santee basin aquifer recharge study - bureau of...
TRANSCRIPT

Santee Basin Aquifer Recharge Study Technical Memorandum – October 2011
Santee Basin Aquifer Recharge Study Technical Memorandum: Regulatory Viability, Engineering Viability and Water Rights Analysis
prepared by:
Douglas B. Blatchford, P.E.
October 2011
U.S. Department of the Interior Bureau of Reclamation Southern California Area Office
Padre Dam Municipal Water District Santee, California

Santee Basin Aquifer Recharge Study Technical Memorandum – October 2011
Project Information
Project Number: K35-1510-2AFA-000-00-0-1-3/2011
Project Name: Santee Basin Aquifer Recharge Study
Project Manager: Douglas B. Blatchford, P.E.
Client: Southern California Area Office (SCAO)
Distribution List for Project Staff
Amy Witherall SCAO
Jack Simes SCAO
Scott Tincher, P.E. Engineering Services Office (ESO)
Phil Mann, P.E. ESO
Douglas B. Blatchford, P.E. ESO
Robert Talbot Technical Services Center (TSC)
Delbert Smith, P.E. TSC
Distribution List for Study Partners
Arne Sandvik, P.E.
Al Lau, P.E.
Mark Niemiec, P.E.
Padre Dam Municipal Water District
Padre Dam Municipal Water District
Padre Dam Municipal Water District

Santee Basin Aquifer Recharge Study Technical Memorandum – October 2011
Contents Page
1.0 Introduction ............................................................................................................................ 1
1.1 Purpose and Need ................................................................................................................. 1 1.2 Scope .................................................................................................................................... 1
2.0 Background ............................................................................................................................ 2 2.1 Location ................................................................................................................................ 2 2.2 Land Use ............................................................................................................................... 2 2.3 Water Rights ......................................................................................................................... 3
3.0 Previous Studies ..................................................................................................................... 7 4.0 Regulatory Requirements ..................................................................................................... 8 5.0 Site Characterization ............................................................................................................. 9
5.1 Hydrology ........................................................................................................................... 10 5.2 Surface Water ..................................................................................................................... 10 5.3 Groundwater ....................................................................................................................... 10 5.4 Geology .............................................................................................................................. 12 5.5 Hydrogeology ..................................................................................................................... 12 5.6 Hydraulic Parameters ......................................................................................................... 14 5.7 Specific Yield ..................................................................................................................... 15
6.0 Conceptual Scenarios........................................................................................................... 19 6.1 Conceptual Scenario No. 1 ................................................................................................. 20 6.2 Conceptual Scenario No. 2 ................................................................................................. 22 6.3 Conceptual Scenario No. 3 ................................................................................................. 24 6.4 Conceptual Scenario No. 4 ................................................................................................. 26
7.0 Conclusions ........................................................................................................................... 28 8.0 Recommendations ................................................................................................................ 28 9.0 References ............................................................................................................................. 30 10.0 Appendices .......................................................................................................................... 31
Appendix A. Glossary of Terms .............................................................................................. 31 Appendix B. Existing Land Ownership ................................................................................... 37 Appendix C. 1965 Cross Sections ........................................................................................... 41 Appendix D. Well Logs ........................................................................................................... 46 Appendix E. Calculations ........................................................................................................ 57 Appendix F. Response to Comments from Stakeholders ........................................................ 62
Sa~tee Basin Aquifer Recharge Study Technical Memorandum - October 2011
Technical Approval The results, findings, and recommendations provided in this Technical Memorandum are technically sound and consistent with current Reclamation practice.
Prepared by: Date:
\d N1C<l/ B. bi>~uvvLl r.E. Jo\/I~ ilf ..
20f/J
Douglas B. Blatchford, P.E. C40534, Exp. 3/31/2013
Peer Review Certifi.cation This Technical Memorandum has been reviewed and is believed to be in accordance with the service agreement and standards ofprofession.
Peer Reviewed by: Date:
Delbert Smith, P.E.

Santee Basin Aquifer Recharge Study Technical Memorandum – October 2011
1
1.0 Introduction
1.1 Purpose and Need
Southern California water supplies originate mainly from Northern California, the Colorado River system, and local groundwater. Over the past ten years, there have been droughts and other interruptions throughout these water supply locations. Padre Dam Municipal Water District (Padre Dam) is seeking creative ways to increase local water supplies to ensure supply reliability for their 100,000 customers. One such idea is infiltrating advanced treated recycled water into the Santee Basin aquifer, and following the appropriate residence time, re-extract it for potable use. The Bureau of Reclamation (Reclamation) and Padre Dam partnered on the Santee Basin Aquifer Recharge Study (Study) to analyze the regulatory and engineering viability of such a project. This Technical Memorandum presents the analysis, results, conclusions, and recommendations for the Study. Synergies include the fact that Padre Dam is investigating expansion of the Padre Dam Water Reclamation Facility (WRF) to serve additional recycled water demands. Further, the Helix Water District (HWD) is considering construction of a pipeline from the WRF to the El Monte Basin to convey advanced treated water to the El Monte Valley Groundwater Recharge Project, located upstream of the Padre Dam site, adjacent to the San Diego River. The HWD pipeline would pass near the Study site, and allow for a turnout for groundwater recharge1.
1.2 Scope
Reclamation partnered with Padre Dam on a planning study to develop this Technical Memorandum analyzing the engineering and regulatory viability of injecting advanced treated recycled water. The analysis included a review of existing references and technical documentation, including, but not limited to, groundwater modeling technical reports, aquifer characteristics, surface water studies, water quality studies, materials from stakeholders, and other information. One outcome of this Technical Memorandum is to evaluate existing regulations that apply to the recharge of advanced recycled water, and identify any impacts to existing domestic water wells in the vicinity. Another outcome of this Technical Memorandum is to develop conceptual scenarios based on an average recharge rate of 1.6 million gallons per day (mgd, 1,600,000 gallons per day, gpd). Reclamation is also tasked with discussing water rights. Conceptual Scenario 1 involves injection and extraction of advanced treated wastewater north of the San Diego River, generally perpendicular to the river alignment in shallower alluvium. Scenario 2 involves injection and extraction of advanced treated wastewater north of and parallel to the San Diego River, whereas Scenario 3 involves injection and extraction of 1 A Glossary of Terms related to water science is provided in Appendix A.

Santee Basin Aquifer Recharge Study Technical Memorandum – October 2011
2
advanced treated wastewater south of and parallel to the San Diego River. Scenario 4 is a combination of both Scenarios 2 and 3.
2.0 Background
2.1 Location
The Santee Basin aquifer is part of the greater San Diego River surface and groundwater system that extends from Mission Bay in the west to El Capitan Reservoir in the east (Figure 1) [1]. The San Diego River system may be broken generally into two major basins, the Mission Valley Basin and the Santee-El Monte Basin. The project site is located adjacent to the San Diego River as part of the Santee Basin, a subset of the Santee-El Monte system. The site is generally bordered by Cuyamaca Street on the west, Riverwalk Drive on the north, Magnolia Avenue on the east, and the Riverview Office Park on the south; the San Diego River and associated riparian area bisects the site, along with a natural flood control channel and riparian habitat that drains from north to south into the San Diego River (Figure 2) [1].
2.2 Land Use
Future land use is shown on Figure 3 [2]. The project site is generally designated as Town Center (TC), intended to provide the City of Santee with a mixed use activity center which is oriented towards enhancing the San Diego River. Land designated as TC is part of a master plan that includes community, commercial, civic, park, open space, and residential use. The ultimate master plan for Town Center should provide the City with a plan that is appropriate to development regulations, consistent with the General Plan [2]. The other major land use is Park and Open Space (P/OS), as shown in green in Figure 3 as the San Diego River corridor. This corridor is intended for permanent open space such as parks, or areas precluded from future development because of the San Diego River floodway. Some appropriate uses may be allowed under special conditions, such as sand extraction operations, golf courses, and agriculture. Other land uses at the project site include the sports complex and school, designated as Public Facilities (PUB), and low, medium, and high density residential housing along the perimeter [2]. A summary of land ownership is shown in the Appendix. In general, the project site north of the San Diego River is owned by the Santee School District, the City of Santee, and San Diego County. South of the San Diego River, the project site is generally owned by San Diego County [3].

Santee Basin Aquifer Recharge Study Technical Memorandum – October 2011
3
2.3 Water Rights
The Santee Basin aquifer is an unadjudicated groundwater basin in San Diego County, California surrounding and underneath the San Diego River. Water rights in the aquifer are subject to the City of San Diego’s water rights to the surface water and groundwater that is underground flow of the San Diego River. As an unadjudicated basin, the water use in the aquifer is not under court control; however, Padre Dam must still follow existing court decisions regarding water rights. Water rights law and water allocation procedures in California have evolved from more than two centuries of common law, legislative action, policy, and court decisions [4]. The key water rights doctrine that governs allocation of surface and ground water of the San Diego River is pueblo water rights. Pueblo water rights are derived from laws that were in effect in California during the time Spain and Mexico maintained jurisdiction, and were transferred to the City of San Diego when San Diego was chartered as a city. San Diego’s pueblo water rights are recognized by the California Supreme Court in the case City of San Diego v. Cuyamaca Water District [5]. The court held that the City of San Diego was the successor to the original pueblo water rights granted by Mexico to the pueblo of San Diego, and that as a result: “The City of San Diego was at the time of the commencement of this action and now is the owner in fee simple of the prior and paramount right to the use of all the water (surface and underground), of the San Diego River, including its tributaries, from its source to its mouth, for the use of said City of San Diego and of its inhabitants…”. 209 Cal. at 151. Therefore, the pueblo water right extends to the entire San Diego River as well as its tributaries, and includes both the surface flow and the subsurface flow of the river. When analyzing the potential for infiltrating and reextracting water in a basin subject to pueblo water rights, other water rights must also be addressed. A case in Los Angeles analyzed that topic and recognized that entities that import water which made its way to the subsurface as return flow can recapture that return flow (City of Los Angeles v. City of San Fernando [6]). Padre Dam should develop a Memorandum of Understanding with the City of San Diego, similar to the one executed by the City of San Diego and the Helix Water District should they proceed with studying indirect potable reuse at the Study site.

Santee Basin Aquifer Recharge Study Technical Memorandum – October 2011
4
Figure 1. Vicinity Map of San Diego area. Shaded blue area represents approximate limits of the Santee-El Monte
Basin (modified from the San Diego River Conceptual Groundwater Management Plan, CH2MHill, 2003[1], provided by the City of San Diego).

Santee Basin Aquifer Recharge Study Technical Memorandum – October 2011
5
Figure 2. Location Map of possible advanced treated wastewater recharge alternatives. Shaded blue area represents
the limit of the Santee Basin. Wells adjacent to the site along with a 500 ft and 1,000 ft perimeter around the project site are shown above (modified from the San Diego River Conceptual Groundwater Management Plan, CH2MHill, 2003[1], provided by the City of San Diego).

Santee Basin Aquifer Recharge Study Technical Memorandum – October 2011
6
R2- LOW-MEDIUM DENSITY RESIDENTIAL (2-5 dwelling units/gross acre) Intended for residential development characterized by single family homes in standard subdivisions (6,000 sq.ft. lots). It covers the largest portion of the City planned for residential uses and is usually found in areas of generally level topography. It is intended to include mobile home parks in the City which may exhibit a slightly higher gross density. This category would typically allow a density of 2 dwelling units per gross acre. R7- MEDIUM DENSITY RESIDENTIAL (7-14 dwelling units/gross acre) Intended for a wide range of residential development including attached and detached single family units. Areas developed under this designation should exhibit adequate access to streets of at least collector capacity and be conveniently serviced by neighborhood commercial and recreational facilities. The density typically approved in this category is 7 dwelling units per gross acre. R14- MEDIUM-HIGH DENSITY RESIDENTIAL (14-22 dwelling units/gross acre) Intended for a residential development characterized at the lower end of the density range by multiple family attached units and at the upper density range by apartment and condominium building. This category encourages innovative site planning, providing on-site recreational amenities and close proximity to major community facilities, business centers and streets of at least major capacity. A density of 14 dwelling units per gross acre could be expected in this designation. TC- TOWN CENTER Intended to provide the City with a mixed-use activity center which is oriented towards and enhances the San Diego River. This designation shall be developed under a master plan including community, commercial, civic, park/open space and residential uses. The master plan for Town Center provides the City with a land use plan and appropriate development regulations that are consistent with the General Plan.
PUB- PUBLIC Areas owned and maintained by public or publicly controlled agencies such as: school districts, Padre Dam Municipal Water District, utility companies and other municipal agencies. Appropriate uses for this designation include schools, the Santee Recreation Lakes, Padre Dam water storage and treatment facilities, freeway right-of-way, utility substations and other public services. P/OS -PARK/OPEN SPACE Intended areas for permanent open space, parks and/or areas precluded from major development because of land constraints such as airport clear zones and established floodways. Recreational uses, such as golf courses with customary support facilities, are considered appropriate within these areas. Agricultural uses and sand extraction operations may, under special conditions, be allowed under this designation. GC- GENERAL COMMERCIAL Provides for commercial areas with a wide range of retail and service activities. It encourages the grouping of commercial outlets into consolidated centers. Appropriate areas to be established with General Commercial activities should have direct access to major roads, prime arterials or freeways.
Figure 3. Future land use at project site [2]. Most of the future land use is designated as TC, or Town Center (cyan). The San Diego River corridor is designated as P/OS, or Public/Open Space, as shown in green. Other future land uses are low to medium residential, public, and general commercial along the perimeter of the project site (provided by the Padre Dam Municipal Water District).
STUDY SITE

Santee Basin Aquifer Recharge Study Technical Memorandum – October 2011
7
3.0 Previous Studies The following selected reports document previous studies in or near the Study area that provide critical information pertinent to the goals of this report (see Scope, pg 1). This is not a comprehensive or all inclusive list of studies and/or reports within the Study area. Padre Dam examined the feasibility of a groundwater recharge and extraction project for the Santee-El Monte Basin in a report prepared by Black & Veatch in association with Woodward-Clyde, titled Santee-El Monte Groundwater Basin and Water Reuse Study, July 1994 [7]. In the Black & Veatch report, Site Number 3 was identified which generally corresponds to the Study site being reviewed in this Technical Memorandum. However, in 1994 the Study site was unimproved and is now partially occupied by a sports complex, north of the San Diego River. Several other reports were reviewed in addition to the Black & Veatch/Woodward Clyde report cited above. A Groundwater Management Planning Study, Santee-El Monte Basin Phase III Report was prepared by Bryan T. Bondy and Dr. David Huntley of the Department of Geological Sciences, San Diego State University for the San Diego County Water Authority (January, 2001) [8]. This report characterizes the hydrogeologic setting of the Santee-El Monte Basin, of which the Study site is a part. Another study, the San Diego River Conceptual Groundwater Management Plan and associated groundwater model (MODFLOW model), was provided by the City of San Diego and also reviewed in the vicinity of the Santee Basin (CH2MHill, 2003)[1]. This report provided a general hydrogeologic characterization for the Santee Basin, provided domestic well information, and GIS electronic information for some of the exhibits of this Technical Memorandum. The Final Report for the El Monte Valley Groundwater Recharge, Mining, and Reclamation Project (Black & Veatch, 2009), was prepared for the Helix Water District and funded by the Local Investigation and Study Assistance Grant-Funding Program for Groundwater Conjunctive Use Studies and Investigations (Phase 1) [9]. The associated groundwater model (MODFLOW) included the reach of the San Diego River adjacent to the Study site. The 2009 Black & Veatch report reviewed conceptual scenarios related to recharging advanced treated wastewater north of the San Diego River through the use of spreading ponds, and utilizing extraction wells south of the San Diego River to retrieve the treated wastewater. The proposed Helix Water District sites are located approximately 6 miles upstream and east of the Study site on the San Diego River. Other key references include land use maps, water well logs, and pump test information. Well logs were made available through the Groundwater Management Study for the Santee-El Monte Groundwater Basin, San Diego County, California, a thesis presented to the faculty of San Diego State University in partial fulfillment of the requirements for Bryan Bondy’s Master of Science in Geological Sciences (Bondy, 2000) [10]. Well logs were made available through the California Department of Water Resources. Well test pump data from the Helix Water District were also made available [11]. Land use maps and land ownership maps were provided by the County of San Diego, City of Santee, and Padre Dam. Regulatory statutes were provided by the
Santee Basin Aquifer Recharge Study Technical Memorandum – October 2011
8
California Department of Public Health, and Regional Water Quality Control Board, and were available online for review. Although the 2008 State of California Title 22 guidelines are not yet finalized, the draft guidelines located online in March 2011were used in this Technical Memorandum (personal communication, California Department of Health).
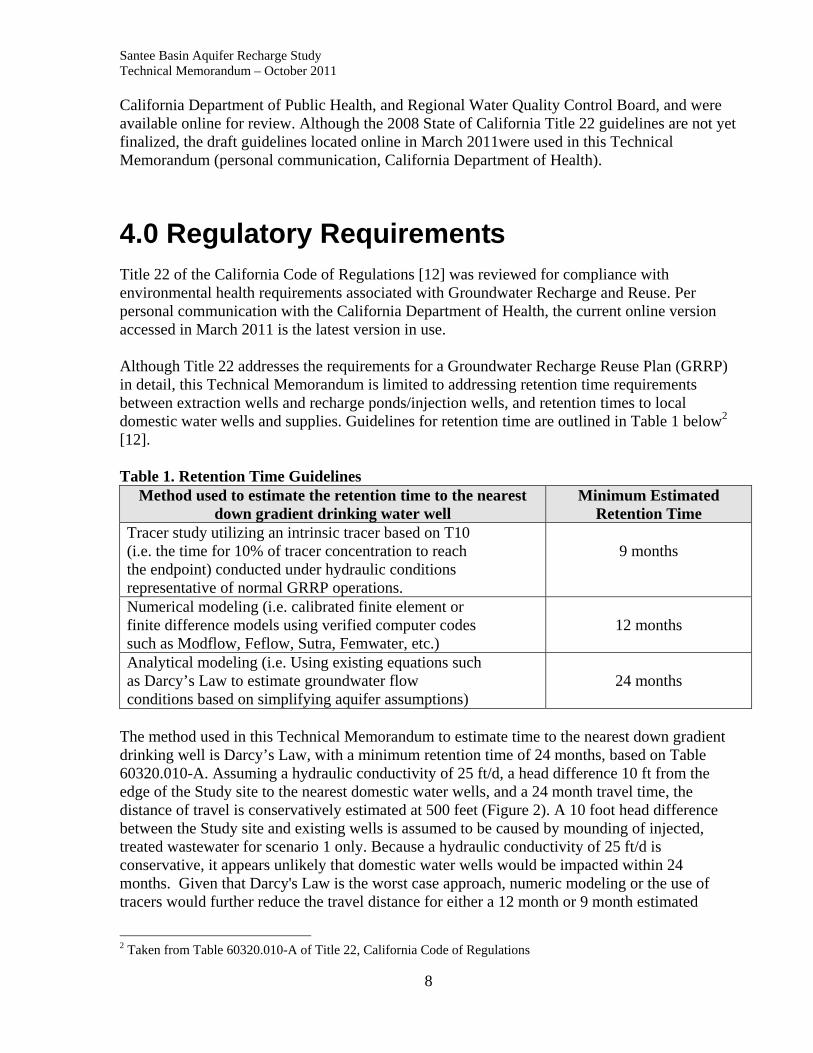
4.0 Regulatory Requirements Title 22 of the California Code of Regulations [12] was reviewed for compliance with environmental health requirements associated with Groundwater Recharge and Reuse. Per personal communication with the California Department of Health, the current online version accessed in March 2011 is the latest version in use. Although Title 22 addresses the requirements for a Groundwater Recharge Reuse Plan (GRRP) in detail, this Technical Memorandum is limited to addressing retention time requirements between extraction wells and recharge ponds/injection wells, and retention times to local domestic water wells and supplies. Guidelines for retention time are outlined in Table 1 below2 [12]. Table 1. Retention Time Guidelines
Method used to estimate the retention time to the nearest down gradient drinking water well
Minimum Estimated Retention Time
Tracer study utilizing an intrinsic tracer based on T10 (i.e. the time for 10% of tracer concentration to reach the endpoint) conducted under hydraulic conditions representative of normal GRRP operations.
9 months
Numerical modeling (i.e. calibrated finite element or finite difference models using verified computer codes such as Modflow, Feflow, Sutra, Femwater, etc.)
12 months
Analytical modeling (i.e. Using existing equations such as Darcy’s Law to estimate groundwater flow conditions based on simplifying aquifer assumptions)
24 months
The method used in this Technical Memorandum to estimate time to the nearest down gradient drinking well is Darcy’s Law, with a minimum retention time of 24 months, based on Table 60320.010-A. Assuming a hydraulic conductivity of 25 ft/d, a head difference 10 ft from the edge of the Study site to the nearest domestic water wells, and a 24 month travel time, the distance of travel is conservatively estimated at 500 feet (Figure 2). A 10 foot head difference between the Study site and existing wells is assumed to be caused by mounding of injected, treated wastewater for scenario 1 only. Because a hydraulic conductivity of 25 ft/d is conservative, it appears unlikely that domestic water wells would be impacted within 24 months. Given that Darcy's Law is the worst case approach, numeric modeling or the use of tracers would further reduce the travel distance for either a 12 month or 9 month estimated
2 Taken from Table 60320.010-A of Title 22, California Code of Regulations
Santee Basin Aquifer Recharge Study Technical Memorandum – October 2011
9
MAST AVE
retention time. As the groundwater gradient is either north or south toward the San Diego River, wells up gradient are unlikely to be impacted by activities outlined in the Conceptual Scenarios; however, groundwater mounding could occur around injection wells.
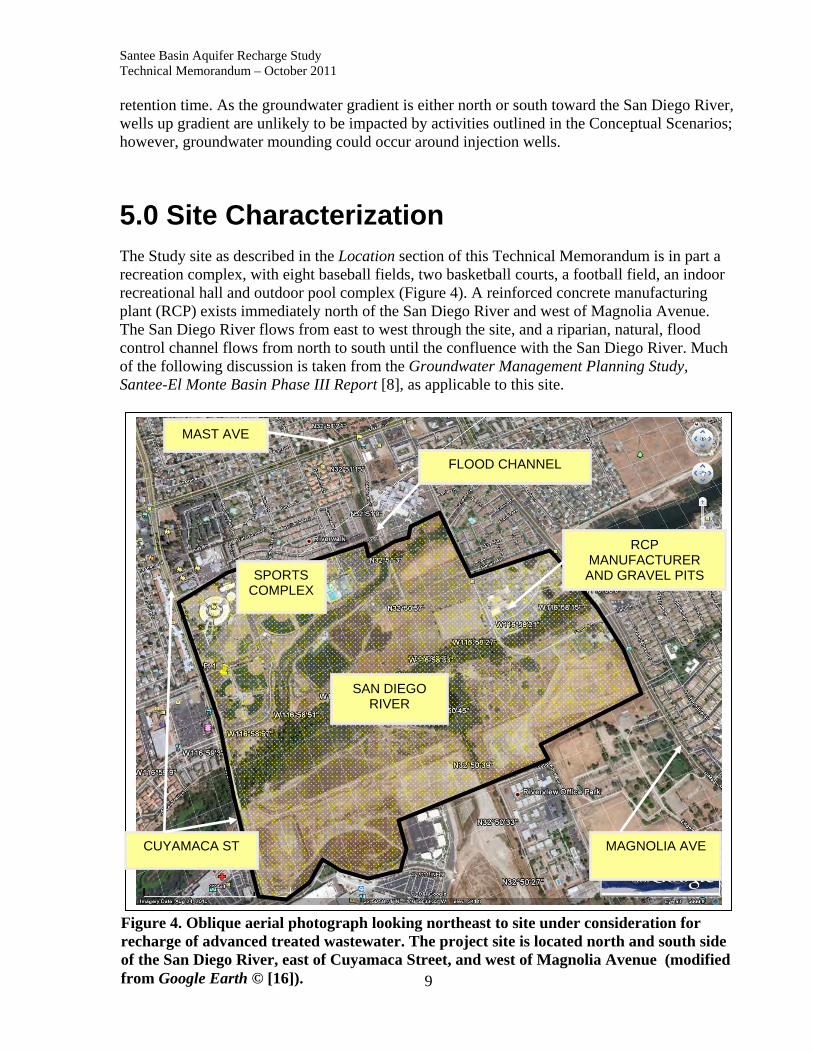
5.0 Site Characterization The Study site as described in the Location section of this Technical Memorandum is in part a recreation complex, with eight baseball fields, two basketball courts, a football field, an indoor recreational hall and outdoor pool complex (Figure 4). A reinforced concrete manufacturing plant (RCP) exists immediately north of the San Diego River and west of Magnolia Avenue. The San Diego River flows from east to west through the site, and a riparian, natural, flood control channel flows from north to south until the confluence with the San Diego River. Much of the following discussion is taken from the Groundwater Management Planning Study, Santee-El Monte Basin Phase III Report [8], as applicable to this site. Figure 4. Oblique aerial photograph looking northeast to site under consideration for recharge of advanced treated wastewater. The project site is located north and south side of the San Diego River, east of Cuyamaca Street, and west of Magnolia Avenue (modified from Google Earth © [16]).
SPORTS COMPLEX
FLOOD CHANNEL
SAN DIEGO RIVER
RCP MANUFACTURER AND GRAVEL PITS
CUYAMACA ST MAGNOLIA AVE

Santee Basin Aquifer Recharge Study Technical Memorandum – October 2011
10
5.1 Hydrology
The Santee-El Monte groundwater basin from Mission Gorge to El Capitan Dam is approximately 15 miles long, and ranges from 500 to 5,000 feet in width. The elevation ranges from approximately 280 feet above mean sea level at Mission Gorge to 600 feet above mean sea level at El Capitan Dam. The Study site is approximately 350 feet above mean sea level [8]. The groundwater basin is an alluvial valley carved out by the San Diego River. Long term precipitation trends were evaluated for El Capitan Reservoir, which has the longest precipitation record in the watershed [8]. Extended periods of dry conditions are evident from 1944 to 1977, and from 1983 to 1991. Conversely, wet conditions were recorded for the periods between 1936 to 1944, 1977 to 1983, and 1991 to 1998. Inter-annual precipitation patterns were also assessed, indicating that 89% of precipitation generally occurs during the months of November through April, with 57% occurring with higher intensities between January and March. March, January and February are the wettest months, in that order [8].
5.2 Surface Water
The Santee-El Monte Basin consists of approximately 116 square miles, extending from Mission Gorge on the west to El Capitan Reservoir on the east, from El Cajon on the south to San Vicente Reservoir on the north. The watershed is naturally truncated by a narrow bedrock constriction at Mission Gorge [8]. Urban runoff from paved surfaces in El Cajon, Santee, and Lakeside influence runoff and flow into the San Diego River. Sources of streamflow include precipitation runoff, wastewater discharge, leakage from El Capitan Reservoir, urban runoff, and baseflow discharge [8]. El Capitan Dam is estimated to contribute approximately 140 acre-feet of water per year. Annual flows in the San Diego River are controlled by releases from El Capitan Dam upstream, precipitation events, and baseflow and urban runoff. The majority of the flow occurs from December through April, and is greatest in February and March, reflecting watershed precipitation patterns. From May through November, the sources of streamflow are baseflow and urban runoff, conveyed through storm drains to the San Diego River.
5.3 Groundwater
Both the surface water and groundwater hydrology of the site is complex, interconnected, and influenced by both nature and manmade developments. Prior to construction of El Capitan Dam, the San Diego River in the Santee Basin was a natural stream and typically flowed on a seasonal basis, fluctuating with dry and wet climate cycles. Groundwater levels in the Santee Basin along the river would generally rise during wet cycles and decline during dry cycles. Construction of El Capitan Dam in 1935 regulated releases from the reservoir, such that only during three wet cycles did groundwater levels rise. These three cycles were the late 1930’s, the early 1980’s, and 1993, and were characterized by rising groundwater levels to near the ground surface, then
Santee Basin Aquifer Recharge Study Technical Memorandum – October 2011
11
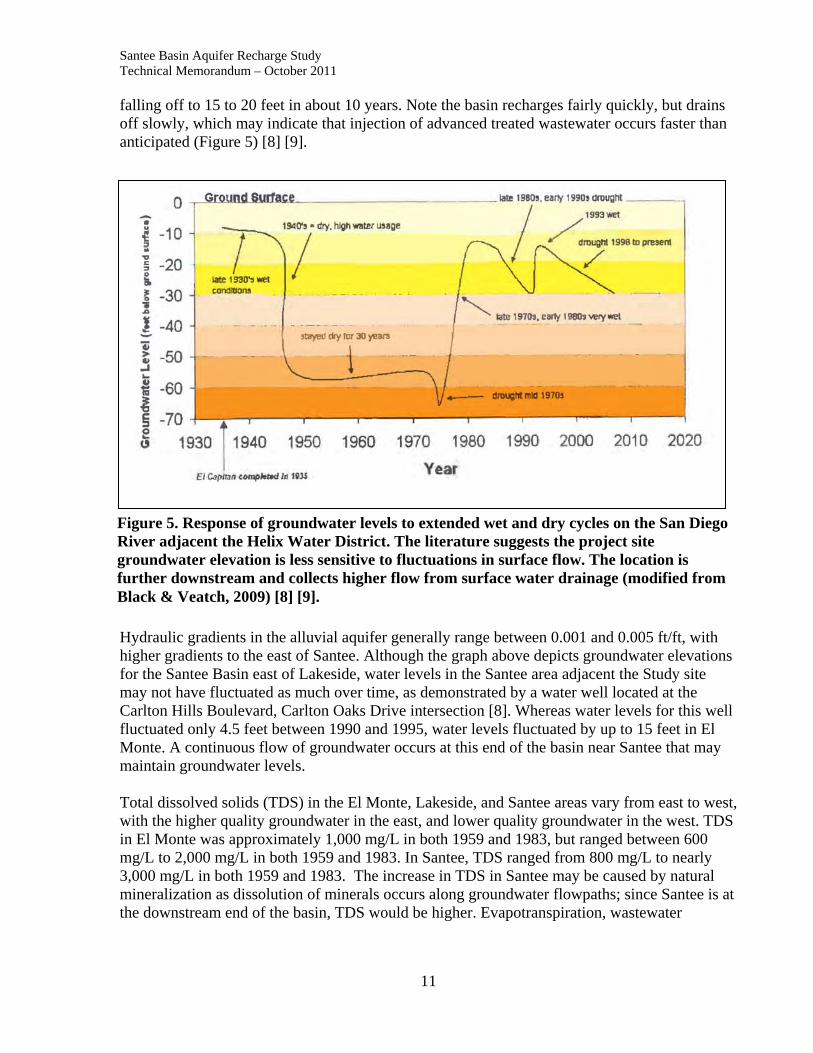
falling off to 15 to 20 feet in about 10 years. Note the basin recharges fairly quickly, but drains off slowly, which may indicate that injection of advanced treated wastewater occurs faster than anticipated (Figure 5) [8] [9].
Hydraulic gradients in the alluvial aquifer generally range between 0.001 and 0.005 ft/ft, with higher gradients to the east of Santee. Although the graph above depicts groundwater elevations for the Santee Basin east of Lakeside, water levels in the Santee area adjacent the Study site may not have fluctuated as much over time, as demonstrated by a water well located at the Carlton Hills Boulevard, Carlton Oaks Drive intersection [8]. Whereas water levels for this well fluctuated only 4.5 feet between 1990 and 1995, water levels fluctuated by up to 15 feet in El Monte. A continuous flow of groundwater occurs at this end of the basin near Santee that may maintain groundwater levels. Total dissolved solids (TDS) in the El Monte, Lakeside, and Santee areas vary from east to west, with the higher quality groundwater in the east, and lower quality groundwater in the west. TDS in El Monte was approximately 1,000 mg/L in both 1959 and 1983, but ranged between 600 mg/L to 2,000 mg/L in both 1959 and 1983. In Santee, TDS ranged from 800 mg/L to nearly 3,000 mg/L in both 1959 and 1983. The increase in TDS in Santee may be caused by natural mineralization as dissolution of minerals occurs along groundwater flowpaths; since Santee is at the downstream end of the basin, TDS would be higher. Evapotranspiration, wastewater
Figure 5. Response of groundwater levels to extended wet and dry cycles on the San Diego River adjacent the Helix Water District. The literature suggests the project site groundwater elevation is less sensitive to fluctuations in surface flow. The location is further downstream and collects higher flow from surface water drainage (modified from Black & Veatch, 2009) [8] [9].

Santee Basin Aquifer Recharge Study Technical Memorandum – October 2011
12
discharge from Santee Lakes, urban runoff, and concentrated salts from former irrigation also contribute to higher TDS at Santee [8].
5.4 Geology
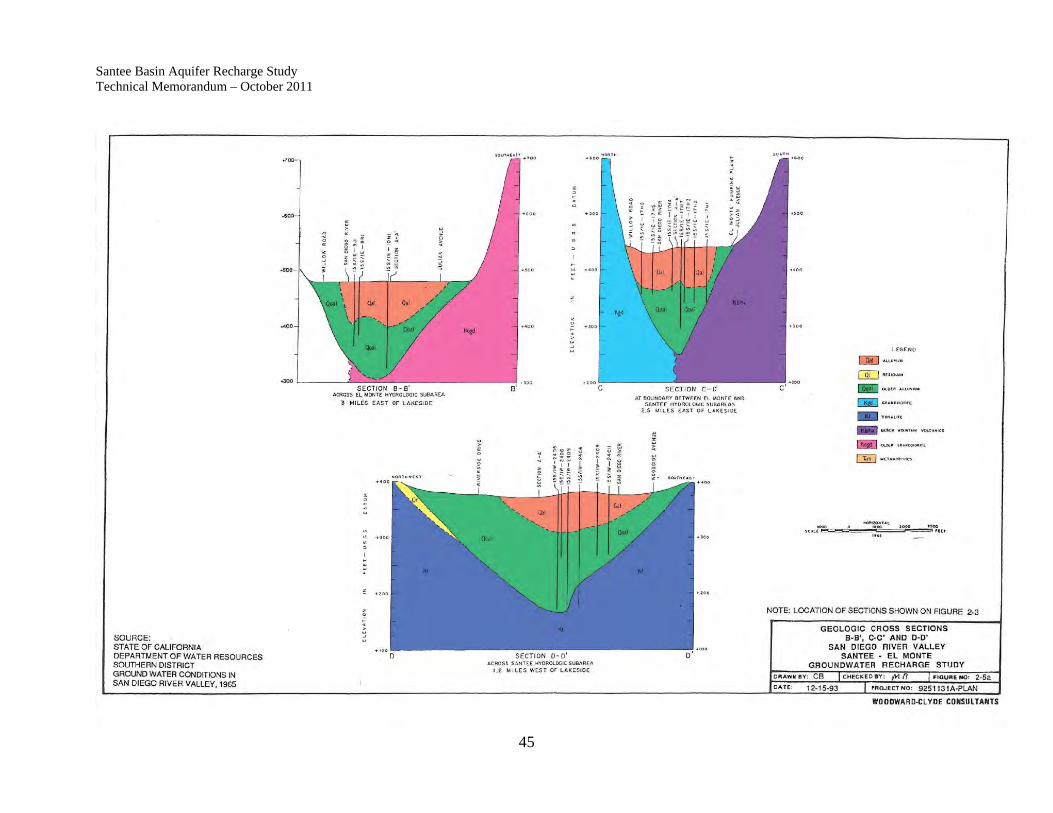
The geology of the Santee Basin is illustrated in Figures 7 and 8 [8]. Figure 7 shows the narrow river channel of the San Diego River extending from Mission Gorge on the west, to El Capitan Dam on the east. Geologic units within the Santee-El Monte Basin include a basement complex of both igneous and metamorphic rocks, the Eocene rocks of the Friars Formation and Poway Group, and Quaternary alluvium [8]. The Quaternary alluvium consists of alluvial, stream-terrace, slope wash, and landslide deposits. The San Diego River carved out a river channel during the Pleistocene when sea water levels were fairly low; a rise in sea level at the end of the Pleistocene probably contributed to deposition of “older alluvium” shown in geologic cross sections, and terrace deposits. Later decline of sea water levels is associated with down cutting of the older alluvium left older terraces in place. A subsequent rise in sea level is associated with deposition of the younger alluvium.
5.5 Hydrogeology
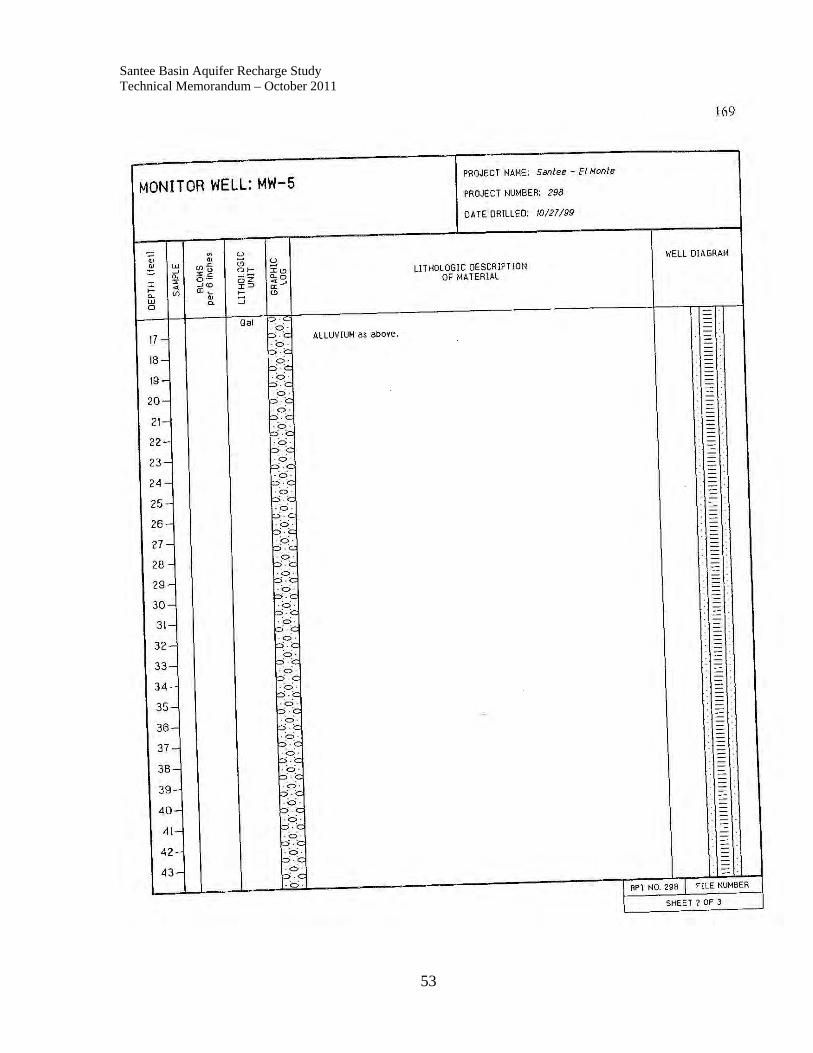
As indicated above, alluvial deposits consist of unconsolidated stream deposits of gravel, sand, silt, and clay, occupying a deeply incised bedrock trough in the eastern section of the basin, and thinning to the west [8]. Although the alluvium may be at most 230 feet deep in the eastern section of the basin, alluvial thicknesses are estimated at approximately 30 to 40 feet at most of the Study site [8]. This is due to an outcrop of basement rock that forms a knob, narrowing the river valley between Riverford Road and Magnolia Avenue. At Cuyamaca Street, the alluvium is approximately 30 to 40 feet thick, and thins to less than 20 feet thick west of Carlton Hills Boulevard closer to Mission Gorge [8] [13]. Locally, deeper alluvial troughs may exist up to 140 feet deep under the current San Diego River and up to 100 feet deep south of the San Diego River between Cuyamaca Street and Magnolia Avenue. An important distinction exists between the older 1994 Black & Veatch report [7] which uses geologic information from 1965, and the more recent Bondy & Huntley report [8] prepared in 2001 [8]. Cross sections from the 1965 data (see Appendix) show the alluvium at the Study site to be at least 200 feet thick, whereas the Bondy & Huntley report determined the alluvium to be between 30 and 40 feet thick (Figures 7 and 8), based on existing drill holes, well logs, and other information. Later studies also estimated the alluvium to be finer west of Lakeside, and coarser in the Helix Water District vicinity, east of Lakeside. Fine grained materials such as clays and silts generally have lower hydraulic conductivities. Monitoring well logs from the Bondy and Huntley report [10] suggest the alluvium is shallower in the vicinity of the Study site. Monitoring well logs MW-1, MW-4, MW-5, and MW-7 are closest to the Study site and have been included in the Appendix for ease of reference, and generally described below:

Santee Basin Aquifer Recharge Study Technical Memorandum – October 2011
13
• Monitoring Well 1 (MW-1) describes Quaternary alluvium (Qal) to 36 feet below the ground surface. The Qal was described as predominantly silts, to fine to medium grained silty sands. At approximately 36 feet below ground surface, the well log recorded the contact with Cretaceous granite (Kg). The granite is described as decomposed granitic rock, light olive brown, wet, fine to medium grained angular soft, and highly weathered.
• Monitoring Well 4 (MW-4) described Quaternary alluvium (Qal) to a depth of 32 feet
below the ground surface, to the contact with the Friars Formation (Tf). The alluvium is described as silty sands to sands, whereas the Friars Formation is described as a very stiff, very hard, low plasticity lean dark clay.
• Monitoring Well 5 (MW-5) described Quaternary alluvium (Qal) to a depth of 50 feet
below the ground surface, until the contact with Cretaceous granite (Kg). The Qal is described a predominantly silty sands to sandy silts, whereas the Kg is described as fine to medium grained, angular, very soft and weathered, decomposed granite.
• Monitoring Well 7 (MW-7) described Quaternary alluvium (Qal) to a depth of 37 feet below the ground surface until the contact with Cretaceous granite (Kg). The Qal is described as silty sands to sandy silts, whereas the Kg is described as fine to medium grained angular soft decomposed granite.
A review of cross sections developed from 1965 (Appendix) and later used in the Black & Veatch report [7] indicates that Cross Section E-E’ is closest to the Study site. Cross section E-E’ shows a 150-200 foot trough of older alluvium immediately south of the San Diego River, however, well data in the location of cross-section E-E’ is not cited (Appendix). The immediate upstream cross-section D-D’ also indicates this same trough; however, unlike cross-section E-E’, cross-section D-D’ is based on well data. It is possible that the older alluvium shown in cross-section E-E’ is an interpolation of the trough found in cross-section D-D’. Evidence suggests that the alluvial thickness in the vicinity of the Study site is both 1) thinner as suggested by Bondy & Huntley [8] on the fringe of the Study site, and 2) may be thicker at some locations as suggested by the Black & Veatch report [7]. A review of existing well logs indicates that the alluvial thickness at Mast Avenue on the north is less than 20 feet. Likewise, the alluvial thickness at Mission Gorge Road on the south is also less than 20 feet [11]. However, several well logs in the vicinity of the San Diego River indicate the possibility of a much thicker section, up to 140 feet thick with higher transmissivities. Also, in the vicinity of the trough shown in cross-section E-E’ from the Black & Veatch report (Appendix), there may also be deeper alluvium. The following highlights findings from existing well records taken along a transect which generally follows Magnolia Avenue, from north to south:
• Well 775696 at Mast Avenue and Magnolia Avenue, depth to decomposed granite (Kg) is less than 20 ft
• Well 15S/1W -21-R1 at the RCP site, depth to decomposed granite (Kg) is 67 ft

Santee Basin Aquifer Recharge Study Technical Memorandum – October 2011
14
• Well 776009 at the RV Park on the south bank of the San Diego River was drilled in 2001 logging 140 ft of alluvium with highly transmissive materials
• Well 15S\1W 28 005 also at the RV Park on the south bank of the San Diego River was drilled in 1980 and logged 130 feet of alluvium with highly transmissive materials
• Well 15S\1W-22-QA logged approximately 55 feet of alluvium before reaching decomposed granite
• Well 15S\1W-27 G-1 at Edgemoor Farms logged approximately 105 feet of alluvium before reaching decomposed granite
• Well 20321 near the intersection of Magnolia Avenue and Mission Gorge Road logged approximately 50 feet of alluvium before reaching decomposed granite
• Well 1085393 also near the intersection of Magnolia Avenue and Mission Gorge Road logged less than 20 feet of alluvium before reaching decomposed granite
A very rough, approximate interpretation of the above well data is shown on Figure 6, developed for this Technical Memorandum. Cross section A-A’ is taken along the general alignment of Magnolia Avenue from Mast Avenue to Mission Gorge Road. Although the evidence for this type of interpretation is marginal, it is possible that a trough of higher transmissive alluvium exists below the San Diego River and also south of the San Diego River. The suggested interpretation in Figure 6 is similar to the cross-section E-E’ of the Black & Veatch report; however, the suggested alluvial thickness is approximately half the thickness shown in cross-section E-E’. More work such as drilling, or geophysical exploration, needs to be performed before the granitic basement can be defined below the Study site. This work should ultimately modify the rudimentary interpretation shown in Figure 6.
5.6 Hydraulic Parameters
Aquifer test data was collected and a pump test was performed on at least one well in the vicinity of Lakeside [8]. Although this well is located east of Santee, the results indicated that hydraulic conductivity of the alluvium ranges from 8 ft/d to 150 ft/d. A review of the well logs indicates that the alluvium grades from coarser materials in the east to finer materials in the west; qualitatively, the hydraulic conductivity at the subject site is likely to be lower than at the well test site at Lakeside. The Helix Water District groundwater model utilized hydraulic conductivities ranging from 25 ft/d to 50 ft/d from Santee to Lakeside [9]. Assuming fine sands and silts in the shallower alluvium closer to Mast Avenue on the north and Cuyamaca Street on the south, a rough estimate of hydraulic conductivity for the shallower alluvium ranges from 0.01 ft/d to 25 ft/d. These values are consistent with Helix Water District hydraulic conductivities, given a finer grained alluvial material at the Study site.

Santee Basin Aquifer Recharge Study Technical Memorandum – October 2011
15
Hydraulic conductivities of the alluvium below the San Diego River and the trough to the south of the San Diego River were assumed to be higher, based on the description of alluvial materials in well logs. Well 776009 at the RV Park on the south bank of the San Diego River was drilled in 2001, logging 140 ft of alluvium with highly transmissive materials. These materials included sands, gravels, cobbles, and boulders, which could easily range in hydraulic conductivity between 0.1 and 1,000 ft/d [15]. Similarly, well data for Well 15S\1W-27 G-1 at Edgemoor Farms logged approximately 105 feet of alluvium south of the San Diego River, and suggests a higher conductivity than the shallower alluvium found at Mission Gorge Road. Hydraulic conductivities at the Edgemoor Farms well could range from 0.1 and 100 ft/d [15].
5.7 Specific Yield
Specific yield is a measure of how much an aquifer can drain from porosity, and directly relates to how much water can be pumped from an aquifer at any given location. The aquifer at the north and south perimeter of the Study site is estimated at approximately 30 to 40 feet thick, and comprised of finer alluvial materials such as silts or clays. A comparatively lower specific yield than the alluvium at Lakeside is expected in the vicinity of Santee. The alluvial troughs south of the San Diego River and directly under the San Diego River may have a comparatively higher specific yield. The groundwater model prepared for the Helix Water District utilized a specific yield of 0.18. San Diego State University constructed a groundwater model using the United States Geological Survey’s MODFLOW simulation package that was calibrated to the Santee-El Monte groundwater basins, primarily for areas east of Lakeside [9]. In addition to the MODFLOW model, the Padre Dam Municipal Water District expressed an interest in estimating specific yield near Magnolia Street in eastern Santee [8]. The results suggested pumping rates from 49 gpm to 36 gpm could be maintained for periods ranging from 0.6 year to 3.6 years [8]. However, well pump tests were not performed in the vicinity of the Study site, and because the Helix Water District model was not calibrated for the Study site, significant error may exist in using specific yield data developed for the Helix Water District [9]. Error could be reduced if explorations were performed to verify subsurface conditions, and if pump tests were performed at Santee. Typical specific yields for alluvial sediments range from approximately 0.03 for silts to 0.35 for coarse sands and fine gravels [15]. Well yield is discussed in the Conceptual Scenarios below, in units of gpm.

Santee Basin Aquifer Recharge Study Technical Memorandum – October 2011
16
Figure 6. One possible interpretation of existing well records along the alignment of Magnolia Avenue, from south to north. More work needs to be performed to verify well records [11]. Alluvial thickness shown in red numbers at top of cross section. Not to scale.

Santee Basin Aquifer Recharge Study Technical Memorandum – October 2011
17
Figure 7. Cross section locations from the Bondy and Huntley report (2001) [8].
Project Scenario No. 3 identified in 1994 by Black & Veatch.
Mission Gorge
- Quaternary lake deposits - Quaternary alluvial deposits - Quaternary stream-terrace deposits - Eocene rocks of the Poway Group and Friars Formation, undifferentiated - Granitic rocks of the Southern California Batholith - Jurassic metavolcanic and metasedimentary rocks
El Capitan Reservoir

Santee Basin Aquifer Recharge Study Technical Memorandum – October 2011
18
Figure 8. Cross sections B’-B’, C’-C’, D’-D’, and E’ to E’ identified by the Bondy & Huntley report [8] showing thinning alluvial sequences to the west of Lakeside. Cross sections look upstream.
Cross section nearest project site, looking upstream.
Santee Basin Aquifer Recharge Study Technical Memorandum – October 2011
19
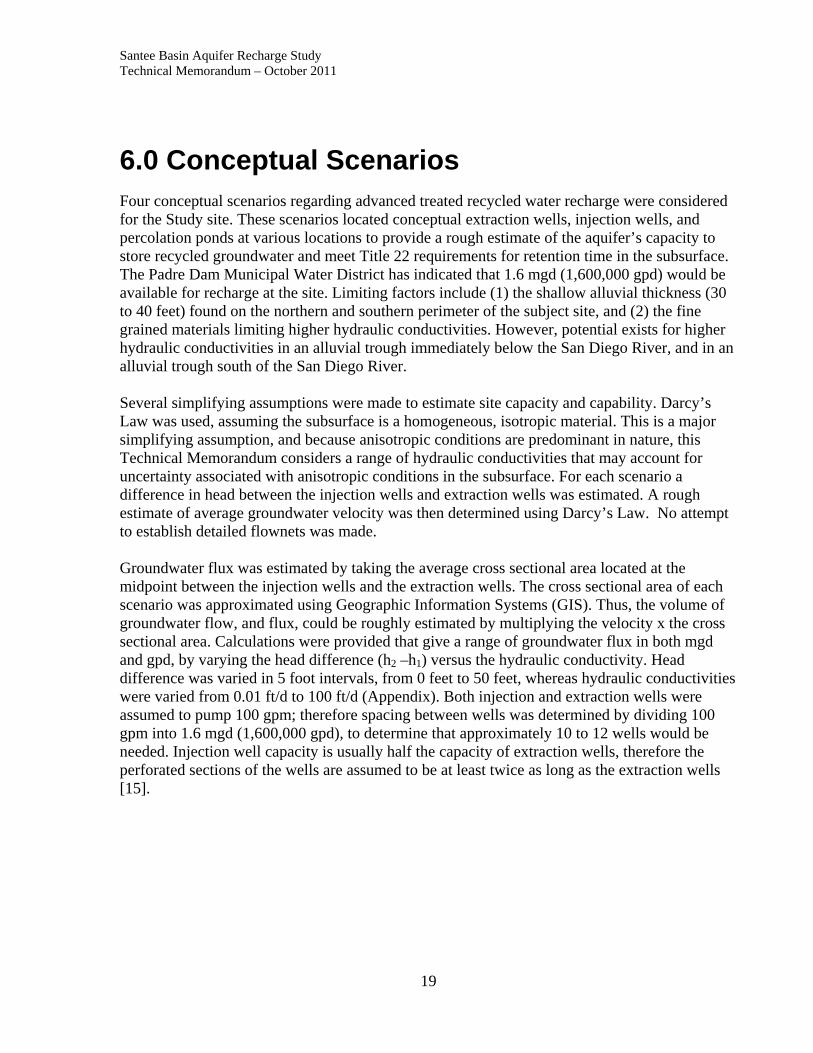
6.0 Conceptual Scenarios Four conceptual scenarios regarding advanced treated recycled water recharge were considered for the Study site. These scenarios located conceptual extraction wells, injection wells, and percolation ponds at various locations to provide a rough estimate of the aquifer’s capacity to store recycled groundwater and meet Title 22 requirements for retention time in the subsurface. The Padre Dam Municipal Water District has indicated that 1.6 mgd (1,600,000 gpd) would be available for recharge at the site. Limiting factors include (1) the shallow alluvial thickness (30 to 40 feet) found on the northern and southern perimeter of the subject site, and (2) the fine grained materials limiting higher hydraulic conductivities. However, potential exists for higher hydraulic conductivities in an alluvial trough immediately below the San Diego River, and in an alluvial trough south of the San Diego River. Several simplifying assumptions were made to estimate site capacity and capability. Darcy’s Law was used, assuming the subsurface is a homogeneous, isotropic material. This is a major simplifying assumption, and because anisotropic conditions are predominant in nature, this Technical Memorandum considers a range of hydraulic conductivities that may account for uncertainty associated with anisotropic conditions in the subsurface. For each scenario a difference in head between the injection wells and extraction wells was estimated. A rough estimate of average groundwater velocity was then determined using Darcy’s Law. No attempt to establish detailed flownets was made. Groundwater flux was estimated by taking the average cross sectional area located at the midpoint between the injection wells and the extraction wells. The cross sectional area of each scenario was approximated using Geographic Information Systems (GIS). Thus, the volume of groundwater flow, and flux, could be roughly estimated by multiplying the velocity x the cross sectional area. Calculations were provided that give a range of groundwater flux in both mgd and gpd, by varying the head difference (h2 –h1) versus the hydraulic conductivity. Head difference was varied in 5 foot intervals, from 0 feet to 50 feet, whereas hydraulic conductivities were varied from 0.01 ft/d to 100 ft/d (Appendix). Both injection and extraction wells were assumed to pump 100 gpm; therefore spacing between wells was determined by dividing 100 gpm into 1.6 mgd (1,600,000 gpd), to determine that approximately 10 to 12 wells would be needed. Injection well capacity is usually half the capacity of extraction wells, therefore the perforated sections of the wells are assumed to be at least twice as long as the extraction wells [15].

Santee Basin Aquifer Recharge Study Technical Memorandum – October 2011
20
6.1 Conceptual Scenario No. 1
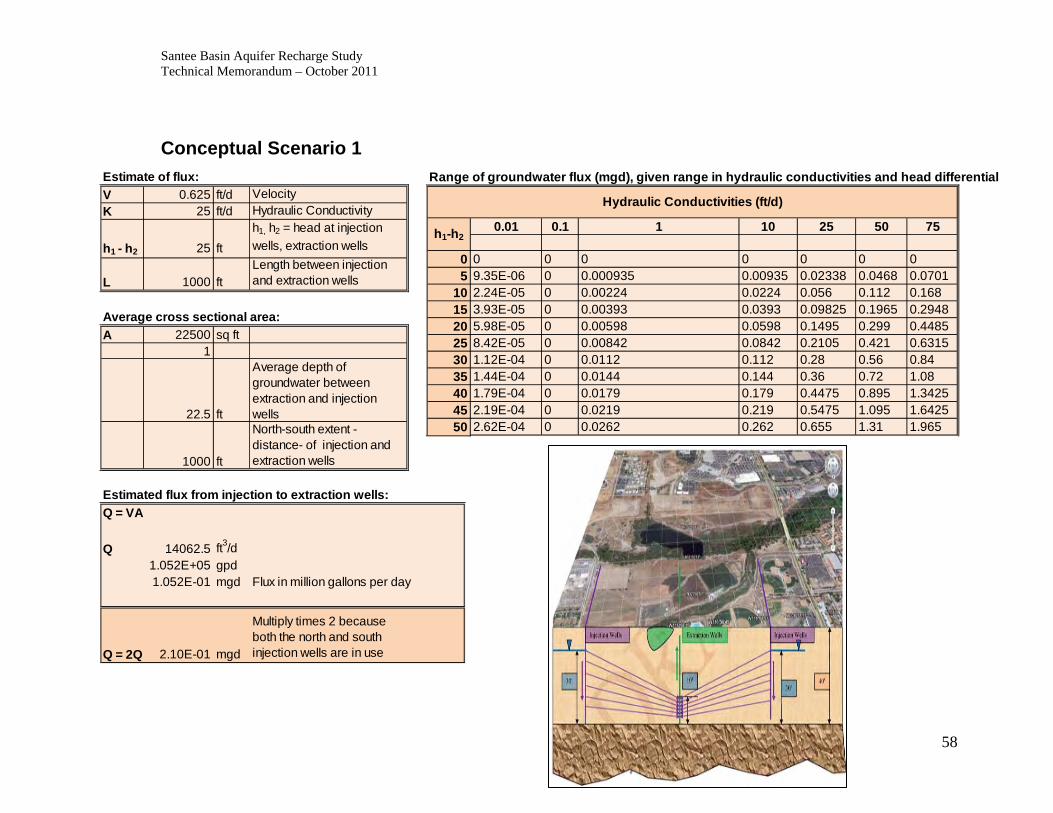
A schematic for Conceptual Scenario No. 1 is shown in Figure 9. Injection wells are located along two general alignments shown in purple, each row of wells approximately 1,000 feet long, with wells spaced approximately 50 feet apart, whereas extraction wells are located along a general alignment shown in green approximately 1,000 feet long, with wells spaced approximately 25 feet apart. The distance north and south between extraction wells is approximately 1,000 feet, and general flowpaths are shown as yellow lines. Assuming a range of hydraulic head between 0 feet and 25 feet, and a range of hydraulic conductivities from 0.01 to 25 ft/d, groundwater flux could range from 0.00000935 mgd (9.35 gpd) to .210 mgd (210,000 gpd), well below the needed capacity of 1.6 mgd (1,600,000 gpd). The needed capacity of 1.6 mgd (1,600,000 gpd) could be obtained if the aquifer was thicker (up to 60 feet) and conductivities were on the order of 75 ft/d or higher.

Santee Basin Aquifer Recharge Study Technical Memorandum – October 2011
21
Figure 9. Conceptual Scenario No. 1 – Cross section of site, looking north. Assumed head differential shown is 20 feet (30 feet – 10 feet to top of extraction wells). Distance between injection wells and extraction wells is 1000 feet east and west of the extraction wells.
Santee Basin Aquifer Recharge Study Technical Memorandum – October 2011
22
6.2 Conceptual Scenario No. 2
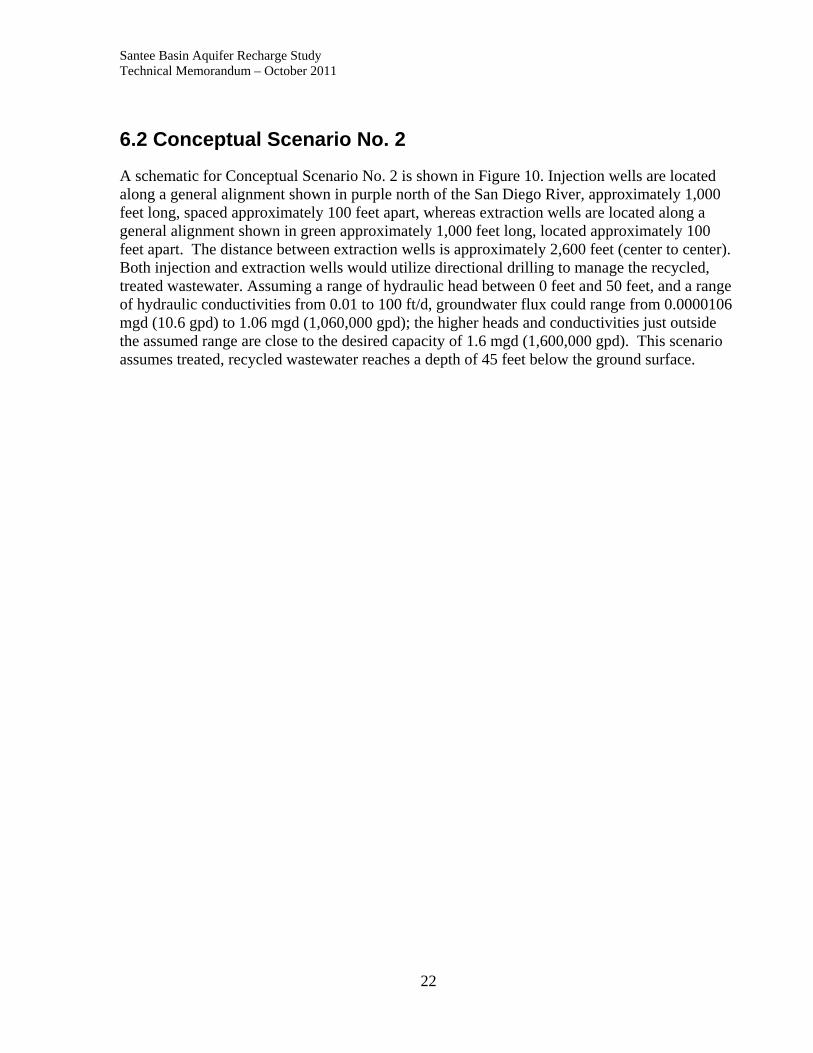
A schematic for Conceptual Scenario No. 2 is shown in Figure 10. Injection wells are located along a general alignment shown in purple north of the San Diego River, approximately 1,000 feet long, spaced approximately 100 feet apart, whereas extraction wells are located along a general alignment shown in green approximately 1,000 feet long, located approximately 100 feet apart. The distance between extraction wells is approximately 2,600 feet (center to center). Both injection and extraction wells would utilize directional drilling to manage the recycled, treated wastewater. Assuming a range of hydraulic head between 0 feet and 50 feet, and a range of hydraulic conductivities from 0.01 to 100 ft/d, groundwater flux could range from 0.0000106 mgd (10.6 gpd) to 1.06 mgd (1,060,000 gpd); the higher heads and conductivities just outside the assumed range are close to the desired capacity of 1.6 mgd (1,600,000 gpd). This scenario assumes treated, recycled wastewater reaches a depth of 45 feet below the ground surface.

Santee Basin Aquifer Recharge Study Technical Memorandum – October 2011
23
Figure 10. Conceptual Scenario No. 2. Looking west onto project site. Injection wells are located along purple lines as shown, approximately 1,000 feet long, with a well spacing of 100 feet, on the north side of the San Diego River. Extraction wells are located along green line as shown, spaced approximately 100 feet apart.

Santee Basin Aquifer Recharge Study Technical Memorandum – October 2011
24
6.3 Conceptual Scenario No. 3
A schematic for Conceptual Scenario No. 3 is shown in Figure 11. Injection wells are located along a general alignment shown in purple south of the San Diego River, approximately 1,000 feet long, spaced approximately 100 feet apart, whereas extraction wells are located along a general alignment shown in green approximately 1,000 feet long, located approximately 100 feet apart, also on the south side of the San Diego River. The distance between extraction wells is approximately 2,600 feet (center to center). Both injection and extraction wells would utilize directional drilling to manage the recycled, treated wastewater. Assuming a range of hydraulic head between 0 feet and 50 feet, and a range of hydraulic conductivities from 0.01 to 100 ft/d, groundwater flux could range from 0.0000088 mgd (8.8 gpd) to 0.88 mgd (888,000 gpd). This scenario assumes treated, recycled wastewater reaches a depth of 45 feet below the ground surface at the injection wells.

Santee Basin Aquifer Recharge Study Technical Memorandum – October 2011
25
Figure 11. Conceptual Scenario No. 3. Looking west onto project site. Injection wells are located along purple lines as shown, approximately 1,000 feet long, with a well spacing of 100 feet, on the south side of the San Diego River. Extraction wells are located along green line as shown, spaced approximately 100 feet apart on the south side of the San Diego River. Depth of recycled, treated wastewater is assumed at 45 feet at injection wells.

Santee Basin Aquifer Recharge Study Technical Memorandum – October 2011
26
6.4 Conceptual Scenario No. 4
A schematic for Conceptual Scenario No. 4 is shown in Figure 12. Injection wells are located along a general alignment shown in purple both north and south of the San Diego River, approximately 1,000 feet long, spaced approximately 100 feet apart, whereas extraction wells are located along a general alignment shown in green approximately 1,000 feet long, located approximately 100 feet apart, also on both the north and south side of the San Diego River. The distance between extraction wells is approximately 2,600 feet (center to center). Both injection and extraction wells would utilize directional drilling to manage the recycled, treated wastewater. Assuming a range of hydraulic head between 0 feet and 50 feet, and a range of hydraulic conductivities from 0.01 to 100 ft/d, groundwater flux could range from 0.0000229 mgd (22.9 gpd) to 2.29 mgd (2,290,000 gpd). Assuming the recycled wastewater reaches a depth of 35 feet below the ground surface at the injection wells, groundwater flux could range from 0.0000298 mgd (29.8 gpd) to 2.98 mgd (2, 980,000 gpd).

Santee Basin Aquifer Recharge Study Technical Memorandum – October 2011
27
Figure 12. Conceptual Scenario No. 4. Looking west onto project site. Injection wells are located along purple lines as shown, approximately 1,000 feet long, with a well spacing of 100 feet, on both the south side and north side of the San Diego River. Extraction wells are located along green line as shown, spaced approximately 100 feet apart on the south side or north of the San Diego River.
Santee Basin Aquifer Recharge Study Technical Memorandum – October 2011
28
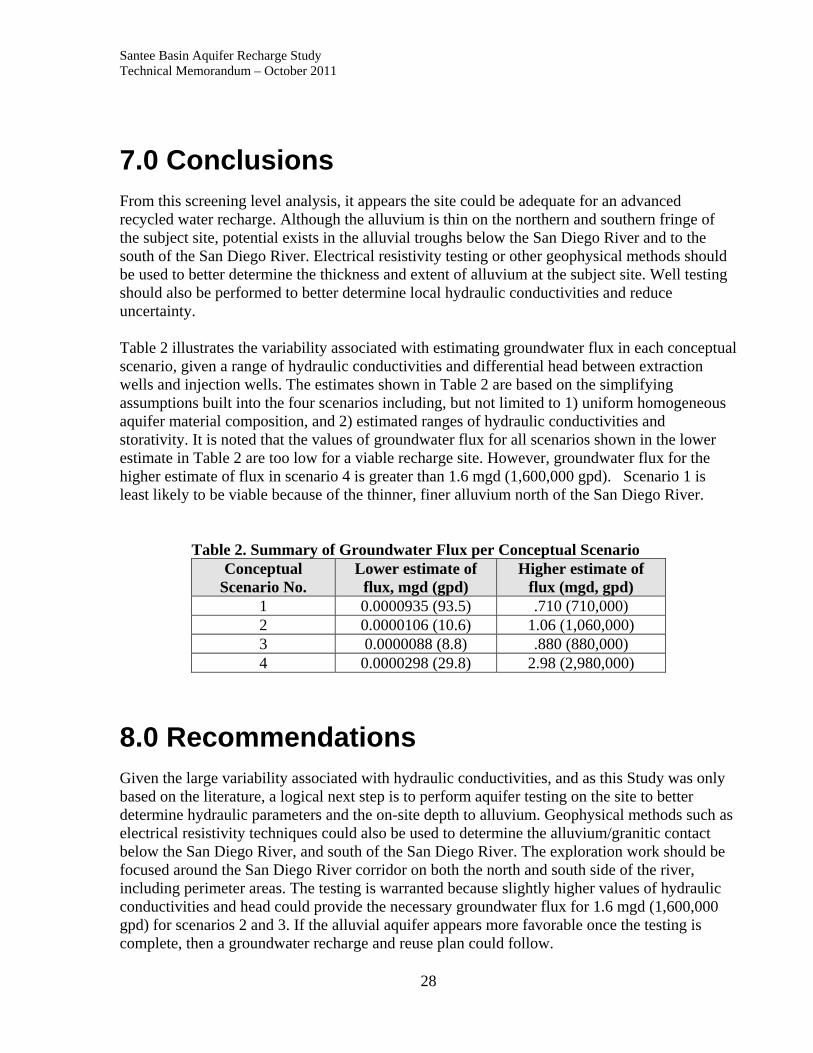
7.0 Conclusions From this screening level analysis, it appears the site could be adequate for an advanced recycled water recharge. Although the alluvium is thin on the northern and southern fringe of the subject site, potential exists in the alluvial troughs below the San Diego River and to the south of the San Diego River. Electrical resistivity testing or other geophysical methods should be used to better determine the thickness and extent of alluvium at the subject site. Well testing should also be performed to better determine local hydraulic conductivities and reduce uncertainty. Table 2 illustrates the variability associated with estimating groundwater flux in each conceptual scenario, given a range of hydraulic conductivities and differential head between extraction wells and injection wells. The estimates shown in Table 2 are based on the simplifying assumptions built into the four scenarios including, but not limited to 1) uniform homogeneous aquifer material composition, and 2) estimated ranges of hydraulic conductivities and storativity. It is noted that the values of groundwater flux for all scenarios shown in the lower estimate in Table 2 are too low for a viable recharge site. However, groundwater flux for the higher estimate of flux in scenario 4 is greater than 1.6 mgd (1,600,000 gpd). Scenario 1 is least likely to be viable because of the thinner, finer alluvium north of the San Diego River.
Table 2. Summary of Groundwater Flux per Conceptual Scenario Conceptual
Scenario No. Lower estimate of
flux, mgd (gpd) Higher estimate of
flux (mgd, gpd) 1 0.0000935 (93.5) .710 (710,000) 2 0.0000106 (10.6) 1.06 (1,060,000) 3 0.0000088 (8.8) .880 (880,000) 4 0.0000298 (29.8) 2.98 (2,980,000)
8.0 Recommendations Given the large variability associated with hydraulic conductivities, and as this Study was only based on the literature, a logical next step is to perform aquifer testing on the site to better determine hydraulic parameters and the on-site depth to alluvium. Geophysical methods such as electrical resistivity techniques could also be used to determine the alluvium/granitic contact below the San Diego River, and south of the San Diego River. The exploration work should be focused around the San Diego River corridor on both the north and south side of the river, including perimeter areas. The testing is warranted because slightly higher values of hydraulic conductivities and head could provide the necessary groundwater flux for 1.6 mgd (1,600,000 gpd) for scenarios 2 and 3. If the alluvial aquifer appears more favorable once the testing is complete, then a groundwater recharge and reuse plan could follow.

Santee Basin Aquifer Recharge Study Technical Memorandum – October 2011
29
Should Padre Dam decide to proceed with analysis of the project site, the Study team recommends the following next steps.
• Phase 1: Define bedrock topography through geophysical methods, such as electrical resistivity or seismic testing
• Phase 2: Targeted drilling to determine hydraulic conductivities and transmissivities
• Phase 3: Development of a detailed Groundwater Management Plan
• Phase 4: Well design and construction

Santee Basin Aquifer Recharge Study Technical Memorandum – October 2011
30
9.0 References [1] CH2MHill, San Diego River System Conceptual Groundwater Management Plan, prepared
for the City of San Diego, May 2003. [2] City of Santee, future Land Use Maps, March 2011. [3] County of San Diego Assessor's Office, http://arcc.co.san-
diego.ca.us/services/assessor_maps_links.aspx, accessed March 2011. [4] Black & Veatch, Final Feasibility Study for the El Monte Valley Recharge Project, Section
8.0 Water Rights, prepared for the Helix Water District, 2006. [5] City of San Diego v. Cuyamaca Water District, 209 Cal. 105, March 21, 1930. [6] City of Los Angeles v. City of San Fernando, 14 Cal. 3d 199, May 12, 1975. [7] Black & Veatch, Inc, Santee-El Monte Groundwater Basin and Water Re-use Study,
prepared for Padre Dam Municipal Water District, July 1994. [8] Bondy, B. T., and Huntley, D., Groundwater Management Planning Study, Santee-El Monte
Basin, Phase III Report, prepared for San Diego Water Authority, January 2000. [9] Black & Veatch, Final Report for the El Monte Valley Groundwater Recharge, Mining, and
Reclamation District, prepared for the Helix Water District, March 2009. [10] Bondy, B.T., Groundwater Management Study for the Santee-El Monte Groundwater
Basin, San Diego County, California, A Thesis Presented to the Faculty of San Diego State University, Fall 2000.
[11] California Department of Water Resources, Well Completion Reports, March 2011. [12] Title 22, California Code of Regulations, http://www.cdph.ca.gov/certlic/drinkingwater/
Documents/Recharge/DraftRechargeReg2008, accessed March 2011. [13] San Diego County Department of Environmental Health, Permitted Private Well Locations,
Santee, January 2011. [14] United States Geological Survey, Water Science Glossary of Terms,
http://ga.water.usgs.gov/edu/dictionary.html, accessed March 2011. [15] Driscoll, I.G., Groundwater and Wells, 2nd Edition, 1986. [16] Google Earth®, accessed 2011.

Santee Basin Aquifer Recharge Study Technical Memorandum – October 2011
31
10.0 Appendices
Appendix A. Glossary of Terms
Alluvium--deposits of clay, silt, sand, gravel, or other particulate material that has been deposited by a stream or other body of running water in a streambed, on a flood plain, on a delta, or at the base of a mountain.
Aquifer--a geological formation or structure that stores and/or transmits water, such as to wells and springs. Use of the term is usually restricted to those water-bearing formations capable of yielding water in sufficient quantity to constitute a usable supply for people's uses.
Artificial recharge--a process where water is put back into groundwater storage from surface water supplies such as irrigation, or induced infiltration from streams or wells. Base flow--sustained flow of a stream in the absence of direct runoff. It includes natural and human-induced streamflows. Natural base flow is sustained largely by groundwater discharges.
Bedrock--the solid rock beneath the soil and superficial rock. A general term for solid rock that lies beneath soil, loose sediments, or other unconsolidated material. Discharge--the volume of water that passes a given location within a given period of time. Usually expressed in cubic feet per second.
Drainage basin--land area where precipitation runs off into streams, rivers, lakes, and reservoirs. It is a land feature that can be identified by tracing a line along the highest elevations between two areas on a map, often a ridge. Large drainage basins, like the area that drains into the Mississippi River contain thousands of smaller drainage basins. Also called a "watershed."
Drawdown--a lowering of the groundwater surface caused by pumping.
Effluent--water that flows from a sewage treatment plant after it has been treated.
Erosion--the process in which a material is worn away by a stream of liquid (water) or air, often due to the presence of abrasion.
Evaporation--the process of liquid water becoming water vapor, including vaporization from water surfaces, land surfaces, and snow fields, but not from leaf surfaces.

Santee Basin Aquifer Recharge Study Technical Memorandum – October 2011
32
Evapotranspiration--the sum of evaporation and transpiration.
Flood--an overflow of water onto lands that are used or usable by man and not normally covered by water. Floods have two essential characteristics: The inundation of land is temporary; and the land is adjacent to and inundated by overflow from a river, stream, lake, or ocean.
Flood, 100-year--a 100-year flood does not refer to a flood that occurs once every 100 years, but to a flood level with a 1 percent chance of being equaled or exceeded in any given year.
Flood plain--a strip of relatively flat and normally dry land alongside a stream, river, or lake that is covered by water during a flood.
Flood stage--the elevation at which overflow of the natural banks of a stream or body of water begins in the reach or area in which the elevation is measured.
Groundwater--(1) water that flows or seeps downward and saturates soil or rock, supplying springs and wells. The upper surface of the saturated zone is called the water table. (2) Water stored underground in rock crevices and in the pores of geologic materials that make up the Earth's crust.
Groundwater recharge--inflow of water to a groundwater reservoir from the surface. Infiltration of precipitation and its movement to the water table is one form of natural recharge. Also, the volume of water added by this process.
Groundwater, unconfined--water in an aquifer that has a water table that is exposed to the atmosphere.
Million gallons per day (mgd)--a rate of flow of water equal to 133,680.56 cubic feet per day, or 1.5472 cubic feet per second, or 3.0689 acre-feet per day. A flow of one million gallons per day for one year equals 1,120 acre-feet (365 million gallons).
Municipal water system--a water system that has at least five service connections or which regularly serves 25 individuals for 60 days; also called a public water system.
Peak flow--the maximum instantaneous discharge of a stream or river at a given location. It usually occurs at or near the time of maximum stage.
Percolation--(1) the movement of water through the openings in rock or soil. (2) the entrance of a portion of the streamflow into the channel materials to contribute to ground water replenishment.

Santee Basin Aquifer Recharge Study Technical Memorandum – October 2011
33
Permeability--the ability of a material to allow the passage of a liquid, such as water through rocks. Permeable materials, such as gravel and sand, allow water to move quickly through them, whereas impermeable materials, such as clay, do not allow water to flow freely.
Precipitation--rain, snow, hail, sleet, dew, and frost.
Primary wastewater treatment--the first stage of the wastewater-treatment process where mechanical methods, such as filters and scrapers, are used to remove pollutants. Solid material in sewage also settles out in this process.
Prior appropriation doctrine--the system for allocating water to private individuals used in most Western states. The doctrine of Prior Appropriation was in common use throughout the arid West as early settlers and miners began to develop the land. The prior appropriation doctrine is based on the concept of "First in Time, First in Right." The first person to take a quantity of water and put it to beneficial use has a higher priority of right than a subsequent user. The rights can be lost through nonuse; they can also be sold or transferred apart from the land.
Public supply--water withdrawn by public governments and agencies, such as a county water department, and by private companies that is then delivered to users. Public suppliers provide water for domestic, commercial, thermoelectric power, industrial, and public water users. Most people's household water is delivered by a public water supplier. The systems have at least 15 service connections (such as households, businesses, or schools) or regularly serve at least 25 individuals daily for at least 60 days out of the year.
Public water use--water supplied from a public-water supply and used for such purposes as fire-fighting, street washing, and municipal parks and swimming pools.
Recharge--water added to an aquifer. For instance, rainfall that seeps into the ground.
Reclaimed wastewater--treated wastewater that can be used for beneficial purposes.
Recycled water--water that is used more than one time before it passes back into the natural hydrologic system.
Reservoir--a pond, lake, or basin, either natural or artificial, for the storage, regulation, and control of water.
River--a natural stream of water of considerable volume, larger than a brook or creek.
Runoff--(1) that part of the precipitation, snowmelt, or irrigation water that appears in uncontrolled surface streams, rivers, drains or sewers. Runoff may be classified according to

Santee Basin Aquifer Recharge Study Technical Memorandum – October 2011
34
speed of appearance after rainfall or melting snow as direct runoff or base runoff, and according to source as surface runoff, storm interflow, or ground-water runoff. (2) The total discharge described in (1), above, during a specified period of time. (3) Also defined as the depth to which a drainage area would be covered if all of the runoff for a given period of time were uniformly distributed over it.
Secondary wastewater treatment--treatment (following primary wastewater treatment) involving the biological process of reducing suspended, colloidal, and dissolved organic matter in effluent from primary treatment systems and which generally removes 80 to 95 percent of the Biochemical Oxygen Demand (BOD) and suspended matter. Secondary wastewater treatment may be accomplished by biological or chemical-physical methods. Activated sludge and trickling filters are two of the most common means of secondary treatment. It is accomplished by bringing together waste, bacteria, and oxygen in trickling filters or in the activated sludge process. This treatment removes floating and settleable solids and about 90 percent of the oxygen-demanding substances and suspended solids. Disinfection is the final stage of secondary treatment.
Sediment--usually applied to material in suspension in water or recently deposited from suspension. In the plural the word is applied to all kinds of deposits from the waters of streams, lakes, or seas.
Sedimentary rock--rock formed of sediment, and specifically: (1) sandstone and shale, formed of fragments of other rock transported from their sources and deposited in water; and (2) rocks formed by or from secretions of organisms, such as most limestone. Many sedimentary rocks show distinct layering, which is the result of different types of sediment being deposited in succession.
Seepage--(1) the slow movement of water through small cracks, pores, interstices, etc., of a material into or out of a body of surface or subsurface water. (2) The loss of water by infiltration into the soil from a canal, ditches, laterals, watercourse, reservoir, storage facilities, or other body of water, or from a field.
Sewage treatment plant--a facility designed to receive the wastewater from domestic sources and to remove materials that damage water quality and threaten public health and safety when discharged into receiving streams or bodies of water. The substances removed are classified into four basic areas: [1] greases and fats; [2] solids from human waste and other sources; [3] dissolved pollutants from human waste and decomposition products; and [4] dangerous microorganisms. Most facilities employ a combination of mechanical removal steps and bacterial decomposition to achieve the desired results. Chlorine is often added to discharges from the plants to reduce the danger of spreading disease by the release of pathogenic bacteria.

Santee Basin Aquifer Recharge Study Technical Memorandum – October 2011
35
Storm sewer--a sewer that carries only surface runoff, street wash, and snow melt from the land. In a separate sewer system, storm sewers are completely separate from those that carry domestic and commercial wastewater (sanitary sewers).
Stream--a general term for a body of flowing water; natural watercourse containing water at least part of the year. In hydrology, it is generally applied to the water flowing in a natural channel as distinct from a canal.
Streamflow--the water discharge that occurs in a natural channel. A more general term than runoff, streamflow may be applied to discharge whether or not it is affected by diversion or regulation.
Surface water--water that is on the Earth's surface, such as in a stream, river, lake, or reservoir.
Tertiary wastewater treatment--selected biological, physical, and chemical separation processes to remove organic and inorganic substances that resist conventional treatment practices; the additional treatment of effluent beyond that of primary and secondary treatment methods to obtain a very high quality of effluent. The tertiary wastewater treatment process consists of flocculation basins, clarifiers, filters, and chlorine basins or ozone or ultraviolet radiation processes.
Transmissibility (groundwater)--the capacity of a rock to transmit water under pressure. The coefficient of transmissibility is the rate of flow of water, at the prevailing water temperature, in gallons per day, through a vertical strip of the aquifer one foot wide, extending the full saturated height of the aquifer under a hydraulic gradient of 100-percent. A hydraulic gradient of 100-percent means a one foot drop in head in one foot of flow distance.
Transpiration--process by which water that is absorbed by plants, usually through the roots, is evaporated into the atmosphere from the plant surface, such as leaf pores. See evapotranspiration.
Tributary--a smaller river or stream that flows into a larger river or stream. Usually, a number of smaller tributaries merge to form a river.
Unsaturated zone--the zone immediately below the land surface where the pores contain both water and air, but are not totally saturated with water. These zones differ from an aquifer, where the pores are saturated with water.
Wastewater--water that has been used in homes, industries, and businesses that is not for reuse unless it is treated.
Wastewater-treatment return flow--water returned to the environment by wastewater-treatment facilities.

Santee Basin Aquifer Recharge Study Technical Memorandum – October 2011
36
Water quality--a term used to describe the chemical, physical, and biological characteristics of water, usually in respect to its suitability for a particular purpose.
Water table--the top of the water surface in the saturated part of an aquifer.
Water use--water that is used for a specific purpose, such as for domestic use, irrigation, or industrial processing. Water use pertains to human's interaction with and influence on the hydrologic cycle, and includes elements, such as water withdrawal from surface- and ground-water sources, water delivery to homes and businesses, consumptive use of water, water released from wastewater-treatment plants, water returned to the environment, and in stream uses, such as using water to produce hydroelectric power.
Watershed--the land area that drains water to a particular stream, river, or lake. It is a land feature that can be identified by tracing a line along the highest elevations between two areas on a map, often a ridge. Large watersheds, like the Mississippi River basin contain thousands of smaller watersheds.
Well (water)--an artificial excavation put down by any method for the purposes of withdrawing water from the underground aquifers. A bored, drilled, or driven shaft, or a dug hole whose depth is greater than the largest surface dimension and whose purpose is to reach underground water supplies or oil, or to store or bury fluids below ground.
Withdrawal--water removed from a ground- or surface-water source for use.
Yield--mass per unit time per unit area.

Santee Basin Aquifer Recharge Study Technical Memorandum – October 2011
37
Appendix B. Existing Land Ownership

Santee Basin Aquifer Recharge Study Technical Memorandum – October 2011
38
Assessor’s Parcel Map depicting land ownership south of the San Diego River. The County of San Diego is the existing land owner of the project site south of the San Diego River.

Santee Basin Aquifer Recharge Study Technical Memorandum – October 2011
39
Assessor’s Parcel Map depicting land ownership north of the San Diego River. The County of San Diego, the City of Santee and Santee School District are the existing land owners of the project site north of the San Diego River.

Santee Basin Aquifer Recharge Study Technical Memorandum – October 2011
40

Santee Basin Aquifer Recharge Study Technical Memorandum – October 2011
41
Appendix C. 1965 Cross Sections

Santee Basin Aquifer Recharge Study Technical Memorandum – October 2011
42
Study Site

Santee Basin Aquifer Recharge Study Technical Memorandum – October 2011
43

Santee Basin Aquifer Recharge Study Technical Memorandum – October 2011
44
Study site (Scenario 3) identified by Black & Veatch in 1994 [7]
Santee Basin Aquifer Recharge Study Technical Memorandum – October 2011
45

Santee Basin Aquifer Recharge Study Technical Memorandum – October 2011
46
Appendix D. Well Logs

Santee Basin Aquifer Recharge Study Technical Memorandum – October 2011
47

Santee Basin Aquifer Recharge Study Technical Memorandum – October 2011
48

Santee Basin Aquifer Recharge Study Technical Memorandum – October 2011
49

Santee Basin Aquifer Recharge Study Technical Memorandum – October 2011
50

Santee Basin Aquifer Recharge Study Technical Memorandum – October 2011
51

Santee Basin Aquifer Recharge Study Technical Memorandum – October 2011
52
Santee Basin Aquifer Recharge Study Technical Memorandum – October 2011
53

Santee Basin Aquifer Recharge Study Technical Memorandum – October 2011
54

Santee Basin Aquifer Recharge Study Technical Memorandum – October 2011
55

Santee Basin Aquifer Recharge Study Technical Memorandum – October 2011
56

Santee Basin Aquifer Recharge Study Technical Memorandum – October 2011
57
Appendix E. Calculations
Santee Basin Aquifer Recharge Study Technical Memorandum – October 2011
58
Estimate of flux:V 0.625 ft/d Velocity K 25 ft/d Hydraulic Conductivity
h1 - h2 25 fth1, h2 = head at injection wells, extraction wells
L 1000 ftLength between injection and extraction wells
Average cross sectional area:A 22500 sq ft
1
22.5 ft
Average depth of groundwater between extraction and injection wells
1000 ft
North-south extent - distance- of injection and extraction wells
Estimated flux from injection to extraction wells:Q = VA
Q 14062.5 ft3/d1.052E+05 gpd1.052E-01 mgd Flux in million gallons per day
Q = 2Q 2.10E-01 mgd
Multiply times 2 because both the north and south injection wells are in use
Range of groundwater flux (mgd), given range in hydraulic conductivities and head differential
0.01 0.1 1 10 25 50 75
0 0 0 0 0 0 0 05 9.35E-06 0 0.000935 0.00935 0.02338 0.0468 0.0701
10 2.24E-05 0 0.00224 0.0224 0.056 0.112 0.16815 3.93E-05 0 0.00393 0.0393 0.09825 0.1965 0.294820 5.98E-05 0 0.00598 0.0598 0.1495 0.299 0.448525 8.42E-05 0 0.00842 0.0842 0.2105 0.421 0.631530 1.12E-04 0 0.0112 0.112 0.28 0.56 0.8435 1.44E-04 0 0.0144 0.144 0.36 0.72 1.0840 1.79E-04 0 0.0179 0.179 0.4475 0.895 1.342545 2.19E-04 0 0.0219 0.219 0.5475 1.095 1.642550 2.62E-04 0 0.0262 0.262 0.655 1.31 1.965
h1-h2
Hydraulic Conductivities (ft/d)
Conceptual Scenario 1

Santee Basin Aquifer Recharge Study Technical Memorandum – October 2011
59
Estimate of fluxInjection to river troughV 1.346 ft/dK 100 ft/d
h1 - h2 35 ft
L 2600 ft
Cross section of Trough at 50 ft Depth (from GIS)73700 sq ft
Q 99211.53846 ft3/d7.422E+05 gpd7.422E-01 mgd Flux in mgd
Velocity Hydraulic Conductivity
h1, h2 = head at injection wells, extraction wells
Length between injection and extraction wells
Q = VA
Estimated flux from south injection wells to extraction wells
Range of groundwater flux (mgd), given range in hydraulic conductivities and head differential
0.01 0.1 1 10 25 50 75 100
0 0 0 0 0 0 0 0 05 1.06E-05 1.06E-04 1.06E-03 0.01 0.03 0.05 0.08 0.11
10 2.12E-05 2.12E-04 2.12E-03 0.02 0.05 0.11 0.16 0.2115 3.18E-05 3.18E-04 3.18E-03 0.03 0.08 0.16 0.24 0.3220 4.24E-05 4.24E-04 4.24E-03 0.04 0.11 0.21 0.32 0.4225 5.30E-05 5.30E-04 5.30E-03 0.05 0.13 0.27 0.40 0.5330 6.36E-05 6.36E-04 6.36E-03 0.06 0.16 0.32 0.48 0.6435 7.42E-05 7.42E-04 7.42E-03 0.07 0.19 0.37 0.56 0.7440 8.48E-05 8.48E-04 8.48E-03 0.08 0.21 0.42 0.64 0.8545 9.54E-05 9.54E-04 9.54E-03 0.10 0.24 0.48 0.72 0.9550 1.06E-04 1.06E-03 1.06E-02 0.11 0.27 0.53 0.80 1.06
Hydraulic Conductivities (ft/d)
h1-h2
Conceptual Scenario 2

Santee Basin Aquifer Recharge Study Technical Memorandum – October 2011
60
Range of groundwater flux (mgd), given range in hydraulic conductivities and head differential
0.01 0.1 1 10 25 50 75 100
0 0 0 0 0 0 0 0 05 8.88E-06 8.88E-05 8.88E-04 8.88E-03 0.022 0.044 0.067 0.089
10 1.78E-05 1.78E-04 1.78E-03 1.78E-02 0.044 0.089 0.133 0.17815 2.66E-05 2.66E-04 2.66E-03 2.66E-02 0.067 0.133 0.200 0.26620 3.55E-05 3.55E-04 3.55E-03 3.55E-02 0.089 0.178 0.266 0.35525 4.44E-05 4.44E-04 4.44E-03 4.44E-02 0.111 0.222 0.333 0.44430 5.33E-05 5.33E-04 5.33E-03 5.33E-02 0.133 0.266 0.399 0.53335 6.21E-05 6.21E-04 6.21E-03 6.21E-02 0.155 0.311 0.466 0.62140 7.10E-05 7.10E-04 7.10E-03 7.10E-02 0.178 0.355 0.533 0.71045 7.99E-05 7.99E-04 7.99E-03 7.99E-02 0.200 0.399 0.599 0.79950 8.88E-05 8.88E-04 8.88E-03 8.88E-02 0.222 0.444 0.666 0.888
h1-h2
Hydraulic Conductivities (ft/d)
Estimate of fluxInjection to river troughV 1.346 ft/d Velocity
K 100 ft/dHydraulic Conductivity
h1 - h2 35 ft
h1, h2 = head at injection wells, extraction wells
L 2600 ft
Length between injection and extraction wells
Cross section of Trough at 50 ft Depth (from GIS)61700 sq ft
Q = VA
Q 83057.69 ft3/d6.21E+05 gpd
6.213E-01 mgd Flux in mgd
Estimated flux from south injection wells to extraction wells
Conceptual Scenario 3

Santee Basin Aquifer Recharge Study Technical Memorandum – October 2011
61
Range of groundwater flux (mgd), given range in hydraulic conductivities and head differentialGroundwater Depth at 45ft below ground surface
0.01 0.1 1 10 25 50 75 100
0 0 0 0 0 0 0 0 05 2.29E-05 2.29E-04 2.29E-03 2.29E-02 0.06 0.11 0.17 0.23
10 4.58E-05 4.58E-04 4.58E-03 4.58E-02 0.11 0.23 0.34 0.4615 6.87E-05 6.87E-04 6.87E-03 6.87E-02 0.17 0.34 0.52 0.6920 9.16E-05 9.16E-04 9.16E-03 9.16E-02 0.23 0.46 0.69 0.9225 1.15E-04 1.15E-03 1.15E-02 1.15E-01 0.29 0.57 0.86 1.1530 1.37E-04 1.37E-03 1.37E-02 1.37E-01 0.34 0.69 1.03 1.3735 1.60E-04 1.60E-03 1.60E-02 1.60E-01 0.40 0.80 1.20 1.6040 1.83E-04 1.83E-03 1.83E-02 1.83E-01 0.46 0.92 1.37 1.8345 2.06E-04 2.06E-03 2.06E-02 2.06E-01 0.52 1.03 1.55 2.0650 2.29E-04 2.29E-03 2.29E-02 2.29E-01 0.57 1.15 1.72 2.29
Range of groundwater flux (mgd), given range in hydraulic conductivities and head differentialGroundwater Depth at 35ft below ground surface
0.01 0.1 1 10 25 50 75 100
0 0 0 0 0 0 0 0 05 2.98E-05 2.98E-04 2.98E-03 2.98E-02 7.45E-02 0.15 0.22 0.30
10 5.96E-05 5.96E-04 5.96E-03 5.96E-02 0.15 0.30 0.45 0.6015 8.94E-05 8.94E-04 8.94E-03 8.94E-02 0.22 0.45 0.67 0.8920 1.19E-04 1.19E-03 1.19E-02 0.12 0.30 0.60 0.89 1.1925 1.49E-04 1.49E-03 1.49E-02 0.15 0.37 0.75 1.12 1.4930 1.79E-04 1.79E-03 1.79E-02 0.18 0.45 0.89 1.34 1.7935 2.09E-04 2.09E-03 2.09E-02 0.21 0.52 1.04 1.56 2.0940 2.38E-04 2.38E-03 2.38E-02 0.24 0.60 1.19 1.79 2.3845 2.68E-04 2.68E-03 2.68E-02 0.27 0.67 1.34 2.01 2.6850 2.98E-04 2.98E-03 2.98E-02 0.30 0.75 1.49 2.24 2.98
Hydraulic Conductivities (ft/d)
Hydraulic Conductivities (ft/d)
h1-h2
h1-h2
Estimate of fluxInjection to River troughV 1.346 ft/d Velocity
K 100 ft/dHydraulic Conductivity
h1 - h2 35 ft
h1, h2 = head at injection wells, extraction wells
L 2600 ft
Length between injection and extraction wells
Water Elevation 45 Ft Below Ground Surface159260 sq ft
Q = VA
Q 214388.46 ft3/d1.60E+06 gpd
1.604E+00 mgd Flux in mgd
Estimated flux from south injection wells to extraction wells
Conceptual Scenario 4

Santee Basin Aquifer Recharge Study Technical Memorandum – October 2011
62
Appendix F. Response to Comments from Stakeholders
A. California Department of Public Health
1. The draft Groundwater Recharge Reuse regulations are undergoing a significant revision and should be available online this fall. Please be aware that the both the Santee Basin and El Monte Basin projects will be reviewed based on the revised regulations. Although not anticipated to be more stringent than the existing draft regulations, the time of travel sections will be particularly important to review for the Santee Basin project. Response: The project will comply with all regulations.
2. Extraction wells for the purpose of providing drinking water must be constructed per California Department of Water Resources – Well Standards. Specifically, a minimum 50‐foot sanitary seal must be provided. This means no casing perforations are allowed in the first 50 feet. Scenario 1 in the TM describes wells that would not meet this requirement. Perforations and sanitary seal depths are not called out in the TM so it is unclear whether or not this requirement can be met with the other Scenarios. Response: The project will comply with all regulations.
3. The hydrology of the basin is not very well characterized as noted in the conclusions of the TM and additional work will be needed to better define what water depths/topography are available to support a recharge project in order to comply with both comments above. Response: This will occur in the next phase of the Study.
B. City of San Diego
1. General. What are Padre Dam’s plans for blend water for mixing with the advanced treated wastewater prior to injection into the groundwater? Response: Sources of blend water have not been identified. Multiple options will be considered in future phases of the Study.
2. General. Will extracted water from this project be subject to the surface water treatment rule? Response: More aquifer testing is needed to determine. This will occur in future Study phases.

Santee Basin Aquifer Recharge Study Technical Memorandum – October 2011
63
3. General. Has any consideration been given to known or potential contaminating activities in and around the project Study area? Response: Not yet. This will be addressed in future Study phases.
4. Pg 10, Surface Water. The text mentions sewage treatment plants discharging to the San Diego River in El Cajon and Lakeside. Please verify this. Response: This was an error and will be deleted.
5. Pg 15, Specific yield. What are Padre Dam’s plans for an area specific groundwater model? The report references Helix’s model which was calibrated for the area east of Lakeside? Response: After next steps testing, if additional data gaps are identified, a supplemental field investigation will occur. Any additional groundwater modeling would be identified in future phases. The need for the model may be dependent on future groundwater regulations.
6. Pg 29, Recommendations. We agree that field testing is the logical and necessary next step to confirm and establish the basin characteristics. Response: Thank you.
C. City of Santee
1. The City of Santee is concerned about impacts to land use. Response: Padre Dam will continue to coordinate with the City on this project to identify impacts to land use.
2. The City of Santee is concerned about impacts the project may have on the City of Santee using wells (owned and operated by the City of Santee) to irrigate Parks/Open space. Response: The City of Santee would need to obtain a permit for any new well to extract water from this aquifer as water rights are Pueblo Rights owned by the City of San Diego. Any existing wells owned by the City of Santee used for irrigation purposes would not be affected by this project.
D. County of San Diego Real Estate Services Division
Background The project site area shown in the Santee Basin Aquifer Recharge Study Area overlays property owned by the County of San Diego in Santee, California. County-

Santee Basin Aquifer Recharge Study Technical Memorandum – October 2011
64
owned property in the vicinity of the Santee Basin Aquifer Recharge Study Area was originally acquired before 1930. The property consists of approximately 275 acres located in the Town Center area of Santee, California. The property is bounded by Cuyamaca Street, Mission Gorge Road and Magnolia Avenue and extends north of the San Diego River. Existing public facilities on the site include the Edgemoor Skilled Nursing Facility and the Las Colinas Detention Facility. The County is actively pursuing the development of the Edgemoor property to generate revenue and meet the long-range needs of the County departments located on the property. The County owns the following parcels in the area:
Assessor Parcel
Number
Size
Remarks
381-050-12 12.26 acres Residential Site 381-050-13 11.71 acres Edgemoor Skilled Nursing Facility 381-050-57 3.01 acres Riverbed 381-050-61 1.42 acres Riverbed 381-050-64 10.13 acres Office Site 381-050-65 12.66 acres Residential Site 381-050-66 6.74 acres Theater/Office Site 381-050-59 8.24 acres Ground Leased Office Site 381-050-68 34.28 acres Office Site 381-050-69 10.59 acres Office Site 381-050-70 66.23 acres Institutional/Office Site 381-050-71 0.55 acres Interpretive Area Site 381-050-72 0.4 acres Remnant Parcel 381-050-73 67.08 acres Riverbed 381-050-74 18.98 acres Residential 381-160-80 7.27 acres Riverbed 381-160-82 3.41 acres Riverbed Total 274.96 acres
The 149 acres of County-owned property located south of the San Diego River are targeted for office, high-density residential and institutional uses. Portions of the County-owned land in this area are subject to development under a Disposition and Development Agreement with a private developer. Approximately 45-acres of the County -owned land south of the San Diego River are set aside for a new Las Colinas Detention Facility. Efforts to secure permits for a restoration project and mitigation bank on the majority of the 82 acres of County-owned property within the riverbed and floodway of the San Diego River are currently underway.

Santee Basin Aquifer Recharge Study Technical Memorandum – October 2011
65
An 11.71 acre site north of the San Diego River is used for the County’s Edgemoor Skilled Nursing Facility. The remaining 31 acres of County-owned property north of the river are zoned for high-density residential use. Study Comments Potential Effects on/Compatibility with Surface Development
1. Injection Wells a) Location of injection wells b) Footprint/size of injection wells c) Infrastructure and right of way needed to deliver treated waste water to
injection wells
2. Extraction Wells a) Location of extraction wells b) Footprint/size of extraction wells c) Infrastructure and right of way needed to deliver water from extraction
wells
3. Use of Treated Wastewater a) Proximity to residential uses b) Proximity to Edgemoor Skilled Nursing Facility
Response: The Study team will work with the County to minimize impacts throughout the Project planning process and ensure that proposed facilities and easements will have minimal impact to existing and proposed development. The team appreciates County-provided information on the Study site. There is flexibility with the well locations as they will be directionally drilled. Padre Dam will comply with CDPH regulations for water reuse. The Study team is optimistic, but not sure if the Project is feasible. We need to do more work to characterize the Project.
Potential Effects on/Compatibility with River Restoration/Mitigation Bank Project
1. Groundwater Levels a. Will the groundwater level within the restoration/mitigation bank area
be affected by drawdown near the extraction wells? (especially Conceptual Scenarios 2 and Conceptual Scenario 4)
b. Will any changes in groundwater level affect the hydrology of the project?
c. Will any changes in groundwater levels increase occurrences of flooding?

Santee Basin Aquifer Recharge Study Technical Memorandum – October 2011
66
d. Will any changes in groundwater levels affect established or replanted vegetation?
2. Use of Treated Wastewater
a. Proximity to pond within San Diego River floodway.
3. Sand Extraction a. Will changes in groundwater levels reduce the amount of sand that
can be extracted and sold during the course of construction for the river restoration? Revenue from the sand offsets the cost of the project.
Response: Padre Dam will obtain information on the proposed Mitigation Bank and will review the plan with regard to potential impacts the proposed Santee Basin Aquifer Project may have on the Mitigation Bank. Incompatibility with Los Colinas Detention Facility Project
1. The County has entered into a Memorandum of Understanding for participation in the State of California AB 900 funding program that requires no ownership limitations that could interfere with the beneficial use and occupancy of the Las Colinas Detention Facility.
a. The proposed alignment of the upstream injection wells in Conceptual
Scenario 3 and Conceptual Scenario 4 appear to conflict with the site for the Las Colinas replacement facility.
2. Conceptual Scenario 3 and Conceptual Scenario 4 include an east-west
alignment of injection wells adjacent to the northern limits of the existing Las Colinas Detention Facility from the drainage channel to Magnolia Avenue.
b. This alignment appears to span the Las Colinas Detention Facility site in a manner that conflicts with the secured perimeter and the footprints of several buildings.
3. No timeframes are provided for project implementation.
4. The project scope makes reference to evaluating existing regulations that
apply to recharge and the development conceptual scenarios are based on a particular recharge rate as outcomes.
5. Use of Treated Wastewater
a. Proximity to institutional use.
Response: The Study team will work with the County to minimize impacts throughout the Project planning process and ensure that proposed facilities and
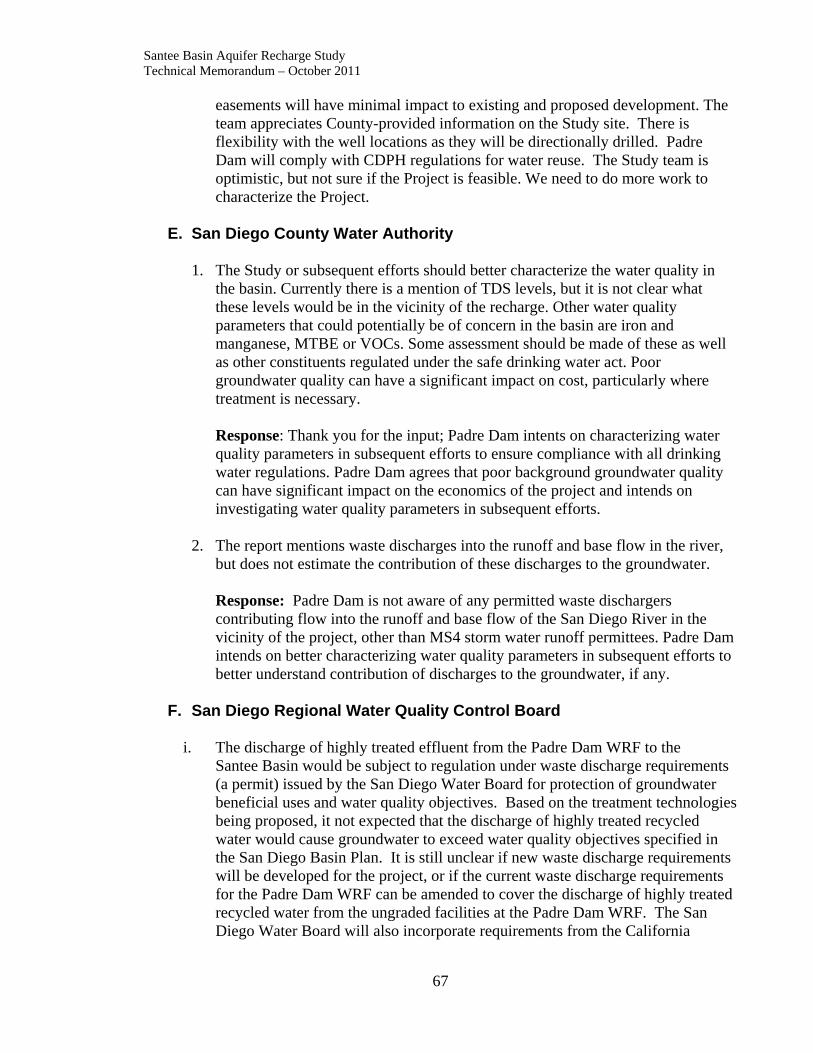
Santee Basin Aquifer Recharge Study Technical Memorandum – October 2011
67
easements will have minimal impact to existing and proposed development. The team appreciates County-provided information on the Study site. There is flexibility with the well locations as they will be directionally drilled. Padre Dam will comply with CDPH regulations for water reuse. The Study team is optimistic, but not sure if the Project is feasible. We need to do more work to characterize the Project.
E. San Diego County Water Authority
1. The Study or subsequent efforts should better characterize the water quality in the basin. Currently there is a mention of TDS levels, but it is not clear what these levels would be in the vicinity of the recharge. Other water quality parameters that could potentially be of concern in the basin are iron and manganese, MTBE or VOCs. Some assessment should be made of these as well as other constituents regulated under the safe drinking water act. Poor groundwater quality can have a significant impact on cost, particularly where treatment is necessary. Response: Thank you for the input; Padre Dam intents on characterizing water quality parameters in subsequent efforts to ensure compliance with all drinking water regulations. Padre Dam agrees that poor background groundwater quality can have significant impact on the economics of the project and intends on investigating water quality parameters in subsequent efforts.
2. The report mentions waste discharges into the runoff and base flow in the river, but does not estimate the contribution of these discharges to the groundwater. Response: Padre Dam is not aware of any permitted waste dischargers contributing flow into the runoff and base flow of the San Diego River in the vicinity of the project, other than MS4 storm water runoff permittees. Padre Dam intends on better characterizing water quality parameters in subsequent efforts to better understand contribution of discharges to the groundwater, if any.
F. San Diego Regional Water Quality Control Board
i. The discharge of highly treated effluent from the Padre Dam WRF to the Santee Basin would be subject to regulation under waste discharge requirements (a permit) issued by the San Diego Water Board for protection of groundwater beneficial uses and water quality objectives. Based on the treatment technologies being proposed, it not expected that the discharge of highly treated recycled water would cause groundwater to exceed water quality objectives specified in the San Diego Basin Plan. It is still unclear if new waste discharge requirements will be developed for the project, or if the current waste discharge requirements for the Padre Dam WRF can be amended to cover the discharge of highly treated recycled water from the ungraded facilities at the Padre Dam WRF. The San Diego Water Board will also incorporate requirements from the California
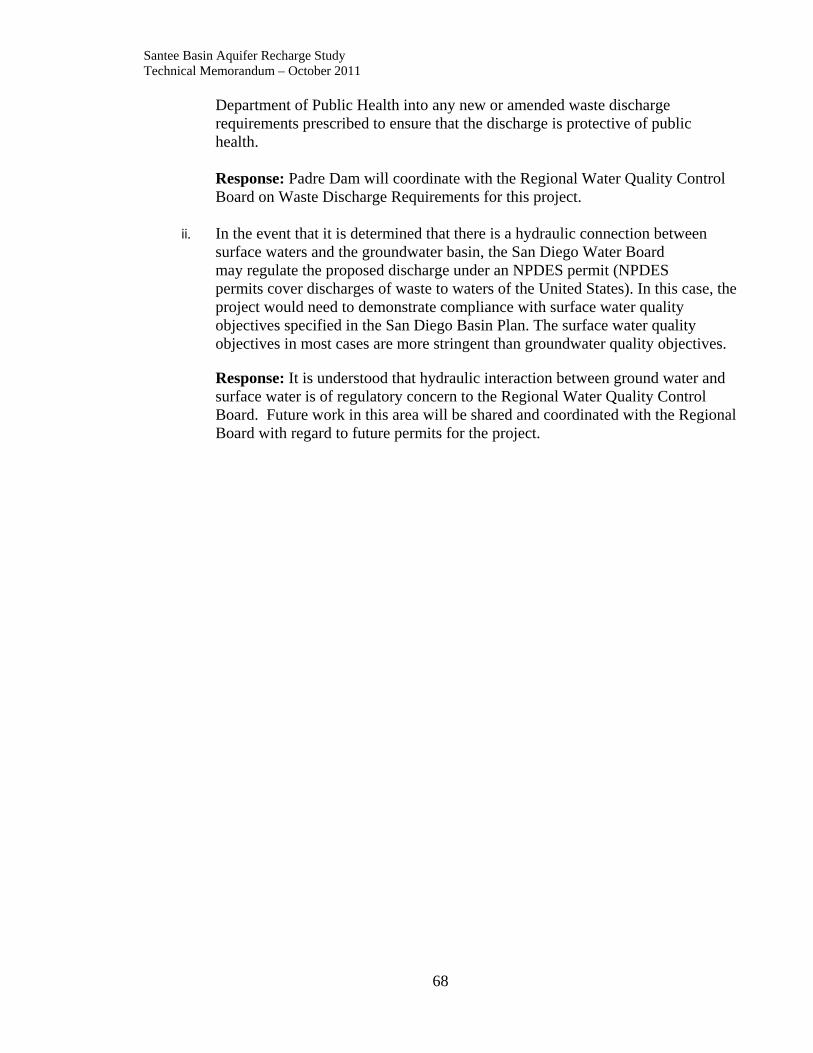
Santee Basin Aquifer Recharge Study Technical Memorandum – October 2011
68
Department of Public Health into any new or amended waste discharge requirements prescribed to ensure that the discharge is protective of public health. Response: Padre Dam will coordinate with the Regional Water Quality Control Board on Waste Discharge Requirements for this project.
ii. In the event that it is determined that there is a hydraulic connection between surface waters and the groundwater basin, the San Diego Water Board may regulate the proposed discharge under an NPDES permit (NPDES permits cover discharges of waste to waters of the United States). In this case, the project would need to demonstrate compliance with surface water quality objectives specified in the San Diego Basin Plan. The surface water quality objectives in most cases are more stringent than groundwater quality objectives. Response: It is understood that hydraulic interaction between ground water and surface water is of regulatory concern to the Regional Water Quality Control Board. Future work in this area will be shared and coordinated with the Regional Board with regard to future permits for the project.