santo domingo project region iii, chile ni 43-101 ...€¦ · santo domingo project region iii,...
TRANSCRIPT
Santo Domingo ProjectRegion III, Chile NI 43-101 Technical Report
Prepared by:Ms Joyce Maycock, P. Eng., WoodMr. Antonio Luraschi, CMC, WoodMr. Marcial Mendoza, CMC, WoodDr. Mario Bianchin, P. Geo., WoodMr. David Rennie, P. Eng., RPAMr. Carlos Guzman, CMC, NCLMr. Roger Amelunxen, P. Eng., AminproMr. Michael Gingles, QP MMSA, Sunrise Americas Mr. Tom Kerr, P. Eng., Knight Piésold Mr. Roy Betinol, P. Eng., BRASS. Mr. Lyn Jones, P. Eng., MPlan InternationalDr. Gregg Bush, P. Eng.
Prepared for: Capstone Mining Corp.
Effective Date: 19 February, 2020
Project Number: C40029
CERTIFICATE OF QUALIFIED PERSON Av. Apoquindo 3846, Piso 15
Las Condes, Santiago 7550123, Chile
I, Joyce Maycock, P.Eng., am employed as a Project Manager with Amec Foster Wheeler Ingeniería y Construcción Ltda (doing business as Wood), located at Avenida Presidente Riesco 5335, Las Condes, Santiago, Chile.
This certificate applies to the technical report titled “Santo Domingo Project, Region III, Chile, NI 43-101 Technical Report” that has an effective date of 19 February, 2020 (the “technical report”).
I am a Professional Engineer with Engineers and Geoscientists of British Columbia (membership number 13331). I graduated from the Royal School of Mines, Imperial College, University of London, with a Bachelor of Science (Engineering) degree in Metallurgy in 1969.
Since 1969 I have continually been involved in mineral processing operations and projects for precious and base metals in Argentina, Canada, Chile, Peru, and Zambia. From 2009 to date I have worked as report co-ordinator for many prefeasibility and feasibility reports including a feasibility study for Santo Domingo; for feasibility studies for Mina Justa, Minsur and Zafranal, CMZ in Peru; for a feasibility study for El Espino, Pucobre; for a prefeasibility study for Lobo Marte, Kinross; a feasibility study for Maricunga, Kinross; a feasibility study for Angostura, Greystar; a prefeasibility and feasibility study for Cerro Casale, Barrick/Kinross; a scoping study for Zaldivar Sulphides, Barrick; and a feasibility study for Guanaco for Compañía Minera Guanaco.
As a result of my experience and qualifications, I am a Qualified Person as defined in National Instrument 43–101 Standards of Disclosure for Mineral Projects (NI 43–101).
I have not visited the Santo Domingo Project.
I am responsible for Sections 1.1 to 1.3, 1.15.1, 1.22, 1.24.1, 1.24.5; Sections 2.1 to 2.3, 2.5 to 2.7; Sections 3.1, 3.2; Section 4; Section 5; Sections 18.1, 18.2.3, 18.7; Section 23; Sections 24.1, 24.5.1, 24.5.8; Sections 25.1, 25.2, 25.10, 25.16; and Section 27 of the technical report.
I am independent of Capstone Mining Corp. as independence is described by Section 1.5 of NI 43–101.
I have previously co-authored the following technical reports on the project:
• Maycock, J., Luraschi, A., Mendoza, M., Bianchin, M., Rennie, D., Guzman, C., Amelunxen, R., Gingles, M., Kerr, T., and Betinol, R., 2018: Santo Domingo Project, Region III, Chile, NI 43-101 Technical Report on Feasibility Study Update: technical report prepared by Amec Foster Wheeler International Ingeniería y Construcción Limitada, Roscoe Postle Associates Inc., NCL Ltda, Aminpro Chile SPA, Sunrise Americas LLC, Knight Piésold S.A., and BRASS Chile SA for Capstone Mining Corp., effective date 26 November, 2018
• Maycock, J., Gopfert, H., Rennie D., Guzman, C., Frost, D., Kerr, T., Betinol, R., Klimek, A., and Khera V., 2014: Santo Domingo Project, Region III, Chile, NI 43-101 Technical Report on Feasibility Study: technical report prepared by Amec International Ingeniería y Construcción Limitada, NCL Ltda, Roscoe Postle Associates Inc., Knight Piésold and Co., and BRASS Chile SA, effective date 22 May, 2014

I have read NI 43–101 and the sections of the technical report for which I am responsible have been prepared in compliance with that Instrument.
As of the effective date of the technical report, to the best of my knowledge, information and belief, the sections of the technical report for which I am responsible contain all scientific and technical information that is required to be disclosed to make the technical report not misleading.
Dated: 24 March, 2020
“Signed and sealed”
Joyce Maycock, P.Eng.

CERTIFICATE OF QUALIFIED PERSON
Avenida Presidente Riesco 5335 Las Condes, Santiago
I, Dr. Antonio Luraschi, CMC, am employed as a Manager of Metallurgical Development with Amec Foster Wheeler Ingeniería y Construcción Ltda. (doing business as Wood), located at Avenida Presidente Riesco 5335, Las Condes, Santiago, Chile.
This certificate applies to the technical report titled “Santo Domingo Project, Region III, Chile, NI 43-101 Technical Report” that has an effective date of 19 February, 2020 (the “technical report”).
I am a Registered Member of the Chilean Institute of Mining Engineers and a Qualified Person (persona competente) with the Chilean Mining Commission, registration number #0188. I graduated from University of Concepcion, Chile, as a Chemical Professional Engineer and Metallurgical Professional Engineer in 1971, and obtained M.Sc. (1973) and Ph.D. (1976) degrees from the Massachusetts Institute of Technology in the United States.
I have practiced my profession for 43 years. I have been directly involved in a number of mining and metallurgical projects, specifically in their process and project development and financial analysis, including financial evaluation of several similar mining development projects in recent years.
As a result of my experience and qualifications, I am a Qualified Person as defined in National Instrument 43–101 Standards of Disclosure for Mineral Projects (NI 43–101).
I have not visited the Santo Domingo Project site.
I am responsible for Sections 1.1, 1.15.5, 1.17, 1.18 to 1.21, 1.23, 1.24.1, 1.24.5, 1.24.7 to 1.24.11; Sections 2.1 to 2.3, 2.5, 2.6; Section 3; Section 18.8; Section 19; Section 21.1.1, 21.1.3, 21.1.5 to 21.1.13, 21.2.3 to 21.2.8; Section 22; Sections 24.1, 24.5.9.1, 24.5.9.2, 24.5.9.4, 24.6, 24.8.1.1, 24.8.2.3 to 24.8.2.7, 24.8.3.1, 24.8.3.3, 24.8.3.9, 24.8.4, 24.9 to 24.11, Sections 25.1, 25.12 to 25.15, 25.18.5 to 25.18.10; and Section 27 of the technical report.
I am independent of Capstone Mining Corp. as independence is described by Section 1.5 of NI 43–101.
I have been involved with the Santo Domingo report since 2018, and have previously co-authored a technical report on the project:
• Maycock, J., Luraschi, A., Mendoza, M., Bianchin, M., Rennie, D., Guzman, C., Amelunxen, R., Gingles, M., Kerr, T., and Betinol, R., 2018: Santo Domingo Project, Region III, Chile, NI 43-101 Technical Report on Feasibility Study Update: technical report prepared by Amec Foster Wheeler International Ingeniería y Construcción Limitada, Roscoe Postle Associates Inc., NCL Ltda, Aminpro Chile SPA, Sunrise Americas LLC, Knight Piésold S.A., and BRASS Chile SA for Capstone Mining Corp., effective date 26 November, 2018
I have read NI 43–101 and the sections of the technical report for which I am responsible have been prepared in compliance with that Instrument.

As of the effective date of the technical report, to the best of my knowledge, information and belief, the sections of the technical report for which I am responsible contain all scientific and technical information that is required to be disclosed to make the technical report not misleading.
Dated: 24 March, 2020
“Signed”
Dr Antonio Luraschi, CMC.

CERTIFICATE OF QUALIFIED PERSON
Avenida Presidente Riesco 5335, Las Condes, Santiago
I, Marcial Mendoza, CMC., am employed as a Supervising Engineer Process and Technology with Amec Foster Wheeler Ingeniería y Construcción Ltda (doing business as Wood), located at located at Avenida Presidente Riesco 5335, Las Condes, Santiago, Chile.
This certificate applies to the technical report titled “Santo Domingo Project, Region III, Chile, NI 43-101 Technical Report” that has an effective date of 19 February, 2020 (the “technical report”).
I am a Qualified Person (persona competente) with the Chilean Mining Commission, registration number #0175. I graduated from University of Concepcion, Chile, as a Metallurgical Professional Engineer in 1984.
I have practiced my profession for 35 years. During this time, I have been directly involved in, and supervised, the design of metallurgical testwork programs and pilot plant testing, in designing process flowsheets and selection of mineral processing equipment. I have been directly involved in process engineering design and construction for copper projects in Chile.
As a result of my experience and qualifications, I am a Qualified Person as defined in National Instrument 43–101 Standards of Disclosure for Mineral Projects (NI 43–101).
I have not visited the Santo Domingo Project.
I am responsible for Sections 1.1, 1.8.1, 1.8.2, 1.8.3, 1.14, 1.24.1, 1.24.4, 1.25.1, 1.25.4, Sections 2.1 to 2.3, 2.6; Sections 3.1, 3.2, 3.3; Sections 13.1.1 to 13.1.3, 13.1.5 to 13.1.10, 13.3.1, 13.4.1, 13.4.2, 13.5.1; Section 17; Section 18.5.2; Sections 21.1.3, 21.2.2, Sections 24.4.2 to 24.4.3, 24.4.4.1, 24.4.5, 24.8.1.3, 24.8.3.3, 24.8.3.6 to 24.8.3.8; Sections 25.1, 25.5, 25.9, 25.17; Sections 26.1, 26.4.1; and Section 27 of the technical report.
I am independent of Capstone Mining Corp. as independence is described by Section 1.5 of NI 43–101.
I have been involved with the Santo Domingo report since 2018 and have co-authored a technical report on the project:
Maycock, J., Luraschi, A., Mendoza, M., Bianchin, M., Rennie, D., Guzman, C., Amelunxen, R., Gingles, M., Kerr, T., and Betinol, R., 2018: Santo Domingo Project, Region III, Chile, NI 43-101 Technical Report on Feasibility Study Update: technical report prepared by Amec Foster Wheeler International Ingeniería y Construcción Limitada, Roscoe Postle Associates Inc., NCL Ltda, Aminpro Chile SPA, Sunrise Americas LLC, Knight Piésold S.A., and BRASS Chile SA for Capstone Mining Corp., effective date 26 November, 2018
I have read NI 43–101 and the sections of the technical report for which I am responsible have been prepared in compliance with that Instrument.

As of the effective date of the technical report, to the best of my knowledge, information and belief, the sections of the technical report for which I am responsible contain all scientific and technical information that is required to be disclosed to make the technical report not misleading.
Dated: 24 March, 2020
“signed”
Marcial Mendoza, CMC.
CERTIFICATE OF QUALIFIED PERSON #600 – 4445 Lougheed Hwy
Burnaby, BC, V5C 0E4 Canada
I, Dr Mario Bianchin, P.Geo., am employed as a Senior Associate Hydrogeologist with Wood Canada Limited (doing business as Wood), located at #600 – 4445 Lougheed Hwy, Burnaby, BC, V5C 0E4, Canada.
This certificate applies to the technical report titled “Santo Domingo Project, Region III, Chile, NI 43-101 Technical Report” that has an effective date of 19 February, 2020 (the “technical report”).
I am a Professional Geoscientist with Engineers and Geoscientists of British Columbia, membership #39051. In addition, I am a Professional Geoscientist with the Association of Professional Engineers and Geoscientists of Alberta, membership #201901. I graduated with a PhD in Hydrology from the University of British Columbia in 2010.
I have practiced my profession for 19 years. I have been directly involved in environmental baseline studies, water and water management scopes for mining projects since 2010.
As a result of my experience and qualifications, I am a Qualified Person as defined in National Instrument 43–101 Standards of Disclosure for Mineral Projects (NI 43–101).
I have not visited the Santo Domingo Project.
I am responsible for Sections 1.1; 1.16.1 to 1.16.3, 1.16.5, 1.24.1, 1.24.6, 1.25.1, 1.25.4; Sections 2.1 to 2.3, 2.6; Sections 3.1 to 3.3; Section 18.5; Sections 20.1. to 20.3, 20.5, 20.6; Sections 24.1, 24.5.5, 24.7.1 to 24.7.3, 24.7.5; Sections 25.1, 25.11, 25.18.4; Sections 26.1, 26.4.2; and Section 27 of the technical report.
I am independent of Capstone Mining Corp. as independence is described by Section 1.5 of NI 43–101.
I have been involved with the Santo Domingo report since 2018 and have co-authored the following report on the project:
• Maycock, J., Luraschi, A., Mendoza, M., Bianchin, M., Rennie, D., Guzman, C., Amelunxen, R., Gingles, M., Kerr, T., and Betinol, R., 2018: Santo Domingo Project, Region III, Chile, NI 43-101 Technical Report on Feasibility Study Update: technical report prepared by Amec Foster Wheeler International Ingeniería y Construcción Limitada, Roscoe Postle Associates Inc., NCL Ltda, Aminpro Chile SPA, Sunrise Americas LLC, Knight Piésold S.A., and BRASS Chile SA for Capstone Mining Corp., effective date 26 November, 2018
I have read NI 43–101 and the sections of the technical report for which I am responsible have been prepared in compliance with that Instrument.

As of the effective date of the technical report, to the best of my knowledge, information and belief, the sections of the technical report for which I am responsible contain all scientific and technical information that is required to be disclosed to make the technical report not misleading.
Dated: 24 March, 2020
“Signed and sealed”
Dr Mario Bianchin, P.Geo..

RPA 55 University Ave. Suite 501 | Toronto, ON, Canada M5J 2H7 | T +1 (416) 947 0907 www.rpacan.com
CERTIFICATE OF QUALIFIED PERSON
Suite 501, 55 University Ave Toronto, ON, M5J 2H7
Canada
I, David Rennie, P.Eng., am employed as an Associate Principal Geologist with Roscoe Postle Associates Inc., located at Suite 501, 55 University Ave, Toronto, ON, M5J 2H7.
This certificate applies to the technical report titled “Santo Domingo Project, Region III, Chile, NI 43-101 Technical Report” that has an effective date of 19 February, 2020 (the “technical report”).
I am a Professional Engineer in the Province of British Columbia (Reg.#13572). I graduated from the University of British Columbia, Vancouver, BC, Canada, in 1979 with a Bachelor of Applied Science degree in Geological Engineering.
I have practiced my profession for 41 years since graduation. I have extensive experience in a number of geological environments and have carried out numerous Mineral Resource estimates, audits, and reviews for a wide variety of commodities, including copper, gold, silver, nickel laterite, tungsten, iron, uranium, PGEs, and industrial minerals. My relevant experience for the purpose of the technical report includes:
• Preparation of Mineral Resource estimates and audits on numerous copper-gold exploration projects and mining operations in North and South America.
• Pre-Feasibility and Feasibility Study work on several projects.
As a result of my experience and qualifications, I am a Qualified Person as defined in National Instrument 43–101 Standards of Disclosure for Mineral Projects (NI 43–101).
I visited the Santo Domingo Project site on 14 to 16 June 2010 and again from 14 to 15 June 2012.
I am responsible for Sections 1.1, 1.4 to 1.7, 1.9, 1.10, 1.25.1, 1.25.2; Section 2; Section 6; Section 7; Section 8; Section 9; Section 10; Section 11; Section 12; Section 14; Section 23; Sections 25.1, 25.3, 25.4, 25.6; Sections 26.1, 26.2; and Section 27 of the technical report.
I am independent of Capstone Mining Corp. as independence is described by Section 1.5 of NI 43–101.
I have previously co-authored the following technical reports on the project:
• Maycock, J., Luraschi, A., Mendoza, M., Bianchin, M., Rennie, D., Guzman, C., Amelunxen, R., Gingles, M., Kerr, T., and Betinol, R., 2018: Santo Domingo Project, Region III, Chile, NI 43-101 Technical Report on Feasibility Study Update: technical report prepared by Amec Foster Wheeler International Ingeniería y Construcción Limitada, Roscoe Postle Associates Inc., NCL Ltda, Aminpro Chile SPA, Sunrise Americas LLC, Knight Piésold S.A., and Brass Chile SA for Capstone Mining Corp., effective date 26 November, 2018

RPA 55 University Ave. Suite 501 | Toronto, ON, Canada M5J 2H7 | T +1 (416) 947 0907 www.rpacan.com
2
• Maycock, J., Gopfert, H., Rennie D., Guzman, C., Frost, D., Kerr, T., Betinol, R., Klimek, A., and Khera V., 2014: Santo Domingo Project, Region III, Chile, NI 43-101 Technical Report on Feasibility Study: technical report prepared by AMEC International Ingeniería y Construcción Limitada, NCL Ltda, Roscoe Postle Associates Inc., Knight Piésold and Co., and BRASS Chile SA, effective date 22 May, 2014
• Brimage, D., Rennie, D., Nilsson, J., Winkers, A., and Davies, M., 2011: Technical Report on the Santo Domingo Project, Chile: unpublished report prepared by Ausenco Minerals and Metals, Roscoe Postle Associates Inc., Nilsson Mine Services Ltd., Arthur H. Winckers & Associates Mineral Processing Consulting Inc., and Amec Environment & Infrastructure for Capstone Mining Corp., effective date 28 September 2011
• Rennie, D., 2010: Technical Report on The Santo Domingo Property, Region III, Atacama Province, Chile, NI 43-101 Report: unpublished report prepared by Scott Wilson Roscoe Postle Associates for Far West Mining Ltd, re-addressed to Capstone Mining Corp., effective date 26 August 2010
• Lacroix, P.A., and Rennie, D.W., 2007: Technical Report on the 4A (Santo Domingo) Area of the Candelaria Project, Region III, Atacama Province, Chile: unpublished technical report prepared by Roscoe Postle Associates Inc. for Far West Mining Ltd., effective date 19 October 2007
I have read NI 43–101 and the sections of the technical report for which I am responsible have been prepared in compliance with that Instrument.
As of the effective date of the technical report, to the best of my knowledge, information and belief, the sections of the technical report for which I am responsible contain all scientific and technical information that is required to be disclosed to make the technical report not misleading.
Dated: 24 March, 2020
“Signed and sealed”
David Rennie, P.Eng.
NCL Ingeniería y Construcción SpA. General del Canto 230, office 401, Providencia, Santiago, Chile. Tel: +56 2 2651-0800 Fax: +56 2 2651-0890 [email protected]
CERTIFICATE OF QUALIFIED PERSON
I, Carlos Guzman, CMC, FAusIMM, am employed as the Principal/Project Director with NCL SpA, located at General del Canto 230, Office 401, Providencia, Santiago, Chile.
This certificate applies to the technical report titled “Santo Domingo Project, Region III, Chile, NI 43-101 Technical Report” that has an effective date of 19 February, 2020 (the “technical report”).
I am a registered with the Comision Calificadora de Competencias en Recursos y Reservas Mineras (CMC; N° 0119). I am also a Fellow of the Australasian Institute of Mining and Metallurgy (FAusIMM, N°229036). I graduated from the Universidad of Chile as a mining engineer in 1995.
I have practiced my profession for 24 years since graduation. My relevant experience for the purpose of the technical report is:
• Review and report as a consultant on numerous exploration, mining operation and projects around the world for due diligence and regulatory requirements.
• I have extensive experience in mining engineering. I have worked on mining engineering assignments.
As a result of my experience and qualifications, I am a Qualified Person as defined in National Instrument 43–101 Standards of Disclosure for Mineral Projects (NI 43–101).
I visited the Santo Domingo Project site on 15 October 2013 and again on 29 October 2018.
I am responsible for Sections 1.1, 1.11 to 1.13, 1.15.3, 1.15.4, 1.24.1 to 1.24.3; Sections 2.1 to 2.6; Section 3; Section 15; Section 16; Sections 18.3, 18.4; Sections 21.1.2, 21.2.1; Sections 24.1 to 24.3, 24.5.3, 24.5.4, 24.8.1.2, 24.8.3.2; Sections 25.1, 25.7, 25.8, 25.18.1; and Section 27 of the technical report.
I am independent of Capstone Mining Corp. as independence is described by Section 1.5 of NI 43–101.
I have previously co-authored the following technical reports on the project:
• Maycock, J., Luraschi, A., Mendoza, M., Bianchin, M., Rennie, D., Guzman, C., Amelunxen, R., Gingles, M., Kerr, T., and Betinol, R., 2018: Santo Domingo Project, Region III, Chile, NI 43-101 Technical Report on Feasibility Study Update: technical report prepared by Amec Foster Wheeler International Ingeniería y Construcción Limitada, Roscoe Postle Associates Inc., NCL Ltda, Aminpro Chile SPA, Sunrise Americas LLC, Knight Piésold S.A., and BRASS Chile SA for Capstone Mining Corp., effective date 26 November, 2018
• Maycock, J., Gopfert, H., Rennie D., Guzman, C., Frost, D., Kerr, T., Betinol, R., Klimek, A., and Khera V., 2014: Santo Domingo Project, Region III, Chile, NI 43-101 Technical Report on Feasibility Study: technical report prepared by AMEC International Ingeniería y Construcción Limitada, NCL Ltda, Roscoe Postle Associates Inc., Knight Piésold and Co., and BRASS Chile SA, effective date 22 May, 2014.
I have read NI 43–101 and the sections of the technical report for which I am responsible have been prepared in compliance with that Instrument.
As of the effective date of the technical report, to the best of my knowledge, information and belief, the sections of the technical report for which I am responsible contain all scientific and technical information that is required to be disclosed to make the technical report not misleading.
Dated: 24 March, 2020
“Signed”
Carlos Guzman, CMC, FAusIMM.
CERTIFICATE OF QUALIFIED PERSON Amelunxen Mineral Processing Ltd
41961 Ross Road (Box 296) Garibaldi Highlands, BC, V0N 1T0
I, Roger Amelunxen, P.Eng.., am employed as a Principal with Amelunxen Mineral Processing Ltd, with an office at 41961 Ross Road Garibaldi Highlands, BC, V0N 1T0.
This certificate applies to the technical report titled “Santo Domingo Project, Region III, Chile, NI 43-101 Technical Report” that has an effective date of 19 February, 2020 (the “technical report”).
I am a P.Eng of the Association of Professional Engineers and Geoscientists of British Columbia I graduated from McGill University, Montreal, Quebec, in 1974.
I have practiced my profession for 45 years. I have been directly involved in:
• Placer Development: Dump Leaching Process Design – Gibraltar Mines-1984
• SPCC: Toquepala Dump Leaching SX-EW Design-1992
• Freeport McMoRan: 103 K Expansion Design Grasberg-1993
• BHP-Escondida : Design Phase 3.5 , Design Phase IV, Design Hamburgo Tailings
• Newmont – Minas Conga – Process plant design -2004-2008
• Freeport McMoRan: Design Grasberg Tailings Pyrite process to 2042; 2013
• Codelco – Andina – Moly plant Design - 1992
• Freeport McMoRan – Design of Bagdad Moly plant - 2018
• Quadra - Sierra Gorda – Bulk Plant Design - 2008
• Newcrest – Cadia – Moly Plant design – 2018.
As a result of my experience and qualifications, I am a Qualified Person as defined in National Instrument 43–101 Standards of Disclosure for Mineral Projects (NI 43–101).
I have not visited the Santo Domingo Project.
I am responsible for Section 1.8.1, 1.24.4; Sections 2.1 to 2.3, 2.6; Sections 13.1.1, 13.1.4.3, 13.2.1 to 13.2.3, 13.5.1; Section 24.4.1; and Section 27 of the technical report.
I am independent of Capstone Mining Corp. as independence is described by Section 1.5 of NI 43–101.
I have been involved with the Santo Domingo Project since 2018, and have previously co-authored the following technical report on the project:
• Maycock, J., Luraschi, A., Mendoza, M., Bianchin, M., Rennie, D., Guzman, C., Amelunxen, R., Gingles, M., Kerr, T., and Betinol, R., 2018: Santo Domingo Project, Region III, Chile, NI 43-101 Technical Report on Feasibility Study Update: technical report prepared by Amec Foster Wheeler International Ingeniería y Construcción Limitada, Roscoe Postle Associates Inc., NCL Ltda, Aminpro Chile SPA, Sunrise Americas LLC, Knight Piésold S.A., and BRASS Chile SA for Capstone Mining Corp., effective date 26 November, 2018.
I have read NI 43–101 and the sections of the technical report for which I am responsible have been prepared in compliance with that Instrument.
As of the effective date of the technical report, to the best of my knowledge, information and belief, the sections of the technical report for which I am responsible contain all scientific and technical information that is required to be disclosed to make the technical report not misleading.
Dated: 24 March, 2020
“Signed and sealed”
Roger Amelunxen, P.Eng.
1
CERTIFICATE OF QUALIFIED PERSON
7902 Glen Ridge Drive, Castle Pines, Colorado 80108, USA
I, Michael J. Gingles, am employed as the Principal of Sunrise Americas LLC with a business address at 7902 Glen Ridge Drive, Castle Pines, Colorado 80108, USA.
This certificate applies to the technical report titled “Santo Domingo Project, Region III, Chile, NI 43-101 Technical Report” that has an effective date of 19 February, 2020 (the “technical report”).
I am a Qualified Professional (QP) member of the Metallurgical & Mining Society of America (MMSA) with special expertise in Mineral Valuation; membership number 01393QP. I graduated from Kings College, University of London, with a BSc. in Geology in 1984, I obtained an MSc. from the Royal School of Mines, University of London, in Mineral Exploration in 1985, and I obtained an MBA from Imperial College Business School, University of London, in 1991.
I have practiced my profession for 30 years since graduation. I have been directly involved in strategic planning, valuations, corporate development, business development and commercial contracts in mining, energy, water and infrastructure throughout my career. I have worked on four continents, both for major mining companies (Outokumpu; Placer Dome) and in the junior sector. Through my consultancy firm, I have advised a number of national and international firms on mining, energy, water, infrastructure and EPC contracts.
I have visited and participated in development projects and mines in Chile since 1992, including living in Chile between 1995-2004. I was responsible for management of key supply and infrastructure projects as Strategic Planning Manager for Compañia Minera Zaldívar between 1995-1998; I was EVP Corporate Development for Placer Dome Americas between 2001-2006, and was involved in major acquisitions and project development of the company’s major copper and gold assets in Chile and the Americas; and I was President and CEO of Fortune Valley Resources between 2006-2010, a TSX Venture Exchange-listed junior mining company with a portfolio of mining assets in Chile. I have participated in the planning and negotiation of several major electricity contracts in Chile and the Americas.
As a result of my experience and qualifications, I am a Qualified Person as defined in National Instrument 43–101 Standards of Disclosure for Mineral Projects (NI 43–101).
I visited the Santo Domingo Project site on 11 October 2018.
I am responsible for Sections 1.1, 1.15.2, 1.15.6, 1.24.1, 1.24.5; Sections 2.1 to 2.4, 2.6; Sections 3.1, 3.2, 3.3; Sections 18.2.1, 18.2.2, 18.9; Section 21.2.4; Sections 24.1, 24.5.2, 24.5.10, 24.8.3.5; Sections 25.1, 25.10; and Section 27 of the Technical Report.
I am independent of Capstone Mining Corp. as independence is described by Section 1.5 of NI 43–101.

2
I have been involved with the Santo Domingo Project since 2018 and previously co-authored the following technical report on the project:
Maycock, J., Luraschi, A., Mendoza, M., Bianchin, M., Rennie, D., Guzman, C., Amelunxen, R., Gingles, M., Kerr, T., and Betinol, R., 2018: Santo Domingo Project, Region III, Chile, NI 43-101 Technical Report on Feasibility Study Update: technical report prepared by Amec Foster Wheeler International Ingeniería y Construcción Limitada, Roscoe Postle Associates Inc., NCL Ltda, Aminpro Chile SPA, Sunrise Americas LLC, Knight Piésold S.A., and Brass Chile SA for Capstone Mining Corp., effective date 26 November, 2018
I have read NI 43–101 and the sections of the Technical Report for which I am responsible have been prepared in compliance with that Instrument.
As of the effective date of the Technical Report, to the best of my knowledge, information and belief, the sections of the Technical Report for which I am responsible contain all scientific and technical information that is required to be disclosed to make the technical report not misleading.
Dated: 24 March 2020
“signed”
Michael Gingles, QP MMSA.

CERTIFICATE OF QUALIFIED PERSON 750 West Pender St., Suite 1400
Vancouver, BC, V6C 2T8 Canada
I, Thomas F. Kerr, P.Eng., P.E., am employed as a Principal Consultant with Knight Piésold Ltd., located at 750 West Pender St., Suite 1400, Vancouver, BC, V6C 2T8, Canada.
This certificate applies to the technical report titled “Santo Domingo Project, Region III, Chile, NI 43-101 Technical Report” that has an effective date of 19 February, 2020 (the “technical report”).
I am a Registered Professional Engineer in the State of Colorado (Registration No. 44505). In addition, I am a member in good standing of the following professional associations:
Registered Professional Engineer in the State of Michigan (Registration No. 6201057916)
Registered Professional Engineer in the State of Alaska (Registration No. 10969)
Registered Professional Engineer in the State California (Registration No. C49260)
Registered Professional Engineer – Ontario, Canada (No. 90407230)
Registered Professional Engineer – British Columbia, Canada (No. 14906).
I graduated from the University of Saskatchewan, Canada with a B.Sc., Eng. (Civil) in 1982 and from Imperial College, United Kingdom with an M.Sc.,D.I.C. Eng (Soil Mechanics) in 1986.
I have worked as a Civil Geotechnical Engineer for a total of 37 years since my graduation from the University of Saskatchewan, Canada in 1982. I have extensive experience in design, construction, operation, and closure of geotechnical, water, and environmental projects for the mining industry. My principal areas of expertise are in tailings and heap leach management facilities and I have been responsible for the planning, design, and operational assistance on many such facilities around the world. In tailings management, my work has included sub-aerial, cycloned, thickened, and paste projects.
As a result of my experience and qualifications, I am a Qualified Person as defined in National Instrument 43–101 Standards of Disclosure for Mineral Projects (NI 43–101).
I visited the Santo Domingo Project site on 24 October 2013.
I am responsible for Sections 1.1, 1.16.4, 1.24.1, 1.24.6, 1.25.3; Sections 2.1 to 2.4, 2.6; Sections 3.1, 3.2, 3.3; Section 20.4; Section 21.1.4; Sections 24.1, 24.7.4, 24.8.1.4; Sections 25.1, 25.10, 25.18.3; Sections 26.1, 26.3, and Section 27 of the technical report.
I am independent of Capstone Mining Corp. as independence is described by Section 1.5 of NI 43–101.
I have previously co-authored the following technical reports on the project:
Maycock, J., Luraschi, A., Mendoza, M., Bianchin, M., Rennie, D., Guzman, C., Amelunxen, R., Gingles, M., Kerr, T., and Betinol, R., 2018: Santo Domingo Project, Region III, Chile, NI 43-101 Technical Report on Feasibility Study Update: technical report prepared by Amec Foster Wheeler International Ingeniería y Construcción Limitada, Roscoe Postle Associates Inc., NCL Ltda,

Aminpro Chile SPA, Sunrise Americas LLC, Knight Piésold S.A., and BRASS Chile SA for Capstone Mining Corp., effective date 26 November, 2018
Maycock, J., Gopfert, H., Rennie D., Guzman, C., Frost, D., Kerr, T., Betinol, R., Klimek, A., and Khera V., 2014: Santo Domingo Project, Region III, Chile, NI 43-101 Technical Report on Feasibility Study: technical report prepared by Amec International Ingeniería y Construcción Limitada, NCL Ltda, Roscoe Postle Associates Inc., Knight Piésold and Co., and BRASS Chile SA, effective date 22 May, 2014
I have read NI 43–101 and the sections of the technical report for which I am responsible have been prepared in compliance with that Instrument.
As of the effective date of the technical report, to the best of my knowledge, information and belief, the sections of the technical report for which I am responsible contain all scientific and technical information that is required to be disclosed to make the technical report not misleading.
Dated: 24 March 2020
“Signed and sealed”
Thomas F. Kerr, P.Eng., P.E.
CERTIFICATE OF QUALIFIED PERSON
Cerro el Plomo 5420 Las Condes
Santiago, Chile
I, Roy Betinol, P. Eng., am employed as the General Manager of BRASS Chile SA, located at Cerro el Plomo 5420, Las Condes, Santiago, Chile.
This certificate applies to the technical report titled “Santo Domingo Project, Region III, Chile, NI 43-101 Technical Report” that has an effective date of 19 February, 2020 (the “technical report”).
I am a Registered Professional Engineer from the State of California, Registration number M30166. I am an affiliate member of the American Society of Mechanical Engineers, USA. I graduated from Silliman University in 1976 with the degree of Bachelor in Science of Mechanical Engineering.
I have practiced my profession for 42 years. I have been directly involved in the design of slurry concentrate pipelines which are currently operating. Some of the most recent projects include the Cerro Negro Norte Iron Concentrate Pipeline, 2013, Chile; Escondida Expansion Copper Concentrate Pipeline, 2013, Chile; Hierro Atacama Iron Concentrate Pipeline, 2008, Chile; and, Paragominas Bauxite Pipeline, 2006, Brazil.
As a result of my experience and qualifications, I am a Qualified Person as defined in National Instrument 43–101 Standards of Disclosure for Mineral Projects (NI 43–101).
I have not visited the Santo Domingo Project.
I am responsible for Sections 1.1, 1.25.1, 1.25.6; Sections 2.1 to 2.3, 2.6; Sections 3.1, 3.2. 3.3; Sections 18.2.4, 18.6; Section 21.1.6; Sections 24.1, 24.5.6, 24.8.2.1; Sections 25.1, 25.10, 25.18.3; Sections 26.1, 26.6; and Section 27 of the technical report.
I am independent of Capstone Mining Corp. as independence is described by Section 1.5 of NI 43–101.
I have previously co-authored the following technical reports on the project:
• Maycock, J., Luraschi, A., Mendoza, M., Bianchin, M., Rennie, D., Guzman, C., Amelunxen, R., Gingles, M., Kerr, T., and Betinol, R., 2018: Santo Domingo Project, Region III, Chile, NI 43-101 Technical Report on Feasibility Study Update: technical report prepared by Amec Foster Wheeler International Ingeniería y Construcción Limitada, Roscoe Postle Associates Inc., NCL Ltda, Aminpro Chile SPA, Sunrise Americas LLC, Knight Piésold S.A., and BRASS Chile SA for Capstone Mining Corp., effective date 26 November, 2018
• Maycock, J., Gopfert, H., Rennie D., Guzman, C., Frost, D., Kerr, T., Betinol, R., Klimek, A., and Khera V., 2014: Santo Domingo Project, Region III, Chile, NI 43-101 Technical Report on Feasibility Study: technical report prepared by Amec International Ingeniería y Construcción Limitada, NCL Ltda, Roscoe Postle Associates Inc., Knight Piésold and Co., and BRASS Chile SA, effective date 22 May, 2014.
I have read NI 43–101 and the sections of the technical report for which I am responsible have been prepared in compliance with that Instrument.
As of the effective date of the technical report, to the best of my knowledge, information and belief, the sections of the technical report for which I am responsible contain all scientific and technical information that is required to be disclosed to make the technical report not misleading.
Dated: 24 March, 2020
“signed and sealed”
Roy Betinol, P.Eng.
CERTIFICATE OF QUALIFIED PERSON
I, Lyn Jones, P.Eng., am employed as a Senior Consultant with M.Plan International, with a business address at 900-390 Bay Street, Toronto, Ontario, Canada M5H 2Y2. This certificate applies to the technical report titled “Santo Domingo Project, Region III, Chile, NI 43-101 Technical Report” that has an effective date of 19 February, 2020 (the “technical report”). I am registered as a Professional Engineer in the province of Ontario (PEO licence #100067095). I graduated from the University of British Columbia in 1996 with a Bachelor’s of Applied Science in 1996, and a Master’s of Applied Science in 1998. I have practiced my profession continuously for 22 years. I have been directly involved with base and precious metals projects in the mining sector with experience including metallurgical testwork, flowsheet development, process engineering, and plant commissioning. As a result of my experience and qualifications, I am a Qualified Person as defined in National Instrument 43–101 Standards of Disclosure for Mineral Projects (NI 43–101). I have not visited the Santo Domingo Project site. I am responsible for Sections 1.1, 1.8.4, 1.24.1, 1.24.4, 1.24.8, 1.24.9, 1.25.5, Sections 2.1 to 2.3, 2.6; Sections 13.1.1, 13.1.11, 13.2.4, 13.3.2, 13.4.3, 13.5.2; Sections 24.1, 24.4.1, 24.4.2, 24.4.3, 24.4.4.2, 24.4.5, 24.5.7, 24.5.9.3, 24.6.4, 24.8.1.3, 24.8.3.3; Sections 25.1, 25.5, 25.18.2; Sections 26.1, 26.5; and Section 27 of the technical report. I am independent of Capstone Mining Corp. as independence is described by Section 1.5 of NI 43–101. I have been involved with the Santo Domingo project since October, 2018. I have read NI 43–101 and the sections of the technical report for which I am responsible have been prepared in compliance with that Instrument.
As of the effective date of the technical report, to the best of my knowledge, information and belief, the sections of the technical report for which I am responsible contain all scientific and technical information that is required to be disclosed to make the technical report not misleading.
Dated: 24 March, 2020.
“Signed”
Lyn Jones, P.Eng.

CERTIFICATE OF QUALIFIED PERSON
I, Gregg Bush, P.Eng., am self-employed as a consulting metallurgist, with a business address at 120 Milross Ave., Vancouver, BC.
This certificate applies to the technical report titled “Santo Domingo Project, Region III, Chile, NI 43-101 Technical Report” that has an effective date of 19 February, 2020 (the “technical report”).
I am a Registered Member of the Engineers and Geoscientists British Columbia, P.Eng., EGBC# 50474.
I am a graduate of the University of Texas at El Paso, with a Bachelor of Science degree that was conferred in 1981. I have been practicing my profession since 1981.
I have been directly involved in or responsible for the operation of comminution, flotation, leaching, solvent extraction and electrowinning, and pyrometallurgical circuits, and have been responsible for metallurgical testing design, flowsheet design, and capital and operating cost planning for operations and projects in North and South America.
As a result of my experience and qualifications, I am a Qualified Person as defined in National Instrument 43–101 Standards of Disclosure for Mineral Projects (NI 43–101).
I visited the Santo Domingo Project site most recently on 7 August 2019.
I am responsible for Sections 1.1, 1.8.4, 1.24.1, 1.24.4, 1.24.8, 1.24.9, 1.25.5, Sections 2.1 to 2.4, 2.6; Sections 3.1, 3.2, 3.3, 3.5, 3.6; Sections 13.1.1, 13.1.11, 13.2.4, 13.3.2, 13.4.3, 13.5.2; Sections 24.1, 24.4.1, 24.4.2, 24.4.3, 24.4.4.2, 24.4.5, 24.5.7, 24.5.9.3, 24.6.4, 24.8.1.3, 24.8.3.3; Sections 25.1, 25.5, 25.18.2; Sections 26.1, 26.5; and Section 27 of the technical report.
I am not independent of Capstone Mining Corp. as independence is described by Section 1.5 of NI 43–101.
I have been involved with the Santo Domingo report since 2012. From 2012 to 2018, as the Chief Operating Office for Capstone, I was responsible for the Santo Domingo Project as a corporate asset. From 2019, I have acted as a consultant metallurgist for the Santo Domingo Project.
I have read NI 43–101, and the sections of the technical report for which I am responsible have been prepared in compliance with that Instrument.
As of the effective date of the technical report, to the best of my knowledge, information and belief, the sections of the technical report for which I am responsible contain all scientific and technical information that is required to be disclosed to make the technical report not misleading.
Dated: 24 March, 2020
“Signed”
Gregg Bush, P.Eng.
IMPORTANT NOTICE
This report was prepared as a National Instrument 43-101 Technical Report for Minera Santo Domingo SCM (Minera Santo Domingo) by Amec Foster Wheeler Ingeniería y Construcción Limitada, a Wood company, BRASS Chile SA, Knight Piésold S.A., NCL Ltda, Roscoe Postle Associates Inc, Aminpro Chile SPA, Gregg Bush, MPlan International, and Sunrise Americas LLC, collectively the “Report Authors”. The quality of information, conclusions, and estimates contained herein is consistent with the level of effort involved in the Report Authors’ services, based on i) information available at the time of preparation, ii) data supplied by outside sources, and iii) the assumptions, conditions, and qualifications set forth in this report. This report is intended for use by Minera Santo Domingo subject to terms and conditions of the individual contracts with the Report Authors. Except for the purposes legislated under Canadian provincial and territorial securities law, any other use of, or reliance on, this report by any third party is at that party’s sole risk.

Santo Domingo Project Region III, Chile
NI 43-101 Technical Report
TOC i
March 2020 Project Number: C40029
C O N T E N T S
1.0 SUMMARY .................................................................................................................................................................. 1-1 1.1 Introduction and Terms of Reference ............................................................................................. 1-1 1.2 Property Setting ...................................................................................................................................... 1-2 1.3 Mineral Tenure, Surface Rights, Water Rights and Agreements .......................................... 1-3 1.4 Geology and Mineralization ............................................................................................................... 1-4 1.5 History ......................................................................................................................................................... 1-6 1.6 Drilling and Sampling ........................................................................................................................... 1-7 1.7 Data Verification ...................................................................................................................................... 1-8 1.8 Metallurgical Testwork ......................................................................................................................... 1-8
1.8.1 Overview .................................................................................................................................... 1-8 1.8.2 Copper and Gold .................................................................................................................... 1-9 1.8.3 Iron ............................................................................................................................................ 1-12 1.8.4 Cobalt....................................................................................................................................... 1-14
1.9 Mineral Resource Estimation ........................................................................................................... 1-16 1.10 Mineral Resource Statement ........................................................................................................... 1-17 1.11 Mineral Reserve Estimation ............................................................................................................. 1-19 1.12 Mineral Reserve Statement .............................................................................................................. 1-20 1.13 Mining Methods ................................................................................................................................... 1-22 1.14 Recovery Methods ............................................................................................................................... 1-23
1.14.1 Crushing and Grinding ...................................................................................................... 1-23 1.14.2 Copper Flotation ................................................................................................................. 1-23 1.14.3 Magnetic Separation .......................................................................................................... 1-24 1.14.4 Tailings Thickening ............................................................................................................. 1-24 1.14.5 Copper Concentrate Filtration ....................................................................................... 1-25 1.14.6 High Density Tailings and Tailings Transport .......................................................... 1-25 1.14.7 Plant Infrastructure ............................................................................................................. 1-25 1.14.8 Port Infrastructure ............................................................................................................... 1-25 1.14.9 Production Plan ................................................................................................................... 1-26
1.15 Infrastructure ......................................................................................................................................... 1-26 1.15.1 Planned Facilities ................................................................................................................. 1-26 1.15.2 Access Considerations ....................................................................................................... 1-27 1.15.3 Waste Rock Storage Facilities ........................................................................................ 1-27 1.15.4 Stockpile Facilities ............................................................................................................... 1-27 1.15.5 Port ........................................................................................................................................... 1-27 1.15.6 Power and Electrical Supply ............................................................................................ 1-28
1.16 Environmental, Permitting and Social Considerations .......................................................... 1-28 1.16.1 Environmental Considerations ....................................................................................... 1-28 1.16.2 Permitting Considerations ............................................................................................... 1-29 1.16.3 Closure Considerations ..................................................................................................... 1-29 1.16.4 Tailings Storage Facility .................................................................................................... 1-29
Santo Domingo Project Region III, Chile
NI 43-101 Technical Report
TOC ii
March 2020 Project Number: C40029
1.16.5 Social Considerations ........................................................................................................ 1-31 1.17 Markets and Contracts ...................................................................................................................... 1-31 1.18 Capital Cost Estimates ....................................................................................................................... 1-33 1.19 Operating Cost Estimates ................................................................................................................. 1-34 1.20 Economic Analysis ............................................................................................................................... 1-35 1.21 Sensitivity Analysis .............................................................................................................................. 1-38 1.22 Risks and Opportunities .................................................................................................................... 1-39 1.23 Interpretation and Conclusions ...................................................................................................... 1-39 1.24 2020 Preliminary Economic Assessment .................................................................................... 1-40
1.24.1 Introduction ........................................................................................................................... 1-40 1.24.2 Mineral Resource Subset Within the 2020 PEA Mine Plan ................................. 1-40 1.24.3 2020 PEA Mining Methods .............................................................................................. 1-41 1.24.4 2020 PEA Recovery Methods ......................................................................................... 1-42 1.24.5 2020 PEA Infrastructure .................................................................................................... 1-43 1.24.6 2020 PEA Environmental, Permitting and Social Considerations ..................... 1-45 1.24.7 2020 PEA Markets and Contracts ................................................................................. 1-47 1.24.8 2020 PEA Capital Cost Estimates .................................................................................. 1-48 1.24.9 2020 PEA Operating Cost Estimates ............................................................................ 1-49 1.24.10 2020 PEA Economic Analysis .......................................................................................... 1-50 1.24.11 2020 PEA Sensitivity Analysis ......................................................................................... 1-54
1.25 Recommendations .............................................................................................................................. 1-56 1.25.1 Overview ................................................................................................................................. 1-56 1.25.2 RPA Recommendations .................................................................................................... 1-56 1.25.3 Knight Piésold Recommendations ............................................................................... 1-56 1.25.4 Wood Recommendations ................................................................................................ 1-57 1.25.5 Gregg Bush and MPlan Recommendations .............................................................. 1-57 1.25.6 Brass Recommendations .................................................................................................. 1-57
2.0 INTRODUCTION ....................................................................................................................................................... 2-1 2.1 Introduction .............................................................................................................................................. 2-1 2.2 Terms of Reference ................................................................................................................................ 2-1 2.3 Qualified Persons .................................................................................................................................... 2-3 2.4 Site Visits and Scope of Personal Inspection ............................................................................... 2-4 2.5 Effective Dates .......................................................................................................................................... 2-4 2.6 Information Sources and References .............................................................................................. 2-5 2.7 Previous Technical Reports ................................................................................................................. 2-6
3.0 RELIANCE ON OTHER EXPERTS ......................................................................................................................... 3-1 3.1 Introduction .............................................................................................................................................. 3-1 3.2 Property Ownership ............................................................................................................................... 3-1 3.3 Mineral Tenure, Rights of Way and Easements .......................................................................... 3-1 3.4 Taxation ...................................................................................................................................................... 3-2 3.5 Commodity Markets .............................................................................................................................. 3-2 3.6 Sulphuric Acid Pricing ........................................................................................................................... 3-4
4.0 PROPERTY DESCRIPTION AND LOCATION ................................................................................................... 4-1

Santo Domingo Project Region III, Chile
NI 43-101 Technical Report
TOC iii
March 2020 Project Number: C40029
4.1 Introduction .............................................................................................................................................. 4-1 4.2 Property and Title in Chile ................................................................................................................... 4-1
4.2.1 Regulations ............................................................................................................................... 4-1 4.2.2 Mineral Tenure ........................................................................................................................ 4-2 4.2.3 Surface Rights .......................................................................................................................... 4-3 4.2.4 Rights of Way .......................................................................................................................... 4-3 4.2.5 Water Rights ............................................................................................................................. 4-3 4.2.6 Environmental Regulations ................................................................................................ 4-4 4.2.7 Land Use .................................................................................................................................... 4-4 4.2.8 Closure Considerations ........................................................................................................ 4-5 4.2.9 Foreign Investment ............................................................................................................... 4-6 4.2.10 Fraser Institute Survey .......................................................................................................... 4-8
4.3 Property Ownership ............................................................................................................................... 4-9 4.4 Mineral Tenure ......................................................................................................................................... 4-9 4.5 Surface Rights ....................................................................................................................................... 4-10 4.6 Water Rights .......................................................................................................................................... 4-20 4.7 Royalties and Encumbrances .......................................................................................................... 4-20 4.8 Permitting Considerations................................................................................................................ 4-20 4.9 Environmental Considerations ........................................................................................................ 4-20 4.10 Social License Considerations ......................................................................................................... 4-20 4.11 Comments on Section 4 .................................................................................................................... 4-20
5.0 ACCESSIBILITY, CLIMATE, LOCAL RESOURCES, INFRASTRUCTURE AND PHYSIOGRAPHY ........ 5-1 5.1 Accessibility ............................................................................................................................................... 5-1 5.2 Climate ........................................................................................................................................................ 5-1 5.3 Local Resources and Infrastructure.................................................................................................. 5-2 5.4 Physiography ............................................................................................................................................ 5-3 5.5 Seismicity ................................................................................................................................................... 5-3 5.6 Comments on Section 5 ....................................................................................................................... 5-3
6.0 HISTORY ...................................................................................................................................................................... 6-1 6.1 Exploration History ................................................................................................................................. 6-1 6.2 Production ................................................................................................................................................. 6-5
7.0 GEOLOGICAL SETTING AND MINERALIZATION ......................................................................................... 7-1 7.1 Regional Geology ................................................................................................................................... 7-1 7.2 Property Geology .................................................................................................................................... 7-1
7.2.1 Lithologies ................................................................................................................................. 7-1 7.2.2 Structure .................................................................................................................................... 7-6
7.2.2.1 Faults .................................................................................................................................. 7-6 7.2.2.2 Fault Blocks ..................................................................................................................... 7-6 7.2.2.3 Folds ................................................................................................................................... 7-7
7.2.3 Alteration ................................................................................................................................... 7-8 7.2.4 Weathering and Supergene Development .................................................................. 7-8
7.3 Deposits ...................................................................................................................................................... 7-9 7.3.1 Santo Domingo Sur ............................................................................................................... 7-9
Santo Domingo Project Region III, Chile
NI 43-101 Technical Report
TOC iv
March 2020 Project Number: C40029
7.3.2 Iris .............................................................................................................................................. 7-14 7.3.3 Iris Norte ................................................................................................................................. 7-15 7.3.4 Estrellita ................................................................................................................................... 7-15
7.4 Prospects/Exploration Targets ........................................................................................................ 7-20 7.4.1 Estrellita and Estefánia Areas .......................................................................................... 7-20 7.4.2 Santo Domingo Fault ......................................................................................................... 7-23 7.4.3 Limestones ............................................................................................................................. 7-23
8.0 DEPOSIT TYPES ......................................................................................................................................................... 8-1 8.1 Introduction .............................................................................................................................................. 8-1 8.2 Candelaria Deposit ................................................................................................................................. 8-1 8.3 Manto Verde Deposit ............................................................................................................................ 8-3 8.4 Comment on Section 8 ......................................................................................................................... 8-5
9.0 EXPLORATION .......................................................................................................................................................... 9-1 9.1 Grids and Surveys ................................................................................................................................... 9-1 9.2 Geological Mapping .............................................................................................................................. 9-1 9.3 Geochemical Sampling ......................................................................................................................... 9-1 9.4 Geophysics ................................................................................................................................................ 9-2
9.4.1 Airborne ..................................................................................................................................... 9-2 9.4.2 Ground ....................................................................................................................................... 9-4
9.5 Petrology, Mineralogy and Research Studies .............................................................................. 9-4 9.6 Exploration Potential ............................................................................................................................. 9-5
10.0 DRILLING .................................................................................................................................................................. 10-1 10.1 Introduction ........................................................................................................................................... 10-1 10.2 Drill Methods ......................................................................................................................................... 10-1 10.3 Logging Procedures ............................................................................................................................ 10-5 10.4 Recovery .................................................................................................................................................. 10-5 10.5 Collar Surveys ........................................................................................................................................ 10-6 10.6 Downhole Surveys ............................................................................................................................... 10-6 10.7 Sample Length/True Thickness ...................................................................................................... 10-6 10.8 Summary of Drill Programs.............................................................................................................. 10-6
10.8.1 Santo Domingo Sur ............................................................................................................ 10-6 10.8.2 Iris and Iris Norte ................................................................................................................. 10-7 10.8.3 Estrellita ................................................................................................................................... 10-7 10.8.4 Exploration ............................................................................................................................. 10-8 10.8.5 Twin Drilling .......................................................................................................................... 10-8
10.9 Geotechnical and Condemnation Drilling .................................................................................. 10-8 10.9.1 Geotechnical Drilling ......................................................................................................... 10-8 10.9.2 Condemnation Drilling ...................................................................................................... 10-8
10.10 Comments on Section 10 ................................................................................................................. 10-9 11.0 SAMPLE PREPARATION, ANALYSES AND SECURITY .............................................................................. 11-1
11.1 Sampling Methods .............................................................................................................................. 11-1 11.1.1 Geochemical Sampling ..................................................................................................... 11-1
Santo Domingo Project Region III, Chile
NI 43-101 Technical Report
TOC v
March 2020 Project Number: C40029
11.1.2 Reverse Circulation Drilling ............................................................................................. 11-1 11.1.3 Core Drilling .......................................................................................................................... 11-1
11.2 Metallurgical Sampling ...................................................................................................................... 11-2 11.3 Density Determinations ..................................................................................................................... 11-2 11.4 Magnetic Susceptibility ..................................................................................................................... 11-3 11.5 Analytical and Test Laboratories .................................................................................................... 11-4 11.6 Sample Preparation and Analysis .................................................................................................. 11-4 11.7 Quality Assurance and Quality Control ....................................................................................... 11-5 11.8 Databases ................................................................................................................................................ 11-5 11.9 Sample Security .................................................................................................................................... 11-6 11.10 Comments on Section 11 ................................................................................................................. 11-7
12.0 DATA VERIFICATION ........................................................................................................................................... 12-1 12.1 Introduction ........................................................................................................................................... 12-1 12.2 RPA (2012) .............................................................................................................................................. 12-1 12.3 RPA (2018) .............................................................................................................................................. 12-1 12.4 RPA (2019) .............................................................................................................................................. 12-2 12.5 RPA Verification Results .................................................................................................................... 12-2
12.5.1 Analytical QA/QC ................................................................................................................ 12-2 12.5.1.1 Standards ....................................................................................................................... 12-2 12.5.1.2 Blanks .............................................................................................................................. 12-2 12.5.1.3 Duplicates ...................................................................................................................... 12-2 12.5.1.4 Pulp Duplicates ............................................................................................................ 12-3 12.5.1.5 Magnetic Susceptibility ............................................................................................ 12-4
12.5.2 Twin Holes .............................................................................................................................. 12-5 12.5.3 Mass Recovery/Magnetic Susceptibility..................................................................... 12-6 12.5.4 Cobalt....................................................................................................................................... 12-7
12.6 Comments on Section 12 ................................................................................................................. 12-8 13.0 MINERAL PROCESSING AND METALLURGICAL TESTING .................................................................... 13-1
13.1 Metallurgical Testwork ...................................................................................................................... 13-1 13.1.1 Summary ................................................................................................................................. 13-1 13.1.2 Physical Characterization ................................................................................................. 13-1 13.1.3 Comminution Circuit Testwork ...................................................................................... 13-8
13.1.3.1 Crushing and Grinding ............................................................................................. 13-8 13.1.3.2 Magnetite Regrinding ............................................................................................... 13-9
13.1.4 Copper Flotation Testwork ............................................................................................ 13-10 13.1.4.1 OCT and LCT Testwork .......................................................................................... 13-10 13.1.4.2 Pilot Plant Testwork ................................................................................................ 13-14 13.1.4.3 Aminpro 2018 and 2019 Testwork .................................................................... 13-14
13.1.4.3.1 Mineralogy .................................................................................................. 13-18 13.1.5 Magnetic Iron Testwork .................................................................................................. 13-22 13.1.6 Magnetic Separation Testwork .................................................................................... 13-23
13.1.6.1 Magnetic Separation Variability Testwork Review ...................................... 13-26 13.1.6.2 Magnetic Separation Pilot Testing .................................................................... 13-27
Santo Domingo Project Region III, Chile
NI 43-101 Technical Report
TOC vi
March 2020 Project Number: C40029
13.1.7 Magnetite Concentrate Thickening Tests ................................................................ 13-28 13.1.8 Copper Concentrate Thickening Tests ...................................................................... 13-29 13.1.9 Concentrate Filtration Testwork .................................................................................. 13-30 13.1.10 Tailings Thickening Testwork ....................................................................................... 13-33 13.1.11 Cobalt..................................................................................................................................... 13-34
13.1.11.1 Physical Characterization and Sample Selection ................................ 13-34 13.1.11.1.1 Sample Description ............................................................................... 13-34 13.1.11.1.2 Cobalt Mineral Characterization ...................................................... 13-35
13.1.11.2 Pyrite Flotation Testwork and Bulk Pyrite Concentrate Generation13-36 13.1.11.3 Pyrite Oxidation and Cobalt Leaching Testwork ................................. 13-38
13.1.11.3.1 Albion Process ........................................................................................ 13-39 13.1.11.3.2 BiOX Testing ............................................................................................ 13-39 13.1.11.3.3 POX Testing ............................................................................................. 13-40 13.1.11.3.4 Roasting and Calcine Leaching Testing ........................................ 13-41
13.1.11.4 Solution Purification Testwork ................................................................... 13-42 13.1.11.5 Solvent Extraction Circuit Conceptual Design Work ......................... 13-43
13.2 Recovery Estimates ........................................................................................................................... 13-43 13.2.1 Copper ................................................................................................................................... 13-43 13.2.2 Gold ........................................................................................................................................ 13-45 13.2.3 Iron .......................................................................................................................................... 13-47 13.2.4 Cobalt..................................................................................................................................... 13-49
13.3 Metallurgical Variability ................................................................................................................... 13-49 13.3.1 Copper, Iron and Gold .................................................................................................... 13-49 13.3.2 Cobalt..................................................................................................................................... 13-49
13.4 Deleterious Elements ........................................................................................................................ 13-50 13.4.1 Copper Concentrate ......................................................................................................... 13-50 13.4.2 Iron Concentrate................................................................................................................ 13-51 13.4.3 Cobalt Sulphate Heptahydrate .................................................................................... 13-53
13.5 Comments on Section 13 ............................................................................................................... 13-54 13.5.1 Copper, Gold and Iron .................................................................................................... 13-54 13.5.2 Cobalt..................................................................................................................................... 13-55
14.0 MINERAL RESOURCE ESTIMATES .................................................................................................................. 14-1 14.1 Introduction and Background ......................................................................................................... 14-1 14.2 Geological Models ............................................................................................................................... 14-2
14.2.1 Santo Domingo Sur, Iris and Iris Norte Wireframes .............................................. 14-2 14.2.2 Estrellita Wireframes .......................................................................................................... 14-3 14.2.3 Oxide Model .......................................................................................................................... 14-3 14.2.4 Santo Domingo Sur ............................................................................................................ 14-4 14.2.5 Iris .............................................................................................................................................. 14-4 14.2.6 Iris Norte ................................................................................................................................. 14-4 14.2.7 Estrellita ................................................................................................................................... 14-4
14.3 Grade Capping/Outlier Restrictions ............................................................................................. 14-5 14.3.1 Santo Domingo Sur, Iris and Iris Norte ...................................................................... 14-5

Santo Domingo Project Region III, Chile
NI 43-101 Technical Report
TOC vii
March 2020 Project Number: C40029
14.3.2 Estrellita ................................................................................................................................... 14-7 14.4 Composites ............................................................................................................................................ 14-7
14.4.1 Santo Domingo Sur, Iris and Iris Norte ...................................................................... 14-7 14.4.2 Estrellita ................................................................................................................................... 14-8
14.5 Variography ............................................................................................................................................ 14-8 14.5.1 Santo Domingo Sur, Iris and Iris Norte ...................................................................... 14-8 14.5.2 Estrellita ................................................................................................................................. 14-10
14.6 Estimation/Interpolation Methods .............................................................................................. 14-10 14.6.1 Model Dimensions ............................................................................................................ 14-10
14.6.1.1 Santo Domingo Sur, Iris and Iris Norte ........................................................... 14-10 14.6.1.2 Estrellita ....................................................................................................................... 14-11
14.6.2 Interpolation ....................................................................................................................... 14-11 14.6.2.1 Santo Domingo Sur, Iris and Iris Norte ........................................................... 14-11 14.6.2.2 Estrellita ....................................................................................................................... 14-12
14.7 Specific Gravity ................................................................................................................................... 14-13 14.7.1 Santo Domingo Sur, Iris and Iris Norte .................................................................... 14-13 14.7.2 Estrellita ................................................................................................................................. 14-13
14.8 Block Model Validation ................................................................................................................... 14-13 14.8.1 Santo Domingo Sur, Iris and Iris Norte .................................................................... 14-13 14.8.2 Estrellita ................................................................................................................................. 14-13
14.9 Classification of Mineral Resources ............................................................................................ 14-14 14.9.1 Santo Domingo Sur, Iris and Iris Norte .................................................................... 14-14 14.9.2 Estrellita ................................................................................................................................. 14-14
14.10 Reasonable Prospects of Economic Extraction ...................................................................... 14-15 14.11 Cut-off Grades .................................................................................................................................... 14-17
14.11.1 Santo Domingo Sur, Iris and Iris Norte .................................................................... 14-17 14.11.2 Estrellita ................................................................................................................................. 14-18
14.12 Mineral Resource Statement ......................................................................................................... 14-18 14.13 Factors That May Affect the Mineral Resource Estimate ................................................... 14-18
15.0 MINERAL RESERVE ESTIMATES ....................................................................................................................... 15-1 15.1 Block Model ........................................................................................................................................... 15-1 15.2 Throughput Rate and Supporting Assumptions ..................................................................... 15-1
15.2.1 Geotechnical Considerations .......................................................................................... 15-3 15.2.2 Dilution and Mine Losses ................................................................................................. 15-4 15.2.3 Cut-Off Grades ..................................................................................................................... 15-6
15.3 Mineral Reserves Statement ............................................................................................................ 15-6 15.4 Factors That May Affect the Mineral Reserve Estimate ........................................................ 15-6
16.0 MINING METHODS .............................................................................................................................................. 16-1 16.1 Pit Designs .............................................................................................................................................. 16-1 16.2 Pit Phases ................................................................................................................................................ 16-4 16.3 Production Schedule .......................................................................................................................... 16-4 16.4 Blasting and Explosives ..................................................................................................................... 16-9 16.5 Mining Equipment ............................................................................................................................... 16-9

Santo Domingo Project Region III, Chile
NI 43-101 Technical Report
TOC viii
March 2020 Project Number: C40029
16.6 Mine Rotation Schedule .................................................................................................................. 16-15 17.0 RECOVERY METHODS ........................................................................................................................................ 17-1
17.1 Process Flowsheet ............................................................................................................................... 17-1 17.1.1 Coarse Ore Handling and Crushing ............................................................................. 17-1 17.1.2 Grinding and Classification ............................................................................................. 17-1 17.1.3 Copper Flotation ................................................................................................................. 17-3 17.1.4 Copper Thickening ............................................................................................................. 17-3 17.1.5 Copper Filtration and Load Out .................................................................................... 17-3 17.1.6 Magnetic Separation .......................................................................................................... 17-4
17.1.6.1 Rougher Magnetic Separation and Regrinding .............................................. 17-4 17.1.6.2 Cleaner Magnetic Separation................................................................................. 17-4
17.1.7 Magnetite Thickening........................................................................................................ 17-5 17.1.8 Lime and Reagent Preparation Plants ......................................................................... 17-5 17.1.9 Grinding Media .................................................................................................................... 17-6 17.1.10 Tailings Thickening ............................................................................................................. 17-6 17.1.11 Plant Desalinated Water Distribution .......................................................................... 17-6 17.1.12 Plant Auxiliary Facilities ..................................................................................................... 17-7 17.1.13 Port ........................................................................................................................................... 17-7
17.1.13.1 Copper Concentrate .......................................................................................... 17-7 17.1.13.2 Magnetite Concentrate .................................................................................... 17-8
17.1.14 Water Supply Facilities ...................................................................................................... 17-9 17.1.15 Port Auxiliary Facilities ...................................................................................................... 17-9
17.1.15.1 Plant Air .................................................................................................................. 17-9 17.1.15.2 Dust Control ......................................................................................................... 17-9
17.2 Plant Design ......................................................................................................................................... 17-10 17.2.1 Design Criteria .................................................................................................................... 17-10 17.2.2 Mineral Classification ....................................................................................................... 17-10
17.3 Production Plan .................................................................................................................................. 17-14 17.4 Energy, Water and Process Materials Requirements ........................................................... 17-14 17.5 Comments on Section 17 ............................................................................................................... 17-17
18.0 INFRASTRUCTURE ................................................................................................................................................ 18-1 18.1 Introduction ........................................................................................................................................... 18-1 18.2 Roads and Logistics ............................................................................................................................ 18-4
18.2.1 Access ...................................................................................................................................... 18-4 18.2.2 On-Site Access ..................................................................................................................... 18-4 18.2.3 Copper Concentrate Haulage Study ............................................................................ 18-4 18.2.4 Pipeline Route Studies ...................................................................................................... 18-7
18.3 Waste Rock Storage Facilities ......................................................................................................... 18-7 18.4 Stockpiles ................................................................................................................................................ 18-9 18.5 Water Management ............................................................................................................................ 18-9
18.5.1 Hydrology .............................................................................................................................. 18-9 18.5.2 Water Requirements ........................................................................................................ 18-10
18.6 Magnetite Concentrate Pipeline .................................................................................................. 18-10
Santo Domingo Project Region III, Chile
NI 43-101 Technical Report
TOC ix
March 2020 Project Number: C40029
18.7 Building Infrastructure ..................................................................................................................... 18-11 18.8 Port .......................................................................................................................................................... 18-12 18.9 Power and Electrical .......................................................................................................................... 18-13
19.0 MARKET STUDIES AND CONTRACTS ........................................................................................................... 19-1 19.1 Market Capabilities ............................................................................................................................. 19-1 19.2 Copper Concentrate Market ............................................................................................................ 19-1
19.2.1 Supply ...................................................................................................................................... 19-2 19.2.2 Demand .................................................................................................................................. 19-3 19.2.3 Supply/Demand Gap ......................................................................................................... 19-3 19.2.4 Price Projections .................................................................................................................. 19-4 19.2.5 Treatment and Refining Charges .................................................................................. 19-6
19.3 Copper Concentrate ........................................................................................................................... 19-7 19.3.1 Santo Domingo Likely Product Specifications ......................................................... 19-7 19.3.2 Deleterious Elements and Penalties in Copper Concentrates ........................... 19-7 19.3.3 Marketing Strategy ............................................................................................................. 19-9 19.3.4 Concentrate Marketing Assessment .......................................................................... 19-10 19.3.5 Logistics ................................................................................................................................ 19-11
19.4 Iron Concentrate ................................................................................................................................ 19-12 19.4.1 Iron Ore Market ................................................................................................................. 19-13 19.4.2 Pellet and Pellet Feed Supply and Demand Summary ....................................... 19-14 19.4.3 Pricing of High-Grade Iron Ore Fines (>65% Fe) ................................................. 19-14 19.4.4 Logistics ................................................................................................................................ 19-16 19.4.5 Iron Ore Freight Rates ..................................................................................................... 19-17 19.4.6 Santo Domingo Iron Ore Concentrate - Specifications ..................................... 19-18 19.4.7 Deleterious Elements and Penalties in Iron Concentrates ................................ 19-18
19.5 Contracts ............................................................................................................................................... 19-19 19.6 Comments on Section 19 ............................................................................................................... 19-20
20.0 ENVIRONMENTAL STUDIES, PERMITTING AND SOCIAL OR COMMUNITY IMPACT ................ 20-1 20.1 Baseline Studies .................................................................................................................................... 20-1 20.2 Permitting ............................................................................................................................................... 20-2 20.3 Closure Considerations ...................................................................................................................... 20-5 20.4 Proposed Tailings Storage Facility ................................................................................................ 20-6
20.4.1 Main Embankment and Saddle Dam .......................................................................... 20-8 20.4.1.1 Description .................................................................................................................... 20-8 20.4.1.2 Seismic Setting ............................................................................................................. 20-8
20.4.2 Stability Analyses ................................................................................................................. 20-9 20.4.3 Water Management ........................................................................................................... 20-9
20.4.3.1 Water Balance .............................................................................................................. 20-9 20.4.3.2 Probable Maximum Precipitation ...................................................................... 20-10 20.4.3.3 Seepage ....................................................................................................................... 20-11 20.4.3.4 Surface Run-off Considerations ......................................................................... 20-11 20.4.3.5 Spillway ........................................................................................................................ 20-12
20.4.4 Thickened Tailings Distribution ................................................................................... 20-12
Santo Domingo Project Region III, Chile
NI 43-101 Technical Report
TOC x
March 2020 Project Number: C40029
20.4.5 Water Recovery and Transport System .................................................................... 20-13 20.4.6 Monitoring ........................................................................................................................... 20-14 20.4.7 Closure Considerations ................................................................................................... 20-14 20.4.8 Risk Evaluation ................................................................................................................... 20-14
20.5 Considerations of Social and Community Impacts .............................................................. 20-15 20.6 Comment on Section 20 ................................................................................................................. 20-17
21.0 CAPITAL AND OPERATING COSTS ................................................................................................................ 21-1 21.1 Capital Cost Estimate ......................................................................................................................... 21-1
21.1.1 Basis of Estimate .................................................................................................................. 21-1 21.1.2 Mine Capital Costs .............................................................................................................. 21-1 21.1.3 Process Capital Costs ......................................................................................................... 21-2 21.1.4 Tailings Storage Facility .................................................................................................... 21-2 21.1.5 Infrastructure Capital Costs ............................................................................................. 21-3 21.1.6 Concentrate Pipeline .......................................................................................................... 21-3 21.1.7 Port Facility ............................................................................................................................ 21-4 21.1.8 Indirect Costs ........................................................................................................................ 21-5 21.1.9 Owner Costs .......................................................................................................................... 21-6 21.1.10 Contingency .......................................................................................................................... 21-6 21.1.11 Taxation Considerations ................................................................................................... 21-7 21.1.12 Initial Capital Cost Estimate ............................................................................................ 21-7 21.1.13 Sustaining Capital Cost Estimate .................................................................................. 21-7
21.2 Operating Costs .................................................................................................................................... 21-8 21.2.1 Mining Costs ......................................................................................................................... 21-9 21.2.2 Process Costs ........................................................................................................................ 21-9 21.2.3 Labour .................................................................................................................................... 21-11 21.2.4 Power ..................................................................................................................................... 21-13 21.2.5 Reagents and Consumables ......................................................................................... 21-14 21.2.6 Other Costs .......................................................................................................................... 21-15 21.2.7 Summary of Operating Cost Estimate ...................................................................... 21-15 21.2.8 Comment on Section 21................................................................................................. 21-16
22.0 ECONOMIC ANALYSIS ........................................................................................................................................ 22-1 22.1 Cautionary Statement ........................................................................................................................ 22-1 22.2 Methodology Used ............................................................................................................................. 22-1 22.3 Financial Model Parameters ............................................................................................................ 22-2 22.4 Taxation Considerations .................................................................................................................... 22-5 22.5 Financing Considerations ................................................................................................................. 22-6 22.6 Results of the Economic Analysis .................................................................................................. 22-6 22.7 Sensitivity Analysis ............................................................................................................................ 22-13 22.8 Comments on Section 22 ............................................................................................................... 22-15
23.0 ADJACENT PROPERTIES ..................................................................................................................................... 23-1 24.0 OTHER RELEVANT DATA AND INFORMATION ........................................................................................ 24-1
24.1 Introduction to 2020 PEA ................................................................................................................. 24-1

Santo Domingo Project Region III, Chile
NI 43-101 Technical Report
TOC xi
March 2020 Project Number: C40029
24.2 Mineral Reserve Estimates Note in Relation to 2020 PEA ................................................... 24-1 24.3 2020 PEA Mining Methods .............................................................................................................. 24-1
24.3.1 Subset of Mineral Resources within the 2020 PEA Mine Plan ........................... 24-1 24.3.2 Pit Design Considerations ................................................................................................ 24-2 24.3.3 Production Plan ................................................................................................................... 24-5 24.3.4 Mining Equipment .............................................................................................................. 24-9
24.4 2020 PEA Recovery Methods ........................................................................................................ 24-11 24.4.1 Process Selection ............................................................................................................... 24-11 24.4.2 Proposed Flowsheet ......................................................................................................... 24-12 24.4.3 Process Design ................................................................................................................... 24-12 24.4.4 Process Production Plan ................................................................................................. 24-23
24.4.4.1 Copper and Iron ....................................................................................................... 24-23 24.4.4.2 Cobalt ........................................................................................................................... 24-24
24.4.5 Energy, Water and Process Materials Requirements .......................................... 24-25 24.5 2020 PEA Infrastructure ................................................................................................................... 24-27
24.5.1 Introduction ......................................................................................................................... 24-27 24.5.2 Access .................................................................................................................................... 24-30 24.5.3 Waste Rock Storage Facilities ...................................................................................... 24-32 24.5.4 Stockpiles ............................................................................................................................. 24-33 24.5.5 Water Management ......................................................................................................... 24-33 24.5.6 Magnetite Concentrate Pipeline ................................................................................. 24-34 24.5.7 Pyrite Pond .......................................................................................................................... 24-34 24.5.8 Building Infrastructure .................................................................................................... 24-34 24.5.9 Port ......................................................................................................................................... 24-35
24.5.9.1 Copper Concentrate ............................................................................................... 24-36 24.5.9.2 Magnetite Concentrate ......................................................................................... 24-36 24.5.9.3 Cobalt Sulphate ........................................................................................................ 24-36 24.5.9.4 Auxiliary Facilities ..................................................................................................... 24-36
24.5.10 Power and Electrical ......................................................................................................... 24-36 24.6 2020 PEA Market Studies and Contracts .................................................................................. 24-37
24.6.1 Capstone Market Capabilities ...................................................................................... 24-37 24.6.2 Copper Concentrate Market ......................................................................................... 24-37
24.6.2.1 Current Market.......................................................................................................... 24-37 24.6.2.2 Supply ........................................................................................................................... 24-38 24.6.2.3 Demand ....................................................................................................................... 24-38 24.6.2.4 Price Projections ....................................................................................................... 24-39 24.6.2.5 Treatment and Refining Charges ....................................................................... 24-39 24.6.2.6 Forecast Copper Concentrate Product ............................................................ 24-40 24.6.2.7 Copper Marketing Strategy ................................................................................. 24-40 24.6.2.8 Logistics ....................................................................................................................... 24-43
24.6.3 Iron Concentrate................................................................................................................ 24-43 24.6.3.1 Market Input .............................................................................................................. 24-43 24.6.3.2 Supply/Demand ....................................................................................................... 24-44 24.6.3.3 Pricing of High-Grade Iron Ore Fines (>65% Fe) ........................................ 24-44

Santo Domingo Project Region III, Chile
NI 43-101 Technical Report
TOC xii
March 2020 Project Number: C40029
24.6.3.4 Logistics ....................................................................................................................... 24-45 24.6.3.5 Freight Rates .............................................................................................................. 24-45 24.6.3.6 Forecast Iron Concentrate Specifications ....................................................... 24-46
24.6.4 Cobalt..................................................................................................................................... 24-47 24.6.4.1 Cobalt Sulphate ........................................................................................................ 24-47 24.6.4.2 Copper ......................................................................................................................... 24-48 24.6.4.3 Sulphuric Acid ........................................................................................................... 24-48 24.6.4.4 Electricity ..................................................................................................................... 24-48
24.6.5 Contracts .............................................................................................................................. 24-48 24.6.6 Comments on Section 24.6 ........................................................................................... 24-49
24.7 2020 PEA Environmental Studies, Permitting and Social or Community Impact ..... 24-50 24.7.1 Baseline Studies ................................................................................................................. 24-50 24.7.2 Permitting............................................................................................................................. 24-51
24.7.2.1 Overview ...................................................................................................................... 24-51 24.7.2.2 Proposed Cobalt Circuit EIA/DIA ....................................................................... 24-51 24.7.2.3 Sectorial Permits ...................................................................................................... 24-54 24.7.2.4 Permit Risks ................................................................................................................ 24-55
24.7.3 Closure Planning ............................................................................................................... 24-55 24.7.4 Proposed Tailings Storage Facility ............................................................................. 24-56 24.7.5 Considerations of Social and Community Impacts .............................................. 24-56
24.8 2020 PEA Capital and Operating Costs ..................................................................................... 24-58 24.8.1 Capital Cost Estimate ....................................................................................................... 24-58
24.8.1.1 Introduction ............................................................................................................... 24-58 24.8.1.2 Mining Costs .............................................................................................................. 24-58 24.8.1.3 Process Costs ............................................................................................................. 24-58 24.8.1.4 Tailings Storage Facility ......................................................................................... 24-60
24.8.2 Infrastructure Capital Costs ........................................................................................... 24-60 24.8.2.1 Concentrate Pipeline .............................................................................................. 24-60 24.8.2.2 Port Facility ................................................................................................................. 24-60 24.8.2.3 Indirect Costs ............................................................................................................. 24-60 24.8.2.4 Owner Costs ............................................................................................................... 24-61 24.8.2.5 Contingency ............................................................................................................... 24-61 24.8.2.6 Taxation Considerations ........................................................................................ 24-61 24.8.2.7 2020 PEA Capital Cost Estimate Summary .................................................... 24-61 24.8.2.8 Cobalt Plant Subset of Capital Cost Estimate in 2020 PEA ..................... 24-63
24.8.3 Operating Costs ................................................................................................................. 24-63 24.8.3.1 Introduction ............................................................................................................... 24-63 24.8.3.2 Mining Costs .............................................................................................................. 24-64 24.8.3.3 Process Costs ............................................................................................................. 24-64 24.8.3.4 Labour .......................................................................................................................... 24-64 24.8.3.5 Power ............................................................................................................................ 24-64 24.8.3.6 Reagents and Consumables ................................................................................ 24-64 24.8.3.7 Other Costs ................................................................................................................ 24-65 24.8.3.8 2020 PEA Operating Cost Estimate Summary .............................................. 24-65
Santo Domingo Project Region III, Chile
NI 43-101 Technical Report
TOC xiii
March 2020 Project Number: C40029
24.8.3.9 Cobalt Plant Subset of 2020 PEA Operating Cost Estimate .................... 24-66 24.8.4 Comment on Section 24.8 ............................................................................................. 24-67
24.9 2020 PEA Economic Analysis ......................................................................................................... 24-67 24.9.1 Caution Statement ............................................................................................................ 24-67 24.9.2 Methodology Used ........................................................................................................... 24-68 24.9.3 Financial Model Parameters .......................................................................................... 24-68 24.9.4 Taxation Considerations ................................................................................................. 24-72 24.9.5 Financing Considerations ............................................................................................... 24-73 24.9.6 Results of the Economic Analysis ............................................................................... 24-73 24.9.7 Cobalt Plant Subset of 2020 PEA Economic Analysis ......................................... 24-83 24.9.8 Sensitivity Analysis ............................................................................................................ 24-84
24.10 2020 PEA Risks and Opportunities ............................................................................................. 24-86 24.11 2020 PEA Conclusions ...................................................................................................................... 24-87
25.0 INTERPRETATION AND CONCLUSIONS ...................................................................................................... 25-1 25.1 Introduction ........................................................................................................................................... 25-1 25.2 Mineral Tenure, Surface Rights, Water Rights, Royalties and Agreements .................. 25-1 25.3 Geology and Mineralization ............................................................................................................ 25-2 25.4 Exploration, Drilling and Analytical Data Collection in Support of Mineral
Resource Estimation ........................................................................................................................... 25-3 25.5 Metallurgical Testwork ...................................................................................................................... 25-5 25.6 Mineral Resource Estimates ............................................................................................................. 25-6 25.7 Mineral Reserve Estimates ............................................................................................................... 25-7 25.8 Mine Plan ................................................................................................................................................ 25-8 25.9 Recovery Plan ........................................................................................................................................ 25-9 25.10 Infrastructure ....................................................................................................................................... 25-10 25.11 Environmental, Permitting and Social Considerations ........................................................ 25-12 25.12 Markets and Contracts .................................................................................................................... 25-13 25.13 Capital Cost Estimates ..................................................................................................................... 25-14 25.14 Operating Cost Estimates ............................................................................................................... 25-14 25.15 Economic Analysis ............................................................................................................................. 25-14 25.16 Risks and Opportunities .................................................................................................................. 25-15 25.17 Conclusions .......................................................................................................................................... 25-15 25.18 2020 Preliminary Economic Assessment .................................................................................. 25-16
25.18.1 2020 PEA Mine Plan ......................................................................................................... 25-16 25.18.2 2020 PEA Recovery Plan ................................................................................................. 25-16 25.18.3 2020 PEA Infrastructure .................................................................................................. 25-17 25.18.4 2020 PEA Environmental, Permitting and Social Considerations ................... 25-18 25.18.5 2020 PEA Markets and Contracts ............................................................................... 25-19 25.18.6 2020 PEA Capital Cost Estimates ................................................................................ 25-20 25.18.7 2020 PEA Operating Cost Estimates .......................................................................... 25-20 25.18.8 2020 PEA Economic Analysis ........................................................................................ 25-20 25.18.9 2020 PEA Risks and Opportunities ............................................................................. 25-21 25.18.10 2020 PEA Conclusions ............................................................................................. 25-21

Santo Domingo Project Region III, Chile
NI 43-101 Technical Report
TOC xiv
March 2020 Project Number: C40029
26.0 RECOMMENDATIONS ........................................................................................................................................ 26-1 26.1 Introduction ........................................................................................................................................... 26-1 26.2 RPA Recommendations ..................................................................................................................... 26-1 26.3 Knight Piésold Recommendations ................................................................................................ 26-1 26.4 Wood Recommendations ................................................................................................................. 26-3
26.4.1 Metallurgy .............................................................................................................................. 26-3 26.4.2 Environmental and Permitting ....................................................................................... 26-4
26.5 Gregg Bush and MPlan Recommendations .............................................................................. 26-4 26.6 Brass Recommendations ................................................................................................................... 26-6
27.0 REFERENCES ........................................................................................................................................................... 27-1
T A B L E S
Table 1-1: Mineral Resource Estimates (13 February 2020) ............................................................................. 1-18 Table 1-2: Mineral Reserves Statement (14 November 2018) ........................................................................ 1-21 Table 1-3: Initial Capital Cost Estimate .................................................................................................................... 1-34 Table 1-4: Operating Cost Estimate .......................................................................................................................... 1-34 Table 1-5: Summary of Pre-Tax Cash Flow ............................................................................................................. 1-36 Table 1-6: Cash Cost Summary LOM ........................................................................................................................ 1-37 Table 1-7: Subset of Mineral Resource Estimate in 2020 PEA Mine Plan .................................................. 1-41 Table 1-8: 2020 PEA Initial Capital Cost Estimate (by Area) ............................................................................ 1-49 Table 1-9: 2020 PEA Operating Cost Estimate by Area ..................................................................................... 1-50 Table 1-10: 2020 PEA Economic Analysis Forecast ................................................................................................ 1-51 Table 1-11: Cobalt Plant Subset of 2020 PEA Economic Analysis ................................................................... 1-53 Table 4-1: Exploitation Concessions ......................................................................................................................... 4-12 Table 4-2: Exploration Concessions .......................................................................................................................... 4-15 Table 4-3: Provisional Surface Rights Granted to Capstone ............................................................................ 4-17 Table 4-4: Definitive Surface Rights Granted to Capstone .............................................................................. 4-19 Table 4-5: Capstone Surface Rights in the Process of Approval .................................................................... 4-19 Table 6-1: Exploration Summary Table ....................................................................................................................... 6-2 Table 10-1: Drill Summary Table by Hole Purpose ................................................................................................ 10-2 Table 10-2: Drill Summary Table by Drill Hole Type ............................................................................................. 10-2 Table 10-3: Drill Summary Table – Drill Holes Supporting Resource Estimate .......................................... 10-2 Table 11-1: Summary Table, Specific Gravity ........................................................................................................... 11-3 Table 12-1: Summary of Cobalt QA/QC Data .......................................................................................................... 12-8 Table 13-1: Metallurgical Testwork Summary Table ............................................................................................. 13-2 Table 13-2: Head Grades Years 1-5 Composite .................................................................................................... 13-16 Table 13-3: Rougher and Cleaner Optimal Flotation Conditions .................................................................. 13-16 Table 13-4: Results of LCTs on the Years 1-5 Composite ................................................................................. 13-17 Table 13-5: Head Grades for the Yearly Composites for the First 5 Years ................................................. 13-17

Santo Domingo Project Region III, Chile
NI 43-101 Technical Report
TOC xv
March 2020 Project Number: C40029
Table 13-6: Recovery and Grade for LCTs using Yearly Composites for the First 5 Years ................... 13-18 Table 13-7: Mineralogical Composition of the Years 1-5 Composite .......................................................... 13-19 Table 13-8: Mineralogical Composition of the Yearly Composites for the First 5 Years ...................... 13-20 Table 13-9: Head Grades of the 28 Variability Samples .................................................................................... 13-21 Table 13-10: 2019 Sequential Flotation Typical Results ..................................................................................... 13-37 Table 13-11: LCT Cobalt Testing Results .................................................................................................................... 13-38 Table 13-12: POX Concentrate Leach Test Summary .......................................................................................... 13-40 Table 13-13: Concentrate Roast/Leach Test Summary ....................................................................................... 13-42 Table 13-14: Recovery Estimates ................................................................................................................................... 13-49 Table 13-15: Final Concentrate Properties and Capstone Target Specification ......................................... 13-52 Table 13-16: Battery-Grade Cobalt Sulphate Specifications .............................................................................. 13-53 Table 14-1: Assay Capping Levels – Copper ............................................................................................................ 14-6 Table 14-2: Assay Capping Levels – Gold .................................................................................................................. 14-6 Table 14-3: Assay Capping Levels – Cobalt .............................................................................................................. 14-7 Table 14-4: Variogram Models ...................................................................................................................................... 14-9 Table 14-5: Cobalt Variogram Models ..................................................................................................................... 14-10 Table 14-6: LG Optimization Parameters – Santo Domingo ............................................................................ 14-15 Table 14-7: LG Optimization Parameters – Estrellita ........................................................................................... 14-16 Table 14-8: Mineral Resource Estimate .................................................................................................................... 14-19 Table 15-1: LG Optimization Parameters ................................................................................................................... 15-2 Table 15-2: Slope Domain Data .................................................................................................................................... 15-5 Table 15-3: Mineral Reserve Statement ..................................................................................................................... 15-7 Table 16-1: Mine Design Parameters .......................................................................................................................... 16-2 Table 16-2: Mine Production Schedule Summary.................................................................................................. 16-7 Table 16-3: Plant Feed Schedule ................................................................................................................................. 16-10 Table 16-4: Peak Fleet Requirements for Pre-Production and Commercial Production ...................... 16-12 Table 16-5: Fleet Requirements by Year .................................................................................................................. 16-13 Table 17-1: Utilization Rates ......................................................................................................................................... 17-11 Table 17-2: Crushing and Grinding ............................................................................................................................ 17-11 Table 17-3: Copper Circuit ............................................................................................................................................ 17-12 Table 17-4: Magnetite Circuit ....................................................................................................................................... 17-12 Table 17-5: Production Plan ......................................................................................................................................... 17-15 Table 18-1: Mine and Plant Site Buildings .............................................................................................................. 18-12 Table 19-1: Global Copper Supply/Demand and Price Forecast to 2030 ..................................................... 19-5 Table 19-2: Copper Concentrate Specification ....................................................................................................... 19-8 Table 19-3: Price Forecast for Capstone Pellet Feed........................................................................................... 19-17 Table 19-4: Iron Ore Concentrate Specification.................................................................................................... 19-19 Table 20-1: Critical Permits ............................................................................................................................................. 20-3 Table 21-1: Mine Capital Cost Estimate Summary ($ x 1,000) .......................................................................... 21-1 Table 21-2: Process Plant Capital Cost Estimate Summary ................................................................................ 21-2

Santo Domingo Project Region III, Chile
NI 43-101 Technical Report
TOC xvi
March 2020 Project Number: C40029
Table 21-3: TSF Capital Cost Estimate Summary .................................................................................................... 21-3 Table 21-4: Magnetite Concentrate Pipeline Capital Cost Estimate Summary .......................................... 21-4 Table 21-5: Port Capital Cost Estimate Summary .................................................................................................. 21-4 Table 21-6: Indirect Costs Estimate Summary ......................................................................................................... 21-5 Table 21-7: Owner Costs Estimate Summary ........................................................................................................... 21-6 Table 21-8: Initial Capital Cost Estimate (by Area) ................................................................................................. 21-7 Table 21-9: Summary of Sustaining Capital by Year ............................................................................................. 21-8 Table 21-10: Mine Operating Costs ............................................................................................................................... 21-9 Table 21-11: Process Operating Costs – Commodity Summary ......................................................................... 21-9 Table 21-12: Labour Cost Breakdown ......................................................................................................................... 21-12 Table 21-13: Power Consumption and Costs .......................................................................................................... 21-13 Table 21-14: Operating Supplies Estimates .............................................................................................................. 21-15 Table 21-15: Operating Cost Estimate by Area ....................................................................................................... 21-16 Table 22-1: Exchange Rates Used ................................................................................................................................. 22-3 Table 22-2: Total Operating Costs ............................................................................................................................... 22-3 Table 22-3: Smelter Terms ............................................................................................................................................... 22-3 Table 22-4: Copper and Magnetite Concentrate Transport and Insurance Charges ............................... 22-4 Table 22-5: Metal Prices ................................................................................................................................................... 22-5 Table 22-6: Results of the Economic Analysis ......................................................................................................... 22-7 Table 22-7: Summary of Cash Costs First 5 Years .................................................................................................. 22-8 Table 22-8: Summary of Cash Costs - LOM .............................................................................................................. 22-9 Table 22-9: Summary of Cash Flow ........................................................................................................................... 22-10 Table 22-10: Cash Flow on an Annualized Basis .................................................................................................... 22-11 Table 22-11: Sensitivity to Metal Price (base case is highlighted) ................................................................... 22-15 Table 24-1: Subset of Mineral Resource Estimate in 2020 PEA Mine Plan .................................................. 24-2 Table 24-2: Mine Plan Assumptions ............................................................................................................................ 24-2 Table 24-3: 2020 PEA Production Schedule Forecast ........................................................................................... 24-8 Table 24-4: Proposed Peak Fleet Requirements ................................................................................................... 24-10 Table 24-5: Process Description .................................................................................................................................. 24-16 Table 24-6: Process Design Assumptions Cu and Fe Plant .............................................................................. 24-20 Table 24-7: Cobalt Plant Major Equipment ............................................................................................................ 24-22 Table 24-8: Copper, Gold and Iron Production Plan ........................................................................................... 24-24 Table 24-9: Cobalt and Sulphur Production Plan ................................................................................................. 24-26 Table 24-10: Predicted Copper Concentrate Specification ................................................................................. 24-41 Table 24-11: Concentrate Analysis for Years 1-5 Composite ............................................................................. 24-42 Table 24-12: Predicted Iron Concentrate Specification ........................................................................................ 24-46 Table 24-13: Critical Permits ........................................................................................................................................... 24-52 Table 24-14: 2020 PEA Mine Capital Cost Estimate Summary ($M)................................................................ 24-59 Table 24-15: 2020 PEA Process Plant Capital Cost Estimate Summary .......................................................... 24-59 Table 24-16: 2020 PEA Initial Capital Cost Estimate (by area) ........................................................................... 24-61

Santo Domingo Project Region III, Chile
NI 43-101 Technical Report
TOC xvii
March 2020 Project Number: C40029
Table 24-17: 2020 PEA Summary of Sustaining Capital by Year ..................................................................... 24-62 Table 24-18: Cobalt Plant Subset of 2020 PEA Initial Capital Cost Estimate ............................................... 24-63 Table 24-19: 2020 PEA Mine Operating Costs ........................................................................................................ 24-65 Table 24-20: 2020 PEA Process Operating Costs .................................................................................................. 24-65 Table 24-21: 2020 PEA Operating Cost Estimate by Area ................................................................................... 24-66 Table 24-22: Cobalt Plant Subset of 2020 PEA Operating Cost Estimate ..................................................... 24-66 Table 24-23: 2020 PEA Estimated Cash Costs by Process .................................................................................. 24-70 Table 24-24: 2020 PEA Smelter Term Assumptions ............................................................................................. 24-71 Table 24-25: 2020 PEA Concentrate Transport and Insurance Charge Assumptions .............................. 24-71 Table 24-26: 2020 PEA Metal Price Assumptions .................................................................................................. 24-72 Table 24-27: 2020 PEA Economic Analysis Forecast .............................................................................................. 24-74 Table 24-28: Summary of 2020 PEA First 5 Years Cash Costs Forecast, By-Product Basis ..................... 24-75 Table 24-29: Summary of 2020 PEA LOM Cash Costs Forecast, By-Product Basis .................................... 24-76 Table 24-30: Summary of 2020 PEA First 5 Years Cash Costs Forecast, Co-Product Basis .................... 24-77 Table 24-31: Summary of 2020 PEA LOM Cash Costs Forecast, Co-Product Basis ................................... 24-78 Table 24-32: 2020 PEA Cash Flow Forecast Summary .......................................................................................... 24-78 Table 24-33: 2020 PEA Cash Flow Forecast on an Annualized Basis .............................................................. 24-80 Table 24-34: Cobalt Plant Subset of 2020 PEA Economic Analysis ................................................................. 24-83 Table 24-35: Sensitivity of 2020 PEA to Metal Price .............................................................................................. 24-86
F I G U R E S
Figure 1-1: After Tax Cash Flow Summary ............................................................................................................... 1-37 Figure 1-2: Sensitivity of IRR .......................................................................................................................................... 1-38 Figure 1-3: Sensitivity of NPV8% ($ x 1,000) ........................................................................................................... 1-39 Figure 1-4: 2020 PEA After-Tax Cash Flow ............................................................................................................... 1-52 Figure 1-5: After-Tax Cash Flow for Cobalt Project Subset of 2020 PEA ..................................................... 1-54 Figure 1-6: 2020 PEA After-Tax Sensitivity of IRR ................................................................................................. 1-55 Figure 1-7: 2020 PEA After-Tax Sensitivity of NPV8% ($ x 1,000) ................................................................... 1-55 Figure 2-1: Property Location ........................................................................................................................................... 2-2 Figure 4-1: Proposed Facility Locations ..................................................................................................................... 4-11 Figure 4-2: Exploitation Concessions in Relation to Proposed Infrastructure Locations ....................... 4-13 Figure 4-3: Location Plan, Exploitation Concessions ............................................................................................ 4-14 Figure 4-4: Location Plan, Exploration Claims......................................................................................................... 4-16 Figure 7-1: Regional Geology and Fault Structures in the Greater Santo Domingo Property Area ..... 7-2 Figure 7-2: Local Geology Plan Showing Major Intrusive Events ....................................................................... 7-5 Figure 7-3: Deposit and Prospect Layout Plan ....................................................................................................... 7-10 Figure 7-4: Geology and Structure Plan, Santo Domingo Sur .......................................................................... 7-12 Figure 7-5: Santo Domingo Sur Simplified Geology (Cross Section 99600) ............................................... 7-13 Figure 7-6: Geology and Structure Plan, Iris ............................................................................................................ 7-16

Santo Domingo Project Region III, Chile
NI 43-101 Technical Report
TOC xviii
March 2020 Project Number: C40029
Figure 7-7: Iris Simplified Geology (Cross Section 100500) .............................................................................. 7-17 Figure 7-8: Geology Plan, Iris Norte............................................................................................................................ 7-18 Figure 7-9: Iris Norte Simplified Geology ................................................................................................................. 7-19 Figure 7-10: Geology and Structure Plan, Estrellita ................................................................................................ 7-21 Figure 7-11: Estrellita Geological Cross-Section (Section 369300E) ................................................................. 7-22 Figure 10-1: Property Drill Location Plan .................................................................................................................... 10-3 Figure 10-2: Deposit Area Drill Location Plan ........................................................................................................... 10-4 Figure 12-1: Magnetic Susceptibility versus Mass Recovery ............................................................................... 12-7 Figure 13-1: Co vs. Pyrite in Flotation Products ..................................................................................................... 13-36 Figure 13-2: Cobalt to Sulphur Regression for Timed Pyrite Flotation ......................................................... 13-38 Figure 13-3: BiOX Cobalt and Copper Extraction vs. Leach Time .................................................................... 13-39 Figure 13-4: 2018 Copper Recovery Model .............................................................................................................. 13-44 Figure 13-5: 2019 Copper Recovery Model ............................................................................................................. 13-45 Figure 13-6: 2018 Gold Recovery Model ................................................................................................................... 13-46 Figure 13-7: 2019 Gold Recovery Model ................................................................................................................... 13-47 Figure 13-8: Mass Recovery versus Results .............................................................................................................. 13-48 Figure 15-1: Geotechnical Slope Domains ................................................................................................................. 15-5 Figure 16-1: Santo Domingo Pit Layout Plan ............................................................................................................ 16-3 Figure 16-2: Iris Norte Pit Layout Plan ......................................................................................................................... 16-5 Figure 16-3: Mining Phases .............................................................................................................................................. 16-6 Figure 17-1: Process Flowsheet ....................................................................................................................................... 17-2 Figure 17-2: Mine Plan Hematite and Magnetite Distribution ......................................................................... 17-16 Figure 17-3: Mine Plan Feed Grade Distribution .................................................................................................... 17-16 Figure 17-4: Mine Plan Distribution of Concentrate Tonnes ............................................................................. 17-17 Figure 18-1: Location Plan Showing Proposed Pipeline ....................................................................................... 18-2 Figure 18-2: Proposed Mine Site and Plant Layout................................................................................................. 18-3 Figure 18-3: Access Routes from the South ............................................................................................................... 18-5 Figure 18-4: Access Routes from the North ............................................................................................................... 18-6 Figure 18-5: Punta Angamos Port, Mejillones ........................................................................................................... 18-7 Figure 18-6: Final Pit and Waste Rock Facility Configuration ............................................................................. 18-8 Figure 19-1: Copper Market Balance Estimate to 2030 ......................................................................................... 19-5 Figure 19-2: Pellet Supply/Demand Summary (2017–2027) ............................................................................. 19-15 Figure 19-3: Premiums and Discounts for Fe Content ......................................................................................... 19-15 Figure 20-1: Location Plan, Proposed Tailings Storage Facility .......................................................................... 20-7 Figure 20-2: Tailings Deposition Layout Plan (Operating Years 3 to 18) ...................................................... 20-13 Figure 22-1: After Tax Cash Flow Summary ............................................................................................................... 22-8 Figure 22-2: Sensitivity of IRR ........................................................................................................................................ 22-13 Figure 22-3: Sensitivity of NPV8% ($ x 1,000) ......................................................................................................... 22-14 Figure 24-1: Geotechnical Slope Domains ................................................................................................................. 24-4 Figure 24-2: 2020 PEA Pit Layout Plan, Santo Domingo ....................................................................................... 24-6
Santo Domingo Project Region III, Chile
NI 43-101 Technical Report
TOC xix
March 2020 Project Number: C40029
Figure 24-3: 2020 PEA Pit Layout Plan, Iris Norte .................................................................................................... 24-7 Figure 24-4: PEA 2020 Copper Circuit Process Flowsheet .................................................................................. 24-13 Figure 24-5: 2020 PEA Pyrite Production Process Flowsheet ............................................................................ 24-14 Figure 24-6: 2020 PEA Cobalt Recovery Circuit Process Flowsheet ................................................................ 24-15 Figure 24-7: 2020 PEA Location Plan Showing Proposed Pipeline ................................................................. 24-28 Figure 24-8: 2020 PEA Proposed Mine Site and Plant Layout .......................................................................... 24-29 Figure 24-9: 2020 PEA Access Routes from the South ........................................................................................ 24-30 Figure 24-10: 2020 PEA Access Routes from the North ................................................................................. 24-31 Figure 24-11: 2020 PEA Pit and Waste Rock Facility Configuration .......................................................... 24-32 Figure 24-12: 2020 PEA After Tax Cash Flow ...................................................................................................... 24-75 Figure 24-13: After-Tax Cash Flow for Cobalt Circuit Subset of 2020 PEA ............................................. 24-83 Figure 24-14: 2020 PEA After-Tax Sensitivity of IRR ........................................................................................ 24-84 Figure 24-15: 2020 PEA After-Tax Sensitivity of NPV8% ($ x 1,000) ......................................................... 24-85
Santo Domingo Project Region III, Chile
NI 43-101 Technical Report
Page 1-1
March 2020
Project Number: C40029
1.0 SUMMARY
1.1 Introduction and Terms of Reference
Amec Foster Wheeler Ingeniería y Construcción Limitada, a Wood company (Wood) was commissioned by Capstone Mining Corp. (Capstone) to prepare a technical report (the Report) on two alternative development options for the Santo Domingo property (the Property), located in the Atacama Region (Region III) of the Republic of Chile. The firms and consultants who are responsible for the content of this Report are, in alphabetical order, Aminpro Chile SPA (Aminpro), Brass Chile SA (Brass), Gregg Bush, Knight Piésold S.A. (Knight Piésold), MPlan International (MPlan), NCL Ltda (NCL), Roscoe Postle Associates Inc. (RPA), Sunrise Americas LLC (Sunrise Americas) and Wood. The Report is used in support of Capstone’s press release dated 19 February 2020 entitled “Capstone Presents a Robust Cobalt Production Option to the Santo Domingo 2019 Technical Report with a 2020 Preliminary Economic Assessment”. The term “Property” is used in reference to the overall mineral tenure holdings. A technical report on a feasibility study update was issued with an effective date of 26 November 2018, that was filed on 3 January 2019 (referred to as the 2019 Technical Report). The information on the study remains current, and the results are is presented in Sections 1.12 to 1.21 of this summary, and in Sections 15 to 22 of this Report. The study contemplates conventional open pit mining, feeding a conventional process plant to produce copper–gold and iron concentrates. A preliminary economic assessment (PEA) was completed in 2020 (2020 PEA). The 2020 PEA envisages an alternative development option, consisting of conventional open pit mining, production of copper and iron concentrates via a conventional process plant and production of battery-grade cobalt sulphate via roasting. The cobalt plant will produce secondary by-products of electrical power and sulphuric acid. The results of the 2020 PEA are presented in Section 1.24 of this summary, and in Section 24 of this Report. The Santo Domingo property is held 70% by Capstone and 30% by Korea Resources Corporation (Kores). The companies use an operating entity, Minera Santo Domingo SCM (MSD), as the Chilean holding company for the Property.
Santo Domingo Project Region III, Chile
NI 43-101 Technical Report
Page 1-2
March 2020
Project Number: C40029
Units used in the report are metric unless otherwise noted. Unless otherwise noted, all dollar figures used are United States of America (US) dollars ($). The Chilean currency is the Chilean peso (CLP). Mineral Resources and Mineral Reserves are reported in accordance with the Canadian Institute of Mining, Metallurgy and Petroleum (CIM) Definition Standards for Mineral Resources and Mineral Reserves (May 2014; the 2014 CIM Definition Standards). Years discussed in the mine and production plan and the economic analysis supporting this Report, in the mine plan and production plan and in the economic analysis supporting the 2020 PEA are presented for illustrative purposes only, as no decision has been made on mine construction by Capstone.
1.2 Property Setting
The portion of the Santo Domingo area that hosts the Santo Domingo deposits and will host the mine and plant site areas is located approximately 5 km southeast of the town of Diego de Almagro in the province of Diego de Almagro in the Atacama Region of northern Chile. Current access to the planned mine and plant site area where the deposits are located is via the paved Pan-American Highway (Route 5 North) and a network of generally well-maintained paved roads. The deposits are about five hours travel time by road south from Antofagasta and two hours by road north from Copiapó. The Atacama Region has well established infrastructure (roads and electrical transmission systems) and capacity (labour, support services) to serve the mining industry. However, there is currently no infrastructure on the Santo Domingo property, except gravel roads for access to the concessions and drill sites. Highway C-17 highway connecting Diego de Almagro and Copiapó is paved and passes immediately east of the proposed mine–plant site area. The nearby town of Diego de Almagro (population around 15,000) is connected to the regional power grid and can provide some support services for the planned operations. The climate is generally warm, dry and clear in all seasons. The area of the proposed mine site is classified as interior desert, whereas the proposed port location is in a coastal desert regime. Rainfall is low and concentrated in the winter months. Mining activities are expected to be possible on a year-round basis.

Santo Domingo Project Region III, Chile
NI 43-101 Technical Report
Page 1-3
March 2020
Project Number: C40029
Elevations in the mine–plant site area range from approximately 1,000–1,300 masl. Vegetation is very sparse. The area is likely to have high seismicity and the site is considered to be Zone 3 according to the Chilean standard NCh 2.369, with a peak ground acceleration value of 0.4g.
1.3 Mineral Tenure, Surface Rights, Water Rights and Agreements
Wood was provided with information that supports that Minera Santo Domingo, a Capstone subsidiary, is a mining company (Sociedad Contractual Minera or SCM) that is legally organized under the laws of the Republic of Chile. Capstone has advised Wood that under the terms of the shareholders’ agreement signed between Capstone and Kores on 17 June 2011, Capstone is the operator. Capstone holds two groups of concessions with a total of 116 claims, which cover a total of 28,897 ha and includes the areas of the planned mine site, plant area and auxiliary facilities including the port facilities. The tenure consists of 96 exploitation concessions and 20 exploration concessions. All the concessions are held in the name of Minera Santo Domingo. The total concession area is divided as follows: 27,597 ha of exploitation concessions that encompass the area where the mine,
plant, construction and operations camp and ancillary facilities are planned 1,300 ha of exploration concessions that encompass the port area.
Concessions are surveyed as part of the grant process and are protected under Chilean law by payment of the annual mining license fees. Capstone advised Wood that all concession fees were in good standing and were fully paid up to 28 February 2020 and will continue to be paid on a regular basis as due, using a formal status tracking system. Wood was provided with information that supports that the surface land in the Communities of Diego de Almagro, Caldera and Chañaral where Santo Domingo is located is owned by the state and managed and represented by the Ministerio de Bienes Nacionales.

Santo Domingo Project Region III, Chile
NI 43-101 Technical Report
Page 1-4
March 2020
Project Number: C40029
Capstone has developed a legal strategy to obtain the necessary surface rights to cover the planned mine, plant, camps, tailings storage facility, mine waste disposal, pipelines, port and transmission lines. Capstone currently possesses 17 registered provisional surface rights (covering 3,634 ha) and 16 definitive surface rights (covering 3,856.78 ha). Capstone has six applications in progress for definitive surface rights (covering 239.84 ha). Together these easements cover 100% of facilities and infrastructure area. Capstone does not need to file an application for water rights, because desalinated water will be used. A maritime concession has been approved which will allow the extraction of sea water for processing in the desalination plant. Water for construction will be obtained from an authorized third-party provider.
1.4 Geology and Mineralization
The deposits are located within the Cretaceous Iron Belt (CIB) of the Atacama fault zone, a ductile/brittle sinistral strike-slip and dip-slip crustal scale structure that parallels the coast of Chile for over 1,200 km. The CIB is a segment of the Atacama fault zone approximately 630 km by 40 km in dimension that hosts numerous iron oxide–copper–gold (IOCG) type deposits. The Santo Domingo deposits lie on the east side of the Atacama fault complex, which, in this area, consists of numerous clusters of generally north–south structural breaks in a belt approximately 30 km wide. The base of the stratigraphic sequence in the deposit area is interpreted to be Punta del Cobre Formation sedimentary rocks. These rocks grade upwards into an interdigitated contemporaneous sequence of limestone and marine sediments of the Chañarcillo Group and andesitic flows and volcaniclastic rocks of the Bandurrias Group. The upper Punta del Cobre Formation near its contact with the overlying Bandurrias–Chañarcillo Group sequences is the stratigraphic host location of the Candelaria deposit (operated by third parties) approximately 120 km to the south. The geology underlying the Property is divided into a number of structural blocks with different lithological characteristics suggesting that the blocks are part of different stratigraphic levels. Mineralization within the deposit area consists of: Stratiform replacement mantos and breccias within tuffaceous sedimentary rocks
(e.g. Santo Domingo Sur deposit)

Santo Domingo Project Region III, Chile
NI 43-101 Technical Report
Page 1-5
March 2020
Project Number: C40029
Structurally-controlled mineralization along the east–west Santo Domingo fault zone (e.g. Estrellita deposit)
Small, closely-spaced (100 m to 200 m) northwest-trending and moderately to steeply northeast-dipping veins which range in width from a few centimetres to several metres
Minor copper oxide minerals disseminated in amygdales in volcanic flows and encountered as small chalcocite nodules in limestone.
Drilling at 100 m centres or less at the Santo Domingo Sur deposit has outlined a 150 m to 500 m thick copper-bearing, specularite–magnetite manto sequence covering an area of approximately 1,300 m by 800 m. The mantos are zoned from an outer rim of specular hematite toward a magnetite-rich core. The mantos consist of semi-massive to massive specularite and magnetite layers with clots and stringers of chalcopyrite, that range in thickness from approximately 4–20 m. The upper parts of the manto sequence are frequently oxidized and contain various amounts of copper oxides and chalcocite. Drilling below a depth of 350 m is sparse and mineralization below that depth is not well defined at this time. The Iris deposit is a narrow zone (100 m to 250 m wide) of copper-bearing iron mantos and breccias extending over 1,900 m that are hosted by andesitic tuffs and andesitic breccias. The dominating iron oxide at Iris is hematite and the main copper mineral is chalcopyrite. There are some old mine workings at the southern end of the deposit where copper oxides such as brochantite and chrysocolla were mined at surface. Mineralization at Iris Norte is very similar to the Iris deposit; however, part of the mineralization appears to be hosted by andesitic flows. The deposit is approximately 500 m wide and has been tested over a strike length of 1,600 m. The Iris Norte deposit has been intruded by significant amounts of diorite dykes and sills that separate the deposit into two lenses. The main sulphides are pyrite and chalcopyrite, with the latter providing the copper content of the deposit. Drilling at the Estrellita deposit has outlined a tabular body of copper mineralization hosted by breccias and mantos along a fault zone around the Estrellita artisanal mine workings. The east–west extent of the Estrellita deposit along the Santo Domingo fault adds up to more than 1,000 m and the deposit remains open in both directions. The Estrellita deposit has an unquantified oxide component, consisting of chrysocolla,
Santo Domingo Project Region III, Chile
NI 43-101 Technical Report
Page 1-6
March 2020
Project Number: C40029
brochantite and various amorphous copper oxides such as pitch limonite, tenorite and copper wad.
1.5 History
Artisanal mining activities commenced in the general mine and plant site area during the early 19th century. The major commodities targeted were gold and iron. As a result, there are a significant number of small workings and pits throughout the planned mine–plant site area. However, most of the surface workings are typical of artisanal activities, being less than a few tens of metres in length. Modern exploration commenced in 2002. Between 2002 and June 2011 work by Far West Mining Ltd. (Far West) included a regional airborne geophysical survey and interpretation of results, geological mapping, surface and drainage sampling, an induced polarization (IP) survey, core and reverse circulation (RC) drilling and resource estimation. A preliminary assessment was conducted in 2008. Capstone acquired Santo Domingo from Far West in 2011 and completed a pre-feasibility study (2011 pre-feasibility study) in the same year. The 2014 feasibility study was commissioned in 2012 and completed in 2014. In July 2015, the Environmental Impact Assessment (EIA), including the mine, infrastructure, process facilities, development of a greenfields port and iron concentrate and water supply pipelines (as outlined in the 2014 feasibility study), was approved by the Chilean authorities. Capstone drilled 14 twinned diamond holes for a total of 3,206 m, during 2014 and early 2015. The purpose of this drilling was to confirm previous drilling and to collect metallurgical samples. In late 2015 Capstone announced that it would discontinue work on Santo Domingo in response to low copper and iron prices. Capstone continued to maintain the holdings and community relations activities. Updates to the 2014 feasibility study were completed in 2018, resulting in the 2019 Technical Report. A summary of the results of the 2019 Technical Report is included in this Report. In January 2019 Capstone drilled 13 twinned diamond drill holes for a total of 3,747 m, to collect additional material for metallurgical sampling. A PEA was undertaken in 2019–2020 for an alternative development option that includes a cobalt recovery circuit, a summary of the results is included in this Report.
Santo Domingo Project Region III, Chile
NI 43-101 Technical Report
Page 1-7
March 2020
Project Number: C40029
1.6 Drilling and Sampling
Between July 2003 and January 2019, a total of 616 core and RC holes (153,004 m) were drilled over the Santo Domingo area as a whole. Drilling that supports the resource estimate or was used in support of the construction of the geological models, comprises 464 holes (120,168 m). Most drill holes are vertical. Drill cuttings and core were logged using a table of pre-set codes. All geological data were entered digitally into summary logs. Geotechnical data were also recorded. Drill collars were located using a differential global positioning system (GPS) instrument. Downhole surveying was conducted using a combination of gyroscope and accelerometer, with measurements taken every 10 m. RC drill cuttings were collected at 2 m intervals. Core was nominally sampled at 2 m intervals. Samples for assay were marked at 1 m and 2 m intervals by technicians and subsequently adjusted by the geologist to correspond to major lithological contacts. For programs conducted prior to 2011, sample lengths were not less than 0.5 m and most did not exceed 2 m. The shortest and longest sample lengths in 2011–2012 were 0.7 m and 2.7 m, respectively and most samples were 2 m long. The primary analytical laboratory was ALS Chemex and the facilities in La Serena, Chile and Antofagasta, Chile were used. Both of these facilities have ISO 9001:2008 accreditation and La Serena also has ISO 17025 accreditation. Sample preparation consisted of drying, crushing to minus #10 Tyler >70%, homogenizing and then pulverizing to minus #200 Tyler >85%. Samples were analyzed for 27 elements via ALS Chemex procedure ME-ICP61, using inductively coupled plasma (ICP). Gold assays were determined using fire assay with an atomic absorption spectroscopy (AAS) finish. Copper values over 10,000 ppm were re-assayed. Due to the ME-ICP61 method understating the iron content, 7,401 samples from the 2010 drill program were resubmitted for assay using a method with a more aggressive digestion; including all samples over 15% Fe inside the existing block model for which sample material was still available. Soluble copper analysis was conducted on 1,035 samples from 2011–2012 drilling. A total of 19,302 magnetic susceptibility measurements have been recorded. There are 2,229 density measurements performed by Far West personnel on core samples using the water displacement method. RPA developed regression formulae based on the

Santo Domingo Project Region III, Chile
NI 43-101 Technical Report
Page 1-8
March 2020
Project Number: C40029
specific gravity (SG) values reported by Far West to convert volumes to weights, using iron concentration as the independent variable. The quality assurance and quality control (QA/QC) protocols have remained largely consistent throughout all programs conducted by Far West and Capstone. Minor changes have been implemented by Capstone to accommodate issues and recommendations from past programs and to include magnetic susceptibility measurements. Certified reference materials (CRMs), or standards, are inserted every 25th sample, constituting 4% of the total number of samples submitted. Blanks, consisting of common Portland cement, were inserted every 50th sample. Field duplicates are taken every 25th sample. Capstone has undertaken a program to certify some of the CRMs for cobalt. As at the end of February 2020, some analytical work remains to be completed. Preliminary results indicate that there are no concerns with cobalt assays. RPA considers that the drilling has been conducted in a manner consistent with standard industry practices. The spacing and orientation of the holes are appropriate for the deposit geometry and mineralization style. Sampling methods are acceptable, meet industry-standard practice, are appropriate for the mineralization style and are acceptable for Mineral Resource estimation. The quality of the analytical data is reliable and analysis and security are generally performed in accordance with exploration best practices and industry standards.
1.7 Data Verification
Regular data verification programs have been undertaken by third-party consultants, including RPA, from 2005 to 2019 on the data collected in support of technical reports on the Property. RPA considers that as a result of this work, the data verification findings acceptably support the geological interpretations and the database quality and therefore support the use of the data in Mineral Resource estimation.
1.8 Metallurgical Testwork
1.8.1 Overview
Metallurgical testwork has been undertaken from 2006 to 2019.

Santo Domingo Project Region III, Chile
NI 43-101 Technical Report
Page 1-9
March 2020
Project Number: C40029
Two separate physical characterization testwork programs, including semi-autogenous grind (SAG) mill competency (SMC) testwork campaigns, were conducted in order to confirm the throughput rate of the comminution circuit. The complete data set tested was spatially and lithologically representative of the first 3 years of mining. As a result of variability testing of Hematite and Magnetite composite ore types and the dominant proportion of magnetic iron (magnetite), it was decided to modify the comminution flowsheet from a semi-autogenous, ball mill, crushing (SABC) circuit that was used in the 2011 pre-feasibility study to a direct semi-autogenous, ball mill (DSAG) for the 2014 feasibility study. The decision to remove pebble crushing from the design was due to the operational and maintenance complexity of managing the detection and removal of tramp metal from the SAG mill discharge pebble stream. An estimated throughput rate of 65,000 t/d (first 5 years) (design capacity) and 60,000 t/d (nominal capacity) for the remaining life-of-mine (LOM) was determined. In order to support the decision to use desalinated water (not sea water) testwork was carried out using desalinated water. This included rougher and cleaner kinetic tests for modelling the flotation circuit and development of a recovery algorithm for Cu and Au with desalinated water.
1.8.2 Copper and Gold
In the testing program completed in 2012, SGS Santiago carried out 51 rougher kinetic tests and 15 open circuit flotation tests. The open circuit tests used sea water and sodium cyanide depression to understand the variability in flotation response associated with the process plant feed. Sample results which were low in total sulphur content, had a significant proportion of soluble copper present, or were classified as being in a waste zone of the pit (23 of the 51 samples) were not considered in the final process evaluation. A subsequent flotation testing program by SGS Santiago was conducted in 2014. The program objectives were to understand the impact on ultimate copper recovery and copper flotation kinetics using sea water and sodium metabisulphite (SMBS) as a pyrite depressant (replacing sodium cyanide). Testing was completed on composite samples in order to confirm the optimal process flowsheet and conditions. The composite samples testwork was followed by open cycle tests (OCT) and locked cycle tests (LCT). A pilot plant was operated in 2015 to produce concentrate for testwork and to verify design criteria. Composites were prepared from drill core from the 2014–2015 drill

Santo Domingo Project Region III, Chile
NI 43-101 Technical Report
Page 1-10
March 2020
Project Number: C40029
program to represent each of the first 5 years of operation and a combined composite. The pilot plant used sea water and the flowsheet for copper and iron was the flowsheet current at the time. Samples of copper concentrate, iron concentrate and tailings resulting from the pilot plant operation were sent to equipment manufacturers for testing. The aim of the testing was to determine the filtration, settling and rheology parameters for the slurries. Based on the decision to use desalinated water in the process, copper flotation testwork was carried out in 2018 by Aminpro to develop recovery algorithms for copper and gold based on the copper head grade. The 2018 Technical Report used the copper feed grade to predict the recovery in the deposit using the results from Aminpro 2018 metallurgical testwork. The equations derived are: Copper Global Cu Recovery = 0.98 * 96.9018*(Feed, % Cu) 0.0199 The factors included in the model represent the following:
o 0.98 = copper cleaning recovery factor (more studies were carried out with additional samples to improve the confidence in this value)
o 96.9018 and 0.0199 = optimized constants of the potential equation. Gold Global Au Recovery = 0.85 * 82.646*(Feed, % Cu) 0.1611 The factors included in the model represent the following:
o 0.85 = gold cleaning recovery factor (more studies were carried out with additional samples to improve the confidence in this value)
o 82.646 and 0.1611 = optimized constants of the potential equation. These equations were used to calculate copper and gold recovery for the production plan in Section 17.3 and for the economic analysis in Section 22. Additional flotation testwork was carried out by Aminpro in 2019 to produce a gold recovery algorithm based on the gold head grade and to provide more confidence in the copper recovery algorithm . The copper head grade was used to predict the copper

Santo Domingo Project Region III, Chile
NI 43-101 Technical Report
Page 1-11
March 2020
Project Number: C40029
recoveries and the gold head grade was used to predict the gold recoveries using the following recovery algorithms: Copper
The letters and factors included in the model represent the following:
R = Global Cu recovery (%) L = Feed grade (% Cu) C1, C2 = Optimized constants in the equation C1 = 94.63 C2 = 275.86
Gold
The letters and factors included in the model represent the following: R = Global Au recovery (%) L = Feed grade (g/t Au) C1, C2 = Optimized constants in the equation C1 = 91.52 C2 = 64.57
These equations were used to calculate the copper and gold recovery for the production plan in Section 24.4.4 and for the economic analysis in Section 24.4. At the end of February 2020, pilot plant testwork for the magnetic separation circuit to produce iron concentrate was still in progress. Deleterious elements may include strongly oxidised material near the deposit surface. Soluble copper content levels are variable within the deposit, reflecting different copper minerals. Blocks with soluble copper content above 10% are classified as waste within the mine plan or fall with in a faulted area and will not be sent to the plant.
Santo Domingo Project Region III, Chile
NI 43-101 Technical Report
Page 1-12
March 2020
Project Number: C40029
Clay content may increase near faults. Capstone plans to manage this by grade control measures and in-pit mapping. A review of the analyses of the copper concentrate generated from the Years 1-5 composite in the 2019 Aminpro testwork indicated that arsenic values were low, the silica level is acceptable and heavy minerals such as bismuth, antimony and cadmium are low. In the QP’s opinion, the levels of deleterious elements in the copper concentrate are such that no penalties are likely to be levied.
1.8.3 Iron
Testwork was conducted by three laboratories, ALS Chemex, Studien-Gesellschaft für Eisenerz-Aufbereitung (SGA) and Compañía Minera del Pacifico (CMP) in 2009. In 2010 and 2011, Davis Tube tests (DT) and low intensity magnetic separation (LIMS) tests were used to determine the recovery of magnetite from the primary copper flotation tailings stream. The results obtained from LIMS testing were used as the basis for the design of the recovery of magnetic iron in both the primary magnetic separation step and the subsequent magnetic separator cleaning stages. Confirmatory DT programs were completed at ALS and CMP using variability samples in 2011 and 2012. Additional DT and LIMS testing was completed by ALS in 2014. This latest testwork was used to confirm the feed regrind size (P80 of 40 µm) for the first, second and third magnetic separator cleaner stages; and to augment the 2011 pre-feasibility study data for the magnetic iron mass recovery to final concentrate relationship. The testwork also provided support for the iron concentrate grades and associated elements. Using the composite and variability sample testwork results, an algorithm was developed relating magnetic susceptibility values to iron mass recovery. Under the magnetic susceptibility assumptions, the Hematite composite was classified as having magnetic susceptibility values of between 2,000 and 8,000 and Magnetite was classified as having magnetic susceptibility values of greater than 8,000. If the magnetic susceptibility is ≥2,000, the algorithm is: Mass Recovery of Fe = 0.0011 x (MagSus) – 3E-09 x (MagSus)2 If the magnetic susceptibility is <2,000, then the mass recovery is measured as zero. Concentrate quality variability LIMS testwork completed during the 2011 pre-feasibility study and 2014 feasibility study programs indicated an average magnetic iron content
Santo Domingo Project Region III, Chile
NI 43-101 Technical Report
Page 1-13
March 2020
Project Number: C40029
exceeding 65% Fe in the magnetite concentrate. This average value of 65% Fe was used with the mass recovery algorithm to determine the total tonnes of magnetite concentrate. Magnetite settling testwork was performed by Outotec and Delkor in 2012 using bench-scale dynamic thickening equipment. The results of the testwork indicated a magnetite concentrate process design settling rate of 0.678 t/hr/m2. Magnetite concentrate filtration testwork was completed by Outotec in two separate programs in 2011 and 2012. The objective of these tests was to determine the filtration design parameters using ceramic rotary filters. This testwork resulted in a final filter cake moisture content of 8% w/w. Based on the test results, a filtration rate of 1,300 kg/m2/hr was used for the process design. Final tailings samples were tested by Outotec and Delkor in 2012 and 2013 to evaluate the settling behaviour of the tailings and provide thickener design parameters. Based on the results of these tests and associated rheological characterization, a trade-off study was conducted to evaluate capital and operating costs for different thickener configurations. It was determined that two stages of thickening in series will be the most effective to achieve the desired tailings density. The first stage of thickening will be completed at the process plant with a high rate thickener designed for an underflow density of 55% solids w/w at a settling rate of 0.65 t/hr/m2. The second thickening stage will be located at the tailings storage facility (TSF) using two high-density thickeners. The second stage thickening design settling rate will be 0.5 t/hr/m2 at an underflow density of 67% solids w/w. A pilot plant was operated in 2015 using a composite designed to represent the first 5 years of operation. The plant was operated using sea water and the flowsheet current at the time. Concentrate from the pilot plant operation was tested by FLSmidth and Outotec to determine filtration and thickening characteristics. Adjustments were made to the LIMS circuit in the pilot plant operation in order to maintain a high iron grade and low silica content. The testwork indicated that further improvement may be possible without reducing the P80 grind size. A clear relationship was demonstrated between managing iron grade and the level of silica contamination. Further testwork is recommended.

Santo Domingo Project Region III, Chile
NI 43-101 Technical Report
Page 1-14
March 2020
Project Number: C40029
The majority of iron concentrate samples produced from the DT tests returned elemental grade values within target specification and indicate that a marketable iron concentrate can be produced. Treatment of the ANDE ore types in high proportions in the mill feed could potentially lead to the production of concentrates containing low iron and high silica contents, due to the inability to separate magnetite from silica. There is a risk that a portion of the ANDE material designated as plant feed will be designated as waste. In order to quantify this potential impact on concentrate marketability, additional targeted variability testwork is recommended to better understand magnetite concentrate variations in specific ANDE lithology zones. Additional testwork was completed at SGS Santiago in 2019 to confirm design criteria using LIMS using rougher flotation tailings from the program completed at Aminpro in 2019, using the Years 1-5 composite sample and desalinated water. In all cases the final iron concentrate grade was >65% Fe and impurities (such as silica and others) were close to Capstone’s target. The circuit was confirmed as per the current design.
1.8.4 Cobalt
Cobalt testwork was initially performed at Blue Coast Metallurgy Ltd. (Blue Coast) during 2018. Programs included flotation separation tests and evaluation of pyrite concentrate and scavenger tailing particles. During 2019, more detailed test programs were conducted at Kingston Process Metallurgy (KPM) and SGS Lakefield to develop an oxidation and purification process to produce cobalt sulphate heptahydrate and copper sulphide precipitate as final products. In 2019 Aminpro commenced cobalt flotation testwork, which consisted of floating the pyrite from the scavenger tailings from the copper circuit. Testwork is ongoing. Cobalt deportment was analyzed for the 2019 flotation testing program as part of the refinement of the copper flotation circuit. For the Years 1-5 composite, 90.2% of the cobalt and 97.5% of the pyrite reported to the cleaner tailings. The LCT cleaner tailings for the Years 1-5 composite averaged 0.268% Co and 22% S for the last three test cycles. This is considered to be representative of the cobalt/sulphur deportment to be expected over the mine life based on analysis of the drilling and block model databases. Subsequent investigation to test the amenability of re-flotation of the pyrite in the cleaner tailings indicated that an assumption of 98% pyrite (and Co) recovery to a re-

Santo Domingo Project Region III, Chile
NI 43-101 Technical Report
Page 1-15
March 2020
Project Number: C40029
cleaned pyrite concentrate was reasonable, based on the targeted concentration ratio from the cleaner tailings to the pyrite concentrate of approximately two. An initial preliminary concentrate oxidation testwork program consisting of one pressure leach test (POX) and one bacterial oxidation test (BiOX) indicated the potential for cobalt extraction through dissolution of the sulphide minerals. Therefore, three hydrometallurgical sulphide oxidation flowsheets were evaluated: Albion, BiOX and POX. The Albion and BiOX results were not encouraging. The POX work demonstrated that high cobalt extraction can be achieved, but under the conditions tested this was only possible with high oxidation of sulphide to sulphate. No opportunity was identified to produce elemental sulphur and reduce the final acid concentration. Roasting tests were conducted at KPM. Optimum cobalt leach extraction was achieved with residues from tests conducted at a temperature of 660–680°C with SO2 and O2 at 10%. Leach results for cobalt were found to be essentially independent of leach time or acid addition. Maximum cobalt extraction was achieved after 1 hour of leaching and, in many cases, before the addition of acid. Higher acid additions and longer leach times did favour higher copper extraction, but also dissolved more iron. Preliminary solution purification testwork was conducted at SGS Lakefield. A bulk pregnant leach solution (PLS) was neutralized with limestone in two stages. At the end of the second stage, all of the iron and virtually all of the contained aluminium had precipitated out. A sample of post-secondary neutralization PLS was used to evaluate copper precipitation. A final purification test was conducted using Caro’s acid to precipitate manganese from the CuS precipitation raffinate. Neutralized tailings will report to the final tailings from the copper-iron circuit. Stage flotation recovery of cobalt and copper to the roaster feed are estimated at 88.4% and 2.97%, respectively. Overall recoveries from the copper circuit feed to the two final product streams are calculated to be 78.3% for cobalt and 2.21% for copper based on mill feed contained metals. In addition, 99% recovery of contained sulphur in the roaster feed is assumed as sulphuric acid. The product from the cobalt recovery circuit will be battery-grade cobalt sulphate heptahydrate. No impurities are anticipated that would prevent the production of a battery-grade cobalt sulphate. Elements that need to be considered in the process design are magnesium, zinc and manganese. It is planned to manage these elements
Santo Domingo Project Region III, Chile
NI 43-101 Technical Report
Page 1-16
March 2020
Project Number: C40029
by a combination of phase scrubbing, pre-purification and polishing steps. There is potential for zinc build-up in the solvent extraction (SX) circuit, which can be managed using organic scrubbing.
1.9 Mineral Resource Estimation
The Mineral Resource estimates for Santo Domingo Sur, Iris and Iris Norte were completed in 2012. The estimate for Estrellita was conducted in 2007. In 2018, RPA revised the block models to include an estimate for cobalt and in 2020, sulphur estimates were added to all but Estrellita. The economic parameters were also changed, with updates to the metal prices, revisions to the mass recovery calculation, updates to the copper equivalent (CuEq) calculation and the addition of pit shell constraints. RPA constructed three-dimensional (3D) wireframe or solid models and gridded surfaces of the mineralized zones, fault structures and topography for use in constraining the block grade interpolations. The principal controls were lithology and structure; however, in some places a nominal grade shell boundary was used. Most zones required construction of wireframes for post-mineral dikes that transect the mineralized mantos. There are also some sequences of barren tuffs that were modelled. A wireframe model was also created to enclose oxidized material that has been demonstrated to yield much lower metallurgical recoveries than the un-oxidized mineralization. A modest amount of underground and open pit mining has been carried out at Estrellita. Far West personnel provided raw cavity monitoring device (CMD) data from which RPA was able to construct approximate wireframe models of the void spaces. The current wireframe models for copper/iron mineralization were used for the cobalt estimates. In RPA’s opinion the interpolations could be improved by constructing separate wireframe models for the cobalt mineralization. The distribution of sulphur in some portions of the deposit was observed to be inconsistent with the copper content. RPA recommends that a review be undertaken of the sulphur mineralogy in order to understand the sulphur distribution. At Santo Domingo Sur, Iris and Iris Norte copper, gold and cobalt assays were capped at 3.5% Cu, 0.52 g/t Au and 1,750 ppm Co, respectively. Grades at Estrellita were capped at 3.0% Cu, 0.3 g/t Au and 1,000 ppm Co. Sulphur was not capped but in Iris Norte a distance constraint was placed on sulphur values >2.5% S.

Santo Domingo Project Region III, Chile
NI 43-101 Technical Report
Page 1-17
March 2020
Project Number: C40029
Samples from Santo Domingo Sur, Iris and Iris Norte were composited in down-hole intervals of 4 m starting at the contact for each zone and continuing until the hole exited the zone. Drill samples at Estrellita were composited to 2 m lengths, weighted by both length and density. Grades for copper, gold, iron, cobalt, sulphur and magnetic susceptibility were interpolated into each block using ordinary kriging (OK) for the Santo Domingo Sur, Iris and Iris Norte deposits. The interpolation was configured to use an ellipsoidal search with a minimum of 3 and a maximum of 18 composites, with a maximum of 3 composites allowed from any one drill hole. For Estrellita, OK was used to interpolate copper, gold, iron and cobalt grades into each block. Sulphur was not estimated due to the uniformly low sulphur grades. The search was constrained to a minimum of 3 and maximum of 12 composites, with a maximum of 3 composites from any one drill hole. Grade interpolations were validated and no significant errors or biases were noted. Blocks receiving an estimate for copper were assigned to at least the Inferred category at Santo Domingo Sur, Iris and Iris Norte. All blocks with an average distance to composites of 200 m or less and for which the nearest composite was within 100 m were classified as Indicated. Within the area of infill drilling completed in 2011–2012, a boundary was drawn around the 50 m drilling pattern and Indicated blocks encompassed by it were nominally assigned to the Measured classification. The final step in the classification was to use the oxide wireframe to tag oxidized blocks and remove these from the Mineral Resources. The classification of Indicated at Estrellita was applied to all blocks estimated by at least two drill holes with the closest composite less than 65 m away. Remaining blocks were classified as Inferred. RPA ran a pit optimization on the block models using a Lerchs–Grossmann (LG) algorithm. The resulting pit shells were used to constrain the resource reporting. The analysis suggested that a cut-off grade of 0.125% CuEq would be appropriate for the Mineral Resource estimate.
1.10 Mineral Resource Statement The Mineral Resource estimates and geological models were prepared by Mr. David Rennie, P. Eng., an associate of RPA. Mr. Rennie is the Qualified Person as defined under NI 43-101 for the estimate. Mineral Resources for the Property have an effective date of 13 February 2020. Mineral Resources in Table 1-1 are reported inclusive of Mineral Reserves. Mineral Resources that are not Mineral Reserves do not have demonstrated economic viability.
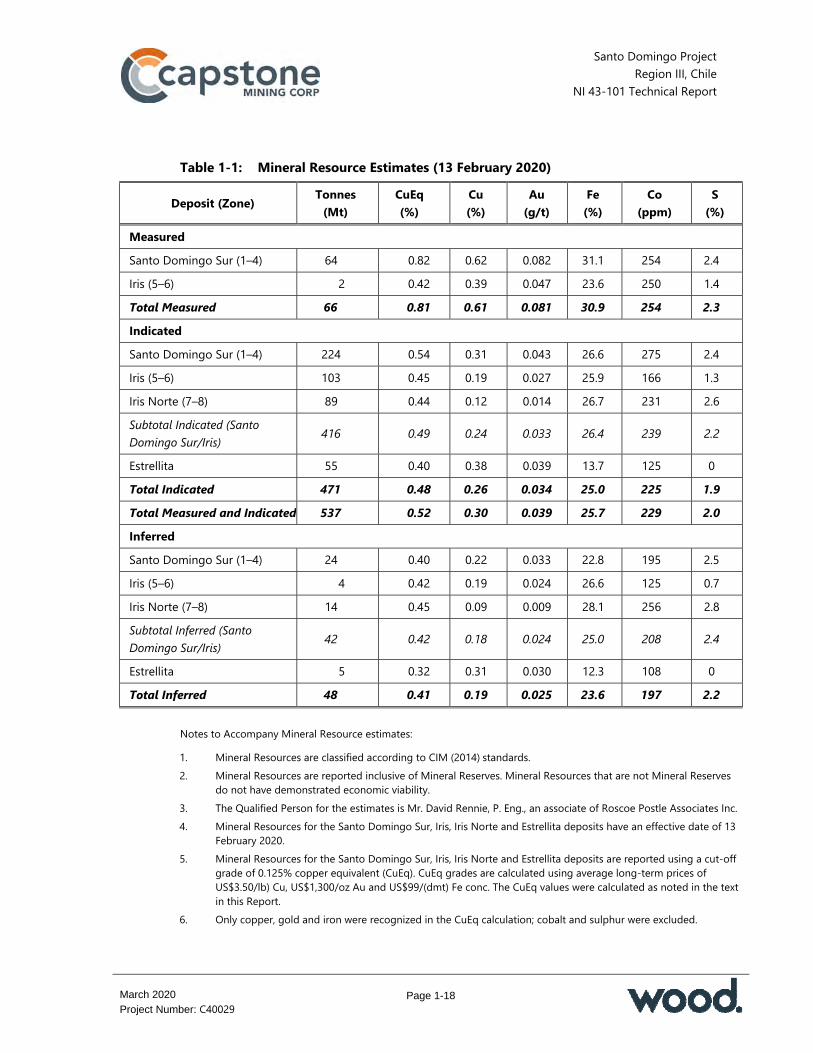
Santo Domingo Project Region III, Chile
NI 43-101 Technical Report
Page 1-18
March 2020
Project Number: C40029
Table 1-1: Mineral Resource Estimates (13 February 2020)
Deposit (Zone) Tonnes (Mt)
CuEq (%)
Cu (%)
Au (g/t)
Fe (%)
Co (ppm)
S (%)
Measured Santo Domingo Sur (1–4) 64 0.82 0.62 0.082 31.1 254 2.4 Iris (5–6) 2 0.42 0.39 0.047 23.6 250 1.4 Total Measured 66 0.81 0.61 0.081 30.9 254 2.3 Indicated Santo Domingo Sur (1–4) 224 0.54 0.31 0.043 26.6 275 2.4 Iris (5–6) 103 0.45 0.19 0.027 25.9 166 1.3 Iris Norte (7–8) 89 0.44 0.12 0.014 26.7 231 2.6 Subtotal Indicated (Santo Domingo Sur/Iris) 416 0.49 0.24 0.033 26.4 239 2.2
Estrellita 55 0.40 0.38 0.039 13.7 125 0 Total Indicated 471 0.48 0.26 0.034 25.0 225 1.9 Total Measured and Indicated 537 0.52 0.30 0.039 25.7 229 2.0 Inferred Santo Domingo Sur (1–4) 24 0.40 0.22 0.033 22.8 195 2.5 Iris (5–6) 4 0.42 0.19 0.024 26.6 125 0.7 Iris Norte (7–8) 14 0.45 0.09 0.009 28.1 256 2.8 Subtotal Inferred (Santo Domingo Sur/Iris) 42 0.42 0.18 0.024 25.0 208 2.4
Estrellita 5 0.32 0.31 0.030 12.3 108 0 Total Inferred 48 0.41 0.19 0.025 23.6 197 2.2
Notes to Accompany Mineral Resource estimates:
1. Mineral Resources are classified according to CIM (2014) standards. 2. Mineral Resources are reported inclusive of Mineral Reserves. Mineral Resources that are not Mineral Reserves
do not have demonstrated economic viability. 3. The Qualified Person for the estimates is Mr. David Rennie, P. Eng., an associate of Roscoe Postle Associates Inc. 4. Mineral Resources for the Santo Domingo Sur, Iris, Iris Norte and Estrellita deposits have an effective date of 13
February 2020. 5. Mineral Resources for the Santo Domingo Sur, Iris, Iris Norte and Estrellita deposits are reported using a cut-off
grade of 0.125% copper equivalent (CuEq). CuEq grades are calculated using average long-term prices of US$3.50/lb) Cu, US$1,300/oz Au and US$99/(dmt) Fe conc. The CuEq values were calculated as noted in the text in this Report.
6. Only copper, gold and iron were recognized in the CuEq calculation; cobalt and sulphur were excluded.

Santo Domingo Project Region III, Chile
NI 43-101 Technical Report
Page 1-19
March 2020
Project Number: C40029
7. Mineral Resources are constrained by preliminary pit shells derived using a Lerchs–Grossmann algorithm and the following assumptions: pit slopes averaging 45º; mining cost of US$1.90/t, processing cost of US$7.27/t (including G&A cost); processing recovery of 89% copper and 79% gold, iron recoveries are calculated based on magnetic susceptibility; and metal prices of US$3.50/lb Cu, US$1,300/oz Au and US$99/dmt Fe concentrate.
8. Rounding as required by reporting standards may result in apparent summation differences. 9. Tonnage measurements are in metric units. Copper, iron and sulphur are reported as percentages, gold as
grams per tonne and cobalt as parts per million. Risk factors that could potentially affect the Mineral Resources estimates include the following: Assumptions used to generate the conceptual data for consideration of
reasonable prospects of eventual economic extraction including: Commodity price assumptions Exchange rate assumptions Density assumptions Geotechnical and hydrogeological assumptions Operating and capital cost assumptions Metal recovery assumptions Concentrate grade and smelting/refining terms Changes in interpretations of mineralization geometry and continuity of
mineralization zones. There are no environmental, permitting, legal, title, taxation, socio-economic, marketing, political or other relevant factors known to the QP, other than those discussed in this Report, that could affect the Mineral Resource estimates.
1.11 Mineral Reserve Estimation
Pit optimization, mine design and mine planning were carried out by NCL using the 2012 block model prepared by RPA and did not include consideration of material classified as Inferred. Inferred Mineral Resources were treated as waste. A block size of 12.5 m E x 12.5 m N x 12 m high was selected for the block model. The selected block size was based on the geometry of the domain interpretation and the data configuration. The mining cost estimate for the pit optimization process is based on studies carried out by NCL during 2018. The estimated average mining cost was separated into various components such as fuel, explosives, tires, parts, salaries and wages, benchmarked against similar current operations in Chile. Each component was updated

Santo Domingo Project Region III, Chile
NI 43-101 Technical Report
Page 1-20
March 2020
Project Number: C40029
for third quarter 2018 prices and the exchange rate from Chilean Pesos to US dollars. This resulted in an estimated mining cost of approximately $1.75/t. The metal prices, processing costs, refining costs and processing recoveries were provided to NCL by Capstone. A number of calculations were performed in the model in order to determine the net smelter return (NSR) of each individual block. The internal (or mill) cut-off of $7.53/t milled incorporates all operating costs except mining. This internal cut-off is applied to material contained within an economic pit shell where the decision to mine a given block was determined by the pit optimization and was applied to all of the Mineral Reserve estimates. Marginal material was calculated for the same $7.53/t cut-off, but for a NSR determined at higher metal prices. Final slope angles used for the pit optimization process were a result of multiple iterations and analysis carried out by the NCL mining team and geotechnical specialists Derk Ingeniería y Geología Ltda. (Derk). The original block model was based on an ore percentage with dimensions of 12.5 m x 12.5 m x 12 m, resulting in a 1,875 m3 block volume; this means that every block has a defined “ore” portion with an ore density and a corresponding “waste” portion with a waste density. To accommodate selective mining methods, any resource block with an ore percentage that was <10% was treated as waste. Blocks with an ore percentage that was higher than 90% were diluted with waste such that all high-ore blocks were considered to contain only 90% ore. Selective mining, therefore, will be performed on those blocks that have an ore percentage between 10% and 90%.
1.12 Mineral Reserve Statement
Mineral Reserves are summarized in Table 1-2 and have an effective date of 14 November 2018. The QP for the estimate is Mr. Carlos Guzman, CMC, an NCL employee. In the opinion of the NCL QP, the main factors that may affect the Mineral Reserves estimate are metallurgical recoveries and operating costs (fuel, energy and labour). NCL notes that the base price, as well as changes in the price of metals, even though this is the most important factor for revenue calculation, does not affect the Mineral Reserves estimate to any significant degree.
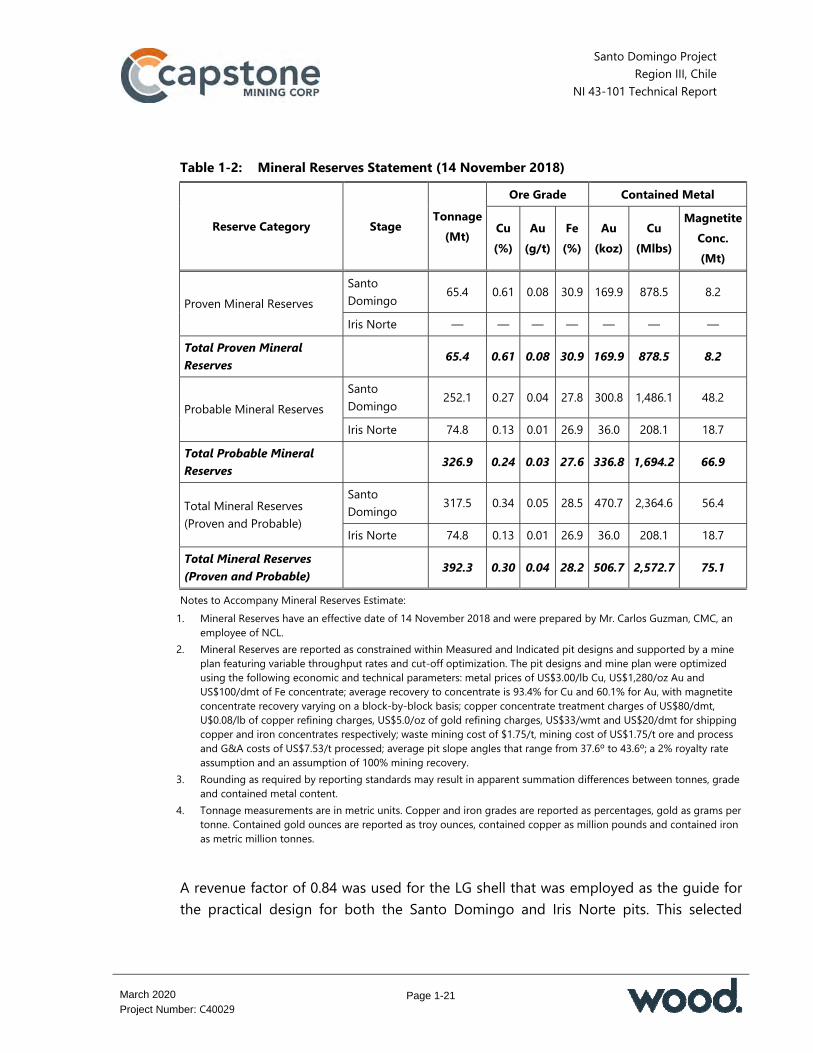
Santo Domingo Project Region III, Chile
NI 43-101 Technical Report
Page 1-21
March 2020
Project Number: C40029
Table 1-2: Mineral Reserves Statement (14 November 2018)
Reserve Category Stage Tonnage (Mt)
Ore Grade Contained Metal
Cu (%)
Au (g/t)
Fe (%)
Au (koz)
Cu (Mlbs)
Magnetite Conc. (Mt)
Proven Mineral Reserves Santo Domingo 65.4 0.61 0.08 30.9 169.9 878.5 8.2
Iris Norte — — — — — — — Total Proven Mineral Reserves
65.4 0.61 0.08 30.9 169.9 878.5 8.2
Probable Mineral Reserves Santo Domingo 252.1 0.27 0.04 27.8 300.8 1,486.1 48.2
Iris Norte 74.8 0.13 0.01 26.9 36.0 208.1 18.7 Total Probable Mineral Reserves
326.9 0.24 0.03 27.6 336.8 1,694.2 66.9
Total Mineral Reserves (Proven and Probable)
Santo Domingo 317.5 0.34 0.05 28.5 470.7 2,364.6 56.4
Iris Norte 74.8 0.13 0.01 26.9 36.0 208.1 18.7 Total Mineral Reserves (Proven and Probable)
392.3 0.30 0.04 28.2 506.7 2,572.7 75.1
Notes to Accompany Mineral Reserves Estimate: 1. Mineral Reserves have an effective date of 14 November 2018 and were prepared by Mr. Carlos Guzman, CMC, an
employee of NCL. 2. Mineral Reserves are reported as constrained within Measured and Indicated pit designs and supported by a mine
plan featuring variable throughput rates and cut-off optimization. The pit designs and mine plan were optimized using the following economic and technical parameters: metal prices of US$3.00/lb Cu, US$1,280/oz Au and US$100/dmt of Fe concentrate; average recovery to concentrate is 93.4% for Cu and 60.1% for Au, with magnetite concentrate recovery varying on a block-by-block basis; copper concentrate treatment charges of US$80/dmt, U$0.08/lb of copper refining charges, US$5.0/oz of gold refining charges, US$33/wmt and US$20/dmt for shipping copper and iron concentrates respectively; waste mining cost of $1.75/t, mining cost of US$1.75/t ore and process and G&A costs of US$7.53/t processed; average pit slope angles that range from 37.6º to 43.6º; a 2% royalty rate assumption and an assumption of 100% mining recovery.
3. Rounding as required by reporting standards may result in apparent summation differences between tonnes, grade and contained metal content.
4. Tonnage measurements are in metric units. Copper and iron grades are reported as percentages, gold as grams per tonne. Contained gold ounces are reported as troy ounces, contained copper as million pounds and contained iron as metric million tonnes.
A revenue factor of 0.84 was used for the LG shell that was employed as the guide for the practical design for both the Santo Domingo and Iris Norte pits. This selected

Santo Domingo Project Region III, Chile
NI 43-101 Technical Report
Page 1-22
March 2020
Project Number: C40029
revenue factor is conservative and as such allows for changes in metals pricing before any salient effect on the Mineral Reserves estimate will occur.
1.13 Mining Methods
A mine plan was developed to process 60,000 t/d to 65,000 t/d of feed (21.9 Mt/y to 23.7 Mt/y) with a peak total mining rate of 107.5 Mt/y in Years 1 to 4. Because of the softer characteristics of the initial feed (higher copper content and lower magnetite), an initial period of 5 years was scheduled for a plant feed of 65 kt/d. From Year 6 the plant throughput is scheduled for 60 kt/d. Year 1 feed to the plant is made up of material mined during pre-production and Year 1. Oxide material will be identified and will be stockpiled separately. A 15 month pre-production period will be needed. Mill throughput was also restricted to a magnetite concentrate production capacity of a maximum 4.5 Mt/y up to Year 10; and 5.4 Mt/y from Year 11. The mine is scheduled to work 7 days per week, 365 days per year. Each day will consist of two 12-hour shifts. Four mining crews will cover the operation. The final pit design was based on a LG shell that used a copper price of $3.00/lb and $100/t for magnetite concentrate. Two pits, the Santo Domingo pit and the Iris Norte pit, were designed. The Santo Domingo pit will have four phases; three mining phases are planned for the Iris Norte pit. These values were used only for mine design not the economic analysis. The Santo Domingo pit will have two exits on the west side providing access to the run-of-mine (ROM) pad area and the primary crusher. On the east side there will be another exit to access the main waste rock storage area. The Iris Norte pit will have one exit on the west side providing access to the ROM pad area and the primary crusher. On the east side there will be an exit to access the waste rock storage area. Mine equipment requirements were calculated based on the annual mine production schedule, the mine work schedule and equipment hourly production estimates. The study is based on operating the mine with 42 m3 capacity hydraulic excavators (shovels) and trucks with a capacity of 290 t. The fleet will be complemented with drilling rigs for ore and waste. Auxiliary equipment will include tracked dozers, wheel dozers, motor graders and a water truck. A small drill rig was also included for pre-splitting purposes.

Santo Domingo Project Region III, Chile
NI 43-101 Technical Report
Page 1-23
March 2020
Project Number: C40029
1.14 Recovery Methods
1.14.1 Crushing and Grinding
The primary crushing plant will receive ROM feed directly from the open pits. The crusher is designed to allow two 290 t trucks to discharge directly into the crusher dump pocket (rated capacity of 450 t). The crushed product will be conveyed to the coarse ore stockpile (live capacity equivalent to 6 to 8 hours of operation). The SAG mill will operate in a DSAG mode. Oversize pebbles from the SAG mill discharge screen will be recycled to the SAG mill. The SAG mill product will discharge onto a conventional vibrating double deck screen. The SAG mill discharge screen undersize will flow into a common SAG and ball mill discharge pump box and is pumped in parallel using two separate feed pumps to two separate hydrocyclone clusters. The hydrocyclone oversize (or underflow) fraction will return by gravity to the ball mills for further size reduction.
1.14.2 Copper Flotation
The total hydrocyclone overflow streams from the grinding circuit (the copper flotation circuit feed stream) with a P80 of 150 µm will be fed to a single bank of mechanical forced air flotation cells. The combined flotation rougher tailings will be pumped to the magnetic separation circuit. Combined rougher and scavenger concentrates flow by gravity to the concentrate regrind stage, which consists of a single vertical mill and hydrocyclone cluster, operating in closed circuit. The overflow from the regrind hydrocyclones (the product of the regrind circuit) will feed a single conditioning tank before it feeds the first cleaner flotation circuit consisting of a first cleaner section followed by a first scavenger section; in a single bank of mechanical forced air tank type flotation cells. The concentrate from the first cleaner circuit will be pumped to the second cleaning flotation stage; the concentrate from the scavengers returns to the regrind feed. The primary cleaner circuit scavenger tailings will report to the final tailings stream where it will be combined with magnetite recovery circuit tailings. The second stage of flotation cleaning will be performed in a single bank of cells operating with forced air. The concentrate produced flows by gravity to third cleaner flotation and the tailings are pumped back to the first cleaning flotation stage. The concentrate from the third cleaners is the final copper concentrate. This concentrate is
Santo Domingo Project Region III, Chile
NI 43-101 Technical Report
Page 1-24
March 2020
Project Number: C40029
sent to concentrate thickening. The tailings from the third cleaner flotation stage will be recirculated to the second cleaning stage feed. The copper concentrate thickener underflow will discharge at 60% solids w/w and will be pumped to the copper concentrate filters.
1.14.3 Magnetic Separation
Tailings from the primary rougher flotation stage (the magnetite circuit feed) will be pumped to a central distribution box with pneumatic dart valves feeding two lines each with five individual primary LIMS (1,000 gauss) magnetic drum separators operating in parallel. It is planned that initially 10 LIMS drum separators will be installed with space for additional LIMS to be installed later as required to treat increased magnetite feed. The rougher magnetic drums will operate in parallel to maximize the rougher concentrate iron grade. The rougher magnetic concentrate from each magnetic drum line will be sent to grinding and classification; the rougher magnetic concentration tailings will report to the main plant tailings stream. Hydrocyclone overflow from the magnetite concentrate grinding and classification circuit at a P80 of 40 μm will be sent to cleaner magnetic separation. The cleaning circuit magnetic LIMS concentrator will consist of two parallel lines each with three LIMS drum separators operating in a counter-current configuration to facilitate high selectivity. The final magnetite concentrate produced will be pumped to the magnetite concentrate thickener and the tailings from the cleaner magnetic stage will be combined with rougher LIMS tailings and will be sent to the final tailings stream. Overflow water from the concentrate thickener will report to the main process water pond and thickener underflow from the magnetite concentrate thickener at 65% solids w/w will be pumped to the concentrate transport system.
1.14.4 Tailings Thickening
The first stage of tailings thickening (pre-thickening) will be conducted at the process plant and the second stage (final thickening) will be conducted at the TSF area. Pre-thickening of tailings will be done in high rate thickeners, which deliver tailings thickener underflow at 55% solids w/w. Recovered water from the thickeners will be pumped back to the process water pond. Thickened tailings will be pumped to the TSF area.

Santo Domingo Project Region III, Chile
NI 43-101 Technical Report
Page 1-25
March 2020
Project Number: C40029
1.14.5 Copper Concentrate Filtration
Copper concentrate will be filtered at the mine site in three ceramic disc filters. Copper concentrate filter cake will discharge by gravity to the copper concentrate stockpile.
1.14.6 High Density Tailings and Tailings Transport
Final tailings thickening will be carried out in two high density thickeners which produce a 67% solids w/w discharge. The water recovered from the thickeners will be stored in a tank; some water will be pumped to filtration and used as dilution water for flocculant preparation and surplus water will flow by gravity to the process water pond. The thickened tailings discharge will be pumped to a tank at the TSF and will flow by gravity into the TSF.
1.14.7 Plant Infrastructure
The plant will use desalinated water from a pumping station at the port. The current plan is to negotiate for the supply of desalinated water at the mine site on a build, own, operate, transfer (BOOT) contract for a plant at the port or to purchase water from an existing desalination plant. A Request for Proposal (RFP) solicitation process has been conducted with proposals provided for a BOOT arrangement and for direct purchase. Desalinated water will be pumped via a pipeline to the process water ponds on site. Capstone will operate potable water treatment plants at the mine site (using desalinated water) for the potable water supply on site and for the potable water supply to the town of Diego de Almagro. Compressed air will be supplied from the compressed air plant consisting of four 200 kW compressors, one accumulator and one dryer and one accumulator for the instrument air. These will be installed in the plant area.
1.14.8 Port Infrastructure
There will be a filter plant at the port for magnetite concentrate. Magnetite concentrate will be transported by pipeline from the mine site and will be received at the port in an agitated storage tank and then pumped directly to the filter plant to obtain a magnetite concentrate with a moisture content of 8% w/w. Initially there will be two ceramic disc filters (increasing to four by Year 5) and the magnetite concentrate filter cake product will discharge onto a conveyor feeding the concentrate transfer tower and then the magnetite concentrate stockpile.

Santo Domingo Project Region III, Chile
NI 43-101 Technical Report
Page 1-26
March 2020
Project Number: C40029
Process water (desalinated water) required at the port will be provided by the desalinated water supplier. Potable water at the port will be produced from the desalinated water by chlorination. Instrument air and plant air will be provided via distribution ring main systems.
1.14.9 Production Plan
The production plan obtained from the mine plan and the metallurgical models for copper and iron recovery assumes yearly average treatment rates of 65,000 t/d and 60,000 t/d, with an annual peak production of 514.1 kt of copper concentrate in the first full year of production and an annual peak production for magnetite concentrate of 4.04 Mt for the first 6 years of production and 5.40 Mt for the remaining mine life. In Years 0 and 1 Hematite ore reaches the maximum treatment rate within the plan (about 32% of the total processed in the year). The maximum treatment rate of Magnetite ore is close to 90% in Year 18. In some periods the plant could process more tonnage than projected. The head grade varies between 0.68% Cu and 0.42% Cu during the first 5 full years of production. After the fifth full year the head grade varies between 0.37% Cu and 0.14% Cu. At the end of the mine life the head grade is only 0.06% Cu. For the first 5 full years the head grade is about 30% Fe, with an average of around 28% Fe with little variation over the LOM.
1.15 Infrastructure
1.15.1 Planned Facilities
The main infrastructure facilities considered in the 2019 Technical Report are planned to be located at the following sites: Santo Domingo plant site: Located at approximately 26°28’00”S and 70°00’30”W Permanent camp and temporary construction camp: Located on the mine site; part
will be rented and removed after construction and the rest will be permanent Iron concentrate and water pipelines: 111.6 km long between the Santo Domingo
plant site and the port site at Punta Roca Blanca Santo Domingo port facilities: Located about 43.5 km north of Caldera at Punta
Roca Blanca (Puerto Santo Domingo).
Santo Domingo Project Region III, Chile
NI 43-101 Technical Report
Page 1-27
March 2020
Project Number: C40029
1.15.2 Access Considerations
The planned route for transporting cargo, staff and equipment to the Santo Domingo site is from the south of the mine site by Route C-17 and from the north by Route C-13. The closest airport to the Santo Domingo site is the El Salvador Airport, a private airport, 44 km from the site. The closest commercial airport is the Desierto Atacama Airport, 113 km south from Chañaral. The planned port for transport and shipment of heavy machinery, equipment and materials is Punta Angamos in Mejillones, Antofagasta Region, 520 km from the plant site. This port operates throughout the year and is accessed directly from Route 5 North.
1.15.3 Waste Rock Storage Facilities
Three waste rock storage facilities (WRF) were designed at the west and south of the open pits. The WRFs were designed in 50 m lifts. Capstone has concluded that the WRFs show a moderate to low potential for generation of acid rock drainage.
1.15.4 Stockpile Facilities
During the pre-production period, the ROM pad area will be constructed close to the initial pit for later re-handling to the primary crusher. The total ore to be stockpiled during this period amounts to 0.47 Mt. The marginal material stockpile and the oxide stockpile will be located in areas between the Santo Domingo and Iris Norte pits.
1.15.5 Port
Puerto Santo Domingo will be located in the Punta Roca Blanca area, which is located between Caleta Hornos and Punta Choros, in the Atacama Region. The maximum required annual port capacity is 5.5 Mt/y of magnetite concentrate and 0.52 Mt/y of copper concentrate. Copper concentrate will be delivered to the port by concentrate haul trucks. Magnetite concentrate will be delivered by pipeline. Capstone has held detailed discussions with water supply companies to confirm interest in supplying desalinated water to the operation, from a facility at the port or from another location. The current plan is that a build–own–operate–transfer (BOOT)
Santo Domingo Project Region III, Chile
NI 43-101 Technical Report
Page 1-28
March 2020
Project Number: C40029
contractor will construct and operate the sea water intake, reverse osmosis desalination plant and brine return system at the port and the desalinated water pipeline as part of the BOOT contract. An alternative under consideration is to purchase desalinated water from an existing plant.
1.15.6 Power and Electrical Supply
The facilities requiring power will be located at the following sites: Mine and plant site located near Diego de Almagro. The mine and plant site areas
include the mine, process plant, infrastructure and tailings facility electrical loads. Santo Domingo Port at Punta Roca Blanca. The port facilities include the
desalination system operation (not included in the electrical load estimate, included in the unit cost of desalinated water), the magnetite concentrate filtration plant, magnetite and copper concentrate storage and handling and associated infrastructure.
The peak power demand during operations is estimated to be approximately 112 MW (excluding the desalinated water system). An RFP process was held with six power suppliers for a long term contract for the supply of power for the operation. All bidders were responsive and experienced. A Power Purchase Agreement (PPA) has been negotiated and signed with one supplier. The terms and conditions of the PPA are considered normal and competitive in the Chilean electrical market.
1.16 Environmental, Permitting and Social Considerations
1.16.1 Environmental Considerations
Baseline studies were carried out in the area of influence covering the following communities: Diego de Almagro, Inca de Oro, El Salado, Chañaral, Flamenco, Torres del Inca, Obispito and Caldera. Studies have included physical environment (climate, meteorology); air quality; noise; natural hazards; soils; hydrology/hydrogeology; fauna; flora; port area (setting, tides, chemical and marine environments); human environment (setting, heritage, archaeology); paleontology; and visual landscape.
Santo Domingo Project Region III, Chile
NI 43-101 Technical Report
Page 1-29
March 2020
Project Number: C40029
1.16.2 Permitting Considerations
Works and installations will be constructed for operations facilities for mining, waste rock and tailings disposal, processing in the concentrator plant, concentrate transport by pipeline to the shipping port and port facilities. This also includes the construction of support works and facilities such as the camp; service support (guard houses, lunchrooms, first aid rooms and waste storage); power lines; and roads (internal and access). An application for the enlargement of the sea water intake and brine disposal lines required for a BOOT contract has been included in the update to the EIA submitted for approval in September 2019 (approval expected in H2 2020). This work requires the identification, preparation, submission and approval of environmental and sectorial permits. To date, approximately 700 permits have been identified that will be required to support operations. Twenty of these are considered to be critical for timely construction and start-up. In January 2020 permits had been received for the WRF, exploitation method and mining process, process plant, TSF, port and the Closure Plan. The request for the early works permit (Informe de Factibilidad de Construcción, IFC) was approved in December 2019.
1.16.3 Closure Considerations
The Closure Plan for Santo Domingo was approved in July 2019. Closure costs are treated in the economic analysis as operating costs and total $135.5 M. The closure costs are accrued on an annual basis and treated as expenses in the year in which they are spent.
1.16.4 Tailings Storage Facility
The TSF will be located approximately 2 km southeast of the process plant. The TSF embankment will be constructed from compacted, non-acid generating mine waste rock. A 1.5 mm thick high-density polyethylene (HDPE) geomembrane liner will be installed on the upstream face and will be placed over a geotextile and a 3 m thick soil bedding layer. In the TSF basin the geomembrane will be installed beneath the area of the supernatant pond and extended 100 m beyond the expected pond limits to reduce vertical seepage from the pond. The pond will remain in direct contact with the upstream face of the embankment throughout the operating life of the facility. The liner may be extended further than 100 m in the future detailed design stage to

Santo Domingo Project Region III, Chile
NI 43-101 Technical Report
Page 1-30
March 2020
Project Number: C40029
provide coverage for a potentially larger pond. This could be required if the tailings thickening and deposition is not always as effective as planned. The anchor trench along the upstream limits of the liner may be deepened and widened to further reduce seepage. The embankment will be constructed in stages using the downstream method. In the final configuration, the crest elevation will be between 1,058.5 masl and 1,069.7 masl, 55.5 m maximum height. The final dam will require a total of 7.7 Mm3 of fill. The initial dam will have a crest elevation of 1,044.9 masl, maximum height of 41 m and 2,418 m long. It will require 2.2 Mm3 of fill. A 26.7 m high saddle dam will be constructed at the southwest limit of the TSF to provide containment at that location. Foundation preparation will involve removing loose and deleterious material and material with a high salt content that could develop solution cavities due to seepage. A storm water diversion channel will be constructed around the perimeter of the TSF to reduce the ingress of storm water run-off into the TSF. It is anticipated that the TSF will store 314 Mt of copper and iron tailings, equivalent to an estimated total volume of 196 Mm³ at an overall average dry density of 1.6 t/m3. These tailings will be deposited over 18 years. Monitoring of the facility will include piezometers, clinometers, inclinometers, accelerometers, three existing monitoring wells and a pumping well that were drilled during field investigations. A fibre optic data communication system will be incorporated for near-continuous, real time data reception and assessment. If any water is detected in the monitoring wells, additional pumping wells may be installed as needed to intercept the source. The water recovered will be either treated for release or returned to the TSF for re-cycling in the process. After Year 10 any ground water flows from the TSF are expected to be intercepted by the Iris Norte well system that will be installed to dewater the pit. The tailings will be pumped from the plant after first stage thickening at 55% by mass solids content, to the second stage thickeners located at the southern end of the TSF. The second stage thickeners will produce tailings with approximately 67% solids content. These tailings will be pumped to, and deposited in, the TSF using the sub-aerial deposition method. Liquid solids separation will occur on the beach and the liberated water will flow downslope to the supernatant pond against the embankment from where it will be recirculated to the process plant. It is possible that during start up and periodically during operations, the tailings thickening may produce a less dense

Santo Domingo Project Region III, Chile
NI 43-101 Technical Report
Page 1-31
March 2020
Project Number: C40029
slurry than the target 67%; this will result in a larger volume of water introduced into the TSF than planned. During detail design the impact of this will be assessed and accounted for. Closure of the TSF will include removal of any supernatant water, covering the surface of the tailings with non-acid generating (NAG) granular material and installing a spillway to remove surface run-off from the low point (in the north area of the TSF). The spillway will have sufficient capacity to convey the probable maximum precipitation (PMP) event throughout the post-closure phase of the facility.
1.16.5 Social Considerations
A stakeholder identification study has been completed and has identified a number of parties that will be either directly or indirectly affected by the property development. A number of communication sessions were undertaken during 2012 and 2013; and included open houses and meetings with regional authorities, community support service authorities and professional organizations, as well as sessions to address specialist interests (such as fishermen). Although the lands of the Colla Community of Diego de Almagro are not within the direct area of influence of the property, Capstone will keep lines of communication open for possible approaches or inquiries from this community. Capstone’s communications strategy will focus on building a positive reputation and supportive environment for the mine and plant development in the Atacama Region. Specific development strategies are focussing on the communities of Diego de Almagro and Caldera. A communications plan, communications committee and crisis response management plan are being developed. A health and safety management system has been developed to meet local legal requirements and industry best practices. Capstone will implement policies, standards, plans and security procedures and will use facilities, equipment and personnel required to provide adequate security levels for its staff and facilities.
1.17 Markets and Contracts
Capstone requested David J. Trotter and Braemar to prepare papers on price projections, sales potential and shipping costs for the iron ore concentrates to be produced over the LOM. These documents updated information provided by CRU and CTAG for the 2014 feasibility study.
Santo Domingo Project Region III, Chile
NI 43-101 Technical Report
Page 1-32
March 2020
Project Number: C40029
Capstone has been shipping copper concentrate from the Pinto Valley Mine since 2013 and has established a reputation as a reliable supplier. Capstone’s Marketing Group is experienced and will establish and implement the marketing strategy for Santo Domingo’s copper concentrate offtake agreements. Kores has rights to purchase up to 50% of the annual production of copper and iron ore concentrates produced by the operation. Capstone will market and sell the remaining concentrate. The Kores terms and conditions will reflect the Capstone terms negotiated independently in the market. The Santo Domingo copper concentrate would generally be considered clean; low in impurities (deleterious or penalty elements). For trading companies specializing in blending various complex copper concentrates, a clean concentrate such as that from Santo Domingo would be in high demand. The timing to secure sales contracts would be dependent on the progress of arrangements for project financing. It is likely that banks or financial institutions would want to have signed letters of intent (LOIs) or memorandums of understanding (MOUs) from smelters, followed by full long-term contracts, as a condition for the completion of financing. Santo Domingo will produce a high magnetite ultra-fine (UF) iron ore concentrate and will need to shortlist a number of potential pellet and/or sintering plants that can process the iron ore concentrate as a starting point of a campaign to contract suitable long-term offtakers. Capstone has made contact with Chinese iron ore processors in Hebei province at an early stage in order to start the process to have meaningful MOUs in place that can be developed into long-term offtake contracts. Each steel mill complex has its own level of tolerance in terms of impurities. The main levels of impurities as far as the magnetite concentrate is concerned are silica and copper. Copper is below the threshold but may in some circumstances represent a non-preferred feed; silica is only likely to be a cost factor or penalty element rather than a rejectable quality issue. In the 2014 feasibility study, the CRU prediction was that on average from 2016 through to and including 2025, copper prices were expected to average $3.13/lb. CTAG agreed that this was a realistic price to be used as an average over this period. For the purposes of the economic analysis in this Report, a copper price of $3.00/lb was used based on Capstone corporate guidelines.
Santo Domingo Project Region III, Chile
NI 43-101 Technical Report
Page 1-33
March 2020
Project Number: C40029
A forward pricing report prepared for Capstone by David J. Trotter in 2018 estimated that prices for 62% Fe content sinter fines (Platts Iron Ore Index or IODEX) cost-and-freight (CFR) Qingdao delivery (deemed the standard product for CFR China delivery) can be expected to be in the range of $62/dmt to $72/dmt over the next 10 years. This study is based on a long-term price of $69/dmt for 62% Fe concentrate. Premiums for 65% Fe concentrate ($24/dmt), value-in-use (VIU) for 66% Fe ($1.50/dmt), magnetite content ($2.50/dmt) and low alumina ($7/dmt for each 1% below 2.5%) are expected to remain relatively stable because of the direct impact on furnace productivity and decrease in emissions. This study discounted the current premiums to approximately 80%. Braemar conducted a long-term estimate of shipping costs to include new construction and new environmental regulations on sulphide emissions. Long-term contracted prices are expected to drop from the current spot market price of $20/dmt to below $15/dmt. This study has assumed a long-term shipping cost of $20/dmt. The net result is a price of $80/dmt free-on-board (FOB) Chile. The value used for iron ore concentrate was $100/t ($69/t base + $31/t premium) less $20/t for shipping ($80/t shipped).
1.18 Capital Cost Estimates
All capital costs are in Q3 2018 US$. A foreign exchange rate of 600 CLP to US$1 was used for the detailed estimate. Capital cost estimates were prepared by the various consultants working on this Report and were based on battery limits established by Capstone. Owner costs were provided by Capstone. Estimates were based on a combination of direct quotes and benchmarking. The estimate is a Type 3 estimate according to Wood and AACE International standards, with an accuracy of -10 to +15% at the 85% confidence level. The initial capital cost was estimated to be $1,512 M. The estimated sustaining capital cost total approximately $379 M. The combined initial and sustaining capital costs for the LOM were estimated to be about $1,891 M (Table 1-3).

Santo Domingo Project Region III, Chile
NI 43-101 Technical Report
Page 1-34
March 2020
Project Number: C40029
Table 1-3: Initial Capital Cost Estimate
Area Cost ($ M)
Initial Capital
Mine 177.5 Process Plant 313.3 Tailings and Water Reclaim 48.2 Plant Infrastructure (On Site) 81.9 Port 147.4 Port Infrastructure (On Site) 21.9 External Infrastructure (Off Site) 143.2 Indirect Costs 381.0 Contingency 197.8
Total Initial Capital 1,512.3 Total Sustaining Capital 378.6 Total Cost 1,890.9 Note: Costs in this table are summarized by major area and include costs from consultants, Wood, Capstone, or all relevant parties.
1.19 Operating Cost Estimates
All operating cost estimates are in Q3 2018 US$. Costs are based on a foreign exchange rate of CLP600 to US$1.00. For the CuEq estimate, prices of $3.00/lb Cu, $1,290/oz Au and $80.00/t magnetite concentrate (shipped) were used. The operating cost estimate is considered to be at a feasibility study level, with an accuracy of -10% to +15%. Operating costs are summarized in Table 1-4. The total operating cost over the projected life-of-mine is $5,570.0 M (excluding copper concentrate land transport). Table 1-4: Operating Cost Estimate
Cost Centre LOM Total ($ M)
LOM Average ($/t)
LOM Average ($/lb CuEq)
Process 2,547.6 6.49 0.610 General & Administrative (G&A) 402.8 1.03 0.097 Mining 2,619.6 6.68 0.631 Total 5,570.0 14.20 1.34

Santo Domingo Project Region III, Chile
NI 43-101 Technical Report
Page 1-35
March 2020
Project Number: C40029
1.20 Economic Analysis
The results of the economic analysis to support Mineral Reserves represent forward-looking information that is subject to a number of known and unknown risks, uncertainties and other factors that may cause actual results to differ materially from those presented here. Forward-looking statements include, but are not limited to, statements with respect to future metal prices and concentrate sales contracts, assumed currency exchange rates, the estimation of Mineral Reserves and Mineral Resources, the realization of Mineral Reserve estimates including the achievement of the dilution and recovery assumptions, the timing and amount of estimated future production, costs of production, capital expenditures, costs and timing of the development of ore zones, permitting time lines, requirements for additional capital, government regulation of mining operations, environmental risks, unanticipated reclamation expenses and title disputes. Additional risk can come from actual results of reclamation activities; conclusions of economic evaluations; changes in parameters as mine and process plans continue to be refined; possible variations in ore reserves, grade, or recovery rates; geotechnical considerations during mining; failure of plant, equipment, or processes to operate as anticipated; shipping delays and regulations; accidents, labour disputes and other risks of the mining industry; and delays in obtaining government approvals. The Property was evaluated using non-inflated cash flows on an after-tax basis. Metal prices used were $3.00/lb Cu, $1,290/oz Au and $80/t Fe (assuming 65% Fe content). On a pre-tax basis with no discount, the cumulative cash flow is $4,666 M. On an after-tax basis the cumulative undiscounted cash flow is $3,250 M, the internal rate of return (IRR) is 21.8% and the payback period is 2.8 years. At an 8% discounted cash flow (DCF) rate, the after-tax net present value (NPV) is $1,032 M. A pre-tax summary table is included as Table 1-5. The LOM cash flow is shown in Figure 1-1. Cash costs are summarized in Table 1-6.
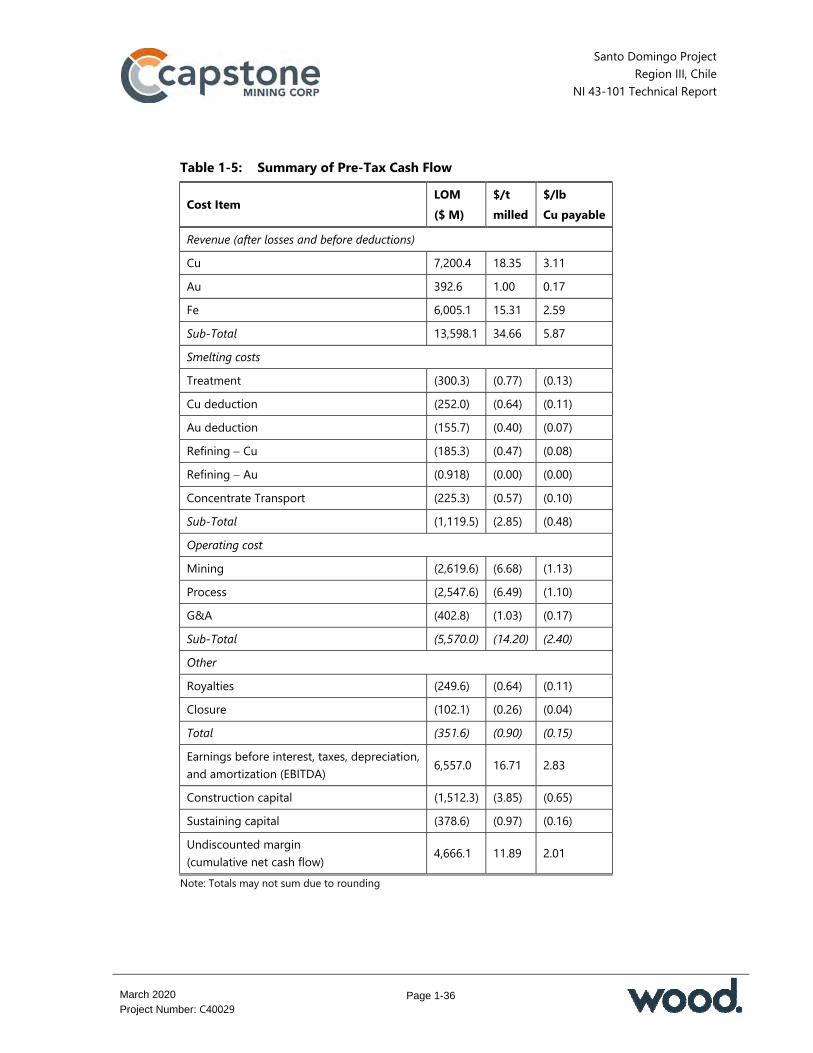
Santo Domingo Project Region III, Chile
NI 43-101 Technical Report
Page 1-36
March 2020
Project Number: C40029
Table 1-5: Summary of Pre-Tax Cash Flow
Cost Item LOM ($ M)
$/t milled
$/lb Cu payable
Revenue (after losses and before deductions)
Cu 7,200.4 18.35 3.11 Au 392.6 1.00 0.17 Fe 6,005.1 15.31 2.59 Sub-Total 13,598.1 34.66 5.87
Smelting costs
Treatment (300.3) (0.77) (0.13) Cu deduction (252.0) (0.64) (0.11) Au deduction (155.7) (0.40) (0.07) Refining Cu (185.3) (0.47) (0.08) Refining Au (0.918) (0.00) (0.00) Concentrate Transport (225.3) (0.57) (0.10) Sub-Total (1,119.5) (2.85) (0.48) Operating cost
Mining (2,619.6) (6.68) (1.13) Process (2,547.6) (6.49) (1.10) G&A (402.8) (1.03) (0.17) Sub-Total (5,570.0) (14.20) (2.40)
Other
Royalties (249.6) (0.64) (0.11) Closure (102.1) (0.26) (0.04) Total (351.6) (0.90) (0.15)
Earnings before interest, taxes, depreciation, and amortization (EBITDA) 6,557.0 16.71 2.83
Construction capital (1,512.3) (3.85) (0.65) Sustaining capital (378.6) (0.97) (0.16) Undiscounted margin (cumulative net cash flow) 4,666.1 11.89 2.01
Note: Totals may not sum due to rounding

Santo Domingo Project Region III, Chile
NI 43-101 Technical Report
Page 1-37
March 2020
Project Number: C40029
Figure 1-1: After Tax Cash Flow Summary
Note: Figure prepared by Wood, 2018
Table 1-6: Cash Cost Summary LOM
Cash Costs LOM Total ($ M)
Cost per tonne milled ($/t)
Cost per pound Cu payable ($/lb)
Costs
Mining 2,619.6 6.68 1.13 Process 2,547.6 6.49 1.10 G&A 402.8 1.03 0.17 Treatment charges 300.3 0.77 0.13 Refining charges 186.2 0.47 0.08 Concentrate transport 225.3 0.57 0.10 Sub-Total 6,281.9 16.01 2.72
Credits
Au (392.6) (1.00) (0.17) Fe (6,005.1) (15.31) (2.59) Sub-Total (6,397.7) (16.31) (2.76)
Adjusted Cash Cost Total 39.8 0.10 0.02
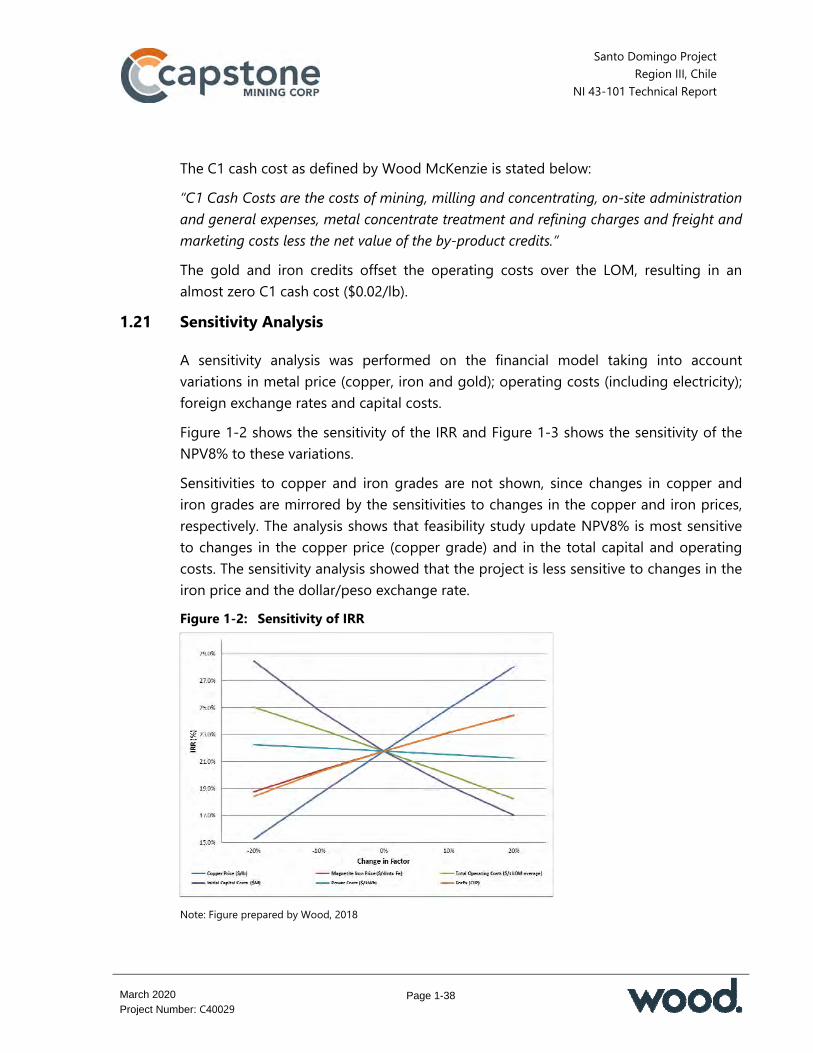
Santo Domingo Project Region III, Chile
NI 43-101 Technical Report
Page 1-38
March 2020
Project Number: C40029
The C1 cash cost as defined by Wood McKenzie is stated below: “C1 Cash Costs are the costs of mining, milling and concentrating, on-site administration and general expenses, metal concentrate treatment and refining charges and freight and marketing costs less the net value of the by-product credits.”
The gold and iron credits offset the operating costs over the LOM, resulting in an almost zero C1 cash cost ($0.02/lb).
1.21 Sensitivity Analysis
A sensitivity analysis was performed on the financial model taking into account variations in metal price (copper, iron and gold); operating costs (including electricity); foreign exchange rates and capital costs. Figure 1-2 shows the sensitivity of the IRR and Figure 1-3 shows the sensitivity of the NPV8% to these variations. Sensitivities to copper and iron grades are not shown, since changes in copper and iron grades are mirrored by the sensitivities to changes in the copper and iron prices, respectively. The analysis shows that feasibility study update NPV8% is most sensitive to changes in the copper price (copper grade) and in the total capital and operating costs. The sensitivity analysis showed that the project is less sensitive to changes in the iron price and the dollar/peso exchange rate. Figure 1-2: Sensitivity of IRR
Note: Figure prepared by Wood, 2018

Santo Domingo Project Region III, Chile
NI 43-101 Technical Report
Page 1-39
March 2020
Project Number: C40029
Figure 1-3: Sensitivity of NPV8% ($ x 1,000)
Note: Figure prepared by Wood, 2018
1.22 Risks and Opportunities
The most significant risks were evaluated in a risk review in 2018 and include: Delay in financing Schedule delays Contractor engagement and price uncertainty Increased equipment and labor costs. Opportunities identified in 2018 include: Include cobalt in the Mineral Reserve Enhance gold recovery through further metallurgical testing Incorporate autonomous haulage Share infrastructure with other local companies Consider autogenous grinding.
1.23 Interpretation and Conclusions
Under the assumptions outlined in this Report, the feasibility study update shows positive economics.
Santo Domingo Project Region III, Chile
NI 43-101 Technical Report
Page 1-40
March 2020
Project Number: C40029
Checks were undertaken in March 2020 to confirm that the cost estimates remained current. The checks included a review of recent study work to see if this work would result in any material changes to the estimates. The review considered additional engineering information such as refinement of drawings and quantity takeoffs, review of commodity price forecasts and basic assumptions used in the cost estimation, review of the impact of power pricing as a result of the PPA, and review of the impact of a newly-enacted Chilean regional tax on the economic analysis. The results showed that if this new information was included in the cost estimates, it would not result in a material change in the outcome of the study (capital and operating costs, economic analysis). Therefore, the cost estimates and economic analyses are considered current and suitable to be included in this Report. The QPs consider that the scientific and technical information for the feasibility study update in this Report can be used to support a decision by Capstone to proceed with the detailed design phase.
1.24 2020 Preliminary Economic Assessment
1.24.1 Introduction
The 2020 PEA that follows is an alternative development option to assess the installation of a circuit during Year 3 of operations to recover cobalt from the copper flotation circuit cleaner tailings. The 2020 PEA is a significant change to the process plant, capital and operating costs, recovered products and revenues from those shown in the feasibility study update. The 2020 PEA is a stand-alone study and has no impact on the feasibility study update, including the Mineral Reserves and the key assumptions and parameters supporting the Mineral Reserves. The Mineral Reserves are considered to remain current and valid in light of the key assumptions and parameters used in the 2020 PEA. The 2020 PEA is preliminary in nature and is based on Mineral Resources that are not Mineral Reserves, and do not have demonstrated economic viability.
1.24.2 Mineral Resource Subset Within the 2020 PEA Mine Plan
The subset of the Mineral Resource estimate included in the PEA mine plan is provided in Table 1-7.

Santo Domingo Project Region III, Chile
NI 43-101 Technical Report
Page 1-41
March 2020
Project Number: C40029
Table 1-7: Subset of Mineral Resource Estimate in 2020 PEA Mine Plan
Confidence Category Stage Tonnage
(Mt)
Grade Contained Metal
Cu (%)
Au (g/t)
Fe (%)
Co (ppm)
S (%)
Au (koz)
Cu (Mlbs)
Co (kt)
Magnetite Conc. (Mt)
S (kt)
Measured Mineral Resources
Santo Domingo 65.4 0.61 0.08 30.86 254.1 2.3 169.9 878.5 16.6 8.2 1,524 Iris Norte — — — — — — — — — — — Sub-total 65.4 0.61 0.08 30.9 254.1 2.3 169.9 878.5 16.6 8.2 1,524
Indicated Mineral Resources
Santo Domingo 252.1 0.27 0.04 27.8 241.9 2.1 300.8 1,486.1 61.0 48.2 5,217 Iris Norte 74.8 0.13 0.01 26.89 227.5 2.5 36.0 208.1 17.0 18.7 1,879 Sub-total 326.9 0.24 0.03 27.6 238.6 2.2 336.8 1,694.2 78.0 66.9 7,095
Measured and Indicated Mineral Resources
Santo Domingo 317.5 0.34 0.05 28.5 244.4 2.1 470.7 2,364.6 77.6 56.4 6,740 Iris Norte 74.8 0.13 0.01 26.9 227.5 2.5 36.0 208.1 17.0 18.7 1,879
Total 392.3 0.30 0.04 28.2 241.2 2.2 506.7 2,572.7 94.6 75.1 8,619
Note: footnotes to Table 1-1 are also applicable to this table.
1.24.3 2020 PEA Mining Methods
Nested pit shells were generated for several revenue factors. The revenue factor 0.84 was selected for pit design. This design omits about 70 Mt of low-grade Indicated Mineral Resources that would require a separate cutback and would affect the sites selected for waste rock storage. The Santo Domingo pit will be about 2,200 m long in the north–south direction and 1,500 m wide in the east–west direction. The Iris Norte pit will be approximately 1,600 m long in the north–south direction and 900 m wide in the east–west direction. Seven pit phases are planned; four for Santo Domingo Sur and three for Iris Norte. A mine production schedule was developed based on process plant throughput of 65,000 t/d for the first 5 years and 60,000 t/d from Year 6 (23.7 Mt/y and 21.9 Mt/y). The mined material movement will peak at 107.5 Mt/y during Years 1 to 4. A 15-month pre-production period will be needed. Mineralized material will be hauled to the primary crusher for direct tipping. Marginal mill feed material will be mined and hauled to a stockpile to be located between the Santo Domingo and Iris Norte pits until Year 13. This material will be re-handled and
Santo Domingo Project Region III, Chile
NI 43-101 Technical Report
Page 1-42
March 2020
Project Number: C40029
will become part of the plant feed in the later years. From Year 14 on, the marginal mineralized material will be sent directly to the plant. The oxide material was treated as waste in the mine plan. No economic process has been defined to treat this material; however, an area for stockpiling the oxide material with copper content greater than 0.2% was set aside so that this material can be recovered for possible future processing. The total mined waste considers two main destinations; the main waste rock storage areas and the TSF for the embankment construction. Three WRF areas at the west and south of the pits were assumed. The mine major equipment was selected based on the mine production schedule, 15 months of pre-production and approximately 18 years of commercial mining operations. Equipment will be conventional to open pit mining operations.
1.24.4 2020 PEA Recovery Methods
The 2020 PEA process plan is based on production of a copper concentrate, a magnetite concentrate and battery-grade cobalt sulphate heptahydrate. Sulphuric acid for the local market and heat for power co-generation on site will be produced as by-products of the cobalt refining. The process plant will have the following main areas as in the copper-iron only circuit: Coarse mill feed material handling and crushing Grinding and classification Copper flotation Copper concentrate thickening Copper concentrate filtration and load out Magnetic separation Magnetite concentrate thickening Lime and reagent preparation plants Grinding media Tailings thickening Plant desalinated water distribution.

Santo Domingo Project Region III, Chile
NI 43-101 Technical Report
Page 1-43
March 2020
Project Number: C40029
The following additional areas will be required: Pyrite cleaning Roasting Sulphuric acid plant Calcine leach Solution purification and Co/Cu recovery Plant auxiliary facilities. The main process design criteria include: Design capacity (first 5 years): 65,000 t/d Nominal capacity (after 5 years): 60,000 t/d Operating period: 365 days per year. The production schedule for copper concentrate and magnetite concentrate is based on the 2020 PEA production plan and the recovery models for copper and iron. There is an annual peak production of 514.1 kt of copper concentrate in Year 1 and an annual peak for magnetite concentrate of 4.04 Mt in the first 6 years of production and 5.40 Mt for the remaining mine life. The production schedule for the cobalt is based on a delayed start-up relative to the copper and iron production. The quantity of pyrite in the resource will determine the quantity of material that will be subjected to roasting and leaching for cobalt recovery. The quantity of roaster feed material will impact by-product revenues from sulphuric acid and power co-generation.
1.24.5 2020 PEA Infrastructure
It is planned to locate the main infrastructure facilities within the 2020 PEA at the following sites: Santo Domingo mine and plant site: located at approximately 26°28’00”S and
70°00’30”W Operations camp: located on site Port facilities: located about 43.5 km north of Caldera at Punta Roca Blanca Concentrate and water pipelines: 111.6 km long between the Santo Domingo plant
site location and the Santo Domingo port site at Punta Roca Blanca

Santo Domingo Project Region III, Chile
NI 43-101 Technical Report
Page 1-44
March 2020
Project Number: C40029
High voltage transmission line: from the Diego de Almagro (San Lorenzo) substation to the proposed mine and plant site
High voltage transmission line: from the Totoralillo substation to the port site. It is planned to build approximately 13 km of roads on the site to connect the mine, plant and infrastructure areas. The proposed route for the magnetite concentrate pipeline is assumed to run parallel to the existing roads and use existing RoW access to avoid the construction of new roads. A common trench will be excavated for the concentrate pipeline and the desalinated water pipeline. At the port and plant locations, each line will be routed separately to the respective facilities. The planned port for transport and shipment of heavy machinery, equipment and materials for construction is Punta Angamos in Mejillones, Antofagasta Region, 520 km from the plant site. This port is a year-round operation and is accessed directly from Route 5 North. It is planned to ship magnetite concentrate using a mixture of Panamax- and Cape-size vessels. It is assumed that cobalt sulphate will be shipped in bags in containers to the Santo Domingo port and then to Asian markets. It is assumed that sulphuric acid will be transported to an existing port with sulphuric acid handling facilities and then by sea to the port of Mejillones. Based upon current Santo Domingo concentrate production estimates, the maximum required annual port capacity is 5.5 Mt/y of magnetite concentrate, 0.52 Mt/y of copper concentrate and an average of approximately 22,500 t/y of cobalt sulphate in containers. Three WRF areas, to be located to the west and south of the pits, are assumed. During the pre-production period, the ROM pad area will be constructed close to the initial pit for later re-handling to the primary crusher. The marginal mill feed material stockpile and the oxide stockpile are planned to be located between the Santo Doming and Iris Norte pits. A 1.3 Mm3 capacity pond will be constructed to store the cobalt-rich pyrite concentrate for the first 2 years of the planned operation. The mine and port will use desalinated sea water. The current plan is to produce desalinated water under a BOOT contract or to have an existing contractor deliver desalinated water to Capstone at the mine site and the port at an agreed price per cubic meter. The desalination facilities will consist of a sea water intake, filtration, treatment and a reverse osmosis desalination plant. Desalinated water will be used for the process and Capstone will operate potable water treatment plants for consumption
Santo Domingo Project Region III, Chile
NI 43-101 Technical Report
Page 1-45
March 2020
Project Number: C40029
in the mine and port areas and to supplement water resources in the town of Diego de Almagro. The water requirement during the construction phase will be provided by an authorized water supplier. Building requirements will include at a minimum: Mine and plant site: administration area (offices, lunch room, control gate, access
guard house); operations (process plant control room and dispatch office, change house and training building, dining room for process plant and mine); contractor area (lubricants shop, workshops, change house); first aid and emergency facilities; maintenance facilities (mechanical maintenance, welding, warehouse and offices); assay laboratory; primary crusher and truck operators area (lunch room).
Port: port office (police, customs and marine services); port operations (offices, control room and laboratory building); change house; lunchroom; workshop and warehouse; access control; magnetite filter plant; copper concentrate storage; desalination plant.
Accommodation for construction and operations personnel will be in one camp at the mine site using temporary units to increase the capacity during construction. These units will be removed when construction is complete. The planned location of the camp is 2.5 km from the mine and process area. Power will be required for the port, desalination plant, mine and process facilities. The total maximum (peak) demand during operations estimated to be approximately 112 MW (excluding the desalinated water system). The estimated average demand during operations will be approximately 85 MW. Capstone has entered into a long term PPA with a leading power company operating in the national grid system. There are no concerns that the Chilean national grid system can provide a firm and continuous electrical supply. The excess power produced by the acid plant (estimated to be between 18 MW and 20 MW) is assumed as a credit to the 2020 PEA operating costs for the cobalt circuit at the contracted power cost.
1.24.6 2020 PEA Environmental, Permitting and Social Considerations
Baseline studies have been carried out in the area of influence. Studies have included physical environment (climate, meteorology); air quality; noise; natural hazards; soils; hydrology/hydrogeology; fauna; flora; port area (setting, tides, chemical and marine environments); human environment (setting, heritage, archaeology); paleontology; and visual landscape.
Santo Domingo Project Region III, Chile
NI 43-101 Technical Report
Page 1-46
March 2020
Project Number: C40029
The EIA was presented to the authorities in October 2013. Capstone’s RCA was obtained in 2015 and will expire in July 2020. A project owner has up to 5 years after the RCA is awarded to initiate the construction of the approved works or activities. At a minimum, early works must be initiated to retain the validity of an RCA. For Santo Domingo these early works consist primarily of site access from the existing road network and some site grading. Capstone has completed the engineering evaluations and requested construction quotations for the early work and will begin construction in May 2020. This should ensure that the RCA will remain valid post July 2020. After issue of the RCA, modifications were identified at the port for the desalination plant and auxiliary facilities. These were included in an Environmental Impact Statement (DIA) submitted in September 2019; it is estimated that approval will be received in H2 2020. This 2019 DIA did not include the cobalt circuit, therefore the planned changes relating to the cobalt plant will require a new application. The cobalt circuit is planned to be located northeast of the copper concentrator area described in the approved EIA. The area where the cobalt circuit is projected to be built was previously characterized in the geological, hydrological and hydrogeological baseline studies for the EIA. However, given that the cobalt circuit will modify the original planned facilities, a new EIA (or DIA) will be required and must be approved by the SEA. It is likely that any additional baseline characterizations can be developed from the information in the original EIA or updated using secondary sources. This could include information on physical environment (climate, meteorology), hydrology/hydrogeology, geology, geomorphology and natural hazards, soils and the visual landscape. A preliminary analysis was completed to assess whether the transport of the sulphuric acid would change the type of environmental document required. A review of projects that involve the transportation of sulphuric acid, showed that most requested approval via a DIA. To date, approximately 700 permits have been identified that will be required to support operations. Sixteen of these are considered to be critical for timely construction and start-up. In January 2020 permits had been received for the WRF, exploitation method and mining process, process plant, TSF, port and the Closure Plan. Stakeholder identification has been conducted and communications such as open houses, open meetings, themed meetings for specialist interests and meetings with authorities, regional and community groups have been undertaken.

Santo Domingo Project Region III, Chile
NI 43-101 Technical Report
Page 1-47
March 2020
Project Number: C40029
The TSF is planned to be located approximately 2 km southeast of the process plant. It was designed for a total tailings storage capacity of approximately 196 Mm³ or 314 Mt at an estimated final overall average dry density of 1.6 t/m3. Water from the supernatant water pond will be recovered and recycled to the process throughout the operating life of the TSF. A large portion of the rain water from the catchment area above the TSF will be diverted around the TSF by a 3.7 km long channel. No characterization of the cobalt circuit tailings has been conducted to the present time. The neutralized leach residue, consisting primarily of hematite, will be combined with the iron circuit tailing. As a result of the roasting operation, the resulting overall tailings would possess a lower acid generation potential than would be the case in the absence of the cobalt circuit.
1.24.7 2020 PEA Markets and Contracts
Capstone has been shipping copper concentrate from the Pinto Valley Mine since 2013 and has established a reputation as a reliable supplier. Capstone’s Marketing Group is experienced and will establish and implement the marketing strategy for Santo Domingo’s copper concentrate offtake agreements. Kores has rights to purchase up to 50% of the annual production of copper and iron ore concentrates produced by the operation. Capstone will market and sell the remaining concentrate. The Kores terms and conditions will reflect the Capstone terms negotiated independently in the market. The Santo Domingo copper concentrate would generally be considered clean. Chlorine and fluorine are safely under the limits and if they are occasionally over the limit it is likely that only a nominal penalty would apply. For trading companies specializing in blending various complex copper concentrates a clean concentrate such as that from Santo Domingo would be in high demand. Santo Domingo will produce a high magnetite ultra-fine (UF) iron ore concentrate and will need to shortlist a number of potential pellet and/or sintering plants that can process the iron ore concentrate as a starting point of a campaign to contract suitable long-term offtakers. Capstone has made contact with Chinese iron ore processors in Hebei province at an early stage in order to start the process to have meaningful MOUs in place that can be developed into long-term offtake contracts. Each steel mill complex has its own level of tolerance in terms of impurities. The main levels of impurities as far as the magnetite concentrate is concerned are silica and copper. Copper is below the threshold but may in some circumstances represent a non-
Santo Domingo Project Region III, Chile
NI 43-101 Technical Report
Page 1-48
March 2020
Project Number: C40029
preferred feed; silica is only likely to be a cost factor or penalty element rather than a rejectable quality issue. The cobalt circuit will produce cobalt sulphate heptahydrate, sulphuric acid, copper sulphide precipitate and power. The expected market for cobalt sulphate would be Korea, Japan and Europe. The cobalt recovery circuit will generate a minor amount of by-product copper sulphide precipitate. For 2020 PEA purposes, it is assumed that the filtered copper sulphide precipitate will be combined with the copper concentrate for shipping. Although there are several operations near Santo Domingo that use sulphuric acid in copper leaching operations, the market for acid in Chile is normalized to Mejillones in Region II. The net power co-generation is assumed to be fed to the Santo Domingo operation as a partial supply and is treated as a credit for the operation. The 2020 PEA assumes the following commodity pricing: $3/lb Cu $1,280/oz Au $80/t Fe concentrate (based on 65% Fe) $20/lb Co.
1.24.8 2020 PEA Capital Cost Estimates
This capital cost estimate provides the total capital cost estimate for the 2020 PEA. Initial capital costs are estimated to be $2.18 billion, $1.51 billion related to the copper-iron-gold mine and processing facility and $665 M related to the additional cobalt plant. This includes a contingency of $197 M for the copper-iron-gold facility and a contingency of $133 M for the cobalt opportunity, resulting in a total contingency of $331 M. Capital cost estimates are presented at an overall cost accuracy of ±40%. The overall initial capital estimate is provided in Table 1-8. The sustaining capital estimate is $443 M.
Santo Domingo Project Region III, Chile
NI 43-101 Technical Report
Page 1-49
March 2020
Project Number: C40029
Table 1-8: 2020 PEA Initial Capital Cost Estimate (by Area)
Area Cost ($ M)
Mine 178 Process plant 448 Tailings and water reclaim 49 Plant infrastructure (on site) 82 Port 147 Port infrastructure (on site) 22 External infrastructure (off site) 143 Acid plant 144 Roast 122 Indirect costs 512 Contingency 331 Total 2,178
Note: Totals may not sum due to rounding.
1.24.9 2020 PEA Operating Cost Estimates
Operating costs are presented at an overall ±40% estimate accuracy. The overall assumptions for operating costs that apply to all areas (including mining) include: Costs are presented at end of 2019 US dollars, unless stated otherwise Costs are based on an exchange rate of CLP600 to $US1.00 An average burden rate of 25% has been applied to salaried and hourly labour
for social insurance, medical and insurance costs, pensions and vacation costs The average concentrate grade is 29% for copper and 65% for magnetite For the copper equivalent estimate, average life of mine prices of $3.00/lb
copper, $80/t magnetite concentrate and $20/lb cobalt were used. Operating costs for the 2020 PEA assume a maximum throughput of 65,000 t/d for the first 5 years and 60,000 t/d for subsequent years. The operating cost estimate by area is shown in Table 1-9.
Santo Domingo Project Region III, Chile
NI 43-101 Technical Report
Page 1-50
March 2020
Project Number: C40029
Table 1-9: 2020 PEA Operating Cost Estimate by Area
Area LOM Total ($ M)
LOM Average ($/t)
LOM Average ($/lb CuEq)
Process operating/plant 1,747 4.5 0.318 TSF and tailings water reclaim 38 0.1 0.007 Magnetite concentrate transport system 74 0.2 0.013 Desalinated water transfer system* 532 1.4 0.097 Magnetite filtration – port 93 0.2 0.017 Fe and Cu handling, storage and loading 90 0.2 0.016 Co process plant 562 1.4 0.102 Total process 3,137 8.0 0.571 G&A 417 1.1 0.076 Mining 2,620 6.7 0.477 Total 6,173 15.7 1.123
Note: Totals may not sum due to rounding.
The cost of copper concentrate land transport is included in the 2020 PEA economic analysis. The LOM operating cost is estimated at $6,173 M. The portion of the operating cost estimate that pertains to the cobalt plant is $576 M (an operating cost of approximately $38/t of roaster fed), this is included in the financial model from Year 3 of operations.
1.24.10 2020 PEA Economic Analysis
The 2020 PEA is preliminary in nature, is based on Mineral Resources that are not Mineral Reserves and do not have demonstrated economic viability. The results of the economic analysis represent forward-looking information that is subject to a number of known and unknown risks, uncertainties and other factors that may cause actual results to differ materially from those presented here. Forward-looking statements include, but are not limited to, statements with respect to future metal prices and concentrate sales contracts, the estimation of Mineral Resources, dilution and recovery assumptions in the subset of the Mineral Resources used in the 2020 PEA mine plan, the timing and amount of estimated future production, costs of production, capital expenditures, costs and timing of the development of mineralized zones, permitting time lines, requirements for additional

Santo Domingo Project Region III, Chile
NI 43-101 Technical Report
Page 1-51
March 2020
Project Number: C40029
capital, government regulation of mining operations, environmental risks, unanticipated reclamation expenses and title disputes. Additional risk can come from actual results of reclamation activities; conclusions of economic evaluations; changes in parameters envisaged in the 2020 PEA as mine and process plans continue to be refined; possible variations in tonnage, grade, or recovery rates; geotechnical considerations during mining; failure of plant, equipment, or processes to operate as anticipated; shipping delays and regulations; accidents, labour disputes and other risks of the mining industry; and delays in obtaining government approvals. The 2020 PEA has been evaluated using an 8% discounted cashflow (DCF) analysis on a non-inflated, after tax basis. The 2020 PEA cash flows consist of approximately 3 years of pre-production costs and 18 years of operations. To reflect the time value of money, annual NCF projections are discounted back to the present study valuation date of end 2019 using an 8% discount rate. The 2020 PEA was evaluated on an after-tax basis. On an after-tax basis, the cumulative net cash flow is $5,286 M, the IRR is 23% and the payback period is 3.5 years. Based on the assumptions discussed in the 2020 PEA, the cash flow analysis shows that the 2020 PEA will generate positive cash flows from the first full year of production onwards. A summary of the economic analysis is provided in Table 1-10 and the after-tax cash flow is illustrated in Figure 1-4. Table 1-10: 2020 PEA Economic Analysis Forecast
Summary of Cash Flow Unit Pre-tax After-tax
Cumulative net cash flow undiscounted net present value US$ M 7,695 5,286
Discounted at 4% US$ M 4,396 2,956 Discounted at 6% US$ M 3,349 2,214 Discounted at 8% US$ M 2,558 1,652 Discounted at 10% US$ M 1,953 1,222 Discounted at 12% US$ M 1,486 890 Internal rate of return % 28.1 23.0 Payback period Years 3.2 3.5

Santo Domingo Project Region III, Chile
NI 43-101 Technical Report
Page 1-52
March 2020
Project Number: C40029
Figure 1-4: 2020 PEA After-Tax Cash Flow
Note: Figure prepared by Wood, 2020
The C1 cash cost as defined by Wood McKenzie is stated below: “C1 Cash Costs are the costs of mining, milling and concentrating, on-site administration and general expenses, metal concentrate treatment and refining charges and freight and marketing costs less the net value of the by-product credits.”
In the calculation of all-in costs, by-product and co-product credits are included as a credit to operating costs. Both by-product (i.e. secondary metal sales treated as a reduction of cost of sales in the financial statements) and co-product (i.e. secondary metal sales reported as sales in the financial statements) credits are treated as a reduction of all in costs. The terms are defined below: C1 cash cost per pound of payable copper produced (by product basis) = C1 cash
costs: mine, mill, G&A operating costs, plus TC/RCs and selling costs less revenue (excluding copper revenue)
C1 cash cost (co-product basis) - Copper (per pound of payable copper equivalent produced) = C1 cash costs: mine, mill, G&A operating costs, plus TC/RCs and selling costs less revenue (excluding copper, iron and cobalt revenue). Payable copper equivalent production: Payable copper production plus (iron and cobalt revenue divided by the copper price) - this converts the iron and cobalt production into copper equivalent units using the relative dollar values as the conversion factor
C1 cash costs (co-product basis) - Magnetite iron concentrate (per tonne of iron equivalent production) = C1 cash costs: mine, mill, G&A operating costs, plus
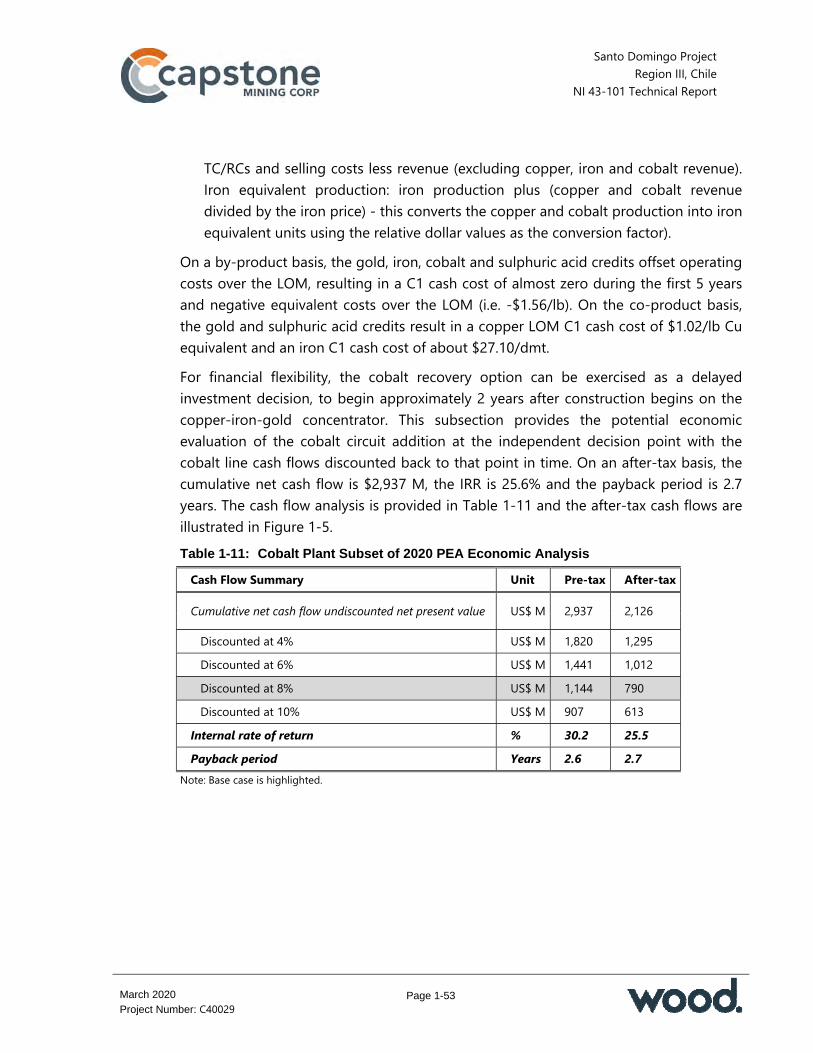
Santo Domingo Project Region III, Chile
NI 43-101 Technical Report
Page 1-53
March 2020
Project Number: C40029
TC/RCs and selling costs less revenue (excluding copper, iron and cobalt revenue). Iron equivalent production: iron production plus (copper and cobalt revenue divided by the iron price) - this converts the copper and cobalt production into iron equivalent units using the relative dollar values as the conversion factor).
On a by-product basis, the gold, iron, cobalt and sulphuric acid credits offset operating costs over the LOM, resulting in a C1 cash cost of almost zero during the first 5 years and negative equivalent costs over the LOM (i.e. -$1.56/lb). On the co-product basis, the gold and sulphuric acid credits result in a copper LOM C1 cash cost of $1.02/lb Cu equivalent and an iron C1 cash cost of about $27.10/dmt. For financial flexibility, the cobalt recovery option can be exercised as a delayed investment decision, to begin approximately 2 years after construction begins on the copper-iron-gold concentrator. This subsection provides the potential economic evaluation of the cobalt circuit addition at the independent decision point with the cobalt line cash flows discounted back to that point in time. On an after-tax basis, the cumulative net cash flow is $2,937 M, the IRR is 25.6% and the payback period is 2.7 years. The cash flow analysis is provided in Table 1-11 and the after-tax cash flows are illustrated in Figure 1-5. Table 1-11: Cobalt Plant Subset of 2020 PEA Economic Analysis
Cash Flow Summary Unit Pre-tax After-tax
Cumulative net cash flow undiscounted net present value US$ M 2,937 2,126
Discounted at 4% US$ M 1,820 1,295 Discounted at 6% US$ M 1,441 1,012 Discounted at 8% US$ M 1,144 790 Discounted at 10% US$ M 907 613 Internal rate of return % 30.2 25.5 Payback period Years 2.6 2.7
Note: Base case is highlighted.

Santo Domingo Project Region III, Chile
NI 43-101 Technical Report
Page 1-54
March 2020
Project Number: C40029
Figure 1-5: After-Tax Cash Flow for Cobalt Project Subset of 2020 PEA
Note: Figure prepared by Wood, 2020
1.24.11 2020 PEA Sensitivity Analysis
A sensitivity analysis was performed on the financial model taking into account variations in metal price (copper, iron, gold and cobalt); operating costs (including power); capital costs and exchange rates. Figure 1-6 shows the sensitivity of the IRR and Figure 1-7 shows the sensitivity of the NPV8%. Sensitivities to copper and iron grades are not shown, because changes in copper and iron grades are mirrored by the sensitivities to changes in the copper and iron prices, respectively. The analysis shows that the 2020 PEA NPV8% is most sensitive to changes in the copper price (copper grade) and in total operating and capital expenditures. The sensitivity analysis showed that the 2020 PEA is less sensitive to changes in the iron price (iron grade) and the dollar/peso exchange rate and least sensitive to changes in power costs. Because the 2020 PEA is priced in US dollars, the effects of exchange rate variation other than the CLP do not apply in the current model, although in reality some equipment, supplies and services may be priced in other currencies such as the Euro.

Santo Domingo Project Region III, Chile
NI 43-101 Technical Report
Page 1-55
March 2020
Project Number: C40029
Figure 1-6: 2020 PEA After-Tax Sensitivity of IRR
Note: Figure prepared by Wood, 2020
Figure 1-7: 2020 PEA After-Tax Sensitivity of NPV8% ($ x 1,000)
Note: Figure prepared by Wood, 2020

Santo Domingo Project Region III, Chile
NI 43-101 Technical Report
Page 1-56
March 2020
Project Number: C40029
1.25 Recommendations 1.25.1 Overview
Recommendations are presented in the following sub-sections, broken down by QP recommendation, and can be completed concurrently. The total budget required to complete the proposed work programs is in the range of $5.6 M to $6.8 M.
1.25.2 RPA Recommendations RPA recommends about $300,000 to $350,000 of third-party consultant work, to review the mineralogy and mode of occurrence of cobalt, a study to better characterize the mineral types in the model for geometallurgical purposes, including more definition of the oxide material types, and to certify reference materials for cobalt. If, on the basis of the cobalt studies, it is determined that new mineralization wireframes are required, $100,000 to $125,000 should be budgeted.
1.25.3 Knight Piésold Recommendations Knight Piésold recommends that the following work is conducted: Update the site climatic and hydrologic databases with the latest hydrological
events in the area and revise the water balance model and water management and diversion plans if needed. Use a risk management basis to determine the size of the temporary extreme event water storage capacity for the 72-hour PMP
Determine the final limits of the geomembrane liner within the TSF impoundment based on the updated water balance and supernatant pond predictions
Assess the need for a deeper cut-off trench to anchor the geomembrane liner Assess the sensitivity of the tailings deposit plans to a flatter tailings beach slope
than the current design and make any accommodations for this Develop a detailed monitoring plan including for piezometers in and under the
embankments and basin Complete additional tailings tests on new samples to confirm or modify the in-
storage density and consolidation characteristics Conduct a large scale triaxial test on a representative sample of construction
materials for the TSF dams to confirm the characteristics of the material, integrate the results of the tailings and large triaxial tests into the overall TSF design
Santo Domingo Project Region III, Chile
NI 43-101 Technical Report
Page 1-57
March 2020
Project Number: C40029
Update the stability analyses to include the effects of locally saturated zones in and under the dam including earthquake induced deformation numerical analyses
Conduct field testing for soluble salts content in the dam foundation and adjust the foundation excavation and preparation plans based on the results.
The engineering and testing costs associated with this work is expected to be approximately in the range of $595,000 to $785,000.
1.25.4 Wood Recommendations Additional bench-scale metallurgical testwork and a pilot plant testwork program are recommended to optimize plant operation and potentially reduce operating costs. The recommended pilot plant is designed to be conducted prior to the completion of the basic engineering stage. The bench-scale testwork is estimated to be $300,000–$500,000. Depending on the number of physical tests completed as part of the plant optimization runs, the pilot plant costs could range from $300,000 to $1 M. The following should be reviewed or conducted: water crossing permit applications should be submitted to the authorities prior to the commencement of earthworks in sensitive areas due to the length of the approval process; installations approved in the EIA may overlap with new installations belonging to third parties and modifications may be required to approved locations for linear works (such as the pipeline route); ,baseline information will need to be updated for the cobalt circuit installation and the transport route for sulphuric acid. This work will require about $870,000 to complete. It is recommended that the design be updated in the next phase of work to allow for the decrease in the P80 from 180 microns to 150 microns.
1.25.5 Gregg Bush and MPlan Recommendations Recommendations include trade-off studies, laboratory testing for process optimization and roasting, SX/crystallization testing and small-scale piloting and engineering activities to support process definition. These recommendations are to support development of the cobalt plant proposed in the 2020 PEA. The budget required is about $2.8 M.
1.25.6 Brass Recommendations Brass recommends $335,000 of work, consisting of soil characterization testing, hydrological surveys of water crossing area and additional slurry testing to better simulate the final slurry product.

Santo Domingo Project Region III, Chile
NI 43-101 Technical Report
Page 2-1
March 2020
Project Number: C40029
2.0 INTRODUCTION
2.1 Introduction
Amec Foster Wheeler Ingeniería y Construcción Limitada, a Wood company (Wood), was commissioned by Capstone Mining Corp. (Capstone) to prepare a technical report (the Report) on two alternative development options for the Santo Domingo property (the Property), located in the Atacama Region (Region III) of the Republic of Chile. The Property location is shown in Figure 2-1. The firms and consultants who are responsible for the content of this Report are, in alphabetical order, Aminpro Chile SPA (Aminpro), Gregg Bush, Brass Chile SA (Brass), Knight Piésold S.A. (Knight Piésold), MPlan International (MPlan), NCL Ltda (NCL), Roscoe Postle Associates Inc. (RPA), Sunrise Americas LLC (Sunrise Americas) and Wood. The Property is held 70% by Capstone and 30% by Korea Resources Corporation (Kores). The companies use an operating entity, Minera Santo Domingo SCM (MSD), as the Chilean holding company for the Property.
2.2 Terms of Reference
The Report is prepared in support of Capstone’s press release dated 19 February 2020 entitled “Capstone Presents a Robust Cobalt Production Option to the Santo Domingo 2019 Technical Report with a 2020 Preliminary Economic Assessment”. The term “Property” is used in reference to the overall mineral tenure holdings. A technical report on a feasibility study update was issued with an effective date of 26 November 2018, that was filed on 3 January 2019 (referred to as the 2019 Technical Report). The information on the study remains current, and the results are is presented in Sections 15 to 22 of this Report. This study contemplates conventional open pit mining, feeding a conventional process plant to produce copper–gold and iron concentrates. A preliminary economic assessment (PEA) was completed in 2020 (2020 PEA). The 2020 PEA envisages an alternative development option, consisting of conventional open pit mining, production of copper and iron concentrates via a conventional process plant and production of battery-grade cobalt sulphate via roasting. The cobalt plant will
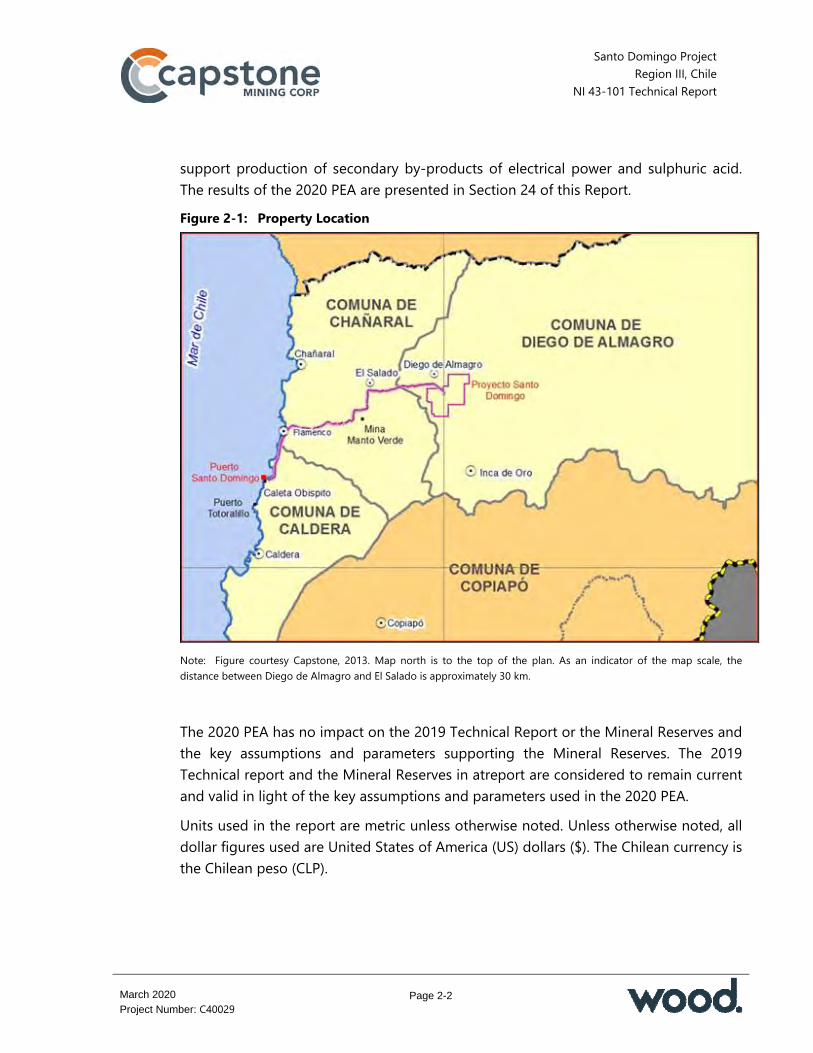
Santo Domingo Project Region III, Chile
NI 43-101 Technical Report
Page 2-2
March 2020
Project Number: C40029
support production of secondary by-products of electrical power and sulphuric acid. The results of the 2020 PEA are presented in Section 24 of this Report. Figure 2-1: Property Location
Note: Figure courtesy Capstone, 2013. Map north is to the top of the plan. As an indicator of the map scale, the distance between Diego de Almagro and El Salado is approximately 30 km.
The 2020 PEA has no impact on the 2019 Technical Report or the Mineral Reserves and the key assumptions and parameters supporting the Mineral Reserves. The 2019 Technical report and the Mineral Reserves in atreport are considered to remain current and valid in light of the key assumptions and parameters used in the 2020 PEA. Units used in the report are metric unless otherwise noted. Unless otherwise noted, all dollar figures used are United States of America (US) dollars ($). The Chilean currency is the Chilean peso (CLP).
Santo Domingo Project Region III, Chile
NI 43-101 Technical Report
Page 2-3
March 2020
Project Number: C40029
Mineral Resources and Mineral Reserves are reported in accordance with the Canadian Institute of Mining, Metallurgy and Petroleum (CIM) Definition Standards for Mineral Resources and Mineral Reserves (May 2014; the 2014 CIM Definition Standards). Years discussed in the mine and production plan and in the economic analysis are presented for illustrative purposes only, as no decision has been made on mine construction by Capstone. Years discussed in the 2020 PEA are also presented for illustrative purposes only. Amec and Amec Foster Wheeler Ingeniería y Construcción Limitada (Amec Foster Wheeler) are predecessor companies to Wood. Where work was specifically undertaken by Amec or Amec Foster Wheeler, that name is used in the Report. For all other purposes in this Report, the name Wood is used to refer to both Wood and predecessor Amec/Amec Foster Wheeler companies.
2.3 Qualified Persons
The following are the qualified persons responsible for the contents of this Technical Report as that term is defined in National Instrument 43-101, Standards of Disclosure for Mineral Projects and for preparing the Technical Report in compliance with Form 43-101F1: Ms. Joyce Maycock, P. Eng., Project Manager, Wood Santiago Mr. Antonio Luraschi, CMC, Manager of Metallurgical Development, Wood
Santiago Mr. Marcial Mendoza, CMC, Supervising Engineer Process and Technology, Wood
Santiago Dr. Mario Bianchin, P. Geo., Senior Associate Hydrogeologist, Wood Vancouver Mr. David Rennie, P. Eng., Associate Principal Geologist, RPA Vancouver Mr. Carlos Guzman, CMC, FAusIMM, Principal and Project Director, NCL Santiago Mr. Roger Amelunxen, P. Eng., Business Director, Aminpro Mr. Michael Gingles, QP MMSA, Principal, Sunrise Americas Mr. Thomas F. Kerr, P. E., P. Eng., Principal Consultant, Knight Piésold Mr. Roy Betinol, P. Eng., Regional Director, Brass Mr. Lyn Jones, P. Eng., MPlan
Santo Domingo Project Region III, Chile
NI 43-101 Technical Report
Page 2-4
March 2020
Project Number: C40029
Mr. Gregg Bush, P. Eng., Consultant. 2.4 Site Visits and Scope of Personal Inspection
Mr. Rennie visited the Property from 14 to 16 June 2010 and again from 14 to 15 June 2012. During the visits, Mr. Rennie reviewed the geological setting of the deposits and viewed drilling operations and drill core. Mr. Rennie’s site visit is still considered current as there has been little drilling activity on the Property since 2012. Mr. Guzman visited the Property on 15 October 2013 and again on 29 October 2018. During the visits he inspected the area planned for the mine and process infrastructure to assess topography and reviewed the layout and general site overview with respect to mine planning and execution. He also viewed drill core. Mr. Gingles visited the Property on 11 October 2018. During the visit he reviewed the area planned for the mine site, including the open pit, process plant and tailings storage facility (TSF) locations, reviewed the storage facilities in Diego de Almagro (storage of diamond core, reverse circulation (RC) drilling samples and metallurgical samples), reviewed the area planned for the port site and made a general review of the regional infrastructure that would be available to support the development options. Mr. Kerr visited the Property on 24 October 2013. During this visit he viewed the area proposed for the TSF and assessed the topography and general ground conditions. Mr. Bush visited the Property five times between 2012 and 2019, with the most recent visit being on 7 August 2019. During this visit he gathered information concerning neighboring facilities. Previous visits had varying purposes, including surveying regional infrastructure, inspecting the core storage facility, site evaluation for facilities layout, assessment of potential environmental/social aspects and information exchange with regional authorities.
2.5 Effective Dates
The Report has a number of effective dates as follows: Date of supply of last assay data used in resource estimation: 30 June 2012 Date of Mineral Resource estimates: 13 February 2020 Date of Mineral Reserve estimate: 14 November 2018 Date of the financial analysis supporting the 2020 PEA: 19 February 2020.
Santo Domingo Project Region III, Chile
NI 43-101 Technical Report
Page 2-5
March 2020
Project Number: C40029
The effective date of the Report is taken to be the date of the 2020 PEA economic analysis and is 19 February 2020.
2.6 Information Sources and References
Information sources supporting the Report include the 2014 feasibility study, 2019 Technical Report completed in 2018 and memoranda and other documents prepared to support the 2020 PEA.
Information used to support this Report was also derived from previous technical reports on the Santo Domingo property (Section 2.8), from the sources listed in Section 2.7, from expert documents cited in Section 3 and from the reports and documents listed in Section 27. Additional information was sought from Capstone personnel where required.
Mr. Tom Kerr, the Knight Piésold QP, has relied upon information supplied by Solange Gantenbein, Environmental Manager of the Knight Piésold S.A., Santiago, Chile, office on environmental, permitting and social issues that was used in support of the information presented in Section 20 of the Report. Information from Mrs. Gantenbein was further reviewed on behalf of Mr. Kerr by Chris Brodie, R.P.Bio., Environmental Manager of the Knight Piésold office in Vancouver, Canada. Mr. Luis Rebolledo, Project Director Engineering for Knight Piésold S.A., Santiago, Chile, was relied upon by Mr. Kerr for aspects of the TSF engineering design and cost estimates pertaining to the tailings facilities and the estimated closure and reclamation costs. Mr. Roy Betinol, the Brass QP, has relied upon information provided by Mr. Jose Escarate, Civil Engineer with Brass; this information is used in Section 18.2.4 and Section 18.9. Mr. Escarate visited the site from 14 to 17 May 2013 to select and define the proposed route for the water and concentrate pipelines. A second visit was made by Mr. Escarate on 4 June 2013 to review the planned routing as modifications had been made to avoid critical areas. This specialist information on the pipeline route was provided to Mr. Betinol for use in the Report. Mr. Antonio Luraschi of Wood has relied upon information provided by Ghisolfo staff on the proposed transport route for copper concentrate; this information is used in Section 18.2.3. Three Ghisolfo staff, Mr. Franscisco Ghisolfo, Mr. Alvaro Fernandez and Mr. Daniel Pizarro, visited the Property from 27 to 30 June 2013 and reviewed the routes planned for transport of copper concentrate through the towns of Diego de

Santo Domingo Project Region III, Chile
NI 43-101 Technical Report
Page 2-6
March 2020
Project Number: C40029
Almagro, El Salado and Chañaral. This specialist information on the concentrate transport route was provided to Mr. Luraschi for use in the Report.
2.7 Previous Technical Reports
Capstone has filed the following technical reports on the Santo Domingo property: Maycock, J., Luraschi, A., Mendoza, M., Bianchin, M., Rennie, D., Guzman, C.,
Amelunxen, R., Gingles, M., Kerr, T., and Betinol, R., 2018: Santo Domingo Project, Region III, Chile, NI 43-101 Technical Report on Feasibility Study Update: technical report prepared by Amec Foster Wheeler International Ingeniería y Construcción Limitada, Roscoe Postle Associates Inc., NCL Ltda, Aminpro Chile SPA, Sunrise Americas LLC, Knight Piésold S.A., and Brass Chile SA for Capstone Mining Corp., effective date 26 November, 2018
Maycock, J., Gopfert, H., Rennie D., Guzman, C., Frost, D., Kerr, T., Betinol, R., Klimek, A., and Khera V., 2014: Santo Domingo Project, Region III, Chile, NI 43-101 Technical Report on Feasibility Study: technical report prepared by Amec International Ingeniería y Construcción Limitada, Roscoe Postle Associates Inc., NCL Ltda, Knight Piésold and Co., and Brass Chile SA, effective date 22 May 2014
Brimage, D., Rennie, D., Nilsson, J., Winkers, A., and Davies, M., 2011: Technical Report on the Santo Domingo Project, Chile: unpublished report prepared by Ausenco Minerals and Metals, Roscoe Postle Associates Inc., Nilsson Mine Services Ltd., Arthur H. Winckers & Associates Mineral Processing Consulting Inc., and Amec Environment & Infrastructure for Capstone Mining Corp., effective date 28 September 2011
Rennie, D., 2010: Technical Report on The Santo Domingo Property, Region III, Atacama Province, Chile, NI 43-101 Report: unpublished report prepared by Scott Wilson Roscoe Postle Associates for Far West Mining Ltd, re-addressed to Capstone Mining Corp., effective date 26 August 2010.
Far West Mining Ltd. (Far West), a predecessor company to Capstone, filed the following technical reports: Allen, G.J., 2004: Report on the 2003 Exploration Activities in the 4c Santo Domingo
Area of the Candelaria Project, Region III, Chile: unpublished report prepared by Far West Mining Ltd

Santo Domingo Project Region III, Chile
NI 43-101 Technical Report
Page 2-7
March 2020
Project Number: C40029
Allen, G.J., 2005: Report on the Exploration Activities in the 4a Santo Domingo Area of the Candelaria Project, Region III, Chile: unpublished report prepared by Far West Mining Ltd., effective date 31 July 2005
Allen, G.J., and Höy, T., 2005: Exploration Activities in the 4a (Santo Domingo) Area of the Candelaria Project, Region III, Chile: unpublished report prepared by Far West Mining Ltd., effective date 10 December 2005
Penner, R., Lacombe, P., Maycock, T., and Henry, E., 2008: Review of the Santo Domingo Sur and Iris Project, Region III, Chile: unpublished report prepared by Amec International (Chile) S.A. for Far West Mining Ltd., effective date 30 April 2008
Lacroix, P.A., 2006: Technical Report on the 4A (Santo Domingo) Area of the Candelaria Project, Region III, Chile: unpublished technical report prepared by Roscoe Postle Associates Inc. for Far West Mining Ltd., effective date 13 June 2006
Lacroix, P.A., and Rennie, D.W., 2007: Technical Report on the 4A (Santo Domingo) Area of the Candelaria Project, Region III, Atacama Province, Chile: unpublished technical report prepared by Roscoe Postle Associates Inc. for Far West Mining Ltd., effective date 19 October 2007
Lacroix, P.A., 2009: Technical Report on the Santo Domingo Property, Region III, Chile: unpublished technical report prepared by Roscoe Postle Associates Inc. for Far West Mining Ltd., effective date 4 June 2009
Rennie, D., 2010: Technical Report on the Santo Domingo Property, Region III, Atacama Province, Chile, NI 43-101 Report: unpublished report prepared by Scott Wilson Roscoe Postle Associates for Far West Mining Ltd effective date 26 August 2010.
Santo Domingo Project Region III, Chile
NI 43-101 Technical Report
Page 3-1
March 2020
Project Number: C40029
3.0 RELIANCE ON OTHER EXPERTS
3.1 Introduction
The QPs have relied upon the following other expert reports, which provided information regarding mineral rights, surface rights, property agreements and marketing sections of this Report as noted below.
3.2 Property Ownership
The QPs have not reviewed the Property ownership, nor independently verified the ownership legal status. The QPs have fully relied upon and disclaim responsibility for, information derived from Capstone experts through the following document: Capstone, 2020: MSD Ownership Structure: Written communication from
Capstone to Wood, 7 January 2020. This information is used in Section 4 of the Report. It is also used in support of the Mineral Resource statement in Section 14, the Mineral Reserve statement in Section 15 and the economic analysis result in Section 22 and Section 24.9.
3.3 Mineral Tenure, Rights of Way and Easements
The QPs have not reviewed the mineral tenure, nor independently verified the legal status, ownership of the Property, underlying property agreements or permits. The QPs have fully relied upon, and disclaim responsibility for, information derived from Capstone experts and experts retained by Capstone for this information through the following documents: Maria Elizabeth Orrego Espinosa (Abogados): Propiedad Minera – Minera Santo
Domingo SCM: legal opinion prepared for Minera Santo Domingo, 17 December 2019
Maria Elizabeth Orrego Espinosa (Abogados): Informe de Titulos Concesiones Mineras MSD: legal opinion prepared for Minera Santo Domingo, December 2019
Quinzio & Anriquez Novoa (Abogados): Terrenos Superficiales y Servidumbres MSD: legal opinion prepared for Minera Santo Domingo, 5 December 2019

Santo Domingo Project Region III, Chile
NI 43-101 Technical Report
Page 3-2
March 2020
Project Number: C40029
Quinzio & Anriquez Novoa (Abogados): Terrenos Superficiales y Servidumbres MSD – Informe Anexo: legal opinion prepared for Minera Santo Domingo, 5 December 2019.
This information is used in Section 4 of the Report. It is also used in support of the Mineral Resource statement in Section 14, the Mineral Reserve statement in Section 15 and the economic analysis result in Section 22 and Section 24.9.
3.4 Taxation
The QPs have fully relied upon and disclaim responsibility for, information supplied by Capstone staff and experts retained by Capstone for information related to taxation as applied to the financial model as follows: Ernst and Young, 2018: Final Report Review of Tax Aspects of the Financial Model,
dated 12 November 2018. This information is used in the financial model in Section 22 and Section 24.9 of the Report.
3.5 Commodity Markets
The QPs have fully relied upon, and disclaim responsibility for, information supplied by experts retained by Capstone for copper marketing and pricing through the following documents: Wood Mackenzie, 2019: Long-Term Copper Outlook, Q4 Update: report prepared
by Wood Mackenzie, December 2019, 29 p. Wood Mackenzie, 2020: Global Copper Short-Term Outlook, February 2020:
report prepared by Wood Mackenzie, February 2020, 37 p. This information is used in Sections 19 and 22 of the Report and in support of the Mineral Reserve statement in Section 15. It is also used in Section 24.6 and Section 24.9 of the Report in support of the 2020 PEA. Metals price forecasting is a specialized business requiring knowledge of supply and demand, economic activity and other factors that are highly specialized and requires an extensive global database that is outside of the pervade of a QP. The QPs consider it reasonable to rely upon Wood Mackenzie as the company provides up-to-date, in-depth insight and analysis into all facets of the metals industry,

Santo Domingo Project Region III, Chile
NI 43-101 Technical Report
Page 3-3
March 2020
Project Number: C40029
including production supply and costs as well as consumption demand, and metal price forecasts. The QPs have fully relied upon, and disclaim responsibility for, information supplied by experts retained by Capstone for the iron fines pricing and markets in Asia, as follows: Trotter, D.J., 2018: Pellet Feed Market Characterization and Forward Pricing
Outlook for Capstone Mining Corporation: report prepared for Capstone, September 2018.
This information is used in Sections 19 and 22 of the Report and in support of the Mineral Reserve statement in Section 15. It is also used in Section 24.6 and Section 24.9 of the Report in support of the 2020 PEA. The QPs consider it reasonable to rely upon the information provided by Mr Trotter for iron ore concentrate. Mr. Trotter is a global iron ore and pellet feed consultant, with significant experience in sales and marketing for major iron-producing companies, including BHP Billiton, Fortescue Metals Group and Anglo American. Mr Trotter has been involved with sales and technology for marketing, trading and technical development in iron ore, metals and concentrate organizations across European, Chinese, Indian, American and globally-developing markets. The QPs were able to review Mr. Trotter’s report. The QPs have fully relied on, and disclaim responsibility for, the following document for marketing and pricing assumptions related to cobalt, cobalt intermediate products and cobalt battery raw materials: Darton Commodities Limited, February 2019: Cobalt Market Review 2018-2019.
This information is used in Section 24.6.4 and Section 24.9 of the Report. The QPs consider it reasonable to rely on the information provided by Darton Commodities for the cobalt marketing assumptions used in this report because Darton is recognized within the cobalt industry as having access to global production data and import/export statistics. Darton Commodities is one of the largest, independent, specialized full-service cobalt metal suppliers operating globally. The company focuses on the cobalt market, is considered to be an industry authority in cobalt market research and analysis and is a leading specialist supplier of cobalt metal products. Darton Commodities produces an annual publication (Cobalt Market Review) that is generally considered to be the
Santo Domingo Project Region III, Chile
NI 43-101 Technical Report
Page 3-4
March 2020
Project Number: C40029
leading cobalt research paper. The Cobalt Market Review is compiled from a combination of first-hand and in-depth market intelligence; it provides a detailed up-to-date overview of cobalt supply and demand factors, including global production data, export/import statistics, consumption data and trends and price forecasts.
3.6 Sulphuric Acid Pricing
The QPs have fully relied on, and disclaim responsibility for, information in the following document on the sulphuric acid pricing and marketing assumptions: Chilean Copper Commission (Cochilco), 2018: Mercado Chileno del Ácido Sulfúrico
al Año 2027: Chilean Copper Commission publication, 40 p. This information is used in Section 24.6.4 and Section 24.9 of the Report. The QPs consider it reasonable to rely upon the information provided by Cochilco on the Chilean sulphuric acid market because Cochilco is the research and policy planning department of the Chilean Copper Commission, and a standing component of its work is to regularly review the status of the Chilean sulphuric acid market, and report on markets of relevance to sustainable mining development in Chile. The reports are used by sulphuric acid producers, consumers, traders, logistics services provider and regulators to provide the best overview of the sulphuric acid pricing trends in Chile.
Santo Domingo Project Region III, Chile
NI 43-101 Technical Report
Page 4-1
March 2020
Project Number: C40029
4.0 PROPERTY DESCRIPTION AND LOCATION
4.1 Introduction
The portion of the Santo Domingo Property that hosts the Santo Domingo deposits and will host the mine and plant site areas is located approximately 5 km southeast of the town of Diego de Almagro in the province of Diego de Almagro in the Atacama Region of northern Chile. This area was originally part of the BHP’s Candelaria project area which consisted of eight non-contiguous concessions along a north–south corridor that stretched between the towns of Taltal in the north to a point about 75 km south of the city of Copiapó. The centre of the Santo Domingo property is approximately 398,000E and 7,074,000N (datum: PSAD 56, Zone 19S).
4.2 Property and Title in Chile
Information in this subsection is based on data in the public domain and Chilean law (Chilean Civil Code, Chilean Mining Code, Chilean Tax Law, Fraser Institute, 2017) and has not been independently verified by the QPs.
4.2.1 Regulations
The mining industry is regulated by the following laws: Constitution of the Republic of Chile Constitutional Organic Law of Mining Code and Regulations governing Mining Code and Regulations governing Water Rights Laws and Regulations governing Environmental Protection as related to mining.
Chile’s mining policy is based on legal provisions that were enacted as part of the 1980 constitution. These were established to stimulate the development of mining and to guarantee the property rights of both local and foreign investors. According to the law, the state owns all mineral resources, but exploration and exploitation of these

Santo Domingo Project Region III, Chile
NI 43-101 Technical Report
Page 4-2
March 2020
Project Number: C40029
resources by private parties is permitted through mining concessions, which are granted by the courts. The concessions grant both rights and obligations, as defined by the Constitutional Organic Law on Mining Concessions (JGRCh, 1982) and the Mining Code (JGRCh, 1983). Many of the steps involved in the constitution of the mining concession are published weekly in Chile’s official mining bulletin for the relevant region as are court processes due to conflicting claims.
4.2.2 Mineral Tenure
The concessions have both rights and obligations as defined by a Constitutional Organic Law (enacted in 1982). Concessions can be mortgaged or transferred and the holder has full ownership rights and is entitled to obtain the rights of way for exploration and exploitation. In addition, the concession holder has the right to defend ownership of the concession against the state and third parties. A concession is obtained by a claim filing and includes all minerals that may exist within its area. Exploitation concessions are valid indefinitely and are subject to the payment of annual fees. Once an exploitation concession has been granted, the owner can remove materials for sale. There is a mining tax that provides protection of rights; it is calculated as a percentage of the Unidad Tributaria Mensual (UTM or monthly tax unit) and applies to each hectare of land included in the mining exploration and/or mining exploitation concessions. This tax is paid annually in a single payment before 31 March of each year. For mining exploitation concessions, the tax rate is currently 10% of a UTM per hectare; for mining exploration concessions the tax rate is currently 2% of a UTM per hectare. The value of the UTM is adjusted monthly according to the consumer price index (IPC) in Chile. At each of the stages of the claim acquisition process, several steps are required, a full description of the process is documented in Chile’s mining code. Many of the steps involved in establishing the claim are published in Chile’s official mining bulletin for the appropriate region (published weekly). Most companies in Chile retain a mining claim specialist to review the weekly mining bulletins and ensure that their land position is kept secure.
Santo Domingo Project Region III, Chile
NI 43-101 Technical Report
Page 4-3
March 2020
Project Number: C40029
Legislation is being considered that seeks to further streamline the process for better management of natural resources. Under the new proposed law, mining and exploration companies will have to declare their reserves and resources and report drilling results. The legislation also aims to facilitate funds for mining projects across the country. In addition to the mining law, the Organic Constitutional Law on Mining Concessions (1982) and the Mining Code of 1983 are the two key mechanisms governing mining activities in Chile.
4.2.3 Surface Rights
Ownership rights to the sub-soil are governed separately from surface ownership. Articles 120 to 125 of the Chilean Mining Code regulate mining easements. The Mining Code grants to the owner of any mining exploitation or exploration concessions full rights to use the surface land, provided that reasonable compensation is paid to the owner of the surface land.
4.2.4 Rights of Way
The Mining Code also grants the holder of the mining concession general rights to establish a right of way (RoW), subject to payment of reasonable compensation to the owner of the surface land. Rights of way are granted through a private agreement or legal decision which indemnifies the owner of the surface land. A RoW must be established for a particular purpose and will expire after cessation of activities for which the right of way was obtained. The owners of mining easements are also obliged to allow owners of other mining properties the benefit of the RoW, as long as this does not affect their own exploitation activities.
4.2.5 Water Rights
Article 110 of the Chilean Mining Code establishes that the owner of record of a mining concession is entitled, by operation of law, to use waters found in the works within the limits of the concession, as required for exploratory work, exploitation and processing, according to the type of concession the owner might engage in. These rights are inseparable from the mining concession. Water is considered part of the public domain and is considered to be independent of the land ownership. Individuals can obtain the rights to use public water in accordance with the Water Code. In accordance with the Code (updated in 1981), water rights are
Santo Domingo Project Region III, Chile
NI 43-101 Technical Report
Page 4-4
March 2020
Project Number: C40029
expressed in litres per second (L/s) and usage rights are granted on the basis of total water reserves.
4.2.6 Environmental Regulations
Environmental impact statements are required for projects such as dams, thermo-electric and hydroelectric plants, nuclear power plants, mining, oil and gas, roads and highways, ports, development of real estate in congested areas, water pipelines, manufacturing plants, forestry projects, sanitary projects, production, storage and recycling of toxic and flammable and hazardous substances. Developments not covered by these categories must submit a sworn statement of environmental impact indicating that the project or activity does not affect the environment and does not violate environmental laws. All projects must be approved by the national Environmental Evaluation Service (Servicio de Evaluación Ambiental, SEA) and regional sectorial authorities. Decree No. 40/2012, 30 October 2012 Regulations for the System of Environmental Impact Assessment (Reglamento del Sistema de Evaluación de Impacto Ambiental, RSEIA) was approved and published in the Official Gazette on 12 August 2013. In general terms, the new regulation updates the assessment procedure in accordance with the legal and regulatory changes enacted in Chile from 2001 to date. It redefines the information that must be submitted when entering an Environmental Impact Statement (EIA) or an Environmental Impact Declaration (DIA), seeking to give greater certainty to those regulated and to the citizens. The RSEIA seeks to make assessments early, to raise the standard of information and evaluation and to reduce time to complete the process. The changes are consolidated in Law 19.300, especially with regard to public participation in EIAs. Indigenous consultation is included for projects entering the system, complying with ILO Agreement 169 in force in Chile since 2009.
4.2.7 Land Use
Chile’s zoning and urban planning are governed by the General Law of Urban Planning and Construction (Ley General de Urbanismo y Construcción). This law contains several administrative provisions that are applicable to different geographical and hierarchical levels and sets specific standards for both urban and inter-urban areas. In addition to complying with the Environmental Law (Ley Ambiental) and other legal environmental requirements, projects must also comply with urban legislation
Santo Domingo Project Region III, Chile
NI 43-101 Technical Report
Page 4-5
March 2020
Project Number: C40029
governing the different types of land use. Land use regulations are considered part of the Chilean environmental legal framework. Land use regulatory requirements are diverse and operate at different levels, the main instruments are the inter-community regulatory plans (Planes Reguladores Intercomunales, PRI) and the community regulatory plans (Planes Reguladores Comunales, PRC). The PRIs regulate territories of more than one municipality, including urban and rural territory.
4.2.8 Closure Considerations
Law 20.551, Law of Mine Closure, enacted in October 2011, took effect in November 2012 and imposes on the mining industry the obligation to execute closure of its operations, incorporating closure as part of the life cycle of a mining project. To comply with these regulations, the owner of the project must submit a Closure Plan to Sernageomin, prior to starting construction of a mining project, with an approval procedure that depends on the mine capacity. The main procedure is applicable to mining projects with a mine capacity greater than 10,000 tonnes per month. A simplified procedure is allowed for projects with a mine capacity equal to or less than 10,000 tonnes per month or which are exploration projects. The differences between these procedures are the type of information required to be submitted for evaluation of the Closure Plan. Closure Plans for larger operations must provide more detailed information and must also provide a monetary guarantee to ensure the full and timely compliance with the Closure Plans. The guarantee must cover the costs of the measures associated with closure and post-closure. To comply with the Closure Plan, the execution of any closure activities and an update of the Closure Plan must be audited every 5 years, as a complementary instrument of control by Sernageomin. For smaller mining projects or exploration projects that are subject to the simplified procedure, no financial guarantee is required and no audit of the Closure Plan is needed. The following are the requirements for the guarantee: The amount of the guarantee must cover the total value of the cost for the Closure
Plan including post-closure and is determined by an estimate of the current costs of the plan. The guarantee is periodically updated

Santo Domingo Project Region III, Chile
NI 43-101 Technical Report
Page 4-6
March 2020
Project Number: C40029
The guarantee must be paid in full within the first two-thirds of the estimated life of the project if less than 20 years, or within a period of 15 years if the estimated life of the project is more than 20 years
The payment of the guarantee must begin within the first year of the start of operations and the value must be equal to 20% of the total closure cost. From the second year on, the payment must be proportional to the period which remains for the complete amount. The guarantee increases until the total value of the closure costs is deposited. The instruments of guarantee must be liquid and easy to execute
The financial guarantee can be gradually released as the Closure Plan is executed. Once the closure is complete and a certificate of final closure is issued by Sernageomin all guarantees will be released.
Mining companies that are obliged to provide a guarantee have a period of 2 years to estimate the cost of the Closure Plan. The Closure Plan must be approved under the regulation of Mining Safety Regulations and Environmental Qualification Resolution (RCA). After this period the company must submit the cost of executing the Closure Plan as well as the guarantee to Sernageomin. Sernageomin will then confirm that the company is in compliance.
4.2.9 Foreign Investment
In Chile, foreign investors may own 100% of a company based in Chile with no limit of duration for property rights. Within the limits of the Chilean law, investors can undertake any type of economic activity. Potential foreign investors must comply with the administrative system described in Chapter XIV of the Chilean Central Bank’s Compendium of Foreign Exchange Regulations in order to register the entry of foreign capital into Chile. Under the administrative system of Chapter XIV of the Chilean Central Bank, the entry of foreign capital must be registered by commercial banks which, in turn, must coordinate with the Central Bank of Chile. A minimum of $10,000 can be brought in through this mechanism in the form of currency or loans. This mechanism does not require a contract of any type. Capital entering Chile under Chapter XIV is not subject to any tax benefit and foreign investors using this regime are subject to the general taxation established by the Chilean Income Tax Law and the VA (VAT) Law.
Santo Domingo Project Region III, Chile
NI 43-101 Technical Report
Page 4-7
March 2020
Project Number: C40029
Foreign investors complying with the above may freely choose to apply for the Foreign Investment Legal Framework established in Law No. 20.848 of 2015, which entered into force on 1 January 2016. The Foreign Investment Legal Framework regulates investments made by an individual or legal entity incorporated overseas, not residing or domiciled in Chile, whose investment is equal to or greater than $5 million, or the equivalent in other currencies. Foreign investments authorized under this legal framework are entitled to: Remit abroad the equity invested and the net profits generated by the investment
in Chile, when all tax obligations have been fulfilled according to the local regulations
Access the formal exchange market to liquidate the currency constituting the investment
Access the formal exchange market in order to obtain the foreign currency required to remit the equity invested or the net profits generated by the investment in Chile
A VAT exemption on the import of capital goods in projects worth over $5 million, as long as certain requirements are met
No arbitrary discrimination, the foreign investor is subject to the same legal regime as local investors.
In order to qualify as a foreign investor and access the rights available under the Foreign Investment Legal Framework of Law 20.848 described above, the investor must request a certificate from the Agency for the Promotion of Foreign Investments demonstrating the investor’s foreign status. The request submitted to the Agency must provide evidence (in a form determined by the Agency) that the investment will be materialized in the country; a detailed description of the investment; and the amount, purpose and nature of the investment. Law 20.848 states that, for a period of 4 years from 1 January 2016, a foreign investor may request authorization to sign a tax invariability contract according to the terms, time frames and conditions established in Articles 7 and 11 ter of Decree Law No. 600 (DL 600 was replaced by Law 20.780 from 1 January 2016).

Santo Domingo Project Region III, Chile
NI 43-101 Technical Report
Page 4-8
March 2020
Project Number: C40029
Article 7 of Decree Law 600 establishes a tax invariability system that grants, for a period of 10 years, a total effective tax rate of 44.45% for investments of no less than $5 million for any investment purposes in Chile
Article 11 ter of Decree Law 600 establishes a tax invariability system that grants, for a period of 15 years, specific rights for investments of no less than $50 million for mining projects.
On 7 February 2014, Capstone signed a foreign investment contract with the state of Chile, which fell under the provisions of DL 600. According to the DL 600 Contract, Capstone, acting as the foreign investor entity, is entitled to make an investment in the Chilean company Minera Santo Domingo SCM, the developer of the Santo Domingo property. According to the DL 600 Contract provisions, this investment can be carried out in Chile via capital contribution and debt for an authorized amount of up to $2,100 million. This amount must be fully contributed within 8 years from the date of the signature of the contract (the contract will expire on 7 February 2022). Under the provisions of the DL 600 Contract, Capstone has the following rights: The right to transfer its capital and net profits abroad, in accordance with the
provisions of Articles 4, 5 and 6 of DL 600 and the provisions of the Income Tax Law
Access to the foreign exchange market, both to liquidate the foreign currency constituting the contribution and for capital and profit remittances, at the most favorable exchange rate, according to Articles 2° letter a) and 4 of DL 600
Tax invariability in accordance with the provisions of Article 11 ter of DL 600 Non-discrimination, in accordance with Articles 9 and 10 of DL 600 Exemption from any levy, tax or encumbrance on the net proceeds obtained by the
alienation of the shares or rights representative of the foreign investment, or by the sale or liquidation of the receiving company, up to the amount actually invested under this contract, in accordance with the provisions of Article 6 of DL 600, without prejudice to the provisions of the Income Tax Law.
4.2.10 Fraser Institute Survey
Wood has used the 2019 Fraser Institute Annual Survey of Mining Companies report (the Fraser Institute survey) as a credible source for the assessment of the overall political risk facing an exploration or mining project in Chile. Each year, the Fraser

Santo Domingo Project Region III, Chile
NI 43-101 Technical Report
Page 4-9
March 2020
Project Number: C40029
Institute sends a questionnaire to selected mining and exploration companies globally. The Fraser Institute survey is an attempt to assess how mineral endowments and public policy factors such as taxation and regulatory uncertainty affect exploration investment. Chile has a Policy Perception Index rank of 17 out of the 76 jurisdictions in the Fraser Institute survey. Chile’s Investment Attractiveness Index rating is 15 out of the 76 jurisdictions and it is ranked 27 of 76 on the Best Practices Mineral Potential Index.
4.3 Property Ownership
Information provided to Wood supports that MSD is a mining company (Sociedad Contractual Minera or SCM) legally organized under the laws of the Republic of Chile. MSD holds various mining concessions in the area of Diego de Almagro; collectively, these properties constitute the Santo Domingo property. The capital of MSD is indirectly 70% owned by Capstone and 30% by Korean Resource Corporation (Kores) as follows: Capstone owns 70% of the issued and outstanding common shares of 0908113 BC
Ltd A subsidiary of Kores, Korea Chile Mining Corporation, owns the remaining 30% of
0908113 BC Ltd 0908113 BC Ltd owns 100% of the issued and outstanding common shares of Far
West Mining Ltd Far West Mining Ltd owns 100% of the issued and outstanding common shares of
MSD MSD owns 100% of the Santo Domingo property. Capstone has advised Wood that under the terms of the shareholder agreement signed between Capstone, 0908113 BC Ltd., Korea Resources Corporation and Korea Chile Mining Corporation dated 17 June 2011, Capstone is the operator.
4.4 Mineral Tenure
Capstone holds two groups of concessions, totalling 116 claims, which cover a total of 28,897 ha and include the proposed mine site, plant area and auxiliary facilities

Santo Domingo Project Region III, Chile
NI 43-101 Technical Report
Page 4-10
March 2020
Project Number: C40029
including port facilities. The tenure includes 96 exploitation concessions and 20 exploration concessions. Concessions are held in the name of MSD. The total concession area is divided as follows: 27,597 ha of exploitation concessions that encompass the area where the mine,
plant, construction and operations camp and ancillary facilities are planned 1,300 ha of exploration concessions that encompass the port area. As part of the grant process, the concessions have been surveyed by a government-licensed surveyor. Concessions are protected under Chilean law by payment of the annual mining license fees. Capstone advised Wood on 28 February 2020 that all concession fees were paid and will continue to be paid on a regular basis as due, using a formal status tracking system. A simplified location plan for the contemplated infrastructure is included as Figure 4-1. A summary of the mineral tenure is provided in Table 4-1 for the exploitation concessions. Figure 4-2 and Figure 4-3 show the layout of the concessions in Table 4-1. Table 4-2 summarizes the exploration concessions. Figure 4-4 shows the locations of the concessions and the surface rights for the proposed facilities.
4.5 Surface Rights
Based on the current state of development, the existing legislation in Chile and the legal assurances necessary and required to safeguard the areas impacted by the proposed mine and plant development, a strategy has been developed for acquisition of surface lands sufficient to support the mine and plant operation. The surface land in the Community of Diego de Almagro where the mine and plant will be located is part of a larger lot that is owned by the State and is managed and represented by the Ministerio de Bienes Nacionales. The State is also the owner and the Ministerio de Bienes Nacionales also manages and represents the land in the districts of Caldera and Chañaral where the planned facilities will be located.
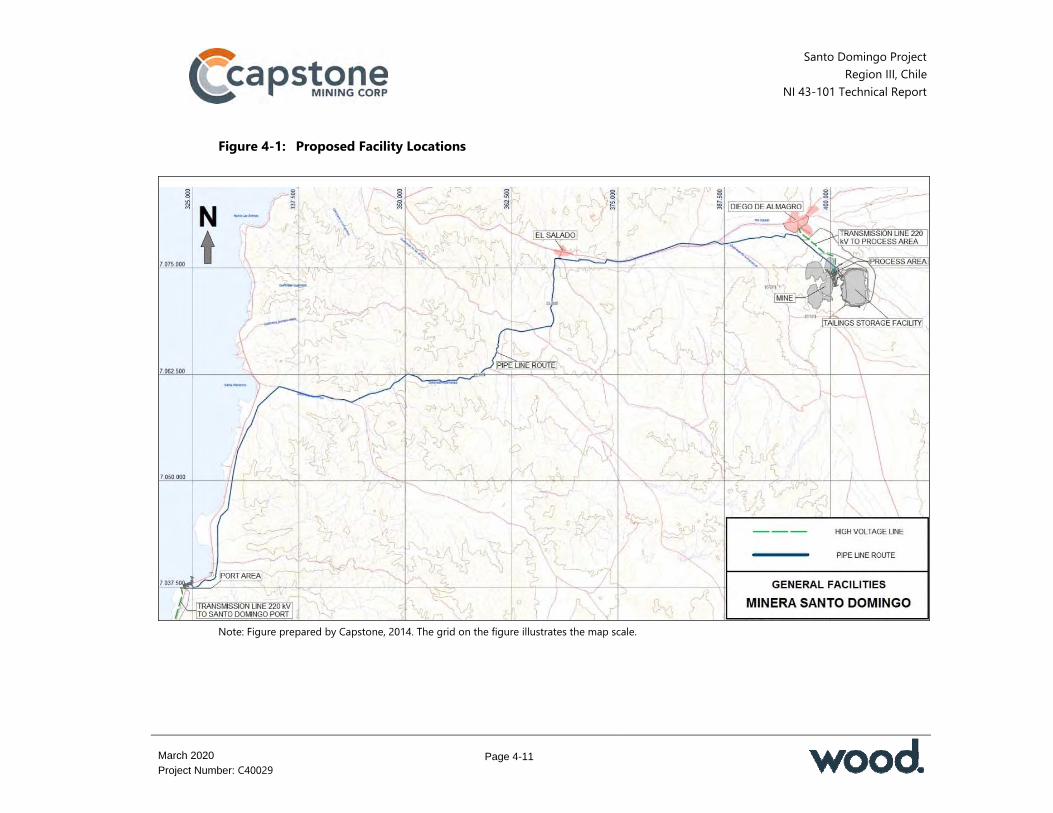
Santo Domingo Project Region III, Chile
NI 43-101 Technical Report
Page 4-11
March 2020
Project Number: C40029
Figure 4-1: Proposed Facility Locations
Note: Figure prepared by Capstone, 2014. The grid on the figure illustrates the map scale.

Santo Domingo Project Region III, Chile
NI 43-101 Technical Report
Page 4-12
March 2020
Project Number: C40029
Table 4-1: Exploitation Concessions Name Area (ha) Name Area (ha) Name Area (ha) SORPRESA 1/10 34 MANTA 513 1/60 300 MANTA 575 1/60 300 ESPERANZA UNO 4 MANTA 514 1/60 300 MANTA 576 1/60 300 ILUSION 1/2 10 MANTA 515 1/60 300 MANTA 577 1/60 300 MANTA 264 1/54 266 MANTA 516 1/60 300 MANTA 328 B 1/2 2 MANTA 270 1/28 134 MANTA 518 1/60 300 MANTA 328 C 1/2 2 MANTA 273 1/60 300 MANTA 519 1/60 300 MANTA 505 1/60 300 MANTA 276 1/22 110 MANTA 520 1/60 300 MANTA 509 1/60 300 MANTA 282 1/56 239 MANTA 521 1/60 300 MANTA 501 1/60 300 MANTA 330 1/58 286 MANTA 522 1/60 300 MANTA 502 1/60 300 MANTA 332A 1/38 184 MANTA 523 1/60 300 MANTA 503 1/60 300 MANTA 332B 1/2 8 MANTA 524 1/60 300 MANTA 526 1/60 300 MANTA 334 1/40 200 MANTA 525 1/60 300 MANTA 528 1/60 300 MANTA 327 1/60 300 MANTA 517 1/60 300 MANTA 529 1/60 300 MANTA 328 1/60 290 MANTA 527 1/60 300 MANTA 530 1/60 300 MANTA 329 1/40 200 MANTA 531 1/60 300 MANTA 578 1/39 195 MANTA 331 1/40 200 MANTA 532 1/60 300 MANTA 583 1/60 300 IRIS 1/55 273 MANTA 579 1/60 300 MANTA 590 1/60 300 IRIS PRIMERO 1/20 192 MANTA 580 1/60 300 MANTA 578 B 1/9 31 IRIS SEGUNDO 1/17 160 MANTA 581 1/60 300 DOMINGO 03 1/60 300 ESTRELLITA 1/10 50 MANTA 582 1/60 300 DOMINGO 04 1/60 272 PICHANGA 1/100 110 MANTA 584 1/60 300 DOMINGO 07 1/60 300 SANTO 1/20 92 MANTA 585 1/60 300 DOMINGO 08 1/60 300 MANTO RUSO 1/6 24 MANTA 586 1/60 300 DOMINGO 09 1/60 300 ESTEPHANIA 1/10 40 MANTA 276 B 1/28 128 DOMINGO 11 1/60 300 MANTA 572 B 1/24 120 MANTA 287 1/36 161 DOMINGO 12 1/60 300 MANTA 504 1/60 300 MANTA 533 1/40 200 ALTO 2 1/60 300 MANTA 506 1/60 300 MANTA 569 1/60 300 ALTO 4 1/60 300 MANTA 507 1/60 300 MANTA 570 1/60 300 ALTO 6 1/60 300 MANTA 508 1/60 300 MANTA 571 1/60 300 ALTO 13 1/40 200 MANTA 510 1/60 300 MANTA 572 1/26 130 ALTO 14 1/60 250 MANTA 511 1/60 300 MANTA 573 1/60 300 SALADO 20 160 300 MANTA 512 1/60 300 MANTA 574 1/60 300 SALADO 27 160 300

Santo Domingo Project Region III, Chile
NI 43-101 Technical Report
Page 4-13
March 2020
Project Number: C40029
Figure 4-2: Exploitation Concessions in Relation to Proposed Infrastructure Locations
Note: Figure prepared by Capstone, 2018. Area in white is the town of Diego de Almagro; dark blue outline is the proposed tailings storage facility, purple outlines are the proposed Santo Domingo open pit and waste rock facilities and the Iris Norte open pit; red line is the proposed C-17 by-pass road. Map north is to top of plan. It is approximately 7 km from the planned concentrator site (purple rectangle located between the Iris Norte pit and the tailings storage facility) to the town of Diego de Almagro as an indicator of scale.
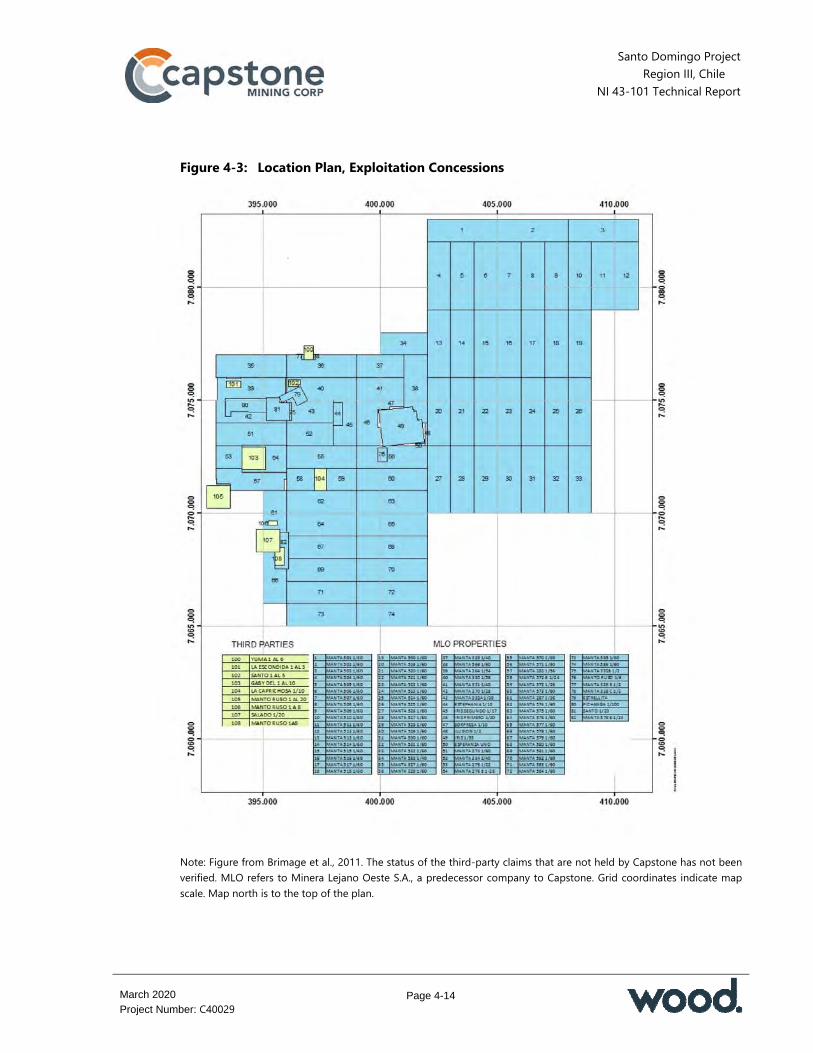
Santo Domingo Project Region III, Chile
NI 43-101 Technical Report
Page 4-14
March 2020
Project Number: C40029
Figure 4-3: Location Plan, Exploitation Concessions
Note: Figure from Brimage et al., 2011. The status of the third-party claims that are not held by Capstone has not been verified. MLO refers to Minera Lejano Oeste S.A., a predecessor company to Capstone. Grid coordinates indicate map scale. Map north is to the top of the plan.

Santo Domingo Project Region III, Chile
NI 43-101 Technical Report
Page 4-15
March 2020
Project Number: C40029
Table 4-2: Exploration Concessions Name Area (ha)
OESTE 1A 100OESTE 2A 300OESTE 3A 300OESTE 4A 300BLANCA 18 200BLANCA 19 100BLOCK 1 300BLOCK 2 300BLOCK 3 300BLOCK 4 300BLOCK 5 300BLOCK 6 300BLOCK 7 300BLOCK 8 300BLOCK 9 300BLOCK 10 300BLOCK 11 300BLOCK 12 300BLOCK 13 300DOMINGO 16 300
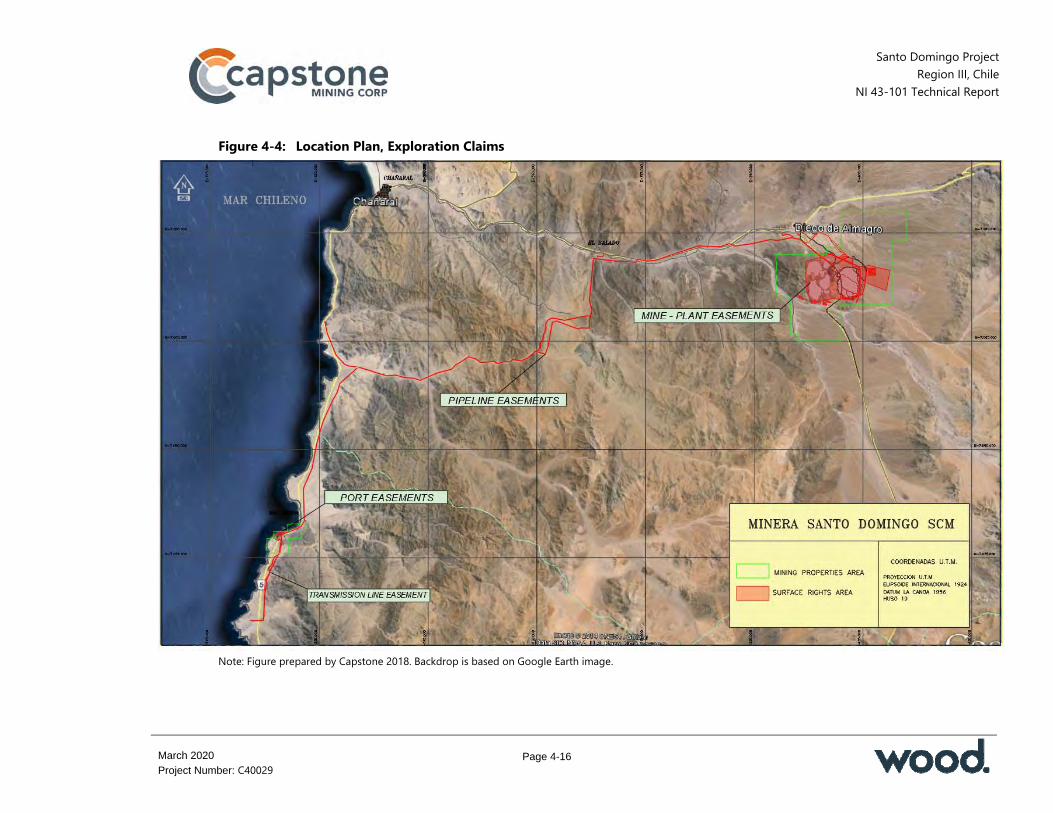
Santo Domingo Project Region III, Chile
NI 43-101 Technical Report
Page 4-16
March 2020
Project Number: C40029
Figure 4-4: Location Plan, Exploration Claims
Note: Figure prepared by Capstone 2018. Backdrop is based on Google Earth image.
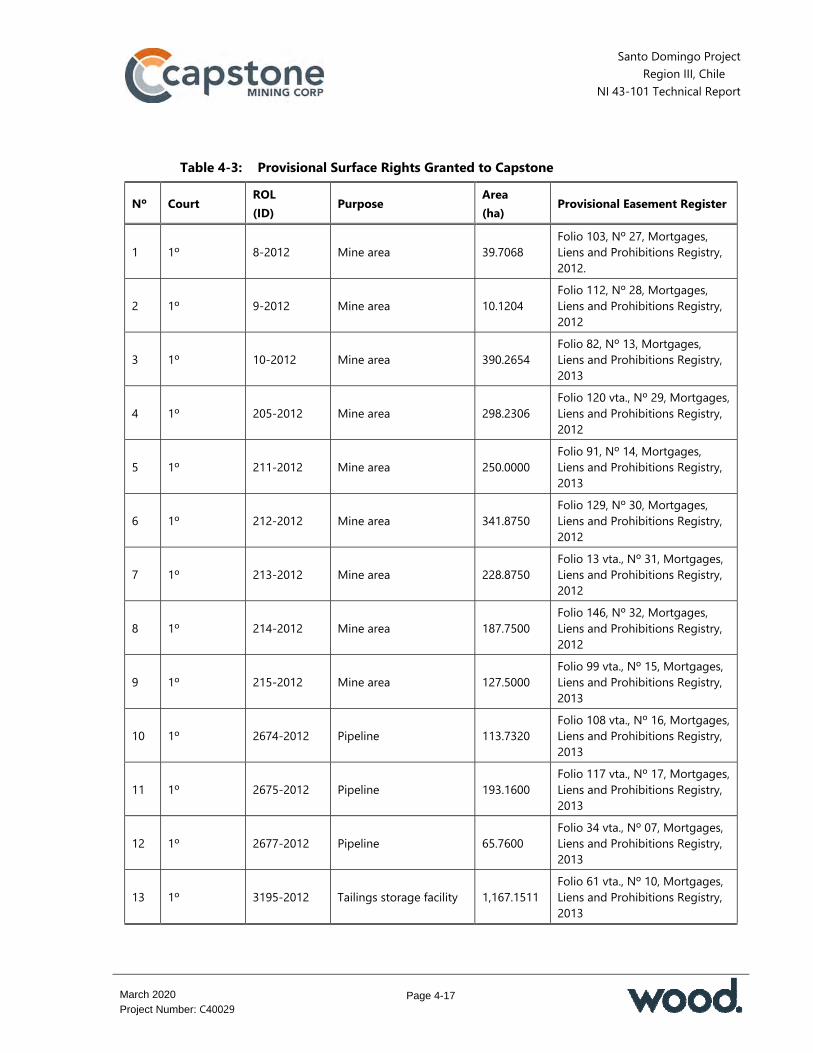
Santo Domingo Project Region III, Chile
NI 43-101 Technical Report
Page 4-17
March 2020
Project Number: C40029
Table 4-3: Provisional Surface Rights Granted to Capstone
Nº Court ROL (ID) Purpose Area
(ha) Provisional Easement Register
1 1º 8-2012 Mine area 39.7068 Folio 103, Nº 27, Mortgages, Liens and Prohibitions Registry, 2012.
2 1º 9-2012 Mine area 10.1204 Folio 112, Nº 28, Mortgages, Liens and Prohibitions Registry, 2012
3 1º 10-2012 Mine area 390.2654 Folio 82, Nº 13, Mortgages, Liens and Prohibitions Registry, 2013
4 1º 205-2012 Mine area 298.2306 Folio 120 vta., Nº 29, Mortgages, Liens and Prohibitions Registry, 2012
5 1º 211-2012 Mine area 250.0000 Folio 91, Nº 14, Mortgages, Liens and Prohibitions Registry, 2013
6 1º 212-2012 Mine area 341.8750 Folio 129, Nº 30, Mortgages, Liens and Prohibitions Registry, 2012
7 1º 213-2012 Mine area 228.8750 Folio 13 vta., Nº 31, Mortgages, Liens and Prohibitions Registry, 2012
8 1º 214-2012 Mine area 187.7500 Folio 146, Nº 32, Mortgages, Liens and Prohibitions Registry, 2012
9 1º 215-2012 Mine area 127.5000 Folio 99 vta., Nº 15, Mortgages, Liens and Prohibitions Registry, 2013
10 1º 2674-2012 Pipeline 113.7320 Folio 108 vta., Nº 16, Mortgages, Liens and Prohibitions Registry, 2013
11 1º 2675-2012 Pipeline 193.1600 Folio 117 vta., Nº 17, Mortgages, Liens and Prohibitions Registry, 2013
12 1º 2677-2012 Pipeline 65.7600 Folio 34 vta., Nº 07, Mortgages, Liens and Prohibitions Registry, 2013
13 1º 3195-2012 Tailings storage facility 1,167.1511 Folio 61 vta., Nº 10, Mortgages, Liens and Prohibitions Registry, 2013

Santo Domingo Project Region III, Chile
NI 43-101 Technical Report
Page 4-18
March 2020
Project Number: C40029
Nº Court ROL (ID) Purpose Area
(ha) Provisional Easement Register
14 1º 1923-2013 Port 75.9336 Folio 1, Nº 1, Mortgages, Liens and Prohibitions Registry, 2014
15 1º 3130-2013 Camp 3.3278 Folio 123 vta., Nº 19, Mortgages, Liens and Prohibitions Registry, 2014
16 1º 915-2014 C-17 by-pass 132.7713 Folio 13, Nº 3, Mortgages, Liens and Prohibitions Registry, 2015
17 2º 1861-2014 Pipeline 8.3900 Folio 34 vta., Nº 4, Mortgages, Liens and Prohibitions Registry, 2015
Note: All Provisional Surface Rights granted were registered with the Diego de Almagro Registrar of Real Estate and Mines.
Capstone has developed a legal strategy to obtain the necessary surface rights to cover mine, plant, camps, tailings storage facilities, pipelines, port and transmission lines. Capstone currently possesses 17 registered provisional surface rights (listed in Table 4-3) and 16 definitive surface rights (listed in Table 4-4). Capstone has six applications in progress for definitive surface rights (listed in Table 4-5). These cover surface rights for facilities and infrastructure. All these surface rights are contracts between Capstone and the Chilean Treasury. Capstone notes that to date, 3,856.78 ha have been granted definitive easements, 3,634 ha have been granted provisional easements and 239.84 ha are in the process of the creation of definitive easements. This total area covers: Plant and infrastructure (process plant, tailings disposal, open pit and waste
disposal) Pipelines Temporary construction and permanent operations camp Port area.

Santo Domingo Project Region III, Chile
NI 43-101 Technical Report
Page 4-19
March 2020
Project Number: C40029
Table 4-4: Definitive Surface Rights Granted to Capstone
Nº Court ROL (ID) Purpose Area
(ha) Inscription Data
1 1º 10-2012 Mine (pit, plant) 390.2654 Folio 109 vta., Nº 22, Mortgages, Liens and Prohibitions Registry, 2019
2 1º 2674-2012 Pipeline 113.7320 Folio 126 vta., Nº 23, Mortgages, Liens and Prohibitions Registry, 2019
3 1º 2675-2012 Pipeline 193.1600 Folio 144 vta., Nº 24, Mortgages, Liens and Prohibitions Registry, 2019
4 1º 620-2013 Tailings storage facility 372.2046 Folio 162 vta., Nº 25, Mortgages, Liens and Prohibitions Registry, 2019
5 1º 1923-2013 Port 75.9336 Folio 191 vta., Nº 115, Mortgages, Liens and Prohibitions Registry, 2019
6 1º 211-2012 Mine area 250.0000 Register Pending 7 1º 212-2012 Mine area 341.8750 Register Pending 8 1º 213-2012 Mine area 228.8750 Register Pending 9 1º 214-2012 Waste 187.7500 Register Pending 10 1º 215-2012 Mine 127.5000 Register Pending 11 1º 2677-2012 Pipeline 65.7600 Register Pending 12 1º 2257-2016 Mine 764.7944 Register Pending 13 2º 768-2015 LTE, by pass 116.9712 Register Pending 14 2º 2303-2016 Mine 307.9881 Register Pending 15 3º 1593-2016 Pipeline 56.2930 Register Pending 16 4º 2282-2016 Mine 263.677 Register Pending
Table 4-5: Capstone Surface Rights in the Process of Approval
Nº Court ROL (ID) Purpose Area
(ha) 1 1º 8-2012 Mine area 39.7068 2 1º 3130-2013 Camp 3.3278 3 1º 915-2014 C-17 by-pass 132.7713 4 1º 2852-2014 El Salado by-pass 3.8170 5 1º 3260-2014 Borrow areas 51.8360 6 2º 1861-2014 Pipeline 8.3900

Santo Domingo Project Region III, Chile
NI 43-101 Technical Report
Page 4-20
March 2020
Project Number: C40029
4.6 Water Rights
MSD will not need to make an application for water rights. The water for operations will consist solely of desalinated sea water. A maritime concession has been granted which will allow the extraction of sea water. Water for construction will be obtained from an authorized third-party provider.
4.7 Royalties and Encumbrances
Government royalties are levied in the form of a mining tax. A 2% net smelter return (NSR) royalty is payable to Enami for minerals mined from certain concessions subject to the royalty agreement in force between Enami and Capstone. A 2% NSR royalty is payable to BHP for minerals mined from certain other concessions subject to the royalty agreement in force between BHP and Capstone. The majority of the proposed open pits are located on concessions subject to one or other of these two royalty agreements.
4.8 Permitting Considerations
The permitting status is discussed in Section 20. 4.9 Environmental Considerations
The environmental and Closure Plan status is discussed in Section 20. 4.10 Social License Considerations
The social licence status is discussed in Section 20. 4.11 Comments on Section 4
The QP was provided with legal opinion and information from Capstone staff and experts retained by Capstone that supports: Capstone holds 70% of the Santo Domingo property; the remaining 30% is held
by Kores Capstone is the operator
Santo Domingo Project Region III, Chile
NI 43-101 Technical Report
Page 4-21
March 2020
Project Number: C40029
The mining tenure held is valid and is sufficient to support declaration of Mineral Resources and Mineral Reserves
Capstone has 17 provisional surface rights and 16 definitive surface rights; with six applications in process for definitive surface rights. Together these easements cover 100% of the area needed for construction of facilities and infrastructure
Royalties in the form of the Chilean mining tax will be payable Royalties to Enami and BHP are also payable in the form of NSRs No water rights are currently envisaged as the water will be sourced from the
ocean, desalinated and piped to the site for use. Capstone advised Wood that Capstone is not aware of any issues that may affect access, title, or the right or ability to perform work on the Property.
Santo Domingo Project Region III, Chile
NI 43-101 Technical Report
Page 5-1
March 2020
Project Number: C40029
5.0 ACCESSIBILITY, CLIMATE, LOCAL RESOURCES, INFRASTRUCTURE AND PHYSIOGRAPHY
5.1 Accessibility
Access to the planned and plant site area where the deposits are located is via the paved Pan-American Highway (Route 5 North) and a network of generally well-maintained gravel roads. The C-17 paved highway connecting Copiapó and Diego de Almagro passes immediately east of the proposed and plant site area. The Santo Domingo deposits are roughly five hours’ travel time by road south of Antofagasta and two hours by road north of Copiapó. Access to the proposed mine site is via Route 5 North, heading east from the town of Chañaral for 12 km to the El Salvador turn-off and then 50 km east to the town of Diego de Almagro. C-17 southbound, a paved highway, connects Diego de Almagro with Copiapó. At 3.3 km southeast from Diego de Almagro along this highway, a secondary gravel road (the Santo Domingo access road) leads south into the property. The total distance by road from Chañaral to the planned Santo Domingo mine site is approximately 68 km, with a travel time of approximately 50 minutes.
5.2 Climate
The proposed mine site is located in an area that is one of the driest places in the country and in the world, with high solar radiation, evaporation rates and salt concentration in the soil. Rainfall is occasional and irregular and, in some years, only received during the winter period. Because of this there are only temporary surface run-offs, except for the El Salado River which is the only permanent water course in the area of influence of the Santo Domingo property. The El Salado River has a predominantly pluvial regime and is located about 7 km downstream of the planned mine and plant area. The river is highly altered and of low flow; it was used in the past to transport tailings from the El Salvador mine to the coast. Meteorological data were collected at three different areas using monitoring stations and define two climate zones: Normal desert: This extends from the south of the Copiapó Valley to the southern
boundary of the Region and is characterized by low annual rainfall, increasing

Santo Domingo Project Region III, Chile
NI 43-101 Technical Report
Page 5-2
March 2020
Project Number: C40029
towards the south. The average annual temperature is 15°C. The main feature in the valleys of the Region is the frost-free condition for 11 months (from August to June). Minimum temperatures occur in July and reach 5°C; maximum temperatures occur in January and reach 28°C. There is strong seasonal precipitation in the area concentrated in the period from May to August, when more than 80% of the total annual precipitation falls
Coastal desert: This is present in all the coastal sectors of the Region and to the north close to Chañaral. The relief does not present barriers to the marine influence; the amount of cloud depends on the presence of the Pacific Anticyclone, a high-pressure system that generates dry air masses. This type of climate is characterized by abundant and dense cloud cover that appears during the night and is dissipated during the morning; it is sometimes accompanied by heavy fog and drizzle. The ocean influence produces a moderate thermal regime with a small temperature range, both daily and annually. Precipitation is mostly associated with fronts and increases from north to south, occurring almost exclusively in winter. Chañaral receives an average of 12 mm per year.
It is expected that it will be possible to conduct mining, processing, desalination and port activities on a year-round basis.
5.3 Local Resources and Infrastructure
There are several towns and villages near the proposed mine site. Diego de Almagro, located adjacent to the mine and plant area, has a population of several thousand people. Chañaral is a deep-sea port less than one hour’s drive to the west of the property. Chañaral has a population of about 10,000 people, hotel accommodation, food, fuel and minor services are available. The most important logistics centre in the Region is Copiapó, about two hours south of the Santo Domingo property. Copiapó has a population of approximately 150,000 people, an airport with daily scheduled flights to Santiago and Antofagasta and companies that offer abundant services for mining and exploration. The Atacama Region has well established infrastructure (energy, water, transportation and labour) to serve the mining industry. However, there is currently no infrastructure on the Santo Domingo property except gravel roads for access to the concessions and drill sites. The nearby town of Diego de Almagro is connected to the regional power

Santo Domingo Project Region III, Chile
NI 43-101 Technical Report
Page 5-3
March 2020
Project Number: C40029
grid and to the rail line. The rail line needs repair to the south and west of Diego de Almagro to be operational. Proposed infrastructure is described in Section 18 of this Report.
5.4 Physiography
Elevations in the deposit area range from approximately 900–1,300 masl. Hills of gentle to moderate relief have been cut by deep gullies and are flanked by gravel-filled valleys and alluvial fans. The vegetation is very sparse. In the valleys, plant life consists of small widely-spaced bushes a few centimetres high. Hillsides and peaks are generally devoid of vegetation. The coastline in the port area is aligned along a west–southwest–east–northeast direction. The soil type is a rocky soil and a lens of sand and gravel on top of the bedrock is easily recognizable.
5.5 Seismicity
Seismic maps of South America indicate that the Property is likely to have high seismicity and the site is considered to be within Zone 3 according to the Chilean standard NCh 2.369, with a peak ground acceleration value of 0.4 g. A seismic hazard assessment was performed by Rodolfo Saragoni, a recognized Chilean seismic reviewer, as part of the 2014 feasibility study and his recommendations are included in the current designs.
5.6 Comments on Section 5
In the QP’s opinion: There is sufficient suitable land available within the exploitation concessions for the
planned tailings disposal, mine waste disposal and mining-related infrastructure such as the open pit, process plant, workshops and offices
Mining, processing, desalination and port activities can be conducted year-round. The Property is likely to have high seismicity. A seismic hazard assessment was performed by a third party on behalf of Capstone and recommendations arising from the study are included in the current designs.

Santo Domingo Project Region III, Chile
NI 43-101 Technical Report
Page 6-1
March 2020
Project Number: C40029
6.0 HISTORY 6.1 Exploration History
Artisanal mining activities commenced in the general area of the Santo Domingo property during the early 19th century. The major commodities targeted were gold and iron. There are a significant number of small workings and pits throughout the Property. Most of the surface workings are typical of artisanal activities, being less than a few tens of metres in length. There is limited information as to the extent of underground mining activities. No production records from this activity have been located. Modern exploration commenced in 2002 when Far West and BHP Billiton formed an alliance to explore the Chilean iron oxide-copper-gold belt (IOCGB) in the Coastal Cordillera. In 2002, BHP Billiton flew a 10,700 line km Falcon™ airborne gravity gradiometer survey covering 5,145 km2 in eight blocks along a 300 km strike length of the IOCGB between Taltal and south of Copiapó in northern Chile. The survey outlined more than 76 target areas containing one or more distinct gravity anomalies. Far West commenced exploration activity in July 2003 and activity continued until 2011, when the company was acquired by Capstone. BHP’s interest in the Property was terminated in May 2005. BHP transferred concession titles to Far West in exchange for a 2% NSR royalty. In January 2006, Far West announced an agreement with Empresa Nacional de Mineria (ENAMI), a Chilean government corporation, to acquire a 100% interest in its 673 ha Iris property. ENAMI transferred concession titles to Far West in exchange for staged payments and a 2% NSR royalty. Work completed included initial geological mapping, surface and drainage sampling, interpretation of airborne geophysical data, an induced polarization (IP) survey and core and RC drilling (Table 6-1). This work resulted in outlining the Santo Domingo Sur, Estrellita and Iris deposits. An initial copper-gold resource estimate was performed in 2006 for Santo Domingo Sur and updated in 2007, which included first-time estimates for Estrellita and Iris.

Santo Domingo Project Region III, Chile
NI 43-101 Technical Report
Page 6-2
March 2020
Project Number: C40029
Table 6-1: Exploration Summary Table Year Company Work Program Program Details Reported
2002 BHP Billiton Airborne geophysical survey
10,700 line km Falcon™ airborne gravity gradiometer survey covering 5,145 km2 in eight blocks along a 300 km strike length of the IOCGB between Taltal and south of Copiapó.
July 2003 to November 2005
Far West/ BHP Billiton*
Geological mapping Approximately 50 km2 of geological mapping at 1:25,000 scale
Höy and Allen, 2005
Surface rock samples
50 samples submitted for analysis for Au and a 27-element ICP suite. Samples were generally taken where copper oxides were apparent and hence most samples contained anomalous levels of copper.
Sediment samples 47 sieved (106 µm) samples, submitted for analysis for Au and a 27-element ICP suite.
IP survey 17.6 line km RC drilling 67 holes (20,592 m) analyzed for Au and a 27-element ICP suite
November 2005 to May 2006 Far West
Geophysical data interpretation
FalconTM gravity and magnetic susceptibility plots were produced for data from Quantec Geofisica Limitada. The gravity anomalies define a north–south-oriented cluster of northwest-trending features up to 5 km long within the Property. Lacroix, 2006
RC drilling 15 holes (5,176 m) analyzed for Au and a 27-element ICP suite Core drilling 4,057 m in eight holes; analyzed for Au and a 27-element ICP suite
May 2006 to September 2007 Far West
RC drilling 215 holes (51,909.5 m); analyzed for Au and a 27-element ICP suite Lacroix and Rennie, 2007 Core drilling 15 holes (2,649.75 m); analyzed for Au and a 27-element ICP suite
September 2007 to December 2008 Far West
RC drilling 37 holes (10376.5 m); analyzed for Au and a 27-element ICP suite Lacroix, 2009
Core drilling One hole (495.25 m); analyzed for Au and a 27-element ICP suite December 2008 to May 2010 Far West RC drilling Nine holes (2,557 m); analyzed for Au and a 27-element ICP suite Rennie, 2010
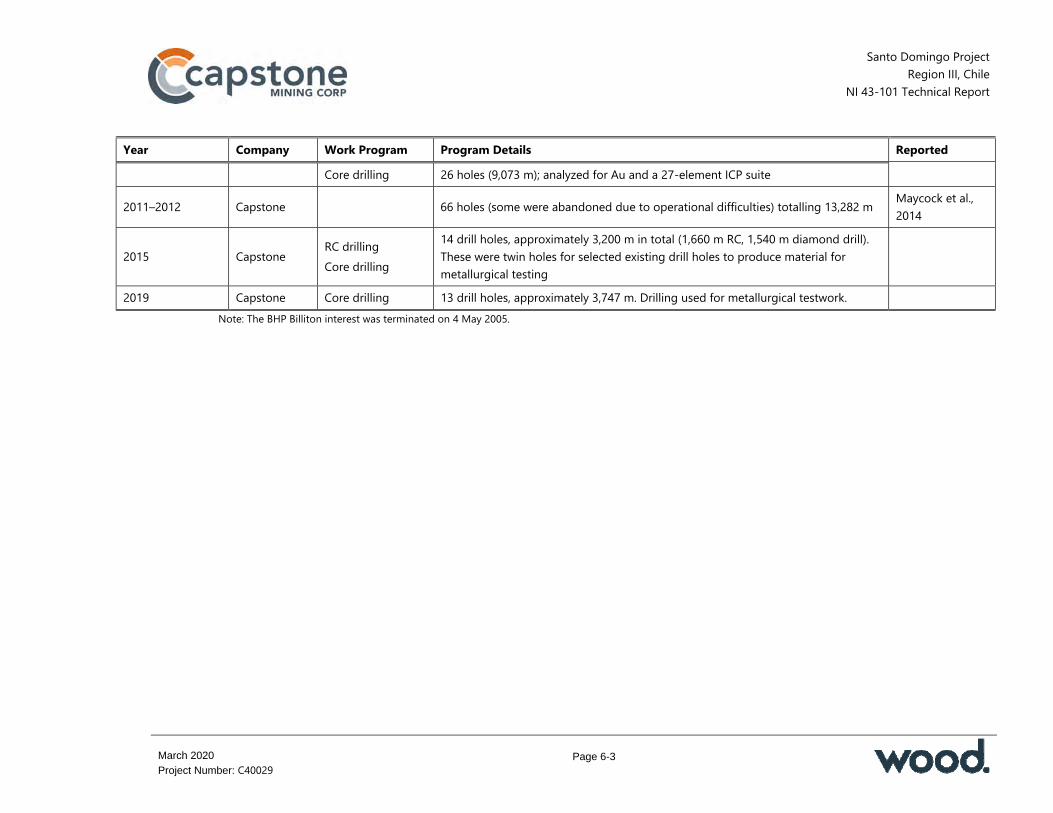
Santo Domingo Project Region III, Chile
NI 43-101 Technical Report
Page 6-3
March 2020
Project Number: C40029
Year Company Work Program Program Details Reported Core drilling 26 holes (9,073 m); analyzed for Au and a 27-element ICP suite
2011–2012 Capstone 66 holes (some were abandoned due to operational difficulties) totalling 13,282 m Maycock et al., 2014
2015 Capstone RC drilling Core drilling
14 drill holes, approximately 3,200 m in total (1,660 m RC, 1,540 m diamond drill). These were twin holes for selected existing drill holes to produce material for metallurgical testing
2019 Capstone Core drilling 13 drill holes, approximately 3,747 m. Drilling used for metallurgical testwork. Note: The BHP Billiton interest was terminated on 4 May 2005.

Santo Domingo Project Region III, Chile
NI 43-101 Technical Report
Page 6-4
March 2020
Project Number: C40029
In 2008, a preliminary assessment (PA) was undertaken. This envisaged two open pit mining options, one mining Santo Domingo Sur for the recovery of copper, gold and iron from magnetite; the second mining the Santo Domingo Sur and Iris deposits for the recovery of copper, gold and iron from magnetite and hematite. The resource estimate for the PA included iron as an element of interest. Results indicated that the options were revenue negative under the assumptions in the PA; changes to the metal price assumptions resulted in potentially positive economics and additional work was recommended. During 2009, the copper–gold resource estimates for Santo Domingo Sur and Iris were updated and the Iris Norte deposit added to the estimate. Iron was included in the updated resource estimates. A further copper–gold–iron resource update was performed in 2010, covering Santo Domingo Sur, Iris and Iris Norte. Following acquisition of Far West by Capstone on 17 June 2011, Capstone completed the 2011 pre-feasibility study. The study envisaged conventional open pit mining of the Santo Domingo Sur, Iris and Iris Norte deposits, a semi-autogenous grind, ball mill and pebble crushing comminution circuit (SABC), conventional copper flotation, magnetic separation, tailings disposal and storage, water and concentrates pipelines and port facilities and associated site infrastructure requirements. The 2014 feasibility study commenced in 2012 and was completed in 2014. During 2014–2015, 14 drill holes were executed, approximately 3,200 m in total (1,660 m RC; 1,540 m diamond drill). These were twin holes for selected existing drill holes to produce composite material approximating the first 5 years of operation in the 2014 feasibility study for metallurgical testing. The work was carried out by MCA S.p.a. and supervised by Amec Foster Wheeler. The drill core was used in pilot plant operation, which was conducted using the flowsheet assumptions envisaged in the 2014 Feasibility Study. During 2018, a review of assumptions in the 2014 feasibility study was undertaken and resulted in completion of the 2019 Technical Report, which changed some design concepts and incorporated more recent pricing. Mineral Reserves and the economic analysis supporting the Mineral Reserves presented in this Report are based on the 2019 Technical Report. In January 2019, Capstone drilled 13 twinned diamond drill holes for a total of 3,747 m, to collect additional material for metallurgical sampling. In 2019 Capstone commissioned a PEA to investigate the potential of adding a cobalt refining circuit to
Santo Domingo Project Region III, Chile
NI 43-101 Technical Report
Page 6-5
March 2020
Project Number: C40029
the process plant and production of sulphuric acid for the Chilean market as by-products. This work is outlined in Section 24 of this Report.
6.2 Production There has been no formal production from the Santo Domingo property area.
Santo Domingo Project Region III, Chile
NI 43-101 Technical Report
Page 7-1
March 2020
Project Number: C40029
7.0 GEOLOGICAL SETTING AND MINERALIZATION
7.1 Regional Geology
The Chilean Iron Belt (CIB) is a narrow, north–south trending belt stretching for over 2,000 km parallel to the Chilean coast, from approximately 25ºS to 31ºS. The dominant feature of the belt is a complex sinistral strike-slip and dip-slip fault system known as the Atacama fault zone. Faulting is interpreted to be related to an oblique subduction of a Jurassic to early Cretaceous magmatic arc. Initial faulting took the form of strike-slip, causing mylonite development and ductile deformation. This gave way to dip-slip fault movement and brittle deformation during later extensional tectonism. Between approximately 132 Ma to 106 Ma, a number of tabular-shaped mafic to felsic plutonic complexes were emplaced along the Atacama fault zone. Emplacement occurred during both strike-slip (ductile) and dip-slip (brittle) deformation regimes. A number of volcanic- or intrusive-hosted breccia zones were developed in association with the strike-slip and dip-slip faulting, which became sites for the formation of a number of metasomatic iron oxide and iron-oxide–copper–gold (IOCG) deposits. IOCG deposits in the CIB are divided into more iron-rich and more copper-rich end members: The iron-rich end members are classified as Kiruna-type magnetite–apatite
deposits with associated actinolite–albite–quartz–tourmaline alteration. Host rocks are typically brecciated volcanic materials, or brecciated intrusions thought to be genetically related to the formation of the deposits. The majority of these iron deposits are spatially related to pyroxene diorites (Ménard, 1995). Some examples of the larger Kiruna-type deposits in the CIB include Romeral, Los Colorados, Boquerón Chañar, Algarrobo, Cerro Iman and Rodados Negros.
Copper-bearing end members include La Candelaria and Manto Verde.
7.2 Property Geology
7.2.1 Lithologies
The Property lies on the east side of the Atacama fault complex, which, in this area, consists of numerous clusters of generally north–south structural breaks in a belt approximately 30 km wide (Figure 7-1).
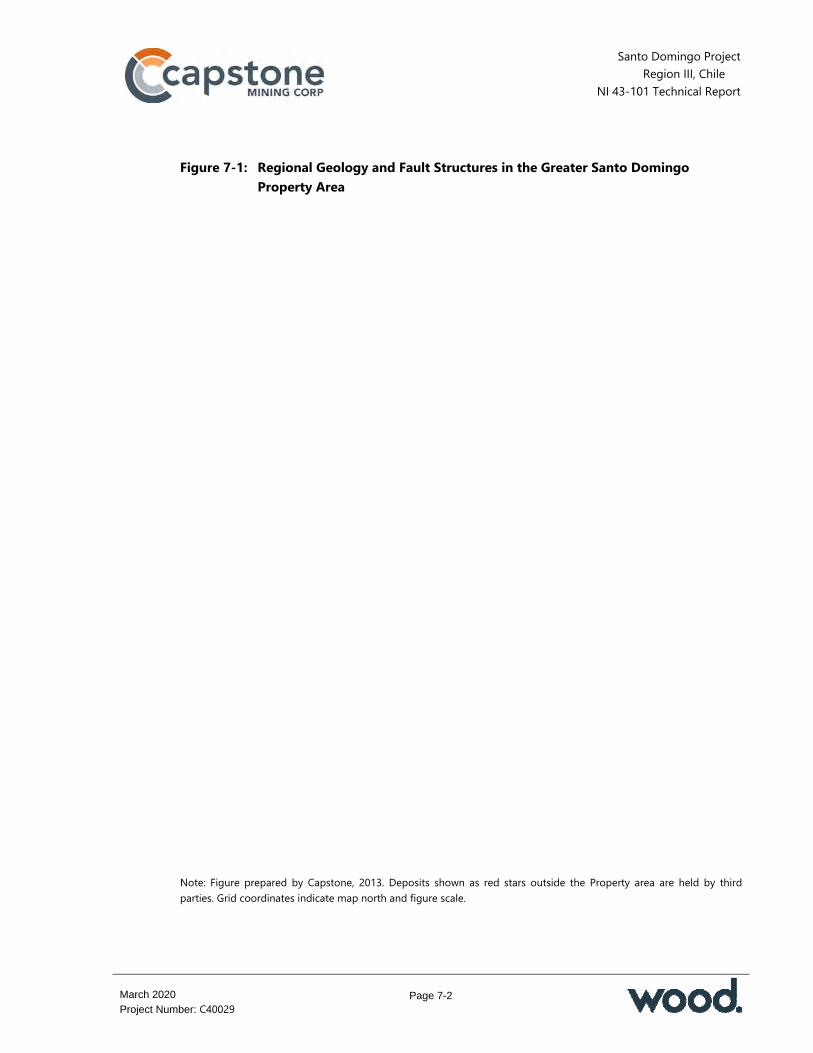
Santo Domingo Project Region III, Chile
NI 43-101 Technical Report
Page 7-2
March 2020
Project Number: C40029
Figure 7-1: Regional Geology and Fault Structures in the Greater Santo Domingo Property Area
Note: Figure prepared by Capstone, 2013. Deposits shown as red stars outside the Property area are held by third parties. Grid coordinates indicate map north and figure scale.

Santo Domingo Project Region III, Chile
NI 43-101 Technical Report
Page 7-3
March 2020
Project Number: C40029
The base of the stratigraphic sequence in the Property is interpreted to be sedimentary rocks of the Punta del Cobre Formation. The only known surface expression of the Punta del Cobre Formation is a poorly-exposed sequence of sedimentary and volcanic rocks outcropping in the extreme southeast part of the Property. Geology in this area consists of intercalated calcareous sedimentary rocks, crystal tuff, lapilli tuff, hornfels and andesite porphyry. One exposure of thinly laminated, moderately west-dipping, red hematitic siltstone may be correlative with the hematitic terrigenous basal conglomerate of the Algarrobo Member of the Punta del Cobre Formation in the Copiapó area (Marschik and Fontboté, 2001). Capstone geologists note that if this is in fact the lower part of the Algarrobo Member, the lithology in this area is in the same stratigraphic position as the host rocks of the Candelaria deposit that is approximately 120 km to the south of the Property. The Punta del Cobre Formation units grade upwards into a contemporaneous, interdigitated sequence of limestone and marine sediments of the Chañarcillo Group and andesitic flows and volcaniclastic rocks of the Bandurrias Group. The upper Punta del Cobre Formation near its contact with the overlying Bandurrias–Chañarcillo Group sequences is the stratigraphic host location of the Candelaria deposit. Limestone units vary in thickness from a few metres to over 100 m but can be the predominant rock type across several hundred metres of stratigraphy. They are generally massive to thickly bedded, fine grained and dark to light grey, predominantly forming the top parts of many prominent hills in the area. True sediments are not abundant, with most clastic rocks classified as tuffaceous sediments or crystal tuffs. These rocks are generally massive to poorly bedded, fine to medium grained and commonly difficult to differentiate from fine-grained, massive flows. Individual units reach thicknesses of up to 50 m but can comprise the bulk of the stratigraphy, reaching over 300 m in thickness, with minor intervals of limestone and andesite lavas. In some places the andesitic volcaniclastic rocks are interlayered with significant volumes of light grey to cream coloured aphanitic and, rarely, thinly-laminated material. In drill holes, this material was logged as possible felsic tuff horizons, but subsequent petrographic work suggests that they are carbonate–potassic feldspar-altered andesitic tuffaceous sediments (Ross, 2005). Several relatively narrow hematite and magnetite (±copper oxide or sulphide) mantos up to 12 m thick occur sporadically within the tuffaceous sequence across a 200 m

Santo Domingo Project Region III, Chile
NI 43-101 Technical Report
Page 7-4
March 2020
Project Number: C40029
stratigraphic interval, with associated weak to strong actinolite-potassic feldspar alteration. This stratigraphy and related iron oxide-copper mantos have been tentatively identified throughout the Property and probably underlie most or all of the area. Andesite flows range from near aphanitic to coarse-grained feldspar-phyric, but are generally medium grained, with 20% to 30% euhedral, white, prismatic plagioclase (±minor hornblende) phenocrysts in a grey to brownish aphanitic groundmass. Some flows are massive, whereas others contain abundant amygdales up to 1 cm in diameter (average 1 mm to 2 mm) filled with varying proportions of quartz, calcite, epidote, chlorite, potassic feldspar, limonite (pyrite) and “almagre” (minute grains of distinct copper minerals admixed with the red hematite) or other copper oxides. The Bandurrias Group is defined as a predominantly volcanic sequence of andesite flows and volcaniclastic rocks. Chañarcillo Group rocks consist primarily of limestone and calcareous marine sediments. These two groups are thought to be contemporaneous, deposited at the same time in different parts of the same back-arc basin. Capstone geologists observe that the overall geological descriptions of the two groups match observed Property geology. However, the andesite-tuff succession that hosts the mantos may be part of the Punta del Cobre sequence. This would suggest the presence of faulted contacts between this sequence and the structurally-adjacent limestone that is more clearly correlated with the Chañarcillo Group. Based on the Sernageomin regional geology map, Capstone geologists have interpreted that at least nine intrusive events have affected the Property. Intrusions are generally younger eastward and range in age from 145 Ma to 90 Ma (Figure 7-2).

Santo Domingo Project Region III, Chile
NI 43-101 Technical Report
Page 7-5
March 2020
Project Number: C40029
Figure 7-2: Local Geology Plan Showing Major Intrusive Events
Note: Figure prepared by Capstone, 2013.
Santo Domingo Project Region III, Chile
NI 43-101 Technical Report
Page 7-6
March 2020
Project Number: C40029
7.2.2 Structure
7.2.2.1 Faults The Property is divided into a number of structural blocks with different lithological characteristics suggesting that the blocks are part of different stratigraphic levels. Faults trend variably north, northwest, northeast and east–west. These faults are complex and seem to have been active repeatedly through time. Many of the faults appear to mark the boundary of pronounced lithological changes. Most faults recognized in the area, either through mapping, drill intersections, or magnetic lows, appear to be high angle faults with both dip-slip and strike-slip movement. As well, some low angle faults with probable reverse displacement have been noted in several outcrops, suggesting the presence of thrust faulting, most notably the fault that bounds Santo Domingo Sur in the south (where mineralization has been intersected below the limestone unit in the south). The extent of these interpreted thrust faults is not known. The most obvious structure, referred to as the Santo Domingo fault, crosses the Estrellita and Estefánia areas. It is a large east-west trending, steeply north dipping, north-side-down block fault, with a probable right lateral strike-slip component. Most of the historic copper production in the area comes from or near this structure. The most prominent fault set, as interpreted from magnetic lows, trends northwest and has fault separations of approximately 1 km. Several northwest-trending faults are also recognized in the Santo Domingo Sur area. High-angle block faulting played an important role in localizing manto- and fault-related iron oxide–copper mineralization in the Property. These faults have uplifted the central part of the Santo Domingo Sur area, bringing the manto succession close to surface. To the east and south there is potential that this prospective horizon is present at depth, beneath limestone cover rocks.
7.2.2.2 Fault Blocks In the Santo Domingo Sur block, a thick package of andesitic flows is underlain by a sequence of tuffaceous rocks of similar composition. The tuffs have been intruded by fine-grained diorite sills. The entire package consisting of andesitic flows and tuffs and diorite intrusions have been cut by later feldspar–hornblende porphyry dykes that cut all other rock types and do not host any mineralization.

Santo Domingo Project Region III, Chile
NI 43-101 Technical Report
Page 7-7
March 2020
Project Number: C40029
The structural block to the west of the Santo Domingo Sur deposit consists of a gently to moderately north–northwest dipping, bedded sequence of limestone and intercalated tuffaceous andesitic rocks grading into less calcareous tuffs and volcanic sediments towards the south. The geology to the south of the Santo Domingo Sur deposit is somewhat distinct from the rest of the Property, as the Bandurrias–Chañarcillo Group rocks have been intruded by a series of small diorite plugs and sills assigned to the Sierra Santo Domingo plutonic suite. The area to the northeast of the Santo Domingo Sur deposit that hosts the Iris deposit is structurally complex and is not well understood at this point as the drill spacing of 100 m does not in many cases allow correlations from one drill hole to the next. Some smaller structural blocks may only be represented by a single drill hole. Between the two structural blocks that host the Santo Domingo Sur and Iris deposits respectively, there is another fault block that consists of andesitic flows hosting massive magnetite mantos that are barren of copper mineralization. The structural block to the east of the Iris deposit is characterized by thick sequences of limestone that can be observed at surface. This structural block has not been tested by drill holes and it is unknown what lithological units are positioned below the limestone sequence. The northern part of the Santo Domingo area where the Iris Norte deposit is situated, is characterized by andesitic flows and andesite porphyries at surface. The highest ridges in the area are typically made up of a thick sequence of limestone that overlies the volcanic sequence. A large part of the northernmost structural block is covered by younger gravel that displays a thickness of up to 150 m that appears to increase towards the north. Drilling at Estrellita has shown that the package of andesitic porphyries and flows has a thickness of up to 200 m. In the Estrellita area this package is underlain by a sequence of volcaniclastics with minor intercalations and interbeds of andesite porphyry, limestone and altered tuff.
7.2.2.3 Folds Limited mapping and recognition of outcrop-scale, open folds indicate that the rocks have been gently folded along north–northeast-trending axes.

Santo Domingo Project Region III, Chile
NI 43-101 Technical Report
Page 7-8
March 2020
Project Number: C40029
7.2.3 Alteration
Hydrothermal alteration and mineralization in the Santo Domingo area affects all rocks and exhibits numerous styles and events with multiple overprinting components. At the deposit and district scales four styles of alteration are recognized: sodic (-calcic), potassic, carbonate and calc-silicate skarn. A clear hydrothermal zoning occurs from proximal to distal assemblages at deposit scale (Santo Domingo Sur) and apparently at district scale at depth and towards the diorite intrusive complex. Main sodic (-calcic) alteration minerals are albite, actinolite, chlorite, epidote and titanite that replace mainly volcanic and intrusive rocks. Scapolite–actinolite–pyroxene veins can be found at the southern portions of the area close by and within the diorite stocks and dikes. At surface, actinolite, chlorite and carbonate typically occur as infilling amygdules and open spaces. Pink albite replaces plagioclase in the more porphyritic rocks. Potassium silicate alteration is less common but is found as K-feldspar–chlorite–carbonate–quartz mineral assemblages. Patchy K-feldspar mainly replaces plagioclase (albite) and is also found in veins with carbonate and quartz. This alteration is mainly located within the copper-iron mantos. Carbonate rich assemblages are widespread and overprint the previous mineral associations. In addition, carbonate (calcite, ankerite, siderite)–chlorite–quartz veins and stockwork are commonly found cutting all rock types of the area. Calc-silicate skarn minerals are found south of Santo Domingo where carbonate rich rocks and lesser volcanic rocks are in contact with diorite intrusive units. Main alteration minerals are garnet (andradite), epidote, pyroxene, actinolite and carbonate.
7.2.4 Weathering and Supergene Development
Supergene processes are weakly developed in the Santo Domingo area. Oxidation is shallow (70 m to 90 m below surface) and enrichment is minimal, consistent with the low total sulphide contents and the calcareous and feldspathic nature of the host rock. The iron–copper–gold mineralization in Santo Domingo is almost entirely hypogene; the proportions of sulphides to oxides are approximately 13:1 (Rennie, 2010). At shallow levels, typical copper–iron mineralization includes small veins, hydrothermal breccias and mantos. Specular hematite ±magnetite is commonly altered to earthy hematite and goethite and usually is found with mixtures of copper oxides (chrysocolla,

Santo Domingo Project Region III, Chile
NI 43-101 Technical Report
Page 7-9
March 2020
Project Number: C40029
brochantite, malachite and copper wad). In addition, almagre has been previously described filling amygdules within the andesitic volcanic flows and in the Estrellita area (Rennie, 2010). At Santo Domingo Sur, gypsum is locally found filling fractures and open spaces, presumably as a hydration product of anhydrite. Relatively scarce digenite ±chalcocite ±covellite are locally present, partially replacing fractures and rims of bornite crystals. Various amounts of native copper are found interstitial to the matrix of hydrothermal breccias and veins, especially the shallower portions of the central part of the Santo Domingo Sur deposit.
7.3 Deposits
To date, four deposits, three of which support Mineral Reserves and a number of prospects have been identified in the Property (Figure 7-3).
7.3.1 Santo Domingo Sur
The andesitic flows and tuffs are the primary host to mineralization at Santo Domingo Sur. Mineralization consists of thick semi-massive to massive iron oxide mantos that have replaced the tuffaceous rocks. The stratigraphic sequence of andesitic flows and tuffs dips gently (at an angle of approximately 15°) towards the north–northwest under gravel cover. The tuff sequence has been intruded by fine-grained diorite sills that are present in almost all drill holes at Santo Domingo Sur, varying in drilled thickness from a few metres to more than 60 m. Similar diorites have been intersected in the Iris deposit and have been observed in outcrop to the south of Santo Domingo Sur. The diorites are typically altered and in rare cases contain copper mineralization. These observations suggest that the diorite intrusion is more or less contemporaneous with the mineralizing event and may in fact have been the heat engine for the formation of the deposit. The last intrusive events in the area are feldspar–hornblende porphyry dykes. Mineralization occurs in the form of copper-bearing semi-massive to massive iron oxide mantos with minor veins and breccias. The mantos are zoned from an outer rim of specular hematite toward a magnetite-rich core.
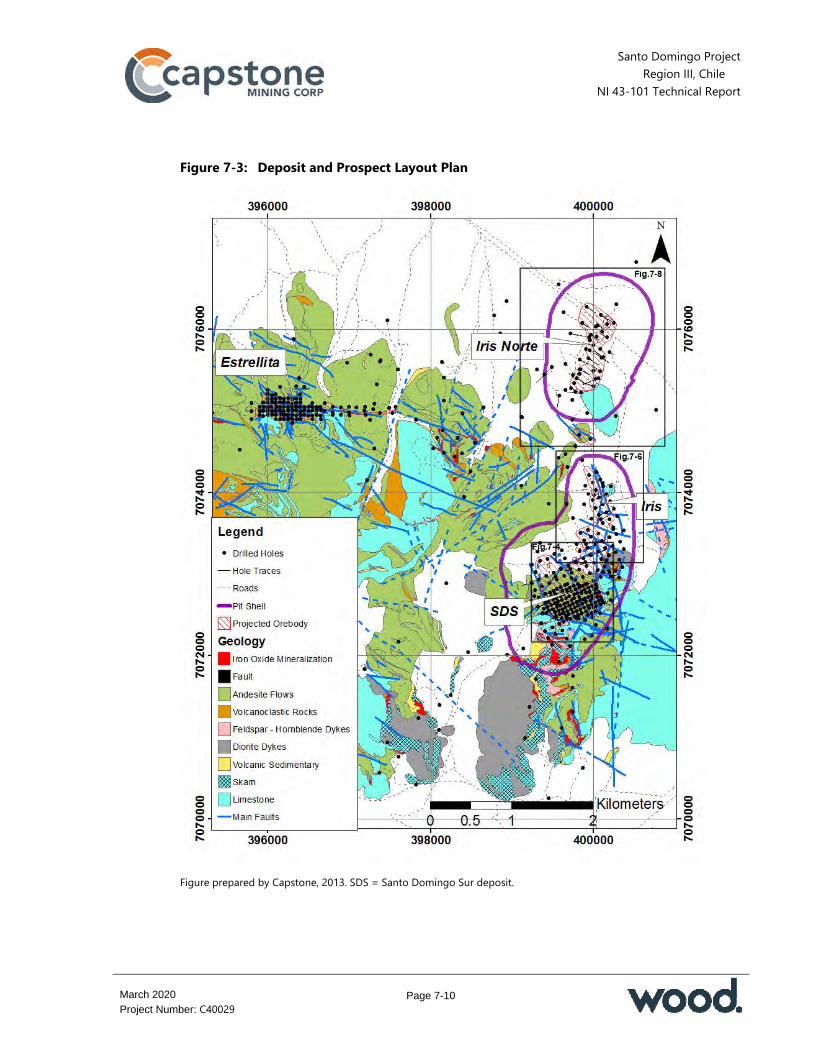
Santo Domingo Project Region III, Chile
NI 43-101 Technical Report
Page 7-10
March 2020
Project Number: C40029
Figure 7-3: Deposit and Prospect Layout Plan
Figure prepared by Capstone, 2013. SDS = Santo Domingo Sur deposit.
Santo Domingo Project Region III, Chile
NI 43-101 Technical Report
Page 7-11
March 2020
Project Number: C40029
Drilling has identified a 150 m to 500 m thick, copper-bearing, specularite–magnetite sequence covering an area of approximately 1,300 m by 800 m and traced to a depth of approximately 525 m below surface. Mineralization consists of stacked chalcopyrite bearing, specularite–magnetite mantos within tuff and tuffaceous sediments overlain by andesitic flows. The mantos consist of semi-massive to massive specularite and magnetite layers with clots and stringers of chalcopyrite, that range in thickness from approximately 4 m to 20 m. The upper parts of the manto sequence directly below the overlying andesite flows are frequently oxidized and contain various amounts of copper oxides and chalcocite. Mineralization in the deposit is strongest in the southern part and in the upper levels. Copper grade and intensity of the mineralization weaken towards the northern part of the deposit as well as with depth. The high-grade core of the deposit is located along the southern margin and close to surface. It appears likely that the bounding fault in the south of the deposit has been the main conduit for mineralizing fluids as mineralization and alteration is strongest along that fault. Recent drilling has outlined a zone of hydrothermal brecciation in the centre of the deposit. The breccia consists of andesite and andesitic tuff fragments in a fine-grained matrix of iron oxides. The upper part of the breccia is oxidized with both limonite, which is the dominant iron oxide and copper oxides. Native copper has also been observed. The lower part of the breccia contains regular sulphide mineralization and differs from the surrounding rock only in texture. The breccia has been intercepted by multiple drill holes, establishing a complex geometry that forms a narrow body at depth, but which widens toward the surface. Figure 7-4 presents a geology and structural plan of the Santo Domingo Sur deposit. Figure 7-5 is an example cross-section through the deposit showing the location and orientation of the mineralization.

Santo Domingo Project Region III, Chile
NI 43-101 Technical Report
Page 7-12
March 2020
Project Number: C40029
Figure 7-4: Geology and Structure Plan, Santo Domingo Sur
Note: Figure prepared by Capstone, 2013.

Santo Domingo Project Region III, Chile
NI 43-101 Technical Report
Page 7-13
March 2020
Project Number: C40029
Figure 7-5: Santo Domingo Sur Simplified Geology (Cross Section 99600)
Note: Figure prepared by Capstone, 2013. Blue lines indicate faults and interpreted structures

Santo Domingo Project Region III, Chile
NI 43-101 Technical Report
Page 7-14
March 2020
Project Number: C40029
7.3.2 Iris
The Iris deposit is essentially blind, covered by a sequence of Quaternary gravel. The elongated shape of the deposit and textures observed in core drill holes indicate that the Iris deposit has formed in a north–northwest-striking fault zone that is bounded by a west-dipping fault that can be traced along most of the deposit’s western side. The eastern side of the deposit is bordered by a steeply-dipping fault that divides andesitic tuffs on the western side from calcareous sedimentary rocks and limestone to the east. The Iris deposit footprint, when projected to surface, is approximately 500 m wide, has a strike length of 1,800 m and has been traced from surface to a depth of approximately 670 m below surface. When the dip and plunge of the zones is considered, the real width of the deposit is of the order of 200 m. The deposit consists of iron oxide mantos and breccias developed along a north–northwest-striking fault zone. The dominant iron oxide at Iris is hematite and the main copper mineral is chalcopyrite. Mineralization occurs close to surface at the southern end and plunges gently towards the north. The distribution of copper mineralization in the Iris deposit is more erratic and irregular when compared to the Santo Domingo Sur deposit. This is attributed to structural controls playing a greater role in the formation of the Iris deposit as contrasted with the more continuous stratiform replacement style mineralization at Santo Domingo Sur. There are some old mine workings at the southern end of the deposit where copper oxides such as brochantite and chrysocolla were mined at surface. The oxide mineralization is hosted by a specularite manto that is cut by steeply-dipping structures. The extent of oxide mineralization at surface is approximately 100 m by 60 m. The Iris Mag zone is located between the Iris deposit and the Santo Domingo Sur deposit in a separate structural block. Mineralization in the zone consists of magnetite and chalcopyrite with a very high magnetite content (40% and more) and typically low copper content (approximately 0.1% Cu on average). The host rocks are andesitic flows and andesite breccias with a much smaller tuff component than the other zones. It appears that this part of the deposit has been subject to the initial high temperature magnetite event but shows little evidence of a

Santo Domingo Project Region III, Chile
NI 43-101 Technical Report
Page 7-15
March 2020
Project Number: C40029
later oxidizing overprint that has introduced high-grade copper and gold values elsewhere. Figure 7-6 is a geology and structure plan of the Iris deposit. Figure 7-7 is a cross-section through the deposit.
7.3.3 Iris Norte
The Iris Norte deposit is located about 600 m to the north of the Iris deposit and is also blind, being entirely covered by a gravel sequence. The deposit is very similar in character to Iris and occurs on the eastern edge of a pronounced gravity anomaly. The deposit is approximately 500 m wide and has been tested over a strike length of 1,600 m and to a depth of 320 m below surface. Mineralization is primarily hosted in andesitic flows, which differs to the tuff host at Santo Domingo Sur and Iris. The Iris Norte deposit is also elongated in shape and seems to have formed in a structural zone. The deposit displays a north-easterly strike which is a rotation of approximately 55° clockwise versus the strike of the Iris deposit. The Iris Norte deposit has been intruded by significant numbers of diorite dykes and sills, which have separated the deposit into two lenses. Mineralization consists of mixed magnetite and hematite mantos. The main sulphides in Iris Norte are pyrite and chalcopyrite, with the latter providing the copper content of the deposit. Iris Norte contains a higher proportion of magnetite than the Iris deposit and there are a higher proportion of intrusive rocks. Figure 7-8 is a geology plan of the Iris Norte deposit. Figure 7-9 is a cross-section through the deposit.
7.3.4 Estrellita
Estrellita is an east–west-striking, flat-lying to shallow north-dipping tabular body lying approximately 3.5 km northwest of Santo Domingo Sur. Mineralization is interpreted by Capstone geologists to occur at a higher stratigraphic level than Santo Domingo Sur, Iris and Iris Norte, which are hosted in tuff sequences below the level of mineralization at Estrellita.
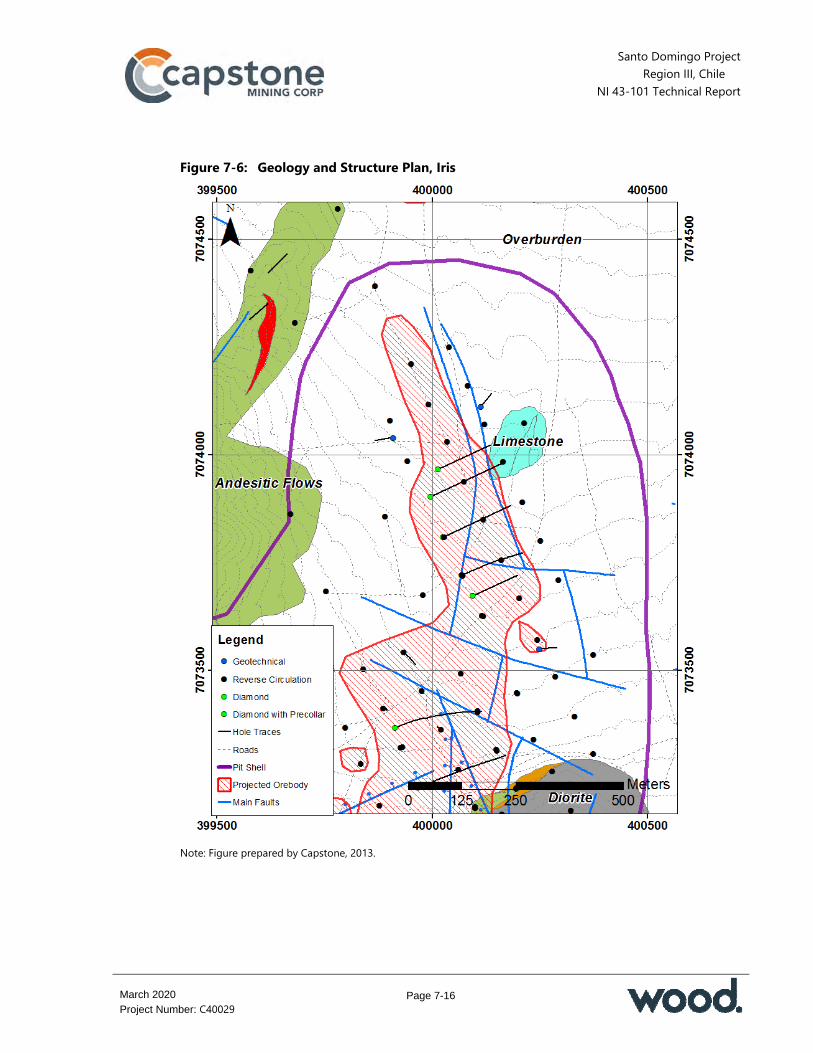
Santo Domingo Project Region III, Chile
NI 43-101 Technical Report
Page 7-16
March 2020
Project Number: C40029
Figure 7-6: Geology and Structure Plan, Iris
Note: Figure prepared by Capstone, 2013.

Santo Domingo Project Region III, Chile
NI 43-101 Technical Report
Page 7-17
March 2020
Project Number: C40029
Figure 7-7: Iris Simplified Geology (Cross Section 100500)
Note: Figure prepared by Capstone, 2013. Blue lines indicate faults and interpreted structures

Santo Domingo Project Region III, Chile
NI 43-101 Technical Report
Page 7-18
March 2020
Project Number: C40029
Figure 7-8: Geology Plan, Iris Norte
Note: Figure prepared by Capstone, 2013.

Santo Domingo Project Region III, Chile
NI 43-101 Technical Report
Page 7-19
March 2020
Project Number: C40029
Figure 7-9: Iris Norte Simplified Geology
Note: Figure prepared by Capstone, 2013. Drill traces are colour-coded to lithologies. Green: andesite; Red: Fe manto; Brown: andesitic tuff; Pink: diorite; Turquoise: limestone; Yellow: overburden.

Santo Domingo Project Region III, Chile
NI 43-101 Technical Report
Page 7-20
March 2020
Project Number: C40029
Drilling at Estrellita has shown that the host package of andesitic porphyries and flows has a thickness of up to 200 m. In the Estrellita area, this package is underlain by a sequence of volcaniclastics with minor intercalations and interbeds of andesite porphyry, limestone and altered tuff. Estrellita has been faulted into a series of four blocks which step downwards to the north, with displacement across the faults ranging up to approximately 75 m. The overall footprint of the zone measures 900 m long by 450 m wide and is up to 100 m thick. The deepest drill intersections are in the order of 250 m below surface. The zone is thickest in the middle and narrows somewhat towards the periphery. There are narrower zones of limited lateral extent in the footwall of the main zone but it is open ended to the east and west. The character of mineralization at the Estrellita deposit is a mixture of manto-style, iron oxide and structurally-controlled, vein-style mineralization. The central part of the Estrellita deposit consists of a more or less horizontal tabular body of iron oxide manto that appears to have formed at the intersection of a flat-lying and a steeply-dipping set of specularite structures. Copper mineralization typically consists of copper oxides such as brochantite, chrysocolla, almagre, cuprite and chalcocite. The oxidized mineralization at surface becomes gradually less oxidized with depth and transitions through a mixed zone of oxides and sulphides into a sulphide zone where the main copper mineral is chalcopyrite. Figure 7-10 is a cross-section through the Estrellita deposit. Figure 7-11 is a cross-section showing a simplified geological interpretation.
7.4 Prospects/Exploration Targets
7.4.1 Estrellita and Estefánia Areas
In the Estrellita and Estefánia areas, several gently north-dipping, stratabound, iron oxide (specular hematite near surface grading to magnetite at depth) ±copper horizons up to 12 m thick occur in roughly the same 200 m stratigraphic interval and have been tentatively traced with drilling or extrapolated across 3 km of strike length. Mineralization typically occurs within a simple, single phase breccia of fine-grained, calcareous tuffaceous sediment.

Santo Domingo Project Region III, Chile
NI 43-101 Technical Report
Page 7-21
March 2020
Project Number: C40029
Figure 7-10: Geology and Structure Plan, Estrellita
Note: Figure from Lacroix and Rennie, 2007.
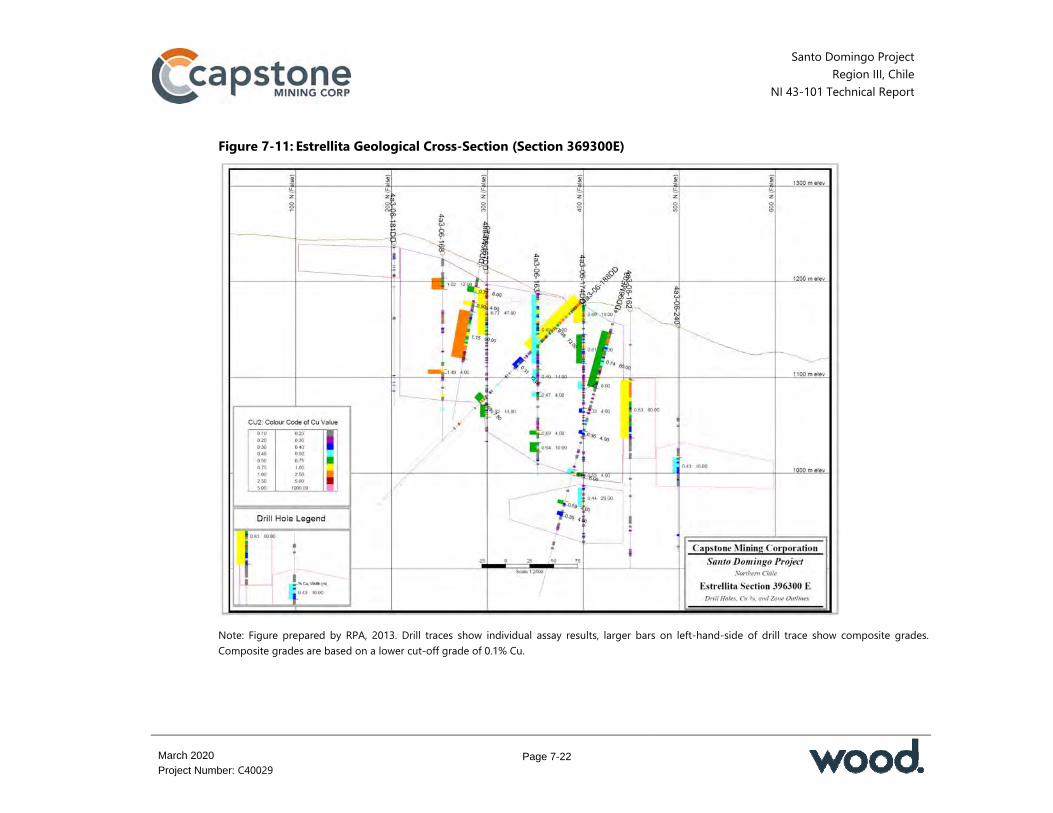
Santo Domingo Project Region III, Chile
NI 43-101 Technical Report
Page 7-22
March 2020
Project Number: C40029
Figure 7-11: Estrellita Geological Cross-Section (Section 369300E)
Note: Figure prepared by RPA, 2013. Drill traces show individual assay results, larger bars on left-hand-side of drill trace show composite grades. Composite grades are based on a lower cut-off grade of 0.1% Cu.
Santo Domingo Project Region III, Chile
NI 43-101 Technical Report
Page 7-23
March 2020
Project Number: C40029
The breccia matrix typically consists of fine-grained specular hematite with disseminated, stringer and fracture coating copper oxides and rare clots of chalcopyrite. Breccia horizons appear to be largely stratabound, but to the south are discordant, following the steeply-dipping Santo Domingo fault and suggesting that this fault may have been a fluid conduit.
7.4.2 Santo Domingo Fault
Andesite units both north and south of the Santo Domingo fault have been cut by a closely spaced (100 m to 200 m) set of northwest striking and steeply northeast dipping carbonate veins mineralized with specular hematite and copper oxides. Although these veins historically have supported very small-scale mining operations for some time, even collectively they do not appear to have had significant production. Copper mineralization also occurs disseminated in the andesite and limestone peripheral to the Santo Domingo fault. Andesite flows north of the fault host copper minerals including chrysocolla, malachite, almagre (a cupriferous limonite) and chalcopyrite, sporadically in amygdales with quartz, calcite, epidote and chlorite.
7.4.3 Limestones
In the limestone sequence, copper occurs rarely as small chalcocite nodules with associated malachite. It is currently uncertain how these disseminated copper occurrences are genetically related to the vein and manto mineralization.

Santo Domingo Project Region III, Chile
NI 43-101 Technical Report
Page 8-1
March 2020
Project Number: C40029
8.0 DEPOSIT TYPES
8.1 Introduction
Information discussed in this section is from public domain sources as noted in the text. RPA has not verified this information and cautions that the discussions of lengths, widths, grades and other indications of mineralization and mining activity on these properties may not necessarily be indicative of the mineralization in the Property, or of any future mining activity that may be able to be conducted in the Property. Mineralization at Santo Domingo occurs primarily as IOCG deposits with related vein and skarn bodies. The largest and most extensively mined IOCG-type deposits in Chile occur within a structurally-complex zone extending between La Serena and Taltal over an area of 500 km by 50 km. Deposits within the CIB have two general end members; a magnetite–apatite–actinolite mineral assemblage similar to the Kiruna deposit in Sweden and a copper-rich type similar to the Olympic Dam deposit in Australia. The magnetite-rich deposits in Chile have been mined for iron since the early 1800s and the Los Colorados mine south of Copiapó is still in production. Examples of copper-rich IOCG deposits in the belt include Candelaria and Manto Verde. The descriptions of the Candelaria and Manto Verde deposits that follow provide more detail on the IOCG-type deposits in the CIB.
8.2 Candelaria Deposit
Lundin Mining’s Candelaria mine is located 20 km south of Copiapó. The Candelaria deposit is hosted in altered volcanic and volcaniclastic rocks of the Punta del Cobre Formation which were deposited in an Early Cretaceous continental volcanic arc and marine back-arc basin terrane. Punta del Cobre Formation rocks have been divided into the lower Geraldo Negro Member and the upper Algarrobo Member. The Geraldo Negro Member consists of massive andesite and minor dacite. The overlying Algarrobo Member is a coarsely bedded sequence of andesitic volcaniclastic and flow rocks with an upper tuffaceous sediment horizon. Rocks of the Algarrobo Member are overlain by calcareous sediments and limestone of the Chañarcillo Group. These marine environment sediments grade laterally into coeval terrestrial volcanic and volcaniclastic rocks of the Bandurrias Group.
Santo Domingo Project Region III, Chile
NI 43-101 Technical Report
Page 8-2
March 2020
Project Number: C40029
The shallow east-dipping stratigraphic sequence above has been gently folded into an open anticline in the deposit area. It has also been cut by closely spaced sets of faults with three dominant orientations: north-northwest to northwest-trending steeply-dipping sinistral strike-slip faults; northeast-trending steeply to moderately northwest-dipping faults; and east–northeast striking high-angle left-lateral offset strike-slip faults. These faults are probably responsible for the channelling of metal bearing fluids and appear to be important controls for metal deposition. An early Cretaceous granitoid pluton in the Chilean Coastal Batholith, which intrudes into the volcano-sedimentary sequence approximately 5 km to the west, is generally believed to be the heat engine responsible for fluid movement and subsequent metal deposition. Mineralization at the Candelaria deposit is typically an assemblage of magnetite-chalcopyrite-pyrite with lesser amounts of specular hematite and/or pyrrhotite. Mineralization is predominantly restricted to the upper part of the Geraldo Negro andesite and the overlying volcano-sedimentary rocks of the Algarrobo Member. Mineralization appears to be roughly strata-bound with upward fluid movement restricted by an impermeable scapolite-rich skarn located at the base of the Chañarcillo Group. Host rocks are strongly altered and zoned into distinct mineral assemblages. In the deeper parts of the deposit area and close to the batholith, rocks are intensely altered to a biotite-quartz-magnetite assemblage. Fracture related calcic amphibole (actinolite) cuts this hydrothermal mineral assemblage. Higher up in the system alteration mineralogy consists of an assemblage of potassium feldspar with chlorite and/or biotite, plus quartz and magnetite and/or hematite. The upper part of the system is typified by a broad zone of sodic alteration with an albite-chlorite-calcite-hematite assemblage. Sulphide stringers (predominantly chalcopyrite and pyrite) post-date all alteration events. Iron oxide mineralization at Candelaria has been dated at 116 Ma to 114 Ma and subsequent copper mineralization at 112 Ma to 110 Ma (Marschik et al., 2000). Ca-amphibole has been dated at 111.7 ±0.8 Ma (Ullrich and Clark, 1998) and hence is closely associated with the copper mineralizing event. These ages are broadly coincident with the age of the adjacent granitoid pluton which is therefore thought to be genetically related to mineralization.

Santo Domingo Project Region III, Chile
NI 43-101 Technical Report
Page 8-3
March 2020
Project Number: C40029
8.3 Manto Verde Deposit
Audley Capital’s Manto Verde mine is located approximately 104 km north of the Candelaria deposit and 25 km southwest of the Santo Domingo area. The oldest lithologies in the Manto Verde area are variably altered (hornfelsed and mylonitized) andesitic volcanic rocks. According to Vila et al. (1996), these are part of a 2,000(+) m thick, east-dipping sequence of predominantly sub-aerial andesite flows and volcanic breccias with minor intercalated sandstone and limestone. Segerstrom (1960) and Brown et al. (1993) have placed the volcanic rocks around Manto Verde into the Early Cretaceous Bandurrias Formation. According to Zamora and Castillo (2000) and the Quebrada Salitrosa geological map by Godoy and Lara (1998), these volcanic rocks have at least in part been assigned to the Mid to Upper Jurassic La Negra Formation. The main part of the Atacama fault zone passes through the Manto Verde mine area. In this region it is interpreted as a 10 km wide zone of structural deformation with three main branches: the eastern, central and western faults. There are many prominent north-south structures apparent on both sides of this complex Atacama fault zone; however, it is clear that the actual zone of deformation is much wider. Volcanic rocks have been cut by numerous phases of north-south elongated granitic to dioritic intrusions. These are interpreted to be syntectonic emplacements along the Atacama fault complex. Geology in the area, therefore, is typified by generally north–south elongated, fault- and intrusion-bounded blocks of volcanic rocks within a multi-phase intrusive complex. Plutonic rocks occur as dykes, plugs, stocks and batholiths, ranging in size from a few metres to a few tens of kilometres. The Manto Verde deposit is located along the Manto Verde fault, a north-northwest trending, 40° to 50° east dipping, riedel shear connecting the east and central branches of this western part of the Atacama fault zone. Host andesitic volcanic rocks and possibly coeval dioritic intrusions (sills?) of the Mid to Upper Jurassic La Negra Formation as well as the Lower Cretaceous Bandurrias Formation, have undergone brittle deformation along the Manto Verde fault during a regime of extensional tectonism. Tabular breccia bodies up to 100 m wide developed along the Manto Verde fault contain fragments of altered host rock within a matrix composed largely of iron oxide

Santo Domingo Project Region III, Chile
NI 43-101 Technical Report
Page 8-4
March 2020
Project Number: C40029
and a variety of copper oxide minerals. In the main pit, the iron oxide is predominantly specularite, whereas in the south pit magnetite is more abundant. Copper minerals appear to both pre-date and post-date iron oxide mineralization. In some cases, copper oxides occur as angular breccia fragments in a specularite matrix. In other cases, copper minerals are clearly late, occurring as disseminations, open space fillings or stringers, cutting massive hematite or magnetite as well as the host rock. Oxidation occurs to depths of over 200 m within the Manto Verde fault. Copper minerals in the oxide zone consist of: Copper sulphates; brochantite, antlerite Copper carbonate; malachite Copper silicate; chrysocolla Copper chloride; atacamite Pitchy copper ore; cupriferous limonite (almagre).
A narrow (generally less than 5 m), discontinuous zone of supergene enrichment is developed at the oxide-sulphide transition. Copper mineralogy in this zone consists of chalcocite and cuprite. Sulphides below the oxide zone consist of disseminated and stringer related pyrite and chalcopyrite within an iron oxide breccia matrix. Magnetite appears to become the more dominant iron oxide at depth. The host andesite-diorite sequence has undergone widespread chloritization and potassic metasomatism (microcline), probably as a result of intrusion by adjacent granitic to dioritic plutons. Intense hydrothermal alteration peripheral to the mineralized structures masks the ubiquitous contact metamorphism. This hydrothermal alteration consists of a sequence of overprinting mineral assemblages. From earliest to latest they are (Zamora and Castillo, 2000): Chlorite–quartz Calcite–sericite–hematite–magnetite K-feldspar–quartz–specularite.
Earlier formed microcline is altered to sericite and plagioclase breaks down to sericite and carbonate. Silica and possibly potassium may be the only significant non-metallic additions during the hydrothermal alteration associated with iron and copper mineralization. Hydrothermal sericite associated with the copper mineralization has
Santo Domingo Project Region III, Chile
NI 43-101 Technical Report
Page 8-5
March 2020
Project Number: C40029
been dated at 121 ±3 Ma and 117 ±3 Ma (Vila et al., 1996). The nearby La Tazas pluton has been dated at 130 Ma to 126 Ma and the Sierra Dieciocho pluton at 126 Ma to 115 Ma (Godoy and Lara, 1998). The age of mineralization at Manto Verde is coincident with the age of the Sierra Dieciocho pluton which outcrops some 4 km to the east of the pit. Late north-trending mafic dykes cut all rock types, alteration assemblages and mineralization.
8.4 Comment on Section 8
The QP considers that exploration programs that use copper-rich IOCG deposit models are appropriate to the Property.

Santo Domingo Project Region III, Chile
NI 43-101 Technical Report
Page 9-1
March 2020
Project Number: C40029
9.0 EXPLORATION
9.1 Grids and Surveys
The coordinate system in use for the deposits is UTM Zone 19S, PSAD-56 datum. The topography used was from a detailed aerial survey of the planned plant site area using a scale of 1:1,000 and 1 m contour spacing, prepared by Fugro Interra S.A. (Fugro) for Capstone in April 2012. Topography at 1:2,000 scale was used for other areas. The topography covers an area of approximately 16,000 ha for the plant site, port facilities and pipeline route. The supporting grid for the mine and plant area and the pipeline system consists of six main points and a secondary grid of 53 points. Fugro provided a coordinate transformation program that allows coordinate conversion in various systems, WGS84 <> PSAD56 and WGS84 <> LTM. A global positioning system (GPS) network for the plant site was prepared including 20 survey monuments to be used for the next stage of engineering design. A topographic coordinate conversion program was provided to correlate data from one datum base to the other. All the survey restitution work was performed by GEOCEN Aerofotogrametría Digital.
9.2 Geological Mapping
Approximately 50 km2 of geological mapping at 1:25,000 scale was completed during 2003–2005 and used for exploration targeting.
9.3 Geochemical Sampling
Far West collected a total of 50 rock chip samples and 47 stream sediment samples (sieved to 100% passing 106 µm in the field) and generated copper and gold plots to assist exploration efforts. Most rock chip samples were collected near copper showings and hence contain anomalous copper values. The gold plot shows that the mineralization within a 2 km radius of the Estrellita mine is commonly weakly gold-anomalous. These samples are generally from the narrow northwest-trending specularite and copper oxide-bearing veins cutting andesite flows. Drainages in the areas underlain by andesite flows, especially in the north and northwest part of the Property, are generally copper anomalous. These values form a
Santo Domingo Project Region III, Chile
NI 43-101 Technical Report
Page 9-2
March 2020
Project Number: C40029
broad anomaly corresponding to northwest-trending specularite–copper oxide mineralized veins that cut the andesite rocks. Gold values in sediments are generally low.
9.4 Geophysics
9.4.1 Airborne
In 2002, BHP Billiton flew a FalconTM gravity and magnetic survey over a portion of the Northern Chilean CIB, including the current Property. FalconTM gravity and magnetic susceptibility plots were produced based on information from Quantec Geofisica Limitada. Gravity anomalies defined a cluster of northwest trending features up to 5 km long. Most of the significant mineralization in the Santo Domingo area is coincident with the gravity anomalies and these areas were considered to be high priority exploration targets. The magnetic susceptibility images show a widely-spaced set of northwest-trending faults and less abundant northeast- and north–south-trending faults. The Santo Domingo fault cuts through the Estrellita deposit and the Estefánia mine workings and shows up as a series of coincident magnetic lows and truncated magnetic features that give this structure a tentative strike length of about 17 km. Many of the more significant mineralized zones in the Santo Domingo area appear to be related to this fault and its entire surface trace was considered prospective. The Santo Domingo gravity anomaly is a west–northwest-trending feature approximately 4 km long by 1.5 km wide for much of its length. The eastern part of the target area may actually be a separate gravity anomaly. It is a north–south-trending, sinuous, linear feature approximately 4 km long by 500 m wide. Most of the Santo Domingo gravity anomaly has coincident high magnetic susceptibility except where cut by faults which show up as linear magnetic lows. Andesite porphyry flows are the dominant lithology underlying most of the Santo Domingo gravity anomaly area. The eastern anomaly boundary is roughly coincident with an andesite–limestone contact. The northwestern part of the Santo Domingo anomaly (Estrellita area) is generally parallel to a series of west–northwest striking faults as defined on the magnetic images and to a closely spaced series of specularite and copper oxide bearing veins, stockwork
Santo Domingo Project Region III, Chile
NI 43-101 Technical Report
Page 9-3
March 2020
Project Number: C40029
and shear zones cutting the andesite. These mineralized veins occur both within the anomaly and outside the anomaly to the south. Copper-bearing manto mineralization at the artisanal Estrellita mine workings underlies the westernmost part of the Santo Domingo gravity anomaly area. The direct association of mineralization with a gravity feature is unusual in the Candelaria area and hence the Santo Domingo target received a good deal of exploration work. Magnetic susceptibility in the Santo Domingo gravity anomaly area is generally high except where cut by faults, most notably the east–west-trending Santo Domingo fault and a prominent northwest-trending fault along the southwest side of the anomaly. In drill holes into the northern part of the anomaly, well away from the Santo Domingo fault, the volcanic flows in the oxide zone (60 m to 120 m below surface) contained an average of 1% to 2% magnetite. Below this level the magnetite content, both disseminated and in magnetite mantos, was estimated to be 5% to 10%. These amounts of magnetite appear to explain the magnetic anomaly and may also be responsible for the gravity anomaly. Magnetite in the oxide zone (near surface) and within the Santo Domingo fault (to depth) has been largely altered to specularite and may explain the magnetic low along the fault. The gravity signature does not show a similar lineament, possibly because the alteration of magnetite to specularite does not change the bulk density. The Santo Domingo Sur area is located in the extreme southeast part of the Santo Domingo anomaly. It was selected as an initial drill target because there were specularite–copper oxide mantos exposed on the flank of a 500 m wide gravity anomaly. The southern part of this anomaly has a coincident magnetic low which may in part be related to magnetite destruction (formation of specularite) along a northwest-trending fault. It has similar geological and geophysical signatures to the mineralized mantos at the Estrellita mine. Drilling within this gravity feature has outlined the Santo Domingo Sur deposit. The deposit has a gravity and magnetic signature that reflects the high magnetite and hematite content. The Iris deposit is located along the eastern flank of the Santo Domingo gravity anomaly where mineralization formed in a fault zone that is more or less coincident with the eastern edge of the gravity feature. The deposit has an associated magnetic anomaly that is much wider than the deposit itself as the extent of magnetic iron oxide is greater than the extent of copper sulphide mineralization.

Santo Domingo Project Region III, Chile
NI 43-101 Technical Report
Page 9-4
March 2020
Project Number: C40029
The Iris Norte deposit follows the eastern side of the same gravity anomaly that hosts the Iris deposit. The strike of the gravity anomaly is rotated by approximately 55° clockwise compared to the southern area that hosts the Iris deposit. Iris Norte has a magnetic expression that is less pronounced than that seen over the Iris deposit.
9.4.2 Ground
Far West completed 17.6 line kilometres of IP survey through contractor Quantec Geofisica Ltda., Antofagasta from April to August 2004. The survey was designed to test for chargeable zones within known gravity and magnetic geophysical anomalies. The time-domain IP survey used a pole-dipole array with a 100 m station separation on lines oriented perpendicular to the general trend of airborne gravity anomalies. Stations were located using a differential GPS. The IP survey generated chargeability anomalies in various parts of the Santo Domingo area. Subsequent drilling of the anomalies demonstrated that IP is not a suitable method to distinguish between massive barren iron oxides and iron oxides that host copper sulphides. This is due to the fact that magnetite itself is chargeable and generates many anomalies in areas where barren iron oxide bodies are present. The application of IP as an exploration tool in the area was therefore discontinued.
9.5 Petrology, Mineralogy and Research Studies
Detailed petrography and mineralogy studies have been completed on selected areas within the Property. These studies have been completed to identify and quantify ore and gangue minerals and for the descriptions of textural variations in several rocks. Modal analysis studies (QEMSCAN) were performed on various mineralization types at Santo Domingo Sur to determine mineral species and their compositions for recovery tests and determining grinding parameters. Two theses have been completed on the Santo Domingo deposit: Daroch, G., 2011: Hydrothermal Alteration and Mineralization of the Iron Oxide
(-Cu–Au) Santo Domingo Sur Deposit, Atacama Region, Northern Chile: unpublished M.Sc. thesis, University of Arizona, Tucson, Arizona, United States, 90 p
Duran, M., 2008: Paragenesis of the Santo Domingo Sur Iron Oxide–Copper–Gold Deposit, Northern Chile: Unpublished M.Sc. thesis, Queen’s University, Kingston, Ontario, Canada, 100 p.

Santo Domingo Project Region III, Chile
NI 43-101 Technical Report
Page 9-5
March 2020
Project Number: C40029
9.6 Exploration Potential
The Property has been explored for its large tonnage potential as a primary consideration. There has been no exploration targeting small lenses of mineralization in the 1 Mt to 5 Mt range. Oxide mineralization has also not been targeted specifically. The San Domingo Sur, Iris and Iris Norte deposits and the Iris Mag prospect have been explored to a depth of approximately 350 m. Drilling below this level is very sparse, but deep drill holes at San Domingo Sur have intersected mineralization as deep as 650 m. The character and extent of deep mineralization has not been established and potential for additional mineralization exists. Additional potential exists for iron mineralization without copper, which so far has been deemed uneconomic by itself but has potential once an operation is built on the Property. The main iron potential is located around Iris Norte and to the south of San Domingo Sur where magnetite occurs in skarn zones of unknown size.

Santo Domingo Project Region III, Chile
NI 43-101 Technical Report
Page 10-1
March 2020
Project Number: C40029
10.0 DRILLING
10.1 Introduction
Between July 2003 and January 2019, a total of 616 core and RC holes (153,004 m) were drilled over the Property as a whole. This drilling is summarized in Table 10-1 by purpose and in Table 10-2 by hole type. Figure 10-1 provides a regional-scale collar location plan for this drilling. Drilling that supports the resource estimate or was used in support of the construction of the geological models, comprises 464 holes (120,168 m). This drilling included 348 RC drill holes in the target area for a total of 90,611 m and 50 diamond drill holes for a total of 16,275 m that was completed by Far West between May 2004 and June 2011. Subsequently, Capstone completed an infill campaign of an additional 12,140 m diamond drilling in 62 holes at Santo Domingo Sur and 1,142 m in four holes at Iris Norte. This drilling is summarized in Table 10-3 and shown in Figure 10-2.
10.2 Drill Methods
Over the exploration period, Chilean-based drill companies Harris y Cia., Major Drilling, Geo Operaciones and Captagua have undertaken drilling operations. The majority of the RC drilling was conducted using a truck mounted Schramm Rotadrill, a centre return hammer and a 5.5 in. (13.97 cm) carbide button bit. Core drilling used various drill rig types. HQ-size core (63.5 mm diameter) was typically drilled to a depth of approximately 300 m below which NQ-size core (47.6 mm diameter) was drilled. The drill programs were originally designed to target gravity and magnetic anomalies for mineralization of the Candelaria or Manto Verde IOCG style. Later programs consisted of core drill holes that were designed to provide information on geology, mineralization and structure and material for metallurgical testwork. Reverse circulation drill holes were designed to tighten the drill spacing within the initial proposed mining areas and to provide sample material for metallurgical testwork.
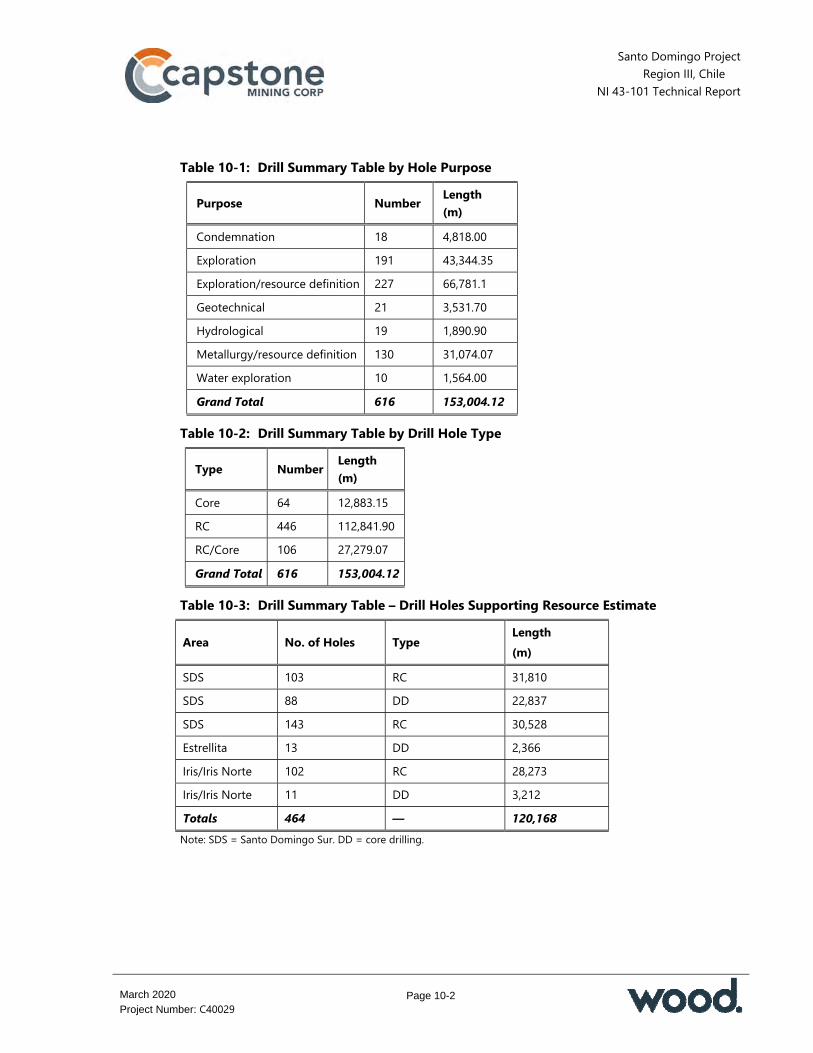
Santo Domingo Project Region III, Chile
NI 43-101 Technical Report
Page 10-2
March 2020
Project Number: C40029
Table 10-1: Drill Summary Table by Hole Purpose
Purpose Number Length (m)
Condemnation 18 4,818.00 Exploration 191 43,344.35 Exploration/resource definition 227 66,781.1 Geotechnical 21 3,531.70 Hydrological 19 1,890.90 Metallurgy/resource definition 130 31,074.07 Water exploration 10 1,564.00 Grand Total 616 153,004.12
Table 10-2: Drill Summary Table by Drill Hole Type
Type Number Length (m)
Core 64 12,883.15 RC 446 112,841.90 RC/Core 106 27,279.07 Grand Total 616 153,004.12
Table 10-3: Drill Summary Table – Drill Holes Supporting Resource Estimate
Area No. of Holes Type Length (m)
SDS 103 RC 31,810 SDS 88 DD 22,837 SDS 143 RC 30,528 Estrellita 13 DD 2,366 Iris/Iris Norte 102 RC 28,273 Iris/Iris Norte 11 DD 3,212 Totals 464 — 120,168 Note: SDS = Santo Domingo Sur. DD = core drilling.

Santo Domingo Project Region III, Chile
NI 43-101 Technical Report
Page 10-3
March 2020
Project Number: C40029
Figure 10-1: Property Drill Location Plan
Note: Figure prepared by RPA, 2020

Santo Domingo Project Region III, Chile
NI 43-101 Technical Report
Page 10-4
March 2020
Project Number: C40029
Figure 10-2: Deposit Area Drill Location Plan
Note: Figure prepared by RPA, 2019
Santo Domingo Project Region III, Chile
NI 43-101 Technical Report
Page 10-5
March 2020
Project Number: C40029
10.3 Logging Procedures
Drill cuttings and core were logged using a set of codes similar to those used for surface mapping. All geological data were entered digitally into summary logs. All digital data (analyses and geological logs) were subsequently entered into a Microsoft Access (Access) database for the Property. Data were exported as required to Gemcom (GEMS) for presentation and interpretation purposes. Core was placed into wooden core boxes by the drilling contractor at the drill site. The depth of each interval of core pulled was marked on a wooden block and placed in the core box. The core was then transported to a logging facility by personnel of the company at the time of drilling. At the logging facility the core was photographed and a geotechnical log completed. Geotechnical data recorded included recovery, rock quality designation (RQD), fracture frequency, rock alteration and weathering, structure type, angle and roughness, joint compressive strength (JCS) and bulk density. Cut core samples with a length of 15 cm or 20 cm were also collected and stored for subsequent triaxial and point load tests. The core was then geologically logged noting lithology, mineralogy and other characteristics using the same codes employed for logging of the RC cuttings. Structural information was also noted during core logging, something that was not possible for RC cuttings.
10.4 Recovery
Overall sample recoveries tended to be quite good throughout all drilling programs. RPA reviewed the recovery data for 37 holes and found that the recovery was well within acceptable limits. Recovery was calculated as a ratio of the actual core length in the box to the drilled length indicated on the metre blocks. It was noted that some intervals had recoveries greater than 100%, which is not realistic. These intervals tended to be just over 100% and in RPA’s opinion, are probably due to slight gaps between pieces of core that caused inaccurate measurements. After normalizing all of these spurious values to 100%, the length-weighted average recovery was 91.1%. RPA also noted the following: Minimum recorded recovery was 0% in one interval across a 2.2 m downhole
interval
Santo Domingo Project Region III, Chile
NI 43-101 Technical Report
Page 10-6
March 2020
Project Number: C40029
65 intervals had values greater than 100% recovery 24 out of the 4,199 measured intervals (0.6%) were below 50% recovery. All but
four of these low recovery intervals were less than a metre in length. 10.5 Collar Surveys
Drill collars were located using a differential GPS. Coordinates are considered by RPA to be accurate to within 1 m or less. Relative elevations between holes in close proximity (such as at Santo Domingo Sur) were determined using a tight chain and clinometer.
10.6 Downhole Surveys
Downhole surveying was conducted by Comprobe Ltda. (Comprobe) using a combination of gyroscope and accelerometer, with measurements taken every 10 m. RPA notes that the downhole survey instruments were not affected by magnetic interference.
10.7 Sample Length/True Thickness
Most holes are vertical or near-vertical because the mineralization on the Property tends to be horizontal or gently dipping. Approximately 25% of the holes included in the resource estimate were drilled at angles shallower than -80°. Inclined holes, particularly core holes, were drilled in order to establish the limits of mineralization at the edges of the deposits as well as to establish the structural framework at Estrellita, Iris and Iris Norte. Drill sections in Section 7 show the orientations of selected drill holes in relation to the mineralization at each deposit.
10.8 Summary of Drill Programs
10.8.1 Santo Domingo Sur
The Santo Domingo Sur deposit is defined by 191 drill holes (103 RC and 88 core holes), completed on an approximate 100 m spacing and reducing to 50 m spacing in the centre of the deposit. Drilling data indicate that the deposit strikes approximately northeast and dips at low angles to the northwest. A northwest-trending fault, only

Santo Domingo Project Region III, Chile
NI 43-101 Technical Report
Page 10-7
March 2020
Project Number: C40029
recognized in drill intersections, appears to have displaced the northeastern portion of the deposit down by approximately 45 m to 65 m. The southern and eastern margins of the deposit are interpreted to be structurally-controlled and are defined by drill holes into adjacent structural blocks that have a different geology. The western margin appears to be a transitional boundary from the tuff sequence to a sedimentary sequence in the west with gradually weakening manto development. Drilling below a depth of 350 m is sparse and mineralization below that depth is not well defined. The deposit remains open at depth.
10.8.2 Iris and Iris Norte
The Iris and Iris Norte deposits are defined by 113 drill holes (102 RC holes and 11 core holes) drilled on approximately 100 m spacings. The Iris deposit forms part of the eastern flank of a gravity anomaly that strikes north–northwest. The deposit is truncated by a west dipping fault on the western side and by a steeply east dipping fault on the eastern side that divides volcanic tuffs and flows in the west from limestone and calcareous sediments in the east. Iris Norte occupies part of the same gravity anomaly that hosts Iris, but in the Iris Norte area, the strike of the anomaly is north–northeast. Both Iris and Iris Norte also appear to be open at depth.
10.8.3 Estrellita
A total of 156 drill holes (143 RC and 13 core holes) have been completed in the Estrellita area. Mineralization is faulted down by approximately east–west-striking faults to the south and north of the main zone around the old workings where drill holes intersected the mineralized zone at deeper levels. Vertical displacement along the faults varies from about 60 m to as much as 100 m. The deposit remains open to the east and to the west. The zones are interpreted to be flat-lying, hence down-dip extensions are unlikely; however, there is potential for additional mantos to occur below the presently-drilled area.

Santo Domingo Project Region III, Chile
NI 43-101 Technical Report
Page 10-8
March 2020
Project Number: C40029
10.8.4 Exploration
Additional holes have been drilled to test other gravity and magnetic features in the Santo Domingo area and intersected widespread but discontinuous copper and iron mineralization around the four outlined deposits.
10.8.5 Twin Drilling
Three programs of twin core drilling, both for confirmation purposes and to collect material for metallurgical testing, have been conducted by Capstone. These programs were carried out in 2010, 2014–2015 and 2019. All programs were carried out in the area of the proposed Santo Domingo Sur open pit.
10.9 Geotechnical and Condemnation Drilling
10.9.1 Geotechnical Drilling
Geotechnical drilling was conducted by Far West between 2006 and 2010 and comprised a total of 28 oriented core drill holes (26 with geotechnical core logging), representing more than 7,000 m of core. The 2010 geotechnical campaign (four drill holes totalling 1,155 m) was supervised by AMEC. During 2011–2012, additional drilling was conducted by Capstone to gather geotechnical data to complete slope calculations for the Santo Domingo Sur/Iris pit and the Iris Norte pit. The 2011–2012 geotechnical/hydrological drilling campaign was designed and supervised by Amec and consisted of 16 bore holes, for a total of 2,841 m for Iris Norte, Santo Domingo Sur/Iris and the proposed TSF area.
10.9.2 Condemnation Drilling
Condemnation drilling was conducted by Far West during early 2011 and by Capstone during early 2012. A total of 3,576 m in 13 RC holes were drilled in the proposed waste rock facility (WRF), process plant and tailings areas. The condemnation drilling was in addition to 5,627 m in 20 old exploration drill holes that had been drilled within the boundaries of the proposed mine site installations (waste rock facility and process plant area).
Santo Domingo Project Region III, Chile
NI 43-101 Technical Report
Page 10-9
March 2020
Project Number: C40029
10.10 Comments on Section 10
In RPA’s opinion, the drilling has been conducted in a manner consistent with standard industry practices. The spacing and orientation of the holes are appropriate for the deposit geometry and mineralization style. RPA has not reviewed the geotechnical drilling or the condemnation drilling in detail.
Santo Domingo Project Region III, Chile
NI 43-101 Technical Report
Page 11-1
March 2020
Project Number: C40029
11.0 SAMPLE PREPARATION, ANALYSES and SECURITY
11.1 Sampling Methods
11.1.1 Geochemical Sampling
A total of 47 sediment samples were collected from drainages within and immediately peripheral to the Santo Domingo area. The samples were analyzed by ALS Chemex for gold and a 27-element inductively coupled plasma (ICP) package. Most drainage channels in the area were sampled. Approximately 200 g of -106 μm material was collected from each sample site using an Endecott No. 140 sieve (or equivalent) and simple bubble plots of copper and gold in sediments were produced.
11.1.2 Reverse Circulation Drilling
Reverse circulation drill cuttings were blown into a cyclone and collected every 2 m from top to bottom of each hole, regardless of lithology changes. This material was dumped directly into a riffle splitter with a bar separation of approximately 1 cm. Both parts of the initial split were reintroduced to the splitter and divided a second time to ensure adequate mixing of the entire sample. Half of this initial split was re-split and then split again. These three consecutive splits resulted in a final sample one-eighth the size of the initial complete sample. Apart from most overburden material and a few obviously barren bedrock intervals, all samples were sent for analyses. A 2 kg to 3 kg portion of the final split was bagged and ticketed with a unique assay number, ready to be sent to the laboratory for analyses. A second sample of 3 kg to 4 kg was collected from the other half of the final split and stored (buried) at or near the drill site.
11.1.3 Core Drilling
Samples for assay were marked at 1 m and 2 m intervals by technicians and subsequently adjusted by the geologist to correspond to major lithological contacts. For programs conducted prior to 2011, sample lengths were not less than 0.5 m and most did not exceed 2 m. The shortest and longest sample lengths in 2011–2012 were 0.7 m and 2.7 m, respectively and most samples were 2 m long. Sampled intervals were cut in half along the drill axis using a diamond saw. Half of the sample was returned to

Santo Domingo Project Region III, Chile
NI 43-101 Technical Report
Page 11-2
March 2020
Project Number: C40029
the core box and stored at the core facility. The other half was bagged and shipped (via ALS Chemex truck) to the ALS Chemex laboratory at La Serena or Antofagasta, Chile, for analyses.
11.2 Metallurgical Sampling
Metallurgical sampling is discussed in Section 13. 11.3 Density Determinations
Specific gravity (SG) determinations were performed by Far West Mining personnel on 1,990 core samples from 11 drill holes for different lithologies in the Estrellita deposit. Far West Mining made direct measurements on core samples using the water displacement method and calculated specific gravity using the formula: SG = Mair/(Mair-Mw) Where
Mair = weight of the dry sample in air
Mw = weight of the sample in water
In addition, 295 determinations were completed on RC samples from two drill holes at ACME Analytical Laboratories (ACME) in Chile. ACME used the pycnometer method in pulps prepared from RC samples. The specific gravity was determined using the following formula: SG = Ws/Wds x SGs Where Ws is the weight of the sample; Wds is the weight of the displaced solvent; and SGs is the specific gravity of the solvent. The most common solvent is acetone, but methanol can also be used.
RPA developed regression formulae based on the specific gravity values reported by Far West Mining to convert volumes to weights, using Fe concentration as the independent variable. The regression curve relationship was as follows: SG = 2.53 + 0.0276*Fe. A summary of the specific gravity data is included by major lithological unit in Table 11-1.

Santo Domingo Project Region III, Chile
NI 43-101 Technical Report
Page 11-3
March 2020
Project Number: C40029
Table 11-1: Summary Table, Specific Gravity
Rock Type No. of Samples
SG (t/m3)
Andesite 488 2.90 Andesite Tuff 685 3.05 Basement 9 2.85 Diorite 48 2.81 Dyke 70 2.69 Fault 34 3.06 Limestone 3 2.72 Manto (High Fe) 883 3.55 Sedimentary 7 2.75 Total Number SG Samples 2,227
Average SG 3.20
11.4 Magnetic Susceptibility
A total of 19,302 magnetic susceptibility determinations have been made to date. Plastic bags of sample reject material from the laboratory are shaken to homogenize the material then laid flat on a table. The magnetic susceptibility instrument is pressed against the plastic bag and the reading is taken. Measurements are taken at four locations in the sample and averaged. If there is a significant deviation between readings, the measurements are repeated until consistency is achieved between the four points. Of the readings, 2,093 were conducted on pulps owing to the lack of remaining reject material. Measurements taken on pulps routinely yield lower readings than those taken on rejects. For quality assurance, 191 pulp reject samples from the 2011–2012 drilling campaign were submitted to ALS Chemex in Perth, Australia, for percent magnetite analysis. Capstone reported that a correlation factor of 0.943 between the average of four magnetic susceptibility readings and percent magnetite was achieved.

Santo Domingo Project Region III, Chile
NI 43-101 Technical Report
Page 11-4
March 2020
Project Number: C40029
11.5 Analytical and Test Laboratories The primary analytical laboratory was ALS Chemex and the facilities in La Serena, Chile and Antofagasta, Chile were used. Both of these facilities have ISO 9001:2008 accreditation and La Serena also has ISO 17025 accreditation. The check laboratory was Andes Analytical Assay Ltda. In Santiago, which also holds ISO 9001:2008 accreditations.
11.6 Sample Preparation and Analysis
Upon arrival at the laboratory the RC and core samples were organized, recorded and prepared for analyses using ALS Chemex’s Prep-31 process. This process consists of: Drying at 60°C Crushing (jaw crusher) to minus #10 Tyler >70% Homogenizing and splitting to 500 g with a Jones splitter Storage of reject material (over 500 g) Pulverizing 500 g sample with a ring pulverizer to minus #200 Tyler >85% Storage in 250 g envelopes. All samples were analyzed for 27 elements using ICP methods. Samples were initially analyzed using ALS Chemex procedure ME-ICP61, which is ICP following four acid, total digestion (HF-HNO3–HclO4 acid digestion, HCl leach) and more recently by ME-ICP81. Copper values over 10,000 ppm were assayed using ALS Chemex method Cu-AA62, which involved total digestion and an atomic absorption spectroscopy (AAS) finish. Gold content was determined using method Au-AA24 (30 g sample, fire assay with an AAS finish). These analytical procedures conform to industry standards. The ME-ICP61 protocol was recognized as understating the iron content, particularly for high grades. The upper limit for ME-ICP61 is 50% Fe; this resulted in a significant downward bias in the block model iron grades in previous resource estimates. For the 2010 program onwards, the ALS Chemex ME-ICP81 protocol was implemented. This incorporated a more aggressive digestion (peroxide fusion) and has no upper limit to the iron assays. A total of 7,401 samples were submitted for re-analysis using ICP81,
Santo Domingo Project Region III, Chile
NI 43-101 Technical Report
Page 11-5
March 2020
Project Number: C40029
including all samples over 15% Fe inside the existing block model for which sample material was still available. Soluble copper analysis was conducted on 1,035 samples from 2011–2012 drilling at ALS Chemex in La Serena, Chile. Assay protocol was the ALS Chemex Cu-AA05 method for non-sulphide copper by dilute sulphuric acid leach and AAS finish on a 1 g sample.
11.7 Quality Assurance and Quality Control
An independent quality control/quality assurance (QA/QC) program was implemented by Far West to monitor the analytical results. Three types of quality control sample inserts were used during the drilling programs: Standards Blanks Duplicates. The QA/QC protocols have remained largely consistent throughout all programs conducted by Far West and Capstone. Minor changes have been implemented by Capstone to accommodate issues and recommendations from past programs and to include magnetic susceptibility measurements. Certified reference materials (CRMs), or standards, are inserted every 25th sample, constituting 4% of the total number of samples submitted. Blanks, consisting of common Portland cement, were inserted every 50th sample. Field duplicates are taken every 25th sample. No CRMs were inserted for cobalt, although the CRMs were analyzed for cobalt. At the Report effective date, Capstone was in the process of obtaining certification on the CRMs. Preliminary results appear to show that the cobalt assays for the standards were within reasonable parameters. RPA notes also that the blank material used prior to 2008 was found to contain significant amounts of sulphur, so blanks results for sulphur from the earliest drilling could not be used.
11.8 Databases
Drill cuttings and core were logged and data collected entered into a Microsoft Excel (Excel) spreadsheet. Each geologist was responsible for entering his/her own logs. Data

Santo Domingo Project Region III, Chile
NI 43-101 Technical Report
Page 11-6
March 2020
Project Number: C40029
from these individual “unproofed” logs were printed out and then checked line by line against the original handwritten log by a team of two geologists. Corrections were made and a “proofed” version of the individual log was saved. Each individual “proofed” geology log was then added to a “master geology” log. This master file was then available for further analysis and/or display by exporting the data in the required format. A separate assay ledger is also kept for each hole. Initially sample intervals and numbers are entered manually into the ledger and then transcribed into an Excel spreadsheet. The initial ledgers or logs are completed by the samplers at the drill site for RC cuttings and at the core logging facility for core. Inserted blanks, standards and duplicates are also recorded in this ledger. Assay results, when available from the laboratory, are cut and pasted into the digital ledger from an Excel file provided by the laboratory. Once complete, data from the ledger are imported to a master Access database containing all the drill assays. One person is responsible for management of the database, posting of final results and controlling user access. A copy of the database is imported to GEMS for interpretation and presentation purposes. Data for density, magnetic susceptibility and surveys are also captured in spreadsheets and then imported to the master Access database. Capstone has a corporate policy on data backup and the database is subject to regular backup procedures.
11.9 Sample Security
The logging facility is fenced, locked when not occupied and is secure. Samples are handled only by company employees or company designates (i.e. ALS Chemex personnel). Once leaving the drill camp, sample security could not be confirmed. However, Capstone advises that, in virtually all cases, copper estimates in logged chips correlate well with analytical results.

Santo Domingo Project Region III, Chile
NI 43-101 Technical Report
Page 11-7
March 2020
Project Number: C40029
11.10 Comments on Section 11
In RPA’s opinion: The sampling methodologies employed by Far West Mining and Capstone are
consistent with industry best practice and appropriate for the mineralization style. The sampling is configured such that it will be representative of the deposit as a whole
The database is reasonably free from error and suitable for use in Mineral Resource estimation
The standards assays were carried out at an acceptable insertion rate, were reviewed in a timely fashion and the results triggered reasonable and appropriate responses. The standards results indicate that the assaying was generally of good quality and acceptable for use in Mineral Resource estimation.
Santo Domingo Project Region III, Chile
NI 43-101 Technical Report
Page 12-1
March 2020
Project Number: C40029
12.0 DATA VERIFICATION
12.1 Introduction
Data verification has been undertaken by third parties, including RPA, in support of technical reports on the Santo Domingo property. Data verification was reportedly conducted by Höy and Allen (2005) in 2005; however, details of this work are no longer available. Prior to 2012 a number of verification studies were undertaken by RPA in support of technical reports on the Santo Domingo property by Lacroix (2006), Lacroix and Rennie (2007), Amec (2008) and Rennie (2009). Work completed included database verification of the database at the time, independent witness sampling, drill collar location checks, downhole survey reading checks and investigation of the potential for down hole contamination in RC drill holes. No material errors, inconsistencies, or discrepancies were noted. More recent validation exercises conducted by RPA are described below in Sections 12.2, 12.3 and 12.4.
12.2 RPA (2012)
RPA undertook the additional data verification steps in support of the 2012 Mineral Resource estimate. This work consisted of importing drill data collected since 2009, inspection and validation. A few errors were captured during the import and validation; these were corrected. RPA also reviewed the validation work conducted by Capstone personnel. No material errors, inconsistencies, or discrepancies were noted.
12.3 RPA (2018)
The cobalt database was provided to RPA in Excel format. No inconsistencies were noted. RPA verified cobalt entries in the Excel sheet with the assay certificates available. No errors, inconsistencies or discrepancies were noted. RPA checked the results of the analytical QA/QC programs, reviewing standard, blank and duplicate data.
Santo Domingo Project Region III, Chile
NI 43-101 Technical Report
Page 12-2
March 2020
Project Number: C40029
12.4 RPA (2019)
As discussed in Section 12.5.2, RPA conducted a review of the 2019 twin drilling results and concluded that there was reasonably good agreement between the twinned holes and that there was no evidence of systematic bias in the assay values.
12.5 RPA Verification Results
12.5.1 Analytical QA/QC
12.5.1.1 Standards Certified reference materials, or standards, were inserted every 25th sample, constituting 4% of the total number of samples submitted. RPA reviewed the CRM results for copper, iron, gold and sulphur and found that they were generally within an acceptable tolerance limit.
12.5.1.2 Blanks Blanks, consisting of common Portland cement, were inserted every 50th sample during the 2004 to 2010 programs and analyzed for copper as well as for gold if the copper results exceeded 0.1% Cu. More recently analyses for iron were included. For the most part the blanks results were within a reasonable tolerance, although some of the copper results suggested that either there was some contamination, or the blank material contained a high background concentration of copper. RPA further notes that there appears to be sulphur in the blank material from this period, as well. For the 2011–2012 drill programs, the same 1 in 50 insertion rate for the blanks was used as in previous programs. There were two blank failures for the 2011–2012 drilling campaign. In RPA’s opinion, this was an acceptable failure rate and there are no concerns regarding the blanks assay results for the 2011–2012 definition drilling.
12.5.1.3 Duplicates The Santo Domingo property standard is for field duplicates to be taken every 25th sample. Core field duplicates consist of quarter-core splits. Prior to December 2005, RC duplicates were collected from the cuttings remaining after the primary sample had been taken. This protocol has since been modified and the duplicate now comprises a split from the primary sample.
Santo Domingo Project Region III, Chile
NI 43-101 Technical Report
Page 12-3
March 2020
Project Number: C40029
From 2004–2007, duplicates were analyzed for copper and gold. RPA conducted t-test analyses on the results and determined that the differences in paired values were not significant. Scatter diagrams and relative difference plots comparing original and duplicate results indicated also that there were no apparent biases. RPA conducted t-test analyses on the duplicates for copper and gold from the 2008–2009 program and found a bias in the gold results. Re-runs of the duplicate analyses did not show the same bias. Duplicated data from the 2010 drill program were collected and plotted on scatter and precision diagrams configured to show each duplicate pair relative to an error limit. RPA reviewed the duplicates results and confirmed that they were within an acceptable tolerance. Field duplicate data from the 2011–2012 drill programs were plotted on scatter diagrams comparing the duplicate result to the original. RPA reviewed the duplicates results and noted that there were apparent biases in both the copper and gold results. However, when results from one outlying pair were removed the bias was eliminated. In RPA’s opinion, this indicated that the field duplicate results were reasonably unbiased. It was also noted that the degree of scatter was somewhat high, even for field duplicates. Capstone’s failure criterion for field duplicates is that 10% or less of pairs should differ by more than 30%. In RPA’s opinion, higher scatter between duplicate pairs can be indicative of higher natural variability in the metal content of the deposit, improper sampling and/or an issue in the laboratory with reproducibility. Increased variability of assays, regardless of the cause, can result in a reduction in the accuracy of local kriged block grades. In RPA’s opinion, the impact of this on the grade interpolation is not likely to be severe. In addition, the lack of any bias in the results indicated that there would not be any material effect on the global grades. RPA considered this to be an issue for follow-up with the laboratory, but it was not considered to be a serious concern with respect to the Mineral Resource estimate.
12.5.1.4 Pulp Duplicates In 2012 a suite of 77 pulp duplicates comprising 2.1% of the total was collected and sent to an alternate laboratory Andes Analytical Assay Ltda., Santiago. Initial results of the pulp duplicates assays suggested that there were significant biases for gold, copper and iron.
Santo Domingo Project Region III, Chile
NI 43-101 Technical Report
Page 12-4
March 2020
Project Number: C40029
Capstone personnel consulted with the laboratory staff and it was determined that the apparent biases were due to incomplete digestion of the sample material. The samples were re-run using the proper analytical method and the bias was eliminated. Biases were also apparent for iron and gold, but in the opposite sense; that is, the secondary laboratory results were higher than the primary. As with copper the bias occurs for only some samples.
12.5.1.5 Magnetic Susceptibility Magnetic susceptibility measurements were conducted to provide a basis for estimation of the proportion of the iron that could be recovered by magnetic means. Most of the measurements were carried out on reject material; however, in 2,093 cases, due to a lack of reject material, it was necessary to use pulps, which tended to yield higher readings than rejects. In RPA’s opinion, there is a significant bias between magnetic susceptibility measurements taken on pulps versus rejects. In order to ameliorate the apparent bias, a regression line equation was derived from a scatter plot of rejects versus pulps. The equation was then used to adjust the pulp measurements downwards to an estimated reject value. The regression line used to derive the equation was deliberately chosen to be conservative. In RPA’s opinion, the use of factors on analytical data is generally undesirable; however, in this case a conservative approach has been applied that is well supported with testwork and hence is considered to be acceptable. Checks have been routinely carried out on standard reference materials to confirm that the magnetic susceptibility instrument was reporting consistently. The reference materials comprised 13 different samples prepared from reject material. The results from these calibration tests were plotted in chronological order to monitor for instrument drift over time. Following the 2010 program it was noted that for some of the reference samples there were significant variations from earlier measurements. For the 2011 drill program it was determined that the instrument drift was sufficiently severe that a replacement was warranted. A new instrument was acquired and its readings were calibrated to the old ones to ensure consistency in the data. Measurements were taken with both old and new instruments on a suite of 551 samples from 10 holes and plotted on a scatter diagram. The regression line derived from this diagram was then used to adjust the new instrument readings relative to the old one. In RPA’s opinion, the scatter diagram displays a relatively tight clustering of
Santo Domingo Project Region III, Chile
NI 43-101 Technical Report
Page 12-5
March 2020
Project Number: C40029
points and a clear regression trend, suggesting that the correction process should yield results consistent with previous measurements. Readings were collected from the 13 magnetic susceptibility reference standards over a period of one month with the new instrument and averaged. These average measurements were plotted against the average measurements obtained with the old instrument over the entire period for which it was used. In RPA’s opinion, the results from the calibration standards show good agreement with the measurements obtained from the drill samples, which further supports the regression line correction curve.
12.5.2 Twin Holes
Several holes have been twinned over the course of the exploration work conducted on the Property. Most of these twins were drilled in the 2010 campaign in order to acquire magnetic susceptibility data in areas for which sample material was no longer available for testing. Additional twin drilling was carried out in 2014–2015 and 2019. For the 2010 twin drilling, RPA matched intervals of 4 m composites for each of the pairs and plotted the grades for gold, copper and iron to compare the results. In RPA’s opinion, for most of the pairs, the assay results compared reasonably well. The data were observed to be quite noisy at the 4 m resolution; however, it was generally noted that high- and low-grade zones matched and that the grades tended to cluster in the same ranges. Only one pair of twinned holes (4a3-06-099/4a3-10-099-B) displayed significant differences that could not be attributed to hole deviation. In 2018, RPA compared copper, gold, iron and cobalt assay values of the drilling done in 2014–2015 with the corresponding twin hole in the database. In RPA’s opinion, for most of the pairs, the assay results compared reasonably well. Capstone drilled another 13 twin holes in January 2019 to acquire additional material for metallurgical testwork. Some of these holes were drilled at the same locations as the 2014–2015 program. RPA compared the results from the 2019 twin drilling program with those from the 2014–2015 and earlier programs. Assay results for gold, copper, iron, magnetic susceptibility and cobalt were generated across the intervals bounded by the resources wireframe models. The grades and overall thicknesses of the zones intersected were observed to be generally consistent although some significant local variability in grades were noted. There did not appear to be a consistent bias between the newer and older generation of drill results.

Santo Domingo Project Region III, Chile
NI 43-101 Technical Report
Page 12-6
March 2020
Project Number: C40029
In RPA’s opinion, the twinning has provided a reasonably consistent verification of the earlier drill results particularly considering the differences in assay protocols and possible survey errors.
12.5.3 Mass Recovery/Magnetic Susceptibility
Magnetic susceptibility readings were used to estimate the proportion of the mass of each block that could be recovered by low intensity magnetic separation (LIMS) methods. Far West Mining conducted Davis Tube (DT) testwork in order to first determine if a saleable iron concentrate could be produced and, secondly to calibrate the expected mass recovery to magnetic susceptibility. In 2008, a bulk sample was collected by blending drill cuttings from a number of Santo Domingo Sur and Iris drill holes. This sample was subject to bulk flotation to remove the sulphide components and the tailings from this process were subject to iron recovery testing. The results of the testwork indicated that LIMS would produce a good quality magnetite iron concentrate. The iron mineralization at Santo Domingo Sur is dominantly magnetite which can be recovered by LIMS and hematite which generally cannot be recovered by LIMS. Consequently, the assays for total iron collected to date do not provide a basis for estimation of the recoverable iron component. Davis Tube, Satmagan and magnetic susceptibility tests were conducted on a set of 22 sub-samples from the bulk composite. A very strong linear relationship was found to exist between the magnetic susceptibility and both Satmagan and DT mass recovery readings. Capstone subsequently embarked on an expanded testing program in order to confirm the observed relationship and develop a reliable regression line equation for relating magnetic susceptibility to mass recovery (Figure 12-1).

Santo Domingo Project Region III, Chile
NI 43-101 Technical Report
Page 12-7
March 2020
Project Number: C40029
Figure 12-1: Magnetic Susceptibility versus Mass Recovery
y = -3E-09x2 + 0.0011x
-
10.00
20.00
30.00
40.00
50.00
60.00
70.00
80.00
90.00
100.00
0 20000 40000 60000 80000 100000 120000
Magnetic Susceptibility
Da
vis
Tu
be
ma
ss
re
co
ve
ry (
%
Note: Figure prepared by RPA, 2012.
In order to model the mass recovery with magnetic susceptibility, Capstone chose an equation which skirts along the bottom of the point distribution. The relationship thus derived is: MR% = (1.1063 x MS) + (-0.003 x MS2) Where: MS = magnetic susceptibility reading/1,000
This line represents the minimum mass recovery observed for the corresponding magnetic susceptibility values; in RPA’s opinion, this will result in conservative estimates of mass recovery.
12.5.4 Cobalt
Throughout the history of the Santo Domingo property, cobalt has been included in the suite of elements analyzed but was not generally considered to be of economic interest. Therefore, cobalt was not fully included in the assay QA/QC protocols employed by Capstone. More recently, cobalt has been recognized as having potential for contributing to the economics and it was necessary to verify the cobalt assay results so that this element can be used in resource estimation.

Santo Domingo Project Region III, Chile
NI 43-101 Technical Report
Page 12-8
March 2020
Project Number: C40029
Capstone personnel reviewed the assay database and concluded that cobalt analyses had been conducted on a large number of blanks, standards and duplicates between 2004 and 2012. Table 12-1 summarizes the number and type of QA/QC sampling collected. Table 12-1: Summary of Cobalt QA/QC Data
QA/QC Control Sample Number Insertion Rate (%) Period
Blanks 1,258 2.2 2004–2012 Standards (no co-certification) 486 4.5 2009–2012 Field duplicates 1,935 3.4 2004–2012 Coarse reject duplicates 170 0.3 2008–2010 Pulp duplicates 171 0.3 2008–2010
The blanks and duplicates data were collated, analyzed and found to be within an acceptable range. The results for the standards were plotted on performance charts and found to be consistent with no trends or severe biases indicating a satisfactory level of precision. The standards, however, had not been certified for cobalt, hence it was not possible to fully ascertain the accuracy of the results. In order to bring the cobalt assay QA/QC results up to the same level of rigour as the rest of the resource database, Capstone has embarked on a certification program for the standards by means of a series of round robin analyses at a number of commercial laboratories in addition to the primary laboratory (ALS Chemex). At the time of writing this report (February 2020), results had been received from six laboratories and the values reported were similar to those obtained from the primary laboratory. RPA reviewed the Capstone analyses of the QA/QC data for cobalt and confirms that there no concerns were found with the cobalt assays. RPA recommends that Capstone proceed with the cobalt certification for the standards.
12.6 Comments on Section 12
In RPA’s opinion: The standards results indicate that the assaying was generally of good quality and
acceptable for use in Mineral Resource estimation
Santo Domingo Project Region III, Chile
NI 43-101 Technical Report
Page 12-9
March 2020
Project Number: C40029
For the 2004–2010 drill programs, for the most part the blanks results were within a reasonable tolerance, although some of the copper results suggested that either there was some contamination or that the blank material contained a high background concentration of copper. There are no concerns regarding the blank assay results for the 2011–2012 definition drilling
Field duplicate results are reasonably unbiased The approach used for monitoring and calibration of the magnetic susceptibility
instrument is reasonably rigorous and indicates that the magnetic susceptibility data should be valid
Twin hole drilling has provided a reasonably consistent verification of the earlier drill results particularly considering the differences in assay protocols and possible survey errors
The assay QA/QC results for cobalt, while not up to the same standard as the economic elements, indicate that there are no concerns with cobalt analyses. Capstone has embarked on a certification program for cobalt in the reference materials; RPA concurs with this approach.

Santo Domingo Project Region III, Chile
NI 43-101 Technical Report
Page 13-1
March 2020
Project Number: C40029
13.0 MINERAL PROCESSING AND METALLURGICAL TESTING
13.1 Metallurgical Testwork
13.1.1 Summary
A summary of the metallurgical testwork performed to date is provided in Table 13-1. 13.1.2 Physical Characterization
During the 2011 pre-feasibility study phase, a total of 128 core samples were selected, with the following tests completed: Bond ball mill work index (BWi) Bond rod mill work index (RWi) Semi-autogenous grind (SAG) mill competency (SMC), giving breakage (Axb) values Abrasion index (Ai) 110 samples defined as Derrick Barratt & Associates (DJB) or Main Drill Core
Samples; results from this testing were used as a preliminary estimate for comminution requirements
JKSimMet SMC (SMC) testing was completed on an additional 19 drill samples. These results were used to finalize the 2011 pre-feasibility study comminution requirements for the grinding circuit.
As part of the 2014 feasibility study phase, the following was undertaken: Two comminution circuit sizing exercises were completed 91 Main Drill Core Samples were re-evaluated using the SMC test methodology to
verify the comminution circuit throughput capacities A second SMC testing campaign using 58 samples (Infill Samples) was completed
to increase the data set and confidence level of the mill power requirements. The 58 Infill Samples were taken within the area of the proposed Santo Domingo open pit and were obtained from within the area planned to be the source of the material processed in the first 3 years of mine production.

Santo Domingo Project Region III, Chile
NI 43-101 Technical Report
Page 13-2
March 2020
Project Number: C40029
Table 13-1: Metallurgical Testwork Summary Table
Date Testwork Type Laboratory/Testwork Facility Work Performed
2006 Comminution SGS Santiago Grindability response testwork on two drill core samples
2008
Comminution SGS Mineral Services Grindability response testwork on five composite drill core samples. Included BWi; Bond Ball Modified tests; RWi; and SAG power index (SPI) tests
Cu flotation SGS Santiago Two master composites (MC-A and MC-B). Copper rougher kinetic, Cu and pyrite rougher kinetic and Cu cleaner and pyrite rougher flotation tests; pyrite rougher flotation on copper rougher tailings to maximize recovery of sulphur from the flotation rougher tailings
2009 Magnetic concentrate
SGS Lakefield Response of composite samples to magnetic separation using DT laboratory tests Studien-Gesellschaft für Eisenerz-Aufbereitung (SGA) LIMS testing to develop a marketable magnetic concentrate
Compañía Minera del Pacifico (CMP) Testing of magnetic concentrate
2010
Comminution SGS Santiago Grindability program on 128 samples; ball mill calibration program on four samples Phillips Enterprises (Advanced TerraTesting Inc.) Crushing and geotechnical program on 128 samples
Cu flotation
SGS Santiago Cu mineralogy
Aminpro Chemical and mineralogical analysis (QEMSCAN) and rougher kinetic flotation tests on five samples; all rougher flotation tests were conducted using sea water
SGS Lakefield
Cu flotation performance and recoveries on five samples of the same composite; Cu performance and recovery testwork on three different composite samples from Santo Domingo Sur; testing used three different water types: SGS Lakefield water, Capstone-supplied saline water and synthetic sea water; five flotation tests to determine the effect of primary grind on Cu recovery
Magnetite concentrate SGA Magnetite recovery tests on five whole ore samples of the same composite at a final grind of less than
63 µm
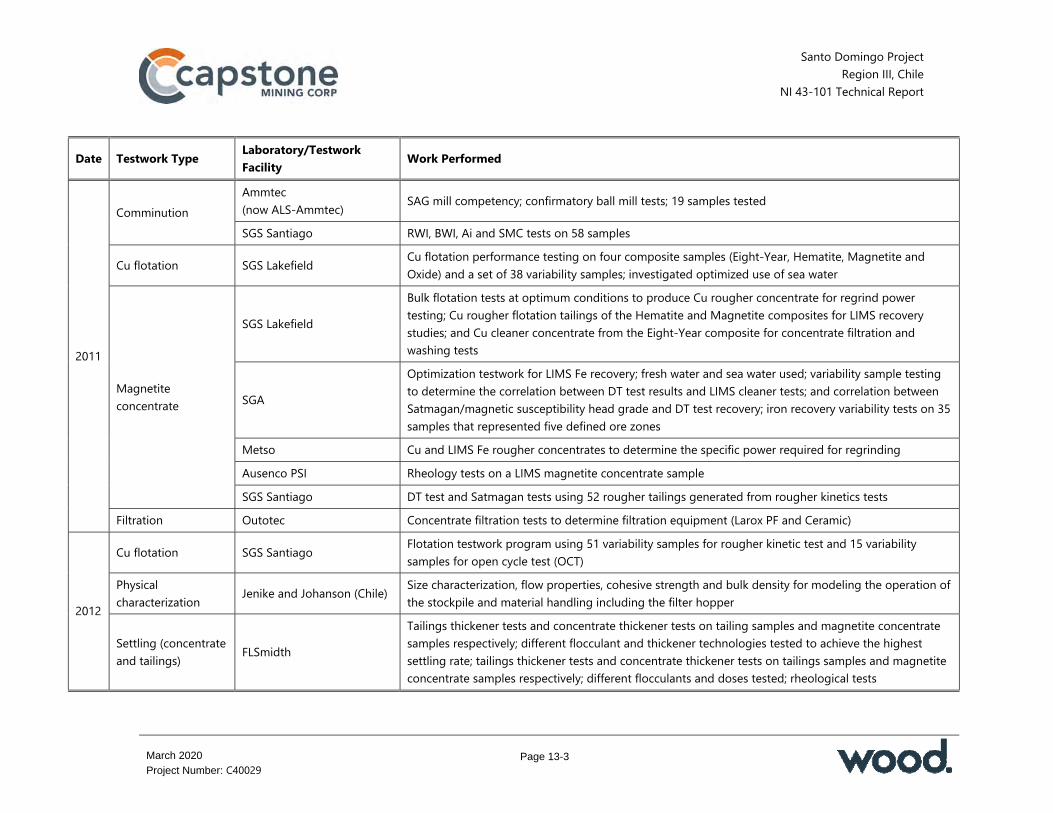
Santo Domingo Project Region III, Chile
NI 43-101 Technical Report
Page 13-3
March 2020
Project Number: C40029
Date Testwork Type Laboratory/Testwork Facility Work Performed
2011
Comminution Ammtec (now ALS-Ammtec) SAG mill competency; confirmatory ball mill tests; 19 samples tested
SGS Santiago RWI, BWI, Ai and SMC tests on 58 samples
Cu flotation SGS Lakefield Cu flotation performance testing on four composite samples (Eight-Year, Hematite, Magnetite and Oxide) and a set of 38 variability samples; investigated optimized use of sea water
Magnetite concentrate
SGS Lakefield
Bulk flotation tests at optimum conditions to produce Cu rougher concentrate for regrind power testing; Cu rougher flotation tailings of the Hematite and Magnetite composites for LIMS recovery studies; and Cu cleaner concentrate from the Eight-Year composite for concentrate filtration and washing tests
SGA
Optimization testwork for LIMS Fe recovery; fresh water and sea water used; variability sample testing to determine the correlation between DT test results and LIMS cleaner tests; and correlation between Satmagan/magnetic susceptibility head grade and DT test recovery; iron recovery variability tests on 35 samples that represented five defined ore zones
Metso Cu and LIMS Fe rougher concentrates to determine the specific power required for regrinding Ausenco PSI Rheology tests on a LIMS magnetite concentrate sample SGS Santiago DT test and Satmagan tests using 52 rougher tailings generated from rougher kinetics tests
Filtration Outotec Concentrate filtration tests to determine filtration equipment (Larox PF and Ceramic)
2012
Cu flotation SGS Santiago Flotation testwork program using 51 variability samples for rougher kinetic test and 15 variability samples for open cycle test (OCT)
Physical characterization Jenike and Johanson (Chile) Size characterization, flow properties, cohesive strength and bulk density for modeling the operation of
the stockpile and material handling including the filter hopper
Settling (concentrate and tailings) FLSmidth
Tailings thickener tests and concentrate thickener tests on tailing samples and magnetite concentrate samples respectively; different flocculant and thickener technologies tested to achieve the highest settling rate; tailings thickener tests and concentrate thickener tests on tailings samples and magnetite concentrate samples respectively; different flocculants and doses tested; rheological tests

Santo Domingo Project Region III, Chile
NI 43-101 Technical Report
Page 13-4
March 2020
Project Number: C40029
Date Testwork Type Laboratory/Testwork Facility Work Performed
Outotec Tailings thickener tests and concentrate thickener tests on tailing samples and magnetite concentrate samples respectively; 10 tests completed for magnetite concentrate and 11 tests completed for tailings; two additional tests completed to compare two different flocculants
Filtration Outotec (Chile) Filtration tests for a magnetite concentrate at 65% w/w solids; eight tests completed to obtain a chloride concentration lower than 300 ppm Cl
2013
Comminution Moly-Cop Chile Grinding test program using rougher magnetic concentrate samples provided by Capstone to determinate conditions for the design and operation of the magnetite regrind mill
Cu flotation SGS Lakefield Rougher kinetics, cleaner flotation, LIMS tests and rougher magnetic circuit tests were completed on three composites (SD1, Hematite and Magnetite); tailings produced used for settling and rheological testing
Physical characterization Patterson & Cooke (Chile) Rheology test program using two tailings samples to determinate the physical properties of the tailings
Settling
Outotec (Chile) Tailings thickener test using Hematite and Magnetite tailings provided by SGS Lakefield; two stages of thickening tested using different flocculants and doses; rheological tests
FLSmidth (USA) Sedimentation and rheology testing programs for Hematite and Magnetite tailings provided by SGS Lakefield to determine the sizing and operational parameters for a tailings thickeners considering both composites
Tenova Delkor (Canada) Settling and thickening tests on two composites (Hematite and Magnetite) provided by SGS Lakefield; sizing for the tailings thickeners completed considering two separate stages of thickening
2014
Cu flotation SGS Santiago Rougher, cleaner kinetics and locked cycle tests (LCT) completed on three Amec-selected composites; variability samples (open circuit and locked cycle) tested to validate the algorithm developed during the 2011 pre-feasibility study
Magnetite Concentrate ALS Ammtec
Magnetite recovery program using three composite samples selected by AMEC and Capstone; optimum magnetic rougher and cleaning grind sizes and conditions including washing and magnetic strengths was confirmed for design purposes
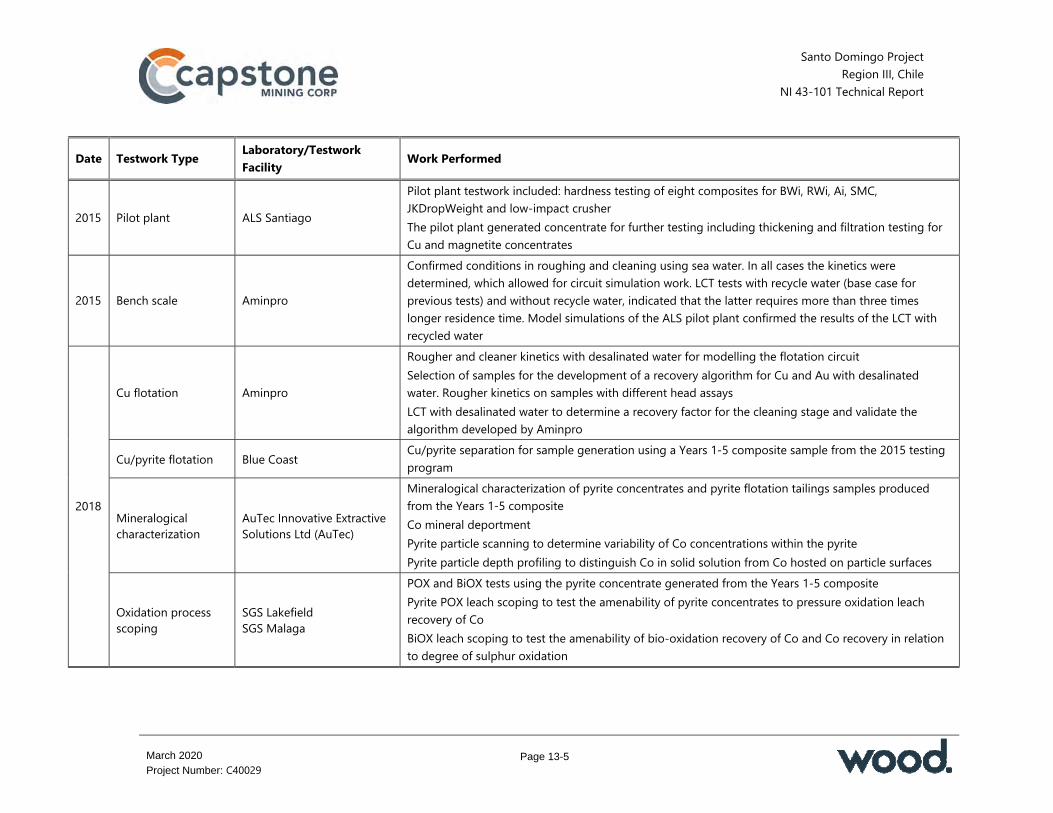
Santo Domingo Project Region III, Chile
NI 43-101 Technical Report
Page 13-5
March 2020
Project Number: C40029
Date Testwork Type Laboratory/Testwork Facility Work Performed
2015 Pilot plant ALS Santiago
Pilot plant testwork included: hardness testing of eight composites for BWi, RWi, Ai, SMC, JKDropWeight and low-impact crusher The pilot plant generated concentrate for further testing including thickening and filtration testing for Cu and magnetite concentrates
2015 Bench scale Aminpro
Confirmed conditions in roughing and cleaning using sea water. In all cases the kinetics were determined, which allowed for circuit simulation work. LCT tests with recycle water (base case for previous tests) and without recycle water, indicated that the latter requires more than three times longer residence time. Model simulations of the ALS pilot plant confirmed the results of the LCT with recycled water
2018
Cu flotation Aminpro
Rougher and cleaner kinetics with desalinated water for modelling the flotation circuit Selection of samples for the development of a recovery algorithm for Cu and Au with desalinated water. Rougher kinetics on samples with different head assays LCT with desalinated water to determine a recovery factor for the cleaning stage and validate the algorithm developed by Aminpro
Cu/pyrite flotation Blue Coast Cu/pyrite separation for sample generation using a Years 1-5 composite sample from the 2015 testing program
Mineralogical characterization
AuTec Innovative Extractive Solutions Ltd (AuTec)
Mineralogical characterization of pyrite concentrates and pyrite flotation tailings samples produced from the Years 1-5 composite Co mineral deportment Pyrite particle scanning to determine variability of Co concentrations within the pyrite Pyrite particle depth profiling to distinguish Co in solid solution from Co hosted on particle surfaces
Oxidation process scoping
SGS Lakefield SGS Malaga
POX and BiOX tests using the pyrite concentrate generated from the Years 1-5 composite Pyrite POX leach scoping to test the amenability of pyrite concentrates to pressure oxidation leach recovery of Co BiOX leach scoping to test the amenability of bio-oxidation recovery of Co and Co recovery in relation to degree of sulphur oxidation
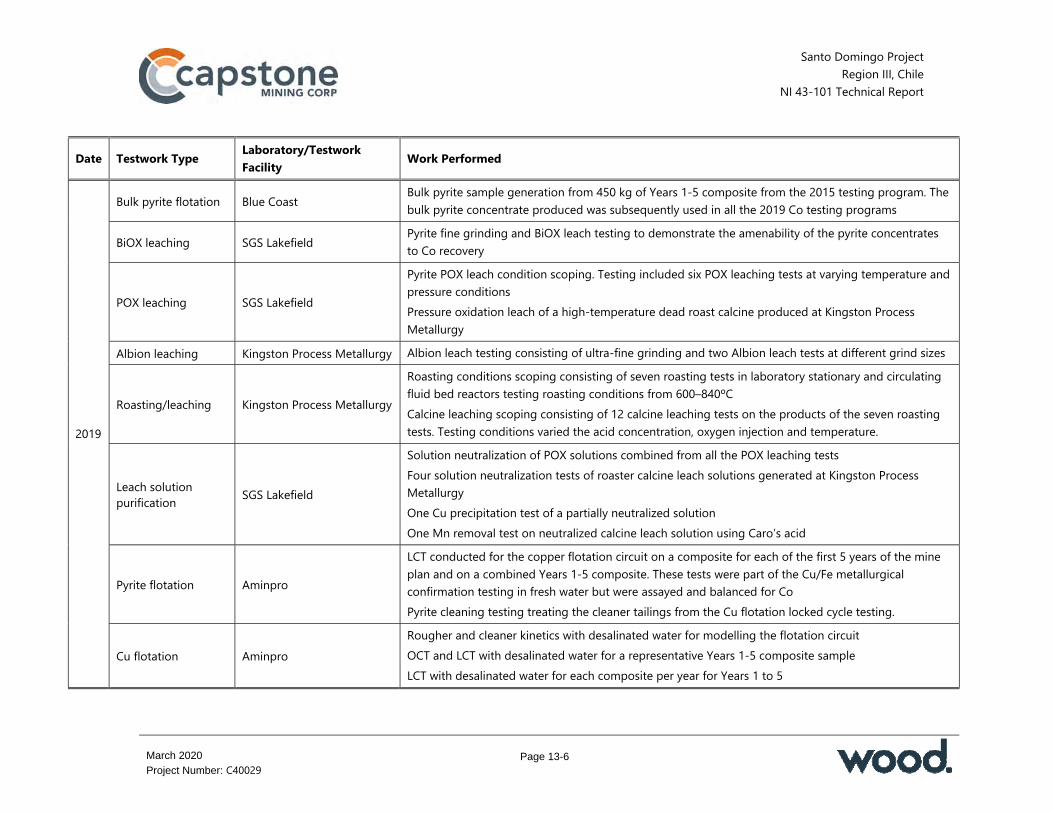
Santo Domingo Project Region III, Chile
NI 43-101 Technical Report
Page 13-6
March 2020
Project Number: C40029
Date Testwork Type Laboratory/Testwork Facility Work Performed
2019
Bulk pyrite flotation Blue Coast Bulk pyrite sample generation from 450 kg of Years 1-5 composite from the 2015 testing program. The bulk pyrite concentrate produced was subsequently used in all the 2019 Co testing programs
BiOX leaching SGS Lakefield Pyrite fine grinding and BiOX leach testing to demonstrate the amenability of the pyrite concentrates to Co recovery
POX leaching SGS Lakefield
Pyrite POX leach condition scoping. Testing included six POX leaching tests at varying temperature and pressure conditions Pressure oxidation leach of a high-temperature dead roast calcine produced at Kingston Process Metallurgy
Albion leaching Kingston Process Metallurgy Albion leach testing consisting of ultra-fine grinding and two Albion leach tests at different grind sizes
Roasting/leaching Kingston Process Metallurgy
Roasting conditions scoping consisting of seven roasting tests in laboratory stationary and circulating fluid bed reactors testing roasting conditions from 600–840ºC Calcine leaching scoping consisting of 12 calcine leaching tests on the products of the seven roasting tests. Testing conditions varied the acid concentration, oxygen injection and temperature.
Leach solution purification SGS Lakefield
Solution neutralization of POX solutions combined from all the POX leaching tests Four solution neutralization tests of roaster calcine leach solutions generated at Kingston Process Metallurgy One Cu precipitation test of a partially neutralized solution One Mn removal test on neutralized calcine leach solution using Caro’s acid
Pyrite flotation Aminpro
LCT conducted for the copper flotation circuit on a composite for each of the first 5 years of the mine plan and on a combined Years 1-5 composite. These tests were part of the Cu/Fe metallurgical confirmation testing in fresh water but were assayed and balanced for Co Pyrite cleaning testing treating the cleaner tailings from the Cu flotation locked cycle testing.
Cu flotation Aminpro Rougher and cleaner kinetics with desalinated water for modelling the flotation circuit OCT and LCT with desalinated water for a representative Years 1-5 composite sample LCT with desalinated water for each composite per year for Years 1 to 5

Santo Domingo Project Region III, Chile
NI 43-101 Technical Report
Page 13-7
March 2020
Project Number: C40029
Date Testwork Type Laboratory/Testwork Facility Work Performed
Variability tests for algorithm update Simulation and modelling of the flotation circuit Co flotation tests
Magnetite concentrate
SGS Santiago Magnetic separation tests using LIMS including rougher and cleaner stages with desalinated water, to confirm circuit performance and design criteria
Polimin Magnetic separation test using LIMS including rougher and cleaner stages
Santo Domingo Project Region III, Chile NI 43-101 Technical Report
Page 13-8
March 2020
Project Number: C40029
During the 2015 pilot plant testwork, eight composites were included for hardness analysis (these composites represented each of the first 5 years of operation and a combined composite). BWi, RWi, Ai, SMC, JKDropWeight and low-impact crusher were evaluated. The Main Drill Core Samples returned the following results: For the Iris and Iris Norte ores there is no significant difference in competency
between Magnetite and Hematite ores. The Iris ores are the softest materials, with an average Axb value of about 80
The BWi showed no significant differences between the Hematite and Magnetite zones for the Iris and Iris Norte areas
The Santo Domingo material shows significant differences between the Hematite and Magnetite feed types, with a 25% variance in the Axb values of the ore types. The Hematite zone is the most competent with the lower Axb average value of 39.3
In the Santo Domingo deposit, the Hematite zone is 15% harder than the Magnetite zone with respect to BWi, with BWi indices of 14.1 kWh/t and 12.1 kWh/t respectively.
The Infill Samples had the following characteristics: The Hematite ores have an Axb value of 42.2 and are the most competent ores in
the first 3 years of operation. The Magnetite ores are 10% less competent with an average Axb of 46.5
There is a similar trend with respect to the BWi with the Hematite ores being 15% harder than the Magnetite ores with BWi values of 13 kWh/t and 11.2 kWh/t respectively
The RWi showed differences of around 10%, with averages of 14.4 kWh/t and 13.4 kWh/t for the Hematite and Magnetite ores respectively.
13.1.3 Comminution Circuit Testwork
13.1.3.1 Crushing and Grinding The comminution characterization pilot plant program started with an initial assessment of drill core from the 2015 drilling program. The comminution characterization program was focused on generating data to evaluate comminution
Santo Domingo Project Region III, Chile NI 43-101 Technical Report
Page 13-9
March 2020
Project Number: C40029
response to obtain process design parameters. ALS Santiago executed the following comminution tests: crushing work index, SMC, Ai, Bwi and Rwi tests. Bond ball mill work index minimum and maximum values were 10.2 kWh/t and 14.3 kWh/t, respectively, averaging 12.4 kWh/t. These results indicate that the composites are considered to be moderately soft. Bond rod mill work index minimum and maximum values were 15 kWh/t and 18.3 kWh/t, respectively, averaging 16.6 kWh/t. The results indicate that the composites tested are considered to be moderately hard. Bond abrasion index minimum and maximum Ai values were 0.03 and 0.08 respectively, averaging 0.06. The results indicate that the composites tested had low abrasion. The SMC tests were performed using a fraction between -22 mm +19 mm. Minimum and maximum values were 46.1 and 56.8, respectively. High axb values indicate soft mineral and low Axb values indicate hard mineral. For the material tested the average Axb was 50.8 which JKTech categorizes as medium hardness. JKDropWeight tests were performed on manto and andesite (ANDT) samples. Densities were measured for 30 samples and the average densities of Manto and ANDT composites were 4.21 and 3.40, respectively. The ANDT density presented a bimodal distribution, with a lower value of 3.2 and a higher value of 4.2. The Manto density presented similar values. The Axb results for Manto and ANDT were 86.3 and 38.8, respectively. The results indicate that the two lithologies have different properties measured by the JKDropWeight tests. A low-impact crushing test was also performed on the Manto and ANDT material. The CWi results for ANDT and Manto were (CWi (average)) 8.8 kWh/t and 7.3 kWh/t, respectively. The JKTech testwork identified some increases in the hardness of the mineral with increasing particle size. The CWi test did not corroborate this observation.
13.1.3.2 Magnetite Regrinding Magnetite ore regrind mill tests were carried out by Metso to obtain the specific energy consumption of representative samples targeting a P80 of 44 μm. The predicted specific energy consumption (VTM) for the sample with F80 of 201.2 μm and P80 of 44.0 μm using 19.1 mm media was 7.95 kWh/t.

Santo Domingo Project Region III, Chile NI 43-101 Technical Report
Page 13-10
March 2020
Project Number: C40029
13.1.4 Copper Flotation Testwork
13.1.4.1 OCT and LCT Testwork Flotation testwork was conducted during feasibility-level studies to define the residence times for the rougher and cleaner circuits and the correct dosage locations, amounts and conditioning times for sodium metabisulphite (SMBS). Two separate testwork programs, the Short-Term and Long-Term programs, were completed and results were used to finalize the process design. The Short-Term program consisted of Hematite and Magnetite composite samples of approximately 40 kg each. Both samples had copper grades, soluble copper, sulphur and iron contents similar to the life-of-mine feed types. OCT conditions were: Grind stage: ball mill Regrind stage: ball mill Grind stage: 65% w/w Regrind stage: 50% w/w Flotation paddle: every 10 seconds Lime used: Ca(OH)2 powder and 10% milk of lime. Based upon the OCT results the following set of conditions were used for the Short-Term LCTs for both the Hematite and Magnetite sample composites: No addition of SMBS to rougher flotation section No addition of SMBS to cleaner flotation section No addition of sodium cyanide (NaCN) to the cleaning flotation section Natural pH levels for roughing stage and 150 g/t addition rate of lime to cleaning
stage The same reagent scheme, frother can be reduced due to recirculation of water
during the LCTs. The flowsheet used for the LCTs consisted of: Conventional rougher flotation circuit with flotation tailings reporting to the
magnetite recovery circuit Rougher circuit concentrate is reground and fed to the first cleaner flotation stage

Santo Domingo Project Region III, Chile NI 43-101 Technical Report
Page 13-11
March 2020
Project Number: C40029
The first cleaner flotation stage concentrate is fed to the second cleaner stage and the first cleaner stage tailings are fed to a scavenger circuit
Scavenger concentrate is fed to the regrind circuit along with the rougher concentrate, the product from the regrind is fed to the first cleaner bank; the scavenger tailings report to the final flotation tailings by-passing the magnetite recovery circuit
The second cleaner circuit concentrate reports to the third cleaner flotation circuit; third cleaner concentrate is the final concentrate and third cleaner tailings report back to the second cleaner circuit.
It was evident from the Short-Term program LCT results that the process residence time and reagent conditions would need to be modified in order to achieve the copper concentrate grades and recoveries reached during the 2011 pre-feasibility study sea water testwork program. The global recoveries achieved were just over 81% to final concentrate. From the rougher circuit recoveries that achieved 95% copper recovery, it was probable that copper losses in the first cleaner and scavenging circuit were the result of reduced flotation kinetics due to the use of sea water. The use of sea water resulted in pyrite activation and competition with the copper mineral species present. It is expected that the use of desalinated water will improve these results. The procedure developed for the Long-Term program provided an optimized flotation solution with final copper recoveries and grades closer to those achieved during the 2011 pre-feasibility study testwork program. Three separate composites (Years 1-5 average, Hematite sample and Magnetite sample) and 15 variability samples were selected for the Long-Term program. The samples were characterized as: Hematite: magnetic susceptibility of 2,000 to 8,000; average copper grade of 0.59% Magnetite: magnetic susceptibility >8,000; average copper grade of 0.31% Years 1-5 selected to be representative of a combination of Hematite and
Magnetite type material during the first 5 years of operation; average copper grade of 0.56%.
For the Long-Term program, the samples were blended in proportion to the lithologies to represent the areas of the deposit that would be processed and ensure that they did not contain soluble copper levels >10% of the copper feed grade. High oxidation
Santo Domingo Project Region III, Chile NI 43-101 Technical Report
Page 13-12
March 2020
Project Number: C40029
(soluble copper) levels indicate waste material or material from fault zones located within the deposit. SGS Santiago carried out 15 OCTs using sea water and sodium cyanide as a depressant to understand the variability in flotation response associated with the process plant feed. Sample results that a) were low in total sulphur content, b) had a significant proportion of soluble copper present, or c) were classified as being in a waste zone of the pit (23 of the 51 samples), were not considered in the final process evaluation. A subsequent flotation test program in 2014 at SGS Santiago had the objective of understanding the impact on total copper recovery and copper flotation kinetics using sea water and sodium metabisulphite (SMBS) as a pyrite depressant (replacing sodium cyanide). Testing was completed on composite samples in order to confirm the optimal process flowsheet and conditions. The composite sample testwork was followed by OCTs and LCTs. Kinetic Testwork
The conditions used in the kinetics tests completed by SGS Santiago were based on the 2011 pre-feasibility study program and the optimized conditions from the Short-Term program. Pyrite depression was not used in the rougher stage. Tests were based on all pyrite rejection taking place in the first cleaner and cleaner scavenger stages and an extended conditioning period with SMBS. These conditions were achieved using pH control and adjusting the quantities and rates of the SMBS added. The rougher kinetics test results were reviewed before the cleaner test program was started. Program observations included: The highest copper recovery was reached in the test using an SMBS addition rate
of 50 g/t (92.8% recovery); elevated pH levels did not improve copper recovery. The use of SMBS in the cleaning circuit increased the copper grade significantly in the first cleaner stream.
There is a significant difference in the copper recovery achieved at the beginning of the first cleaner flotation stage (approximately 10% difference when comparing the highest copper recovery of 72.2% at 2 minutes versus the lowest copper recovery achieved of 53.8%) due to the use of SMBS
From 2 to 6 minutes there is a notable difference in copper recovery (between 15% and 25% for the different tests). After 6 minutes, the copper recovery rate reduces

Santo Domingo Project Region III, Chile NI 43-101 Technical Report
Page 13-13
March 2020
Project Number: C40029
significantly. It appears that copper recoveries are still increasing after 25 minutes but at a very slow rate
The cleaner kinetic test results show that global recoveries in excess of 90% can be achieved for each of the composites tested with concentrate grades of between 28% Cu and 33% Cu. The results show that with sufficient conditioning time using SMBS and extended roughing and cleaning residence times, higher copper recoveries and grades in concentrate can be achieved.
Long-term program cleaner kinetic test results were used to define the conditions for the LCTs. The LCT tests were conducted with seven cycles. Prior to the LCT, OCTs were conducted to determine the amount of material re-circulating in intermediate streams and the potential copper grades obtainable for each of the composites. The LCT results confirmed the OCT results for the Years 1-5 and Hematite type composites with similar copper concentrate grades and recoveries being maintained. The LCT tests for the Magnetite composite showed a lower copper concentrate grade than the OCT partially due to the lower copper head grade maintaining standard LCT test conditions that were determined from the Years 1-5 average sample. Based upon the Years 1-5 and Hematite composites, a conversion of 0.993 was recommended when converting OCT recovery results to LCT recovery results. For the Magnetite composite, it was determined that for a copper concentrate grade of 28.6% Cu, a copper recovery of 92.3% could be achieved. Variability Testing
The objective of the variability sample testing was to confirm the OCT and LCT results using a standard flowsheet and test conditions derived from the Years 1-5 composite testing. Variability samples were selected to obtain variable copper and magnetic susceptibility (iron content) values and representing the major lithologies within the deposit. Samples were also selected for a low soluble copper content and were sourced from below the oxide zone cap. The predominant lithology groups were types of andesite, termed ANDS (sub-units ANDT and ANDE) and MANTO. Combined, these two lithologies represent more than 90% of the deposit. Variability test results included: Two samples (Var 7 and Var 8) were tested for both OCT and LCT
Santo Domingo Project Region III, Chile NI 43-101 Technical Report
Page 13-14
March 2020
Project Number: C40029
Var 7 had an OCT copper recovery of 87.9% at a concentrate grade of 40.1% Cu and an LCT copper recovery of 89.7% at a concentrate grade of 37.4% Cu. Both of these, Var 7 concentrate grades are high and an increase in copper recovery could be expected at a reduced copper concentrate grade. A copper recovery well in excess of 90% could be expected at a concentrate grade of over 30% Cu
Var 8 had an OCT copper recovery of 93.3%; at a concentrate grade of 32.3% Cu and an LCT copper recovery of 93.6% at a concentrate grade of 27.7% Cu. For Var 8, copper recovery has been maintained at the expense of concentrate grade.
The average copper recovery for all the samples (2011 pre-feasibility study samples, 2014 feasibility study variability samples and 2014 feasibility study composite samples) was calculated to be 89%, with a maximum of 95% and a minimum of 81.6%. The 89% recovery was recorded at an average head grade of 0.38% Cu. The algorithm developed generated a calculated plant result of 88.4% recovery for the same 0.38% Cu head grade and takes into account the scale-up from bench scale to plant scale.
13.1.4.2 Pilot Plant Testwork A pilot plant was operated in 2015 at ALS Santiago to produce concentrate for testwork and to verify design criteria. Composites were prepared from drill core from the 2014–2015 drill program to represent each of the first 5 years of operation and a combined composite. The pilot plant used sea water and the flowsheet at that time for copper and iron flotation. Concentrate from the pilot plant operation was tested by FLSmidth and Outotec to determine filtration and thickening characteristics.
13.1.4.3 Aminpro 2018 and 2019 Testwork In 2015 Aminpro was asked to review the laboratory testwork and the design criteria. More flotation testwork was carried using the same sample that ALS Santiago used for the pilot plant work. The objective was to determine the flotation kinetics using a newer version of the kinetic tests that would allow the process to be mathematically simulated and confirm the design criteria for flotation. Tests at Aminpro included LCT using recirculated water. Based on LCT tests completed at Aminpro and iron product marketing specifications, a decision was made to use desalinated water for the process. The 2018 test program at Aminpro was planned to carry out kinetic tests on 23 variability samples plus the yearly composites representing the first 5 years of

Santo Domingo Project Region III, Chile NI 43-101 Technical Report
Page 13-15
March 2020
Project Number: C40029
operation. The LCT results with desalinated water produced copper and gold recoveries of 92.4% and 87.9% with concentrate grades of 32.8% Cu and 3.64 g/t Au, respectively. The samples used in 2018 came from the 2014–2015 drill program and appeared to have aged. Fresh drill core samples were obtained in 2019 to ensure that results are as representative as possible of the material that will be treated. Approximately 19 t of core were received and three test programs were executed: Bench scale tests on the Years 1-5 composite Bench scale testwork on composites for each year of the Years 1-5 Test program on variability samples of the first 5 years of the mine plan. The objectives of these programs were to confirm design criteria and the recovery equations used for copper and gold and obtain more detail of the material to be treated over the first 5 years of mine life. The Years 1-5 composite bench-scale testwork focused on determining the operating conditions using desalinated water in the rougher and cleaner stages. SMBS was eliminated as a pyrite depressant and lime was used. Using the pulp zone kinetics from these tests, the process was simulated for a full-scale circuit. The results of the simulation were confirmed in an exploratory OCT followed by an LCT (locked cycle test of six cycles including water recirculation). The head grades of the Years 1-5 composite are shown in Table 13-2. The optimal operating conditions defined from a large number of rougher and cleaner kinetic tests are shown in Table 13-3.

Santo Domingo Project Region III, Chile NI 43-101 Technical Report
Page 13-16
March 2020
Project Number: C40029
Table 13-2: Head Grades Years 1-5 Composite
Element CuT (%)
Au (g/t)
Ag (ppm)
Co (%)
FeT (%)
S (%)
Grade 0.548 0.056 0.750 0.031 26.31 2.63
Table 13-3: Rougher and Cleaner Optimal Flotation Conditions
P80 (µm) pH % Solids
Reagent (PD-215) (g/t)
Reagent (AP-3418A) (g/t)
Primary grind 150 — — 20 -
Rougher — Natural 8.2 to 8.3 33 — 5
Regrind 34 — — — — Cleaner — 12 17 to 20 2 —
The LCT results showed copper and gold recoveries of 94.4% and 70%, respectively, with concentrate grades of 33.7% Cu and 3.2 g/t Au respectively. The three-stage cleaning circuit produced a high-grade concentrate already in the second cleaners (average of 32.4% Cu from two OCTs). A third cleaning flotation stage is included to enable the circuit to lower the circulating loads to the first cleaners so that pyrite can be recovered from the cleaner scavenger tailings. The recovery and grades from the LCT are shown in Table 13-4. Using the bench-scale tests for the composites by year, the head assays of each production year are shown in Table 13-5, the copper grades vary from 0.39% Cu in Year 5 to 0.71% Cu in Year 1. The LCT results for the individual composites for each year are shown in Table 13-6. The flotation circuit using desalinated water appears to have provided similar results to those with sea water, therefore, SMBS was eliminated as a depressant. There are indications that desalinated water will at times allow the cleaning circuit to operate with fewer cleaning stages; this needs to be confirmed by further testwork and/or by pilot plant testing.
Kinetic tests on the 28 variability samples testwork based on the Years 1-5 composite were used to generate the copper and gold recovery algorithms.
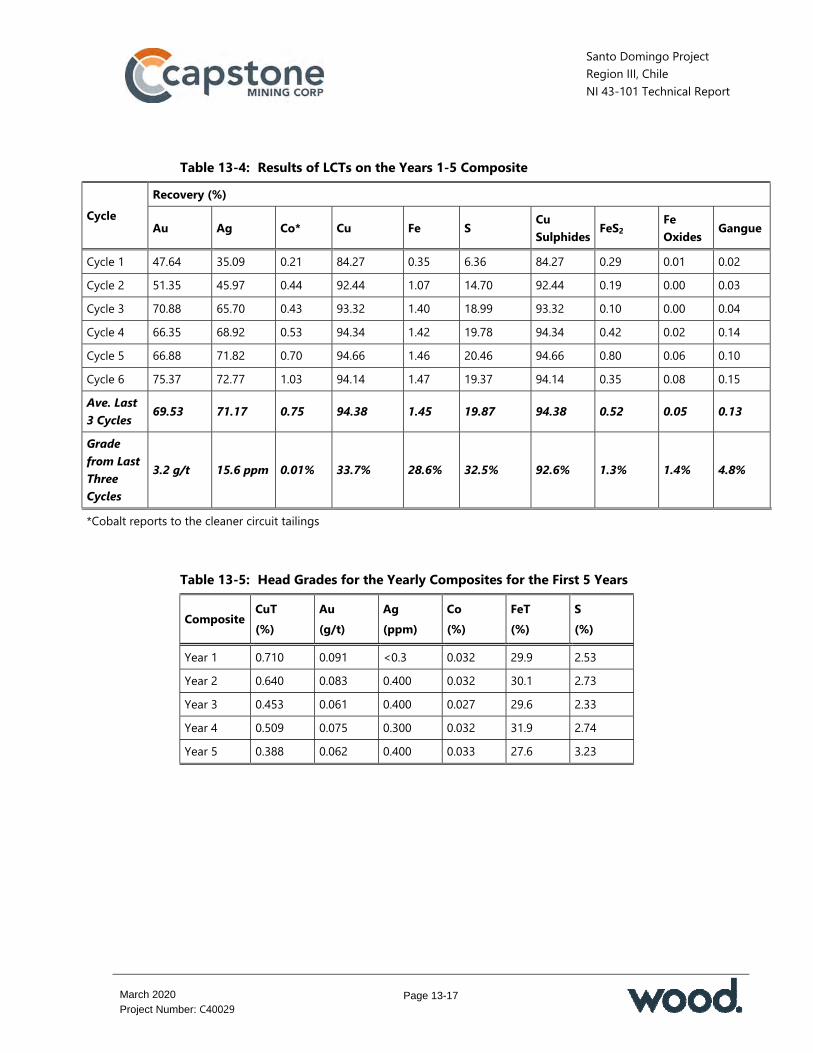
Santo Domingo Project Region III, Chile NI 43-101 Technical Report
Page 13-17
March 2020
Project Number: C40029
Table 13-4: Results of LCTs on the Years 1-5 Composite
Cycle Recovery (%)
Au Ag Co* Cu Fe S Cu Sulphides FeS2 Fe
Oxides Gangue
Cycle 1 47.64 35.09 0.21 84.27 0.35 6.36 84.27 0.29 0.01 0.02 Cycle 2 51.35 45.97 0.44 92.44 1.07 14.70 92.44 0.19 0.00 0.03 Cycle 3 70.88 65.70 0.43 93.32 1.40 18.99 93.32 0.10 0.00 0.04 Cycle 4 66.35 68.92 0.53 94.34 1.42 19.78 94.34 0.42 0.02 0.14 Cycle 5 66.88 71.82 0.70 94.66 1.46 20.46 94.66 0.80 0.06 0.10 Cycle 6 75.37 72.77 1.03 94.14 1.47 19.37 94.14 0.35 0.08 0.15 Ave. Last 3 Cycles 69.53 71.17 0.75 94.38 1.45 19.87 94.38 0.52 0.05 0.13
Grade from Last Three Cycles
3.2 g/t 15.6 ppm 0.01% 33.7% 28.6% 32.5% 92.6% 1.3% 1.4% 4.8%
*Cobalt reports to the cleaner circuit tailings
Table 13-5: Head Grades for the Yearly Composites for the First 5 Years
Composite CuT (%)
Au (g/t)
Ag (ppm)
Co (%)
FeT (%)
S (%)
Year 1 0.710 0.091 <0.3 0.032 29.9 2.53 Year 2 0.640 0.083 0.400 0.032 30.1 2.73 Year 3 0.453 0.061 0.400 0.027 29.6 2.33 Year 4 0.509 0.075 0.300 0.032 31.9 2.74 Year 5 0.388 0.062 0.400 0.033 27.6 3.23
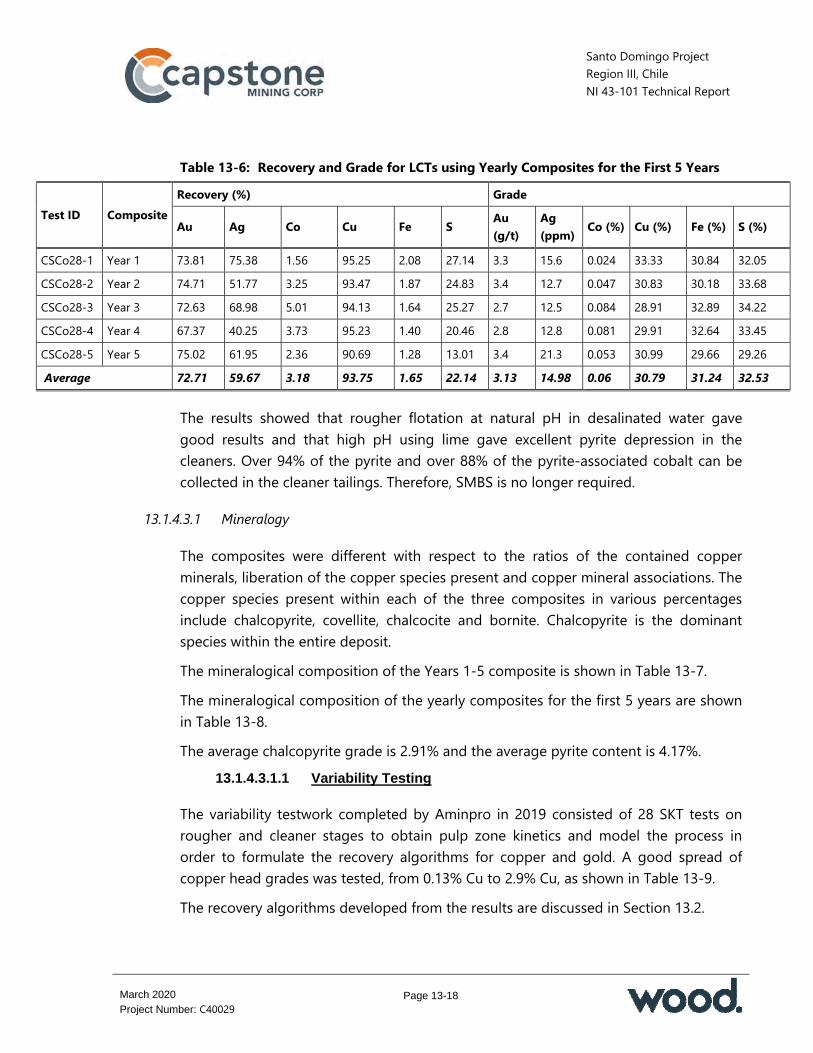
Santo Domingo Project Region III, Chile NI 43-101 Technical Report
Page 13-18
March 2020
Project Number: C40029
Table 13-6: Recovery and Grade for LCTs using Yearly Composites for the First 5 Years
Test ID Composite Recovery (%) Grade
Au Ag Co Cu Fe S Au (g/t)
Ag (ppm) Co (%) Cu (%) Fe (%) S (%)
CSCo28-1 Year 1 73.81 75.38 1.56 95.25 2.08 27.14 3.3 15.6 0.024 33.33 30.84 32.05 CSCo28-2 Year 2 74.71 51.77 3.25 93.47 1.87 24.83 3.4 12.7 0.047 30.83 30.18 33.68 CSCo28-3 Year 3 72.63 68.98 5.01 94.13 1.64 25.27 2.7 12.5 0.084 28.91 32.89 34.22 CSCo28-4 Year 4 67.37 40.25 3.73 95.23 1.40 20.46 2.8 12.8 0.081 29.91 32.64 33.45 CSCo28-5 Year 5 75.02 61.95 2.36 90.69 1.28 13.01 3.4 21.3 0.053 30.99 29.66 29.26 Average 72.71 59.67 3.18 93.75 1.65 22.14 3.13 14.98 0.06 30.79 31.24 32.53
The results showed that rougher flotation at natural pH in desalinated water gave good results and that high pH using lime gave excellent pyrite depression in the cleaners. Over 94% of the pyrite and over 88% of the pyrite-associated cobalt can be collected in the cleaner tailings. Therefore, SMBS is no longer required.
13.1.4.3.1 Mineralogy
The composites were different with respect to the ratios of the contained copper minerals, liberation of the copper species present and copper mineral associations. The copper species present within each of the three composites in various percentages include chalcopyrite, covellite, chalcocite and bornite. Chalcopyrite is the dominant species within the entire deposit. The mineralogical composition of the Years 1-5 composite is shown in Table 13-7. The mineralogical composition of the yearly composites for the first 5 years are shown in Table 13-8. The average chalcopyrite grade is 2.91% and the average pyrite content is 4.17%.
13.1.4.3.1.1 Variability Testing
The variability testwork completed by Aminpro in 2019 consisted of 28 SKT tests on rougher and cleaner stages to obtain pulp zone kinetics and model the process in order to formulate the recovery algorithms for copper and gold. A good spread of copper head grades was tested, from 0.13% Cu to 2.9% Cu, as shown in Table 13-9. The recovery algorithms developed from the results are discussed in Section 13.2.

Santo Domingo Project Region III, Chile NI 43-101 Technical Report
Page 13-19
March 2020
Project Number: C40029
Table 13-7: Mineralogical Composition of the Years 1-5 Composite Mineral Wt% Chalcopyrite 1.69 Chalcopyrite/covellite 0.04 Bornite 0.05 Pyrite 4.20 Sphalerite 0.01 Enargite/tennantite 0.00 Molybdenite 0.00 Fe sulphate 0.07 Magnetite 0.46 Hematite 12.08 Goethite 9.40 Rutile 0.30 Titanite 0.48 Quartz 10.23 Feldspar 12.48 Muscovite 0.33 Biotite 1.57 Amphibole 5.42 Garnet 0.81 Talc 0.03 Clinochlore 9.09 Other silicates 3.57 Siderite 19.73 Dolomite 0.11 Calcite 5.69 Ankerite 1.19 Apatite 0.22 Other 0.76 Total 100

Santo Domingo Project Region III, Chile NI 43-101 Technical Report
Page 13-20
March 2020
Project Number: C40029
Table 13-8: Mineralogical Composition of the Yearly Composites for the First 5 Years Mineral Year 1 Year 2 Year 3 Year 4 Year 5 Pyrite 2.76 4.61 3.86 3.64 5.78 Chalcopyrite 1.81 1.63 1.31 1.10 0.79 Bornite 0.15 0.17 0.05 0.02 0.14 Sphalerite n.d n.d n.d n.d n.d Tennantite 0.01 n.d n.d n.d 0.01 Galena n.d n.d n.d n.d n.d Barite n.d n.d n.d n.d n.d Rutile 0.06 0.09 0.15 0.13 0.05 Ilmenite 0.04 0.14 0.05 0.03 0.06 Hematite/magnetite 41.65 36.64 37.00 39.12 31.61 Titanite 0.42 0.30 0.61 0.48 0.68 Epidote 0.55 0.35 0.30 1.60 0.52 Tourmaline n.d n.d n.d n.d n.d Amphibole 1.83 1.68 2.68 2.30 4.43 Biotite 0.50 0.26 0.32 0.58 0.28 Muscovite 0.06 0.03 0.04 0.06 0.05 Plagioclase 4.67 7.07 10.47 4.10 6.46 K Feldspar 8.16 7.14 8.18 7.15 5.78 Quartz 10.29 11.06 9.78 9.29 11.69 Chlorite 8.27 7.96 6.19 10.94 8.63 Smectite 1.74 2.25 2.64 1.62 2.89 Si-Al clays 2.49 3.37 3.47 5.08 4.88 Sulphide-clay mix 0.22 0.29 0.40 0.60 0.53 Carbonates 12.46 13.24 10.67 10.54 12.69 Apatite 0.19 0.21 0.22 0.30 0.31 Clay-sulphide mix 1.22 0.97 0.97 0.95 1.29 Other 0.47 0.54 0.61 0.36 0.44 Total 100 100 100 100 100
Note: n.d. = Not detected

Santo Domingo Project Region III, Chile NI 43-101 Technical Report
Page 13-21
March 2020
Project Number: C40029
Table 13-9: Head Grades of the 28 Variability Samples
Test ID Au (g/t)
Ag (ppm)
Co (%)
Cu (%)
Fe (%)
S (%)
CSA5-1 — — — — — — CSA5-2 0.282 1.102 0.011 2.906 31.26 3.82 CSA5-3 0.264 0.963 0.022 2.269 29.84 3.44 CSA5-4 0.251 1.241 0.021 2.021 48.14 3.81 CSA5-5 0.247 0.853 0.029 1.904 38.18 4.12 CSA5-6 0.182 1.091 0.009 1.534 32.47 2.20 CSA5-7 0.188 1.028 0.035 1.683 35.16 8.95 CSA5-8 0.146 1.938 0.034 1.305 47.59 3.57 CSA5-9 0.104 0.296 0.003 1.139 61.00 1.34 CSA5-10 0.181 0.733 0.031 1.750 56.70 4.43 CSA5-11 0.212 1.092 0.021 1.267 39.74 3.10 CSA5-12 0.153 0.785 0.045 1.094 47.10 3.38 CSA5-13 0.125 0.450 0.012 1.061 21.90 1.85 CSA5-14 0.107 0.470 0.030 0.900 45.95 2.74 CSA5-15 0.118 1.972 0.036 0.979 36.92 2.73 CSA5-16 0.135 0.966 0.018 1.117 50.81 3.42 CSA5-17 0.108 0.673 0.011 0.675 40.63 1.58 CSA5-18 0.077 0.716 0.038 0.602 39.03 3.43 CSA5-19 0.066 0.477 0.032 0.371 18.05 1.86 CSA5-20 0.065 0.408 0.012 0.579 19.11 1.23 CSA5-21 0.071 0.517 0.019 0.626 30.40 1.93 CSA5-22 0.082 0.746 0.015 0.584 22.41 1.43 CSA5-23 0.048 0.342 0.038 0.494 36.80 2.44 CSA5-24 0.071 0.359 0.021 0.616 29.68 1.53 CSA5-25 0.073 0.350 0.016 0.374 25.90 1.42 CSA5-26 0.034 0.582 0.081 0.134 32.99 7.66 CSA5-27 0.048 0.359 0.013 0.345 15.73 1.18 CSA5-28 0.015 0.177 0015 0.160 10.11 1.35 CSA5-29 0.051 0.476 0.007 0.251 10.53 0.84

Santo Domingo Project Region III, Chile NI 43-101 Technical Report
Page 13-22
March 2020
Project Number: C40029
13.1.5 Magnetic Iron Testwork
Magnetic iron testwork was conducted by three laboratories, ALS Santiago, SGA and Compañía Minera del Pacifico (CMP) in 2009, 2010 and 2011. The testing used DT and LIMS tests to determine the recovery of magnetite from the primary copper flotation tailings stream. The results obtained from LIMS testing were used as the basis for the design of the primary magnetic separation step and the subsequent magnetic separator cleaning stages. Confirmatory DT programs were completed at ALS Santiago and CMP using variability samples in 2011 and 2012. Additional DT and LIMS testing was completed by ALS Santiago in 2014. The 2014 results were used to confirm the regrind product size (P80 of 40 µm) for the first, second and third magnetic separator cleaner stages; and to update the 2011 pre-feasibility study relationship for magnetic iron mass recovery to final concentrate. The testwork also provided support for the iron concentrate grades and associated elements in the concentrate. Using the composite and variability sample testwork results, an algorithm was developed relating the iron mass recovery to the magnetic susceptibility from the DT tests. The magnetic susceptibility assumptions are that the Hematite is classified as having magnetic susceptibility values between 2,000 and 8,000 and Magnetite is classified as having magnetic susceptibility values greater than 8,000. If the magnetic susceptibility is ≥2,000, the algorithm is:
Mass Recovery of Fe = 0.0011 x (MagSus) – 3E-09 x (MagSus)2 If the magnetic susceptibility is <2,000, then the mass recovery is assumed to be zero.
Concentrate quality variability LIMS testwork completed during the 2011 pre-feasibility study and 2014 feasibility study programs indicated an average magnetic iron content exceeding 65% Fe in the magnetite concentrate. This average value of 65% Fe was used with the mass recovery algorithm to determine the total tonnes of magnetite concentrate. Adjustments were made to the LIMS circuit in the pilot plant operation in order to maintain a high iron grade and low silica content. The testwork indicated that further improvement may be possible without reducing the P80 grind size. A clear relationship

Santo Domingo Project Region III, Chile NI 43-101 Technical Report
Page 13-23
March 2020
Project Number: C40029
was demonstrated between managing iron grade and the level of silica contamination. Further testwork is recommended. Magnetite settling testwork was performed by Outotec and Delkor in 2012 using bench scale dynamic thickening equipment. The results of the testwork indicated a magnetite concentrate process design unit area of 0.678 t/hr/m2. Magnetite concentrate filtration testwork was completed by Outotec in two separate programs in 2011 and 2012. The objective of these tests was to determine the filtration design parameters using ceramic rotary filters. This testwork resulted in a final filter cake moisture content of 8% w/w. Based on the test results, a filtration rate of 1,300 kg/m2/hr was used for the process design. Tailings Testwork Final tailings samples were tested by Outotec and Delkor in 2012 and 2013 to evaluate the settling behaviour of the tailings and provide thickener design parameters. Based on the results of these tests and associated rheological characterization, a trade-off study was conducted to evaluate capital and operating costs for different thickener configurations. It was determined that two stages of thickening in series will be the most effective to achieve the desired tailings density. The first stage of thickening will be completed at the process plant with a high rate thickener designed for an underflow density of 55% solids w/w and a unit area of 0.65 t/hr/m2. The second thickening stage will be located at the TSF using two high density thickeners. The second stage thickening design unit area is 0.5 t/hr/m2 at an underflow density of 67% solids w/w. Additional LIMS tests were completed during 2019 using the rougher flotation tailings from the Years 1-5 composite from the flotation program completed at Aminpro in 2019, in order to confirm the circuit and operation parameters using desalinated water. The results confirmed the magnetic separation circuit including a rougher stage, concentrate regrind to 35–40 µm and three cleaning stages, with a final iron concentrate grade >66% Fe.
13.1.6 Magnetic Separation Testwork
During the 2011 pre-feasibility study, several tests were carried out to set the recovery of magnetite using the tailings from the primary copper flotation stage of the Eight-Year Average composite sample.

Santo Domingo Project Region III, Chile NI 43-101 Technical Report
Page 13-24
March 2020
Project Number: C40029
Tests were carried out using a DT bench-scale machine on tailings from the primary copper flotation step. The results indicated that for a grind size of 100% passing 0.063 mm, the highest iron grade obtainable in the final concentrate was 66.5% Fe w/w. With a grind size of 100% passing 0.1 mm, the maximum iron grade obtained in final concentrate was 64.0%. Grinding to less than 100% passing 0.04 mm showed no improvement in the Fe grade with a maximum grade obtainable of 66.1%. Tests were also performed for the primary (rougher) magnetic separation stage using both fresh water and sea water. The results show that the weight recovery percentage for the primary stage using fresh water was 26.5% of the initial weight, slightly lower than the recovery obtained for the tests conducted with sea water. The percentage of recovered magnetite in the primary magnetic separation stage with fresh water was 94.2% of magnetite, which is slightly higher than the result obtained with sea water at 93.4%. The iron grade in the rougher concentrate grade is slightly lower using sea water at 53.9% Fe w/w versus fresh water at 56.2% Fe w/w. The rougher magnetic separation product was re-ground and then a second (cleaning) stage of magnetic separation was carried out using fresh water. A total of 10 regrind cleaner tests were analyzed. The iron grades achieved were acceptable varying between 64% and 68% and reflected the fineness of grind employed. The silica grades varied inversely with the iron grade and grind with the finer grind producing lower final silica grades. The Blaine index measured indicated that the filtration and washing would be more effective at finer grind sizes and this would reduce the deleterious element levels. The Eight-Year Average, Hematite and Magnetite composites were used to verify deposit mineralogy. The samples were ground to the established primary flotation tailings grind size. The results show that the mineralogy of the feed influences the concentrate product produced. The final iron grades achieved were 66.1% for the Eight-Year Average composite, 64.1% for the Hematite sample and 66.6% for the Magnetite sample. For the 2014 feasibility study phase, testwork was completed by ALS Ammtec on three composite samples of copper flotation tailings produced in early 2014. A comparison of these testwork results with prior test programs was also completed. Three copper flotation tailings samples were tested: Years 1-5 Composite #2 (sample derived from the Long-Term testwork program
at SGS Santiago)

Santo Domingo Project Region III, Chile NI 43-101 Technical Report
Page 13-25
March 2020
Project Number: C40029
Hematite (sample derived from the Short-Term testwork program at SGS Santiago)
Magnetite (sample derived from the Short-Term testwork program at SGS Santiago).
Based on testing a range of grind sizes for the three samples and subjecting each size distribution to a DT test, the optimal cleaner LIMS feed grind size was determined to be a P80 of 40 µm. This was compared to the original 2011 pre-feasibility study design grind size P80 of 45 µm. The results of a DT test for a given grind size indicate the expected performance of the LIMS circuit for the material ground to a similar size. The DT testwork indicated that all three concentrates (Years 1-5, Hematite and Magnetite) could potentially achieve the concentrate specification of less than 4.1% SiO2 content if the feed to the cleaner LIMS is ground to a P80 of 40 µm. The final concentrate particle sizes measured varied in the range of P80 of 37–41 µm. Grinding the material finer than 40 µm was not recommended due to the following reasons: Based on the testwork completed to date, the concentrate quality can be only
marginally improved by grinding the LIMS feed to a size <P80 of 40 µm Grinding to a size of <P80 of 40 µm could lead to iron losses from ultra-fines, due
to the fine particle size distribution of this material Commercial LIMS machines have been observed to have difficulties collecting
ultra-fine iron. The three ALS Ammtec final concentrate particle size distributions from the 2014 testwork were similar to those obtained from the Eight-Year Average sample evaluated by SGA in 2011. The Eight-Year Average concentrate was used to develop the target product specification. The three ALS Ammtec concentrates had a P50 size of between 20 µm and 25 µm, further supporting the recommendation of maintaining a P80 of 40 µm. The performance of the three ALS Ammtec samples was in line with the previous program results and also supported the DT concentrate mass recovery versus magnetic susceptibility relationship developed for the magnetite concentrate recovery predictions.
Santo Domingo Project Region III, Chile NI 43-101 Technical Report
Page 13-26
March 2020
Project Number: C40029
Tests using coarser grind sizes for the three samples were completed as part of the ALS Ammtec testwork. The results demonstrate the concentrate quality expected using coarser regrind sizes. Additional testwork was completed at SGS Santiago in 2019 to confirm design criteria using LIMS on rougher flotation tailings from the program completed at Aminpro the same year, using the Years 1-5 composite sample and desalinated water. The magnetic separation circuit included a rougher stage and cleaning, with regrind and three cleaning stages. These were tested at regrind product sizes of 35 µm to 40 µm varying the percent solids in the cleaner stages. A hydro-separator unit was also tested. In all cases the final iron concentrate grade was >65% Fe. The hydro-separator unit did not indicate a significant improvement and the circuit was confirmed as per the current design. The circuit performed well within the percent solids ranges tested. Impurities such as silica and others were close to Capstone’s current target.
13.1.6.1 Magnetic Separation Variability Testwork Review The 2011 pre-feasibility study database consisted of a total of 211 samples from SGS Lakefield, SGA and CMP and included test samples located both within and outside of the proposed Santo Domingo and Iris Norte pit limits. If the results from samples located outside the proposed pit limits are excluded, there are 164 test samples for the planned Santo Domingo pit area and 15 test samples for the planned Iris Norte pit area. The Santo Domingo samples were classified based on major lithologies. Overall, the target iron grade was achieved with the variability samples tested. However, the samples with test results that were outside of the target specification were found to be located adjacent to fault zones and had a high degree of alteration. It is anticipated that during production planning these alteration zones will be reclassified as waste with respect to recoverable magnetite. All of the major lithologies are represented in the testwork data set; however, the ANDE lithology has a lower proportional representation in the data set. Wood conducted an analysis of the likely block model outputs and confirmed that the ANDE lithology represents between 13% and 17% of the LOM feed. Testwork indicated that for some of the ANDE samples, the contained silica does not separate to the same degree as it does for the MANTO samples. The results do not
Santo Domingo Project Region III, Chile NI 43-101 Technical Report
Page 13-27
March 2020
Project Number: C40029
distinguish between magnetite core samples and hematite rim samples. Of the 164 Santo Domingo samples tested, there were only a few samples that contained low iron levels. The test with low iron produced magnetic concentrates with silica content that exceeded the target specification, indicating that there is a potential complex association between silica and iron. Additional optimization and analysis of these results will need to be conducted to generate additional magnetite product from the low magnetic susceptibility feed samples. The major feed types in the Iris Norte deposit are MANTO and ANDT with approximately equal proportions. The highest silica content measured in the 15 samples tested was 7.75% and the lowest was 2.08%. The weighted average silica and iron contents in the magnetic concentrates from these samples were 3.4% and 67.7% respectively. Both of these results are within the target specification.
13.1.6.2 Magnetic Separation Pilot Testing In 2015, a pilot testing program was conducted using a Years 1-5 mill feed composite. This testing confirmed the process design criteria for magnetic separation and also confirmed the mass recovery and concentrate projections used in previous studies. Testing using desalinated water was not carried out because it is expected that there would be no variation in the performance of the LIMS circuit using this type of water. In the next phase, pilot plant testing should be conducted to confirm the iron recovery circuit final design criteria. In the pilot plant, very little variation of results was observed during testwork of the magnetite circuit and the previous bench work. The fundamental basis of the process is physical and the process proved to be very stable. Prior to the pilot plant testwork the biggest concern was iron liberation and grind size relationships. The process design criteria P80 grind size of 42 μm was shown to be adequate to produce the desired recovery, grade and contaminant levels for concentrate sales. Magnetic rougher concentrate was produced during the copper rougher flotation testwork by treating the copper rougher tailings in a LIMS operating at 1,000 gauss, producing a rougher magnetic concentrate at 54% Fe and 21% mass recovery. Laboratory analysis confirmed complete magnetics recovery to the concentrate. The pilot plant testwork was organized in two groups of four tests (A to D and E to H) with each test passing through three stages of cleaning. The densities of these runs did not achieve the desired concentrate quality with respect to final grade or silica content. The target quality for the concentrate is grade greater than 65% Fe and less than 4.1% SiO2.
Santo Domingo Project Region III, Chile NI 43-101 Technical Report
Page 13-28
March 2020
Project Number: C40029
The LIMS conditions were reviewed and an optimization plan was designed to improve the cleaner performance. A series of DT test enhancements were applied to the concentrates from tests A to D. The DT testwork indicated that silica contents of 3.5% and grades >66% Fe were achievable without finer grinding. The tests on samples E to H were conducted using the revised process conditions determined in the DT testwork. A clear relationship was demonstrated between managing iron grade and the level of silica contamination. The DT results indicate that further optimization is possible during full scale operations. The mass recovery relationship established during the pilot plant testwork confirmed the criteria in the process design criteria. In the final stages of cleaning, the mass recovery should hold at approximately 15% in order to achieve an iron grade over 65%. The limits of the maximum grade recovery chart indicate that at iron grades in excess of 68%, recoveries will begin to significantly decline. All tests were conducted at a single value of magnetic susceptibility using the Years 1-5 Average Composite and variations experienced during operations could require changes in mass recovery and in LIMS setting to achieve optimum results.
13.1.7 Magnetite Concentrate Thickening Tests
In 2014, Outotec undertook testing to determine the main characteristics of dynamic settling and thickening of the magnetite concentrate slurry using a bench-scale dynamic thickener. An Outotec 99 mm diameter laboratory thickener was used. Ten thickening tests using dilutions of 20%, 25%, 30%, 35% and 55% w/w solids were performed. An additional test with the thickener operating continuously was carried out, simulating an industrial operation. The results indicate that the yield stress in the thickened solids increases from 30 Pa to 210 Pa as the solids in the discharge increases from 73% to 79% solids w/w. The thickener will operate with a nominal discharge density of 65% solids w/w and a design maximum of 70% solids w/w. Outotec concluded that for the magnetite concentrates the optimal feed density is 35% solids w/w (design values of 55% solids w/w can be used). Outotec also stated that the optimal feed rate was between 0.5 t/hr/m2 and 0.6 t/hr/m2, achieving a clarity of about 200 NTU and 74% solids w/w in the discharge using laboratory bench scale equipment. Delkor also carried out testing in 2014. The objective of testwork undertaken by Delkor was to determine settling rates, evaluate the fluidity of the slurry and determine the
Santo Domingo Project Region III, Chile NI 43-101 Technical Report
Page 13-29
March 2020
Project Number: C40029
capacity of the production thickening equipment using bench-scale laboratory equipment. For the thickening tests using magnetite concentrate, 19 settling tests and three compaction tests were performed. Delkor carried out free settling tests with anionic flocculant AP2020. Slurry dilution densities between 17% and 20% solids were used with flocculant addition rates from 0–7 g/t. The results for the 17% dilution density test indicated that settling rates varied between 18–9 m/hr as the flocculant dose was increased from 0–7 g/t. Delkor carried out forced compaction tests (with rakes) and free compaction tests (without rakes) and observed the highest densities over 24 hours. Flocculant was not used in these tests. The results indicate that for both cases, the solids density after 24 hours is more than 75% w/w. Delkor carried out rheology tests to assess the fluidity of the slurry at different solids concentrations using the material from the compaction tests. The results indicated that for a concentrate slurry with 65% solids, the unsheared yield stress is approximately 12.4 Pa and for concentrate slurries at 68% and 70% solids, the yield stresses were 27.1 Pa and 34.4 Pa, respectively. Wood recommended that a unit value of 0.68 t/hr/m2 be used for the design of the magnetite concentrate thickener which results in a 36 m diameter high rate thickener without a clarifier. This is in the mid-range of the recommendations made by Outotec and Delkor. It is assumed that the process design criteria for concentrate thickening will not change when using desalinated water. Pilot plant testing should be conducted in the next stage to confirm the final design criteria.
13.1.8 Copper Concentrate Thickening Tests
In 2014, Outotec conducted thickener settling testwork on a third and final cleaner concentrate generated the Eight-Year Average composite. The concentrate sample was prepared using synthetic sea water, which had been prepared by adding sea salt crystals to fresh water. A comparison was carried out between anionic flocculants MF10 and MF155 using static settling testwork. A higher settling velocity and improved overflow clarity were obtained using MF10. Two dynamic thickening tests were carried out to analyze the effect of the feed rate (t/hr/m2) on the discharge (Cp%) and the clarity of the overflow (ppm). A rheology test

Santo Domingo Project Region III, Chile NI 43-101 Technical Report
Page 13-30
March 2020
Project Number: C40029
of the thickener discharge was also completed. Feed rates used were 0.25 t/hr/m2 and 0.40 t/hr/m2. The behaviour showed a reduction in the Cp of the discharge with an increase in the feed rate, although for both tests a Cp over 28% in the discharge and clarity less than 50 ppm in the overflow were obtained. In spite of the clarity of the overflow, the concentrate formed foam due to the reagents used in flotation. Therefore, a de-aerator was included in the design prior to the thickener. Outotec stated that testwork should be conducted with feed rates higher than 0.25 t/hr/m2 and recommended that the testwork be undertaken using sea water without flocculant addition, to reach the design Cp of 60% w/w solids in the underflow discharge. The pilot plant testwork in 2015 used sea water and the flowsheet current at that time. Concentrate samples generated from the pilot plant were sent to FLSmidth and Outotec for testwork to determine sizing and operating parameters for the concentrate thickeners. Although the pilot plant used sea water, because the material has a low clay content, the thickening tests should provide valid results. These tests should be repeated to verify settling and rheology characteristics. The samples received by FLSmidth and Outotec were the final copper concentrate, with a P80 target of approximately 43 μm, slurry pH in the range of 8.8–9.2 and solids SG in the range of 4.1 to 4.22. The testwork determined yield stress values as a function of solids concentration with the primary objective being to select a design value for torque for the thickeners and to predict the limits of underflow densities. The FLSmidth results showed that the thickeners can accommodate a solids loading of 0.166 m2/t/d minimum unit area. At this unit area, the concentrate thickeners can produce underflow solids concentration of approximately 60% w/w with less than 0.9 hours of retention time depending on the composition of the material and a yield stress close to 10 Pa. These tests should be repeated using desalinated water to verify the final design criteria.
13.1.9 Concentrate Filtration Testwork
In 2011 Outotec performed a series of filtration tests on magnetite and copper concentrates. The objective of the tests was to determine the main filtration characteristics of the copper and magnetite concentrates.

Santo Domingo Project Region III, Chile NI 43-101 Technical Report
Page 13-31
March 2020
Project Number: C40029
Outotec recommended horizontal plate pressure filters (PF) be used based on the results obtained with the copper concentrate in the ceramic filter. For the magnetite concentrate the results of the filtration tests also showed that PF filters would operate better than the ceramic plate (CC) type. In 2012 additional filtration tests were carried out by Outotec. The objective of the tests was to determine the main filtration parameters for the magnetite concentrate using Larox type pressure filters to obtain a cake with a final moisture content of 8% w/w and a maximum of 300 ppm Cl. The test results without cake washing indicated that filtration rates between 950–807 kg/m2-hr were achieved for slurry feed densities between 65.5–67.3% solids w/w. Cake moisture contents of between 8.7–10.2% were obtained. The tests with cake washing showed that the rate of filtration was between 692–730 kg/m2-hr for slurry feed densities between 63.7% and 65.6% solids w/w. This gave a range in cake moisture contents of between 8.5% and 9.3%. Water consumptions of 0.2 m3/t solids, 0.4 m3/t solids and 0.6 m3/t solids resulted in chloride levels in the residual water in the filtered cake of 610 ppm, 184 ppm and 148 ppm, respectively. The results obtained by Outotec for cake washing indicate a filtration rate of 680 kg/m2-hr, with a cake moisture content of 8.5%. Outotec was prepared to guarantee these results in an industrial application. In 2014 Outotec also conducted filtration testing on copper concentrate samples during the pre-feasibility study phase to evaluate the filtering characteristics using ceramic (CC) and pressure (PF) Larox filters and to evaluate the effect of washing the concentrate. The pilot plant testwork in 2015 used sea water and the flowsheet current at that time. Concentrate samples generated from the pilot plant were sent to FLSmidth and Outotec for evaluation of the filtration characteristics using a plate and frame tower press. The objective of the testwork was to determine sizing and operating parameters such as filter cloth selection, cake thickness, filtration rate, filter cake moisture, cake handling for the copper concentrate filter. Although the pilot plant used sea water, because of the low clay content of the material the filtration tests should provide valid results and indicate the moisture content that can be achieved.
Santo Domingo Project Region III, Chile NI 43-101 Technical Report
Page 13-32
March 2020
Project Number: C40029
The samples received by FLSmidth and Outotec were final copper concentrate, with a P80 target of approximately 43 μm, slurry pH in the range of 8.8–9.2 and solids SG in the range from 4.1 to 4.22. FLSmidth filtration tests reached the desired 8–10% w/w moisture target. Filtration rates were relatively high for a copper concentrate, in the range of 584–862 kg/hr/m2. The cake thickness range tested was between 23–65 mm. In order to achieve a final moisture content below 9%, the optimum cake thickness was 30 mm and 45 mm, with a residence time of approximately 140 seconds and 180 seconds, for FLSmidth and Outotec, respectively. Copper concentrate filtering testwork was not carried out using desalinated water for the 2018 update. Using desalinated water in the process will eliminate the need for washing to lower the chloride content in the final concentrate and the water balance was adjusted. Pilot plant testing should be used to optimize the type and size of the filtration equipment.
The 2015 pilot plant testwork used sea water and the current flowsheet at the time. Concentrate samples generated from the pilot plant and sent to FLSmidth and Outotec for iron concentrate filter evaluation using a plate and frame tower press. The objective of the testwork was to determine the size and operating parameters such as cake thickness, filtration rate, filter cake moisture and cake handling for the magnetite concentrate filters. Although the pilot tests were done with sea water, because of the low clay content of the material, the filtration tests should provide valid results to indicate the moisture content achievable. The samples sent to FLSmidth and Outotec were final magnetite concentrate, with a P80 target of approximately 48 μm, slurry pH in the range of 8.8–9.2 and solids SG of 4.7: the desired final moisture content range was 8–9%. FLSmidth’s filtration tests did reach the desired moisture targets. For Outotec, the cake thickness range tested was 25–65 mm and the residence times to achieve 9% moisture, varied from 30–210 seconds. Based on the projected use of desalinated water in the copper and iron recovery circuits the need for concentrate washing will be eliminated; the water balance was updated to reflect this. Following future pilot plant testing using desalinated water, the process design criteria for the filtration circuits will be updated to reflect the elimination of concentrate washing.
Santo Domingo Project Region III, Chile NI 43-101 Technical Report
Page 13-33
March 2020
Project Number: C40029
13.1.10 Tailings Thickening Testwork
Outotec and Delkor conducted bench-scale thickening testwork on tailings samples from the Santo Domingo deposit using a 99 mm diameter thickener. The tailings testwork results were used to evaluate the behaviour of the tailings under conditions of dynamic settling and to determine design values for the two-stage tailings thickening system. Two stages of thickening in series were selected due to the properties of thickened tailings and to avoid capital and operating costs associated with operating using non-thickened tailings. In the first stage of testing, flocculant screening tests were conducted by Outotec, to determine the type of flocculant and the slurry dilution. The resulting recommendation was the use of anionic flocculant MG-1011 at a slurry dilution of 14% solids w/w. Later in the program dynamic testing was performed for both high-rate thickening and high-capacity thickening. Using free sedimentation tests, Delkor determined the type of flocculant and the dose. Delkor recommended flocculant AP-2020 at a dilution between 9–13% solids w/w. Dynamic tests were also carried out. Based on the testwork results, the recommended tailings thickening conditions are: First stage:
Type of thickener: High rate Thickening rate: 0.65 t/hr/m2 Solid percent of thickened tailings: 55% Flocculant dose: 10 g/t tailings.
Second stage: Type of thickener: High density Thickening rate: 0.5 t/hr/m2 Solid percent of thickened tailings: 67% Flocculant dose: 10 g/t tailings.
It is assumed that the use of desalinated water in the process plant will not materially change the process design criteria for the tailing handling circuit given the absence of swelling clays in the ore. This will be confirmed in the pilot plant testing to be carried out in the next phase.

Santo Domingo Project Region III, Chile NI 43-101 Technical Report
Page 13-34
March 2020
Project Number: C40029
13.1.11 Cobalt
Initial cobalt testwork was performed in 2018 by several laboratories supervised by Blue Coast Metallurgy Ltd. (Blue Coast). This limited testwork indicated that, using the present flowsheet, it may be possible to recover about 80% of the cobalt as a secondary concentrate. Capstone has authorized further studies to define the optimum flotation circuit for cobalt processing. Additional testwork is also planned to determine the quality of the cobalt sulphate product and assess the impact of any impurities that might affect marketing. The initial program consisted of flotation flowsheet development at Blue Coast to produce a cobalt and copper bearing pyrite concentrate from the flotation tailings. Preliminary testwork, on a single bulk sample, indicated that conventional pyrite flotation from the copper circuit tailings could produce a secondary concentrate grading 0.4% Co, 0.6% Cu and 29% S. Three potential processes were tested for extraction of the metals from this concentrate. Cobalt extraction varied from 33% to 98% depending on methods and conditions. In 2019 more detailed test programs were conducted at Kingston Process Metallurgy (KPM) and SGS Lakefield to develop an oxidation and purification process to produce cobalt sulphate heptahydrate and copper sulphide precipitate as final products. The testwork included biological oxidation, pressure oxidation leaching, the Albion Process, and roasting. These processes were tested under a variety of conditions to determine an optimum approach for further development. In 2019 Aminpro also started cobalt flotation testwork, which consisted of floating the pyrite from the scavenger tailings from the copper circuit. Testwork is ongoing.
13.1.11.1 Physical Characterization and Sample Selection 13.1.11.1.1 Sample Description
The 2018 cobalt investigation used the Years 1-5 composite material remaining from the 2015 pilot testing program. This material had been stored in the core storage facility since late 2015 and had been crushed to -3/4” for comminution testing. The 2019 program used remaining Years 1-5 composite previously crushed to -4 mm for feed to the 2015 pilot plant ball mill.
Santo Domingo Project Region III, Chile NI 43-101 Technical Report
Page 13-35
March 2020
Project Number: C40029
13.1.11.1.2 Cobalt Mineral Characterization
Two flotation separation tests were completed at Blue Coast in 2018 to produce separate copper and pyrite concentrates. The cobalt to pyrite ratio in the feed, tailings and the six individual flotation concentrates from each test were regressed to confirm the cobalt association with pyrite. In both tests the cobalt correlates closely with the inferred pyrite content of the individual samples as shown in Figure 13-1. For the two tests the implied cobalt concentration in pyrite is 0.73%. Samples of pyrite concentrate and scavenger tailing produced in the laboratory during the 2018 cobalt investigations were submitted to AuTec in British Columbia for modal analysis and field emission gun–scanning electron microscope (FEG-SEM) imaging and Surface Science Western at the University of Western Ontario for dynamic secondary ion mass spectrometry (D-SIMS) depth profiling of individual pyrite particles. A total of 181 discrete pyrite grains from pyrite concentrate products and scavenger tailings were scanned; the average cobalt content of pyrite grains averaged 0.74%, closely matching the implied concentration from the regression of flotation products. Depth profiling individual pyrite particles does not suggest a concentration gradient away from the particle surface. This work also found a wide variation in cobalt concentration across the sample set analyzed, ranging from 0% Co to 2.5% Co; 80% of the cobalt was contained in the 50% of the pyrite particles containing the highest cobalt content. The modal analysis also found trace discrete cobalt sulphide minerals and cobalt present in hematite; however, these were not prevalent enough to quantify. The cobalt is not uniformly distributed in the pyrite; however, the cobalt is uniformly distributed in the grains containing cobalt, strongly suggesting a solid solution rather than surface coatings or discrete cobalt sulphide minerals locked with pyrite. This work found that 83% of the cobalt in the samples analyzed was present in solid solution with pyrite. The remainder is likely in locked pyrite particles, in chalcopyrite and, in rare instances, in discrete cobalt sulphide minerals.
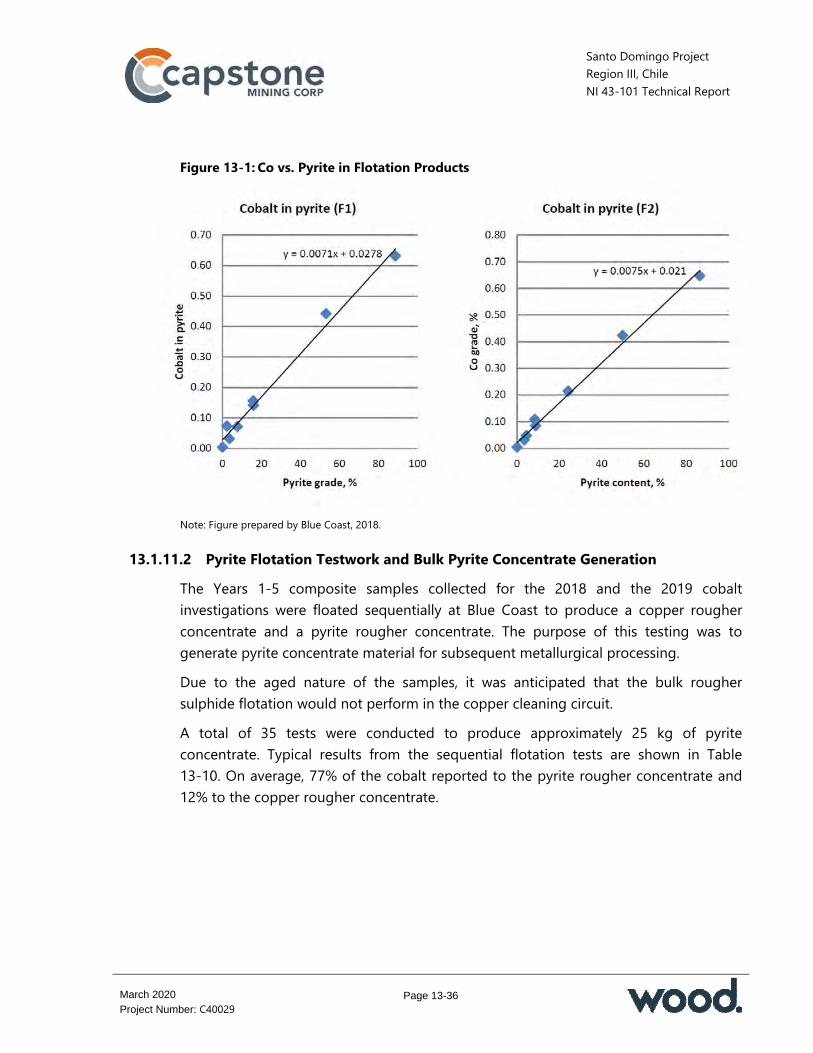
Santo Domingo Project Region III, Chile NI 43-101 Technical Report
Page 13-36
March 2020
Project Number: C40029
Figure 13-1: Co vs. Pyrite in Flotation Products
Note: Figure prepared by Blue Coast, 2018.
13.1.11.2 Pyrite Flotation Testwork and Bulk Pyrite Concentrate Generation The Years 1-5 composite samples collected for the 2018 and the 2019 cobalt investigations were floated sequentially at Blue Coast to produce a copper rougher concentrate and a pyrite rougher concentrate. The purpose of this testing was to generate pyrite concentrate material for subsequent metallurgical processing. Due to the aged nature of the samples, it was anticipated that the bulk rougher sulphide flotation would not perform in the copper cleaning circuit. A total of 35 tests were conducted to produce approximately 25 kg of pyrite concentrate. Typical results from the sequential flotation tests are shown in Table 13-10. On average, 77% of the cobalt reported to the pyrite rougher concentrate and 12% to the copper rougher concentrate.

Santo Domingo Project Region III, Chile NI 43-101 Technical Report
Page 13-37
March 2020
Project Number: C40029
Table 13-10: 2019 Sequential Flotation Typical Results
Product Weight Assays (%) %Distribution g % Cu Co Fe S Cu Co Fe S
Cu Rougher Conc. 1-4 378.0 3.79 15.4 0.10 30.7 19.0 92.9 12.0 3.5 28.2 PY Rougher Conc. 1-3 492.3 4.93 0.47 0.49 40.0 35.7 3.7 76.5 6.0 69.2 Rougher Tailings 9,106.3 91.3 0.02 0.00 32.7 0.07 3.4 11.5 90.5 2.6 Calculated Head 9,976.6 100 0.63 0.03 32.9 2.55 100 100 100 100
Cobalt deportment was analyzed for all the flotation testing program in 2019 as part of the refinement of the copper flotation circuit. In these tests, cobalt and inferred pyrite were traced through all the products generated. For the Years 1-5 composite, 90.2% of the cobalt and 97.5% of the pyrite reported to the cleaner tailings. The LCT cleaner tailings for the Years 1-5 composite averaged 0.268% Co and 22% S for the last three test cycles (see Table 13-11). This is considered to be representative of the cobalt/sulphur deportment to be expected over the mine life based on analysis of the drilling and block model databases. Subsequent investigation to test the amenability of re-flotation of the pyrite in the cleaner tailings by lowering the pH to 6–7 and PAX addition, produced pyrite concentrates with more than 47% S with 97% Co reporting to the concentrates, with proportional cobalt distributions to the pyrite. Insufficient material was available for complete testing of the pyrite cleaning process, but an assumption of 98% pyrite (and Co) recovery to a re-cleaned pyrite concentrate are considered reasonable based on the targeted concentration ratio from the cleaner tailings to the pyrite concentrate of approximately two (a typical copper cleaning circuit would target a ratio of 6 to 7). Two timed pyrite cleaning tests in the laboratory produced five sequential pyrite concentrates with consistent cobalt to sulphur ratios in the timed concentrates, suggesting a straightforward pyrite/gangue separation step. The regression of these products is shown in Figure 13-2.

Santo Domingo Project Region III, Chile NI 43-101 Technical Report
Page 13-38
March 2020
Project Number: C40029
Table 13-11: LCT Cobalt Testing Results
Sample LCT Cleaner Tailings Implied Co
Grade in Pyrite (%)
Grade %Distribution Co (%) FeS2 (%) Co FeS2
Years 1-5 composite 0.268 40.5 90.2 97.5 0.662 Year 1 composite 0.282 41.8 91.5 98.5 0.675 Year 2 composite 0.242 33.5 89.5 96.0 0.722 Year 3 composite 0.224 29.9 87.0 94.0 0.749 Year 4 composite 0.254 33.9 90.0 95.6 0.749 Year 5 composite 0.199 40.3 83.2 91.9 0.494 Avg. of composites 0.245 36.7 88.2 95.2 0.668
Figure 13-2: Cobalt to Sulphur Regression for Timed Pyrite Flotation
Note: Figure prepared by Gregg Bush, based on Aminpro data, 2020
13.1.11.3 Pyrite Oxidation and Cobalt Leaching Testwork An initial preliminary concentrate oxidation testwork program consisting of one pressure leach test (POX) and one bacterial oxidation test (BiOX) indicated the potential for cobalt extraction through dissolution of the sulphide minerals. Therefore, three hydrometallurgical sulphide oxidation flowsheets were evaluated: Albion, BiOX and POX.

Santo Domingo Project Region III, Chile NI 43-101 Technical Report
Page 13-39
March 2020
Project Number: C40029
13.1.11.3.1 Albion Process
The Albion Process consists of ultra-fine grinding followed by atmospheric leaching at elevated temperature with oxygen sparging. Leach times are typically of the order of 48 hours. The process is currently applied commercially for the recovery of gold, copper and zinc. Two tests were conducted at KPM using Santo Domingo concentrate. The first test resulted in only 12% sulphide oxidation and only 17% of the cobalt going into solution. The second Albion test resulted in sulphur oxidation increased to 24% and overall cobalt extractions was 38%. No further Albion Process tests were conducted.
13.1.11.3.2 BiOX Testing
A batch BiOX test was conducted at SGS Lakefield using a 250 g sample of concentrate ground to a P80 of 25 µm. The sample was re-pulped to 15% solids and inoculated with bacteria and nutrient solution. The test was run for a total of 19 days. Sulphide oxidation was essentially complete after 10 days, as shown by the cobalt extraction in Figure 13-3. Figure 13-3: BiOX Cobalt and Copper Extraction vs. Leach Time
0
10
20
30
40
50
60
70
80
90
100
0 2 4 6 8 10 12 14 16
Est
imat
ed M
etal
Ext
ract
ion
(%)
Time (days)
Cobalt Copper
Note: Figure prepared by SGS Lakefield, 2019

Santo Domingo Project Region III, Chile NI 43-101 Technical Report
Page 13-40
March 2020
Project Number: C40029
Overall cobalt extraction exceeded 95% after 12 days, with residue assays measuring below the detection limit of 0.01% Co. However, after nine days of bioleaching the process had consumed 250 kg of calcium carbonate per tonne of test feed to maintain the pulp pH above 1.8; and 35 g/L of iron had leached into solution. No further testwork was conducted using BiOX.
13.1.11.3.3 POX Testing
In total, six 2 L batch pressure oxidation tests were conducted at SGS using Santo Domingo flotation concentrate. Initial testing used temperature conditions of 150°C and 225°C, both with 100 psi oxygen overpressure. At 225°C, a high degree of sulphide oxidation was achieved and cobalt extraction reached 98%. In comparison, at 150°C less acid was produced and the cobalt extraction was roughly half of that realized at 225°C (Table 13-12). Table 13-12: POX Concentrate Leach Test Summary
Test ID Unit POX 1 POX 2 POX 3 POX 4 POX 5 POX 6 Feed P80 µm 207 207 25 25 25 25 Temperature °C 150 225 150 200 180 225 Retention time h 3 3 3 3 3 2 Oxygen overpressure kPa 689 689 689 689 689 689 Pulp density % 15 15 15 15 15 10 Pre-acidification pH — 2 2 1 2 2 2 Lignosol addition g/L 0 0 1 0 0 0 Final free acid g/L 36 67 43 56 63 59 Final Extraction
Co % 47 98 61 98 98 97 Cu % 79 99 94 99 99 97 Fe % 25 11 65 15 49 18 Mn % 94 92 97 97 97 95
Mg % 93 98 95 97 96 97 Ca % 57 51 60 59 72 84 Al % 33 54 40 57 52 63 Na % 4 25 8 13 14 28 Zn % 48 53 74 58 73 70

Santo Domingo Project Region III, Chile NI 43-101 Technical Report
Page 13-41
March 2020
Project Number: C40029
The disadvantage of the higher temperature conditions was an increase in acid generation that would result in higher neutralization costs downstream. Follow-up testing looked at re-grinding the concentrate from the P80 size of 207 µm to a P80 of 25 µm (POX 3 to POX 6), addition of Lignosol as a sulphur dispersant (POX 3,) and temperatures of 180°C (POX 4) and 200°C (POX 5). The finer grind and the addition of Lignosol in POX3 slightly improved cobalt extraction over POX1, to 61%. In contrast, higher leach temperature in POX4 and POX5 achieved results closer to the POX6 result. Copper extraction by POX was as good or better than for cobalt, reaching 99% in some tests. The POX work demonstrated that high cobalt extraction can be achieved, but under the conditions tested this was only possible with high oxidation of sulphide to sulphate. No opportunity was identified to produce elemental sulphur and reduce the final acid concentration.
13.1.11.3.4 Roasting and Calcine Leaching Testing
A pyrometallurgical approach to sulphide oxidation was investigated in a series of roasting tests conducted at KPM. In total, seven roasting tests were carried out, summarized in Table 13-13. The residue from each test was subjected to acid leach testing to quantify the potential cobalt and copper extractions. The first roasting test was carried out in a continuously fed, 2” fluid bed roaster. Residue collected from the test was split into test charges and leached at varying acid concentration for 24 hours. The results indicated that the soluble cobalt species leached quickly, within the first few hours of the test. Subsequent tests evaluated batch fed equipment including a short rotary furnace and a rotary kiln under varying operating temperatures and oxygen additions. Optimum cobalt leach extraction was achieved with residues from tests conducted at a temperature of 660–680°C with SO2 and O2 at 10% (Leach Tests K and M). In Leach Test L the roasting temperature of 800–840°C resulted in poor metal extraction. This is believed to be due to the formation of ferrites at the higher temperature. A POX leach was conducted on the residue under more aggressive leach conditions (250°C and 50 g/L acid) achieved cobalt and copper recoveries of 92% and 90%, respectively. This suggests the potential to operate at a higher roasting temperature followed by pressure leaching of the residue.
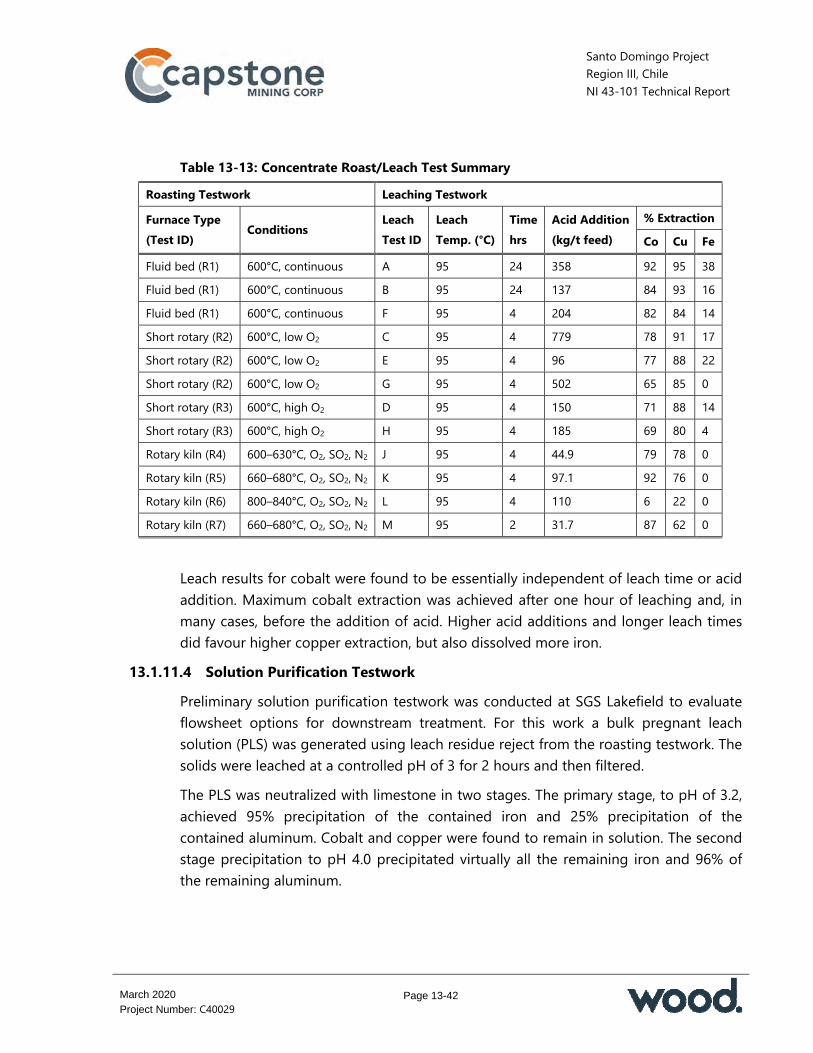
Santo Domingo Project Region III, Chile NI 43-101 Technical Report
Page 13-42
March 2020
Project Number: C40029
Table 13-13: Concentrate Roast/Leach Test Summary Roasting Testwork Leaching Testwork Furnace Type (Test ID) Conditions Leach
Test ID Leach Temp. (°C)
Time hrs
Acid Addition (kg/t feed)
% Extraction Co Cu Fe
Fluid bed (R1) 600°C, continuous A 95 24 358 92 95 38 Fluid bed (R1) 600°C, continuous B 95 24 137 84 93 16 Fluid bed (R1) 600°C, continuous F 95 4 204 82 84 14 Short rotary (R2) 600°C, low O2 C 95 4 779 78 91 17 Short rotary (R2) 600°C, low O2 E 95 4 96 77 88 22 Short rotary (R2) 600°C, low O2 G 95 4 502 65 85 0 Short rotary (R3) 600°C, high O2 D 95 4 150 71 88 14 Short rotary (R3) 600°C, high O2 H 95 4 185 69 80 4 Rotary kiln (R4) 600–630°C, O2, SO2, N2 J 95 4 44.9 79 78 0 Rotary kiln (R5) 660–680°C, O2, SO2, N2 K 95 4 97.1 92 76 0 Rotary kiln (R6) 800–840°C, O2, SO2, N2 L 95 4 110 6 22 0 Rotary kiln (R7) 660–680°C, O2, SO2, N2 M 95 2 31.7 87 62 0
Leach results for cobalt were found to be essentially independent of leach time or acid addition. Maximum cobalt extraction was achieved after one hour of leaching and, in many cases, before the addition of acid. Higher acid additions and longer leach times did favour higher copper extraction, but also dissolved more iron.
13.1.11.4 Solution Purification Testwork Preliminary solution purification testwork was conducted at SGS Lakefield to evaluate flowsheet options for downstream treatment. For this work a bulk pregnant leach solution (PLS) was generated using leach residue reject from the roasting testwork. The solids were leached at a controlled pH of 3 for 2 hours and then filtered. The PLS was neutralized with limestone in two stages. The primary stage, to pH of 3.2, achieved 95% precipitation of the contained iron and 25% precipitation of the contained aluminum. Cobalt and copper were found to remain in solution. The second stage precipitation to pH 4.0 precipitated virtually all the remaining iron and 96% of the remaining aluminum.
Santo Domingo Project Region III, Chile NI 43-101 Technical Report
Page 13-43
March 2020
Project Number: C40029
A sample of post-secondary neutralization PLS was used to evaluate copper precipitation (as CuS) using sodium hydrosulphide (NaHS). Laboratory-scale dosing of the solution with 110% stoichiometric addition of NaHS resulted in approximately 50% Cu recovery. The results indicate that higher NaHS addition is likely required to achieve a copper recovery typical of an operating plant (i.e. greater than 98%). The final purification test was conducted using Caro’s acid to precipitate manganese from the CuS precipitation raffinate. The feed was 140 ppm Mn and after 105 minutes of precipitation the filtered solution was 9.6 ppm Mn. The cobalt grade of the final solution was equal to the feed at 1,060 ppm, indicating minimal losses.
13.1.11.5 Solvent Extraction Circuit Conceptual Design Work Based on the results obtained in the purification testwork, the design criteria for head grade leach density and leach extraction, an estimate was made of solution tenors for the feed to a cobalt SX circuit. This information was provided to Solvay for circuit modelling.
13.2 Recovery Estimates 13.2.1 Copper
The 2018 Technical Report used the copper feed grade to predict the copper recovery using the results from Aminpro 2018 metallurgical testwork. The equation derived was: Global Cu Recovery = 0.98 * 96.9018*(Feed, % Cu) 0.0199 The factors included in the model represent the following: 0.98 = copper cleaning recovery factor (more studies were carried out with
additional samples to improve the confidence in this value) 96.9018 and 0.0199 = optimized constants of the potential equation. The 2018 copper model is shown in Figure 13-4. This equation was used to calculate copper recovery for the production plan in Section 17.3 and for the economic analysis in Section 22.
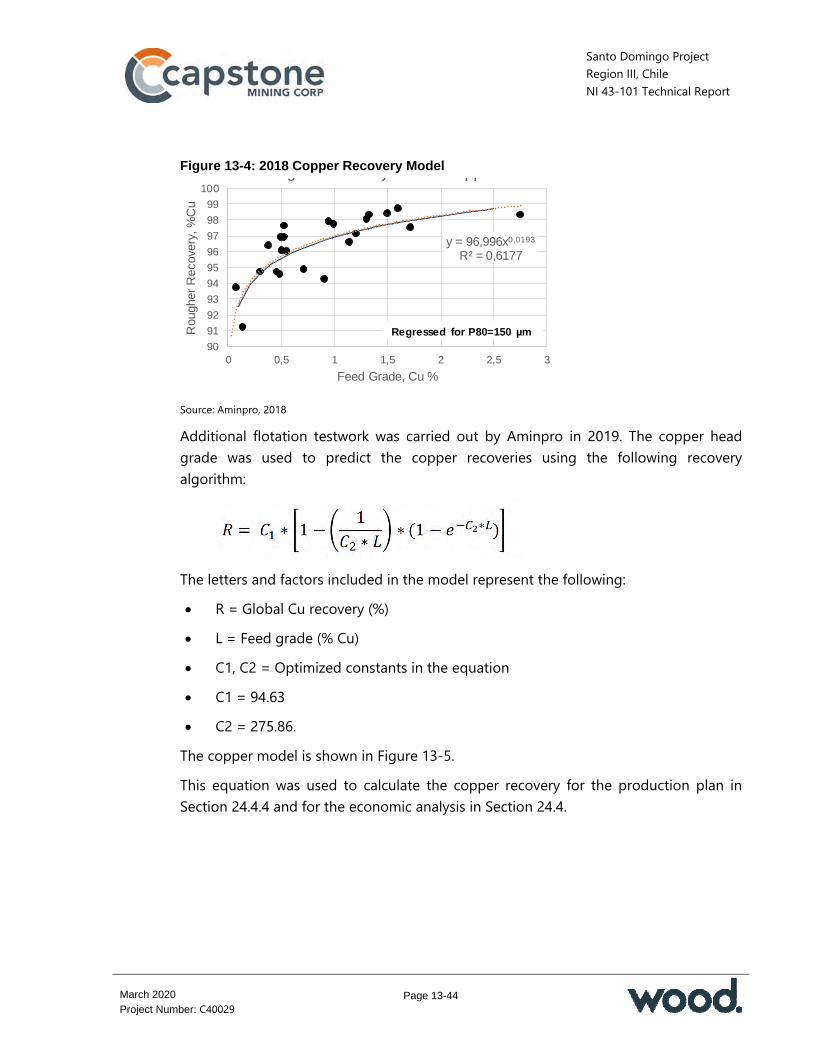
Santo Domingo Project Region III, Chile NI 43-101 Technical Report
Page 13-44
March 2020
Project Number: C40029
Figure 13-4: 2018 Copper Recovery Model
y = 96,996x0,0193
R² = 0,6177
90
91
92
93
94
95
96
97
98
99
100
0 0,5 1 1,5 2 2,5 3
Rou
gher
Rec
over
y, %
Cu
Feed Grade, Cu %
g y pp
Regressed for P80=150 µm
Source: Aminpro, 2018 Additional flotation testwork was carried out by Aminpro in 2019. The copper head grade was used to predict the copper recoveries using the following recovery algorithm:
The letters and factors included in the model represent the following: R = Global Cu recovery (%) L = Feed grade (% Cu) C1, C2 = Optimized constants in the equation C1 = 94.63 C2 = 275.86.
The copper model is shown in Figure 13-5. This equation was used to calculate the copper recovery for the production plan in Section 24.4.4 and for the economic analysis in Section 24.4.
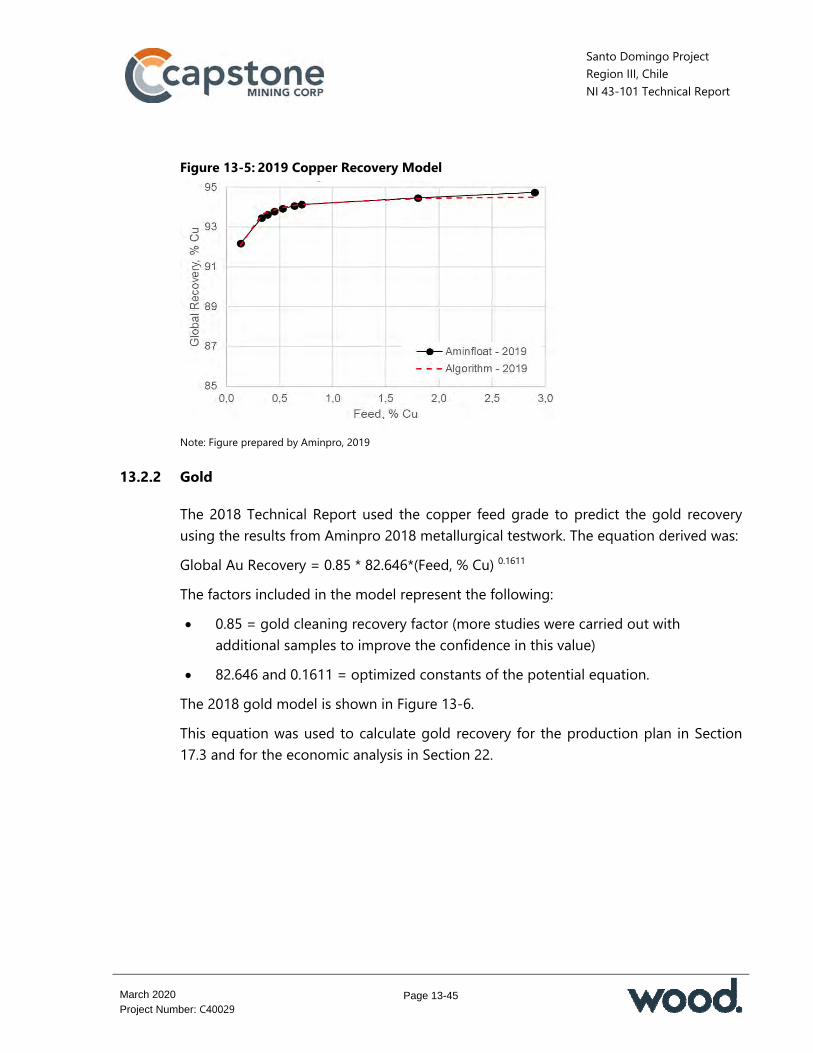
Santo Domingo Project Region III, Chile NI 43-101 Technical Report
Page 13-45
March 2020
Project Number: C40029
Figure 13-5: 2019 Copper Recovery Model
Note: Figure prepared by Aminpro, 2019
13.2.2 Gold
The 2018 Technical Report used the copper feed grade to predict the gold recovery using the results from Aminpro 2018 metallurgical testwork. The equation derived was: Global Au Recovery = 0.85 * 82.646*(Feed, % Cu) 0.1611 The factors included in the model represent the following: 0.85 = gold cleaning recovery factor (more studies were carried out with
additional samples to improve the confidence in this value) 82.646 and 0.1611 = optimized constants of the potential equation.
The 2018 gold model is shown in Figure 13-6. This equation was used to calculate gold recovery for the production plan in Section 17.3 and for the economic analysis in Section 22.

Santo Domingo Project Region III, Chile NI 43-101 Technical Report
Page 13-46
March 2020
Project Number: C40029
Figure 13-6: 2018 Gold Recovery Model
y = 82,646x0,1611
R² = 0,626
40
50
60
70
80
90
100
0 0,5 1 1,5 2 2,5 3
Rou
gher
Rec
over
y, %
Au
Feed Grade, Cu %
g y
Regressed for P80=150 µm
Source: Aminpro, 2018 Additional flotation testwork was carried out by Aminpro in 2019. The gold head grade was used to predict the gold recoveries using the following recovery algorithm:
The letters and factors included in the model represent the following: R = Global Au recovery (%) L = Feed grade (g/t Au) C1, C2 = Optimized constants in the equation C1 = 91.52 C2 = 64.57. The 2019 gold model is shown in Figure 13-7. This equation was used to calculate the gold recovery for the production plan in Section 24.4.4 and for the economic analysis in Section 24.4.

Santo Domingo Project Region III, Chile NI 43-101 Technical Report
Page 13-47
March 2020
Project Number: C40029
Figure 13-7: 2019 Gold Recovery Model
Note: Figure prepared by Aminpro, 2019
13.2.3 Iron
For magnetite recovery, magnetic susceptibility was used to predict the mass recovery to the final magnetite concentrate. The relationship derived is:
0.0011 x (MagSus) – 3E-09 x (MagSus)2; if MagSus ≥ 2,000 Rec. Mass Fe =
0; if MagSus < 2,000 Note: MagSus = magnetic susceptibility; Rec. Mas Fe = mass recovery to final magnetite concentrate
Figure 13-8 compares the values from the model versus testwork results; it can be seen that the model predicts the results of the magnetite testwork conducted. The values of magnetite recovery from the rougher tailings from DT testwork were corrected to reflect the mass recovery equivalent to industrial scale at 90% of the test results. The model was compared with this information and it was observed that there is a good correlation between the model and the test results.
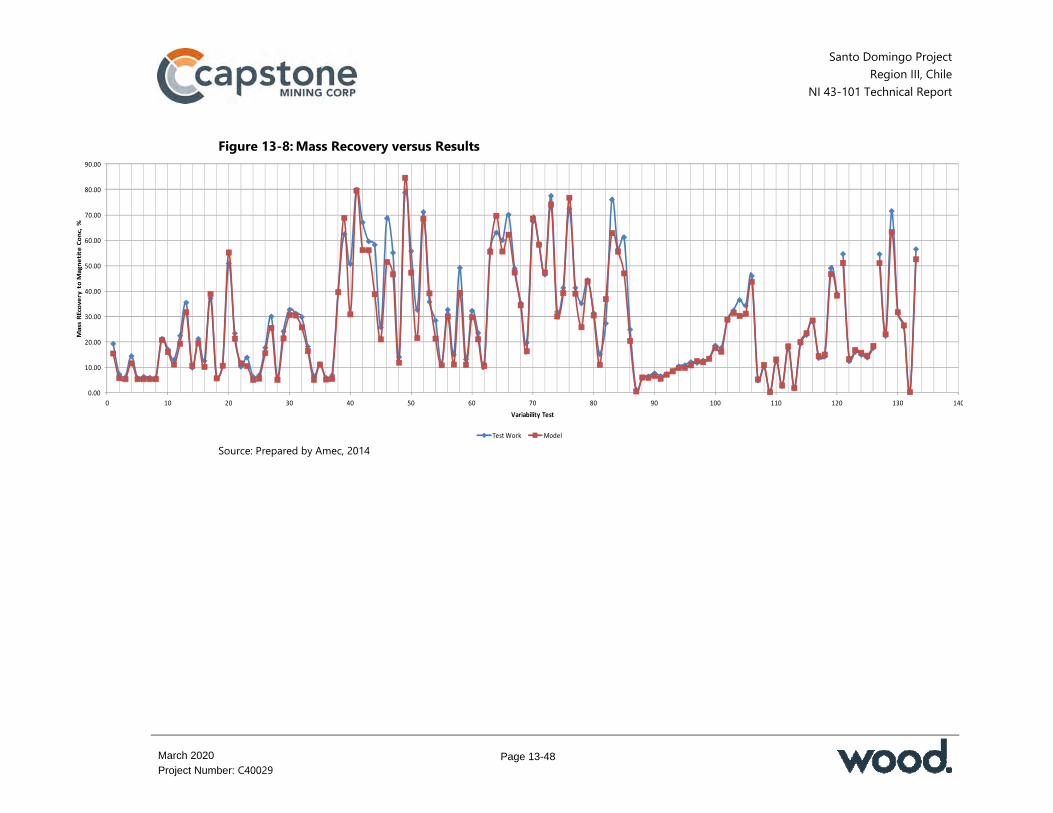
Santo Domingo Project Region III, Chile
NI 43-101 Technical Report
Page 13-48
March 2020
Project Number: C40029
Figure 13-8: Mass Recovery versus Results
0.00
10.00
20.00
30.00
40.00
50.00
60.00
70.00
80.00
90.00
0 10 20 30 40 50 60 70 80 90 100 110 120 130 140
Mass REcovery to M
agnetite Conc, %
Variability Test
Test Work Model Source: Prepared by Amec, 2014

Santo Domingo Project Region III, Chile
NI 43-101 Technical Report
Page 13-49
March 2020
Project Number: C40029
13.2.4 Cobalt
Stage flotation recovery of cobalt and copper to the roaster feed are estimated at 88.4% and 2.97%, respectively. Plant losses during the conversion of flotation concentrate to final products are expected to consist of washed residue solids, residue solids entrained solution, manganese precipitate, mother liquor bleed stream. Table 13-14 shows the estimated stage and overall recoveries for the cobalt circuit. Based on these estimates, overall recoveries from the copper circuit feed to the two final product streams are calculated to be 78.3% for cobalt and 2.21% for copper based on mill feed contained metals. In addition, 99% recovery is assumed of contained sulphur in the roaster feed as sulphuric acid. Table 13-14: Recovery Estimates
Stage Stage Recovery Co (%) Cu (%) FeS2 (%)
Cu cleaner scavenger tailings 90.2 3.00 97.5 Pyrite concentrate 98.0 99.0 98.0 Recovery to roaster feed 88.4 2.97 95.6 Calcine leach recovery 90.0 75.0 — Metal recovery from solution 98.5 99.0 — Overall recovery 78.3 2.21 —
13.3 Metallurgical Variability 13.3.1 Copper, Iron and Gold
Metallurgical variability testwork is discussed in Section 13.1. Variability samples were selected during the 2011 pre-feasibility study program by Capstone personnel to spatially represent the deposit in terms of grade and major lithologies.
13.3.2 Cobalt
Sample selection was dictated largely by the availability of samples that could be used without impacting sample availability for the copper/iron process flowsheet development programs. The samples were limited to materials remaining from the
Santo Domingo Project Region III, Chile
NI 43-101 Technical Report
Page 13-50
March 2020
Project Number: C40029
2015 pilot testing program conducted at ALS Santiago. A statistical analysis was conducted to establish the legitimacy of applying results from the limited sample set. The statistical analysis suggests that there is little correlation between the copper concentration in the samples and the total sulphur concentration (pyrite content is independent of copper content). There is, however, a strong correlation between the sulphur content and the cobalt content in the drilling database for the sulphide zone. The conclusion from the analysis of the drilling database and the correlation between the cobalt concentration in the samples and the implied pyrite concentration is that there is no difference between the cobalt deportment in pyrite for the 5-year pit (represented in the composite used for the cobalt testwork) and the 18-year pit.
13.4 Deleterious Elements 13.4.1 Copper Concentrate
Strongly oxidized material has the potential to impact on the metallurgical recoveries from the process plant. While the current mine plan does not envisage mining of the oxide cap, there may be sections of the proposed pits where increased clay contents are encountered, such as in the vicinity of faults. Capstone plans to manage this by appropriate grade control measures and in-pit mapping. Soluble copper content levels are variable within the deposit. This indicates the presence of different copper mineral species within the ores. Test sample results with high soluble copper contents (>10% soluble copper) were excluded from the algorithm development analysis. Blocks with soluble copper contents above 10% are classified as waste within the mine plan and will not be sent to the plant. For the 2019 metallurgical test program a target of 10% soluble copper ratio to total copper was considered, taking into consideration that blocks with soluble copper content above 10% are mainly classified as waste within the mine plan or are within fault areas that will be managed during the operation. A review of the analyses of the concentrate generated from the Years 1-5 composite indicated that arsenic values were low, the silica level is acceptable and heavy minerals such as bismuth, antimony and cadmium are low. In the QP’s opinion, the levels of deleterious elements in the copper concentrate are such that no penalties are likely to be levied.

Santo Domingo Project Region III, Chile
NI 43-101 Technical Report
Page 13-51
March 2020
Project Number: C40029
Based on the solution chemistry obtained after the calcine leaching step it was determined that the elements that need to be considered in the process design are magnesium, zinc and manganese. Magnesium would be managed with an organic phase scrubbing step to remove excess magnesium from the organic before stripping. Manganese would be managed with a pre-purification step to remove manganese from solution with SO2/air injection following solution neutralization. A second strip liquor polishing step using SO2/air or Caro’s acid may be required after SX and before reporting to the crystallizer. There is a potential for zinc build-up in the SX circuit. This can be managed by increasing the acid in the organic scrubbing step and allowing the zinc concentration to rise. A scrub solution bleed would then report to pH adjustment and final tailings, removing zinc from the circuit.
13.4.2 Iron Concentrate
As no final market specification has been concluded with an end-user for purchase of the magnetite concentrates produced, Capstone derived a target specification from testwork results of concentrates from the 2011 pre-feasibility study (Table 13-15). The majority of concentrate samples produced from the DT tests returned elemental grade values within target specification and indicate that a marketable concentrate can be produced. Additional information on marketability is included in Section 19. From the DT testwork results, 12 of the 164 feed samples were lithologically defined as ANDE and returned values that were outside the target range estimated by Capstone for contained silica in magnetite concentrate. ANDE material represents between 13% and 17% of the LOM plant feed. Treatment of the ANDE ore types in high mill feed proportions could potentially lead to the production of concentrates containing low iron and high silica contents, due to the inability to separate magnetite from silica. In order to meet the target magnetite concentrate market specifications, there is a risk that a portion of the ANDE material designated as plant feed will be designated as waste. In order to quantify this potential impact on concentrate marketability, additional targeted variability testwork is recommended to better understand magnetite concentrate variations in specific ANDE lithology zones (e.g. near barren dyke alterations).

Santo Domingo Project Region III, Chile
NI 43-101 Technical Report
Page 13-52
March 2020
Project Number: C40029
Table 13-15: Final Concentrate Properties and Capstone Target Specification
Element Property
Years 1-5 Average Sample Final LIMS Concentrate (%)
Current Capstone Target (%)
Mass Yield 23.4 — Fe Grade 66.0 > 65 SiO2 Grade 4.56 4.10 Al2O3 Grade 1.00 1.00 TiO2 Grade 0.17 - Mn Grade 0.07 0.07 CaO Grade 0.69 0.57 P Grade 0.01 0.01 S Grade 0.01 0.02 MgO Grade 0.48 0.46 K2O Grade 0.12 0.11 Na2O Grade 0.14 0.15 Zn Grade 0.004 — LOI (1,000) Grade -1.1600 — As Grade 0.0010 — Ba Grade 0.0010 — Cl Grade 0.0060 0.0060 Co Grade 0.0060 — Cr2O3 Grade 0.0900 — Cu Grade 0.0090 0.0081 Ni Grade 0.0340 — Pb Grade 0.0050 — Sn Grade 0.0005 — Sr Grade 0.0010 — V Grade 0.0080 — Zr Grade 0.0040 — FeO Grade 27.1 23.1
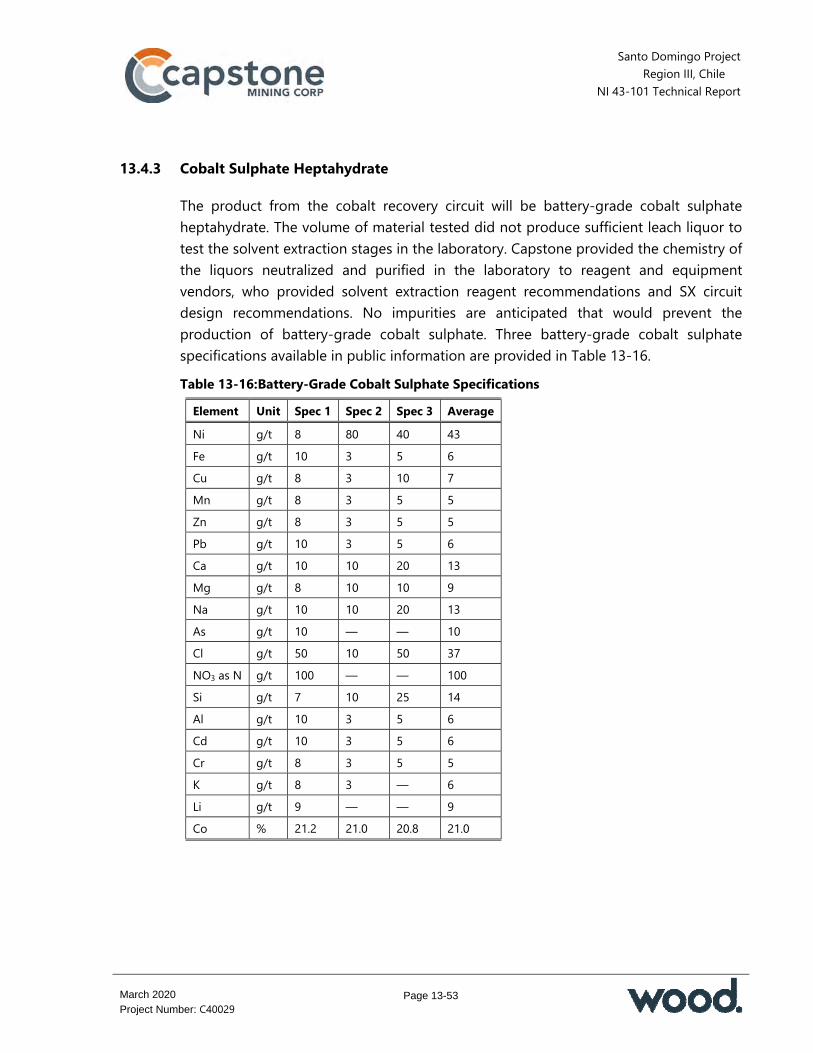
Santo Domingo Project Region III, Chile
NI 43-101 Technical Report
Page 13-53
March 2020
Project Number: C40029
13.4.3 Cobalt Sulphate Heptahydrate
The product from the cobalt recovery circuit will be battery-grade cobalt sulphate heptahydrate. The volume of material tested did not produce sufficient leach liquor to test the solvent extraction stages in the laboratory. Capstone provided the chemistry of the liquors neutralized and purified in the laboratory to reagent and equipment vendors, who provided solvent extraction reagent recommendations and SX circuit design recommendations. No impurities are anticipated that would prevent the production of battery-grade cobalt sulphate. Three battery-grade cobalt sulphate specifications available in public information are provided in Table 13-16. Table 13-16: Battery-Grade Cobalt Sulphate Specifications
Element Unit Spec 1 Spec 2 Spec 3 Average Ni g/t 8 80 40 43 Fe g/t 10 3 5 6 Cu g/t 8 3 10 7 Mn g/t 8 3 5 5 Zn g/t 8 3 5 5 Pb g/t 10 3 5 6 Ca g/t 10 10 20 13 Mg g/t 8 10 10 9 Na g/t 10 10 20 13 As g/t 10 — — 10 Cl g/t 50 10 50 37 NO3 as N g/t 100 — — 100 Si g/t 7 10 25 14 Al g/t 10 3 5 6 Cd g/t 10 3 5 6 Cr g/t 8 3 5 5 K g/t 8 3 — 6 Li g/t 9 — — 9 Co % 21.2 21.0 20.8 21.0
Santo Domingo Project Region III, Chile
NI 43-101 Technical Report
Page 13-54
March 2020
Project Number: C40029
13.5 Comments on Section 13 13.5.1 Copper, Gold and Iron
Metallurgical testwork completed during the 2011 pre-feasibility study, the 2014 feasibility study, during 2018 for the 2019 Technical Report and during 2019 for this Report includes: physical characterization; conventional sulphide flotation using fresh water, sea water and desalinated water; settling and filtration tests on the copper concentrate; magnetic separation of magnetite; and settling and filtration tests on the magnetite concentrate. Settling testwork was also completed on final flotation tailings. The average for the variability data set in 2014 with a copper head grade of 0.38% Cu, gave a recovery of 89% and a concentrate grade of 30.5% Cu. It is expected that there will be no penalty elements in the copper concentrate. The magnetite grades achieved varied between 64% and 68% and reflected the fineness of grind employed. No final market specification has been concluded with an end-user for purchase of the magnetite concentrates produced. Target specifications were developed by Capstone for use in the 2014 feasibility study. The majority of concentrate samples returned element grade values within the target specification and indicate that a marketable concentrate within Capstone’s planned specification can be produced. Additional information on marketability is included in Section 19. To quantify any potential impact on the magnetite concentrate marketability from inclusion of ANDE material in high proportions in the mill feed, additional targeted variability testwork is recommended to understand magnetite concentrate variations in specific zones of ANDE lithology (e.g. near barren dyke alterations) with respect to iron and silica relationships. The testwork completed during 2018 by Aminpro consisted of rougher and cleaner flotation tests with the composite for the first 5 years of operation using desalinated water in order to generate process modelling parameters and to examine the grade of concentrate and the recoveries of copper and gold that could be produced. With head grade variability samples, feed grades between 0.09% Cu and 2.76% Cu were tested and recovery algorithms were determined for copper and gold. The cleaner recoveries for copper and gold were later confirmed using LCT conducted on a composite of the variability samples using desalinated water. The LCT gave a copper global recovery of 92.4% with a concentrate grade of 32.8% Cu. Tests were performed with desalinated
Santo Domingo Project Region III, Chile
NI 43-101 Technical Report
Page 13-55
March 2020
Project Number: C40029
water to determine the new recovery algorithm. It is recommended that tests be carried out with fresh samples to confirm the current design criteria for the plant. From the testwork carried out in 2019 by Aminpro, the optimal operating conditions for the flotation circuit were determined. The results of the LCT were: Recovery: Cu 94.4%, Au 69.5% Grade: 33.7% Cu, 3.2 g/t Au The LCTs using the composites per year indicated a global recovery of Cu between 90.7% and 95.3%, with grades between 28.9% Cu and 33.3% Cu. For Au, the recovery was between 67% and 75%, with grades between 2.7–3.4 g/t. The recovery of pyrite and cobalt in the flows of the cleaner scavenger tailings were, on average, 94.6% and 88.7%, respectively.
13.5.2 Cobalt
During the 2019 Technical Report conceptual capital and operating cost estimates were prepared for cobalt recovery using a BiOX process, a POX process and a dead roasting process by AGP Mining Consultants in Barrie, Ontario. These conceptual estimates indicated that there is a reasonable prospect of eventual economic production of cobalt as a by-product from the process by adding a cobalt recovery circuit. Capstone has undertaken further studies to define the optimum flowsheet for cobalt processing and will continue to investigate this potential by-product stream. Testwork completed in 2019 indicates that cobalt can be recovered in the form of cobalt sulphate heptahydrate by pyrite flotation of the cleaner scavenger tailings, dead roasting of the resulting concentrate, leaching of the calcine and SX recovery from the leach solution. This process will also produce sulphuric acid from an acid plant treating the roaster gases and co-generation of power.
Santo Domingo Project Region III, Chile
NI 43-101 Technical Report
Page 14-1
March 2020
Project Number: C40029
14.0 MINERAL RESOURCE ESTIMATES
14.1 Introduction and Background
The cut-off for assay data was 30 June 2012 for the Iris, Iris Norte and Santo Domingo Sur deposits. The assay database contained 35,817 assay intervals. Of these, 30,938 assays had non-zero values for copper, gold, or iron; and 30,918 had non-zero values for cobalt. Most sampled intervals were 2 m in length for RC holes and 1 m or 2 m for diamond holes. Within the interpreted zones for the Santo Domingo Sur estimates were 16,224 intervals with copper, gold, iron and sulphur values, although 79 of these intervals were zero grade for all components. There were 16,143 non-zero cobalt intervals located within the interpreted mineralized zones. There are 13,192 samples with non-zero magnetic susceptibility values within the mineralized domains. The database provided to RPA contained collar records for 298 drill holes. Of these, 115 are core drill holes or holes collared as RC and then finished as core holes. Thirty holes were drilled as twins. Most of the drill holes are vertical or near vertical, with 76 holes collared at a dip shallower than -80°. Drill hole lengths vary widely, but are typically in the range between 200 m and 400 m. The Estrellita resource estimate was performed in 2007. In 2018, RPA populated the existing block model with cobalt grades. The Mineral Resource estimate is based on 114 RC holes (22,594 m) and 13 core holes (2,366 m). Assays for 18 of the drill holes located within the interpreted zone boundaries of Estrellita were not available at the time of the estimate and were not included. There were 4,702 copper assays, 3,595 gold assays, 4,702 cobalt assays and 4,701 sulphur assays with non-zero values. Cobalt and sulphur are fairly recent additions to the resource modelling, having been included in 2018 and 2020, respectively. Cobalt initially lacked a complete range of QA/QC data, but this is currently being resolved. The assay QA/QC work for sulphur lacks a complete set of blanks analyses, but it is largely complete and there is nothing to suggest that there are any issues with the sulphur analyses. In RPA’s opinion, in spite the lack of these QA/QC components, the overall quality of the database is acceptable for estimation of Mineral Resources. RPA further notes that preliminary review suggests that cobalt occurrence may not be entirely correlated to copper and gold. In RPA’s opinion, the estimate of cobalt grade may be improved by a more detailed geological interpretation and generation of separate domains for cobalt.

Santo Domingo Project Region III, Chile
NI 43-101 Technical Report
Page 14-2
March 2020
Project Number: C40029
Twin drilling programs were conducted at Santo Domingo Sur in 2014–2015 and 2019. The results from these drill holes have not been included in the resource estimate as yet. Although the results from these holes agreed reasonably well with the original data and the impact on the global resource estimate is expected to be minimal, RPA recommends that the estimate be revised to include them.
14.2 Geological Models
14.2.1 Santo Domingo Sur, Iris and Iris Norte Wireframes
RPA constructed three-dimensional (3D) wireframe or solid models and gridded surfaces of the mineralized zones, fault structures and topography for use in constraining the block grade interpolations. All zones required construction of wireframes for post-mineral dikes that transect the mineralized mantos. There are also some sequences of barren tuffs that were modelled. The wireframe outlines were copied from the 2010 models and modified to honour the 2011–2012 drilling. The principal controls were lithology and structure; however, in some places a nominal grade shell boundary was used. There was no rigorous grade cut-off for this boundary, as it was rarely needed, but as a general rule the cut-off was either a copper grade of 0.15% or a magnetic susceptibility value of 15,000. Eight domains were modelled. Three of these (Zones 1, 2 and 3) were further sub-divided into magnetite-rich and magnetite-poor variants. RPA examined the distribution of cobalt and copper mineralization in the entire Santo Domingo area to determine if there is a good correlation between the two metals. Although, cobalt is associated with pyrite mineralization, the overall spatial distribution is similar to copper. RPA considers the current copper domains to be suitable for interpolation of cobalt grades. RPA is of the opinion that future models might benefit from a separate set of cobalt domains to better define higher grades. RPA also reviewed the distribution of sulphur in the deposit and notes that it tends also to correlate with copper mineralization. For the most part, sulphur appears to be higher within current domain boundaries compared to outside. RPA notes, however, that the transition across these boundaries is often indistinct, particularly in zones of lower sulphur content. There are indications that sulphur is depleted in oxidized areas of the deposit, particularly near surface and along fault zones. Domain 7 in Iris Norte contains a
Santo Domingo Project Region III, Chile
NI 43-101 Technical Report
Page 14-3
March 2020
Project Number: C40029
significant number of very low to detection limit assays for sulphur. Many of these low-grade analyses do not correspond to low copper grades and this suggests that perhaps some weathering process has removed the sulphur but not the copper.
14.2.2 Estrellita Wireframes
Three-dimensional wireframe models of the mineralized zones, topography and mined volumes were constructed for use in constraining the block grade interpolations. The grade shell boundaries were constructed using a lower limit of 0.1% Cu. The applied limits are considered nominal because it was often necessary to include lower-grade intervals for continuity, using lithology as a guide. A modest amount of underground and open pit mining has been carried out at Estrellita. Far West personnel provided raw cavity monitoring device (CMD) data from which RPA was able to construct approximate wireframe models of the void spaces. As was the case for Santo Domingo, no separate wireframes were generated to outline the cobalt mineralization at Estrellita. RPA notes that sulphur assays are significantly lower at Estrellita than at Santo Domingo Sur. In addition, there are a much higher number of detection limit sulphur values, often coincident with significant copper grades. This is similar to what was observed in Iris Norte, but appears to be more widespread. As a result of the low sulphur grades observed at Estrellita and the fact that Estrellita is not currently included in the mine plan, it was decided not to proceed with estimation of sulphur in the block model. RPA recommends that the sulphur occurrences at Estrellita be reviewed to better understand the mineralogy and determine the reason for the unusually low sulphur concentrations in some portions of the deposit.
14.2.3 Oxide Model
A wireframe model was also created to enclose oxidized material which has been demonstrated to yield much lower metallurgical recoveries than the un-oxidized mineralization. This was a very preliminary model owing to the lack of a complete data set for leachable copper. The primary criteria for defining the base of the oxidized zone was presence of significant quantities of leachable copper, or strong oxidation noted in the logs. The oxide model was not used to constrain the grade interpolation. However, it was used to tag material within the resource volume such that this material could be excluded from the Mineral Resource estimate.

Santo Domingo Project Region III, Chile
NI 43-101 Technical Report
Page 14-4
March 2020
Project Number: C40029
14.2.4 Santo Domingo Sur
For the purpose of the resource estimates, the Santo Domingo Sur deposit was modelled as four primary structures (Zones 1 to 4). Several interpreted faults serve to constrain the mineralization on the eastern, western and southern extents as well as to divide the deposit into three distinct fault blocks. Capstone geologists have defined a magnetite-rich zone (termed the Mag Zone) which occupies the core of Zones 1, 2 and 3 at Santo Domingo Sur. Surrounding the Mag Zone is relatively more hematite-rich iron mineralization (Hematite Rim). The magnetic susceptibility values tend to be markedly higher for the Mag Zone than for the Hematite Rim. Consequently, a separate wireframe model for the Mag Zone was constructed and then used to constrain the interpolation values for magnetic susceptibility.
14.2.5 Iris
Iris is subdivided by an internal fault that separates a magnetite-rich zone to the west from the main deposit. The deposit is separated from the Santo Domingo Sur deposit by a north-trending, west-dipping fault and constrained on the eastern boundary by a series of east-dipping faults that separate it from limestone sequences to the east.
14.2.6 Iris Norte
Iris Norte is also bounded on the east by an interpreted east-dipping fault structure with limestone sequences located on the east side. The north-trending, west-dipping fault that divides Iris from Santo Domingo Sur appears to extend along the western flank of Iris Norte, limiting its western extent as well as intercepting the east-dipping faults between the limestone and Iris Norte to effectively cut the deposit off to the north.
14.2.7 Estrellita
The zone has been faulted into a series of four blocks which step downwards to the north. The zone is thickest in the middle and narrows somewhat towards the periphery. There are narrower zones of limited lateral extent in the footwall of the main zone.

Santo Domingo Project Region III, Chile
NI 43-101 Technical Report
Page 14-5
March 2020
Project Number: C40029
14.3 Grade Capping/Outlier Restrictions
Samples were capped prior to compositing. 14.3.1 Santo Domingo Sur, Iris and Iris Norte
The sample grade distributions for copper, gold and cobalt are positively skewed, in some cases resembling log-normal distributions. For the 2009 estimate, RPA produced a series of log-normal probability curves for copper and gold within the interpreted zones to examine the distribution of the assay data (Lacroix, 2009). The distribution curves for Santo Domingo Sur and Iris exhibited breaks or inflection points at about 3.5% Cu, 0.52 g/t Au and 1,750 ppm Co, indicating distinct populations for each metal. The data review with the latest drilling indicated the inflection points were still valid. In total, 24 copper and 27 gold assay intervals were capped for the 2012 estimate. These intervals represent approximately 0.2% of the total number of assays. For the 2018 cobalt estimate, 27 cobalt assay intervals were capped representing approximately 0.4% of the total number of assays. In RPA’s opinion, the net impact of the capping was to reduce the average copper, gold and cobalt assay grades by a negligible amount (see Table 14-1 to Table 14-3). The sample distributions for sulphur for all zones except Zone 7 did not indicate that capping was necessary. In Zone 7, there was a distinctly bi-modal distribution, which resulted in a fairly high coefficient of variation. On inspection it was found that there were a large number of very low and detection limit sulphur assays in this domain. A significant number of these low sulphur values occur in samples with significant copper grades, similar to that seen at Estrellita. The highest sulphur values are not unusually high and are not constrained to a single drill hole or two. In RPA’s opinion, applying a cap to the higher grade sulphur values in Zone 7 would be overly punitive. Consequently, a distance constraint of 30 m x 30 m x 15 m was placed on composites with grades higher than 2.5% S. In this way, the highest grades would not be entirely eliminated but would also not be smeared throughout the Zone 7 domain.
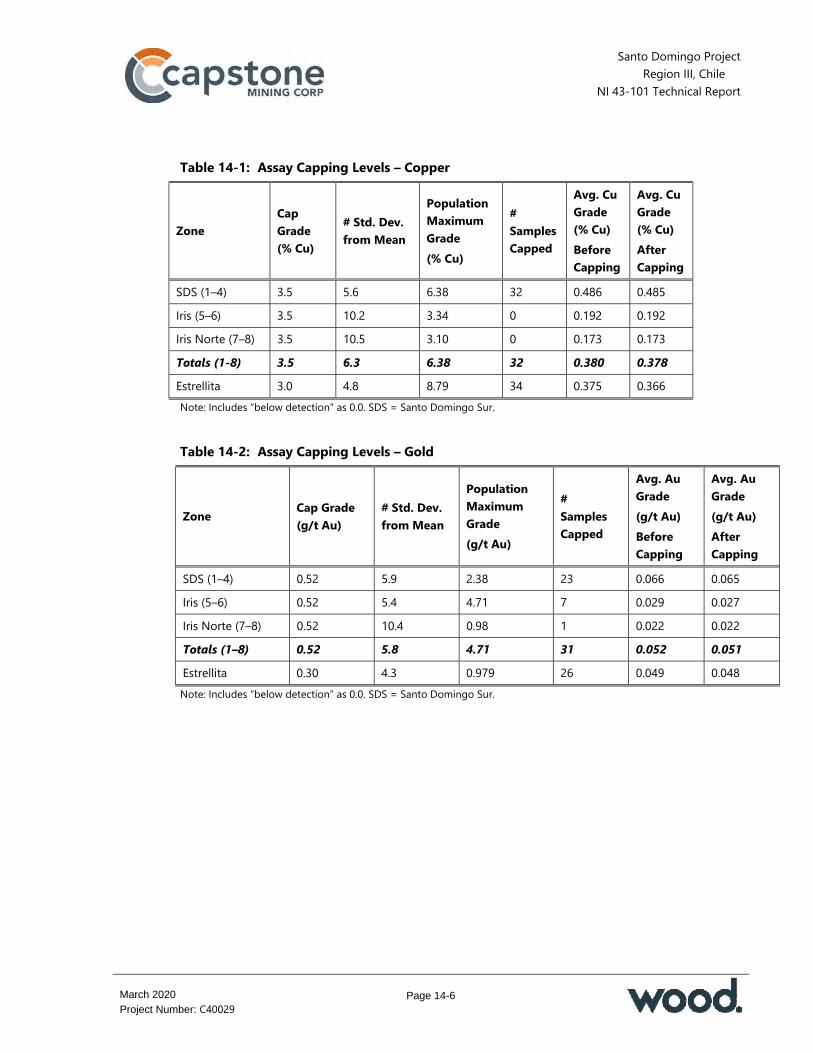
Santo Domingo Project Region III, Chile
NI 43-101 Technical Report
Page 14-6
March 2020
Project Number: C40029
Table 14-1: Assay Capping Levels – Copper
Zone Cap Grade (% Cu)
# Std. Dev. from Mean
Population Maximum Grade (% Cu)
# Samples Capped
Avg. Cu Grade (% Cu) Before Capping
Avg. Cu Grade (% Cu) After Capping
SDS (1–4) 3.5 5.6 6.38 32 0.486 0.485 Iris (5–6) 3.5 10.2 3.34 0 0.192 0.192 Iris Norte (7–8) 3.5 10.5 3.10 0 0.173 0.173 Totals (1-8) 3.5 6.3 6.38 32 0.380 0.378 Estrellita 3.0 4.8 8.79 34 0.375 0.366 Note: Includes “below detection” as 0.0. SDS = Santo Domingo Sur.
Table 14-2: Assay Capping Levels – Gold
Zone Cap Grade (g/t Au)
# Std. Dev. from Mean
Population Maximum Grade (g/t Au)
# Samples Capped
Avg. Au Grade (g/t Au) Before Capping
Avg. Au Grade (g/t Au) After Capping
SDS (1–4) 0.52 5.9 2.38 23 0.066 0.065 Iris (5–6) 0.52 5.4 4.71 7 0.029 0.027 Iris Norte (7–8) 0.52 10.4 0.98 1 0.022 0.022 Totals (1–8) 0.52 5.8 4.71 31 0.052 0.051 Estrellita 0.30 4.3 0.979 26 0.049 0.048 Note: Includes “below detection” as 0.0. SDS = Santo Domingo Sur.
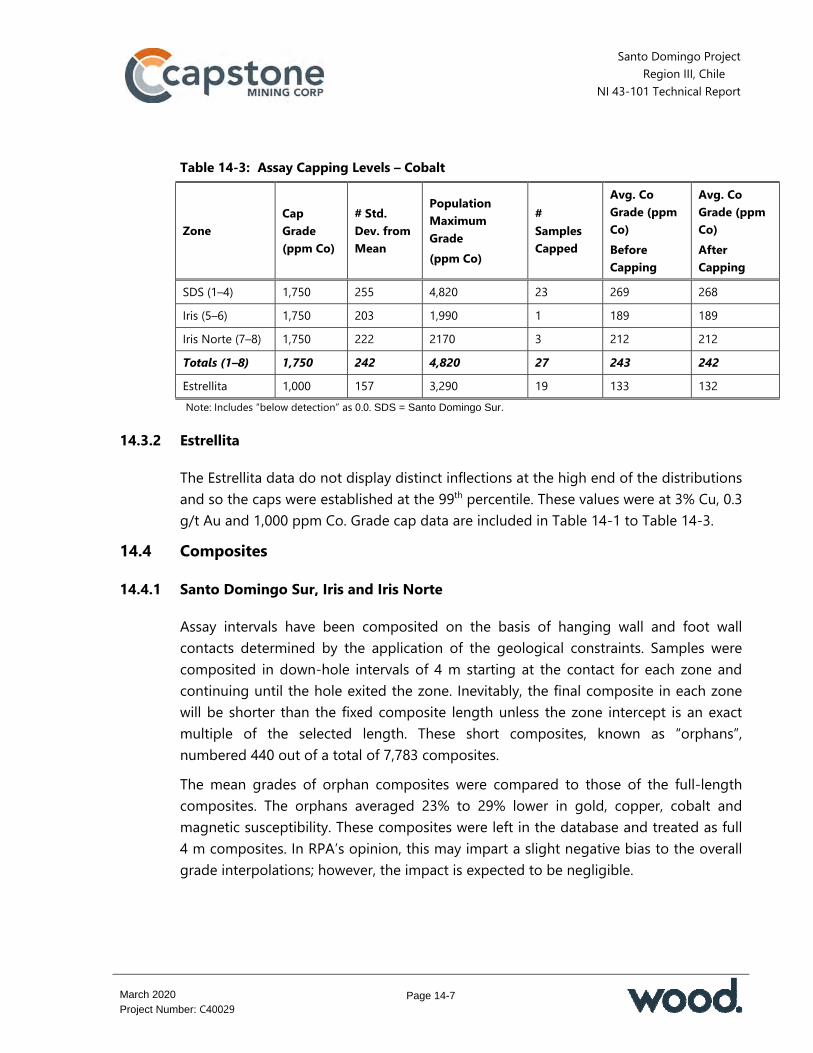
Santo Domingo Project Region III, Chile
NI 43-101 Technical Report
Page 14-7
March 2020
Project Number: C40029
Table 14-3: Assay Capping Levels – Cobalt
Zone Cap Grade (ppm Co)
# Std. Dev. from Mean
Population Maximum Grade (ppm Co)
# Samples Capped
Avg. Co Grade (ppm Co) Before Capping
Avg. Co Grade (ppm Co) After Capping
SDS (1–4) 1,750 255 4,820 23 269 268 Iris (5–6) 1,750 203 1,990 1 189 189 Iris Norte (7–8) 1,750 222 2170 3 212 212 Totals (1–8) 1,750 242 4,820 27 243 242 Estrellita 1,000 157 3,290 19 133 132 Note: Includes “below detection” as 0.0. SDS = Santo Domingo Sur.
14.3.2 Estrellita
The Estrellita data do not display distinct inflections at the high end of the distributions and so the caps were established at the 99th percentile. These values were at 3% Cu, 0.3 g/t Au and 1,000 ppm Co. Grade cap data are included in Table 14-1 to Table 14-3.
14.4 Composites
14.4.1 Santo Domingo Sur, Iris and Iris Norte
Assay intervals have been composited on the basis of hanging wall and foot wall contacts determined by the application of the geological constraints. Samples were composited in down-hole intervals of 4 m starting at the contact for each zone and continuing until the hole exited the zone. Inevitably, the final composite in each zone will be shorter than the fixed composite length unless the zone intercept is an exact multiple of the selected length. These short composites, known as “orphans”, numbered 440 out of a total of 7,783 composites. The mean grades of orphan composites were compared to those of the full-length composites. The orphans averaged 23% to 29% lower in gold, copper, cobalt and magnetic susceptibility. These composites were left in the database and treated as full 4 m composites. In RPA’s opinion, this may impart a slight negative bias to the overall grade interpolations; however, the impact is expected to be negligible.
Santo Domingo Project Region III, Chile
NI 43-101 Technical Report
Page 14-8
March 2020
Project Number: C40029
The 4 m composite length was deemed most suitable, because it was an exact multiple of the most common assay sample interval of 2 m, as well as being an appropriate length for modelling grade in the 12 m high blocks. The former provided relatively discrete composite values that did not straddle the assay intervals; for modelling the number of composites per drill hole could be limited to three or four and still provide sufficient sample coverage for each interpolated block. Composites for each zone or lithological feature were assigned unique numeric codes to differentiate them from the surrounding material.
14.4.2 Estrellita
The individual mineralized zones are smaller than at Santo Domingo Sur/Iris and so a smaller block size and composite interval was used. Drill samples were composited to 2 m lengths, weighted by both length and density. The modeling software used (GEMS) did not have the capability to manipulate “orphan” composites at the time, so they were left in the database as-is. RPA notes that instances of orphaned composites were relatively rare, owing to the fact that the composite interval was generally equivalent to the sample length and the wireframe construction was done on sample boundaries. As a result, only a few composites straddled a wireframe boundary.
14.5 Variography
14.5.1 Santo Domingo Sur, Iris and Iris Norte
RPA carried out a geostatistical analysis to see if revisions to the variogram models developed in 2010 were warranted following the addition of the 2011–2012 definition drill holes. The analysis was conducted using Sage 2001 and GEMS software. There were some significant differences in the updated experimental variogram models from those used in previous grade interpolations; hence the models were revised accordingly (Table 14-4). RPA notes that for some domains, notably Iris Norte, the lack of data made it difficult to obtain coherent variograms. At times it was necessary to force the variogram model to match the interpreted geology.

Santo Domingo Project Region III, Chile
NI 43-101 Technical Report
Page 14-9
March 2020
Project Number: C40029
Table 14-4: Variogram Models
Metal/Zone Model Type Nugget C Total
Sill Orientation (Az/Plunge) Range (m) Major Semi Minor Major Semi Minor
Copper
SDS (1–4) Exp 0.114 0.886 1 118/13 030/-08 329/74 276.3 152.6 42.1 Iris/Iris Mag Sph 0.064 0.936 1 168/-02 078/00 168/88 151.7 48.7 34.7 Iris Norte Sph 0.228 0.772 1 079/00 169/00 079/90 72.3 72.3 25.6 Iron
SDS (1–4) Exp 0.021 0.979 1 130/15 042/-07 334/73 119.2 65.2 35.9 Iris/Iris Mag Sph 0.228 0.772 1 191/00 101/00 191/90 146.0 75.6 42.5 Iris Norte Sph 0.364 0.636 1 136/-04 048/34 219/56 100.6 100.6 52.7 Gold
SDS (1–4) Sph 0.188 0.812 1 073/-08 342/-07 031/80 185.8 101.2 39.4 Iris/Iris Mag Sph 0.031 0.969 1 146/-11 056/00 146/79 192.0 105.8 26.2 Iris Norte Sph 0.400 0.600 1 119/06 210/00 299/84 135.0 135.0 20.0 Mag Sus
SDS Mag Exp 0.125 0.875 1 010/-10 096/19 307/68 128.6 69.1 34.3 SDS Non-Mag Exp 0.029 0.971 1 016/-15 104/07 349/73 119.3 86.4 56.9
Iris/Iris Mag Sph 0.131 0.869 1 190/00 101/34 280/56 171.7 171.7 55.0
Iris Norte Sph 0.029 0.971 1 049/33 139/00 048/-57 102.4 102.4 16.7
Sulphur
SDS (1–4) Exp 0.252 0.748 1 344/-17 065/28 282/56 146.3 78.0 63.0 Iris/Iris Mag Exp 0.252 0.748 1 355/00 265/-11 263/79 564.6 419.0 196.6 Iris Norte Exp 0.252 0.748 1 098/04 008/-02 304/85 318.0 292.1 32.3
Note: SDS = Santo Domingo Sur.
For cobalt, RPA completed a variography analysis with Supervisor 8.8.0.1 software using 4 m composites. The variograms were modelled using two spherical structures and a nugget effect of between 15% and 20% of the sill. A summary of the variogram parameters is shown in Table 14-5.

Santo Domingo Project Region III, Chile
NI 43-101 Technical Report
Page 14-10
March 2020
Project Number: C40029
Table 14-5: Cobalt Variogram Models
Zone Nugget Model Type C1
Range 1 C2
Range 2 Total Sill
Orientation (Gems)
Major Semi Minor Major Semi Minor Z X Z SDS (1–4) 0.20 Sph 0.50 92 40 12 0.30 375 300 145 1.000 -140 25 25 Iris/Iris Mag 0.15 Sph 0.25 450 70 11 0.60 455 190 75 1.000 85 -40 30 Iris Norte 0.20 Sph 0.50 40 90 12 0.30 300 375 145 1.000 119 6 30
Note: SDS = Santo Domingo Sur.
Lack of sufficient data for the Iris Norte area did not allow valid variogram calculation using composites for this domain. Thus, variogram parameters established using the entire cobalt data set were applied in the estimation run at Iris Norte. The geostatistical analyses and modelling for sulphur were carried out by RPA using Sage software.
14.5.2 Estrellita
Variogram ranges were somewhat shorter at Estrellita than at the other deposits; this was interpreted to be probably due to the different style of mineralization and structural discontinuities in the zones. The variogram ranges for copper were 106 m x 93 m x 35 m and this turned out to be too short to completely fill the majority of blocks within the models. Consequently, the search ellipsoid was increased to 150 m x 150 m x 50 m. No variography was carried out for cobalt composites.
14.6 Estimation/Interpolation Methods
14.6.1 Model Dimensions
14.6.1.1 Santo Domingo Sur, Iris and Iris Norte The block size for Santo Domingo Sur, Iris and Iris Norte is 12.5 m east-west, 12.5 m north–south and 12 m high. Each block that was located at least partially within an interpreted zone was assigned a zone code and, potentially, an interpolated grade. Where a block straddled more than one zone (i.e. across a fault) the block received the code of the zone with the largest portion within the block. Grades were estimated for only those blocks falling at least partially within one of the eight interpreted domains (envelopes). Integer codes were assigned to the blocks

Santo Domingo Project Region III, Chile
NI 43-101 Technical Report
Page 14-11
March 2020
Project Number: C40029
according to the zone with the highest proportion of material contained within the block.
14.6.1.2 Estrellita The block size for the Estrellita model was 10 m x 10 m x 5 m. Each block located at least partially within an interpreted zone was assigned a zone code, percent within the zone and, potentially, an interpolated grade.
14.6.2 Interpolation
14.6.2.1 Santo Domingo Sur, Iris and Iris Norte Grades for copper, gold, iron, cobalt, sulphur and magnetic susceptibility were interpolated into each block using ordinary kriging (OK). Block estimates for each zone were constrained to use only composites from that zone. For magnetic susceptibility the interpolation was also configured to discriminate between composites and blocks inside and outside of the Mag Zone. The Mag Zone constraint was not applied for the copper, gold, iron, cobalt and sulphur estimates. In 2012, the interpolation for copper, gold, iron and magnetic susceptibility was configured to use an ellipsoidal search with a minimum of three and a maximum of 18 composites and a maximum of three composites allowed from any one drill hole. Grades were estimated in two passes: the first at twice the copper variogram semi-major axis range (300 m x 300 m) and the second using distances equal to the variogram semi-major axis range (150 m x 150 m). The minor axis searches were 60 m for Pass 1 and 30 m for Pass 2. These search radii were selected to approximately match the anisotropy ratio of the copper variogram model. Although unique variograms were developed for each component, the search was generally made consistent for all. This was done to ensure that if a block received an estimate for one component, it was estimated for the other components. The ellipsoids were oriented parallel to the copper variogram models. Following sensitivity analysis of the interpolation parameters, RPA chose to estimate cobalt grades in 2018 using a different set of search criteria than used previously for other metals. The primary grade interpolation used the OK estimator but was based on a minimum of 4 and a maximum of 12 composites in the first pass and a minimum of 3 and a maximum of 12 composites in the second pass. The first estimation run required

Santo Domingo Project Region III, Chile
NI 43-101 Technical Report
Page 14-12
March 2020
Project Number: C40029
composites from at least two drill holes to interpolate block grades. The second estimation pass limited the number of composites from a drill hole to a maximum of three composites. Search ellipse dimensions were chosen following a review of variography and interpolation efficiency. The search ranges for the first pass were set to 100 m, 70 m and 20 m for the major, semi-major and minor axes respectively. The second pass search ranges for the major and semi-major axes were adjusted to approximately 95% of the variogram sill at 240 m and 180 m respectively. The minor axis search in the second pass remained the same (20 m). The influence of higher-grade cobalt composites was spatially restricted to the search ranges of the first estimation run at 900 ppm Co. The search and interpolation parameters for sulphur were largely the same as those used in 2012. The primary differences were the addition of a nearest neighbour (NN) pass to fill remote corners of the wireframes and a slight modification of the search ellipsoids to better match the sulphur variogram models. The blocks filled by the NN interpolation were not classified as Mineral Resources and will not affect the economics.
14.6.2.2 Estrellita Separate block models were constructed for each individual zone. Following grade interpolation, the individual block grades were combined into one global block model. Grades for blocks straddling zone boundaries were calculated by averaging the individual block estimates and weighting them by the proportion of the block contained within each zone. OK was used to interpolate copper, gold and iron grades into each block. Cobalt was estimated using inverse distance weighting to the third power (ID3) interpolation. Only composites with zone codes that matched the block codes were used in grade estimates. The search was constrained to a minimum of two and maximum of 12 composites, with a maximum of three composites from any one drill hole. The influence of higher-grade cobalt composites was spatially restricted to the half of the search ranges of the first estimation run at 750 ppm Co.

Santo Domingo Project Region III, Chile
NI 43-101 Technical Report
Page 14-13
March 2020
Project Number: C40029
14.7 Specific Gravity
14.7.1 Santo Domingo Sur, Iris and Iris Norte
The specific gravity values were calculated for each block based on the interpolated Fe grade and the formula developed by RPA: SG = 2.53 + 0.0276*Fe.
14.7.2 Estrellita
Specific gravity was based on a regression formula developed by RPA as follows: SG = 2.72 + 0.0018*Fe + 0.0006*Fe2.
14.8 Block Model Validation
14.8.1 Santo Domingo Sur, Iris and Iris Norte
RPA validated the grade interpolations using the following methods: Visual inspection of the estimated block grades and comparison with the drill
composite grades Comparison of global composite and block grades Swath plots comparing OK and nearest-neighbour (NN) block estimates to
composite grades Cross-validation (i.e. estimating individual composite grades using the surrounding
composites) Comparison with the previous model. No significant errors or biases were noted from the validations performed.
14.8.2 Estrellita
Validation was performed on the grade estimates using ID3. RPA concluded that while the OK results were very close to the actual composite means, the lower standard deviations indicated that OK was unable to model the extremes as well. To validate the cobalt grade interpolation, RPA generated swath plots comparing cobalt estimated grades with informing data.

Santo Domingo Project Region III, Chile
NI 43-101 Technical Report
Page 14-14
March 2020
Project Number: C40029
14.9 Classification of Mineral Resources
14.9.1 Santo Domingo Sur, Iris and Iris Norte
Blocks receiving an estimate for copper were assigned to at least the Inferred category. All blocks with an average distance to composites of 200 m or less and for which the nearest composite was within 100 m were classified as Indicated. Definition drilling was carried out during 2011 and 2012 to support potential upgrade of Mineral Resource confidence categories within the area planned for the first 3 years of production to Measured. Within the area drilled in this drill program, the drill spacing is nominally 50 m. A boundary was drawn around the 50 m drilling pattern and Indicated blocks encompassed by it were assigned a preliminary classification of Measured. Blocks below the lowermost extent of the definition holes were excluded from the Measured classification, except in isolated areas where tightly-spaced groups of holes extended to depth. The upper portions of the deposit are oxidized to some extent, as evidenced by limited assaying for leachable copper and the presence of copper and iron oxides in the core and cuttings. The oxide layer typically extends to a depth of about 80 m from surface, with deeper penetration along faults in localized areas. For the purposes of engineering studies, metallurgical recoveries in the oxide mineralization are expected to be poor and hence this material has not been included as Mineral Resources or Mineral Reserves. RPA and Capstone personnel constructed a wireframe model of the oxidized zone based on the presence or absence of oxide copper mineralization or intense weathering. The final step in the classification was to use the oxide wireframe to tag oxidized blocks and remove these from the Mineral Resources.
14.9.2 Estrellita
The major and semi-major variogram ranges modelled for copper at Estrellita were 106 m and 93 m, respectively. The drill spacing is approximately 50 m, well within the two-thirds range limit of the copper variogram (at approximately 65 m). Consequently, the classification of Indicated was applied to all blocks estimated by at least two drill holes with the closest composite less than 65 m away. The Inferred portion at Estrellita occupies the fringes of the deposit and also occurs at depth where a number of holes failed to penetrate the deeper areas.

Santo Domingo Project Region III, Chile
NI 43-101 Technical Report
Page 14-15
March 2020
Project Number: C40029
14.10 Reasonable Prospects of Economic Extraction
In RPA’s opinion the Mineral Resources for the Santo Domingo and Estrellita deposits are considered to have reasonable prospects of eventual economic extraction by open pit mining. To fulfill the CIM requirement of “reasonable prospects for eventual economic extraction”, RPA prepared a preliminary open pit shell for each deposit to constrain the block model for resource reporting purposes. Table 14-6 and Table 14-7 list the parameters used for cut-off grade calculation and pit optimization for Santo Domingo and Estrellita, respectively. Table 14-6: LG Optimization Parameters – Santo Domingo
Parameter Value Metal price Copper $3.50$/lb Gold $1,300/oz Iron $99.00/dmt concentrate Recovery to concentrate
Copper 89% Gold 79% Iron recovery Calculated (see text) Mass recovery for magnetite Rec. Mass Fe (see Section 13.2.3) Copper concentrate grade
Copper 29% Gold Calculated Moisture content 8% Magnetite concentrate grade
Iron 67% Moisture content 8% Smelter payables
Payable copper 96.5% Payable gold 97.0% Off-site costs

Santo Domingo Project Region III, Chile
NI 43-101 Technical Report
Page 14-16
March 2020
Project Number: C40029
Parameter Value Copper con. transport $33.00/wmt Magnetite con. transport $20.00/wmt Copper treatment charge $80.00/dmt Copper refining charge $0.08$/lb Gold refining charge $5.00$/oz Royalty 5% NSR On-site operating costs
Mining cost $1.90/t mined Processing and G&A cost $7.27/t ore processed Pit wall slope
Overburden 38˚ Rock (south, west, north wall) 44˚ Rock (east wall) 40˚
Table 14-7: LG Optimization Parameters – Estrellita
Parameter Value Metal price
Copper $3.50/lb Gold $1,300/oz Recovery to concentrate
Copper 89% Gold 79% Copper concentrate grade
Copper 29% Gold Calculated Moisture content 8% Smelter payables
Payable copper 96.5% Payable gold 97.0% Off-site costs
Copper con. transport $33.00/wmt

Santo Domingo Project Region III, Chile
NI 43-101 Technical Report
Page 14-17
March 2020
Project Number: C40029
Copper treatment charge $80.00/dmt Copper refining charge $0.08/lb Gold refining charge $5.00/oz Royalty 5% NSR On-site operating costs
Mining cost $1.90/t mined Processing and G&A cost $7.27/t ore processed Pit wall slope 45˚
14.11 Cut-off Grades
14.11.1 Santo Domingo Sur, Iris and Iris Norte
The deposits are polymetallic in nature, with elevated copper, iron and gold; copper being the primary contributor. For this reason, a copper equivalent (CuEq) grade was derived which recognizes the potential contributions of all economic components. The methodology for the CuEq calculation was developed by RPA. The 2018 CuEq grades were calculated using estimates for recovery and treatment/refinement charges (TC/RCs) presented in Table 14-6. The metal prices used in Table 14-6 and Table 14-7 were current at the effective date of the estimate, which was 31 October 2018. Typically, the metal prices for RPA’s resource estimations are based on consensus (average) price forecasts by banks and financial institutions. RPA considers long-term average price forecasts to be appropriate for use in estimating Mineral Reserves and slightly higher prices to be appropriate for estimating Mineral Resources. Iron ore pricing is quite variable from project to project due to quality and transport costs; thus, forecast pricing based on a marketing study specific to a project is preferred. RPA used an iron ore price of $99/t concentrate (67% Fe content) based on market studies conducted by Capstone. The $1,300/oz Au price and $3.50/lb Cu price assumptions were based on consensus price forecasts and prices used by major companies at the time the estimate was undertaken. Only copper, gold and iron were recognized in the CuEq calculation.

Santo Domingo Project Region III, Chile
NI 43-101 Technical Report
Page 14-18
March 2020
Project Number: C40029
In RPA’s opinion, based on the costs developed using the parameters detailed in Table 14-6, the cut-off grade to report Mineral Resources for Santo Domingo Sur, Iris and Iris Norte is 0.125% CuEq.
14.11.2 Estrellita
In RPA’s opinion a 0.125% CuEq cut-off grade is also appropriate for reporting of the Estrellita Mineral Resource estimate. The style, geometry and proximity to surface of Estrellita are similar to the Santo Domingo Sur/Iris deposits. The iron content is significantly lower at Estrellita; hence, iron has been excluded from the copper equivalence calculation.
14.12 Mineral Resource Statement
The Mineral Resource estimates and geological models were prepared under the supervision of David Rennie, P. Eng., Associate Principal Geologist for RPA. Mr. Rennie is the Qualified Person as defined under NI 43-101 for the estimate. Mineral Resources for both the Santo Domingo and Estrellita deposits have an effective date of 13 February 2020. Mineral Resources in Table 14-8 are reported inclusive of Mineral Reserves. RPA cautions that Mineral Resources that are not Mineral Reserves do not have demonstrated economic viability.
14.13 Factors That May Affect the Mineral Resource Estimate
In RPA’s opinion, there are certain risk factors which could materially impact estimates of Mineral Resources. These risk factors include: Assumptions used to generate the conceptual data for consideration of reasonable
prospects of economic extraction including: Commodity price assumptions Exchange rate assumptions Density assumptions Geotechnical and hydrogeological assumptions Operating and capital cost assumptions Metal recovery assumptions Concentrate grade and smelting/refining terms

Santo Domingo Project Region III, Chile
NI 43-101 Technical Report
Page 14-19
March 2020
Project Number: C40029
Table 14-8: Mineral Resource Estimate
Deposit (Zone) Tonnes (Mt)
CuEq (%)
Cu (%)
Au (g/t)
Fe (%)
Co (ppm)
S (%)
Measured
Santo Domingo Sur (1–4) 64 0.82 0.62 0.082 31.1 254 2.4 Iris (5–6) 2 0.42 0.39 0.047 23.6 250 1.4 Total Measured 66 0.81 0.61 0.081 30.9 254 2.3 Indicated
Santo Domingo Sur (1–4) 224 0.54 0.31 0.043 26.6 275 2.4 Iris (5–6) 103 0.45 0.19 0.027 25.9 166 1.3 Iris Norte (7–8) 89 0.44 0.12 0.014 26.7 231 2.6 Subtotal Indicated (Santo Domingo Sur/Iris) 416 0.49 0.24 0.033 26.4 239 2.2
Estrellita 55 0.40 0.38 0.039 13.7 125 0 Total Indicated 471 0.48 0.26 0.034 25.0 225 1.9 Total Measured and Indicated 537 0.52 0.30 0.039 25.7 229 2.0
Inferred
Santo Domingo Sur (1–4) 24 0.40 0.22 0.033 22.8 195 2.5 Iris (5–6) 4 0.42 0.19 0.024 26.6 125 0.7 Iris Norte (7–8) 14 0.45 0.09 0.009 28.1 256 2.8 Subtotal Inferred (Santo Domingo Sur/Iris) 42 0.42 0.18 0.024 25.0 208 2.4
Estrellita 5 0.32 0.31 0.030 12.3 108 0 Total Inferred 48 0.41 0.19 0.025 23.6 197 2.2
Notes to Accompany Mineral Resource Estimate: 1. Mineral Resources are classified according to CIM (2014) standards. 2. Mineral Resources are reported inclusive of Mineral Reserves. Mineral Resources that are not Mineral Reserves do
not have demonstrated economic viability. 3. The Qualified Person for the estimates is Mr. David Rennie, P. Eng., an associate of Roscoe Postle Associates Inc. 4. Mineral Resources for the Santo Domingo Sur, Iris, Iris Norte and Estrellita deposits have an effective date of 13
February 2020. 5. Mineral Resources for the Santo Domingo Sur, Iris, Iris Norte and Estrellita deposits are reported using a cut-off
grade of 0.125% CuEq. CuEq grades are calculated using average long-term prices of US$3.50/lb Cu, US$1,300/oz Au and US$99/dmt Fe conc. The CuEq values were calculated as noted in the text in this report.
6. Only copper, gold and iron were recognized in the CuEq calculation, cobalt and sulphur were excluded.

Santo Domingo Project Region III, Chile
NI 43-101 Technical Report
Page 14-20
March 2020
Project Number: C40029
7. Mineral Resources are constrained by preliminary pit shells derived using a Lerchs–Grossmann algorithm and the following assumptions: pit slopes averaging 45º; mining cost of US$1.90/t, processing cost of US$7.27/t (including G&A cost); processing recovery of 89% copper and 79% gold, iron recoveries are calculated based om magnetic susceptibility; and metal prices of US$3.50/lb Cu, US$1,300/oz Au and US$99/dmt iron concentrate.
8. Rounding as required by reporting standards may result in apparent summation differences between tonnes, grade and contained metal content.
9. Tonnage measurements are in metric units. Copper and iron are reported as percentages, gold as grams per tonne. Delays or other issues in reaching agreements with local communities Changes in land tenure requirements or in the permitting requirements Changes in interpretations of mineralization geometry and continuity of
mineralization zones. There are no known environmental, permitting, legal, title, taxation, socio-economic, marketing, political or other relevant factors other than as discussed in this Report that could affect the Mineral Resource estimates.
Santo Domingo Project Region III, Chile
NI 43-101 Technical Report
Page 15-1
March 2020
Project Number: C40029
15.0 MINERAL RESERVE ESTIMATES
15.1 Block Model
NCL was provided with the October 2018 updated resource block model that was developed by RPA and included 2012 drilling campaign results. The September 2012 block model included Mineral Resources that were classified as Measured, Indicated or Inferred. Pit optimization, mine design and mine planning were carried out using this block model and did not include consideration of material classified as Inferred. Inferred Mineral Resources were treated as waste. A block size of 12.5 m E x 12.5 m N x 12 m high was selected for the block model. The selected block size was based on the geometry of the domain interpretation and the data configuration.
15.2 Throughput Rate and Supporting Assumptions
The mining cost estimate for the pit optimization process is based on studies developed by NCL during 2018. The estimated average mining cost was separated into various components such as fuel, explosives, tires, parts, salaries and wages, benchmarked against similar current operations in Chile. Each component was updated for third quarter 2018 prices and the exchange rate from Chilean Pesos to US dollars. This resulted in an estimated mining cost of approximately $1.75/t. The metal prices, processing costs, refining costs and processing recoveries were provided to NCL by Capstone. A summary of the initial input parameters used in the constraining Lerchs–Grossmann (LG) pit shell is included in Table 15-1. A number of calculations were performed in the model in order to determine the NSR of each individual block. The internal (or mill) cut-off of $7.53/t milled incorporates all operating costs except mining. This internal cut-off is applied to material contained within an economic pit shell where the decision to mine a given block was determined by the pit optimization and was applied to all of the Mineral Reserve estimates.
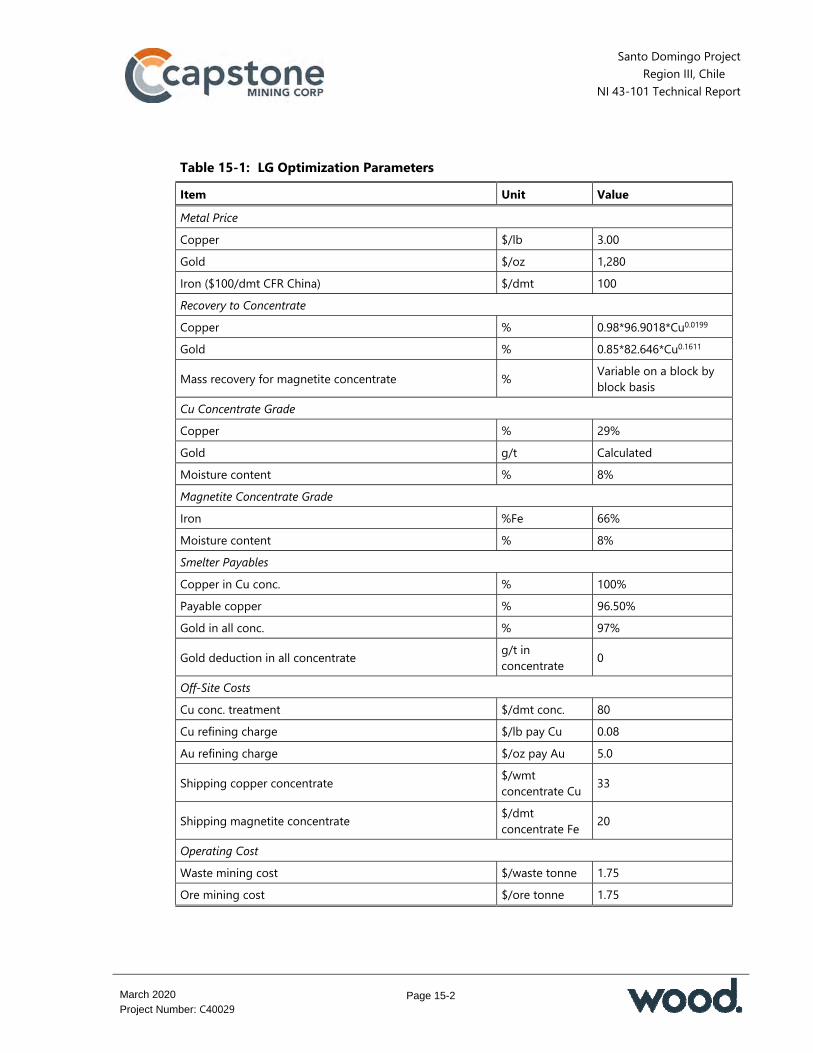
Santo Domingo Project Region III, Chile
NI 43-101 Technical Report
Page 15-2
March 2020
Project Number: C40029
Table 15-1: LG Optimization Parameters Item Unit Value Metal Price Copper $/lb 3.00 Gold $/oz 1,280 Iron ($100/dmt CFR China) $/dmt 100 Recovery to Concentrate Copper % 0.98*96.9018*Cu0.0199 Gold % 0.85*82.646*Cu0.1611
Mass recovery for magnetite concentrate % Variable on a block by block basis
Cu Concentrate Grade Copper % 29% Gold g/t Calculated Moisture content % 8% Magnetite Concentrate Grade Iron %Fe 66% Moisture content % 8% Smelter Payables Copper in Cu conc. % 100% Payable copper % 96.50% Gold in all conc. % 97%
Gold deduction in all concentrate g/t in concentrate 0
Off-Site Costs Cu conc. treatment $/dmt conc. 80 Cu refining charge $/lb pay Cu 0.08 Au refining charge $/oz pay Au 5.0
Shipping copper concentrate $/wmt concentrate Cu 33
Shipping magnetite concentrate $/dmt concentrate Fe 20
Operating Cost Waste mining cost $/waste tonne 1.75 Ore mining cost $/ore tonne 1.75

Santo Domingo Project Region III, Chile
NI 43-101 Technical Report
Page 15-3
March 2020
Project Number: C40029
Item Unit Value Processing + G&A $/t proc 7.53 Average Overall Pit Slope Angle
SDS/Iris & Iris Norte
Overburden 37.6˚ Sector 1 South 43.6˚ Sector 2 West 43.6˚ Sector 3 North 43.6˚ Sector 4 East 40.2˚
Other Grade factor (1-Dilution) % 100 Mining recovery % 100 Royalties % 2 Discount rate % 8 Note: FOB = free on board. SDS = Santo Domingo Sur.
15.2.1 Geotechnical Considerations
Final slope angles used for the pit optimization process were a result of multiple iterations and analysis carried out by the NCL mining team and geotechnical specialists Derk Ingeniería y Geología Ltda. (Derk) as follows: A pit optimization was carried out with an initial set of overall slope angles for
selected geotechnical domains A pit shell was selected for detail mine design, adding haul roads, safety and
geotechnical berms and applying detail bench configuration (batter height, batter angle, berm widths)
The obtained overall angles per slope domain were measured and compared with the initial assumptions
The detail pit design was re-analyzed by Derk and an updated configuration was generated
A new optimization was carried out with the updated configuration and the final mine design was developed.

Santo Domingo Project Region III, Chile
NI 43-101 Technical Report
Page 15-4
March 2020
Project Number: C40029
Figure 15-1 shows the geotechnical domains used for the pit optimization for the Santo Domingo and Iris Norte pits. Table 15-2 summarizes the pit slope angles and parameters.
15.2.2 Dilution and Mine Losses
The original block model was based on an ore percentage with dimensions of 12.5 m x 12.5 m x 12 m, resulting in a 1,875 m3 block volume; this means that every block has a defined “ore” portion with an ore density and a corresponding “waste” portion with a waste density. To accommodate selective mining methods, any resource block with an ore percentage that was <10% was treated as waste. Blocks with an ore percentage that was higher than 90% were diluted with waste such that all high-ore blocks were considered to contain only 90% ore. Selective mining therefore will be performed on those blocks that have an ore percentage of between 10% and 90%. A diluted model was developed to take into account simultaneously the ore loses and dilution, representing 0.1% and 0.3% respectively: All blocks with a value lower than 10% in the ore percent item field were
considered as pure waste (ore percent = 0); grades were also set to zero in those blocks. A new density was calculated using a weighted average that was based upon the original percentage assignment (SGdil).
All blocks with a value greater than 90% in the ore percent item field were considered as pure ore (ore percent = 100) and a new density was calculated using a weighted average upon the original percentage assignment (SGdil). Diluted grades were calculated as follows: Diluted Grade = (Original ore percent/100*Original SG_ore*Original grade)/SGdil
All blocks with values equal to or between 10% and 90% in the ore percent item field were kept as the original percentage assignments; the original specific gravity and grade assignment were also retained.

Santo Domingo Project Region III, Chile
NI 43-101 Technical Report
Page 15-5
March 2020
Project Number: C40029
Figure 15-1: Geotechnical Slope Domains
NIris Norte Pit
0 250m
East wall
South wall
West wall
North wall
0 250m
NSanto Domingo Pit
East wall
South wall
West wall
North wall
Note: Figure prepared by NCL, 2014.
Table 15-2: Slope Domain Data
Sector Inter-Ramp Slope Overall Slope IRA (º)
Face Angle (º)
Height H (m)
Backbreak a (m)
Berm b (m)
Catch Berm c (m)
Slope Height L (m)
Slope Angle (º)
Overburden 44 55 12 8.4 4.0 40 150 38 West 52 75 24 6.4 12.4 40 150 44 East 52 70 24 8.7 10.1 40 100 40 North and South 52 75 24 6.4 12.4 40 150 44 NCL notes that careful grade control will need to be practiced during mining operations to avoid sending sub-grade material to the plant, because of the important effect of head grade on recovery. These efforts should include the following standard procedures:

Santo Domingo Project Region III, Chile
NI 43-101 Technical Report
Page 15-6
March 2020
Project Number: C40029
Implement an intense and systematic program of sampling, mapping, laboratory analyses and reporting
Use specialized in-pit, bench sampling drills for sampling well ahead of production drilling and blasting
Use of shovels to selectively mine ore zones Maintain high quality laboratory staff, equipment and procedures to provide
accurate and timely assay reporting Use trained geologists and technicians to work with shovel operators in identifying,
marking and selectively mining and dispatching ore and waste. 15.2.3 Cut-Off Grades
For mine production schedule purposes an NSR in $/t was calculated to take into account the value of copper, gold and iron; and the off-site costs (transport, smelting and refining). The internal (or mill) cut-off of $7.53/t milled incorporates all operating costs except mining. Mining is treated as a sunk cost for the purposes of the cut-off determination. This internal cut-off is applied to material contained within the mining phases, defining the difference between ore and waste. Marginal material was calculated for the same $7.53/t cut-off, but for an NSR determined at higher metal prices than shown in Table 15-1 ($3.50/lb Cu, $102.63/t magnetite concentrate and $1,500/oz Au were used).
15.3 Mineral Reserves Statement
Mineral Reserves are summarized in Table 15-3 and have an effective date of 14 November 2018. The Qualified Person for the estimate is Mr. Carlos Guzman, CMC, an NCL employee.
15.4 Factors That May Affect the Mineral Reserve Estimate
In the opinion of the NCL QP, the main factors that may affect the Mineral Reserves estimate are metallurgical recoveries and operating costs (fuel, energy and labour). NCL notes that the base price, as well as changes in the price of metals, even though this is the most important factor for revenue calculation, does not affect the Mineral Reserves estimate to any significant degree.

Santo Domingo Project Region III, Chile
NI 43-101 Technical Report
Page 15-7
March 2020
Project Number: C40029
Table 15-3: Mineral Reserve Statement
Reserve Category Stage Ore (Mt)
Ore Grade Contained Metal
Cu (%)
Au (g/t)
Fe (%)
Au (koz)
Cu (Mlbs)
Magnetite Conc. (Mt)
Proven Mineral Reserves Santo Domingo 65.4 0.61 0.08 30.9 169.9 878.5 8.2 Iris Norte — — — — — — — Total Proven Mineral Reserves 65.4 0.61 0.08 30.9 169.9 878.3 8.2
Probable Mineral Reserves Santo Domingo 252.1 0.27 0.04 27.8 300.8 1,486.1 48.2 Iris Norte 74.8 0.13 0.01 26.9 36.0 208.1 18.7 Total Probable Mineral Reserves 326.9 0.24 0.03 27.6 336.8 1,694.2 66.9
Total Mineral Reserves (Proven and Probable)
Santo Domingo 317.5 0.34 0.05 28.5 470.7 2,364.6 56.4 Iris Norte 74.8 0.13 0.01 26.9 36.0 208.1 18.7 Total Mineral Reserves (Proven and Probable)
392.3 0.30 0.04 28.2 506.7 2,572.7 75.1
Notes to Accompany Mineral Reserves Estimate:
1. Mineral Reserves have an effective date of 14 November 2018 and were prepared by Mr. Carlos Guzman, CMC, an employee of NCL.
2. Mineral Reserves are reported as constrained within Measured and Indicated pit designs and are supported by a mine plan featuring variable throughput rates and cut-off optimization. The pit designs and mine plan were optimized using the following economic and technical parameters: metal prices of US$3.00/lb Cu, US$1,280/oz Au and US$100/dmt of Fe concentrate; average recovery to concentrate is 93.4% for Cu and 60.1% for Au, with magnetite concentrate recovery varying on a block-by-block basis; copper concentrate treatment charges of US$80/dmt, U$0.08/lb of copper refining charges, US$5.0/oz of gold refining charges, US$33/wmt and US$20/dmt for shipping copper and iron concentrates respectively; waste mining cost of $1.75/t, mining cost of US$1.75/t ore and process and G&A costs of US$7.53/t processed; average pit slope angles that range from 37.6º to 43.6º; a 2% royalty rate assumption and an assumption of 100% mining recovery.
3. Rounding as required by reporting standards may result in apparent summation differences between tonnes, grade and contained metal content.
4. Tonnage measurements are in metric units. Copper and iron grades are reported as percentages, gold as grams per tonne. Contained gold ounces are reported as troy ounces, contained copper as million pounds and contained iron as metric million tonnes.
Santo Domingo Project Region III, Chile
NI 43-101 Technical Report
Page 15-8
March 2020
Project Number: C40029
A revenue factor of 0.84 was used for the LG shell that was employed as the guide for the practical design for both the Santo Domingo and Iris Norte pits (refer to discussion in Section 16). This selected revenue factor is conservative and as such allows for a broad swing in metals pricing before any salient effect on the Mineral Reserves estimate will occur.
Santo Domingo Project Region III, Chile
NI 43-101 Technical Report
Page 16-1
March 2020
Project Number: C40029
16.0 MINING METHODS
16.1 Pit Designs
Initial pit design considerations are included in Section 15. Nested pit shells were generated for several revenue factors. Whittle shell #36 is the revenue factor 1 shell for Santo Domingo and Iris Norte. However, after analyzing the results (and reviewing total, as well as incremental, values), the Santo Domingo and Iris Norte optimized pit shell #28 (revenue factor 0.84) was chosen as the basis for the detailed ultimate pit design. The difference between pit shell #28 and #36 is an expansion to the south of the Santo Domingo pit, including 70 Mt of low-grade material with a strip ratio of 6.7; considered to be high-risk material. This expansion would also compromise the waste rock storage facilities to the south. The final pit design was based on the economic shells obtained at revenue factor 0.84 for Santo Domingo and Iris Norte, with variable overall slope angles according to geotechnical domains ranging from 38° to 44°. The mine design parameters are summarized in Table 16-1. A road width of 40 m was selected to accommodate 290 t trucks. NCL used a 10% road gradient which is common in the industry for this type of truck. The current mine plan is designed with 12 m benches stacked to 24 m (i.e. double benching) for the fresh rock material. Mining costs are based on blasting 12 m benches for the waste zones and for the ore. Additional 40 m wide safety berms were included in the design when the slope height exceeds 100 m at the east wall and 150 m elsewhere and are in accordance with geotechnical recommendations. The Santo Domingo pit will have two exits on the west side to provide access to the run-of-mine (ROM) pad area and the primary crusher. On the east side there will be another exit to access the main waste rock storage area. The final pit will be 2,200 m long in the north–south direction and 1,500 m wide in the east–west direction. The pit bottom will be at the 676 m elevation. The highest wall will be about 552 m and is situated on the southeast side of the pit. The total area disturbed by the pit will be approximately 229 ha. Figure 16-1 shows the final Santo Domingo pit layout.
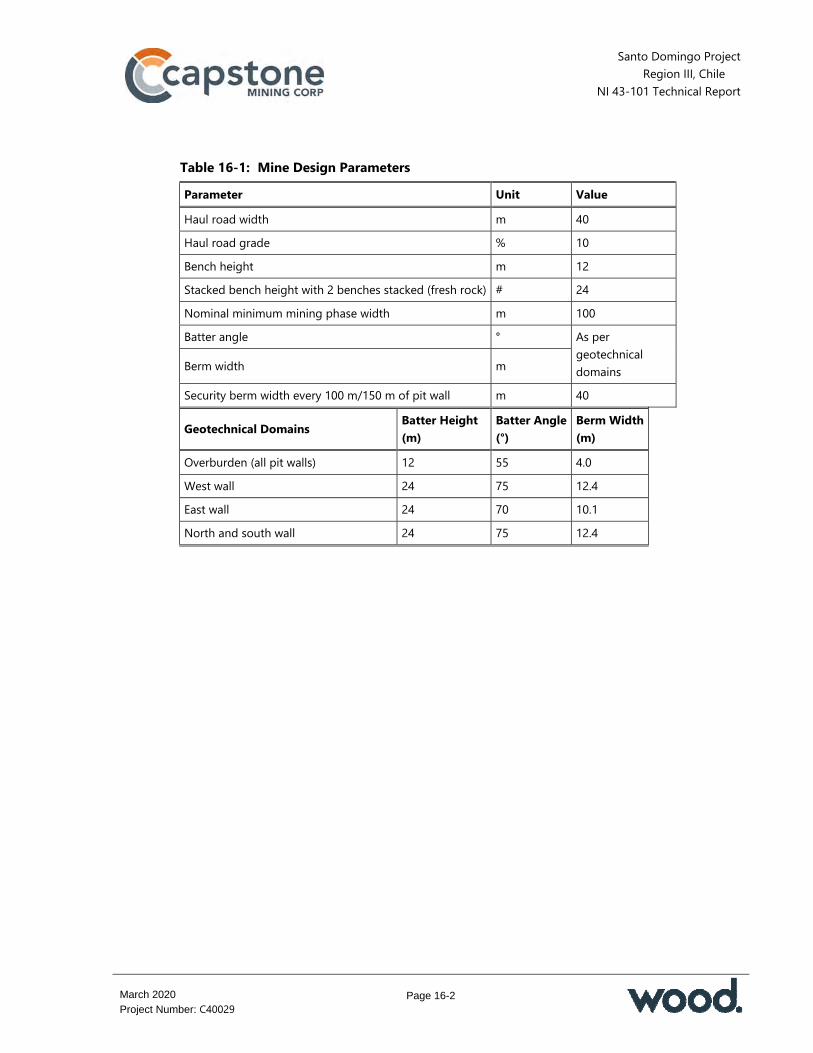
Santo Domingo Project Region III, Chile
NI 43-101 Technical Report
Page 16-2
March 2020
Project Number: C40029
Table 16-1: Mine Design Parameters Parameter Unit Value Haul road width m 40 Haul road grade % 10 Bench height m 12 Stacked bench height with 2 benches stacked (fresh rock) # 24 Nominal minimum mining phase width m 100 Batter angle ° As per
geotechnical domains Berm width m
Security berm width every 100 m/150 m of pit wall m 40
Geotechnical Domains Batter Height (m)
Batter Angle (°)
Berm Width (m)
Overburden (all pit walls) 12 55 4.0 West wall 24 75 12.4 East wall 24 70 10.1 North and south wall 24 75 12.4

Santo Domingo Project Region III, Chile
NI 43-101 Technical Report
Page 16-3
March 2020
Project Number: C40029
Figure 16-1: Santo Domingo Pit Layout Plan
Note: Figure prepared by NCL, 2018. Map north is to right of plan. Grid indicates scale. Grid squares are 1 km x 1 km.

Santo Domingo Project Region III, Chile
NI 43-101 Technical Report
Page 16-4
March 2020
Project Number: C40029
The Iris Norte pit will have one exit on the west side to provide access to the ROM pad area and primary crusher. On the east side there will be an exit to access the waste rock storage area. The final pit will be 1,600 m long in the north–south direction and 900 m wide in the east–west direction. The pit bottom will be at the 664 m elevation. The highest wall will be about 315 m and is located on the north side of the pit. The total area disturbed by the pit is about 124 ha. Figure 16-2 shows the final Iris Norte pit layout.
16.2 Pit Phases
Seven pit phases are planned; four for Santo Domingo Sur and three for Iris Norte (refer to Figure 16-3). In Santo Domingo Sur, Phase 1 (SD01) targets the ore with the highest grade and lowest strip ratio in the central area, down to 892 masl elevation. Phases 2 and 3 (SD02 and SD03) are successive expansions to the north, down to 772 masl and 736 masl elevation, respectively. Phase 4 in Santo Domingo Sur (SD04) is the final expansion to the north, deepening the central portion down to 676 masl. This expansion includes the Iris sector, which is mined together with Santo Domingo Sur in the northern portion of the pit. This sector has a separate access on the east side and goes down to the 820 masl elevation. Three mining phases were designed in Iris Norte (IN01, IN02, IN03), which are successive expansions from south to north, going down to 736 masl, 724 masl and 664 masl elevation, respectively. Each phase has accesses from the east and west sides.
16.3 Production Schedule
A mine production schedule was developed to show the ore tonnes, metal grades, waste material and total material by year, throughout the LOM (Table 16-2). The distribution of ore and waste contained in each of the mining phases was used to develop the schedule, ensuring that criteria such as continuous ore exposure, mining accessibility and consistent material movements were met. NCL used an in-house developed system to evaluate several potential production mine schedules. The required annual ore tonnes and user-specified annual total material movements are provided to the algorithm, which then calculates the mine schedule.

Santo Domingo Project Region III, Chile
NI 43-101 Technical Report
Page 16-5
March 2020
Project Number: C40029
Figure 16-2: Iris Norte Pit Layout Plan
Note: Figure prepared by NCL, 2018. Map north is to right of plan. Grid indicates scale. Grid squares are 1 km x 1 km.
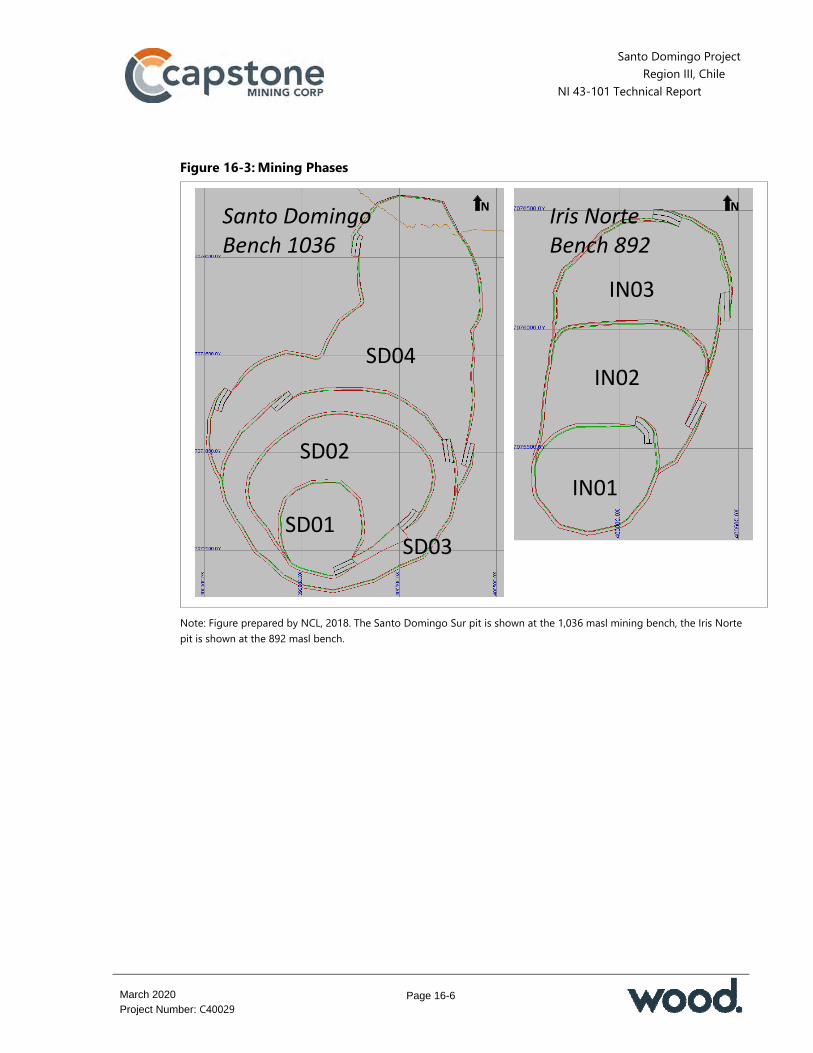
Santo Domingo Project Region III, Chile NI 43-101 Technical Report
Page 16-6
March 2020
Project Number: C40029
Figure 16-3: Mining Phases
Note: Figure prepared by NCL, 2018. The Santo Domingo Sur pit is shown at the 1,036 masl mining bench, the Iris Norte pit is shown at the 892 masl bench.
SD01
SD02
SD03
SD04
Santo Domingo
Bench 1036
Iris Norte
Bench 892
IN03
IN02
IN01
N N
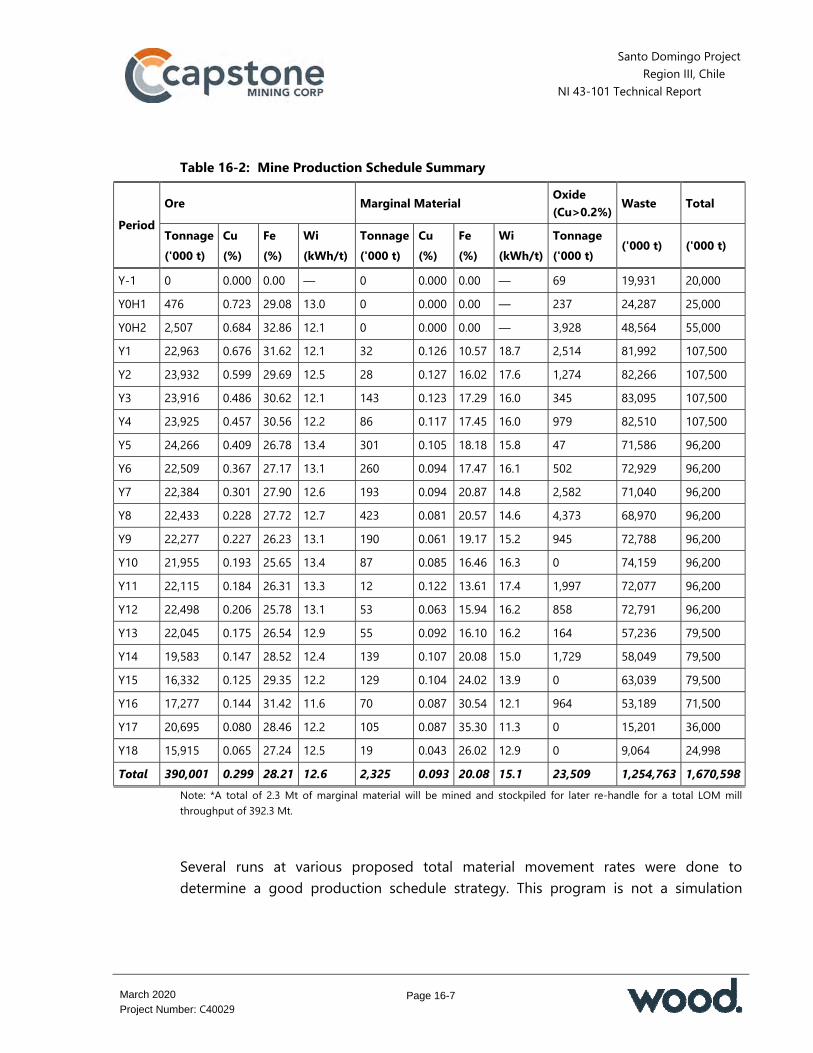
Santo Domingo Project Region III, Chile NI 43-101 Technical Report
Page 16-7
March 2020
Project Number: C40029
Table 16-2: Mine Production Schedule Summary
Period Ore Marginal Material Oxide
(Cu>0.2%) Waste Total
Tonnage ('000 t)
Cu (%)
Fe (%)
Wi (kWh/t)
Tonnage ('000 t)
Cu (%)
Fe (%)
Wi (kWh/t)
Tonnage ('000 t) ('000 t) ('000 t)
Y-1 0 0.000 0.00 — 0 0.000 0.00 — 69 19,931 20,000 Y0H1 476 0.723 29.08 13.0 0 0.000 0.00 — 237 24,287 25,000 Y0H2 2,507 0.684 32.86 12.1 0 0.000 0.00 — 3,928 48,564 55,000 Y1 22,963 0.676 31.62 12.1 32 0.126 10.57 18.7 2,514 81,992 107,500 Y2 23,932 0.599 29.69 12.5 28 0.127 16.02 17.6 1,274 82,266 107,500 Y3 23,916 0.486 30.62 12.1 143 0.123 17.29 16.0 345 83,095 107,500 Y4 23,925 0.457 30.56 12.2 86 0.117 17.45 16.0 979 82,510 107,500 Y5 24,266 0.409 26.78 13.4 301 0.105 18.18 15.8 47 71,586 96,200 Y6 22,509 0.367 27.17 13.1 260 0.094 17.47 16.1 502 72,929 96,200 Y7 22,384 0.301 27.90 12.6 193 0.094 20.87 14.8 2,582 71,040 96,200 Y8 22,433 0.228 27.72 12.7 423 0.081 20.57 14.6 4,373 68,970 96,200 Y9 22,277 0.227 26.23 13.1 190 0.061 19.17 15.2 945 72,788 96,200 Y10 21,955 0.193 25.65 13.4 87 0.085 16.46 16.3 0 74,159 96,200 Y11 22,115 0.184 26.31 13.3 12 0.122 13.61 17.4 1,997 72,077 96,200 Y12 22,498 0.206 25.78 13.1 53 0.063 15.94 16.2 858 72,791 96,200 Y13 22,045 0.175 26.54 12.9 55 0.092 16.10 16.2 164 57,236 79,500 Y14 19,583 0.147 28.52 12.4 139 0.107 20.08 15.0 1,729 58,049 79,500 Y15 16,332 0.125 29.35 12.2 129 0.104 24.02 13.9 0 63,039 79,500 Y16 17,277 0.144 31.42 11.6 70 0.087 30.54 12.1 964 53,189 71,500 Y17 20,695 0.080 28.46 12.2 105 0.087 35.30 11.3 0 15,201 36,000 Y18 15,915 0.065 27.24 12.5 19 0.043 26.02 12.9 0 9,064 24,998 Total 390,001 0.299 28.21 12.6 2,325 0.093 20.08 15.1 23,509 1,254,763 1,670,598
Note: *A total of 2.3 Mt of marginal material will be mined and stockpiled for later re-handle for a total LOM mill throughput of 392.3 Mt. Several runs at various proposed total material movement rates were done to determine a good production schedule strategy. This program is not a simulation
Santo Domingo Project Region III, Chile NI 43-101 Technical Report
Page 16-8
March 2020
Project Number: C40029
package, but a tool for calculation of the mine schedule and haulage profiles for a given set of phases and constraints that must be set by the user. The schedule is based on process plant throughput of 65,000 t/d for the first 5 years and 60,000 t/d from Year 6 (23.7 Mt/y and 21.9 Mt/y). The mined material movement peaks at 107.5 Mt/y during Years 1 to 4. The production is limited by the number of benches that it is possible to mine in a single phase in a year, or the amount of vertical development per phase. The total mined waste considers two main destinations for the material; the main waste rock storage areas and TSF for the embankment construction: Waste requirements for the TSF construction were provided to NCL by Knight
Piésold and are based on the schedule for the dam embankment raises The material to be sent to the mine waste storage areas corresponds to the
difference between the total mined waste from the mine production schedule and the requirement for the TSF.
Three waste rock storage facility (WRF) areas at the west and south of the pits have been designed (refer to Section 18). The mined ore will be hauled to the primary crusher for direct tipping. Marginal material will be mined and hauled to a stockpile located between the Santo Domingo and Iris Norte pits until Year 13. This material will be re-handled and will become part of the plant feed in the later years. From Year 14 on, the marginal material will be sent directly to the plant. The total marginal material amounts to 2.3 Mt and the maximum size of the marginal material stockpile is 4.5 Mt. The oxide material is treated as waste in the mine plan. No economic process has been defined to treat this material; however, a stockpile area for the oxide material with copper content greater than 0.2% was set aside so that this material can be stockpiled for possible future processing. The work completed by NCL, using the in-house NCL software, assessed the pre-stripping on a quarterly basis; the first 15 months of commercial production on a monthly basis; and from the second to fifth years on a quarterly production basis. The pre-production period requires the mining of 45 Mt of total material to expose sufficient ore to start commercial production in H2 Year 0. The pre-production period will be approximately 15 months. The ore mined during pre-production will be

Santo Domingo Project Region III, Chile NI 43-101 Technical Report
Page 16-9
March 2020
Project Number: C40029
stockpiled in the ROM pad area and will make up part of the Year 1 ore production. The total stockpiled ore amounts to 0.5 Mt. Mill throughput will be restricted to the maximum magnetite concentrate production of 4.5 Mt/y up to Year 10; and to 5.4 Mt/y from Year 11 onward. The production plan showing material sent to mill and to stockpile is provided in Table 16-3.
16.4 Blasting and Explosives
The drilling equipment will consist of diesel units capable of drilling 9⅞” diameter holes for ore and 12¼” diameter holes for waste. Additionally, support units capable of drilling 6½” diameter holes for pre-splitting are included. Two units will be required for the pre-production period. During commercial production from Year 1 through Year 14 six units will be required. Support unit requirements are one during pre-production and two during the LOM. A general design for the drilling and blasting patterns has been carried out, using the assistance of Orica to design the patterns. According to the drill pattern specified, a blasting powder factor between 181 g/t and 450 g/t were estimated, as a function of the rock type. Both estimated values are common for fresh rock material.
16.5 Mining Equipment
Mine equipment requirements were calculated based on the annual mine production schedule, the mine work schedule and equipment annual production capacity estimates. This represents the equipment necessary to perform the following duties: Construct roads to the initial mining areas as well as to the crusher, waste rock
storage areas and stockpiles. Construct additional roads as needed to support mining activity
The pre-production development required to expose ore for initial production Mine and transport ore to the primary crusher Mine and transport waste from the pit to the waste rock storage areas Maintain all the mine work areas, in-pit haul roads and external haul roads; and
maintain the waste rock storage areas Re-handle the ore and marginal material (load, transport and auxiliary equipment)
from the stockpiles to feed the primary crusher.

Santo Domingo Project Region III, Chile
NI 43-101 Technical Report
Page 16-10
March 2020
Project Number: C40029
Table 16-3: Plant Feed Schedule
Period
Plant Feed High Grade Stockpile Marginal Stockpile
In Tonnage ('000 t)
Out Tonnage ('000 t)
Level Tonnage ('000 t)
In Tonnage ('000 t)
Out Tonnage ('000 t)
Level Tonnage ('000 t)
Tonnage ('000 t)
Cu (%)
Rec. (%)
ConCu ('000 t)
Fe (%)
MassRec (%)
ConFe (Mt)
Au (g/t)
Recovered Au (koz)
Y-1 — — — — — — — — — 0 0 0 0 0 0 Y0H1 — — — — — — — — — 476 0 476 0 0 0 Y0H2 2,551 0.685 94.4 56.9 32.83 15.1 0.38 0.09 5.2 3 47 431 0 0 0 Y1 23,292 0.678 94.4 514.1 31.63 11.6 2.70 0.09 45.6 60 388 102 32 0 32 Y2 23,725 0.604 94.2 465.3 29.83 14.0 3.33 0.08 39.1 245 38 309 28 0 60 Y3 23,790 0.488 93.8 375.4 30.70 16.1 3.82 0.07 32.3 126 0 435 143 0 203 Y4 23,725 0.460 93.7 352.5 30.67 17.0 4.04 0.06 29.6 200 0 635 86 0 290 Y5 23,725 0.416 93.6 318.5 27.00 10.1 2.39 0.06 27.3 541 0 1,176 301 0 591 Y6 21,900 0.367 93.4 259.1 27.17 12.2 2.67 0.05 21.5 609 0 1,785 260 0 851 Y7 21,960 0.301 93.2 212.2 27.90 17.5 3.85 0.04 16.9 424 0 2,210 193 0 1,044 Y8 21,900 0.228 92.8 159.9 27.72 18.2 3.98 0.03 13.0 533 0 2,742 423 0 1,468 Y9 21,900 0.227 92.8 158.8 26.23 16.2 3.56 0.03 13.1 377 0 3,119 190 0 1,658 Y10 21,900 0.193 92.7 135.3 25.65 17.9 3.92 0.03 10.3 55 0 3,174 87 0 1,744 Y11 21,960 0.184 92.7 129.4 26.31 21.8 4.78 0.03 9.9 155 0 3,328 12 0 1,756 Y12 21,900 0.206 92.6 144.4 25.78 21.0 4.60 0.03 10.9 598 0 3,927 53 0 1,809 Y13 21,900 0.175 92.3 121.8 26.54 22.9 5.00 0.03 9.3 145 0 4,071 55 0 1,864 Y14 21,900 0.149 92.0 103.8 27.65 24.7 5.40 0.02 7.3 0 1,966 2,106 139 351 1,652 Y15 19,913 0.134 92.1 84.9 28.20 27.1 5.40 0.02 5.6 0 1,800 306 0 1,652 0 Y16 17,653 0.145 92.1 81.5 31.34 30.6 5.39 0.02 4.9 0 306 0 0 0 0 Y17 20,799 0.080 90.9 51.8 28.50 25.9 5.39 0.01 1.7 0 0 0 0 0 0 Y18 15,934 0.065 90.4 32.2 27.24 27.9 4.44 0.01 1.1 0 0 0 0 0 0 Total 392,326 0.297 93.4 3,757.8 28.16 19.1 75.06 0.04 304.6 4,545 4,545 0 2,003 2,003 0 Note: Oxide material in the mine movement plan outlined in Table 16-2 is not included in this table as the oxide material is not sent to the plant. The difference between the 2.3 Mt of marginal material and the 2 Mt in the stockpile is a result of 322,000 t of marginal material going directly from the mine to the process plant in the last 4 years of the mine life (i.e. this material does not report to the stockpiles).

Santo Domingo Project Region III, Chile
NI 43-101 Technical Report
Page 16-11
March 2020
Project Number: C40029
The mine major equipment was selected based on the mine production schedule, 15 months of pre-production and approximately 18 years of commercial mining operations. The pre-production period will include preparing roads, preparing bench openings and pre-production stripping. The total material mined during pre-production is 45 Mt. Re-handling of ore will be required in Year 1 for material mined during pre-production to complete the plant feed requirement. An average dry bank density of 3.16 t/m3 was used for ore and 2.80 t/m3 for waste. The density values are based on the resource block model values for the various materials tabulated from the mine production schedule. The material handling swell was estimated at 30%. NCL assumed a moisture content of 2%, which represents the weight percent of the wet weight of the material. The density of wet, loose material was used to calculate truck allowable payload limits. A job efficiency factor (operational losses) of 83.3%, to allow for operational losses, was used to estimate all major units of equipment and productivities; this corresponds to 50 minutes per operating hour. A job efficiency of 85% was used for the haul trucks. This Report assumes that the mining operation will use 42 m3 hydraulic excavators and trucks with a capacity of 290 t. This type of equipment is able to achieve the required productivity for an annual total material movement of 107.5 Mt and will provide sufficient mining selectivity with the excavators as required for good grade control. The fleet will be complemented with drill rigs for ore and waste delineation. Auxiliary equipment will include track dozers, wheel dozers, motor graders and a water truck. The mine fleet will also include the necessary equipment to re-handle the ore from the stockpiles to the primary crusher. This operation will be carried out using a front-end loader and the same 290 t trucks used in the open pit. The peak equipment requirements for the pre-production and mine life are included as Table 16-4. Fleet requirements by year are included in Table 16-5. During pre-production one shovel will be required. Four operating shovels will be required for the commercial production period from Year 1 through Year 12, the number will then drop to the end of mine life as less material is mined. The number of front-end loaders required is less than one for all of the mine life. The front-end loader will also be used as back-up for production loading activities.

Santo Domingo Project Region III, Chile
NI 43-101 Technical Report
Page 16-12
March 2020
Project Number: C40029
Table 16-4: Peak Fleet Requirements for Pre-Production and Commercial Production
Type of Equipment Peak Pre-Production
Peak Requirement
FEL L-2350 1 1 Hydraulic shovel PC 8000 1 4 Haul truck 930E-4SE 6 29 Diesel drill DR 460 3 6 Support drill 1 2 Bulldozer 1 D 375A-6R 2 5 Bulldozer 2 D475A-5E0 1 1 Wheel dozer 1 WD 600-3 1 3 Wheel dozer 2 WD 900-3A 1 1 Motor grader 1 GD 825A-2 1 3 Water truck HD 785-7 1 2 Backhoe 1 1 Fuel truck 85 m3 1 1 Mobile crane 200 t 1 1 Lowboy truck CXU 613/100 t 1 1 Tire handler WD 600-3 1 1 Lighting plant MOTOR LDW 1003 GE 8 15
Note: FEL= front-end loader
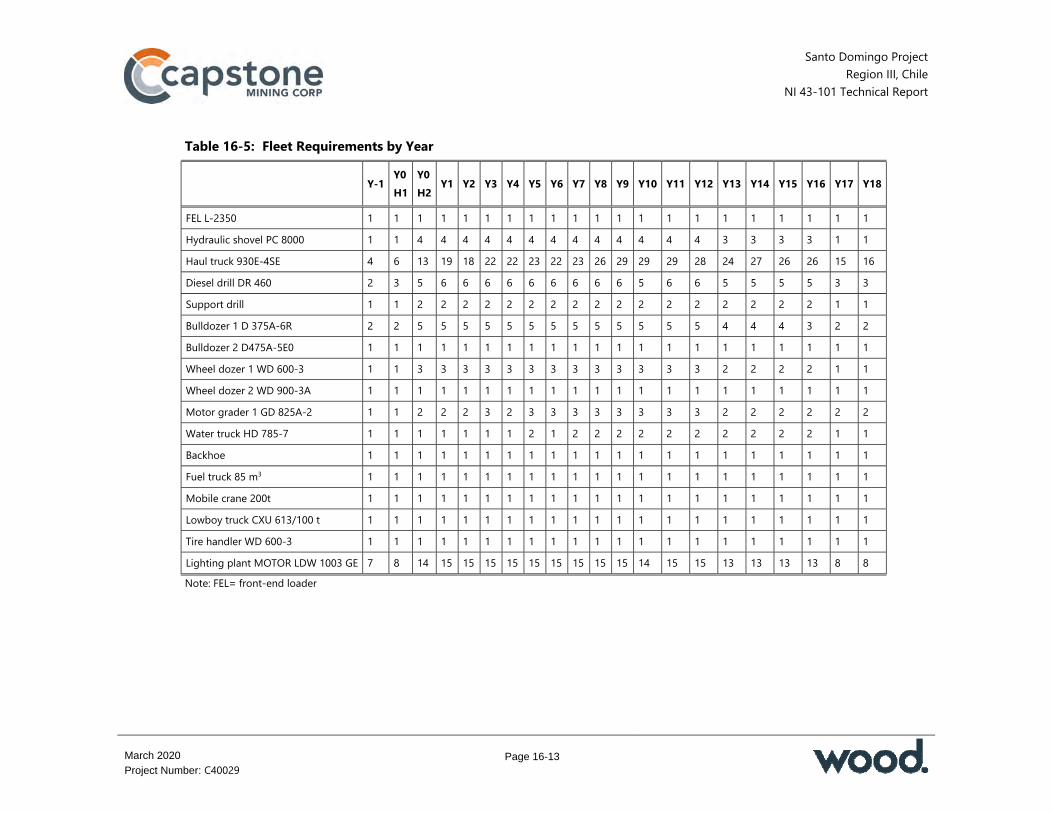
Santo Domingo Project Region III, Chile
NI 43-101 Technical Report
Page 16-13
March 2020
Project Number: C40029
Table 16-5: Fleet Requirements by Year
Y-1 Y0 H1
Y0 H2 Y1 Y2 Y3 Y4 Y5 Y6 Y7 Y8 Y9 Y10 Y11 Y12 Y13 Y14 Y15 Y16 Y17 Y18
FEL L-2350 1 1 1 1 1 1 1 1 1 1 1 1 1 1 1 1 1 1 1 1 1 Hydraulic shovel PC 8000 1 1 4 4 4 4 4 4 4 4 4 4 4 4 4 3 3 3 3 1 1 Haul truck 930E-4SE 4 6 13 19 18 22 22 23 22 23 26 29 29 29 28 24 27 26 26 15 16 Diesel drill DR 460 2 3 5 6 6 6 6 6 6 6 6 6 5 6 6 5 5 5 5 3 3 Support drill 1 1 2 2 2 2 2 2 2 2 2 2 2 2 2 2 2 2 2 1 1 Bulldozer 1 D 375A-6R 2 2 5 5 5 5 5 5 5 5 5 5 5 5 5 4 4 4 3 2 2 Bulldozer 2 D475A-5E0 1 1 1 1 1 1 1 1 1 1 1 1 1 1 1 1 1 1 1 1 1 Wheel dozer 1 WD 600-3 1 1 3 3 3 3 3 3 3 3 3 3 3 3 3 2 2 2 2 1 1 Wheel dozer 2 WD 900-3A 1 1 1 1 1 1 1 1 1 1 1 1 1 1 1 1 1 1 1 1 1 Motor grader 1 GD 825A-2 1 1 2 2 2 3 2 3 3 3 3 3 3 3 3 2 2 2 2 2 2 Water truck HD 785-7 1 1 1 1 1 1 1 2 1 2 2 2 2 2 2 2 2 2 2 1 1 Backhoe 1 1 1 1 1 1 1 1 1 1 1 1 1 1 1 1 1 1 1 1 1 Fuel truck 85 m3 1 1 1 1 1 1 1 1 1 1 1 1 1 1 1 1 1 1 1 1 1 Mobile crane 200t 1 1 1 1 1 1 1 1 1 1 1 1 1 1 1 1 1 1 1 1 1 Lowboy truck CXU 613/100 t 1 1 1 1 1 1 1 1 1 1 1 1 1 1 1 1 1 1 1 1 1 Tire handler WD 600-3 1 1 1 1 1 1 1 1 1 1 1 1 1 1 1 1 1 1 1 1 1 Lighting plant MOTOR LDW 1003 GE 7 8 14 15 15 15 15 15 15 15 15 15 14 15 15 13 13 13 13 8 8 Note: FEL= front-end loader

Santo Domingo Project Region III, Chile
NI 43-101 Technical Report
Page 16-14
March 2020
Project Number: C40029
The number of truck units required was obtained by dividing the annual capacity of transport of a truck for each combination and period by the corresponding tonnage according to the defined assignment per loading unit. Truck operating hours were calculated per period, type of material and loading unit dividing the tonnage that has to be transported by the hourly productivity of each combination. The total haulage distance varies from a minimum of 1.5 km to a maximum of 7.0 km. Truck speeds were determined using typical values obtained from supplier information and similar operations. The truck cycle assignments include fixed times for loading, dumping and queuing. Two and a half minutes have been added to every cycle for dumping and queuing. Operational indices considered for the trucks were: Availability (MA): Variable profile according to vendor and fleet life Use of availability (UA): 86% Operational losses: 85% (accounting for operator factor, inspection and training).
The number of trucks required during pre-production is six. The requirement gradually increases from 19 units in Year 1 to a maximum of 29 units in Years 9 to 11, then decreases to the end of mine life as less material is mined. The primary duties that will be assigned to the auxiliary equipment are as follows: Mine development including access roads, drop cuts, temporary service ramps
and safety berms Waste rock storage area control; this includes maintaining access to the dumping
areas and maintaining the travel surfaces Ore stockpile storage area control; this includes maintaining access to the
stockpile areas and maintaining the travel surfaces Maintenance and clean-up in the mine and WRF areas Drilling for pre-splitting.
Equipment types included in the auxiliary mine fleet are: Komatsu D375A-6R Track Dozer (525 HP) Komatsu D475A-5E0 Track Dozer (860 HP) Komatsu WD600-3 Wheel Dozer (485 HP)
Santo Domingo Project Region III, Chile
NI 43-101 Technical Report
Page 16-15
March 2020
Project Number: C40029
Komatsu WD900-3A Wheel Dozer (853 HP) Komatsu GD825A-2 Grader (280 HP) Komatsu Water Truck HD 785-7 (85 m3) Sandvik DR560 Support Drill (6½").
In general, six track-dozers, four wheel-dozers, three motor-graders and two water trucks will be required.
16.6 Mine Rotation Schedule
The mine is scheduled to work seven days per week, 365 days per year. Each day will consist of two 12-hour shifts. Four mining crews will rotate to cover the operation (two working and two on time off).
Santo Domingo Project Region III, Chile
NI 43-101 Technical Report
Page 17-1
March 2020
Project Number: C40029
17.0 RECOVERY METHODS
17.1 Process Flowsheet
The process flowsheet is included as Figure 17-1. 17.1.1 Coarse Ore Handling and Crushing
The primary crushing plant will process ROM feed in open circuit. Trucks will be able to unload material simultaneously to the 450 t capacity feed hopper that will have a fixed rock breaker. Primary crushing will be carried out in a 600 kW, 60” x 89” gyratory crusher. The crushed product will fall into a 450 t hopper which will unload onto a plate feeder that feeds the conveyor transporting material to the coarse ore stockpile. The stockpile will have a live capacity equivalent to six to eight hours of operation. The stockpile will discharge onto three feeders located within the reclaim tunnel, which then will feed the primary SAG mill.
17.1.2 Grinding and Classification
The grinding circuit will receive fresh feed from the coarse ore stockpile and desalinated water from the water storage pond. The 24 MW (at the shell), 40’ x 26’ EGL SAG mill will operate in a direct (DSAG) mode. The SAG mill will discharge onto a screen. The oversize pebbles from the discharge screen will be recycled to the SAG mill without being crushed. The screen will be a conventional, double deck, 12’ x 24’, vibratory screen with screen openings of 1” on the top deck and ½” on the bottom deck. The oversize pebbles will be transported by a conveyor system to the SAG mill feed conveyor. The undersize from the discharge screen will be fed to secondary grinding circuit pump box. The secondary grinding circuit will consist of two 24’ x 36’ ball mills each with a 12 MW twin pinion drive system. The ball mills will operate in closed circuit with two cyclone clusters of ten 33” hydrocyclones with 20% spare cyclone flow capacity. The coarse (underflow) fraction from the hydrocyclones will be returned to the ball mill feed and the fine material (overflow) fraction will be the final comminution circuit product with a P80 of 150 µm.

Santo Domingo Project Region III, Chile
NI 43-101 Technical Report
Page 17-2
March 2020
Project Number: C40029
Figure 17-1: Process Flowsheet
Note: Figure prepared by Wood, 2018

Santo Domingo Project Region III, Chile
NI 43-101 Technical Report
Page 17-3
March 2020
Project Number: C40029
Each cyclone cluster will be fed by a single centrifugal pump from a common pump box. There will be no spare pumps installed. The pump box will receive the undersize from the SAG mill screen and the discharge from the ball mills. The coarse discharge from each cyclone cluster will feed the dedicated ball mill and the combined fine discharge will be sent to the primary flotation.
17.1.3 Copper Flotation
Copper rougher flotation will be carried out in a single bank of six 600 m3 mechanical, forced air tank cells arranged in a 1-1-1-1-1-1 configuration. Flotation rougher concentrate produced from the rougher cells will flow by gravity to the regrind mill feed box where it will be combined with first cleaner scavenger concentrate and then fed to the regrinding stage which will consist of a single vertical mill and cyclone cluster operating in closed circuit. The overflow from the hydrocyclones will feed a single conditioning tank preceding the first cleaner and cleaner scavenger flotation circuit. First cleaner stage flotation will be carried out in a bank of four mechanical, forced air 250 m3 tank cells; the concentrate will be pumped to the second cleaner stage and the tailings will flow to the scavenger flotation cells. Cleaner scavenger concentrate will be recycled to the regrind cyclone pump box and the tailings will report directly to final plant tailings. The second cleaner flotation stage will be performed in a bank of three mechanical 70 m3 tank cells with the concentrate flowing by gravity to feed the third stage of cleaner flotation. Second cleaner stage tailings will be pumped back to the feed of the first cleaning flotation stage. The third (final) cleaning stage will be performed in a single mechanical 70 m3 tank cell.
17.1.4 Copper Thickening
The final copper concentrate will be thickened in an 18 m diameter thickener. The copper concentrate thickener underflow will discharge at 60% solids w/w and will be pumped to the copper concentrate filtration section.
17.1.5 Copper Filtration and Load Out
Copper concentrate will be filtered in three ceramic disc filters. Filter area design considerations include an area of 60 m2 and a unit filtration rate of 450 kg/hr/m2. The recovered water from filtration will be sent to the manifold wash water tank and then

Santo Domingo Project Region III, Chile
NI 43-101 Technical Report
Page 17-4
March 2020
Project Number: C40029
to the clarifier. The clarifier will also receive the recovered water from the filter operation. It is estimated that the underflow from the clarifier will be approximately 25% solids by weight and this will be returned to the filtration header tank. The clarifier overflow will be pumped back to the plant and will be used as process water. The filtered concentrate cake at approximately 8.5% moisture content will be discharged to a feeder which feeds a conveyor system. The conveyor system will unload into the copper concentrate stockpile. The concentrate will be loaded into trucks from the stockpile using FELs for transport to the port.
17.1.6 Magnetic Separation
The primary flotation tailings from the copper section will be fed to the primary magnetic separation step. The magnetic separation area will include the primary magnetic separation step, regrinding, classification by hydrocyclones, magnetic separation cleaning and magnetite concentrate thickening. Tailings from the primary rougher flotation stage will be pumped to a central distribution box which will feed two parallel lines of five magnetic drums in parallel (1,000 gauss), 48” diameter x 144” long. It is planned to add one additional magnetic drum to each line after Year 5 due to the scheduled increase in magnetite concentrate production.
17.1.6.1 Rougher Magnetic Separation and Regrinding Rougher magnetic concentrate will be sent to regrinding and classification. Rougher magnetic concentration tailings will report to the final plant tailings stream. Hydrocyclone overflow from the magnetite concentrate grinding and classification circuit (P80 of 40 μm) will be sent to cleaner magnetic separation. The primary magnetic concentrate will be reground in a 6.5 MW ball mill in closed circuit with a battery of twelve 15” hydrocyclones (10 operating, two stand-by). It is planned to add a second regrind circuit after Year 5.
17.1.6.2 Cleaner Magnetic Separation The cleaning circuit magnetic LIMS concentrator will consist of two parallel lines each with three LIMS drum separators operating in a counter-current configuration to facilitate high selectivity. The final magnetite concentrate produced will be pumped to the magnetite concentrate thickener and the tailings from the cleaner magnetic stage will be combined with rougher LIMS tailings and sent to the final tailings stream.

Santo Domingo Project Region III, Chile
NI 43-101 Technical Report
Page 17-5
March 2020
Project Number: C40029
Each line will operate counter-currently in series using LIMS drums (750 gauss, 700 gauss and 650 gauss, respectively). Each of the drums will be 48” diameter x 144” long. It is planned to add a third line of three magnetic drums in series after Year 5. Dilution water will be added to the feed to each magnetic drum to agitate the slurry. Wash water will be sprayed onto the magnetic drum to remove the entrained silica within the magnetite concentrate. Concentrate from each line will flow by gravity to the magnetite regrind circuit. The tailings will report to the general final tailings launder.
17.1.7 Magnetite Thickening
The final magnetite concentrate from each line will be collected in a central launder, feeding the magnetite concentrate thickener via gravity flow. Magnetite concentrate will be thickened in a 36 m diameter high rate thickener. Flocculant will be added to the thickener feed producing a thickened concentrate of 65% solids w/w. Overflow water from the concentrate thickener will report to the main process water pond. A deflocculator will be added to the discharge from the thickener. Thickened concentrate will be fed to two 200 m3 tanks. A pumping and pipeline system will transfer the magnetite slurry to the receiving tanks at the port.
17.1.8 Lime and Reagent Preparation Plants
The lime and reagent preparation plants (including storage and distribution systems) will be located near the flotation area; the flocculant preparation plants will be located near the tailings thickeners. The flotation reagent plant will include the primary collector, secondary collector, frother and SMBS systems, each of which will have reception, storage and distribution facilities. The metering pump systems for lime distribution, primary collector, secondary collector, frother and flocculant will supply the reagents to each of the required points in the process. The storage tanks will be designed for 7 days capacity. Reagents will be programmed to be received on a regular basis. There will be two flocculant plants. One will be situated at the process plant and will provide flocculant for the copper concentrate thickener, first stage tailings thickening and magnetite concentrate thickener. The second plant will be located at the tailings area and will supply flocculant for the final thickening stage.
Santo Domingo Project Region III, Chile
NI 43-101 Technical Report
Page 17-6
March 2020
Project Number: C40029
17.1.9 Grinding Media
There will be several grinding media handling systems to serve the mills, to provide balls for the SAG mill, ball mills, copper concentrate regrind mill and the magnetite concentrate regrinding mills.
17.1.10 Tailings Thickening
The tailings from magnetic separation will be combined with copper scavenger flotation tailings. Final plant tailings will be about 20% solids by weight. The first stage of tailings thickening will be conducted at the process plant and the second stage will be conducted at the TSF area. First stage thickener tailings will be flocculated and thickened in a 70 m diameter high rate thickener to achieve a discharge of 55% w/w solids. The tailings recirculation pump is designed to re-circulate 100% of the tailings if required. Discharge from the first stage thickener will be transferred, via centrifugal pumps, to a second thickening stage of two parallel 60 m diameter high density thickeners. The flocculant dose will be 10 g/t of tailings feed and the thickened tailings will be 67% solids by weight. To lift the first stage thickener product to the second stage thickeners, seven 600 kW transfer pumps will be installed in series (six operating, one stand-by). The water recovered from the thickeners will be stored in a tank; some water will be filtered to be used as dilution water for flocculant preparation at the TSF. Surplus water will flow by gravity to the process water pond. Final thickened tailings will be pumped to a tank at the TSF.
17.1.11 Plant Desalinated Water Distribution
The desalinated water received from the port area will be discharged into a distribution box at the plant site. This distribution box will have two separate discharge lines; one will discharge by gravity to the fresh desalinated water tank (2,900 m3) that will feed the potable water plants and the other will feed the desalinated water ponds (two, each 20,000 m3, each designed to provide 24 hours of supply). Water from the tank will feed two potable water systems, one for plant services and the other for general plant site consumption. From the two desalinated water ponds water will be pumped to the process water ponds or directly to consumption points.

Santo Domingo Project Region III, Chile
NI 43-101 Technical Report
Page 17-7
March 2020
Project Number: C40029
From time to time, port process discharge water will be pumped to site with the desalinated water and this will supply only the two desalinated water ponds.
17.1.12 Plant Auxiliary Facilities
The air distribution in the plant will provide compressed air for consumption as plant air and instrument air. The compressed air plant will consist of four 200 kW compressors (three operating and one stand-by), one accumulator and one dryer with an accumulator for the instrument air. The distribution networks will consist of carbon steel piping and valves, oil filters, moisture traps, cut-off valves, quick connections and controls. These networks will supply grinding, flotation, regrinding, magnetic separation and magnetite concentrate thickening with lines to the stockpile areas, lime plant, reagents plant, copper concentrate thickener and tailings thickeners. Compressed air for primary crushing and the blower air for flotation will be provided by dedicated equipment. The plant and instrument air for primary crushing will be provided by a 160 kW compressor, one accumulator and a dryer/accumulator for the instrument air. The air for flotation will be provided by four 500 kW blowers (two operating, two stand-by) with a distribution network to each flotation bank.
17.1.13 Port
17.1.13.1 Copper Concentrate The copper concentrate will be delivered to the port by trucks which will discharge the concentrate within the copper concentrate storage building. The copper concentrate will be handled inside the stockpile building by FELs to form the stockpiles. The enclosed concentrate storage building will have a negative air pressure system and a dust collection system to minimize environmental impacts from the copper concentrate. The total copper concentrate storage capacity will be approximately 50,000 t in two piles within the building. The copper concentrate is reclaimed using FELs which transfer the copper concentrate from the stockpiles to the belt feeder which feeds the copper concentrate onto the shiploader conveyor belt. The conveyor will be fully enclosed to minimize dust emission. The conveyor will have auxiliary equipment such as metal detector, magnet, sampler and belt scale. Based on the current mining plan for the first 5 years of operation the following are the expected peak production rate and stockpile capacity requirements:

Santo Domingo Project Region III, Chile
NI 43-101 Technical Report
Page 17-8
March 2020
Project Number: C40029
Copper concentrate (peak): 514.1 kt/y Stockpile capacity: 50,000 t. From Year 5 on, the following are the expected peak production rate and stockpile capacity requirements: Copper concentrate (peak): 259.1 kt/y Stockpile capacity: 50,000 t.
17.1.13.2 Magnetite Concentrate Magnetite concentrate will be received at the port in an agitated receiving tank from the magnetite slurry pipeline. The magnetite concentrate will then be pumped directly to the filter plant holding tank. The filter plant will initially contain two ceramic disc filters and four filters after Year 5, each with a filter area of 144 m2. The requirement is for two filters for the first year of operation, three filters for the second and third years of operation and four filters from Year 5 onwards as magnetite concentrate production increases. The underflow from the clarifier will be recirculated to the magnetite concentrate storage tank. There will be a common belt feeder which receives discharge from each pair of filters. Both belt feeders will then discharge onto a conveyor which will transfer the filtered concentrate to the mobile stacker at the 320,000 t magnetite stockpile (stockpile capacity will be increased in the fifth year of operation to 500,000 t). The mobile stacker will run along the north side of the magnetite concentrate stockpile area. The filtered concentrate will have a moisture content of about 8%. Due to environmental regulations, protection around the perimeter of the magnetite concentrate stockpile area is required to reduce the wind speed at the face of the stockpile which reduces the generation of dust. It is planned to install a steel structure to provide this protection. Based on the current mining plan for the first 5 years of operation the following are the expected peak production rate and stockpile capacity requirements: Magnetite concentrate (peak): 4.04 Mt/y Stockpile capacity: 320,000 t. From Year 5 on the following are the expected peak production rate and stockpile capacity requirements:

Santo Domingo Project Region III, Chile
NI 43-101 Technical Report
Page 17-9
March 2020
Project Number: C40029
Magnetite concentrate (peak): 5.40 Mtpy Stockpile capacity: 500,000 t.
17.1.14 Water Supply Facilities
Desalinated water for all of the facilities (mine and plant site and the port) will be provided by a build, own, operate, transfer (BOOT) contractor and delivered to Capstone at the port and the mine site at an agreed price per cubic meter. The BOOT water desalination facilities will consist of a sea water intake, filtration, treatment and a reverse osmosis desalination plant located at the port area and operated by the BOOT water supplier. The BOOT contractor will also own and operate the desalinated water pipeline system to deliver water at the plant site. Potable water treatment facilities will be operated by Capstone and will be located at the port and at the plant site, to supply potable water to the port and mine, plant and camp facilities.
17.1.15 Port Auxiliary Facilities
17.1.15.1 Plant Air The port will require both plant and instrument air. The compressor plant will consist of two 110 kW compressors, one accumulator and one dryer with an accumulator for instrument air. The distribution networks will consist of carbon steel piping and valves, oil filters, moisture traps, cut-off valves, quick connections and controls. Air is not required for the filter plant operation other than instrument air which will be provided from the instrument air accumulator. The plant and instrument air will be provided via distribution ring main systems.
17.1.15.2 Dust Control Dust suppression systems at transfer points will use specialized nozzles to produce extremely small water droplets in a dispersed mist. These nozzles will operate by atomizing water with compressed air. This type of dust control system will consume water at a rate of about 0.1 L/t to 0.5 L/t of copper concentrate. The dust suppression system in stockpiles will use large volume water nozzles. For copper concentrate loading and conveyor transfers points, the dust will be collected by dry bag filter systems.

Santo Domingo Project Region III, Chile
NI 43-101 Technical Report
Page 17-10
March 2020
Project Number: C40029
Dust suppression with pressurized air-water systems will be considered for the magnetite concentrate transfer points.
17.2 Plant Design
17.2.1 Design Criteria
The main process design criteria include: Design capacity (first 5 years): 65,000 t/d Nominal capacity (after 5 years): 60,000 t/d Operating period: 365 days per year. Table 17-1 provides the projected utilization rate for the various plant components. Table 17-2 provides a summary of the planned crushing and grinding designs. The copper concentrate circuit design summary is included in Table 17-3 and the magnetite circuit in Table 17-4.
17.2.2 Mineral Classification
It was determined that the magnetic susceptibility parameter could be used to classify the feed in order to define the different types of plant feed as follows: Magnetite = magnetic susceptibility ≥ 8,000 Hematite = magnetic susceptibility 2,000 ≤ 8,000. During the 2014 feasibility study, 52 samples representative of the first 3 years of operation were classified using magnetic susceptibility parameter. These samples were tested using the abbreviated JKSimMet method (SMC). From the results, the treatment rates were set for Magnetite and Hematite materials for the first 5 years of operation. This resulted in the following average treatment capacities for the two feed types: Magnetite: 66,629 t/d Hematite: 61,844 t/d.
Wood notes that because designations of material are based only on the magnetic susceptibility readings, rather than the typical physical characteristics of magnetite and hematite, there may be significant variations in hardness within each of the Hematite or Magnetite feed types.

Santo Domingo Project Region III, Chile
NI 43-101 Technical Report
Page 17-11
March 2020
Project Number: C40029
Table 17-1: Utilization Rates
Area Utilization (%)
Primary crusher 65 Grinding 93 Flotation 93 Tailings thickener 93 Copper concentrate thickener 93 Reagent (lime – flocculant) 93 Magnetic separation 93 Magnetite concentrate thickener 93 Concentrate pipeline 98.5 Filters and copper conc. handling 90 Filters and magnetite conc. handling 90
Table 17-2: Crushing and Grinding Area Specification Crushing
Crushing work index: design 8.4 kWh/t Open size setting (O.S.S.) 180 mm Grinding
SAG mill
Transfer size (K80) design 2,500 µm Specific energy consumption DSAG 7.1 kWh/t Ball mill
Type of circuit Closed Product size (P80) 150 µm Bond Ball work index (BWi)
Average 12.4 kWh/t Design 12.5 kWh/t

Santo Domingo Project Region III, Chile
NI 43-101 Technical Report
Page 17-12
March 2020
Project Number: C40029
Table 17-3: Copper Circuit
Area Flotation Time (mins) pH
Copper flotation
Rougher 40 7.5–8.2 Conditioning time 12 8.8–9.2 First cleaner 25 8.8–9.2 Cleaner scavenger 55 8.8–9.2 Second cleaner 18 8.8–9.2 Third cleaner 10 8.8–9.2 Area Specification Copper regrind mill
Specific energy consumption 4.5 kWh/t Product size P80 of 34 µm Copper concentrate thickener
Settling rate 0.25 t/hr/m2 Solid percentage underflow 60% w/w Copper concentrate filter
Unit filtration rate 60 m2/filter Unit rate 450 kg/hr/m2
Table 17-4: Magnetite Circuit Area Specification Magnetic separation
Rougher
Type of drum LIMS Intensity of magnetic field 1,000 gauss Unit capacity 80 t/hr/m Regrind ball mill
Type of circuit Closed Product size P80 of 40 µm Ball work index (BWi)

Santo Domingo Project Region III, Chile
NI 43-101 Technical Report
Page 17-13
March 2020
Project Number: C40029
Area Specification Average 11.7 kWh/t Design 13.6 kWh/t
Cleaners
Type of drum LIMS Stages of cleaning 3 Intensity of magnetic field 650–750 gauss Unit capacity 80 t/hr/m Magnetite concentrate thickener
Type of thickener High rate Unit rate 0.68 t/hr/m2 Solid % underflow 65% w/w Magnetite concentrate filter
Type of filter Ceramic disc Unit filtration rate 144 m2/filter Unit rate 730 kg/hr/m2 Tailings thickener
First stage
Type of thickener High Rate Unit rate 0.65 t/hr/m2 Solid percentage underflow 55% w/w
Second stage
Type of thickener High density Unit rate 0.5 t/hr/m2 Solid percentage underflow 67% w/w

Santo Domingo Project Region III, Chile
NI 43-101 Technical Report
Page 17-14
March 2020
Project Number: C40029
17.3 Production Plan
The production schedule for copper concentrate and magnetite concentrate is based on the production plan and the recovery models for copper and iron. Table 17-5 presents the production plan obtained from the mine plan and the metallurgical models for copper and iron recovery at yearly average treatment rates of 65,000 t/d and 60,000 t/d, with an annual peak production of 514.1 kt of copper concentrate in Year 1 and an annual peak for magnetite concentrate of 4.04 Mt in the first 6 years of production and 5.40 Mt for the remaining mine life. The distribution of Hematite and Magnetite type feeds over the LOM is indicated in Figure 17-2. The maximum treatment rate of Hematite in the plan is in Year 0 H1 and Year 1 (about 32% of the total processed in the year). The maximum rate treatment of Magnetite type is close to 90% in Year 18. In some periods the plant could process more tonnage than projected; however, the plan is restricted by the maximum treatment rate and the maximum concentrate production rates and this potential extra capacity is not used. Figure 17-3 shows the grades of copper and iron in the plant feed. The head grade will vary between 0.42% Cu and 0.68% Cu during the first 5 years of production. After the fifth year up to Year 16, the head grade is projected to drop to between 0.37% Cu and 0.14% Cu. At the end of the mine life the head grade will be about 0.06% Cu. For the first 5 years, the head grade will be about 30% Fe, averaging 28% Fe with little variation over the LOM. Wood notes that copper production is economically viable (refer to Section 22), even at the lower grades at the end of the LOM, so that there is no specific copper cut-off grade when the copper circuit closes down. Figure 17-4 shows the annual tonnes of copper and magnetite concentrate planned to be produced.
17.4 Energy, Water and Process Materials Requirements
The power requirements are discussed in Section 18.13. Water provision for the plant is outlined in Sections 17.1.9, 17.1.12, 18.7 and 18.8. Reagents required for the plant operation include lime, primary collector (3418A) and secondary collector (3926), flocculant and frother (MIBC). Balls are required for the grinding circuit, ranging from 5” diameter for the SAG mill to 1” to 1.5” diameter for the concentrate regrinding mills.
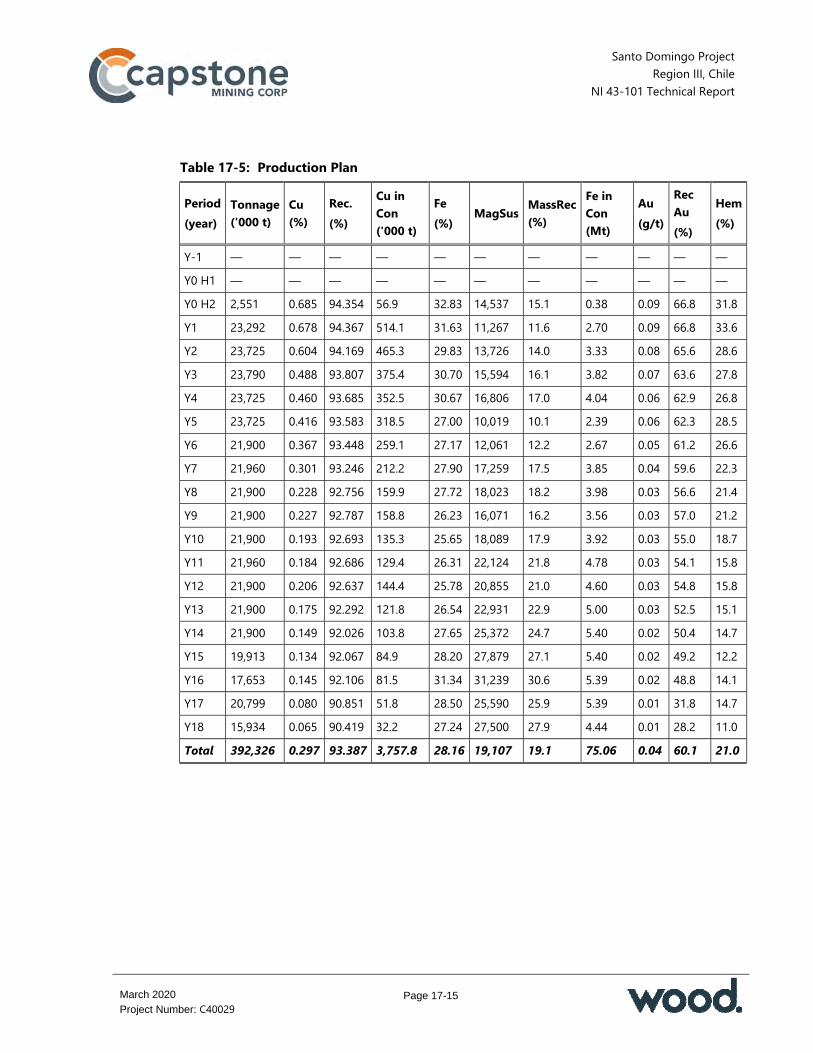
Santo Domingo Project Region III, Chile
NI 43-101 Technical Report
Page 17-15
March 2020
Project Number: C40029
Table 17-5: Production Plan
Period (year)
Tonnage ('000 t)
Cu (%)
Rec. (%)
Cu in Con ('000 t)
Fe (%) MagSus MassRec
(%)
Fe in Con (Mt)
Au (g/t)
Rec Au (%)
Hem (%)
Y-1 — — — — — — — — — — — Y0 H1 — — — — — — — — — — — Y0 H2 2,551 0.685 94.354 56.9 32.83 14,537 15.1 0.38 0.09 66.8 31.8 Y1 23,292 0.678 94.367 514.1 31.63 11,267 11.6 2.70 0.09 66.8 33.6 Y2 23,725 0.604 94.169 465.3 29.83 13,726 14.0 3.33 0.08 65.6 28.6 Y3 23,790 0.488 93.807 375.4 30.70 15,594 16.1 3.82 0.07 63.6 27.8 Y4 23,725 0.460 93.685 352.5 30.67 16,806 17.0 4.04 0.06 62.9 26.8 Y5 23,725 0.416 93.583 318.5 27.00 10,019 10.1 2.39 0.06 62.3 28.5 Y6 21,900 0.367 93.448 259.1 27.17 12,061 12.2 2.67 0.05 61.2 26.6 Y7 21,960 0.301 93.246 212.2 27.90 17,259 17.5 3.85 0.04 59.6 22.3 Y8 21,900 0.228 92.756 159.9 27.72 18,023 18.2 3.98 0.03 56.6 21.4 Y9 21,900 0.227 92.787 158.8 26.23 16,071 16.2 3.56 0.03 57.0 21.2 Y10 21,900 0.193 92.693 135.3 25.65 18,089 17.9 3.92 0.03 55.0 18.7 Y11 21,960 0.184 92.686 129.4 26.31 22,124 21.8 4.78 0.03 54.1 15.8 Y12 21,900 0.206 92.637 144.4 25.78 20,855 21.0 4.60 0.03 54.8 15.8 Y13 21,900 0.175 92.292 121.8 26.54 22,931 22.9 5.00 0.03 52.5 15.1 Y14 21,900 0.149 92.026 103.8 27.65 25,372 24.7 5.40 0.02 50.4 14.7 Y15 19,913 0.134 92.067 84.9 28.20 27,879 27.1 5.40 0.02 49.2 12.2 Y16 17,653 0.145 92.106 81.5 31.34 31,239 30.6 5.39 0.02 48.8 14.1 Y17 20,799 0.080 90.851 51.8 28.50 25,590 25.9 5.39 0.01 31.8 14.7 Y18 15,934 0.065 90.419 32.2 27.24 27,500 27.9 4.44 0.01 28.2 11.0 Total 392,326 0.297 93.387 3,757.8 28.16 19,107 19.1 75.06 0.04 60.1 21.0

Santo Domingo Project Region III, Chile
NI 43-101 Technical Report
Page 17-16
March 2020
Project Number: C40029
Figure 17-2: Mine Plan Hematite and Magnetite Distribution
Note: Figure prepared by Wood, 2018 Figure 17-3: Mine Plan Feed Grade Distribution
Note: Figure prepared by Wood, 2018. X-axis shows years. Blue line is copper grade, red line is iron grade

Santo Domingo Project Region III, Chile
NI 43-101 Technical Report
Page 17-17
March 2020
Project Number: C40029
Figure 17-4: Mine Plan Distribution of Concentrate Tonnes
Note: Figure prepared by Wood, 2018
17.5 Comments on Section 17
For the first 5 years of operation, the Santo Domingo mine will have an annual average production of approximately 249 Mlb of copper contained in 390,000 dmt of concentrate (at an average copper content of 29%). The LOM average is 131 Mlb of copper in approximately 196,000 t of concentrate per year over a period of approximately 18 years. The total LOM production is estimated to be 2.40 Blb of copper contained in 3.758 Mt of concentrate. For the same period, the average magnetite concentrate production is estimated to average 3.16 Mdmt per year. The magnetite concentrate production will average 4.15 Mdmt per year with a total estimated production of approximately 75.0 Mdmt for the LOM. The first 5 years of production do not include the Year 0 ramp up. The effect of grinding to a P80 of 150 μm should be reviewed in the next stage of engineering, this would impact the energy consumption and hence also require an update of the operating costs. The updated copper and gold recovery models were obtained from flotation tests performed using material that was ground to P80 of 150 μm. These should be reviewed in the next engineering phase.
Santo Domingo Project Region III, Chile
NI 43-101 Technical Report
Page 17-18
March 2020
Project Number: C40029
The use of desalinated water could require a modification in the flotation pH. This should be reviewed in the next stage of engineering and the mass recovery and/or consumption of lime should be confirmed through metallurgical testwork. Based on experience in similar projects the use of desalinated water could result in an increase in copper recovery. It is recommended that in the next engineering stage the impact on equipment sizing be reviewed, especially flotation, regrind, filtration and copper concentrate transport system equipment.

Santo Domingo Project Region III, Chile
NI 43-101 Technical Report
Page 18-1
March 2020
Project Number: C40029
18.0 INFRASTRUCTURE
18.1 Introduction
The principal facilities are planned to be located at the following sites: Santo Domingo mine and plant site: located at approximately 26°28’00”S
and 70°00’30”W Operations camp: located on site Port facilities: located about 43.5 km north of Caldera at Punta Roca Blanca Concentrate and water pipelines: 111.6 km long between the Santo
Domingo plant site location and the Santo Domingo port site at Punta Roca Blanca
High voltage transmission line: from Diego de Almagro (San Lorenzo substation) to the proposed mine and plant site
High voltage transmission line: from the Totoralillo substation to the port site.
Figure 18-1 shows the overall layout from the mine site to the proposed port location. Figure 18-2 shows the details of the proposed mine site and plant layout. Two areas where the design will impact existing infrastructure were noted. These are: TSF: Entel’s fibre optic line and Route C-17 Mine–plant area: Red Eléctrica Internacional and Engie (formerly GDF Suez)
Mejillones-Cardones transmission line, the Chañaral–Diego de Almagro transmission line and the Cardones–Diego de Almagro transmission line.

Santo Domingo Project Region III, Chile
NI 43-101 Technical Report
Page 18-2
March 2020
Project Number: C40029
Figure 18-1: Location Plan Showing Proposed Pipeline
Note: Figure prepared by Wood, 2013. Figure uses ESRI Digital Globe as a base, modified by Wood, 2013. As an indicator of map scale, it is approximately 117 km from the proposed process plant location to the proposed port site

Santo Domingo Project Region III, Chile
NI 43-101 Technical Report
Page 18-3
March 2020
Project Number: C40029
Figure 18-2: Proposed Mine Site and Plant Layout
Note: Figure prepared by Wood, 2013. Figure uses ESRI Digital Globe as a base, modified by Wood, 2013. It is approximately 7 km from the planned concentrator site (orange outline located between the Iris Norte pit and the tailings storage facility) to the town of Diego de Almagro as an indicator of scale

Santo Domingo Project Region III, Chile
NI 43-101 Technical Report
Page 18-4
March 2020
Project Number: C40029
18.2 Roads and Logistics
18.2.1 Access
The planned route for transporting cargo, staff and equipment to the Santo Domingo site is from the south of the mine site by Route C-17 (Figure 18-3) and from the north by Route C13 (Figure 18-4). The closest airport to the Santo Domingo site is the El Salvador Airport, a private airport, 44 km from the site. The closest commercial airport is the Desierto Atacama Airport, 113 km south from Chañaral, which has regular scheduled flights to Antofagasta and Santiago. The planned port for transport and shipment of heavy machinery, equipment and materials for construction is Punta Angamos in Mejillones, Antofagasta Region, 520 km from the plant site. This port is a year-round operation and is accessed directly from Route 5 North (Figure 18-5).
18.2.2 On-Site Access
Approximately 13 km of roads will be built on the site in order to connect the mine, plant and infrastructure areas.
18.2.3 Copper Concentrate Haulage Study
Ghisolfo completed a concentrate haulage study for the 117 km distance between the planned mine site and the proposed Santo Domingo port. Owner-operated and contractor-operated haulage estimated costs were found to be relatively close; either operating execution approach can be used. Ghisolfo recommended a by-pass option around the village of El Salado that will allow for future village growth. Ghisolfo also made recommendations for the preparation of contingency plans for spill management and accidents and for training of an incident management team.
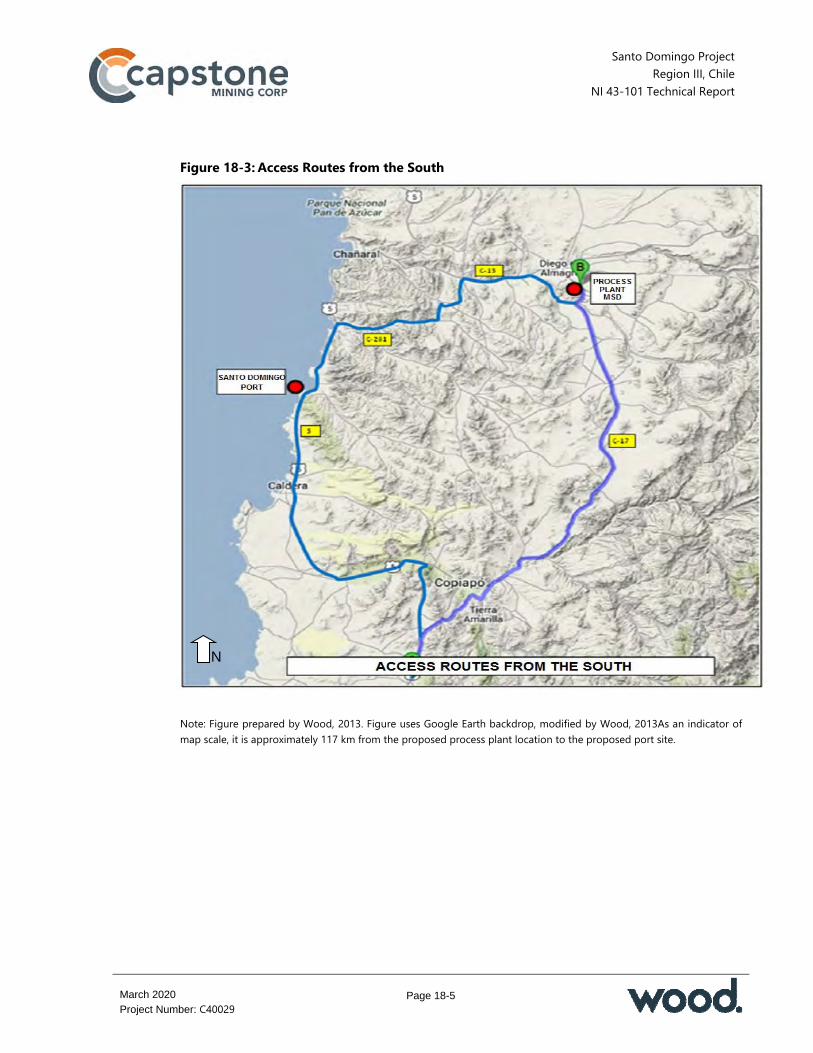
Santo Domingo Project Region III, Chile
NI 43-101 Technical Report
Page 18-5
March 2020
Project Number: C40029
Figure 18-3: Access Routes from the South
Note: Figure prepared by Wood, 2013. Figure uses Google Earth backdrop, modified by Wood, 2013As an indicator of map scale, it is approximately 117 km from the proposed process plant location to the proposed port site.
N

Santo Domingo Project Region III, Chile
NI 43-101 Technical Report
Page 18-6
March 2020
Project Number: C40029
Figure 18-4: Access Routes from the North
Note: Figure prepared by Wood, 2013. Figure uses Google Earth backdrop, modified by Wood, 2013. As an indicator of map scale, it is approximately 117 km from the proposed process plant location to the proposed port site.
N

Santo Domingo Project Region III, Chile
NI 43-101 Technical Report
Page 18-7
March 2020
Project Number: C40029
Figure 18-5: Punta Angamos Port, Mejillones
Note: Figure prepared by Wood, 2013. Figure uses Google Earth backdrop, modified by Wood, 2013. Point A shown on the plan = Mejillones; point B = Santo Domingo site. Map north is to top of plan. The distance from Chañaral to Taltal is approximately 143 km as an indicative scale for the plan.
18.2.4 Pipeline Route Studies
The proposed route for the magnetite concentrate pipeline was optimized using a single 15 m right-of-way (RoW) width and a common trench for the concentrate pipeline and the desalinated water pipeline. The route is designed to run parallel to the existing roads and uses existing RoW access to avoid the construction of new roads. Ongoing access to the pipeline route during operation will be along the platform and construction road.
18.3 Waste Rock Storage Facilities
Three WRF areas, to be located to the west and south of the pits, were designed. The final configuration is shown in Figure 18-6.

Santo Domingo Project Region III, Chile
NI 43-101 Technical Report
Page 18-8
March 2020
Project Number: C40029
Figure 18-6: Final Pit and Waste Rock Facility Configuration
Note: Figure prepared by NCL, 2018. Waste dump = waste rock facility or WRF. Figure north is to top of plan.

Santo Domingo Project Region III, Chile
NI 43-101 Technical Report
Page 18-9
March 2020
Project Number: C40029
Pre-stripping activities will generate approximately 44.2 Mt of waste rock that will be transported by trucks to the WRFs and 4.73 Mt will be used in the TSF starter dam. The facilities were designed in 50 m lifts. Each lift will be constructed at an approximate angle of repose of 37°. A constant 2.0 t/m3 loose density was assumed in the design. No significant acid generation is expected by Capstone from the mined waste and the dry climate conditions are also not expected by Capstone to produce sufficient water to generate drainage through the WRFs to mobilize any acid solutions.
18.4 Stockpiles
During the pre-production period, the ROM pad area will be constructed close to the initial pit for later re-handling to the primary crusher. The total ore to be stockpiled during this period amounts to 0.47 Mt. The marginal material stockpile and the oxide stockpile will be located between the Santo Doming and Iris Norte pits. The stockpiles are designed with 20 m lifts and 30 m set-backs in order to facilitate later re-handling.
18.5 Water Management
18.5.1 Hydrology
A feasibility level analysis of meteorological and hydrological data was carried out by Knight Piésold based on regional stations and historical data and site studies for water resources carried out by third-parties on the proposed Santo Domingo mine site area since 2009. The purpose of this analysis was to characterize the water resources in the area and to support the development of the environmental impact assessment of the Santo Domingo property. Specific outputs from this work included a general description of the site climate, development of regional and site-specific meteorological and precipitation statistics, and hydrologic run-off statistics. It is recommended that in the next phase of work the site climatic and hydrologic databases are updated to include the latest significant hydrological events, and the water balance model and water management plans are updated, if necessary. In addition, on a risk management basis, consideration should be given to expanding the temporary extreme event water storage capacity in the TSF to the 72-hour PMP.
Santo Domingo Project Region III, Chile
NI 43-101 Technical Report
Page 18-10
March 2020
Project Number: C40029
18.5.2 Water Requirements
The mineral processing facility will use desalinated sea water. The current plan is to produce desalinated water under a BOOT or build, own, operate (BOO) contract with a third party. Desalinated water will be used for the process and Capstone will operate potable water treatment plants for consumption in the mine and port areas and to supplement water resources in the town of Diego de Almagro. The water requirement during the construction phase will be provided by an authorized water supplier. The maximum potable water, water for construction and dust control water requirements are estimated at 15 L/s. The mineral processing system at the process plant will use fresh desalinated and recycled water. The forecast water requirement is 348.6 L/s. Two high-density polyethylene (HDPE)-lined open ponds for process water will be located near the process plant and will have a total capacity of 40,000 m3. These ponds will store water reclaimed from the copper and magnetite concentrate thickeners and tailings thickener overflows and make-up from the plant desalinated water storage ponds. Recycled water from the magnetite concentrate filtration at the port will also be pumped to site.
18.6 Magnetite Concentrate Pipeline
The magnetite concentrate transportation pipeline and the desalinated water transportation pipeline will run parallel and will be buried in a common trench for the majority of the pipeline route. At the port and plant locations, each line will be routed separately to their respective facilities. The concentrate transportation system is designed to transport magnetite concentrate slurry from the process plant to the concentrate filter plant at the port. The main pump station will be located in the process plant area. The system will include a single, intermediate choke station located at km 65 at an elevation of 448 masl. A terminal choke station will be located at the concentrate pipeline termination at the port to dissipate the high pressure from the magnetite concentrate pipe and will allow a smooth discharge of the slurry into the port slurry storage tank. At the highest point along the pipeline profile, a monitoring station will be installed to manage the internal pipe pressure and to maintain optimal flow conditions in the concentrate pipeline (e.g. avoid slack flow). A drain station at the lowest point along the pipeline profile (at km

Santo Domingo Project Region III, Chile
NI 43-101 Technical Report
Page 18-11
March 2020
Project Number: C40029
36.10 and 418 masl) will be installed allow drainage of the concentrate pipeline. The drain, choke and terminal stations will each have emergency ponds. The electrical power supply for the concentrate pump station will be provided from the electrical system at the plant site. The electrical power supply for the terminal station at the port will be provided by the port electrical system. Process control for the concentrate transportation system will be by a dedicated, independent control system, connected to the main process control system (PCS).
18.7 Building Infrastructure
The buildings required at the port, mine and plant site are summarized in Table 18-1. Capstone will provide building and maintenance areas to be used by service contractors for plant and mobile equipment maintenance. The areas will include provision for mine trucks and equipment, light vehicles, a mine truck wash bay and tyre shop, a welding shop, spare parts storage area, offices, maintenance dining room and a change house. The heavy vehicle work shop building will have service bays for mobile mine equipment, light trucks, mine trucks and tracked vehicles for maintenance and routine servicing. Mine equipment maintenance will be done under a MARC contract for the first 5 years; after that Capstone will carry out its own maintenance. The warehouse area will consist of two buildings and four open areas for general, lubricant, reagent and gas bottle storage. Accommodation for construction and operations personnel will be in one camp at the mine site using temporary units to increase the capacity during construction. These units will be removed when construction is complete. The planned location of the camp is 2.5 km from the mine and process area. During construction the camp will have capacity for up to 3,100 beds (including 307 beds for operations staff). The proposed permanent camp will accommodate approximately 500 people. There is no plan to retain the construction camp once operations start. For ongoing construction and maintenance activities, it is planned to accommodate personnel in off-site accommodations in Diego de Almagro or other nearby locations. Ancillary infrastructure will include fire protection, compressed air systems, dust control and solid waste management facilities.

Santo Domingo Project Region III, Chile
NI 43-101 Technical Report
Page 18-12
March 2020
Project Number: C40029
18.8 Port
The proposed port, Puerto Santo Domingo, will be located in the Punta Roca Blanca area, which is located between Caleta Hornos and Punta Choros, in the Atacama Region. Table 18-1: Mine and Plant Site Buildings
Area Building Comment
Mine and plant site
Administration Office, lunch room, control gate, access guard house
Operations Process plant control room and dispatch office, change house and training building, dining room for process plant and mine
Contractors Lubricants shop, scheduled maintenance workshop, two workshops, change house
First aid and emergency
Offices, training room, examination rooms, a bathroom and a roofed area for the ambulance
Maintenance Mechanical maintenance, welding, warehouse and offices
Assay laboratory Offices, sample preparation area, wet laboratory and service facilities and an open sided, roofed area for sample storage
Primary crusher Work space, local control room, washrooms, services Mine truck operators Lunchroom space
Port
Port office Police, customs, SAG and marine services Port operations Offices, control room and laboratory building Change house Lunchroom Workshop and warehouse
Mechanical, electrical and instrumentation maintenance, warehouse and offices
Access control Magnetite filter Copper concentrate storage
Desalination plant
Based upon current Capstone concentrate production requirements, the maximum required annual port capacity is 5.5 Mt/y of magnetite concentrate and 0.52 Mt/y of copper concentrate. It is planned to ship magnetite concentrate using a mixture of

Santo Domingo Project Region III, Chile
NI 43-101 Technical Report
Page 18-13
March 2020
Project Number: C40029
Panamax- and Cape-size vessels. Copper concentrate will be shipped using Panamax- and Handymax-size vessels. Wood recommends that Capstone commissions a field data collection program to establish the site-specific sea conditions for the Santo Domingo port. Further berth alignment analysis is required to estimate port availability for ship-loading operation and its impact on the upstream operation. Based on this information, dock design and concentrate loading and storage arrangements should be further optimized. Consideration should also be given to reviewing the potential impact of the port non-availability on the shipping concentrate scheduling during the winter season.
18.9 Power and Electrical Facilities requiring power will be located at the following sites: Mine and plant site located near Diego de Almagro: includes the mine, process
plant, infrastructure and tailings facility electrical loads Santo Domingo Port at Punta Roca Blanca: includes the desalinated water pump
station and desalination plant (these are excluded from the electrical load as the costs are included in the unit cost of desalinated water), magnetite concentrate filtration plant, concentrate storage and handling and associated infrastructure.
The total maximum (peak) demand during operations estimated to be approximately 112 MW (excluding the desalinated water system). The estimated average demand during operations will be approximately 85 MW. Capstone’s mine site and port site will be connected to the Chilean national grid (Sistema Eléctrico Nacional or SEN). The closest connection point to the mine site is at the Diego de Almagro substation located about 9 km from the mine area; the closest connection point to the port is at the Totoralillo substation about 14 km from the port area. There are no concerns that the Chilean national grid system can provide a firm and continuous supply for the operation’s electricity requirements. Capstone has entered into a long term power purchase agreement (PPA) with a leading power company operating in the national grid system and supplier to several major mining companies in Chile. This is consistent with the strategy used by other mining companies to contract for the long-term supply of electricity in Chile. The terms and conditions of the PPA are considered customary and competitive in the Chilean electrical market.

Santo Domingo Project Region III, Chile
NI 43-101 Technical Report
Page 19-1
March 2020
Project Number: C40029
19.0 MARKET STUDIES AND CONTRACTS
19.1 Market Capabilities
Capstone currently markets copper concentrate from its mining operations and has established a reputation as a reliable supplier. Capstone has existing commercial sales contracts and operates under current commercial terms. In addition to the current Asian markets used by Capstone, smelters in Chile are available for sales contracts. Capstone staff and experts retained by Capstone provided information related to the metal pricing for copper, treatment and refining charges and iron ore concentrate (62% Fe content sinter fines). Capstone maintains and publishes a Strategic Resource Planning Guidance; this was provided to the QPs. Capstone’s Marketing Group is experienced and capable of establishing and implementing a marketing strategy that will provide offtake agreements with favourable NSRs and benefit all stakeholders.
19.2 Copper Concentrate Market
Beginning in 2000. and continuing through to 2017, China became an increasingly important factor in the demand for raw material feed in the form of copper concentrate and as a consumer of the refined metal. Copper concentrate imports to China have gone from practically zero in 2000 to 17.35 Mt in 2017. China now consumes 48% of the world’s refined copper. Chinese smelting/refining capacity continues to increase with 1.1 Mt of refined metal capacity to be commissioned over the next 1 to 2 years. This alone will increase the demand for copper concentrate by 4 Mt annually. Overall, global market forecasts are for a compound annual growth rate (CAGR) of 2% or higher. Refined copper is a key determinant in the growth of developed and developing nations. Copper smelters are located in various regions; however, the majority are in Asia. All the smelters are accessible from Chile, but logistic costs are a significant factor in determining which smelter location will result in the best long-term offtake arrangements, hence providing the best returns. Secondary considerations are the possibility of linking offtake agreements to financing arrangements and strategic diversification. Potential smelter counter parties for direct sales contracts include:
Santo Domingo Project Region III, Chile
NI 43-101 Technical Report
Page 19-2
March 2020
Project Number: C40029
Domestic: Chilean smelters (Codelco’s Potrerillos; Enami’s Fundición Hernán Videla Lira (formerly Paipote)).
Export: Brazil (Caraiba) Germany, Sweden, Bulgaria, Spain (Aurubis, Hamburg; Aurubis, Pirdop; Boliden,
Ronnskar; Freeport, Huelva) China Various (Jiangxi, Tongling, Jinlong, Daye, XGC, Jinchuan, Yunnan) Japan (Saganoseki, Naoshima, Onahama, Niihama, Hibi) Korea (LS Nikko) Philippines (PASAR) India (Hindalco, Birla; Vedanta, Sterlite; Adani, Gujarat).
Geographic diversification provides some risk reduction in a marketing strategy, although other factors such as credit risk and performance risk must also be considered. It is expected that the emphasis for direct sales agreements will be placed on Asian smelters unless finance-linked contracts are available.
19.2.1 Supply
Current mine supply is considered inadequate to meet demand over the foreseeable future due to falling ore grades at maturing and depleting mines and not enough capital being expended to fill the gap. Capital expenditures for new copper mines and expansions to existing mines has dropped 60% globally over the last 5 years. The lack of spending relative to projected future demand has occurred primarily because copper prices have been too low relative to project hurdle rates in an environment of rising risks (water supply, more stringent environmental regulations, energy costs, political stability and resource nationalism). Current mine supply is set to decline by almost 5 Mt through 2030 even when including projects under construction. It is estimated there are 250 projects globally with nearly 17 Mt of potential output. Of these, it is estimated that only about 6 Mt of the potential supply is viable; only just offsetting the decline in baseline copper supply over the period to 2030 with additional production of about 1 Mt. Copper prices need to rise to $7,500/t ($3.40/lb) in today’s dollars over the long-term ($8,280/t or $3.75/lb in 2023 dollars) in order to incentivize sufficient copper supply.

Santo Domingo Project Region III, Chile
NI 43-101 Technical Report
Page 19-3
March 2020
Project Number: C40029
Global mine production is set to increase beyond 2018, but not sufficiently to meet the expected demand. New projects (Cobre de Panama, Michiquillay, Quellaveco, Spence, Quebrada Blanca and Kamoa–Kakula) will address some of the future demand. However, the copper price has not reached a level needed ($3.40/lb) to provide companies with the confidence to invest in additional mega-projects. The economics for smaller mines with lower capital costs can be quite different from the economics for the large mines. In the meantime, established and maturing mines are facing declining production due to falling head grades. In major producing areas, potential hurdles for new projects or brownfield expansions are water supply, more stringent environmental regulations, political stability and resource nationalism.
19.2.2 Demand
China remains the key contributor to the forecast growth in copper consumption through 2030. Global industrial production (IP) growth is forecast to be 2.5% per year through 2030. This suggests a 1.5% per year growth in copper demand through the same period (China accounts for approximately 40% of this growth). At a 1.5% copper growth rate, copper demand is expected to grow by 4.5 Mt through 2030. Renewable energy infrastructure is the single biggest driver of global copper demand growth over the coming years. The need to connect significant numbers of small-scale electricity generation units into the grid provides a major boost to copper (solar generation capacity is set to triple and wind generation capacity is set to double by 2025). The shift to areas such as offshore generation will further increase the demand for copper. Growth from the electric vehicle segment (cars and charging infrastructure) is small, but not insignificant. Growth in electric vehicle production has exceeded previous expectations with China accounting for much of the growth but the western world manufacturers are gearing up for significant production post-2020. The growth in electric vehicle production is expected to increase copper demand by 1.3 Mt/y by 2025.
19.2.3 Supply/Demand Gap
A shortage of copper is inevitable over the period to 2030. Potential mine expansions will only cover the loss in production from maturing mines.
Santo Domingo Project Region III, Chile
NI 43-101 Technical Report
Page 19-4
March 2020
Project Number: C40029
Growth in demand could subside for a period of time but it is considered unlikely even with the current tariff/trade disputes initiated by the current USA government. Substitution could occur to some degree, e.g. aluminum for medium-voltage wiring. The supply/demand gap will naturally rise over time. Over the period to 2030, an average annual supply gap of just over 5 Mt is predicted. Given that deficits of this level do not (and cannot) occur in commodity markets, prices will rise to incentivize projects to fill the gap. Figure 19-1 shows the estimated copper market balance to the year 2030.
19.2.4 Price Projections
It is difficult to project prices as far out to 2030. A 14% drop in the copper price in the June–July 2018 period was not anticipated by the analysts. Long-term price forecasts must consider the following: The need for miners to make a return in order to invest to replace their base
production; this requires price growth to outpace the marginal cost growth A draw down in inventories The need for prices to be high enough over the long term to fill the 2025 to 2030
gap. The global copper supply/demand forecast and price forecast from 2018 to 2030 is provided in Table 19-1. Mine concentrate production will continue to increase based on analysis of projects recently commissioned, under construction, recently announced (e.g. Quebrada Blanca 2) and in the planning stages. Combined with announced production forecasts of existing mines, total copper concentrate supply is calculated. Solvent extraction/electro-winning (SX/EW) copper production is added to determine total copper units available for the market. Historically, production forecasts have an error of approximately 5% due to unexpected and unplanned events such as labour strikes, natural disasters, pit wall failures or milling equipment failures. On the consumption side, smelter production is forecast based on historical operating rates. The difference between the supply and the demand provides a view of the market and whether it is in surplus or deficit. The forecasts in Table 19-1 indicate a relatively balanced market through 2022 with small annual deficits. However, the impact of the small deficits over this period will be a reduction in global stocks.
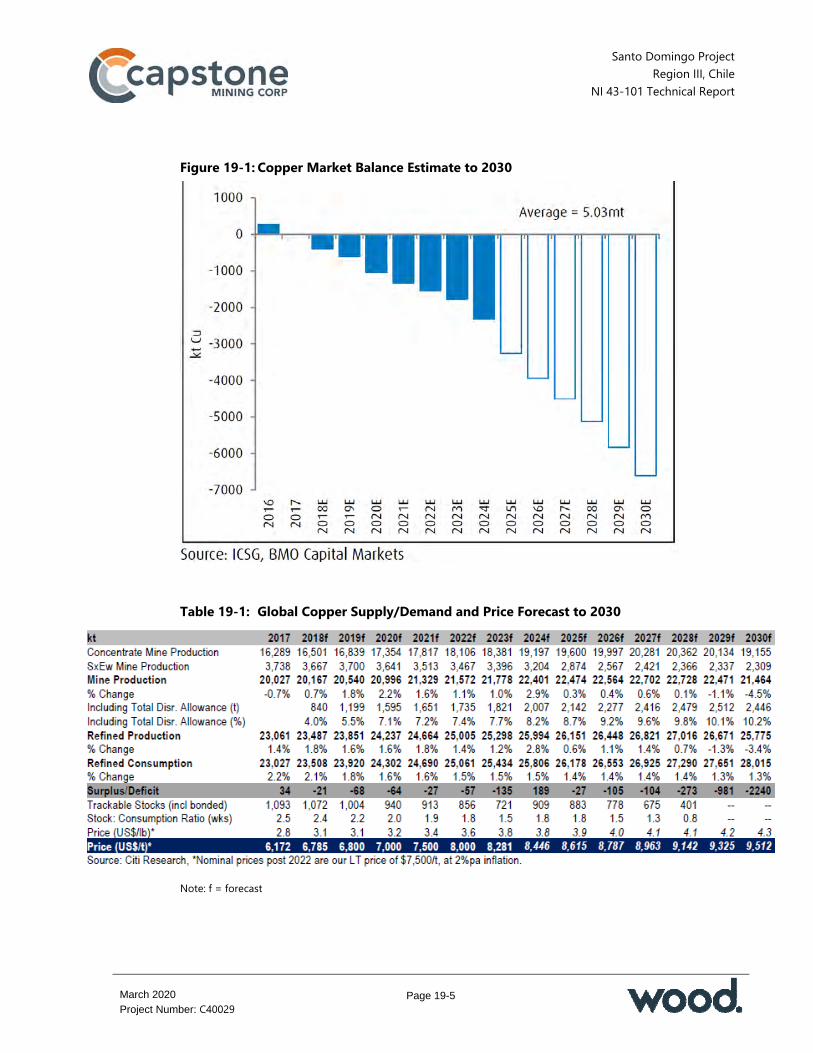
Santo Domingo Project Region III, Chile
NI 43-101 Technical Report
Page 19-5
March 2020
Project Number: C40029
Figure 19-1: Copper Market Balance Estimate to 2030
Table 19-1: Global Copper Supply/Demand and Price Forecast to 2030
Note: f = forecast
Santo Domingo Project Region III, Chile
NI 43-101 Technical Report
Page 19-6
March 2020
Project Number: C40029
Historically, as global stocks approach two weeks consumption levels, prices tend to rise. It is forecast that the incentive price of $3.40/lb will materialize 2021, after which additional projects will be announced but these will take some years to permit and build.
19.2.5 Treatment and Refining Charges
Treatment and refining charges reflect the general status of the supply/demand balance of copper concentrate. Traditionally, the annual benchmark terms have been the guideline for individual producers to establish terms with their smelting counter parties. This process is breaking down and more producers are aligning with counter parties to establish distinct terms on the basis of agreed value propositions. For smelters there is generally a preference for terms fixed for a period of a year to provide stability in their income stream. Many miners are willing to establish some or all of their terms on this basis. However, this practice does not provide flexibility to pursue terms where more value can be added through value propositions. Thus, it is difficult to predict TC/RCs on a longer-term basis. Currently, the average Chinese copper smelter requires a TC/RC of $65/6.5 cents to break even. By-product credits and currency exchange rates also affect the profitability. Given that the analysis of concentrate supply/demand shows a shortage of concentrate in the future, it is reasonable to forecast lower TC/RCs. However, moving from a relatively balanced market in 2017 and 2018, where benchmark TC/RCs were agreed at $82.25/8.225 cents, 2019 benchmark terms have been agreed at $80.80/8.08 cents, recognizing that the concentrate is expected to move to a deficit. Potentially, a deficit of only 2 Mt could push TC/RCs well below the smelter breakeven point. If the deficit continues for an extended period of time, the result could be the closure of some higher cost smelters which would lead to even higher copper prices and also higher TC/RCs as the market seeks an equilibrium state. Longer-term TC/RCs of $75/7.5 cents are considered reasonable given that this provides smelters with an operating margin and still reflects a market that will be in deficit for a period of time.
Santo Domingo Project Region III, Chile
NI 43-101 Technical Report
Page 19-7
March 2020
Project Number: C40029
19.3 Copper Concentrate
19.3.1 Santo Domingo Likely Product Specifications
For the purposes of assessing the marketability of the copper concentrates, Capstone supplied the analysis of the copper concentrate specifications in Table 19-2.
19.3.2 Deleterious Elements and Penalties in Copper Concentrates
China has strictly controlled the import of copper concentrates with specified limits on certain deleterious elements, imposing a ban on the importation of materials containing more than (any one element) 0.5% arsenic (by weight) per dmt (of copper concentrate), 6% lead per dmt, 1,000 ppm fluorine per dmt, 500 ppm cadmium per dmt and 100 ppm mercury per dmt. China is the world’s single largest (by tonnage) consumer of seaborne copper concentrates, hence any copper concentrate containing levels in excess of the above limits will be placed at a significant disadvantage in terms of its marketability and therefore is likely to be discounted heavily compared to ‘clean’ copper concentrate market terms. Given the expected qualitative analysis for the concentrate to be produced, the Santo Domingo concentrate would be considered a “premium” concentrate in the international smelter market. The concentrate is expected to have a higher than average copper content (30%) with no appreciable deleterious elements. Chlorine and fluorine are under the limits at which penalties are normally applied and if they are occasionally over the limit it is likely that only a nominal penalty would apply. The copper concentrate market is a global market. A large secondary market exists in the form of commodity traders (in excess of 17 Mt copper concentrate annually). Commodity traders can provide better net terms than smelters. Additionally, commodity traders provide more flexibility as they can deliver to numerous locations.
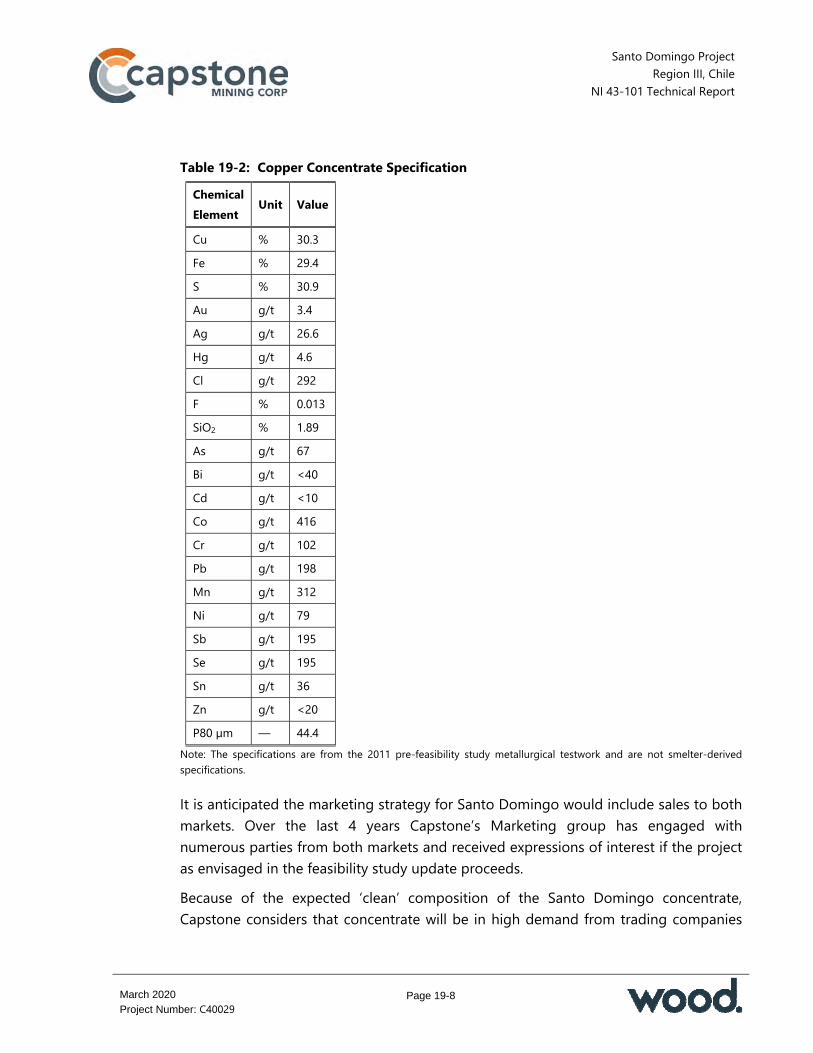
Santo Domingo Project Region III, Chile
NI 43-101 Technical Report
Page 19-8
March 2020
Project Number: C40029
Table 19-2: Copper Concentrate Specification Chemical Element Unit Value
Cu % 30.3 Fe % 29.4 S % 30.9 Au g/t 3.4 Ag g/t 26.6 Hg g/t 4.6 Cl g/t 292 F % 0.013 SiO2 % 1.89 As g/t 67 Bi g/t <40 Cd g/t <10 Co g/t 416 Cr g/t 102 Pb g/t 198 Mn g/t 312 Ni g/t 79 Sb g/t 195 Se g/t 195 Sn g/t 36 Zn g/t <20 P80 µm — 44.4
Note: The specifications are from the 2011 pre-feasibility study metallurgical testwork and are not smelter-derived specifications.
It is anticipated the marketing strategy for Santo Domingo would include sales to both markets. Over the last 4 years Capstone’s Marketing group has engaged with numerous parties from both markets and received expressions of interest if the project as envisaged in the feasibility study update proceeds. Because of the expected ‘clean’ composition of the Santo Domingo concentrate, Capstone considers that concentrate will be in high demand from trading companies
Santo Domingo Project Region III, Chile
NI 43-101 Technical Report
Page 19-9
March 2020
Project Number: C40029
specializing in blending complex materials with clean materials. This high-quality concentrate is highly sought after by smelters and traders.
19.3.3 Marketing Strategy
Copper concentrates can be sold under a number of different agreements, including long-term offtake agreements or frame contracts, mid-term agreements or mid-terms, evergreen and spot contracts and trader offtake agreements. Copper concentrates when delivered to end users are sold based on a payment which is the sum of the addition of all the component ‘payable’ metals (copper, gold, silver and sometimes platinum and palladium) less the sum of the TCs, less the sum of the RCs for copper, silver and gold, less the sum of any penalties and discounts. The amount of payable metal and TC/RCs vary from contract to contract. Copper content is paid for at 96.5% of the full and final assayed quantity (after final assays are agreed), but this would typically be subject to a minimum deduction of one unit of copper. For all practical purposes if the copper content drops below 28.59% in the concentrate, the payable copper will be the copper content less one unit (e.g. if the copper content is 28% the amount payable would be 27% (i.e. 28 - 1)). The price paid for the copper content is usually an averaged price based on a quotation period of the London Metal Exchange (LME) quoted cash copper settlement price (i.e. the seller’s price of copper at the midday close on the LME) on each day during the average period. For precious metal payments there are two different methods commonly used to determine the payable quantities: Asian-style pricing: silver is paid for at 90% of the full and final assayed quantity of
the silver, provided that the silver content is above a minimum of 30 g per dmt. Below this threshold, silver would not normally be payable. Gold is payable on a percentage based on a sliding scale of the full and final assayed quantity, provided that there is a minimum of 1 g per dmt of gold contained. Below this threshold, gold is not payable.
European-style pricing: silver is payable on the full and final assayed quantity of silver less a deduction of 30 g. Any content below 30 g per dmt would not be payable. In higher silver content concentrates, there is often a deduction of 50 g per dmt instead of 30 g per dmt. Gold is payable on the full and final assayed

Santo Domingo Project Region III, Chile
NI 43-101 Technical Report
Page 19-10
March 2020
Project Number: C40029
quantity of gold less a deduction of 1 g per dmt. In concentrate containing less than 1 g per dmt there would be no payment.
Another variation on the actual price paid for each metal (copper, silver and gold) occurs when copper concentrates are exported to the United States. Prices paid for the payable metals are based on the Comex (the New York Mercantile Exchange’s Commodity Exchange division) traded first position (essentially the spot month). This is only used for concentrate delivered from overseas to, or internally within, the United States. Copper concentrate long-term frame contracts are typically highly sought after by smelters. Smelters, especially in China, have been operating at well below capacity. Over the last decade spot TC/RCs for concentrate supply have been running at a discount of $15 to $20 to the long-term contract rates. There is a trend in worldwide concentrates to a higher average arsenic content. The trend is partly a result of general trends in large orebodies currently being mined but is also due to higher commodity prices for contained copper, gold and silver in concentrates. This results in many high arsenic mines (e.g. in Peru, Mexico, the Philippines and Bulgaria) continuing production, despite very high penalties for the arsenic content of the concentrates produced relative to the clean concentrate market.
19.3.4 Concentrate Marketing Assessment
It is expected that the copper concentrate produced will have a low gold content (around 3 g per dmt) and a low silver content (around 27 g per dmt). As a result, there will be considerable value to pricing the material on an Asian-style basis as opposed to a European-style pricing. This will be accentuated when, occasionally, the silver content rises above 30 g per dmt. If this percentage is payable using European terms the payment will be very low, but with Asian terms over 89% would be payable. A number of factors must be taken into consideration when assessing the best contract partners for Capstone on a long-term basis. Factors such as freight, assay bias, geographic location and contractual party reliability must be considered. The normal contract split for mines of the proposed size of Santo Domingo are: 60% to 70% on long-term frame contracts with four or five major smelters 10% to 20% to traders on 3–5 year fixed TC/RCs or TC/RCs to be negotiated
annually
Santo Domingo Project Region III, Chile
NI 43-101 Technical Report
Page 19-11
March 2020
Project Number: C40029
20% to 30% spot contracts for up to 1 year with traders at fixed terms. Long-term contracts should be adjusted to incorporate the high copper concentrate production in the first years of operation and the gradual decline in copper concentrate production thereafter. Consideration must also be given to the terms and timing of the contract renewals so that renewals do not all occur at the same time. The timing to secure sales contracts is dependent on the progress of arrangements for project financing. It is likely that banks or financial institutions will want to have signed letters of intent (LOIs) or memorandums of understanding (MOUs) from smelters initially, followed by full long-term contracts as a condition of the completion of the project financing.
19.3.5 Logistics
It is planned to ship the copper concentrate from a northern Chilean port. However, due to the low monthly shipment tonnages (approximately 30,000 t to 50,000 t per month) and storage facilities (40,000 wmt storage) most of the shipments will be made using Handymax vessels (30,000 wmt to 45,000 wmt carrying capacity) or Panamax vessels (up to 80,000 wmt but limited to 52,500 wmt if using the Panama Canal). Ocean freight rates are primarily driven by two factors; energy (fuel) costs and the supply/demand of vessels. It is almost certain that fuel rates for vessels will rise post-2019 due to the International Maritime Organization (IMO) requirement that vessels burn low sulphur fuel or install scrubbers to process the engine exhaust. For the period January 2016 to January 2018, time charter rates for Supramax vessels (the primary type of vessel used in transporting copper concentrate) have risen almost 60% from $7,000 per day to more than $11,000 per day. Currently there is an adequate supply of vessels and new builds are effectively replacing scrapped vessels. The dry bulk market is expanding at about 3% per year. However, currently order books are thin as current freight rates do not provide an incentive for owners to expand their fleets beyond replacement. If this scenario continues, an annual increase of 5% in freight rates is expected. An escalated price of $40/dmt was used in the economic analysis in this Report, anticipating price escalation and the uncertainty of the new sulphur regulations.
Santo Domingo Project Region III, Chile
NI 43-101 Technical Report
Page 19-12
March 2020
Project Number: C40029
19.4 Iron Concentrate
Magnetite concentrate fines with high iron content (Fe >65%) will be produced for shipment overseas in Cape-sized vessels to iron and steel makers. Capstone contracted CRU in 2014 to supply a report on marketability and price projections for iron ore concentrate (62% Fe content sinter fines). Capstone also contracted CTAG in 2014 to comment on the general aspects of the iron ore business, background information, pricing structure, revenue expectations based on a CRU report, weighing and sampling and freight. In order to supplement the previous information on the international market for the Santo Domingo iron ore concentrate, Capstone contracted the following: Mr. David Trotter, global iron ore and commodity marketing consultant, who
prepared a study entitled “Pellet Feed Market Characterization and Forward Pricing Outlook” for Capstone, dated September 2018.
Braemar, who prepared a study entitled “Very Large Ore Carrier (VLOC) Review”, for Capstone, dated 24 October 2018.
The Trotter (2018) forward pricing report prepared for Capstone estimated that prices for 62% Fe content sinter fines (Platts Iron Ore Index or IODEX) cost-and-freight (CFR) Qingdao delivery (deemed the standard product for CFR China delivery) can be expected to be in the range of $62/dmt to $72/dmt over the next 10 years. This study is based on a long-term price of $69/dmt for 62% Fe concentrate. Premiums for 65% Fe concentrate ($24/dmt), value-in-use (VIU) for 66% Fe ($1.50/dmt), magnetite content ($2.50/dmt) and low alumina ($7/dmt for each 1% below 2.5%) are expected to remain relatively stable because of the direct impact on furnace productivity and decrease in emissions. This study discounted the current premiums to approximately 80%. Braemar conducted a long-term estimate of shipping costs to include new construction and new environmental regulations on sulphide emissions. Long-term contracted prices are expected to drop from the current spot market price of $20/dmt to below $15/dmt. This study has assumed a long-term shipping cost of $20/dmt. The net result is a price of $80/dmt free-on-board (FOB) Chile.

Santo Domingo Project Region III, Chile
NI 43-101 Technical Report
Page 19-13
March 2020
Project Number: C40029
19.4.1 Iron Ore Market
Iron ore is globally traded with hematite (Fe2O3) and magnetite (Fe3O4) ores making up the vast majority of the world seaborne trade with most of the supply coming from South America and Australia. Iron ore is used either in a blast furnace or in a direct reduction furnace to make metallic iron for use in steelmaking. Globally and in the key import markets, over 75% of steelmaking plants use hot iron from a blast furnace. The input of iron into the blast furnaces can be in the form of pellets (agglomerated fine pellet feed from a pellet plant), lump (naturally occurring agglomeration) and sinter fines (agglomerated coarser iron ore fines in a sinter plant). Steel production dictates the demand for iron ore. Global steel production in 2017 was 1.69 billion tonnes (Trotter, 2018). In 2018 global steel production is forecast to be 1.75 Bt. Seaborne trade of iron ore in 2017 was 1.47 Bt. The iron ore seaborne trade is forecast to grow in excess of 2% annually. Globally, basic oxygen furnace (BOF) steel production is growing at a rate of just under 1% per year and electric arc furnace (EAF) production is growing at a rate of 4.4% per year (Trotter, 2018). China dominates the global production of steel and thus the consumption of iron ore. China produced 831 Mt of steel in 2017. Other top producers in 2017 were Japan at 105 Mt, India at 101 Mt and South Korea at 71 Mt. Asian steel producers face increasingly stringent environmental regulations to limit emissions. This is most evident in China. Despite the limited growth in steel demand in China, the demand for pellet feed is expected to be strong and the dominant growth segment in the iron ore market. This is being driven by the changes in requirements in China which include: Environmental restrictions on new blast furnace construction Environmental restrictions on new sinter plant capacity Improving efficiencies in blast furnaces to 90% Lack of high-grade domestic pellet feed as average grades decline New large-scale pellet plants in China Higher margins for high quality steel Increasing use of pellet feed in sintering
Santo Domingo Project Region III, Chile
NI 43-101 Technical Report
Page 19-14
March 2020
Project Number: C40029
Changing individual customer demands and technical limits. These factors are inter-related and are expected to raise steel making efficiencies from 82% in 2017 to finally around 90% by 2026. Pellet consumption in blast furnaces has risen from 250 kg/t hot metal in 2014 to current level of 285 kg/t of hot metal and is forecast to be in excess of 300 kg/t of hot metal by 2022. Global demand for iron ore pellet feed is expected to increase from 416 Mt/y to 655 Mt/y in 2027 (Trotter, 2018).
19.4.2 Pellet and Pellet Feed Supply and Demand Summary
The pellet and pellet feed supply and demand summary are shown in Figure 19-2. 19.4.3 Pricing of High-Grade Iron Ore Fines (>65% Fe)
The price of iron ore is widely accepted as the 62% Iron Ore Index as reported by price reporting companies in dollars per dmt. In 2016 the price range variability was 112% and in 2017 the price range variability was 78%. To July 2018 the price range variability has been only 26%; this represents a decrease in volatility (Trotter, 2018). In 2018 at the same time as reduced variability, the price of higher-grade iron ores (as represented by the Platts and Metal Bulletin 65 Iron Ore Index) has increased relative to the 62 Iron Ore index with a large price differential of $28 per dmt. This premium is expected to persist for higher-grade material. This premium is large relative to the base price of iron ore and higher than the incremental correction for iron content. Currently, the differential is more than 30% above the simple iron value correction. The premiums and discounts for 58–62% Fe and for 65–62% Fe are shown in Figure 19-3. The premium should be considered a major part of any price forecast for iron ore products including pellet feeds. This has been mirrored to an extent by the low-grade ore index; the low-grade ores are under reduced demand and are increasingly being blended with high-grade ores. In order to forecast the value of this premium over the next 10 years, assuming that the major factors remain, the other drivers will be coking coal cost (the other major steelmaking cost) and steel margins.
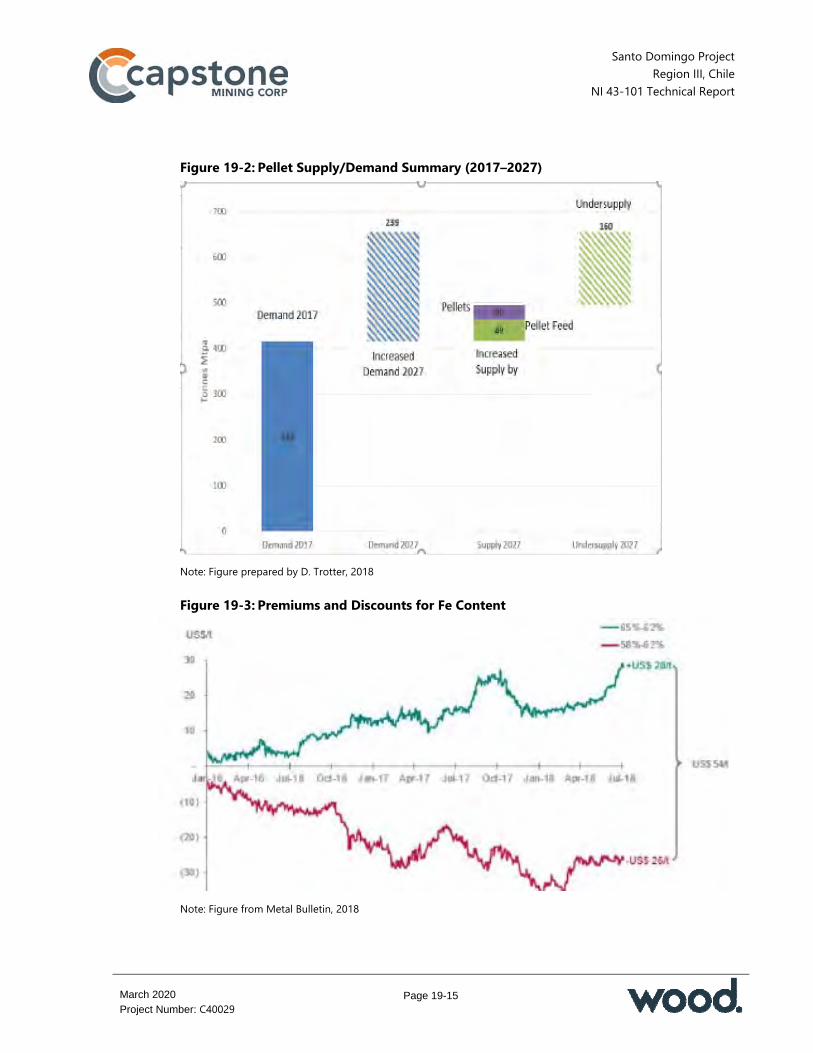
Santo Domingo Project Region III, Chile
NI 43-101 Technical Report
Page 19-15
March 2020
Project Number: C40029
Figure 19-2: Pellet Supply/Demand Summary (2017–2027)
Note: Figure prepared by D. Trotter, 2018
Figure 19-3: Premiums and Discounts for Fe Content
Note: Figure from Metal Bulletin, 2018

Santo Domingo Project Region III, Chile
NI 43-101 Technical Report
Page 19-16
March 2020
Project Number: C40029
Using iron-making models it is possible to predict the scenarios which would affect the premium. Assuming a steel margin in the range $30/t to $100/t and a derived coke price between $170/t and $260/t the scenarios show a long-term premium between $19 and $33. This corresponds to a midpoint of $26/t which can be used as a base for forecasting for the remaining 2018 and 2019. This is a large percentage of the 65% Iron Ore Index price component which is expected to remain disconnected from 62% Iron Ore Index for the period 2020 to 2027. Table 19-3 shows the price forecast for Santo Domingo pellet feed CFR China for 2018 to 2027. The limits on alumina also help to drive up the premium for ores above 65% Fe because by mass balance the total oxides should be less than 6.0%. Three of the top four iron ore suppliers (BHP, Rio Tinto, FMG) have increased alumina from an average below 2% to a combined average of 2.35% in 2018 whilst maintaining an average silica content of 4.5%. These suppliers account for 650 Mt/y of the iron ore supply and 68% of the supply to China. Alumina levels are expected to increase with the depletion of the Yandi Mines (dropping from 150 Mt/y to zero over the next 5 years). The market is expected to be alumina-constrained for several years and, given the small impact that low alumina pellet feed will have on a year on year basis, this may continue. Santo Domingo pellet feed would attract the high iron grade premium and a further premium if the alumina content is less than 1% (currently at $7 per 1% of alumina below 2.5%). Further, if Santo Domingo pellet feed maintains a silica content below 5.0% then it would not attract silica penalties in an alumina-constrained market.
19.4.4 Logistics
Because iron ore is a relatively low-value commodity, it is imperative that logistics costs are minimized to protect margins. Typically, this means using very large ore carriers (VLOC) vessels. Based on the analysis undertaken by Braemar, the new class of VLOC (Guaibamax) (325,000 dwt), of which 38 are on order in South Korea shipyards, would be the most suitable and cost-effective vessel for shipping to Eastern Asia. The 400,000 dwt Valemax vessels would also be effective. This does not preclude the use of smaller vessels in the 250,000 dwt to 300,000 dwt range.
Santo Domingo Project Region III, Chile
NI 43-101 Technical Report
Page 19-17
March 2020
Project Number: C40029
Table 19-3: Price Forecast for Capstone Pellet Feed
Note: First row of table, marked with a blue star, sourced from Wood Mackenzie, June 2018. Remaining table information is from Trotter (2018). The table has a typographic error in the row entitled “-1% Yield Adjustment for 80%<0.45 µm”, where the figure 0.45 µm should read 45 µm.
In determining a freight strategy, the following factors need to be considered: Scheduling of shipments and certainty of commodity production Shipment size and discharge port flexibility Freight pricing mechanisms, including fixed and index linked Charterer’s risk appetite Outlook for freight rates Owners hedging positions Counter party risk.
19.4.5 Iron Ore Freight Rates
Over the last 10 years the market has seen extremes for freight rates for Cape size vessels. Brazil to China rates peaked in May 2008 with charter rates equivalent to $109/wmt and in January 2016 the rate for the same route was $5.33/wmt. Given current bunker rates, port charges, vessel values and 60 kt/d load rate with 50 kt/d discharge rate, a projected freight rate of $12.76/wmt was determined for a Chile–China routing. Allowing for inflation and other possible changes in operating
Santo Domingo Project Region III, Chile
NI 43-101 Technical Report
Page 19-18
March 2020
Project Number: C40029
costs a rate of $20/dmt has been considered conservative and appropriate for the feasibility evaluation.
19.4.6 Santo Domingo Iron Ore Concentrate - Specifications
For the purposes of assessing the marketability of the iron ore concentrate, Capstone expects to produce an iron ore concentrate with the specifications shown in Table 19-4. The specifications given in the table are from the 2011 pre-feasibility study metallurgical testwork and are not smelter specifications. The iron ore concentrate that will be produced is a typical pellet feed currently in use in pellet plants. Magnetite is the predominant mineral. The iron grade is high (Fe >65%) and the low alumina (Al2O3) and low phosphorus (P) make the concentrate suitable for most pellet plants. The suitability and demand for this pellet feed should be considered in the context of increasing use of pellets in iron making, the increased use of higher-grade ores generally and as a premium additive to sinter plants by blending.
19.4.7 Deleterious Elements and Penalties in Iron Concentrates
Each steel mill has different impurity allowances and tolerances. Each is unique in its requirement for feed and will try very carefully to blend the constituent elemental requirements in the iron ore concentrate. However, as a generality, it can be said that most mills prefer SiO2 <3.5%, though in pellet plants this may be as high as 5.5%; Al2O3 <1%; Mn <0.5%; P <0.1%; S <0.1%; Cu <0.01%; and a combined Na2O and K2O <0.5%. The Al2O3 is a cost factor due to its endothermic reaction (and consequent heat absorption cost). Other rarely-found elements in iron ore such as copper are also problematic beyond a certain concentration, but the reality is that copper can often be blended out in the charge feed mix since it is usually only found in trace amounts in most iron ore types. If impurities are higher than the levels discussed, then it becomes more difficult, but not impossible, to place material with mills. The iron ore concentrate specifications and the list of impurities are used by steelmakers to calculate a value in use for each blast furnace and in turn the value of the pellet feed. The main levels of impurities expected in the iron ore concentrate are silica and copper. Copper is expected to be below the threshold but may, in some circumstances, represent a non-preferred feed. Silica is only likely to be a cost factor or penalty element rather than a rejectable quality issue. Silica penalties are variable but would be of the order of $1.50–$2.00/t per each 1% above 3.5%.

Santo Domingo Project Region III, Chile
NI 43-101 Technical Report
Page 19-19
March 2020
Project Number: C40029
Table 19-4: Iron Ore Concentrate Specification Chemical Element Unit Value
Fetot % 66.06 FeO % 23.08 SiO2 % 4.10 Al2O3 % 1.00 CaO % 0.57 MgO % 0.455 P % 0.011 S % 0.020 Cl ppm 60 Na2O % 0.145 K2O % 0.105 Mn % 0.069 Cu % 0.0081 L.O.I % 1,34 >40 µm % 21,3 Blaine cm2/g 1,896
Note: The specifications are from the 2011 pre-feasibility study metallurgical testwork and are not smelter-derived specifications.
China is a silica-impaired destination, as the local ores often have very high levels of silica. Therefore, blending down in China is not readily possible. Some mills will reject material above 6% SiO2, others will reject at higher percentages; there is a very large variance in silica tolerance. Capstone will need to be selective in finding steel mills with the right fit for the Santo Domingo iron ore concentrate. Iron ore in China is normally traded and priced on the basis of 62% Fe content, with premiums paid for higher iron content and discounts for lower iron content.
19.5 Contracts
Kores has the right to purchase up to 50% of the annual production of copper concentrate and iron ore concentrate, leaving Capstone to market and sell the

Santo Domingo Project Region III, Chile
NI 43-101 Technical Report
Page 19-20
March 2020
Project Number: C40029
remaining concentrate. The Kores terms and conditions will reflect the Capstone terms negotiated independently in the market. No contracts are currently in place for Santo Domingo’s production for either the copper or iron ore concentrates. No other contracts are in place.
19.6 Comments on Section 19
In the opinion of the QP, the marketing studies support that there is potential for the sale of the copper and iron concentrates from Santo Domingo as follows: The Santo Domingo copper concentrate would generally be considered clean.
Chlorine and fluorine are safely under the limits and if they are occasionally over the limit it is likely that only a nominal penalty would apply. For trading companies specializing in blending various complex copper concentrates a clean concentrate such as that from Santo Domingo would be in high demand.
It is important that Capstone is ready to enter the market at an early stage to begin the process of finding a partner to buy its ultra-fine iron ore concentrate.
Kores has the right to purchase up to 50% of the annual production of copper concentrate and iron ore concentrate under terms and conditions that will reflect terms negotiated independently in the market by Capstone.
No contracts are currently in place for Capstone’s part of the production for either the copper or iron ore concentrates.
No other contracts are in place. The QP is of the opinion that the marketing studies and metal price forecasts are acceptable for use in the economic analysis in Section 22.

Santo Domingo Project Region III, Chile
NI 43-101 Technical Report
Page 20-1
March 2020
Project Number: C40029
20.0 ENVIRONMENTAL STUDIES, PERMITTING AND SOCIAL OR COMMUNITY IMPACT
20.1 Baseline Studies
Baseline studies were conducted between 2007 and 2013 for the environmental characterization to support the Environmental Impact Assessment (EIA) for the four areas defined for the planned mining operations. Completed studies include: Physical environment (climate, meteorology) Air quality Noise Natural hazards Soils Hydrology/hydrogeology Fauna Flora Port area (setting, tides, chemical and marine environments) Human environment (setting, heritage, archaeology) Paleontology Visual landscape. The studies noted the following: Water: The only active superficial riverbed is the El Salado River, which has been
altered and impacted through anthropogenic activities related to historical mining. There are no exploitable ground water systems in the area. No impacts to water resources are anticipated, because the operation will use desalinated sea water for the mining process. Infiltration to ground water is expected to be minimal or zero from WRFs and from the thickened TSF. Contact water generation will be mitigated through engineering design.
Air quality: The Diego de Almagro weather station indicates high levels of PM10 and PM2.5 particulate material (higher than the values established as the annual

Santo Domingo Project Region III, Chile
NI 43-101 Technical Report
Page 20-2
March 2020
Project Number: C40029
average in D.S. 59/1998 Primary Air Quality Standard for PM10 and D.S. 12/2011 Primary Standard of Air Quality for PM2.5). These high readings can be explained by the location of the station close to a major urban area and its geographical position. Capstone has prepared a plan to mitigate the impact of dust and PM2.5 particles in Diego de Almagro.
Human environment: A by-pass of Route C-13 will be built around Diego de Almagro to reduce congestion in the town.
20.2 Permitting
The Santo Domingo operation will include the following process-related works/facilities: Mine–plant area: open pits, waste dumps and tailings facility, crushing, copper
concentrate production and magnetite concentrate production, copper concentrate filtration; camp, services support (guard house, lunchrooms, first aid facilities, temporary and permanent waste storage), power distribution, roads (internal, mining and access) and modifications of public roads and power lines
Pipeline area Port area: magnetite concentrate filtration, storage of copper and magnetite
concentrates, conveying and ship loading of concentrates, desalination system Power transmission line area: transmission lines to supply power to the mine site
and port. About 140 works and installations were identified, distributed between the four areas. The number of permits required for all facilities is estimated to be about 700 in total, with the majority (about 60%) related to the mine and plant area. Permits that have been classed as critical to ensure that timely construction and start-up of are summarized in Table 20-1. Capstone has organized the permits in a Permitting Matrix (updated in November 2019) that will facilitate management of the status and assignment of responsibilities. During the update of the Permitting Matrix, strategies were identified to reduce the risk of delays in the preparation and submission of submissions for permits.

Santo Domingo Project Region III, Chile
NI 43-101 Technical Report
Page 20-3
March 2020
Project Number: C40029
Table 20-1: Critical Permits Critical Permits DIA for Change of Desalination Plant Closure Plan* Santo Domingo Port Maritime Concession* DOP Permit* Public Road Route 13 and Route C-17 By-Pass Access Road Permits Permit for Construction for Fluid Containment over 5 m height or more than 50,000 m3 capacity Tailings Facility Approval* Authorization for Works in a Water Course (DGA Art.294 letter c)) Authorization for Works Modifying a Water Course Sectorial Permit to Discharge into National Waters Health Authority Approval for Brine Discharge Exploitation Method Authorization (Open Pit)* Authorization for a Stockpile or Waste Dump* Construction Permit (IFC (approved for early works December 2019)) Building Permits Final Works Reception Process Plant Operating Permit* Sanitary Landfill Permit Hazardous Waste Area
Note: * These permits have been approved
Capstone has started the sectorial permitting process and has received approvals from Sernageomin for the TSF (February 2019), the process plant (December 2018), WRFs (September 2018), the Mine Closure Plan (July 2019) and the exploitation method permit (May 2018). For the port area, Capstone has received approval for the Maritime Concession permit (September 2015) and preliminary approval for the port infrastructure (September 2018). These approvals are long term and could have delayed construction if not approved. Capstone has submitted other permits for approval that are currently being evaluated by the authorities. These include the TSF approval by the water authority (DGA), road
Santo Domingo Project Region III, Chile
NI 43-101 Technical Report
Page 20-4
March 2020
Project Number: C40029
modification permits and road by-pass agreements with the roads authority (Vialidad) and the construction permit for early works (IFC). The IFC permit application was submitted in July 2019 and approved in December 2019; this is critical for construction of the early works in order to allow preliminary works prior to full construction. The EIA was presented to the authorities in October 2013. The environmental assessment process took 22 months and the RCA was approved in July 2015. A project owner has up to 5 years after the RCA is awarded to initiate construction. Capstone’s RCA would expire in July 2020. The SEA (environmental regulator) requires as a minimum that early works are initiated to retain the validity of an RCA. For Santo Domingo these early works consist mainly of site access from the existing road network and some site grading. A stipulation in the RCA was the completion of a flora and fauna rescue plan prior to any construction work. MSD started this work in 2019 and completed this season’s work, this has allowed MSD to open the site. MSD has completed the engineering and requested construction quotations for the early work and will begin construction in May 2020. This will remove the threat of losing the RCA in 2020. It will be important to continue some work to maintain the RCA valid after 2020. Some of the commitments in the RCA drive the start of the construction or, in some cases, precede the construction permits and must be implemented pre-construction; MSD is complying with these commitments. Other risks for permitting include: Changes or modifications of the project configuration that were not included in the
original EIA/RCA for which new permits may be required Modifications to the existing legal framework that could lead to new authorizations
and/or permits not currently considered. The approved EIA (RCA obtained in 2015) considered the use of sea water for the process and the construction and operation of two small desalination plants, one in the mine and plant area and other in the port area. Later modifications were made to use desalinated water for the process and the construction of one large desalination plant in the port area, as part of a BOOT contract (the desalination plant and the desalinated water pipeline will be constructed and operated by a third party, who will deliver the water to the port and the mine and plant area).
Santo Domingo Project Region III, Chile
NI 43-101 Technical Report
Page 20-5
March 2020
Project Number: C40029
Based on the modification above Capstone prepared an Environmental Impact Statement (Declaración de Impacto Ambiental, DIA). This 2019 DIA describes the location of the new plant in the port area, an increase of water capture flow and water treatment and modifications of auxiliary installations within the port. The 2019 DIA was submitted on 17 September 2019 for evaluation. It is estimated that approval will be received by the end of 2020. This new approval may include additional commitments with which Capstone must comply. Capstone has identified that the installations approved in the 2015 RCA may overlap with new installations belonging to third parties. Modifications may be required to the approved locations for linear works such as the pipeline route.
20.3 Closure Considerations
Six main areas of legislation cover closure: Supreme Decree (D.S.) 132/2004 - Mining Safety Regulation N° 72 D.S. 248/2007 - Regulations for the Approval of Design, Construction, Operation
and Closure of Tailings Deposits Law 20.551/2011 - Regulates the Closure of Mine Sites and Mining Facilities D.S. 41/2012 - Regulation for the Closure Law for Mine Sites and Mining Facilities D.S. 186/2008 - Regulation about Sanitary Conditions and Basic Safety in Sanitary
Landfills Law 19.300 - General Bases for the Environment, amended by law 20.417. Criteria and contents of the mine Closure Plan under Chilean legislation are provided in Law 20.551 and D.S.41/2012. The Closure Plan must cover the mining facilities included on the EIA; this will include the mine site, port, pipeline route and transmission lines. In addition to the EIA closure obligations, Law 20.511/2011 requires the completion of a risk assessment of the physical and chemical stability of the main mine facilities. This risk assessment supports the establishment of the closure measures and the post-closure mitigation and monitoring plan. This risk assessment is confined to health, safety, community/culture and environment, it does not consider operational or financial risks. The guideline classifies mine facilities as follows: main facilities, complementary and ancillary. Mine facilities that remain after closure (TSF, WRFs and open pits) are
Santo Domingo Project Region III, Chile
NI 43-101 Technical Report
Page 20-6
March 2020
Project Number: C40029
classified as main facilities. Complementary facilities include the process plant, pipelines and port facilities. The ancillary facilities include domestic and industrial waste management facilities. Preliminary results indicate that the processed rock material has a low acid generation potential. However, a detailed material geochemistry characterization will be required. Law 20.551 requires the mining company to provide a bond which is calculated based on the closure costs. The state can execute this bond if the mining company does not comply with the closure commitments. The bond is submitted gradually (currently over a period of 15 years) with the amount to cover 20% of the total closure cost submitted during the first year of operation, discounted at a rate defined by the Central Bank of Chile (Sernageomin, 2018). Capstone must apply for a closure permit to the government, the Closure Plan must be submitted and must specify closure measures defined through the risk assessment process and must include an estimate of the closure costs. The Closure Plan must be approved before construction starts and a bond must be delivered to the government of Chile during the first year of operation. The closure phase for the Santo Domingo mine is planned to occur between 2040 and 2042, followed by the post-closure phase. The post-closure phase consists of monitoring and inspection and is scheduled to end by 2047. Landfill monitoring may continue for another 20 years to comply with the Landfill Regulation (D.S. 186/2008 of the Ministry of Health). Capstone developed a Closure Plan following Sernageomin’s Methodology Guide. Closure Plan approval is preceded by obtaining permits for the TSF, process plant, open pits (mine exploitation) and WRF. Capstone has obtained permits these permits. and received approval of the Closure Plan on 25 July 2019 via Exempt Resolution N°1910. Modifications and changes approved by a DIA or an EIA must be included in updates to the Closure Plan.
20.4 Proposed Tailings Storage Facility
The TSF will be located approximately 2 km southeast of the process plant (Figure 20-1), within a basin area having gentle to moderate slopes with an average slope of approximately 6% to the northwest. The area is underlain by the Atacama Gravels and surrounded by ridges of lesser limestone lithologies.
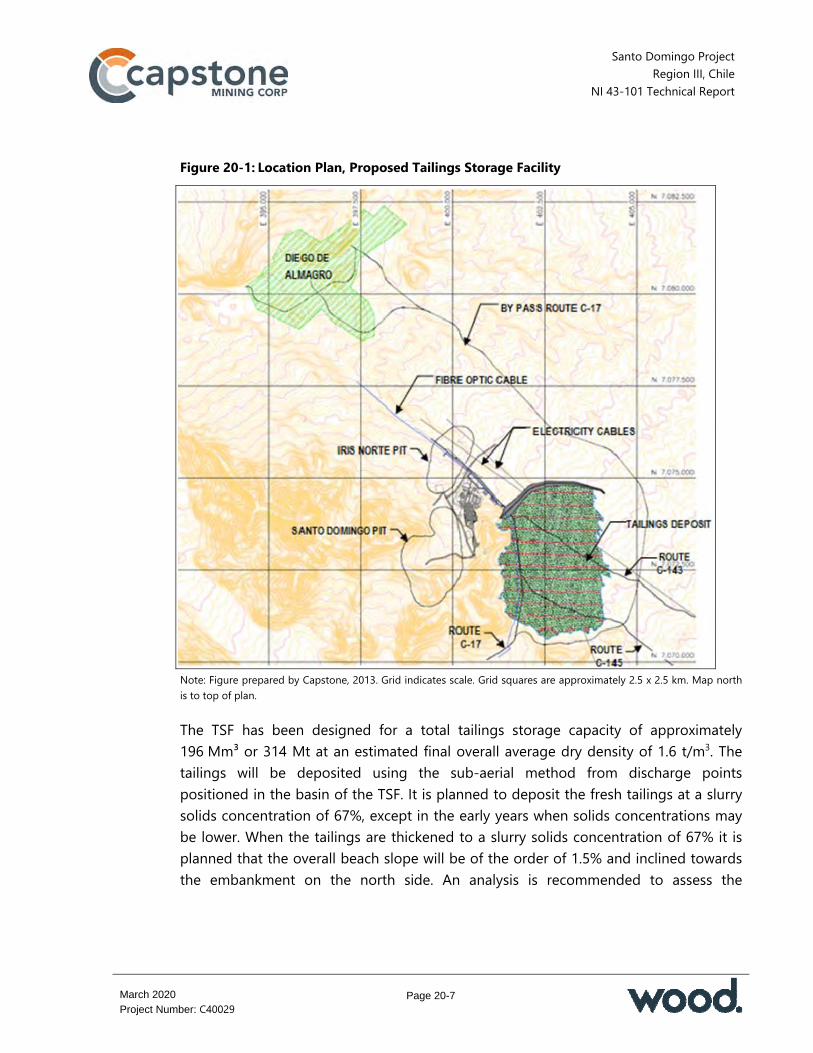
Santo Domingo Project Region III, Chile
NI 43-101 Technical Report
Page 20-7
March 2020
Project Number: C40029
Figure 20-1: Location Plan, Proposed Tailings Storage Facility
Note: Figure prepared by Capstone, 2013. Grid indicates scale. Grid squares are approximately 2.5 x 2.5 km. Map north is to top of plan.
The TSF has been designed for a total tailings storage capacity of approximately 196 Mm³ or 314 Mt at an estimated final overall average dry density of 1.6 t/m3. The tailings will be deposited using the sub-aerial method from discharge points positioned in the basin of the TSF. It is planned to deposit the fresh tailings at a slurry solids concentration of 67%, except in the early years when solids concentrations may be lower. When the tailings are thickened to a slurry solids concentration of 67% it is planned that the overall beach slope will be of the order of 1.5% and inclined towards the embankment on the north side. An analysis is recommended to assess the

Santo Domingo Project Region III, Chile
NI 43-101 Technical Report
Page 20-8
March 2020
Project Number: C40029
sensitivity of the TSF to a flatter tailings slope in the next stage of design with the TSF plans adjusted as needed. Tailings deposition will take place over an 18-year period. In the EIA and sectorial permits, MSD committed to a seepage monitoring plan, a mitigation plan and a contingency plan for the TSF installation.
20.4.1 Main Embankment and Saddle Dam
20.4.1.1 Description The main embankment will consist of an initial starter embankment that will be stage raised by the downstream method. Each stage will have a crest width of 20 m, a 2.5H:1V slope on the upstream face and a 2H:1V slope on the downstream face. Unsuitable foundation material will be removed to an average depth of 2 m below the embankment footprint. It is recommended that future site investigations assess in more detail the soluble salts content within the foundation material to confirm that the recommended 2 m foundation excavations are deep enough to remove any material with excess soluble salts content. The results may require excavation and backfilling to greater depths. The embankment will be constructed with compacted, non-acid generating, mine waste rock. A 1.5 mm thick HDPE geomembrane liner will be installed on the upstream face over a geotextile layer and a 3 m thick layer of fine-grained material that will act as a bedding layer for the liner. A total of 7.7 Mm³ of fill will be placed into the embankment in four planned stages to reach a maximum height of 55.5 m. Additional fill may be required if the depth of the foundations increases. A 26.7 m high saddle dam will be constructed at the southwest corner of the TSF prior to Year 5 of operations. This dam will not be in contact with the supernatant pond and, therefore, will be constructed entirely from compacted, non-acid generating, mine waste rock. No geomembrane liner will be incorporated. The dam will be constructed in a single stage with a crest width of 10 m and slopes at 2H:1V on both the upstream and downstream sides. The design includes for the removal of unsuitable material to an average depth of 1 m below the foundation.
20.4.1.2 Seismic Setting Seismicity studies were completed by S y S Ingenieros Consultores Ltda. These studies provided the following design earthquake characteristics and parameters:
a) Maximum credible earthquake (MCE):
Santo Domingo Project Region III, Chile
NI 43-101 Technical Report
Page 20-9
March 2020
Project Number: C40029
Intra-plate medium depth earthquake Magnitude Mw = 8.0 Free field (hard ground) acceleration amax = 1.02 g KH = 0.22
b) Operational earthquake Intra-plate earthquake of medium depth
Magnitude Mw = 7.5 Free field (hard ground) acceleration amax = 0.54 g KH = 0.16.
20.4.2 Stability Analyses
Stability analyses carried out for the main embankment and saddle dam indicate that under static load conditions the safety factors are above 1.5 during operation and after closure. Under pseudo-static conditions, horizontal seismic coefficients of 0.16 and 0.22 were used for the operational and closure stages and the stability analyses gave safety factors higher than the 1.2 minimum safety factor required by Chilean regulations for these conditions. Under post-earthquake static loading conditions, the analyses also gave safety factors above the required minimum of 1.2. These results confirm that the dams are predicted to remain stable under the loading conditions modelled. During detail design, the potential for locally saturated zones to develop in and under the dam will be analyzed using earthquake induced deformation numerical analyses.
20.4.3 Water Management
20.4.3.1 Water Balance Knight Piésold prepared a monthly water balance for the TSF that estimates the quantities of water entering, exiting and being stored in the TSF. The inflows included water in the tailings stream and precipitation; the outflows included recycle water to the process, evaporation from the supernatant pond and the active beach as well as seepage from the tailings and the pond; storage included water losses to the pores in the tailings and the varying volumes of surface water in the supernatant pond. Water from the supernatant water pond will be recovered and recycled to the process throughout the operating life of the TSF. This is necessary for efficient water use and to control the size of the supernatant pond to limit evaporation and potential seepage

Santo Domingo Project Region III, Chile
NI 43-101 Technical Report
Page 20-10
March 2020
Project Number: C40029
losses. The general operating principle will be to keep the supernatant pond as small as possible so that under a range of normal operating conditions it will remain over the geomembrane lined area upstream of the dam. The water balance described above has been used to estimate the limits of this pond and to establish the limits of the liner. Follow up work in the next stage of design will involve refining the water balance, particularly for the initial years of operations, when a lower density slurry is possible, which may lead to larger volumes of water being stored in the TSF. The result may require an expansion of the lined area. Refinement of the water balance will also include the incorporation of updated site climatic and hydrologic data. The rate of recycling water from the TSF to the process is predicted to be restricted by the size of the supernatant pond. During the first year, the mean recycle flow to the process is planned to be 131 L/s. Between Years 2 and 5 the recycle is predicted to fall to 63 L/s and from Year 6 to Year 15 the recycle is predicted to decrease to 50 L/s. After Year 15, during the final years of operation the recycle is predicted to be 40 L/s. The reducing size of the pond is largely due to the increased rate of evaporation from the expanding beach area.
20.4.3.2 Probable Maximum Precipitation The 24-hour probable maximum precipitation (PMP) was calculated to determine the required storage capacity to manage this event within the TSF. The synthetic unitary Hershfield hydrograph method was used and two design scenarios were analyzed with different frequency factors (K) and catchment areas: A 27.3 km2 basin immediately upstream of the TSF and K=19.8 A larger (57.0 km2) basin including an additional catchment area further upstream
and K=11. The first scenario produced the largest volume reporting to the TSF at 1.33 Mm3 and was used to size the storm run-off capacity in the TSF. The stage by stage raise levels of the TSF include for temporary storage of this volume above the tailings and the normal operating pond at all times with an additional 2 m minimum of freeboard. If a major precipitation event occurs, it will be important to evacuate the excess water as quickly as possible. With the exception of the first year, additional pumping capacity will be in place from the supernatant pond, capable of evacuating the excess water produced by a 1,000-year storm (0.60 Mm³) in 3 months and from the 24-hour PMP (K=19.8) (1.33 Mm³) in 6 months. During the first year there will be sufficient temporary
Santo Domingo Project Region III, Chile
NI 43-101 Technical Report
Page 20-11
March 2020
Project Number: C40029
storage capacity to allow for a slower rate of extraction. During detail design the potential to temporarily store the 72-hour PMP within the TSF will be considered.
20.4.3.3 Seepage Provided that the supernatant pond is kept above the geomembrane liner as intended by the design and the geomembrane installation is of good quality, the seepage flows from the supernatant pond are expected to remain low and vary between 0.17 L/s and 0.33 L/s during the operational life of the TSF. During detailed design a sensitivity analysis will be conducted to investigate the seepage rate because of a lesser quality liner installation to better understand the unlikely impact of numerous defects as a result of installation and loading of the geomembrane. An analysis will also be conducted to assess the impacts on seepage from a larger than planned supernatant pond, particularly in the early period of operations when the tailings may be deposited at a lower solids content; the lined area may need to be expanded as a result of this analysis. The total amount of seepage predicted from the tailings deposit, after accounting for areas extending beyond the liner limits and after including for consolidation induced seepage, is 7.5 L/s during the first year of operation. The total seepage rate is predicted to reduce to 6.2 L/s in Year 2 and 5.0 L/s from Year 6 to the end of the operation. Seepage monitoring wells will be installed downstream of the embankment to monitor any potential changes in the quality of the ground water. If necessary, this water will be intercepted and pumped back into the TSF for return to the process and/or for treatment.
20.4.3.4 Surface Run-off Considerations A large portion of the catchment area above the TSF will be diverted around the TSF by a 3.7 km long channel. The channel will be above the eastern side of the TSF and the diverted run-off will be discharged downstream of the TSF embankment. The diversion design incorporates: Hydraulic capacity to pass the maximum instantaneous flow from the 24-hour
storm with a return period of 100 years (a flow of 3.50 m³/s) A minimum longitudinal slope of 0.4% A Manning roughness coefficient of 0.02 (an unlined, earth surface)
Santo Domingo Project Region III, Chile
NI 43-101 Technical Report
Page 20-12
March 2020
Project Number: C40029
A trapezoidal cross section with a base width of 1.0 m, minimum depth of 0.9 m and side slopes of 2H:1V.
In the next phase of design, the site hydrological data should be updated to include the latest significant hydrological events in the area, and the diversion plans should be checked for adequacy in routing such events and revised if necessary.
20.4.3.5 Spillway A spillway will be constructed during the final raise of the TSF for use as a run-off discharge structure after closure. The spillway will be positioned so that the storage available below it and above the tailings, for the short period of time to the end of deposition, will be sufficient to contain the storm associated with a return period of 1,000 years. The spillway will be sized to safely pass flows up to the peak discharge associated with the 24-hour PMP. The spillway will be located behind the right abutment of the embankment and will be lined with grouted riprap in order to reduce erosion.
20.4.4 Thickened Tailings Distribution
The tailings will be pumped from the plant as thickened slurry (55% by mass solids content) to thickeners located at the southern end of the TSF where further thickening will be carried out to approximately 67% solids content. The tailings will be discharged into a tailings distribution box and directed in pipes to discharge points located in the TSF basin for deposition using the sub-aerial method. The tailings distribution box has been designed to provide flexibility to the system for passing a range of flows and tailings characteristics including slurry solids concentrations. Occasional variations in the quantity and quality of the tailings will require checking to ensure that the system operates within appropriate ranges. The distribution box will have five discharge lines as well as drainage and overflow pipes, interior dimensions of 3.6 m by 3.0 m and a functional height to the overflow outlet of 2.8 m. During the first year of operation the thickened tailings will be deposited by gravity at an average solids content of approximately 58% through two parallel pipes to location P-2 (Figure 20-2). In the second year of operation the tailings will be thickened to an average solids content of approximately 65% and discharged through two pipes operating

Santo Domingo Project Region III, Chile
NI 43-101 Technical Report
Page 20-13
March 2020
Project Number: C40029
simultaneously to two points (P-1 and P-2) within the dam. From Year 3 through the end of the mine life (approximately Year 18), the tailings will be deposited at a concentration of between approximately 65% and 67% via five pipelines depositing simultaneously at five points (P-1, P-2, P-3, P-4 and P-5). Gravity flows are expected, with the exception of the last 2 years when the southwest area of the TSF will require a pumping system. The final design of the TSF will take into account the potentially lower solids contents if the thickeners are less effective than planned. Figure 20-2: Tailings Deposition Layout Plan (Operating Years 3 to 18)
Note: Figure prepared by Knight Piésold, 2013
20.4.5 Water Recovery and Transport System
The water recovery and transport system from the supernatant pond includes pumping and piping to the process plant. The pond will form close to the main embankment at the northern end of the TSF. The water recovery system will consist of: A barge-mounted pump station with two Class #150 vertical pumps (one
operating, one stand-by), 100 HP (75 kW) each, located at the supernatant pond.
Santo Domingo Project Region III, Chile
NI 43-101 Technical Report
Page 20-14
March 2020
Project Number: C40029
This system will be separated from the geomembrane lined surface to avoid damaging the geomembrane
Pumping the recovered water from the supernatant pond to a transfer tank, via pipes
A transfer tank located above the left abutment of the main embankment Gravity flow from the transfer tank to the process water pond at the processing
plant via pipes.
20.4.6 Monitoring
The monitoring system for the TSF will include the three existing monitoring wells and a pumping well drilled during the geotechnical and hydrogeological studies. If seepage from the TSF is detected above acceptable levels, additional pumping wells will be installed as needed. Piezometers will be installed in and under the main embankment and saddle dam and in and under the tailings mass (including under the geomembrane liner) to monitor pore pressures. These will be at locations defined in future stages of design. Instruments, possibly including inclinometers, shape arrays, settlement gauges and surface deformation stations, will be installed in and on the embankments to monitor any movements under static loading and earthquake conditions. In addition, seismic accelerometers will be installed to monitor ground movement accelerations during an earthquake.
20.4.7 Closure Considerations
Current planning and design for the closure phase of the TSF includes a runoff discharge spillway at the low (north) end of the facility to safely remove surface water when it is deemed suitable for release, and treatment or covering of the final tailings beach to reduce the generation of dust and the ingress of surface run-off into the tailings mass. Currently a 0.3 m thick granular cover is considered to meet this objective, although this may change in the future.
20.4.8 Risk Evaluation
The design of the TSF provides for a freeboard allowance of at least 2 m above the maximum flood level resulting from the 24-hour PMP and approximately 4 m above
Santo Domingo Project Region III, Chile
NI 43-101 Technical Report
Page 20-15
March 2020
Project Number: C40029
the supernatant pond level under normal operating conditions. Thus, the risk of overtopping is expected to be small. In the next stage of design, increasing this to temporarily contain the 72-hour PMP will be investigated. The embankment will be constructed from hard, durable, high quality waste rock, which will have high strength and erosion resistance when placed and compacted in horizontal lifts. Thus, the risk of experiencing a structural failure is considered to be small. Seepage will be controlled by a geomembrane liner on the upstream face of the main embankment and under the supernatant pond. Thus, the risk of significant seepage losses or piping being experienced is also considered to be small unless the pond exceeds the limits of the liner or the liner is damaged. The lined area may be expanded in the next stage of design to further reduce this risk. An extensive geotechnical monitoring system will also be incorporated in the next stage of design to allow for a rigorous performance assessment program. Two areas where the design will impact existing infrastructure were noted. These are: TSF: Entel’s fibre optic line and Route C-17 Mine-plant area: Red Eléctrica Internacional and Engie (formerly GDF Suez)
Mejillones-Cardones transmission line, the Chañaral–Diego de Almagro transmission line and the Cardones–Diego de Almagro transmission line.
Electrical and fibre optic lines will be relocated to a strip of land provided by Capstone. 20.5 Considerations of Social and Community Impacts
The area of influence of the Santo Domingo property includes the Provinces of Chañaral and Copiapó in the Atacama Region and particularly the communities and towns of Diego de Almagro, Chañaral and Caldera. There are no indigenous lands or territories of any kind being claimed on the Property. Although the lands of the Colla Community of Diego de Almagro are not within the direct area of influence, Capstone will keep lines of communication open for possible approaches or inquiries from this community. A stakeholder plan was developed to implement an early citizen participation program (PACA) that allowed the local communities involved to understand the major project components and for MSD to gather community opinions, comments and feedback. Semi-structured interviews with people in all the communities within the area of

Santo Domingo Project Region III, Chile
NI 43-101 Technical Report
Page 20-16
March 2020
Project Number: C40029
influence were conducted and supplemented by background information provided by social sources in each community. Consultations have been held in Diego de Almagro, Chañaral and Copiapó (March 2012), Diego de Almagro and Chañaral (August and September 2012), Community of Caldera (June 2013) and Diego de Almagro, Chañaral and Caldera (September 2013). Consultations included open houses, open meetings, meetings for special interest groups such as fishermen and meetings with authorities, regional and community services as well as with professional organizations. Capstone has contacted authorities from government, municipality, business and trade associations and other non-government organizations (NGOs) in the region. As a result of the early citizen participation process, changes in the design were made to minimize impacts to the environment and surrounding communities as follows: New location and technology for the TSF. The TSF was relocated 8.5 km southeast
of the town of Diego de Almagro and thickened tailings technology will be used. The building of a by-pass road for the town of Diego de Almagro, which will reduce
traffic congestion and will avoid the transit of heavy equipment vehicles through the town.
Plan for hiring local workers. This entails re-training programs and strategic partnerships with technical schools in Chañaral and Diego de Almagro.
Defining guidelines for a community relations plan to contribute to sustainable development in Diego de Almagro, Chañaral and Caldera, according to the real needs of the community in the area of influence.
The communications strategy will focus on building a positive reputation and supportive environment for the development of a mining operation in the Atacama Region. Specific development strategies are directed to the communities of Diego de Almagro and Caldera. A communications plan, communications committee and crisis response management plan are being developed. A health and safety management system has been developed to meet local legal requirements and industry best practices. Capstone will implement policies, standards, plans and security procedures and will use facilities, equipment and personnel required to provide adequate security levels for its staff and facilities.

Santo Domingo Project Region III, Chile
NI 43-101 Technical Report
Page 20-17
March 2020
Project Number: C40029
20.6 Comment on Section 20
Capstone is preparing to start construction at Santo Domingo and is developing the first building permit packages and Environmental Management Plans. Capstone will prepare management tools for environmentally-sensitive areas, commitments and permits to facilitate management and ensure compliance with environmental, permitting and social commitments.

Santo Domingo Project Region III, Chile
NI 43-101 Technical Report
Page 21-1
March 2020
Project Number: C40029
21.0 CAPITAL AND OPERATING COSTS
21.1 Capital Cost Estimate
21.1.1 Basis of Estimate
The estimate is classed as a Type 3 estimate according to Wood standards (and AACE International), with an accuracy of -10% to +15% at the 85% confidence level. All construction activity was assumed to be completed by construction contractors. No provision was included for Owner or engineering, procurement and construction management (EPCM) managed direct hire work in the estimate. Direct costs included direct construction labour, equipment, materials, consumables and miscellaneous items that form the permanent facilities. Indirect costs included items required to support the construction of the permanent facilities. Owner costs are Capstone’s costs prior to the start of operations. Sustaining capital costs include ongoing costs for facilities and equipment required to maintain or increase production. Contingency reflects the potential growth in capital costs excluding changes in the scope of work.
21.1.2 Mine Capital Costs
The total estimated mining capital costs are summarized in Table 21-1. Sustaining capital totals $285.3 M from Year 1 through Year 16. The total capital for mine equipment is $267.8 M over the mine life. Table 21-1: Mine Capital Cost Estimate Summary ($ x 1,000)
Cost Area Initial Capital Sustaining
Capital Total Capital Y-1 Y0 H1 Total
Mine development 28,091 29,025 57,117 — 57,117 Equipment purchase 67,684 13,287 80,971 186,779 267,750 Equipment rebuild — — — 93,102 93,102 Other investments 22,664 118 22,783 3,790 26,573 Dispatch 2,861 154 3,015 1,633 4,648 Total 121,301 42,585 163,886* 285,303 449,189
* Does not include mine infrastructure ($13.6 M) which is included in the mine total in the summary tables

Santo Domingo Project Region III, Chile
NI 43-101 Technical Report
Page 21-2
March 2020
Project Number: C40029
21.1.3 Process Capital Costs
The total estimated process plant capital costs are summarized in Table 21-2.
Table 21-2: Process Plant Capital Cost Estimate Summary
Description Cost ($ M)
Process Plant General 7.1 Ore Handling 43.4 Grinding 115.0 Copper Flotation and Regrind 58.0 Magnetic Separation and Regrind 40.1 Tailings Thickening and Transport 28.4 Reagent Plant 9.4 Copper Concentrate Filtration 12.0
Total 313.3
21.1.4 Tailings Storage Facility
The TSF design and capital cost estimate was prepared by Knight Piésold. The TSF design is for a final capacity of 314 Mt of tailings, equivalent to a total volume of 196 Mm³, which will be deposited over approximately 18 years. The costs include all earthworks and supply and installation of materials for the underdrains, liner system, tailings distribution system and tailings water reclaim system. Costs are also included for contractor mobilization and demobilization, overhead and profit. It was assumed that waste rock will be supplied from the mine by Capstone’s mine fleet. The waste rock will be delivered to the embankment with the additional haul cost included in the cost estimate. Table 21-3 summarizes the 2018 cost estimate for the TSF. It does not include any engineering and construction management costs, indirect costs or contingency, which are accounted for elsewhere. During the next stage of design, updated water balance calculations may require expansion of the lined area in the basin and a deeper cut off trench for anchoring the liner. The volume allowance for temporary storage of extreme event run-off may also increase from a 24-hour to a 72-hour PMP, possibly resulting in some impact on the
Santo Domingo Project Region III, Chile
NI 43-101 Technical Report
Page 21-3
March 2020
Project Number: C40029
size of the dam to accommodate this volume. A more detailed study of the soluble salts content in the dam foundation soils may also result in additional excavation at the dam footprint.
Table 21-3: TSF Capital Cost Estimate Summary
TSF Stage Type of Cost and When Applied
Cost ($ M)
Stage 1: Starter Dam Initial capital cost 21.8 Stage 2 Sustaining capital year 2 8.9 Stage 3 Sustaining capital year 8 7.5 Stage 4 Sustaining capital year 12 9.2 Total 47.4
A review of the hydrology study to include the latest significant hydrological events in the area may change the volume for the PMP and as a result may have some impact on the size of the dam to accommodate this volume.
21.1.5 Infrastructure Capital Costs
Building infrastructure costs are primarily based on budget quotes. A 220 kV high voltage transmission line from the Diego de Almagro (San Lorenzo) substation to the mine and process plant site will be required. The line will be approximately 9 km long. A 220 kV high voltage transmission line is planned from the Totoralillo substation to the port site. This line will be approximately 14 km long. The road design and capital cost estimate totals $21.7 M.
21.1.6 Concentrate Pipeline
The magnetite concentrate transport was estimated at $86.8 M. Costs are shown in Table 21-4.
Santo Domingo Project Region III, Chile
NI 43-101 Technical Report
Page 21-4
March 2020
Project Number: C40029
Table 21-4: Magnetite Concentrate Pipeline Capital Cost Estimate Summary
Description Cost ($ M)
Construction and assembly 27.5 Overhead expenses and profit (40%) 11.0 Subcontractors 14.3 Pipe material, spools 15.2 Positive displacement pumps 6.6 Charge pumps, valves, fittings 9.7 Electrical and instrumentation equipment 1.3 Total Direct Costs 85.6 Total Indirect Costs 1.3 Total Concentrate Pipeline Cost 86.9
21.1.7 Port Facility The port facility cost estimate is provided in Table 21-5 and totals $121.4 M. Table 21-5: Port Capital Cost Estimate Summary
Facility Supplies Costs ($ M)
Subcontracts Cost ($ M)
Installation Cost ($ M)
Total Cost ($ M)
Copper concentrate transport and loading 3.7 — 4.0 7.7 Copper concentrate loading and transport to loading platform 10.9 — 1.8 12.7 Magnetite concentrate handling and storage 0.8 — 0.4 1.2 Magnetite concentrate storage 1.4 0.3 1.8 3.5 Magnetite concentrate transport to loading platform 9.5 0.9 3.0 13.4 Access trestle – conveyor belt 14.4 — 5.0 19.4 Ship loader supports 1.6 — 2.0 3.6 Mechanical equipment – copper and magnetite concentrate 11.0 0.1 2.1 13.2 Marine works services 1.0 0.6 0.2 1.8 Mooring and berthing infrastructure 5.2 — 4.6 9.8 Port infrastructure (on site) 0.1 4.9 10.2 15.2 Control, communications and safety system — 0.7 0.1 0.8 Sea water supply 1.1 — 0.6 1.8 Indirect costs — 1.8 — 1.8 Profit @ 15% — 15.4 — 15.4 Total Port Cost 60.8 24.6 36.6 121.4

Santo Domingo Project Region III, Chile
NI 43-101 Technical Report
Page 21-5
March 2020
Project Number: C40029
21.1.8 Indirect Costs
Wood estimated the indirect costs for the execution phase as summarized in Table 21-6. Indirect costs total $269.2 M. Table 21-6: Indirect Costs Estimate Summary
Cost Item Cost ($ M)
Engineering and procurement services (EP) 43.5 Construction management (CM) 62.9 Home & field office materials (EPCM) 6.0 Support engineering 0.6 Construction camp 34.5 Catering and camp services 24.6 Temporary installations 12.0 Water supply (industrial and potable water) 3.4 Power 3.5 Firefighting, cleaning, maintenance, waste management 1.3
Safety, communications 0.7 Consulting, specialists, third party services 8.1 Warehouse 2.6 Crane 1.2 Off-site and on-site transport 1.3 Pre-commissioning, commissioning 4.4 Freight and customs 28.1 Vendor reps. 6.0 Start-up and first year spares 12.3 First fill 2.5 Transport for local staff 0.3 Indirect additional/allowance 9.4 Total Indirect Costs 269.2
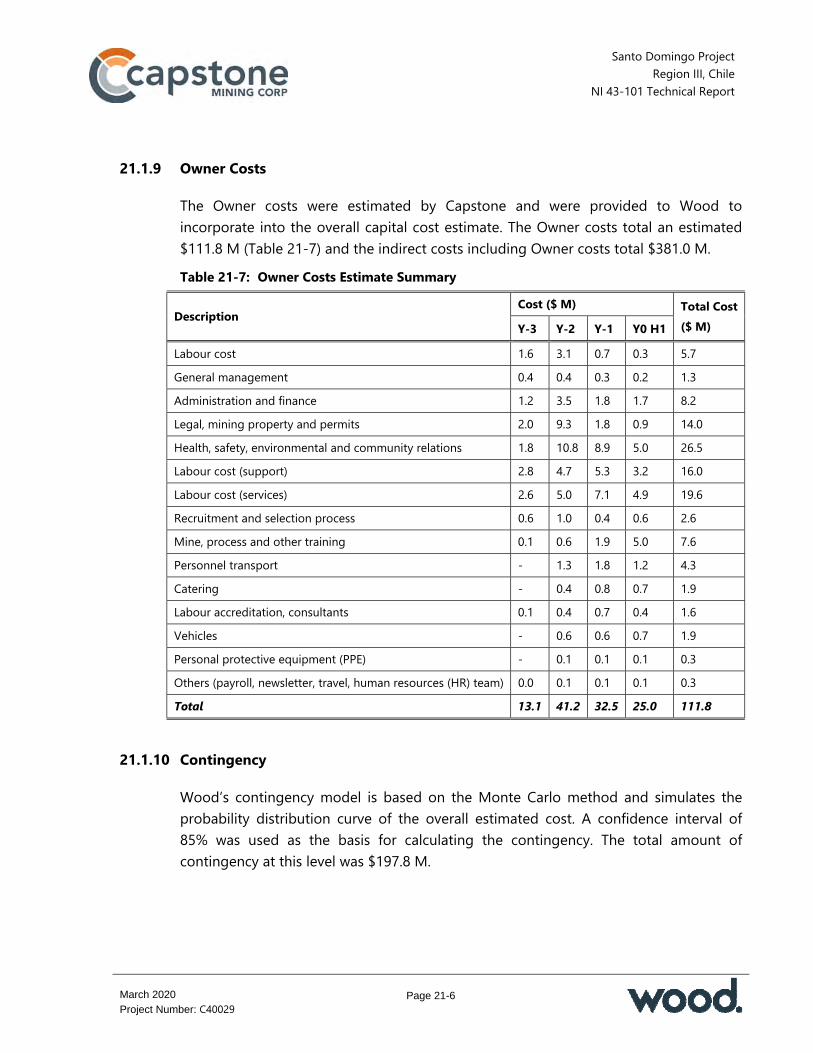
Santo Domingo Project Region III, Chile
NI 43-101 Technical Report
Page 21-6
March 2020
Project Number: C40029
21.1.9 Owner Costs
The Owner costs were estimated by Capstone and were provided to Wood to incorporate into the overall capital cost estimate. The Owner costs total an estimated $111.8 M (Table 21-7) and the indirect costs including Owner costs total $381.0 M. Table 21-7: Owner Costs Estimate Summary
Description Cost ($ M) Total Cost
($ M) Y-3 Y-2 Y-1 Y0 H1 Labour cost 1.6 3.1 0.7 0.3 5.7 General management 0.4 0.4 0.3 0.2 1.3 Administration and finance 1.2 3.5 1.8 1.7 8.2 Legal, mining property and permits 2.0 9.3 1.8 0.9 14.0 Health, safety, environmental and community relations 1.8 10.8 8.9 5.0 26.5 Labour cost (support) 2.8 4.7 5.3 3.2 16.0 Labour cost (services) 2.6 5.0 7.1 4.9 19.6 Recruitment and selection process 0.6 1.0 0.4 0.6 2.6 Mine, process and other training 0.1 0.6 1.9 5.0 7.6 Personnel transport - 1.3 1.8 1.2 4.3 Catering - 0.4 0.8 0.7 1.9 Labour accreditation, consultants 0.1 0.4 0.7 0.4 1.6 Vehicles - 0.6 0.6 0.7 1.9 Personal protective equipment (PPE) - 0.1 0.1 0.1 0.3 Others (payroll, newsletter, travel, human resources (HR) team) 0.0 0.1 0.1 0.1 0.3 Total 13.1 41.2 32.5 25.0 111.8
21.1.10 Contingency
Wood’s contingency model is based on the Monte Carlo method and simulates the probability distribution curve of the overall estimated cost. A confidence interval of 85% was used as the basis for calculating the contingency. The total amount of contingency at this level was $197.8 M.

Santo Domingo Project Region III, Chile
NI 43-101 Technical Report
Page 21-7
March 2020
Project Number: C40029
21.1.11 Taxation Considerations
Local taxes on contractor-supplied materials and installation labour are included in the direct cost estimate. Value-added tax (VAT or IVA in the Spanish acronym) on process equipment, contractor-supplied material and contractors’ profit are not included in the estimates of indirect and direct costs. No escalation has been applied.
21.1.12 Initial Capital Cost Estimate
The initial capital cost estimate by area is presented in Table 21-8. 21.1.13 Sustaining Capital Cost Estimate
Over the LOM, the sustaining capital cost is $378.6 M. Table 21-9 summarizes the sustaining capital by year. Table 21-8: Initial Capital Cost Estimate (by Area)
Area Cost ($ M) % of Total
Mine 177.5 12 Process plant 313.3 21 Tailings and water reclaim 48.2 3 Plant infrastructure (on site) 81.9 5 Port 147.4 10 Port infrastructure (on site) 21.9 1 External infrastructure (off site) 143.2 9 Indirect costs 381.0 25 Contingency 197.8 13 Total 1,512.3 100 Notes: Costs in this table are distributed and summarized by major area and include costs from consultants, Wood, Capstone, or other parties.

Santo Domingo Project Region III, Chile
NI 43-101 Technical Report
Page 21-8
March 2020
Project Number: C40029
Table 21-9: Summary of Sustaining Capital by Year
Description Amount ($ x 1,000)
Year 0 – H2 98,614 Year 1 36,254 Year 2 18,204 Year 3 17,933 Year 4 9,007 Year 5 39,282 Year 6 2,277 Year 7 111 Year 8 37,856 Year 9 43,229 Year 10 17,925 Year 11 467 Year 12 20,412 Year 13 1,333 Year 14 5,441 Year 15 30,010 Year 16 249 Total Sustaining Capital 378,602
21.2 Operating Costs
The estimate is considered to be at feasibility-study level with an accuracy of -10% to +15%. The overall assumptions for operating costs that apply to all areas (including mining) include: Costs are presented in Q3 2018 US dollars, unless stated otherwise Costs are based on an exchange rate of CLP600 to $US1.00 An average burden rate of 25% has been applied to salaried and hourly labour for
social insurance, medical and insurance costs, pensions and vacation costs
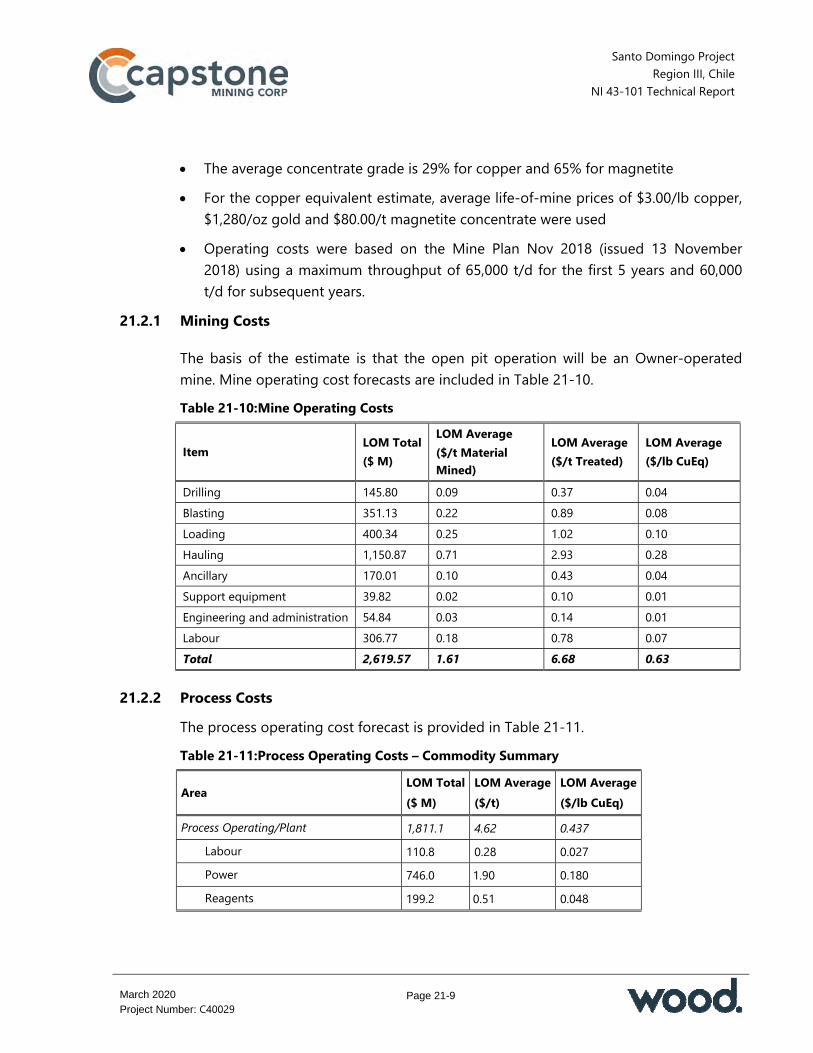
Santo Domingo Project Region III, Chile
NI 43-101 Technical Report
Page 21-9
March 2020
Project Number: C40029
The average concentrate grade is 29% for copper and 65% for magnetite For the copper equivalent estimate, average life-of-mine prices of $3.00/lb copper,
$1,280/oz gold and $80.00/t magnetite concentrate were used Operating costs were based on the Mine Plan Nov 2018 (issued 13 November
2018) using a maximum throughput of 65,000 t/d for the first 5 years and 60,000 t/d for subsequent years.
21.2.1 Mining Costs
The basis of the estimate is that the open pit operation will be an Owner-operated mine. Mine operating cost forecasts are included in Table 21-10. Table 21-10: Mine Operating Costs
Item LOM Total ($ M)
LOM Average ($/t Material Mined)
LOM Average ($/t Treated)
LOM Average ($/lb CuEq)
Drilling 145.80 0.09 0.37 0.04 Blasting 351.13 0.22 0.89 0.08 Loading 400.34 0.25 1.02 0.10 Hauling 1,150.87 0.71 2.93 0.28 Ancillary 170.01 0.10 0.43 0.04 Support equipment 39.82 0.02 0.10 0.01 Engineering and administration 54.84 0.03 0.14 0.01 Labour 306.77 0.18 0.78 0.07 Total 2,619.57 1.61 6.68 0.63
21.2.2 Process Costs The process operating cost forecast is provided in Table 21-11. Table 21-11: Process Operating Costs – Commodity Summary
Area LOM Total ($ M)
LOM Average ($/t)
LOM Average ($/lb CuEq)
Process Operating/Plant 1,811.1 4.62 0.437 Labour 110.8 0.28 0.027 Power 746.0 1.90 0.180 Reagents 199.2 0.51 0.048

Santo Domingo Project Region III, Chile
NI 43-101 Technical Report
Page 21-10
March 2020
Project Number: C40029
Area LOM Total ($ M)
LOM Average ($/t)
LOM Average ($/lb CuEq)
Steel 508.1 1.30 0.122 Operating supplies 19.2 0.05 0.005 Maintenance materials 82.2 0.21 0.020 Other costs 145.7 0.37 0.035
TSF and Tailings Water Reclaim 39.0 0.10 0.009 Labour 18.25 0.05 0.004 Power 9.7 0.03 0.002 Reagents 7.8 0.02 0.002 Operating supplies 0.2 0.00 0.000 Maintenance materials 0.8 0.00 0.000 Other costs 2.2 0.01 0.001
Magnetite Concentrate Transport System 74.3 0.190 0.018 Labour 3.60 0.009 0.001 Power 9.18 0.026 0.002 Maintenance materials 39.586 0.101 0.009 Other costs 4.2 0.011 0.001 Management 16.9 0.043 0.004
Desalinated Water Transfer System* 437.1 1.11 0.105
Other costs 420.2 1.07 0.101 Management 16.9 0.04 0.004
Magnetite Filtration – Port 94.2 0.24 0.023 Labour 31.9 0.08 0.008 Power 9.6 0.02 0.002 Operating supplies 9.1 0.02 0.002 Maintenance materials 26.6 0.07 0.006 Other costs 0.0 0.00 0.000 Management 16.9 0.04 0.004
Fe and Cu Handling, Storage and Loading 91.8 0.23 0.022 Labour 15.0 0.04 0.004 Power 17.1 0.04 0.004

Santo Domingo Project Region III, Chile
NI 43-101 Technical Report
Page 21-11
March 2020
Project Number: C40029
Area LOM Total ($ M)
LOM Average ($/t)
LOM Average ($/lb CuEq)
Operating supplies 13.0 0.03 0.003 Maintenance materials 0.0 0.00 0.000 Other costs 29.8 0.08 0.007 Management 16.9 0.04 0.004 Total 2,547.6 6.49 0.61
Note: * Based on potential BOOT operator quote, plus Capstone management
21.2.3 Labour
Shifts with 7 x 7 and 4 x 3 rotations are used for the operations and administration areas respectively, for process, mining and overhead. Labour costs are summarized in Table 21-12 and total $205.4 M over the LOM.

Santo Domingo Project Region III, Chile
NI 43-101 Technical Report
Page 21-12
March 2020
Project Number: C40029
Table 21-12: Labour Cost Breakdown
Area LOM Total LOM Average LOM Average Hours per Year Total LOM
No. of Staff Cost*
($ x 1,000) ($/t) ($/lb CuEq) (MH/y) (MH/LOM) ($/MH) Process operating/plant 110.8 0.28 0.027 261 4,588 116 24.1
Labour 110.8 0.28 0.027 261 4,588 116 24.1 TSF and tailings water reclaim 18.25 0.05 0.004 42 706 15 25.9
Labour 18.25 0.05 0.004 42 706 15 25.9
Magnetite concentrate transport system 10.06 0.026 0.002 22 372 10 27.05
Labour 3.60 0.009 0.001 11 186 5 19.3 Labour in management 6.46 0.017 0.002 11 186 5 34.8 Desalinated water transfer system 6.46 0.016 0.002 11 186 5 34.8
Labour 0.00 0.00 0.000 0 0 0 0.0 Labour in management 6.46 0.017 0.002 11 186 5 34.8 Magnetite Filtration Port 38.37 0.098 0.009 113 1,925 51 19.93
Labour 31.90 0.081 0.008 102 1,739 46 18.3 Labour in management 6.46 0.016 0.002 11 186 5 34.8 Fe & Cu handling, storage and loading 21.48 0.055 0.005 59 1,000 26 21.48
Labour 15.01 0.038 0.004 48 814 22 18.4 Labour in management 6.46 0.016 0.002 11 186 5 34.8 Total 205.4 0.524 0.049 508 8,777 228 22.91
Note: * The total costs in this column are weighted totals from the unit costs for labour and management. MH = man hours.
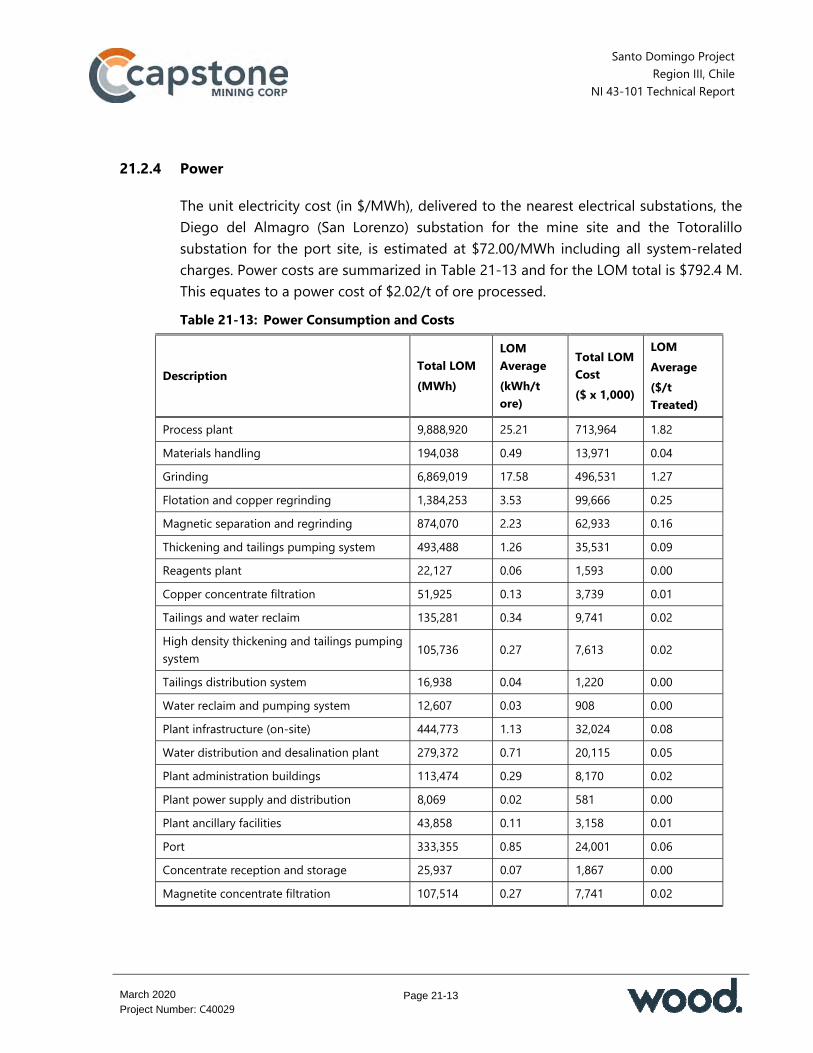
Santo Domingo Project Region III, Chile
NI 43-101 Technical Report
Page 21-13
March 2020
Project Number: C40029
21.2.4 Power
The unit electricity cost (in $/MWh), delivered to the nearest electrical substations, the Diego del Almagro (San Lorenzo) substation for the mine site and the Totoralillo substation for the port site, is estimated at $72.00/MWh including all system-related charges. Power costs are summarized in Table 21-13 and for the LOM total is $792.4 M. This equates to a power cost of $2.02/t of ore processed. Table 21-13: Power Consumption and Costs
Description Total LOM (MWh)
LOM Average (kWh/t ore)
Total LOM Cost ($ x 1,000)
LOM Average ($/t Treated)
Process plant 9,888,920 25.21 713,964 1.82 Materials handling 194,038 0.49 13,971 0.04 Grinding 6,869,019 17.58 496,531 1.27 Flotation and copper regrinding 1,384,253 3.53 99,666 0.25 Magnetic separation and regrinding 874,070 2.23 62,933 0.16 Thickening and tailings pumping system 493,488 1.26 35,531 0.09 Reagents plant 22,127 0.06 1,593 0.00 Copper concentrate filtration 51,925 0.13 3,739 0.01 Tailings and water reclaim 135,281 0.34 9,741 0.02 High density thickening and tailings pumping system 105,736 0.27 7,613 0.02
Tailings distribution system 16,938 0.04 1,220 0.00 Water reclaim and pumping system 12,607 0.03 908 0.00 Plant infrastructure (on-site) 444,773 1.13 32,024 0.08 Water distribution and desalination plant 279,372 0.71 20,115 0.05 Plant administration buildings 113,474 0.29 8,170 0.02 Plant power supply and distribution 8,069 0.02 581 0.00 Plant ancillary facilities 43,858 0.11 3,158 0.01 Port 333,355 0.85 24,001 0.06 Concentrate reception and storage 25,937 0.07 1,867 0.00 Magnetite concentrate filtration 107,514 0.27 7,741 0.02
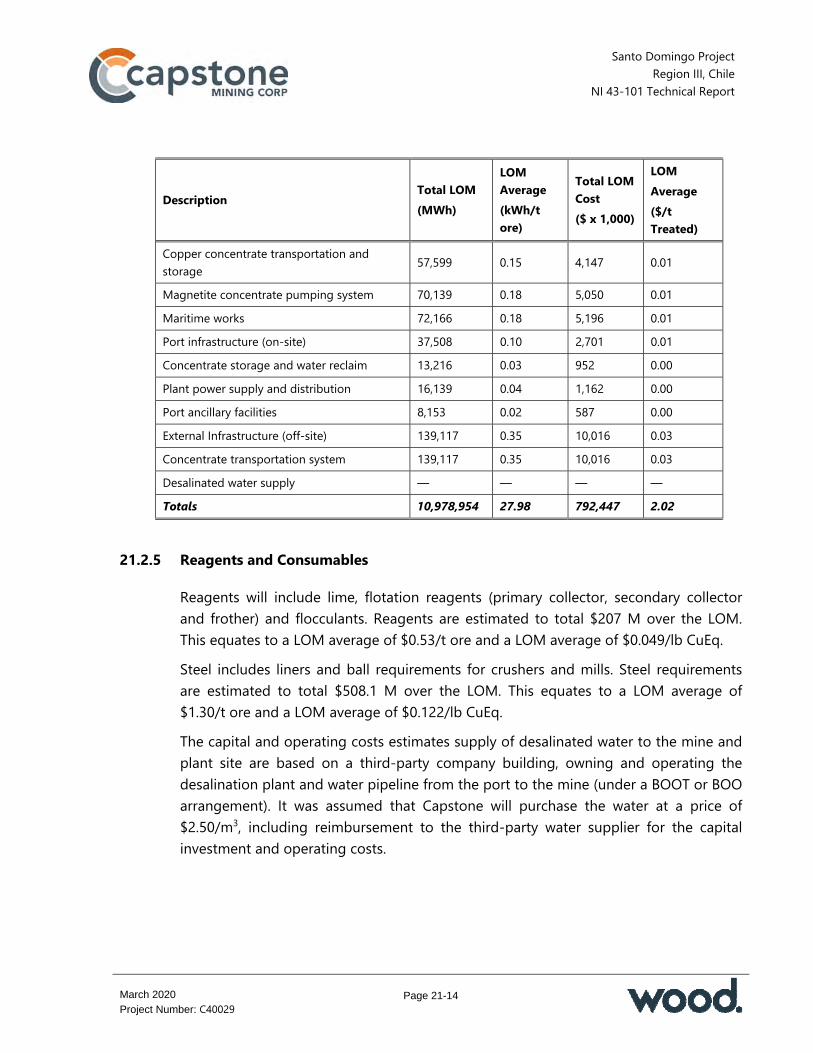
Santo Domingo Project Region III, Chile
NI 43-101 Technical Report
Page 21-14
March 2020
Project Number: C40029
Description Total LOM (MWh)
LOM Average (kWh/t ore)
Total LOM Cost ($ x 1,000)
LOM Average ($/t Treated)
Copper concentrate transportation and storage 57,599 0.15 4,147 0.01
Magnetite concentrate pumping system 70,139 0.18 5,050 0.01 Maritime works 72,166 0.18 5,196 0.01 Port infrastructure (on-site) 37,508 0.10 2,701 0.01 Concentrate storage and water reclaim 13,216 0.03 952 0.00 Plant power supply and distribution 16,139 0.04 1,162 0.00 Port ancillary facilities 8,153 0.02 587 0.00 External Infrastructure (off-site) 139,117 0.35 10,016 0.03 Concentrate transportation system 139,117 0.35 10,016 0.03 Desalinated water supply — — — — Totals 10,978,954 27.98 792,447 2.02
21.2.5 Reagents and Consumables
Reagents will include lime, flotation reagents (primary collector, secondary collector and frother) and flocculants. Reagents are estimated to total $207 M over the LOM. This equates to a LOM average of $0.53/t ore and a LOM average of $0.049/lb CuEq. Steel includes liners and ball requirements for crushers and mills. Steel requirements are estimated to total $508.1 M over the LOM. This equates to a LOM average of $1.30/t ore and a LOM average of $0.122/lb CuEq. The capital and operating costs estimates supply of desalinated water to the mine and plant site are based on a third-party company building, owning and operating the desalination plant and water pipeline from the port to the mine (under a BOOT or BOO arrangement). It was assumed that Capstone will purchase the water at a price of $2.50/m3, including reimbursement to the third-party water supplier for the capital investment and operating costs.
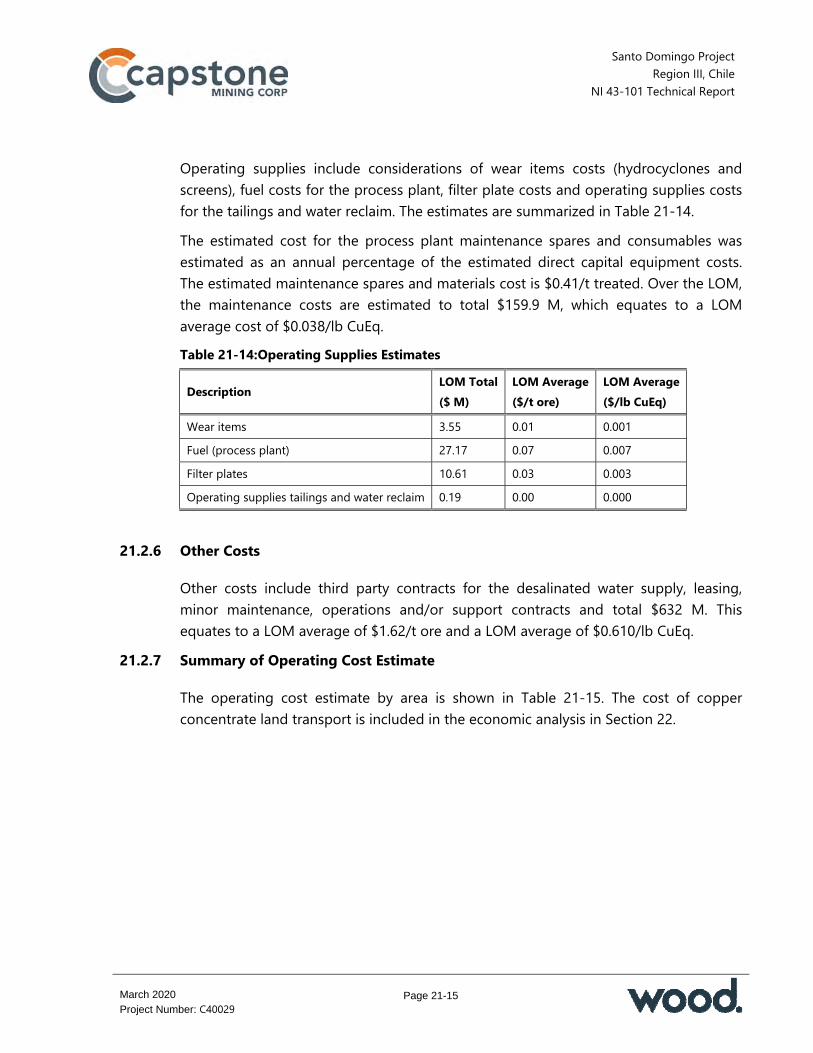
Santo Domingo Project Region III, Chile
NI 43-101 Technical Report
Page 21-15
March 2020
Project Number: C40029
Operating supplies include considerations of wear items costs (hydrocyclones and screens), fuel costs for the process plant, filter plate costs and operating supplies costs for the tailings and water reclaim. The estimates are summarized in Table 21-14. The estimated cost for the process plant maintenance spares and consumables was estimated as an annual percentage of the estimated direct capital equipment costs. The estimated maintenance spares and materials cost is $0.41/t treated. Over the LOM, the maintenance costs are estimated to total $159.9 M, which equates to a LOM average cost of $0.038/lb CuEq. Table 21-14: Operating Supplies Estimates
Description LOM Total ($ M)
LOM Average ($/t ore)
LOM Average ($/lb CuEq)
Wear items 3.55 0.01 0.001 Fuel (process plant) 27.17 0.07 0.007 Filter plates 10.61 0.03 0.003 Operating supplies tailings and water reclaim 0.19 0.00 0.000
21.2.6 Other Costs
Other costs include third party contracts for the desalinated water supply, leasing, minor maintenance, operations and/or support contracts and total $632 M. This equates to a LOM average of $1.62/t ore and a LOM average of $0.610/lb CuEq.
21.2.7 Summary of Operating Cost Estimate
The operating cost estimate by area is shown in Table 21-15. The cost of copper concentrate land transport is included in the economic analysis in Section 22.

Santo Domingo Project Region III, Chile
NI 43-101 Technical Report
Page 21-16
March 2020
Project Number: C40029
Table 21-15: Operating Cost Estimate by Area
Cost Centre LOM Total ($ M)
LOM Average ($/t)
LOM Average ($/lb CuEq)
Process operations/plant 1,811.1 4.62 0.437 Tailings storage facility and tailings water reclaim 39.0 0.10 0.009 Iron concentrate transport system 74.3 0.19 0.018 Desalinated water system 437.1 1.11 0.105 Magnetite filtration – port 94.2 0.24 0.023 Magnetite and copper handling, storage and loading 91.8 0.23 0.022 Total - Process 2,547.6 6.49 0.614
G&A 402.8 1.03 0.097
Mining 2,619.6 6.68 0.631
Total 5,570.0 14.20 1.34
21.2.8 Comment on Section 21
The estimated total LOM capital cost is $1,512.3 M. The estimated LOM operating cost estimate is $5,770.0 M. Checks were undertaken in March 2020 to confirm that the cost estimates discussed in this section remained current. The checks included a review of recent study work to see if this work would result in any material changes to the estimates. The review considered additional engineering information such as refinement of drawings and quantity takeoffs, review of commodity price forecasts and basic assumptions used in the cost estimation, review of the impact of power pricing as a result of the PPA, and review of the impact of a newly-enacted Chilean regional tax on the economic analysis. The results showed that if this new information was included in the cost estimates, it would not result in a material change in the outcome of the study (capital and operating costs, economic analysis). Therefore, the cost estimates and economic analyses are considered current and suitable to be included in this Technical Report. The QPs consider that this review supports the cost estimates as presented in this section. The QPs also note that the updated information on power charges and taxation has no material impact on the economic analysis presented in Section 22.

Santo Domingo Project Region III, Chile
NI 43-101 Technical Report
Page 22-1
March 2020
Project Number: C40029
22.0 ECONOMIC ANALYSIS
22.1 Cautionary Statement
The results of the economic analysis to support Mineral Reserves represent forward-looking information that is subject to a number of known and unknown risks, uncertainties and other factors that may cause actual results to differ materially from those presented here. Forward-looking statements in this Report include, but are not limited to, statements with respect to future metal prices and concentrate sales contracts, assumed currency exchange rates, the estimation of Mineral Reserves and Mineral Resources, the realization of Mineral Reserve estimates including the achievement of the dilution and recovery assumptions, the timing and amount of estimated future production, costs of production, capital expenditures, costs and timing of the development of ore zones, permitting time lines, requirements for additional capital, government regulation of mining operations, environmental risks, unanticipated reclamation expenses and title disputes. Additional risk can come from actual results of reclamation activities; conclusions of economic evaluations; changes in parameters as mine and process plans continue to be refined, possible variations in ore reserves, grade or recovery rates; geotechnical considerations during mining; failure of plant, equipment or processes to operate as anticipated; shipping delays and regulations; accidents, labour disputes and other risks of the mining industry; and delays in obtaining governmental approvals. Years discussed in this sub-section are presented for illustrative purposes only, as no decision has been made on mine construction by Capstone.
22.2 Methodology Used
The Property was evaluated using an 8% discounted cash flow (DCF) analysis on a non-inflated, after tax basis. The cash flows consist of approximately 3 years of pre-production costs and 18 years of operations. Cash inflows consist of annual revenue projections for the mine. Cash outflows include capital costs, operating costs, royalties and taxes, which are subtracted from the inflows to arrive at the annual cash flow projections.
Santo Domingo Project Region III, Chile
NI 43-101 Technical Report
Page 22-2
March 2020
Project Number: C40029
To reflect the time value of money, annual net cash flow (NCF) projections are discounted back to the present study valuation date of Q3 2018 using an 8% discount rate. The discount rate was determined using several factors, including the type of commodity and the level of risks (market risk, technical risk and political risk). The discounted present values of the cash flows are summed to arrive at the net present value (NPV). An NPV sensitivity analysis to discount rates was completed using discount rates of 4%, 6%, 8% (selected rate), 10% and 12%. In addition to the NPV, the internal rate of return (IRR) and payback period were also calculated. The IRR is defined as the discount rate that results in an NPV equal to zero. Cash flows are assumed to occur on an average mid-year basis of each annual period.
22.3 Financial Model Parameters
The financial model is based on the Mineral Reserves outlined in Section 15, the mining rates and assumptions discussed in Section 16 and the recovery and processing rates and assumptions discussed in Section 13 and Section 17 respectively. The capital and operating costs, economic evaluations and reported results were estimated using the foreign exchange rates noted in Table 22-1. Capital costs and sustaining capital costs are summarized in Table 21-8 and Table 21-9, respectively. Initial capital costs are estimated to be $1,512.3 M. Over the LOM sustaining capital is estimated to be $378.6 M. Operating costs are summarized in Table 21-15. LOM operating costs are estimated to be $5,770.0 M. Total and net LOM operating costs, as well as unit costs per tonne of ore treated and per pound of payable copper are summarized in Table 22-2. Closure and reclamation costs have been estimated to be $102.1 M. Smelting and refining terms considered in the evaluation are listed in Table 22-3. Transport and insurance charges for copper concentrate are provided in Table 22-4. Life of mine copper transport costs are estimated to be $47.3 M for land freight, $163.4 M for ocean freight, $3.3 M for insurance and $11.3 M for marketing (total $225.3 M).

Santo Domingo Project Region III, Chile
NI 43-101 Technical Report
Page 22-3
March 2020
Project Number: C40029
Table 22-1: Exchange Rates Used Currency CLP per Unit Dollar 600 Euro 732
Table 22-2: Total Operating Costs
Cash Costs LOM Total ($ M)
LOM Average ($/t)
LOM Cost ($/lb Cu payable)
Mining 2,619.6 6.68 1.13 Process 2,547.6 6.49 1.10 G&A 402.8 1.03 0.18 Cu concentrate transport (onshore & offshore) insurance and sales 225.3 0.57 0.10
Sub-total 5,795.2 14.77 2.51
By-product metal credits 6,242.0 (15.91) (2.70) TC/RC costs 486.5 1.24 0.21 Total - C1 cash cost per payable pound of copper produced 39.8 0.10 0.02 Notes: Totals may not sum due to rounding; C1 cash costs are net of by product credits
Table 22-3: Smelter Terms Item Unit Value Concentrate Cu grade % 29.0 Cu concentrate moisture % 8.0 Cu concentrate losses % 0.10 Cu land freight $/wmt 11.58 Cu ocean freight $/wmt 40.00 Cu marketing and umpiring $/wmt 3.00 Cu insurance premium % 0.05 Cu treatment charge $/dmt 80.00 Cu pay factor % 96.5 Cu unit deduction % 0.0
Santo Domingo Project Region III, Chile
NI 43-101 Technical Report
Page 22-4
March 2020
Project Number: C40029
Item Unit Value Cu refining charge $/lb Cu 0.08 Magnetite concentrate grade % 66.0 Magnetite concentrate moisture % 8.0 Magnetite concentrate price $/dmt 80.00 Au pay factor % 97.0 Au unit deduction g/t 1.0 Au refining charge $/oz 5.00 Table 22-4: Copper and Magnetite Concentrate Transport and Insurance Charges
Item Unit Value Cu concentrate land freight $/wmt 11.58 Cu concentrate ocean freight $/wmt 40.00 Cu concentrate insurance % 0.05 Cu concentrate marketing and umpiring $/wmt 3.00 Magnetite concentrate land freight N/A In operating costs Magnetite concentrate ocean freight N/A FOB Santo Domingo port Magnetite concentrate insurance N/A FOB Santo Domingo port Magnetite concentrate marketing and umpiring N/A 0
Note: N/A = not applicable
For the transport and insurance charges for the magnetite concentrate, the following are included in the operating costs and the financial model: The magnetite concentrate is transferred to the port via pipeline with the costs
included in operating costs. The magnetite concentrate sales price is adjusted to free on board (FOB) Santo
Domingo port shipping basis. As such, no additional transport or insurance charges are required to be included in the financial model for iron concentrate.

Santo Domingo Project Region III, Chile
NI 43-101 Technical Report
Page 22-5
March 2020
Project Number: C40029
The Property was evaluated using a range of six different sets of metal prices. The ranges are shown in Table 22-5. The base case price is Case 4, reflecting averages of analysts’ medium-term projections. Table 22-5: Metal Prices Pay Metals Case 1 2 3 4 5 6 Copper $/lb 2.25 2.50 2.75 3.00 3.25 3.50 Gold $/oz 1,000 1,100 1,200 1,290 1,400 1,500 Iron (Fe 65%) $/t 65 70 75 80 85 90 Note: Base case is highlighted
Royalties of 2% NSR are payable to third parties on 100% of the production. The NSR is charged on all of the metals (copper, iron and gold) recovered. The LOM royalty payments are estimated to be $249.6 M. Working capital is considered to be a temporary use of funds, incurred at the start of operations, intended to fund mining and production operations until the full receipt of revenues. As revenues and costs typically vary from year to year, the working capital will also change each year. However, all working capital is theoretically recovered at the end of operations. The formal definition of working capital is the value of current assets minus current liabilities. To estimate working capital, three months of operating costs were assumed. On this basis, working capital is $25.6 M in the first year of operation and a LOM maximum of $61.0 M (on a previous year’s cumulative basis) in Year 2 and in Year 18. The economic analysis assumes that no inflationary adjustments are made. Capital and operating costs are based on Q3 2018 US dollars. Possible salvage values for the mine, plant and port were not considered, due to the approximately 18-year mine life. At closure, sale of assets may present an opportunity to offset a portion of the closure and reclamation costs.
22.4 Taxation Considerations
The economic analysis was completed on an after-tax basis with taxes payable in three forms: Government royalty or specific mining tax Corporate income tax
Santo Domingo Project Region III, Chile
NI 43-101 Technical Report
Page 22-6
March 2020
Project Number: C40029
VAT (referred to as IVA in Chile). The government mining royalty is a tax on operating mine income levied on a sliding scale between 5% and 14%, depending on operating margins. The royalty is estimated to be $262.7 M over the LOM and is deductible as an expense against corporate income tax. The corporate income tax consists of the First Category Tax (FCT) at 27%. Total FCT payments over the LOM are estimated to be $1,152.9 M. The Second Category or “Additional” Tax was not evaluated. This Second Category Tax is levied on dividend distributions to foreign shareholders. Value Added Tax (IVA) of 19% is applicable to a number of goods and services purchased; however, this tax is refundable once the mine is in operation. Other than the delay in the recovery of IVA charged during construction and the impact of the time value of money, the LOM net effect of IVA is zero. The evaluation was prepared on an all equity funded basis. There may be opportunities to use debt capital as funding and improve the equity return, but this will require planning to consider Chilean thin capitalization requirements, stamp duties and withholding taxes on interest. Capstone has signed a D.L. 600 Foreign Investment Contract to contribute the capital investment. The D.L. 600 Contract provides the ability to elect tax invariability treatment for a project.
22.5 Financing Considerations
Wood’s economic analysis is based on 100% owner equity financing. The reason for this is that a project with a return that exceeds the cost of borrowing tends to show increasingly improved results as more leverage is applied and more of the risk is transferred to a third party such as a bank.
22.6 Results of the Economic Analysis
The economic analysis is based on a real basis (no inflation). On an after-tax basis, the cumulative net cash flow is $3,250.5 M, the IRR is 21.8% and the payback period is 2.8 years. Based on the assumptions discussed in this Report, the cash flow analysis shows that the planned operations will generate positive cash flows from the first full year of production onwards.
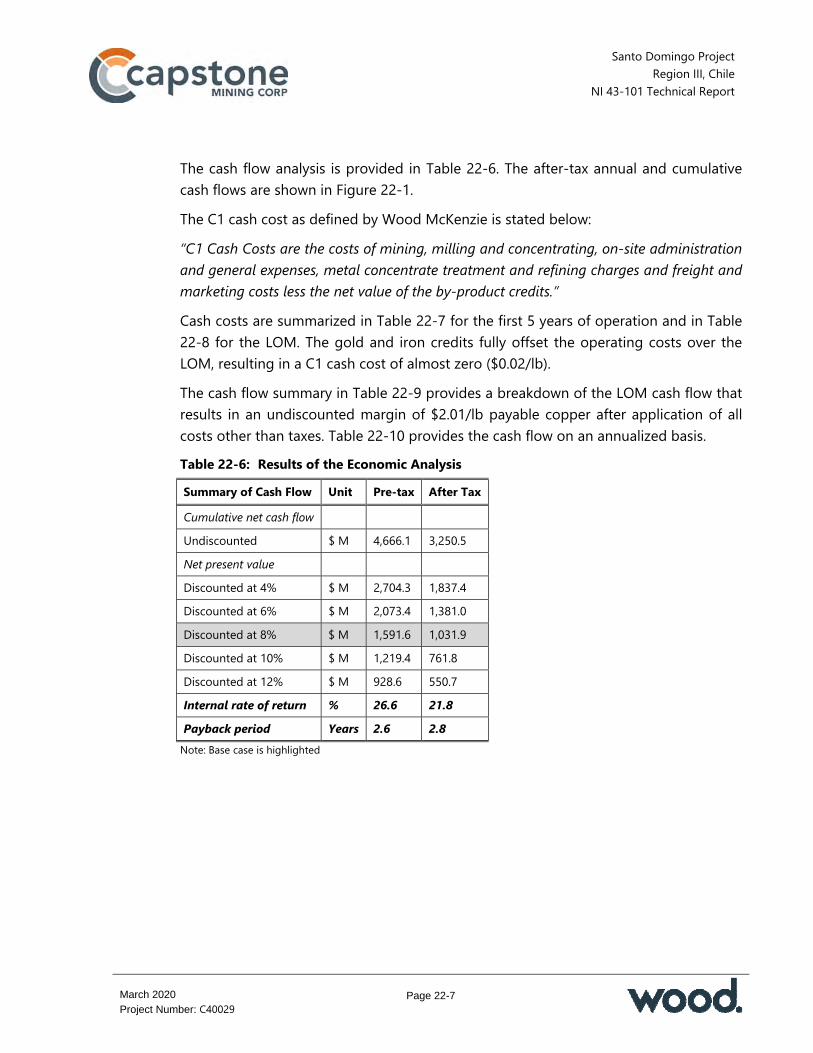
Santo Domingo Project Region III, Chile
NI 43-101 Technical Report
Page 22-7
March 2020
Project Number: C40029
The cash flow analysis is provided in Table 22-6. The after-tax annual and cumulative cash flows are shown in Figure 22-1. The C1 cash cost as defined by Wood McKenzie is stated below: “C1 Cash Costs are the costs of mining, milling and concentrating, on-site administration and general expenses, metal concentrate treatment and refining charges and freight and marketing costs less the net value of the by-product credits.”
Cash costs are summarized in Table 22-7 for the first 5 years of operation and in Table 22-8 for the LOM. The gold and iron credits fully offset the operating costs over the LOM, resulting in a C1 cash cost of almost zero ($0.02/lb). The cash flow summary in Table 22-9 provides a breakdown of the LOM cash flow that results in an undiscounted margin of $2.01/lb payable copper after application of all costs other than taxes. Table 22-10 provides the cash flow on an annualized basis. Table 22-6: Results of the Economic Analysis Summary of Cash Flow Unit Pre-tax After Tax Cumulative net cash flow
Undiscounted $ M 4,666.1 3,250.5 Net present value
Discounted at 4% $ M 2,704.3 1,837.4 Discounted at 6% $ M 2,073.4 1,381.0 Discounted at 8% $ M 1,591.6 1,031.9 Discounted at 10% $ M 1,219.4 761.8 Discounted at 12% $ M 928.6 550.7 Internal rate of return % 26.6 21.8 Payback period Years 2.6 2.8
Note: Base case is highlighted

Santo Domingo Project Region III, Chile
NI 43-101 Technical Report
Page 22-8
March 2020
Project Number: C40029
Figure 22-1: After Tax Cash Flow Summary
Note: Figure prepared by Wood, 2018
Table 22-7: Summary of Cash Costs First 5 Years
Cash Costs
Years 1–5 (Excludes 2022) ($ M)
Cost Per Tonne Milled ($/t)
Cost Per Pound Cu Payable ($/lb)
Costs Mining 781.1 6.60 0.63 Process 750.0 6.34 0.60 G&A 114.3 0.97 0.09 Smelter deductions 83.9 0.71 0.07 Treatment charges 161.9 1.37 0.13 Refining charges 100.4 0.85 0.08 Concentrate transport 121.4 1.03 0.10 Sub-total 2,113.1 17.87 1.69 Credits Au (224.0) (1.89) (0.18) Fe (1,303.1) (11.02) (1.04) Sub-total (1,527.2) (12.91) (1.22) C1 cash cost per payable pound of copper produced 586.0 4.96 0.47
Notes: Totals may not sum due to rounding; C1 cash costs are net of by product credits
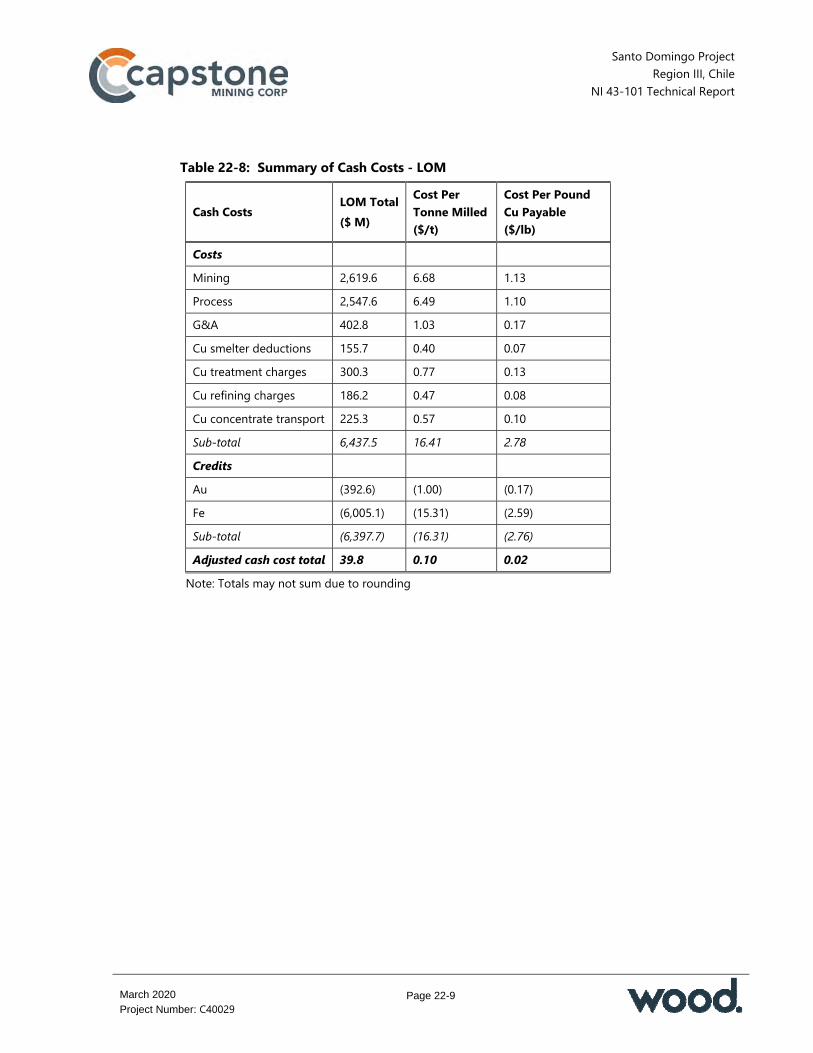
Santo Domingo Project Region III, Chile
NI 43-101 Technical Report
Page 22-9
March 2020
Project Number: C40029
Table 22-8: Summary of Cash Costs - LOM
Cash Costs LOM Total ($ M)
Cost Per Tonne Milled ($/t)
Cost Per Pound Cu Payable ($/lb)
Costs
Mining 2,619.6 6.68 1.13 Process 2,547.6 6.49 1.10 G&A 402.8 1.03 0.17 Cu smelter deductions 155.7 0.40 0.07 Cu treatment charges 300.3 0.77 0.13 Cu refining charges 186.2 0.47 0.08 Cu concentrate transport 225.3 0.57 0.10 Sub-total 6,437.5 16.41 2.78
Credits
Au (392.6) (1.00) (0.17) Fe (6,005.1) (15.31) (2.59) Sub-total (6,397.7) (16.31) (2.76)
Adjusted cash cost total 39.8 0.10 0.02 Note: Totals may not sum due to rounding

Santo Domingo Project Region III, Chile
NI 43-101 Technical Report
Page 22-10
March 2020
Project Number: C40029
Table 22-9: Summary of Cash Flow
Cost Item LOM ($ M)
Milled ($/t)
Cu Payable ($/lb)
Revenue (after losses and before deductions)
Cu 7,200.4 18.35 3.11 Au 392.6 1.00 0.17 Fe 6,005.1 15.31 2.59 Sub-Total 13,598.1 34.66 5.87
Smelting costs
Treatment (300.3) (0.77) (0.13) Cu deduction (252.0) (0.64) (0.11) Au deduction (155.7) (0.40) (0.07) Refining Cu (185.3) (0.47) (0.08) Refining Au (0.9) (0.00) (0.00) Transport (225.73) (0.57) (0.10) Sub-Total (1,119.5) (2.85) (0.48) Operating cost
Mining (2,619.6) (6.68) (1.13) Process (2,547.6) (6.49) (1.10) G&A (402.8) (1.03) (0.17) Sub-Total (5,570.0) (14.20) (2.40)
Other
Royalty (249.6) (0.64) (0.11) Closure (102.1) (0.26) (0.04) Total (351.6) (0.90) (0.15) Earnings before interest, taxes, depreciation, and amortization (EBITDA) 6,557.0 16.71 2.83
Construction capital (1,512.3) (3.85) (0.65) Sustaining capital (378.6) (0.97) (0.16) Undiscounted margin (cumulative net cash flow) 4,666.1 11.89 2.01
Note: Totals may not sum due to rounding

Santo Domingo Project Region III, Chile
NI 43-101 Technical Report
Page 22-11
March 2020
Project Number: C40029
Table 22-10: Cash Flow on an Annualized Basis Unit LOM (4) (3) (2) (1) 0 1 2 3 4 5 6 7 8 9 10 11 12 13 14 15 16 17 18 Metal prices Cu US$/lb 3.00 3.00 3.00 3.00 3.00 3.00 3.00 3.00 3.00 3.00 3.00 3.00 3.00 3.00 3.00 3.00 3.00 3.00 3.00 Au US$/oz 1,290 1,290 1,290 1,290 1,290 1,290 1,290 1,290 1,290 1,290 1,290 1,290 1,290 1,290 1,290 1,290 1,290 1,290 1,290 Iron ore US$/t 80 80 80 80 80 80 80 80 80 80 80 80 80 80 80 80 80 80 80 Extracted metal value (after losses & before deductions) Cu US$000 7,200,397 108,979 984,990 891,599 719,351 675,458 610,279 496,519 406,594 306,388 304,301 259,173 247,894 276,708 233,403 198,931 162,701 156,126 99,337 61,668 Au US$000 392,563 6,651 58,712 50,327 41,678 38,123 35,199 27,659 21,799 16,770 16,822 13,324 12,706 14,101 12,010 9,413 7,270 6,342 2,244 1,414 Fe concentrate US$000 6,005,123 30,781 216,135 266,116 305,745 323,594 191,531 213,719 307,955 318,218 284,411 313,823 382,697 368,136 400,354 431,917 431,935 431,461 431,249 355,347 Total US$000 13,598,083 146,411 1,259,837 1,208,042 1,066,774 1,037,175 837,008 737,897 736,347 641,376 605,534 586,320 643,297 658,945 645,767 640,262 601,906 593,929 532,829 418,429 Smelter deductions/premiums Cu US$000 (252,014) (3,814) (34,475) (31,206) (25,177) (23,641) (21,360) (17,378) (14,231) (10,724) (10,651) (9,071) (8,676) (9,685) (8,169) (6,963) (5,695) (5,464) (3,477) (2,158) Au US$000 (155,698) (2,357) (21,299) (19,280) (15,555) (14,606) (13,196) (10,736) (8,792) (6,625) (6,580) (5,604) (5,360) (5,983) (5,047) (4,302) (3,518) (3,376) (2,148) (1,333) Total US$000 (407,712) (6,171) (55,774) (50,485) (40,732) (38,247) (34,556) (28,115) (23,023) (17,349) (17,231) (14,675) (14,037) (15,668) (13,216) (11,264) (9,213) (8,840) (5,625) (3,492) Treatment charge Cu concentrate US$000 (300,326) (4,545) (41,084) (37,188) (30,004) (28,173) (25,455) (20,710) (16,959) (12,779) (12,692) (10,810) (10,340) (11,541) (9,735) (8,297) (6,786) (6,512) (4,143) (2,572) Refining charges Cu US$000 (185,290) (2,804) (25,347) (22,944) (18,511) (17,382) (15,705) (12,777) (10,463) (7,884) (7,831) (6,669) (6,379) (7,121) (6,006) (5,119) (4,187) (4,018) (2,556) (1,587) Au US$000 (918) (17) (145) (120) (101) (91) (85) (66) (50) (39) (40) (30) (28) (31) (27) (20) (15) (11) (0) (0) Total US$000 (186,208) (2,821) (25,492) (23,064) (18,613) (17,473) (15,790) (12,843) (10,513) (7,924) (7,870) (6,699) (6,408) (7,152) (6,033) (5,139) (4,201) (4,029) (2,557) (1,587) Cu concentrate transport Land freight US$000 (47,300) (716) (6,470) (5,857) (4,725) (4,437) (4,009) (3,262) (2,671) (2,013) (1,999) (1,703) (1,628) (1,818) (1,533) (1,307) (1,069) (1,026) (653) (405) Port storage & handling US$000
Ocean freight US$000 (163,384) (2,473) (22,350) (20,231) (16,323) (15,327) (13,848) (11,266) (9,226) (6,952) (6,905) (5,881) (5,625) (6,279) (5,296) (4,514) (3,692) (3,543) (2,254) (1,399) Marketing & other US$000 (11,273) (171) (1,542) (1,396) (1,126) (1,058) (956) (777) (637) (480) (476) (406) (388) (433) (365) (311) (255) (244) (156) (97) Insurance charges US$000 (3,316) (51) (456) (411) (332) (312) (282) (229) (187) (141) (140) (119) (114) (127) (107) (91) (74) (71) (44) (27) Total US$000 (225,273) (3,410) (30,819) (27,896) (22,507) (21,133) (19,094) (15,534) (12,721) (9,586) (9,521) (8,108) (7,755) (8,657) (7,302) (6,223) (5,090) (4,884) (3,106) (1,928) Net smelter return US$000 12,478,564 129,463 1,106,668 1,069,408 954,918 932,149 742,113 660,695 673,132 593,738 558,220 546,028 604,758 615,927 609,481 609,338 576,616 569,664 517,398 408,849 Third party royalty payment Net smelter return US$000 12,478,564 129,463 1,106,668 1,069,408 954,918 932,149 742,113 660,695 673,132 593,738 558,220 546,028 604,758 615,927 609,481 609,338 576,616 569,664 517,398 408,849 Portion of production (non-cash) % 100% 100% 100% 100% 100% 100% 100% 100% 100% 100% 100% 100% 100% 100% 100% 100% 100% 100% 100% 100% Royalty percentage of NSR (non-cash) % 2.00% 2.00% 2.00% 2.00% 2.00% 2.00% 2.00% 2.00% 2.00% 2.00% 2.00% 2.00% 2.00% 2.00% 2.00% 2.00% 2.00% 2.00% 2.00% 2.00% Applied royalty US$000 (249,571) (2,589) (22,133) (21,388) (19,098) (18,643) (14,842) (13,214) (13,463) (11,875) (11,164) (10,921) (12,095) (12,319) (12,190) (12,187) (11,532) (11,393) (10,348) (8,177) Production costs Mining US$000 (2,619,572) (59,757) (144,730) (149,316) (165,633) (164,585) (156,794) (139,048) (142,214) (155,784) (164,834) (159,090) (160,671) (160,012) (138,459) (145,888) (139,466) (130,143) (79,701) (63,448) Process US$000 (2,547,558) (25,285) (147,762) (151,009) (150,210) (150,095) (150,957) (141,311) (141,777) (142,744) (141,603) (141,678) (143,606) (142,074) (142,025) (143,451) (132,925) (122,650) (138,529) (97,867) G&A US$000 (402,844) (14,042) (24,461) (22,470) (22,401) (22,487) (22,506) (22,414) (22,446) (22,558) (22,485) (21,782) (21,681) (21,688) (21,594) (21,559) (21,548) (21,106) (20,826) (12,787) Total US$000 (5,569,973) (99,084) (316,953) (322,795) (338,244) (337,167) (330,257) (302,773) (306,438) (321,086) (328,922) (322,550) (325,959) (323,774) (302,078) (310,898) (293,940) (273,899) (239,056) (174,102) Cash Cost US$/lb 0.02 2.13 0.51 0.40 0.33 0.26 0.90 0.76 0.20 0.23 0.66 0.32 (0.50) (0.28) (1.09) (1.66) (2.40) (2.89) (5.71) (8.83) Closure & salvage Closure costs US$000 (102,052) (102,052) Total US$000 (102,052) (102,052) Earnings Earnings before taxes. depreciation & amortization US$000 6,556,967 27,790 767,582 725,225 597,576 576,339 397,014 344,709 353,231 260,777 218,133 212,557 266,704 279,834 295,213 286,253 271,144 284,372 267,994 124,518 Taxation Operation incomes and expenses US$000 6,908,590 30,380 789,715 746,613 616,674 594,982 411,857 357,922 366,694 272,652 229,298 223,478 278,799 292,153 307,403 298,440 282,676 295,765 278,342 234,747 Royalty payment US$000 (249,571) (2,589) (22,133) (21,388) (19,098) (18,643) (14,842) (13,214) (13,463) (11,875) (11,164) (10,921) (12,095) (12,319) (12,190) (12,187) (11,532) (11,393) (10,348) (8,177) Start-up expenses (corporate tax) (non-cash) US$000 (133,395) (133,395)
Tax loss (non-cash) US$000 (1,446,894) (701,897) (501,690) (243,306)
Tax depreciation for the first category income tax (non-cash) US$000 (1,890,879) (596,292) (535,294) (438,103) (56,992) (59,316) (17,538) (18,291) (11,791) (17,409) (38,591) (33,560) (9,736) (8,785) (8,933) (7,205) (17,465) (14,975) (599) (4)

Santo Domingo Project Region III, Chile
NI 43-101 Technical Report
Page 22-12
March 2020
Project Number: C40029
Unit LOM (4) (3) (2) (1) 0 1 2 3 4 5 6 7 8 9 10 11 12 13 14 15 16 17 18 Mine closure US$000 (102,052) (17,009) (17,009) (17,009) (17,009) (17,009) (17,009)
Mining royalty (specific tax for mining) US$000 (262,739) (32,081) (28,738) (19,692) (18,313) (9,305) (8,407) (10,229) (5,748) (8,511) (8,957) (11,860) (12,674) (14,047) (13,607) (14,064) (16,033) (16,043) (14,429) Taxable income (non-cash) US$000 2,823,060 (701,897) (501,690) (243,306) 277,586 498,711 370,171 318,010 331,212 237,621 171,031 170,040 245,107 241,367 255,224 248,432 222,606 236,355 234,343 212,137 First category income tax A 1,152,887 74,948 134,652 99,946 85,863 89,427 64,158 46,178 45,911 66,179 65,169 68,910 67,077 60,104 63,816 63,273 57,277 Tax depreciation for the first category income tax (non-cash) US$000 1,890,879 596,292 535,294 438,103 56,992 59,316 17,538 18,291 11,791 17,409 38,591 33,560 9,736 8,785 8,933 7,205 17,465 14,975 599 4 Regular tax depreciation (non-cash) US$000 (1,872,553) (179,010) (184,182) (186,105) (188,640) (189,644) (194,209) (181,367) (151,880) (151,942) (50,561) (35,376) (34,385) (34,814) (33,705) (30,962) (17,477) (11,622) (8,856) (7,818) Start-up expenses (corporate tax) (non-cash) US$000 133,395 133,395
Start-up expenses (specific tax for mining) (non-cash) US$000 (133,395) (22,233) (22,233) (22,233) (22,233) (22,233) (22,233)
Royalty payment (2% NSR) US$000 249,571 2,589 22,133 21,388 19,098 18,643 14,842 13,214 13,463 11,875 11,164 10,921 12,095 12,319 12,190 12,187 11,532 11,393 10,348 8,177 Tax loss (non-cash) US$000 1,446,894 701,897 501,690 243,306
Mine closure US$000 102,052 17,009 17,009 17,009 17,009 17,009 17,009
Taxable base for the mining royalty (specific tax for mining) (non-cash) US$000 4,639,904 (170,863) 551,220 509,538 386,111 364,793 186,109 168,148 204,585 114,962 170,225 179,145 232,554 244,666 259,651 253,871 251,135 268,110 253,443 212,500 Tax rate for the mining royalty (specific tax for mining) (non-cash) % 5.66 0.00% 5.82% 5.64% 5.10% 5.02% 5.00% 5.00% 5.00% 5.00% 5.00% 5.00% 5.10% 5.18% 5.41% 5.36% 5.60% 5.98% 6.33% 6.79% Mining royalty (specific tax for mining) B US$000 262,739 32,081 28,738 19,692 18,313 9,305 8,407 10,229 5,748 8,511 8,957 11,860 12,674 14,047 13,607 14,064 16,033 16,043 14,429 Tax amount (A+B) US$000 (1,415,626) (32,081) (28,738) (94,640) (152,964) (109,252) (94,270) (99,656) (69,906) (54,690) (54,868) (78,039) (77,843) (82,958) (80,684) (74,167) (79,849) (79,316) (71,706) Interim payment of absorbed earnings Value-added tax (IVA) Payment value added tax purchase (IVA) (Capex) US$000 (195,980) (79) (13,688) (79,762) (82,562) (18,919) (971)
Payment value added tax costs (IVA) US$000 (1,125,604) (19,300) (75,500) (74,477) (73,395) (72,261) (69,671) (62,510) (61,192) (61,531) (62,825) (60,759) (61,098) (61,348) (56,702) (57,464) (53,780) (50,211) (43,024) (48,554) Outstanding IVA CF US$000 (79)
Recuperation value added tax (net zero) US$000 1,321,584 13,767 79,762 101,862 94,420 75,448 73,395 72,261 69,671 62,510 61,192 61,531 62,825 60,759 61,098 61,348 56,702 57,464 53,780 50,211 43,024 48,554 Payment value added tax US$000 (1,321,584) (79) (13,688) (79,762) (101,862) (94,420) (75,448) (73,395) (72,261) (69,671) (62,510) (61,192) (61,531) (62,825) (60,759) (61,098) (61,348) (56,702) (57,464) (53,780) (50,211) (43,024) (48,554) Capital expenditure Construction US$000 (1,512,277) (15,094) (171,064) (625,198) (700,439) (482)
Sustaining US$000 (378,602) (98,614) (36,254) (18,204) (17,933) (9,007) (39,282) (2,277) (111) (37,856) (43,229) (17,925) (468) (20,412) (1,333) (5,441) (30,010) (249)
Working capital US$000 (25,623) (61,320) (730) (2,515) 613 2,237 7,761 (213) (2,878) (1,943) 1,946 (764) 321 5,763 (1,935) 4,523 5,062 9,155 60,541 Construction. sustaining & working capital US$000 (1,890,879) (15,094) (171,064) (625,198) (824,677) (98,056) (18,933) (20,448) (8,394) (37,045) 5,484 (323) (40,734) (45,172) (15,978) (1,232) (20,091) 4,430 (7,376) (25,487) 4,813 9,155 60,541 Net Project Cash Flow Pre-tax US$000 4,666,088 (15,094) (171,064) (625,198) (796,887) 669,525 706,292 577,128 567,945 359,970 350,193 352,908 220,043 172,962 196,579 265,472 259,743 299,643 278,877 245,657 289,185 277,149 185,058 After tax US$000 3,250,461 (15,173) (170,985) (625,198) (796,887) 637,444 677,554 482,488 414,981 250,718 255,923 253,252 150,137 118,272 141,711 187,433 181,900 216,685 198,193 171,490 209,336 197,833 113,353 Payback Pre-tax cumulative net cash flow US$000 (15,094) (186,158) (811,356) (1,608,242) (938,717) (232,425) 344,703 912,648 1,272,618 1,622,811 1,975,719 2,195,762 2,368,723 2,565,302 2,830,775 3,090,518 3,390,161 3,669,038 3,914,695 4,203,881 4,481,029 4,666,088 After tax cumulative net cash flow US$000 (15,173) (186,158) (811,356) (1,608,242) (970,798) (293,244) 189,244 604,225 854,943 1,110,866 1,364,117 1,514,255 1,632,527 1,774,238 1,961,671 2,143,571 2,360,257 2,558,450 2,729,940 2,939,276 3,137,109 3,250,461
Note: Totals may not sum due to rounding

Santo Domingo Project Region III, Chile
NI 43-101 Technical Report
Page 22-13
March 2020
Project Number: C40029
22.7 Sensitivity Analysis
A sensitivity analysis was performed on the financial model taking into account variations in: Metal price (copper and iron) Operating costs (including power) Capital costs Exchange rates.
Error! Not a valid bookmark self-reference. shows the sensitivity of the IRR and Figure 22-3 shows the sensitivity of the NPV8% to the variations imposed in the parameters listed in the bullet points above. Sensitivities to copper and iron grades are not shown, because changes in copper and iron grades are mirrored by the sensitivities to changes in the copper and iron prices, respectively. Figure 22-2: Sensitivity of IRR
Note: Figure prepared by Wood, 2018

Santo Domingo Project Region III, Chile
NI 43-101 Technical Report
Page 22-14
March 2020
Project Number: C40029
Figure 22-3: Sensitivity of NPV8% ($ x 1,000)
Note: Figure prepared by Wood, 2018
The analysis shows that the Santo Domingo NPV8% is most sensitive to changes in the copper price (copper grade) and in total operating and capital expenditures. The sensitivity analysis showed that Santo Domingo is less sensitive to changes in the iron price (iron grade) and the dollar/peso exchange rate and least sensitive to changes in power costs. Because the estimates are priced in US dollars, the effects of exchange rate variation other than the CLP do not apply in the current model, although in reality some equipment, supplies and services may be priced in other currencies such as the Euro. In addition to the base case metal prices five other sets of metal prices were considered. The sensitivity to metal price fluctuations is summarized in Table 22-11.
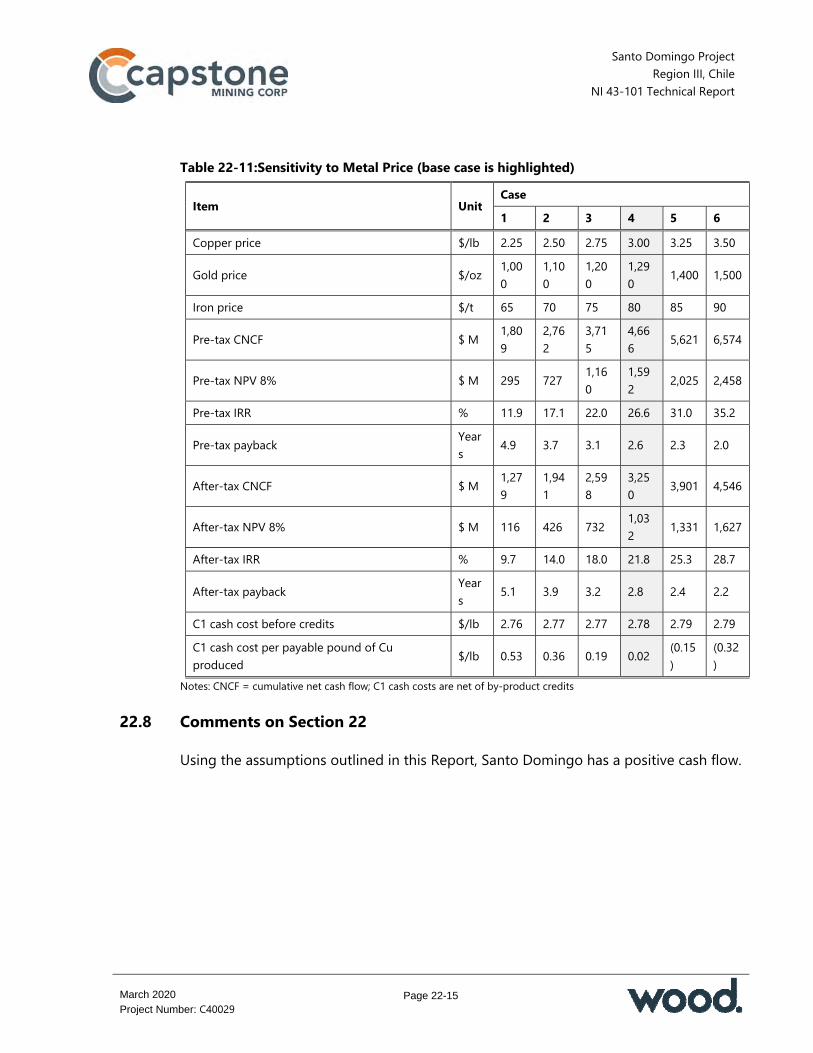
Santo Domingo Project Region III, Chile
NI 43-101 Technical Report
Page 22-15
March 2020
Project Number: C40029
Table 22-11: Sensitivity to Metal Price (base case is highlighted)
Item Unit Case 1 2 3 4 5 6
Copper price $/lb 2.25 2.50 2.75 3.00 3.25 3.50
Gold price $/oz 1,000
1,100
1,200
1,290 1,400 1,500
Iron price $/t 65 70 75 80 85 90
Pre-tax CNCF $ M 1,809
2,762
3,715
4,666 5,621 6,574
Pre-tax NPV 8% $ M 295 727 1,160
1,592 2,025 2,458
Pre-tax IRR % 11.9 17.1 22.0 26.6 31.0 35.2
Pre-tax payback Years 4.9 3.7 3.1 2.6 2.3 2.0
After-tax CNCF $ M 1,279
1,941
2,598
3,250 3,901 4,546
After-tax NPV 8% $ M 116 426 732 1,032 1,331 1,627
After-tax IRR % 9.7 14.0 18.0 21.8 25.3 28.7
After-tax payback Years 5.1 3.9 3.2 2.8 2.4 2.2
C1 cash cost before credits $/lb 2.76 2.77 2.77 2.78 2.79 2.79 C1 cash cost per payable pound of Cu produced $/lb 0.53 0.36 0.19 0.02 (0.15
) (0.32)
Notes: CNCF = cumulative net cash flow; C1 cash costs are net of by-product credits
22.8 Comments on Section 22
Using the assumptions outlined in this Report, Santo Domingo has a positive cash flow.
Santo Domingo Project Region III, Chile
NI 43-101 Technical Report
Page 23-1
March 2020
Project Number: C40029
23.0 ADJACENT PROPERTIES
This section is not relevant to this Report.

Santo Domingo Project Region III, Chile
NI 43-101 Technical Report
Page 24-1
March 2020
Project Number: C40029
24.0 OTHER RELEVANT DATA AND INFORMATION
24.1 Introduction to 2020 PEA
The 2020 PEA that follows is an alternative development option to assess the installation of a circuit during Year 3 of operations to recover cobalt from the plant tailings. The 2020 PEA is a significant change to the process plant, capital and operating costs, recovered products and revenues, from that in the 2019 Technical Report. The 2020 PEA mine plan is based on Measured and Indicated Mineral Resources and there is no certainty that the PEA based on these Mineral Resources will be realized. The information presented in Sections 1 to 14 of the Report also pertains to the 2020 PEA, as do Section 23 and Sections 25 to 27 and therefore these sections are not repeated in this sub-section. Information relating to the equivalent Sections 15 to 22 content for the 2020 PEA is provided in the following sub-sections. Years presented in the 2020 PEA are for illustrative purposes only.
24.2 Mineral Reserve Estimates Note in Relation to 2020 PEA
This section is not relevant to the 2020 PEA, as the 2020 PEA mine plan is based on Mineral Resources only.
24.3 2020 PEA Mining Methods
24.3.1 Subset of Mineral Resources within the 2020 PEA Mine Plan
The subset of the Mineral Resource estimate included in the PEA mine plan is provided in Table 24-1. Mineral Resources are not Mineral Reserves and do not have demonstrated economic viability.
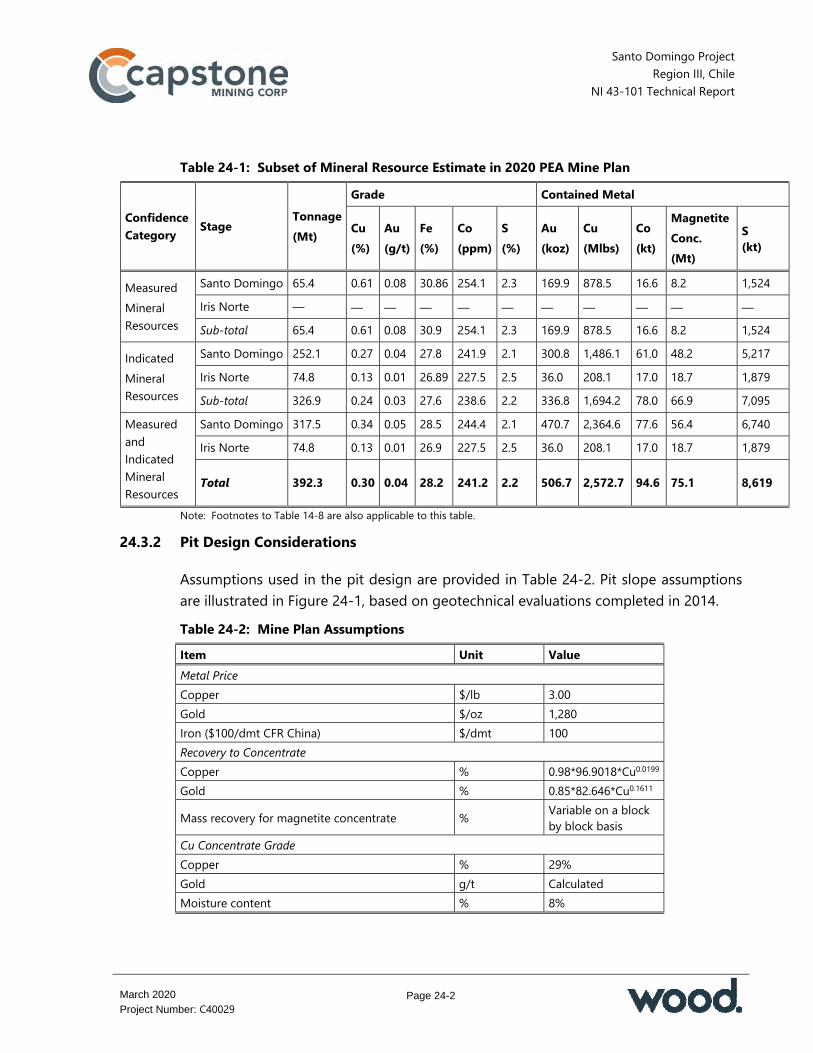
Santo Domingo Project Region III, Chile
NI 43-101 Technical Report
Page 24-2
March 2020
Project Number: C40029
Table 24-1: Subset of Mineral Resource Estimate in 2020 PEA Mine Plan
Confidence Category Stage Tonnage
(Mt)
Grade Contained Metal
Cu (%)
Au (g/t)
Fe (%)
Co (ppm)
S (%)
Au (koz)
Cu (Mlbs)
Co (kt)
Magnetite Conc. (Mt)
S (kt)
Measured Mineral Resources
Santo Domingo 65.4 0.61 0.08 30.86 254.1 2.3 169.9 878.5 16.6 8.2 1,524 Iris Norte — — — — — — — — — — — Sub-total 65.4 0.61 0.08 30.9 254.1 2.3 169.9 878.5 16.6 8.2 1,524
Indicated Mineral Resources
Santo Domingo 252.1 0.27 0.04 27.8 241.9 2.1 300.8 1,486.1 61.0 48.2 5,217 Iris Norte 74.8 0.13 0.01 26.89 227.5 2.5 36.0 208.1 17.0 18.7 1,879 Sub-total 326.9 0.24 0.03 27.6 238.6 2.2 336.8 1,694.2 78.0 66.9 7,095
Measured and Indicated Mineral Resources
Santo Domingo 317.5 0.34 0.05 28.5 244.4 2.1 470.7 2,364.6 77.6 56.4 6,740 Iris Norte 74.8 0.13 0.01 26.9 227.5 2.5 36.0 208.1 17.0 18.7 1,879
Total 392.3 0.30 0.04 28.2 241.2 2.2 506.7 2,572.7 94.6 75.1 8,619
Note: Footnotes to Table 14-8 are also applicable to this table.
24.3.2 Pit Design Considerations
Assumptions used in the pit design are provided in Table 24-2. Pit slope assumptions are illustrated in Figure 24-1, based on geotechnical evaluations completed in 2014. Table 24-2: Mine Plan Assumptions Item Unit Value Metal Price Copper $/lb 3.00 Gold $/oz 1,280 Iron ($100/dmt CFR China) $/dmt 100 Recovery to Concentrate Copper % 0.98*96.9018*Cu0.0199 Gold % 0.85*82.646*Cu0.1611
Mass recovery for magnetite concentrate % Variable on a block by block basis
Cu Concentrate Grade Copper % 29% Gold g/t Calculated Moisture content % 8%

Santo Domingo Project Region III, Chile
NI 43-101 Technical Report
Page 24-3
March 2020
Project Number: C40029
Item Unit Value Magnetite Concentrate Grade Iron %Fe 66% Moisture content % 8% Smelter Payables Copper in Cu concentrate % 100% Payable copper % 96.50% Gold in all concentrate % 97%
Gold deduction in all concentrate g/t in concentrate 0
Off-Site Costs Cu conc. treatment $/dmt conc. 80 Cu refining charge $/lb pay Cu 0.08 Au refining charge $/oz pay Au 5.0
Shipping copper concentrate $/wmt concentrate Cu 33
Shipping magnetite concentrate $/dmt concentrate Fe 20
Operating Cost Waste mining cost $/waste tonne 1.75
Mineralized material mining cost $/tonne of mineralized material
1.75
Processing + G&A $/t processed 7.53 Average Overall Pit Slope Angle
SDS/Iris & Iris Norte
Overburden 37.6˚ Sector 1 South 43.6˚ Sector 2 West 43.6˚ Sector 3 North 43.6˚ Sector 4 East 40.2˚
Other Grade factor (1-Dilution) % 100 Mining recovery % 100 Royalties % 2 Discount rate % 8 Note: FOB = free on board. SDS = Santo Domingo Sur.
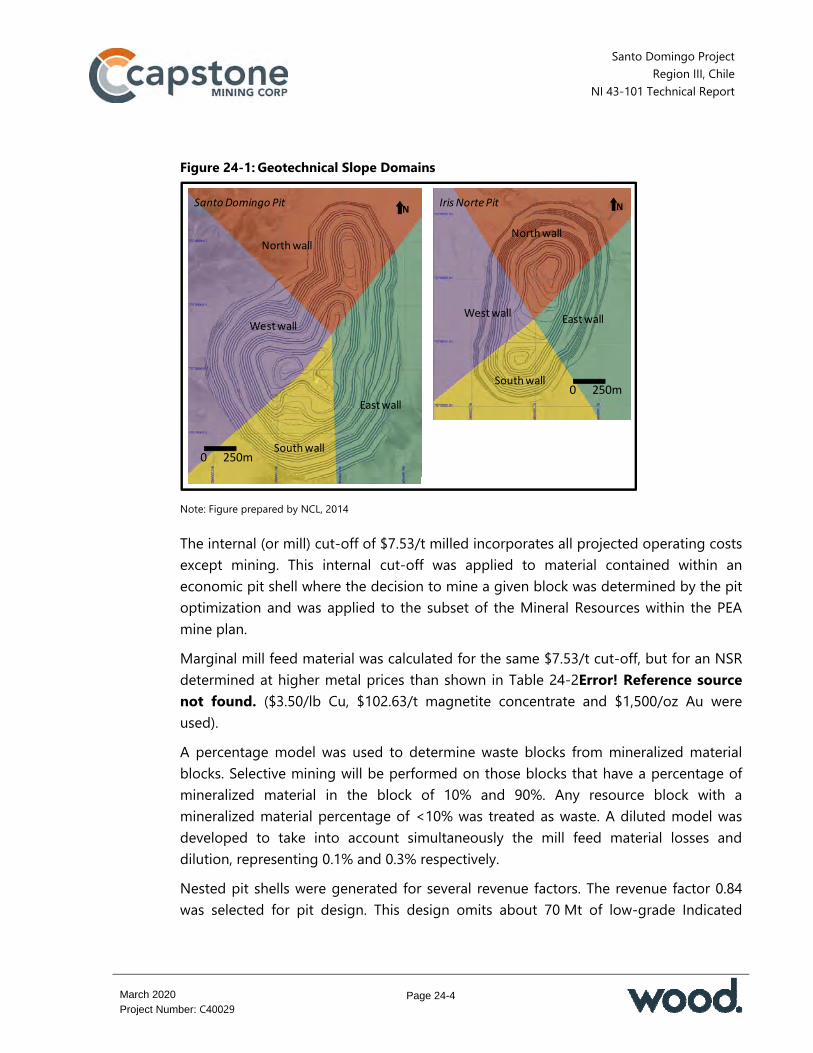
Santo Domingo Project Region III, Chile
NI 43-101 Technical Report
Page 24-4
March 2020
Project Number: C40029
Figure 24-1: Geotechnical Slope Domains
NIris Norte Pit
0 250m
East wall
South wall
West wall
North wall
0 250m
NSanto Domingo Pit
East wall
South wall
West wall
North wall
Note: Figure prepared by NCL, 2014
The internal (or mill) cut-off of $7.53/t milled incorporates all projected operating costs except mining. This internal cut-off was applied to material contained within an economic pit shell where the decision to mine a given block was determined by the pit optimization and was applied to the subset of the Mineral Resources within the PEA mine plan. Marginal mill feed material was calculated for the same $7.53/t cut-off, but for an NSR determined at higher metal prices than shown in Table 24-2Error! Reference source not found. ($3.50/lb Cu, $102.63/t magnetite concentrate and $1,500/oz Au were used). A percentage model was used to determine waste blocks from mineralized material blocks. Selective mining will be performed on those blocks that have a percentage of mineralized material in the block of 10% and 90%. Any resource block with a mineralized material percentage of <10% was treated as waste. A diluted model was developed to take into account simultaneously the mill feed material losses and dilution, representing 0.1% and 0.3% respectively. Nested pit shells were generated for several revenue factors. The revenue factor 0.84 was selected for pit design. This design omits about 70 Mt of low-grade Indicated
Santo Domingo Project Region III, Chile
NI 43-101 Technical Report
Page 24-5
March 2020
Project Number: C40029
Mineral Resources that would require a separate cutback and would affect the selected sites for waste rock storage. The 2020 PEA mine plan was designed with 12 m benches stacked to 24 m (i.e. double benching) for the fresh rock material. A security berm would be placed at nominal 40 m intervals for each 100–150 m of pit wall. Mining costs were based on blasting 12 m benches for the waste zones and for the mineralized material. Mining phase widths were assumed to be 100 m. Haul roads were anticipated to be 40 m wide and had a 10% assumed gradient. The Santo Domingo pit will be about 2,200 m long in the north–south direction and 1,500 m wide in the east–west direction, with a base at approximately the 676 m elevation. The pit will have two exits on the west side to provide access to the run-of-mine (ROM) pad area and the primary crusher. The Iris Norte pit will be approximately 1,600 m long in the north–south direction and 900 m wide in the east–west direction with a base at approximately the 664 m elevation. There will be a single exit on the east side of the pit to access the planned waste rock facility area. Final pit layout plans are provided in Figure 24-2 and Figure 24-3. Seven pit phases are planned; four for Santo Domingo Sur and three for Iris Norte.
24.3.3 Production Plan
A mine production schedule was developed to show the mill feed material tonnes, metal grades, waste material and total material by year, throughout the LOM (Table 24-3). The schedule was based on process plant throughput of 65,000 t/d for the first 5 years and 60,000 t/d from Year 6 (23.7 Mt/y and 21.9 Mt/y). The mined material movement will peak at 107.5 Mt/y during Years 1 to 4. The production was limited by the number of benches that it is possible to mine in a single phase in a year, or the amount of vertical development per phase. The pre-production period requires the mining of about 45 Mt of total material to expose sufficient mill feed material to start commercial production in Year 1. The pre-production period will be approximately 15 months. The mill feed material mined during pre-production will be stockpiled in the ROM pad area and will make up part of the Year 1 production. The total stockpiled material is forecast at 0.5 Mt.

Santo Domingo Project Region III, Chile
NI 43-101 Technical Report
Page 24-6
March 2020
Project Number: C40029
Figure 24-2: 2020 PEA Pit Layout Plan, Santo Domingo
Note: Figure prepared by NCL, 2018. Map north is to right of plan. Grid indicates scale. Grid squares are 1 km x 1 km.

Santo Domingo Project Region III, Chile
NI 43-101 Technical Report
Page 24-7
March 2020
Project Number: C40029
Figure 24-3: 2020 PEA Pit Layout Plan, Iris Norte
Note: Figure prepared by NCL, 2018. Map north is to right of plan. Grid indicates scale. Grid squares are 1 km x 1 km.

Santo Domingo Project Region III, Chile
NI 43-101 Technical Report
Page 24-8
March 2020
Project Number: C40029
Table 24-3: 2020 PEA Production Schedule Forecast
Year Mill Feed Material Marginal Mill Feed Material Oxide
(Cu>0.2%) ('000 t)
Waste ('000 t)
Total ('000 t) ('000 t) Cu (%) Au (g/t) Fe
(%) Co (ppm) S (%)
Wi (kWh/t)
('000 t) Cu (%) Au (g/t) Fe (%) Co (ppm) S
(%) Wi (kWh/t)
Y-1 — — — — — — — — — — — — — — 69 19,931 20,000 Y0 H1 476 0.723 0.11 29.08 329.59 3.1 13.0 — — — — — — — 237 24,287 25,000 Y0 H2 2,507 0.684 0.09 32.86 302.31 2.8 12.1 — — — — — — — 3,928 48,564 55,000 Y01 22,963 0.676 0.09 31.62 257.01 2.4 12.1 32 0.126 0.01 10.57 79.24 1.1 18.7 2,514 81,992 107,500 Y02 23,932 0.599 0.08 29.69 250.49 2.4 12.5 28 0.127 0.02 16.02 107.53 1.1 17.6 1,274 82,266 107,500 Y03 23,916 0.486 0.07 30.62 233.88 2.1 12.1 143 0.123 0.01 17.29 153.58 1.2 16.0 345 83,095 107,500 Y04 23,925 0.457 0.06 30.56 266.38 2.3 12.2 86 0.117 0.01 17.45 171.57 1.2 16.0 979 82,510 107,500 Y05 24,266 0.409 0.06 26.78 262.58 2.1 13.4 301 0.105 0.01 18.18 166.47 1.1 15.8 47 71,586 96,200 Y06 22,509 0.367 0.05 27.17 259.70 2.3 13.1 260 0.094 0.01 17.47 177.63 1.7 16.1 502 72,929 96,200 Y07 22,384 0.301 0.04 27.90 291.15 2.4 12.6 193 0.094 0.01 20.87 182.31 1.4 14.8 2,582 71,040 96,200 Y08 22,433 0.228 0.03 27.72 297.16 2.4 12.7 423 0.081 0.01 20.57 103.22 0.8 14.6 4,373 68,970 96,200 Y09 22,277 0.227 0.03 26.23 251.95 2.0 13.1 190 0.061 0.01 19.17 127.16 0.9 15.2 945 72,788 96,200 Y10 21,955 0.193 0.03 25.65 196.75 1.8 13.4 87 0.085 0.01 16.46 138.64 1.1 16.3 — 74,159 96,200 Y11 22,115 0.184 0.03 26.31 164.66 1.5 13.3 12 0.122 0.02 13.61 300.93 1.1 17.4 1,997 72,077 96,200 Y12 22,498 0.206 0.03 25.78 180.66 1.6 13.1 53 0.063 0.01 15.94 168.78 1.4 16.2 858 72,791 96,200 Y13 22,045 0.175 0.03 26.54 200.41 2.1 12.9 55 0.092 0.02 16.10 133.57 1.6 16.2 164 57,236 79,500 Y14 19,583 0.147 0.02 28.52 211.24 1.7 12.4 139 0.107 0.02 20.08 222.54 1.7 15.0 1,729 58,049 79,500 Y15 16,332 0.125 0.02 29.35 226.29 2.4 12.2 129 0.104 0.02 24.02 255.75 1.5 13.9 — 63,039 79,500 Y16 17,277 0.144 0.02 31.42 261.12 2.5 11.6 70 0.087 0.01 30.54 194.82 1.3 12.1 964 53,189 71,500 Y17 20,695 0.080 0.01 28.46 265.39 2.7 12.2 105 0.087 0.01 35.30 149.27 0.7 11.3 — 15,201 36,000 Y18 15,915 0.065 0.01 27.24 262.64 3.3 12.5 19 0.043 0.00 26.02 245.06 1.5 12.9 — 9,064 24,998 Total 390,001 0.299 0.04 28.21 241.67 2.2 12.6 2,325 0.093 0.01 20.08 159.71 1.2 15.1 23,509 1,254,763 1,670,598
Santo Domingo Project Region III, Chile
NI 43-101 Technical Report
Page 24-9
March 2020
Project Number: C40029
Mill throughput will be restricted to the maximum magnetite concentrate production of 4.5 Mt/y up to Year 10; and to 5.4 Mt/y from Year 11 onward. Mineralized material will be hauled to the primary crusher for direct tipping. Marginal mill feed material will be mined and hauled to a stockpile to be located between the Santo Domingo and Iris Norte pits until Year 13. This material will be re-handled and will become part of the plant feed in the later years. From Year 14 on, the marginal mineralized material will be sent directly to the plant. The total marginal mineralized material amounts to about 2.3 Mt and the maximum size of the marginal stockpile is approximately 4.5 Mt. The oxide material was treated as waste in the mine plan. No economic process has been defined to treat this material; however, an area was set aside for stockpiling the oxide material with copper content greater than 0.2% so that this material can be recovered for possible future processing. The total mined waste considers two main destinations for the material; the main waste rock storage areas and the TSF for the embankment construction. Three WRF areas at the west and south of the pits were assumed (see discussion in Section 24.5.3).
24.3.4 Mining Equipment
Mine equipment requirements were calculated based on the annual mine production schedule, the mine work schedule and equipment annual production capacity estimates. The mine major equipment was selected based on the mine production schedule, 15 months of pre-production and approximately 18 years of commercial mining operations. The peak equipment requirements for the pre-production and mine life are included as Table 24-4. The 2020 PEA assumes: During pre-production one shovel will be required. Four operating shovels will be
required for the commercial production period from Year 1 through Year 12, the number will then drop to the end of mine life as less material is mined
The number of front-end loaders required is less than one for all of the mine life. The front-end loader will also be used as back-up for production loading activities
The number of trucks required during pre-production is six. The requirement gradually increases from 19 units in Year 1 to a maximum of 29 units in Years 9 to 11, then decreases to the end of mine life as less material is mined
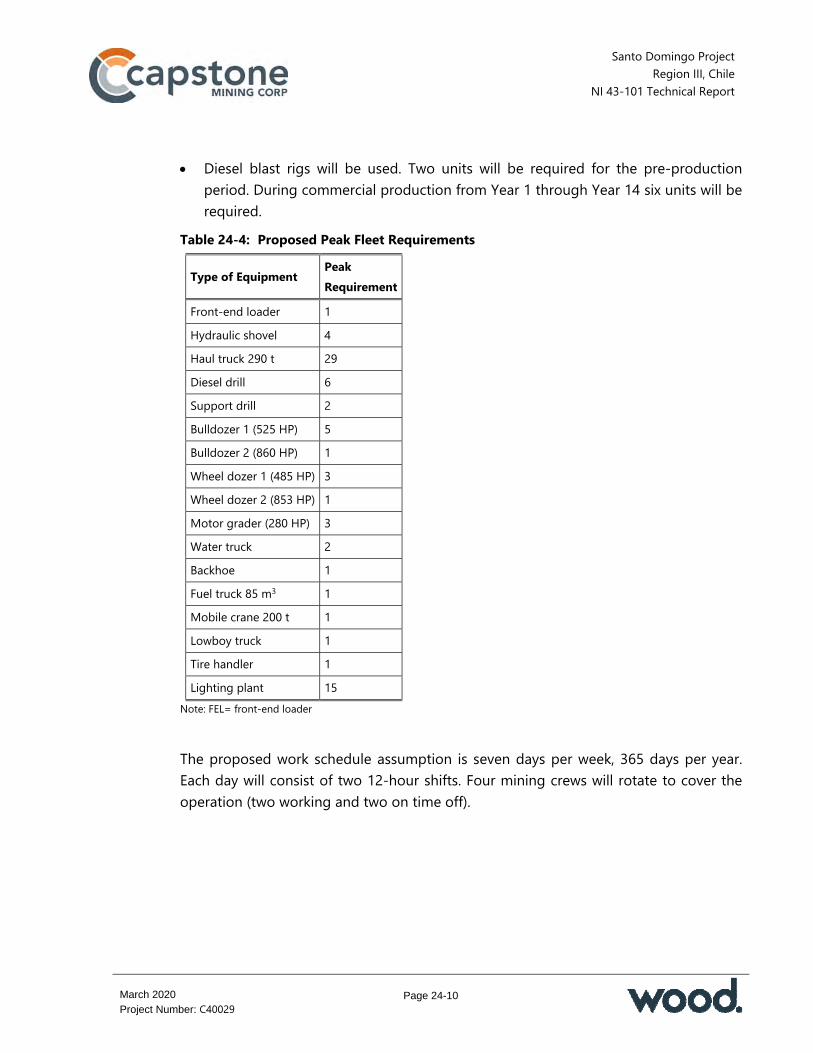
Santo Domingo Project Region III, Chile
NI 43-101 Technical Report
Page 24-10
March 2020
Project Number: C40029
Diesel blast rigs will be used. Two units will be required for the pre-production period. During commercial production from Year 1 through Year 14 six units will be required.
Table 24-4: Proposed Peak Fleet Requirements
Type of Equipment Peak Requirement
Front-end loader 1 Hydraulic shovel 4 Haul truck 290 t 29 Diesel drill 6 Support drill 2 Bulldozer 1 (525 HP) 5 Bulldozer 2 (860 HP) 1 Wheel dozer 1 (485 HP) 3 Wheel dozer 2 (853 HP) 1 Motor grader (280 HP) 3 Water truck 2 Backhoe 1 Fuel truck 85 m3 1 Mobile crane 200 t 1 Lowboy truck 1 Tire handler 1 Lighting plant 15
Note: FEL= front-end loader
The proposed work schedule assumption is seven days per week, 365 days per year. Each day will consist of two 12-hour shifts. Four mining crews will rotate to cover the operation (two working and two on time off).
Santo Domingo Project Region III, Chile
NI 43-101 Technical Report
Page 24-11
March 2020
Project Number: C40029
24.4 2020 PEA Recovery Methods
24.4.1 Process Selection
The testwork completed suggests several viable routes to recover cobalt from the pyrite in the cleaner scavenger tailings. BiOX yielded cobalt recovery in excess of 95% in the 2018 and 2019 investigations. The primary disadvantages to the BiOX process are: Oxidation conditions are not high enough to re-precipitate the iron from solution,
requiring large facilities to precipitate the iron and deal with the volume of precipitate
Large limestone requirements to neutralize acid Temperature control would require operation at very low solids given the high
pyrite content of the feed, leading to very dilute solutions feeding the SX step and larger and more complex SX design
Elevated capital costs would be expected based on the retention time and SX design constraints
High energy costs for agitation and air injection. High-temperature POX leaching produced high cobalt and copper recoveries and excellent iron rejection in the leaching step. Key disadvantages of the high temperature POX process are: Dilute slurry density leaching conditions would be required given the high pyrite
concentration in the feed Large limestone requirements for acid neutralization High operating costs compared with roasting due to energy requirements for
oxygen. Dead roasting at 650–680°C produced recovery in the 90% range for cobalt and copper recovery in the 75% range (dead roasting is roasting to eliminate essentially all the sulphur in the material). A major benefit to this process is the ability to leach the calcines under atmospheric conditions and at elevated solids with low acid concentrations. This would lead to a relatively simple SX circuit to produce battery-
Santo Domingo Project Region III, Chile
NI 43-101 Technical Report
Page 24-12
March 2020
Project Number: C40029
grade cobalt sulphate. An additional benefit of the roasting approach would be the production of high grade sulphuric acid and electricity as by-products of the operation.
24.4.2 Proposed Flowsheet
The planned flowsheets are shown in Figure 24-4 (copper circuit) and Figure 24-5 and Figure 24-6 (cobalt circuit). The cobalt recovery circuit will treat the cleaner scavenger tailings from the copper flotation circuit. The product streams are scavenger tailings and the first cleaner pyrite concentrate, which reports to a dewatering circuit ahead of cobalt recovery. For the first 2 years of operation, the cleaner scavenger tailings will be stored in a pond. The cobalt circuit will start to operate in Year 3 and the material from the pond will be re-pulped and combined with fresh cleaner scavenger tailings for treatment in the cobalt circuit.
24.4.3 Process Design
The main process design criteria include: Design capacity (first 5 years): 65,000 t/d Nominal capacity (after 5 years): 60,000 t/d Operating period: 365 days per year. The process design is summarized in Table 24-5. Table 24-6 provides the design equipment and other parameter assumptions for the plant other than those for the cobalt circuit. Table 24-7 lists the main equipment for the cobalt circuit. The magnetite process assumptions are based on magnetic susceptibility readings, which gave the following average treatment capacities for the two magnetite circuit feed types: Magnetite: 66,629 t/d Hematite: 61,844 t/d. Wood notes that because designations of material are based only on the magnetic susceptibility readings, rather than the typical physical characteristics of magnetite and hematite, there may be significant variations in hardness within each of the Hematite or Magnetite feed types.

Santo Domingo Project Region III, Chile
NI 43-101 Technical Report
Page 24-13
March 2020
Project Number: C40029
Figure 24-4: PEA 2020 Copper Circuit Process Flowsheet
Note: Figure prepared by Wood, 2018
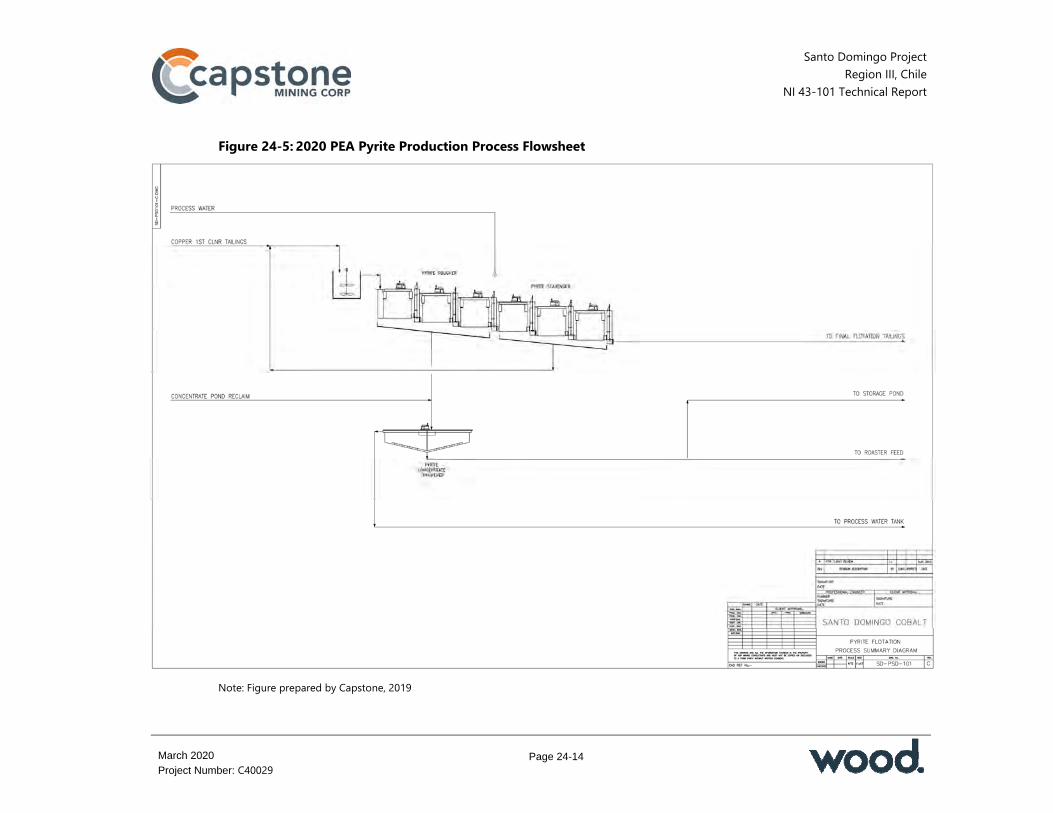
Santo Domingo Project Region III, Chile
NI 43-101 Technical Report
Page 24-14
March 2020
Project Number: C40029
Figure 24-5: 2020 PEA Pyrite Production Process Flowsheet
Note: Figure prepared by Capstone, 2019
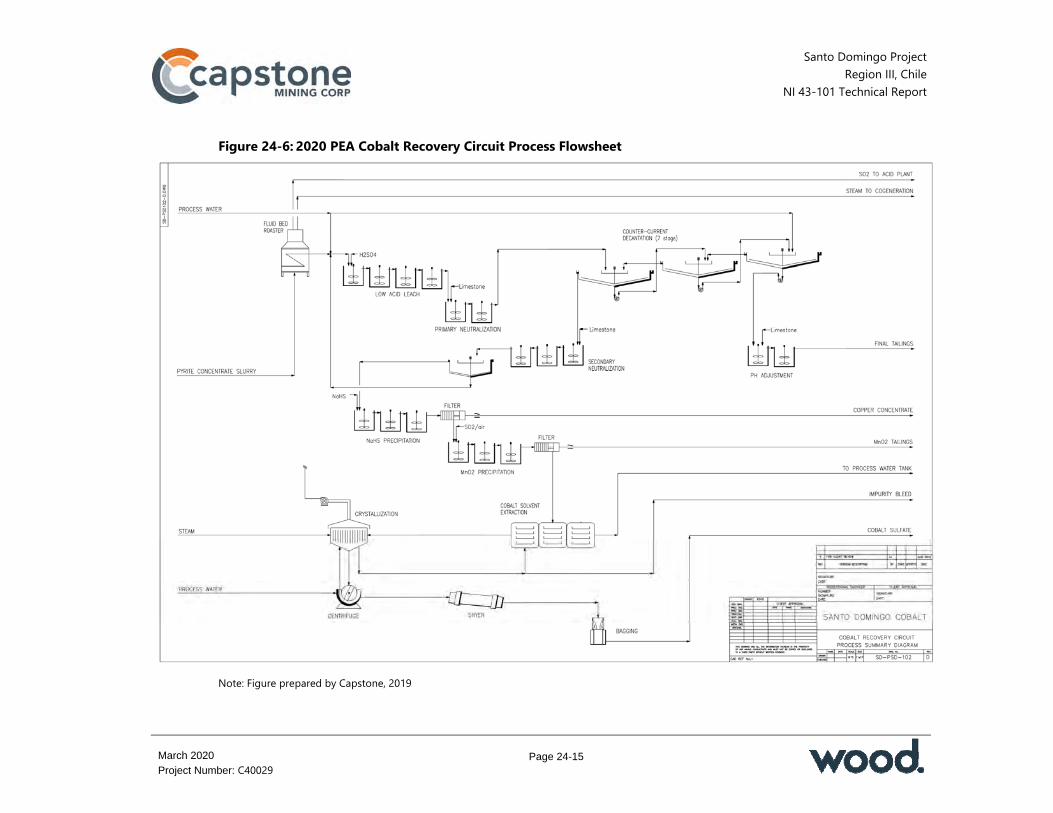
Santo Domingo Project Region III, Chile
NI 43-101 Technical Report
Page 24-15
March 2020
Project Number: C40029
Figure 24-6: 2020 PEA Cobalt Recovery Circuit Process Flowsheet
Note: Figure prepared by Capstone, 2019

Santo Domingo Project Region III, Chile
NI 43-101 Technical Report
Page 24-16
March 2020
Project Number: C40029
Table 24-5: Process Description Area Notes
Coarse mill feed material handling and crushing
The primary crushing plant will process ROM feed in open circuit. Primary crushing will be carried out in a 600 kW, 60” x 89” gyratory crusher. The crushed product will fall into a 450 t hopper which will unload onto a plate feeder that feeds the conveyor transporting material to the coarse ore stockpile. The stockpile will discharge onto three feeders located within the reclaim tunnel, which then will feed the primary semi-autogenous grind (SAG) mill.
Grinding and classification
The 24 MW (at the shell), 40’ x 26’ EGL SAG mill will operate in a direct (DSAG) mode. The SAG mill will discharge onto a conventional, double deck, 12’ x 24’, vibratory screen. Oversize pebbles from the discharge screen will be recycled to the SAG mill without being crushed. Undersize from the discharge screen will be fed to secondary grinding circuit pump box. The secondary grinding circuit will consist of two 24’ x 36’ ball mills each with a 12 MW twin pinion drive system. The ball mills will operate in closed circuit with two cyclone clusters of ten 33” hydrocyclones with 20% spare cyclone flow capacity. The coarse (underflow) fraction from the hydrocyclones will be returned to the ball mill feed and the fine material (overflow) fraction will be the final comminution circuit product with a P80 of 150 µm.
Copper flotation
Copper rougher flotation will be carried out in a single bank of six 600 m3 mechanical, forced air tank cells arranged in a 1-1-1-1-1-1 configuration. Flotation rougher concentrate produced from the rougher cells will flow by gravity to a regrind mill feed box where it will be combined with first cleaner scavenger concentrate and then fed to the regrinding stage which will consist of a single vertical mill and cyclone cluster operating in closed circuit. The overflow from the hydrocyclones will feed a single conditioning tank preceding the first cleaner and cleaner scavenger flotation circuit. First cleaner stage flotation will be carried out in a bank of four mechanical, forced air 250 m3 tank cells; the concentrate will be pumped to the second cleaner stage and the tailings will flow to the scavenger flotation cells. Cleaner scavenger concentrate will be recycled to the regrind cyclone pump box and the tailings will report directly to final plant tailings. The second cleaner flotation stage will be performed in a bank of three mechanical 70 m3 tank cells with the concentrate flowing by gravity to feed the third stage of cleaner flotation. Second cleaner stage tailings will be pumped back to the feed of the first cleaning flotation stage. The third (final) cleaning stage will be performed in a single mechanical 70 m3 tank cell. The cleaner scavenger tailings from the copper flotation circuit will feed the cobalt recovery circuit.
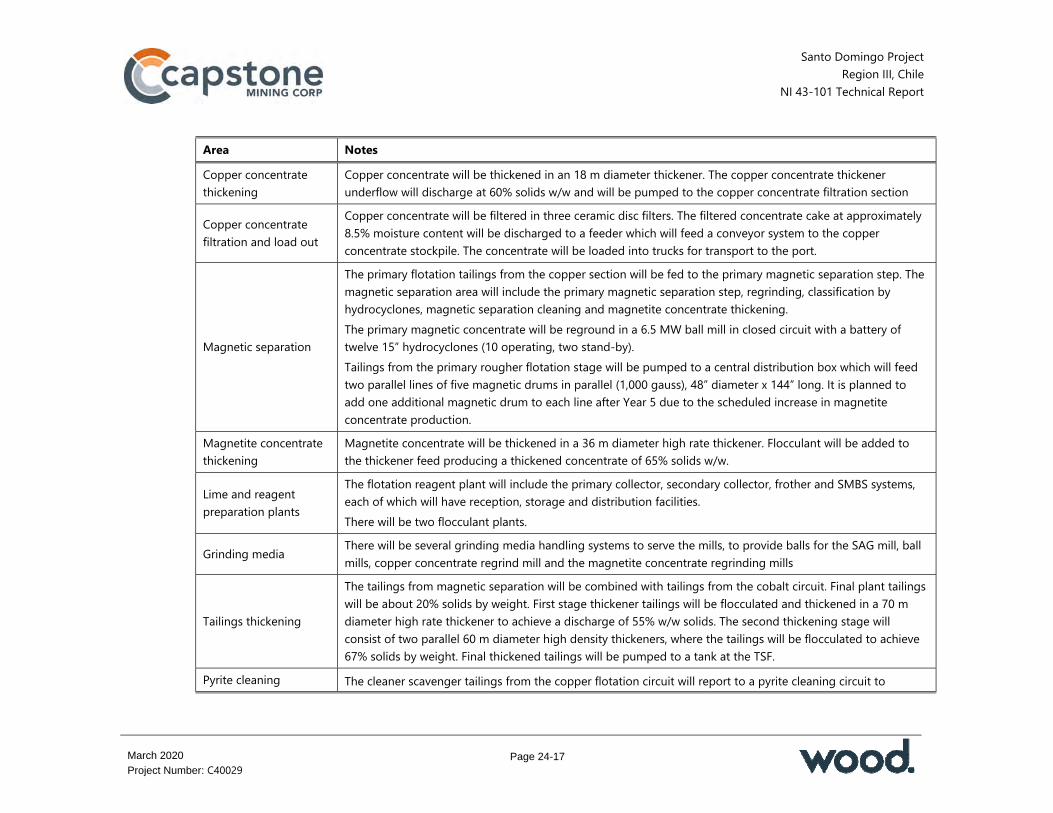
Santo Domingo Project Region III, Chile
NI 43-101 Technical Report
Page 24-17
March 2020
Project Number: C40029
Area Notes Copper concentrate thickening
Copper concentrate will be thickened in an 18 m diameter thickener. The copper concentrate thickener underflow will discharge at 60% solids w/w and will be pumped to the copper concentrate filtration section
Copper concentrate filtration and load out
Copper concentrate will be filtered in three ceramic disc filters. The filtered concentrate cake at approximately 8.5% moisture content will be discharged to a feeder which will feed a conveyor system to the copper concentrate stockpile. The concentrate will be loaded into trucks for transport to the port.
Magnetic separation
The primary flotation tailings from the copper section will be fed to the primary magnetic separation step. The magnetic separation area will include the primary magnetic separation step, regrinding, classification by hydrocyclones, magnetic separation cleaning and magnetite concentrate thickening. The primary magnetic concentrate will be reground in a 6.5 MW ball mill in closed circuit with a battery of twelve 15” hydrocyclones (10 operating, two stand-by). Tailings from the primary rougher flotation stage will be pumped to a central distribution box which will feed two parallel lines of five magnetic drums in parallel (1,000 gauss), 48” diameter x 144” long. It is planned to add one additional magnetic drum to each line after Year 5 due to the scheduled increase in magnetite concentrate production.
Magnetite concentrate thickening
Magnetite concentrate will be thickened in a 36 m diameter high rate thickener. Flocculant will be added to the thickener feed producing a thickened concentrate of 65% solids w/w.
Lime and reagent preparation plants
The flotation reagent plant will include the primary collector, secondary collector, frother and SMBS systems, each of which will have reception, storage and distribution facilities. There will be two flocculant plants.
Grinding media There will be several grinding media handling systems to serve the mills, to provide balls for the SAG mill, ball mills, copper concentrate regrind mill and the magnetite concentrate regrinding mills
Tailings thickening
The tailings from magnetic separation will be combined with tailings from the cobalt circuit. Final plant tailings will be about 20% solids by weight. First stage thickener tailings will be flocculated and thickened in a 70 m diameter high rate thickener to achieve a discharge of 55% w/w solids. The second thickening stage will consist of two parallel 60 m diameter high density thickeners, where the tailings will be flocculated to achieve 67% solids by weight. Final thickened tailings will be pumped to a tank at the TSF.
Pyrite cleaning The cleaner scavenger tailings from the copper flotation circuit will report to a pyrite cleaning circuit to
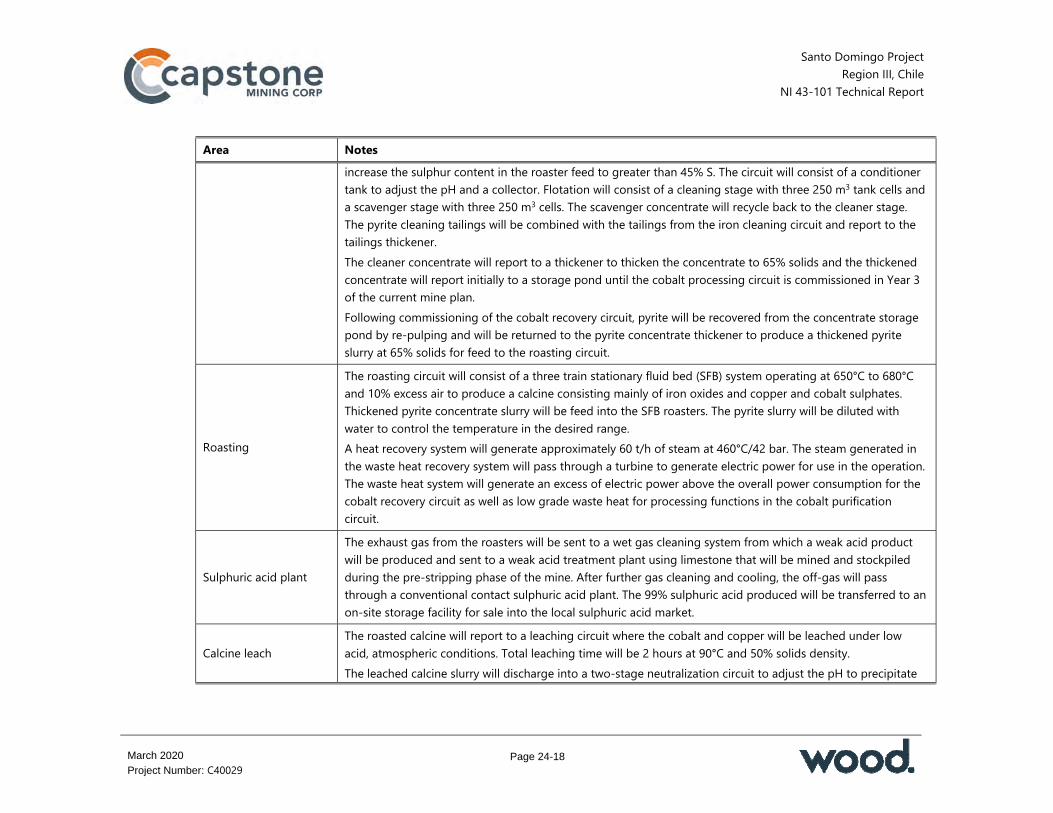
Santo Domingo Project Region III, Chile
NI 43-101 Technical Report
Page 24-18
March 2020
Project Number: C40029
Area Notes increase the sulphur content in the roaster feed to greater than 45% S. The circuit will consist of a conditioner tank to adjust the pH and a collector. Flotation will consist of a cleaning stage with three 250 m3 tank cells and a scavenger stage with three 250 m3 cells. The scavenger concentrate will recycle back to the cleaner stage. The pyrite cleaning tailings will be combined with the tailings from the iron cleaning circuit and report to the tailings thickener. The cleaner concentrate will report to a thickener to thicken the concentrate to 65% solids and the thickened concentrate will report initially to a storage pond until the cobalt processing circuit is commissioned in Year 3 of the current mine plan. Following commissioning of the cobalt recovery circuit, pyrite will be recovered from the concentrate storage pond by re-pulping and will be returned to the pyrite concentrate thickener to produce a thickened pyrite slurry at 65% solids for feed to the roasting circuit.
Roasting
The roasting circuit will consist of a three train stationary fluid bed (SFB) system operating at 650°C to 680°C and 10% excess air to produce a calcine consisting mainly of iron oxides and copper and cobalt sulphates. Thickened pyrite concentrate slurry will be feed into the SFB roasters. The pyrite slurry will be diluted with water to control the temperature in the desired range. A heat recovery system will generate approximately 60 t/h of steam at 460°C/42 bar. The steam generated in the waste heat recovery system will pass through a turbine to generate electric power for use in the operation. The waste heat system will generate an excess of electric power above the overall power consumption for the cobalt recovery circuit as well as low grade waste heat for processing functions in the cobalt purification circuit.
Sulphuric acid plant
The exhaust gas from the roasters will be sent to a wet gas cleaning system from which a weak acid product will be produced and sent to a weak acid treatment plant using limestone that will be mined and stockpiled during the pre-stripping phase of the mine. After further gas cleaning and cooling, the off-gas will pass through a conventional contact sulphuric acid plant. The 99% sulphuric acid produced will be transferred to an on-site storage facility for sale into the local sulphuric acid market.
Calcine leach The roasted calcine will report to a leaching circuit where the cobalt and copper will be leached under low acid, atmospheric conditions. Total leaching time will be 2 hours at 90°C and 50% solids density. The leached calcine slurry will discharge into a two-stage neutralization circuit to adjust the pH to precipitate

Santo Domingo Project Region III, Chile
NI 43-101 Technical Report
Page 24-19
March 2020
Project Number: C40029
Area Notes iron and aluminum from the leach liquor using limestone. The partially neutralized slurry will be fed into a seven-stage counter current solid-liquid separation (CCD) circuit to produce a cobalt/copper liquor feed to the metal recovery circuit. Metal recovery in the washing circuit will be greater than 98%. The pH of the CCD circuit underflow will be adjusted to 7.5 to 8 using limestone and will be combined with the magnetic separation circuit tailings and will report to the tailings thickener.
Solution purification and Co/Cu recovery
The rich liquor exiting the CCD circuit will be neutralized to a pH of 6.5. Any additional solids precipitated in the secondary neutralization step will be thickened and returned to the calcine leaching circuit to ensure co-precipitation of cobalt in the neutralization step. The neutralized solution will be treated with sodium hydrosulphide to precipitate the copper. The copper sulphide precipitate will be filtered and combined with the copper concentrate produced in the copper flotation circuit for shipment and sale. After copper removal, a final solution purification step will remove manganese from the solution prior to the cobalt solvent extraction (SX) step. The polished liquor will pass through a multi-stage SX circuit to produce a purified cobalt liquor. After a final polishing step to remove trace manganese, the cobalt rich liquor will be fed to a vacuum crystallizer to produce battery-grade cobalt sulphate heptahydrate. The final product will be bagged and shipped off site for sale.
Plant desalinated water distribution
The desalinated water received from the port area will be discharged to either a fresh desalinated water tank (2,900 m3) that will feed the potable water plants, or to two desalinated water ponds (each 20,000 m3).
Plant auxiliary facilities
The compressed air plant will consist of four 200 kW compressors (three operating and one stand-by), one accumulator and one dryer with an accumulator for the instrument air. The plant and instrument air for primary crushing will be provided by a 160 kW compressor, one accumulator and a dryer/accumulator for the instrument air. The air for flotation will be provided by four 500 kW blowers (two operating, two stand-by) with a distribution network to each flotation bank.

Santo Domingo Project Region III, Chile
NI 43-101 Technical Report
Page 24-20
March 2020
Project Number: C40029
Table 24-6: Process Design Assumptions Cu and Fe Plant Circuit Area Specification
Crushing and grinding
Crushing
Crushing work index: design 8.4 kWh/t Open size setting 180 mm
Grinding
SAG mill
Transfer size (K80) design 2,500 µm Specific energy consumption
DSAG 7.1 kWh/t
Ball mill
Type of circuit Closed Product size (P80) 150 µm
Bond ball work index (BWi)
Average 12.4 kWh/t Design 12.5 kWh/t
Circuit Area Flotation Time (mins) pH
Copper circuit
Copper flotation
Rougher 40 7.5 – 8.2 Conditioning time 12 8.8 – 9.2 First cleaner 25 8.8 – 9.2 Cleaner scavenger 55 8.8 – 9.2 Second cleaner 18 8.8 – 9.2 Third cleaner 10 8.8 – 9.2
Circuit Area Specification
Copper circuit
Copper regrind mill
Specific energy consumption 4.5 kWh/t Product size P80 of 34 µm
Copper concentrate thickener
Settling rate 0.25 t/hr/m2 Solid percentage underflow 60% w/w

Santo Domingo Project Region III, Chile
NI 43-101 Technical Report
Page 24-21
March 2020
Project Number: C40029
Circuit Area Specification Copper concentrate filter
Unit filtration rate 60 m2/filter Unit rate 450 kg/hr/m2
Magnetite Circuit
Magnetic separation Rougher
Type of drum LIMS Intensity of magnetic field 1,000 gauss Unit capacity 80 t/hr/m
Regrind ball mill
Type of circuit Closed Product size P80 of 40 µm Ball work index (BWi)
Average 11.7 kWh/t Design 13.6 kWh/t
Cleaners
Type of drum LIMS Stages of cleaning 3 Intensity of magnetic field 650–750 gauss Unit capacity 80 t/hr/m
Magnetite concentrate thickener
Type of thickener High rate Unit rate 0.68 t/hr/m2 Solid % underflow 65% w/w
Magnetite concentrate filter
Type of filter Ceramic disc Unit filtration rate 144 m2/filter Unit rate 730 kg/hr/m2
Tailings thickener
First stage
Type of thickener High Rate Unit rate 0.65 t/hr/m2
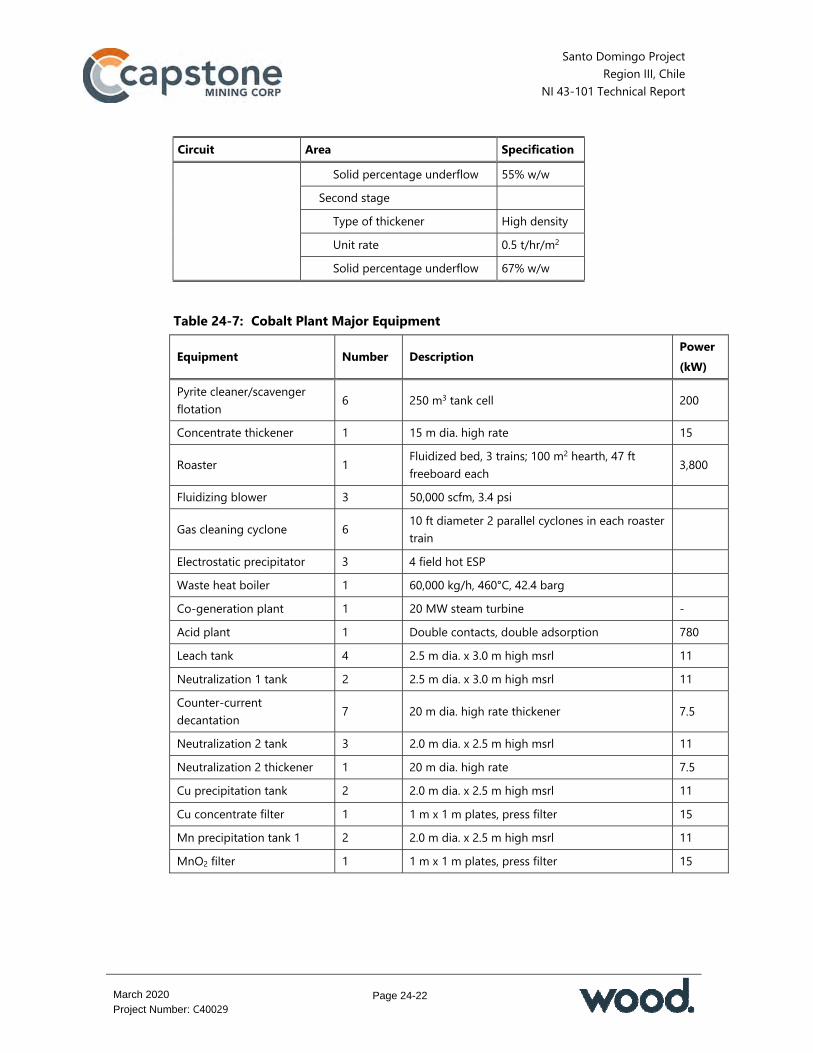
Santo Domingo Project Region III, Chile
NI 43-101 Technical Report
Page 24-22
March 2020
Project Number: C40029
Circuit Area Specification Solid percentage underflow 55% w/w
Second stage
Type of thickener High density Unit rate 0.5 t/hr/m2 Solid percentage underflow 67% w/w
Table 24-7: Cobalt Plant Major Equipment
Equipment Number Description Power (kW)
Pyrite cleaner/scavenger flotation 6 250 m3 tank cell 200
Concentrate thickener 1 15 m dia. high rate 15
Roaster 1 Fluidized bed, 3 trains; 100 m2 hearth, 47 ft freeboard each 3,800
Fluidizing blower 3 50,000 scfm, 3.4 psi
Gas cleaning cyclone 6 10 ft diameter 2 parallel cyclones in each roaster train
Electrostatic precipitator 3 4 field hot ESP Waste heat boiler 1 60,000 kg/h, 460°C, 42.4 barg Co-generation plant 1 20 MW steam turbine - Acid plant 1 Double contacts, double adsorption 780 Leach tank 4 2.5 m dia. x 3.0 m high msrl 11 Neutralization 1 tank 2 2.5 m dia. x 3.0 m high msrl 11 Counter-current decantation 7 20 m dia. high rate thickener 7.5
Neutralization 2 tank 3 2.0 m dia. x 2.5 m high msrl 11 Neutralization 2 thickener 1 20 m dia. high rate 7.5 Cu precipitation tank 2 2.0 m dia. x 2.5 m high msrl 11 Cu concentrate filter 1 1 m x 1 m plates, press filter 15 Mn precipitation tank 1 2 2.0 m dia. x 2.5 m high msrl 11 MnO2 filter 1 1 m x 1 m plates, press filter 15
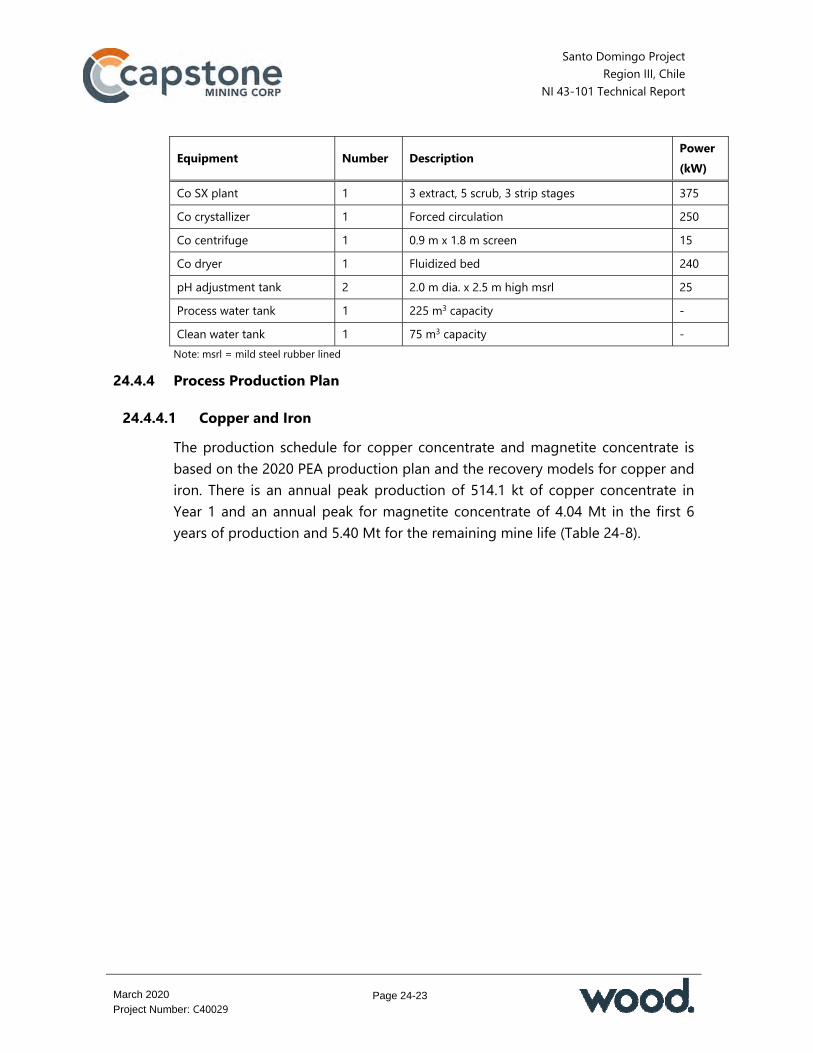
Santo Domingo Project Region III, Chile
NI 43-101 Technical Report
Page 24-23
March 2020
Project Number: C40029
Equipment Number Description Power (kW)
Co SX plant 1 3 extract, 5 scrub, 3 strip stages 375 Co crystallizer 1 Forced circulation 250 Co centrifuge 1 0.9 m x 1.8 m screen 15 Co dryer 1 Fluidized bed 240 pH adjustment tank 2 2.0 m dia. x 2.5 m high msrl 25 Process water tank 1 225 m3 capacity - Clean water tank 1 75 m3 capacity -
Note: msrl = mild steel rubber lined
24.4.4 Process Production Plan
24.4.4.1 Copper and Iron The production schedule for copper concentrate and magnetite concentrate is based on the 2020 PEA production plan and the recovery models for copper and iron. There is an annual peak production of 514.1 kt of copper concentrate in Year 1 and an annual peak for magnetite concentrate of 4.04 Mt in the first 6 years of production and 5.40 Mt for the remaining mine life (Table 24-8).

Santo Domingo Project Region III, Chile
NI 43-101 Technical Report
Page 24-24
March 2020
Project Number: C40029
Table 24-8: Copper, Gold and Iron Production Plan
Period (year)
Tonnage ('000 t)
Cu (%)
Rec. (%)
Cu in Con ('000 t)
Fe (%) MagSus MassRec
(%)
Fe in Con (Mt)
Au (g/t)
Rec Au (%)
Hem (%)
Y-1 — — — — — — — — — — — Y0 H1 — — — — — — — — — — — Y0 H2 2,551 0.685 94.354 56.9 32.83 14,537 15.1 0.38 0.09 66.8 31.8 Y1 23,292 0.678 94.367 514.1 31.63 11,267 11.6 2.70 0.09 66.8 33.6 Y2 23,725 0.604 94.169 465.3 29.83 13,726 14.0 3.33 0.08 65.6 28.6 Y3 23,790 0.488 93.807 375.4 30.70 15,594 16.1 3.82 0.07 63.6 27.8 Y4 23,725 0.460 93.685 352.5 30.67 16,806 17.0 4.04 0.06 62.9 26.8 Y5 23,725 0.416 93.583 318.5 27.00 10,019 10.1 2.39 0.06 62.3 28.5 Y6 21,900 0.367 93.448 259.1 27.17 12,061 12.2 2.67 0.05 61.2 26.6 Y7 21,960 0.301 93.246 212.2 27.90 17,259 17.5 3.85 0.04 59.6 22.3 Y8 21,900 0.228 92.756 159.9 27.72 18,023 18.2 3.98 0.03 56.6 21.4 Y9 21,900 0.227 92.787 158.8 26.23 16,071 16.2 3.56 0.03 57.0 21.2 Y10 21,900 0.193 92.693 135.3 25.65 18,089 17.9 3.92 0.03 55.0 18.7 Y11 21,960 0.184 92.686 129.4 26.31 22,124 21.8 4.78 0.03 54.1 15.8 Y12 21,900 0.206 92.637 144.4 25.78 20,855 21.0 4.60 0.03 54.8 15.8 Y13 21,900 0.175 92.292 121.8 26.54 22,931 22.9 5.00 0.03 52.5 15.1 Y14 21,900 0.149 92.026 103.8 27.65 25,372 24.7 5.40 0.02 50.4 14.7 Y15 19,913 0.134 92.067 84.9 28.20 27,879 27.1 5.40 0.02 49.2 12.2 Y16 17,653 0.145 92.106 81.5 31.34 31,239 30.6 5.39 0.02 48.8 14.1 Y17 20,799 0.080 90.851 51.8 28.50 25,590 25.9 5.39 0.01 31.8 14.7 Y18 15,934 0.065 90.419 32.2 27.24 27,500 27.9 4.44 0.01 28.2 11.0 Total 392,326 0.297 93.387 3,757.8 28.16 19,107 19.1 75.06 0.04 60.1 21.0
24.4.4.2 Cobalt The production schedule for the cobalt is based on a delayed start-up relative to the copper and iron production. The copper cleaner scavenger tailings will pass to a pyrite cleaning circuit to upgrade the pyrite concentrate to an average 45% sulphur content. For the first 2 years of operation the pyrite concentrate will report to a storage pond for recovery when the cobalt circuit comes on line

Santo Domingo Project Region III, Chile
NI 43-101 Technical Report
Page 24-25
March 2020
Project Number: C40029
during Year 3. It is planned to reclaim the stored pyrite slurry gradually and combine it with the fresh pyrite concentrate over approximately 11 years. The remaining years the plant will treat fresh feed only The production plan for the cobalt production circuit is provided in Table 24-9. The quantity of pyrite in the resource will determine the quantity of material that will be subjected to roasting and leaching for cobalt recovery. The quantity of roaster feed material will impact by-product revenues from sulphuric acid and power co-generation. An increase in the pyrite grade will increase the by-product revenues, which would largely be offset by higher operating costs. The converse is also true, if the incoming pyrite grade is lower then there are less by-product revenues and lower operating costs.
24.4.5 Energy, Water and Process Materials Requirements
Power requirement forecasts are included in Section 24.5. Water provision for the plant is outlined in Section 24.5. Reagents required for the plant operation include lime and limestone, primary collector (3418A), secondary collector (3926), pyrite collector, flocculants, frother (MIBC), sodium hydrosulphide and extractant and diluent for solvent extraction. Balls are required for the grinding circuit, ranging from 5” diameter for the SAG mill to 1” to 1.5” diameter for the concentrate regrinding mills.
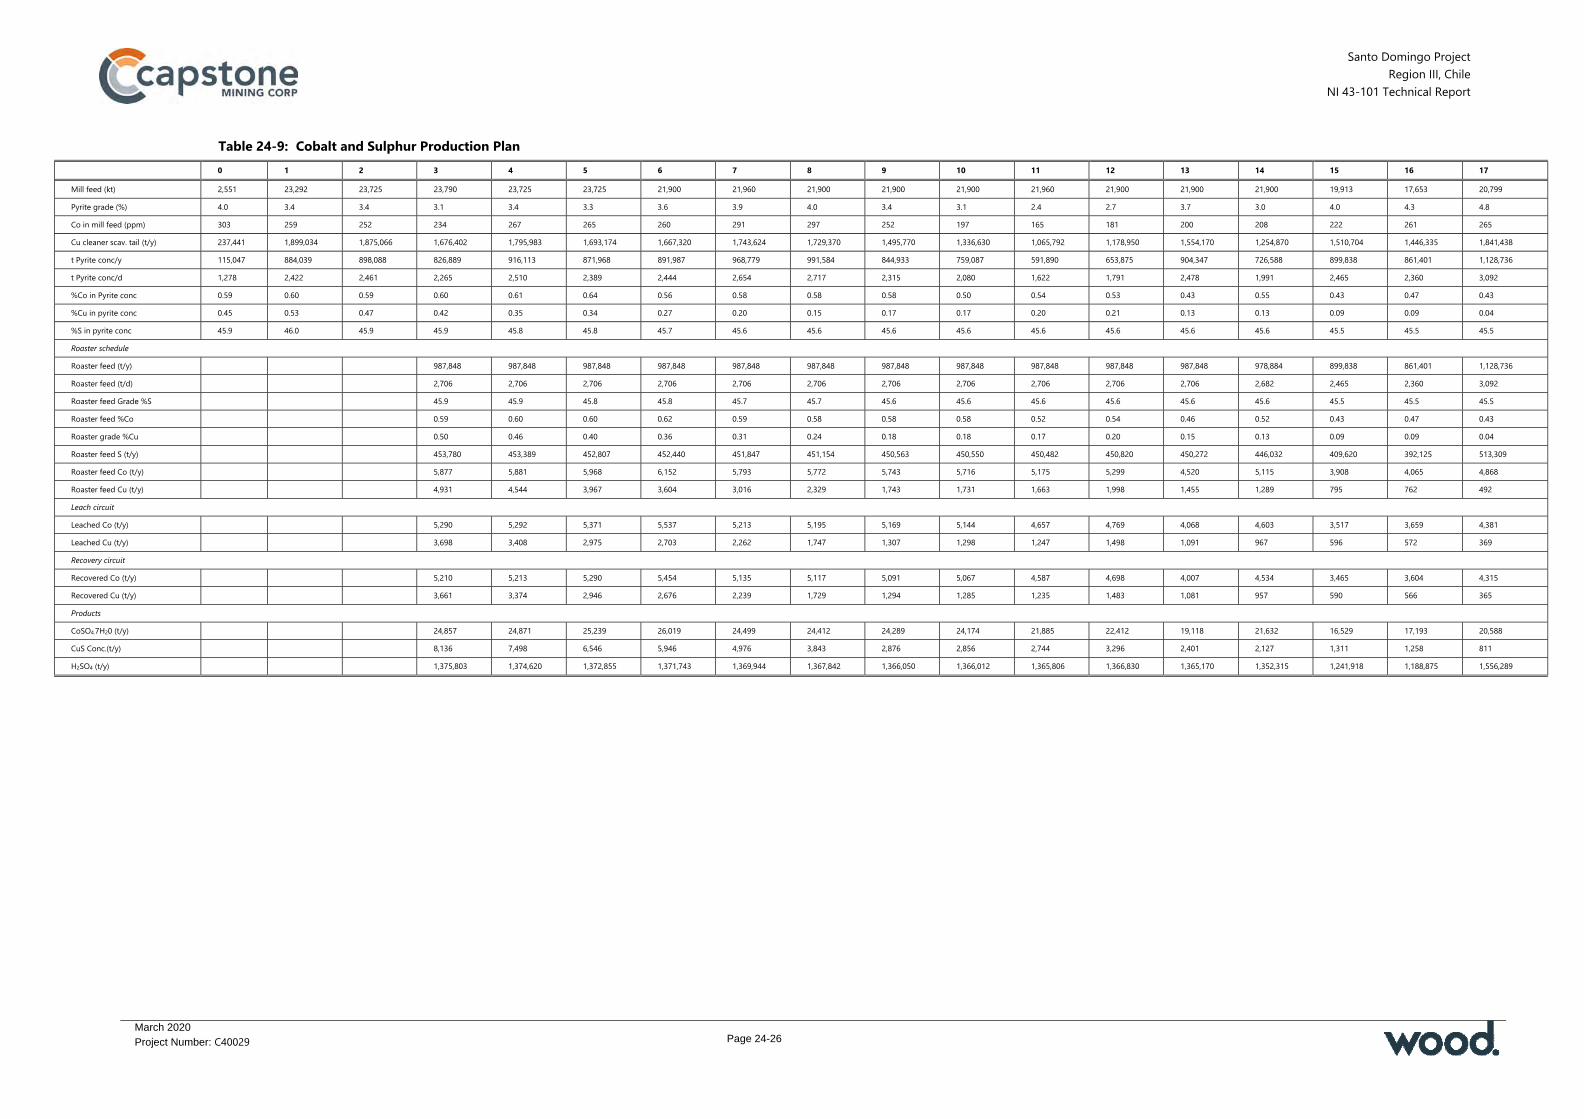
Santo Domingo Project Region III, Chile
NI 43-101 Technical Report
March 2020
Project Number: C40029
Page 24-26
Table 24-9: Cobalt and Sulphur Production Plan 0 1 2 3 4 5 6 7 8 9 10 11 12 13 14 15 16 17
Mill feed (kt) 2,551 23,292 23,725 23,790 23,725 23,725 21,900 21,960 21,900 21,900 21,900 21,960 21,900 21,900 21,900 19,913 17,653 20,799
Pyrite grade (%) 4.0 3.4 3.4 3.1 3.4 3.3 3.6 3.9 4.0 3.4 3.1 2.4 2.7 3.7 3.0 4.0 4.3 4.8
Co in mill feed (ppm) 303 259 252 234 267 265 260 291 297 252 197 165 181 200 208 222 261 265
Cu cleaner scav. tail (t/y) 237,441 1,899,034 1,875,066 1,676,402 1,795,983 1,693,174 1,667,320 1,743,624 1,729,370 1,495,770 1,336,630 1,065,792 1,178,950 1,554,170 1,254,870 1,510,704 1,446,335 1,841,438
t Pyrite conc/y 115,047 884,039 898,088 826,889 916,113 871,968 891,987 968,779 991,584 844,933 759,087 591,890 653,875 904,347 726,588 899,838 861,401 1,128,736
t Pyrite conc/d 1,278 2,422 2,461 2,265 2,510 2,389 2,444 2,654 2,717 2,315 2,080 1,622 1,791 2,478 1,991 2,465 2,360 3,092
%Co in Pyrite conc 0.59 0.60 0.59 0.60 0.61 0.64 0.56 0.58 0.58 0.58 0.50 0.54 0.53 0.43 0.55 0.43 0.47 0.43
%Cu in pyrite conc 0.45 0.53 0.47 0.42 0.35 0.34 0.27 0.20 0.15 0.17 0.17 0.20 0.21 0.13 0.13 0.09 0.09 0.04
%S in pyrite conc 45.9 46.0 45.9 45.9 45.8 45.8 45.7 45.6 45.6 45.6 45.6 45.6 45.6 45.6 45.6 45.5 45.5 45.5
Roaster schedule
Roaster feed (t/y) 987,848 987,848 987,848 987,848 987,848 987,848 987,848 987,848 987,848 987,848 987,848 978,884 899,838 861,401 1,128,736
Roaster feed (t/d) 2,706 2,706 2,706 2,706 2,706 2,706 2,706 2,706 2,706 2,706 2,706 2,682 2,465 2,360 3,092
Roaster feed Grade %S 45.9 45.9 45.8 45.8 45.7 45.7 45.6 45.6 45.6 45.6 45.6 45.6 45.5 45.5 45.5
Roaster feed %Co 0.59 0.60 0.60 0.62 0.59 0.58 0.58 0.58 0.52 0.54 0.46 0.52 0.43 0.47 0.43
Roaster grade %Cu 0.50 0.46 0.40 0.36 0.31 0.24 0.18 0.18 0.17 0.20 0.15 0.13 0.09 0.09 0.04
Roaster feed S (t/y) 453,780 453,389 452,807 452,440 451,847 451,154 450,563 450,550 450,482 450,820 450,272 446,032 409,620 392,125 513,309
Roaster feed Co (t/y) 5,877 5,881 5,968 6,152 5,793 5,772 5,743 5,716 5,175 5,299 4,520 5,115 3,908 4,065 4,868
Roaster feed Cu (t/y) 4,931 4,544 3,967 3,604 3,016 2,329 1,743 1,731 1,663 1,998 1,455 1,289 795 762 492
Leach circuit
Leached Co (t/y) 5,290 5,292 5,371 5,537 5,213 5,195 5,169 5,144 4,657 4,769 4,068 4,603 3,517 3,659 4,381
Leached Cu (t/y) 3,698 3,408 2,975 2,703 2,262 1,747 1,307 1,298 1,247 1,498 1,091 967 596 572 369
Recovery circuit
Recovered Co (t/y) 5,210 5,213 5,290 5,454 5,135 5,117 5,091 5,067 4,587 4,698 4,007 4,534 3,465 3,604 4,315
Recovered Cu (t/y) 3,661 3,374 2,946 2,676 2,239 1,729 1,294 1,285 1,235 1,483 1,081 957 590 566 365
Products
CoSO4.7H20 (t/y) 24,857 24,871 25,239 26,019 24,499 24,412 24,289 24,174 21,885 22,412 19,118 21,632 16,529 17,193 20,588
CuS Conc.(t/y) 8,136 7,498 6,546 5,946 4,976 3,843 2,876 2,856 2,744 3,296 2,401 2,127 1,311 1,258 811
H2SO4 (t/y) 1,375,803 1,374,620 1,372,855 1,371,743 1,369,944 1,367,842 1,366,050 1,366,012 1,365,806 1,366,830 1,365,170 1,352,315 1,241,918 1,188,875 1,556,289

Santo Domingo Project Region III, Chile
NI 43-101 Technical Report
Page 24-27
March 2020
Project Number: C40029
24.5 2020 PEA Infrastructure
24.5.1 Introduction
It is planned to locate the main infrastructure facilities within the 2020 PEA at the following sites: Santo Domingo mine and plant site: located at approximately 26°28’00”S
and 70°00’30”W Operations camp: located on site Port facilities: located about 43.5 km north of Caldera at Punta Roca Blanca Concentrate and water pipelines: 111.6 km long between the Santo
Domingo plant site location and the Santo Domingo port site at Punta Roca Blanca
High voltage transmission line: from the Diego de Almagro (San Lorenzo) substation to the proposed mine and plant site
High voltage transmission line: from the Totoralillo substation to the port site.
Figure 24-7 shows the overall proposed layout from the mine site to the anticipated port location. Figure 24-8 shows the details of the proposed mine site and plant layout. Two areas where the layout will impact existing infrastructure were noted. These are: TSF: Entel’s fibre optic line and Route C-17 Mine–plant area: Red Eléctrica Internacional and Engie (formerly GDF Suez)
Mejillones-Cardones transmission line, the Chañaral–Diego de Almagro transmission line and the Cardones–Diego de Almagro transmission line.
Electrical and fibre optic lines will be relocated on a strip of land provided by Capstone.
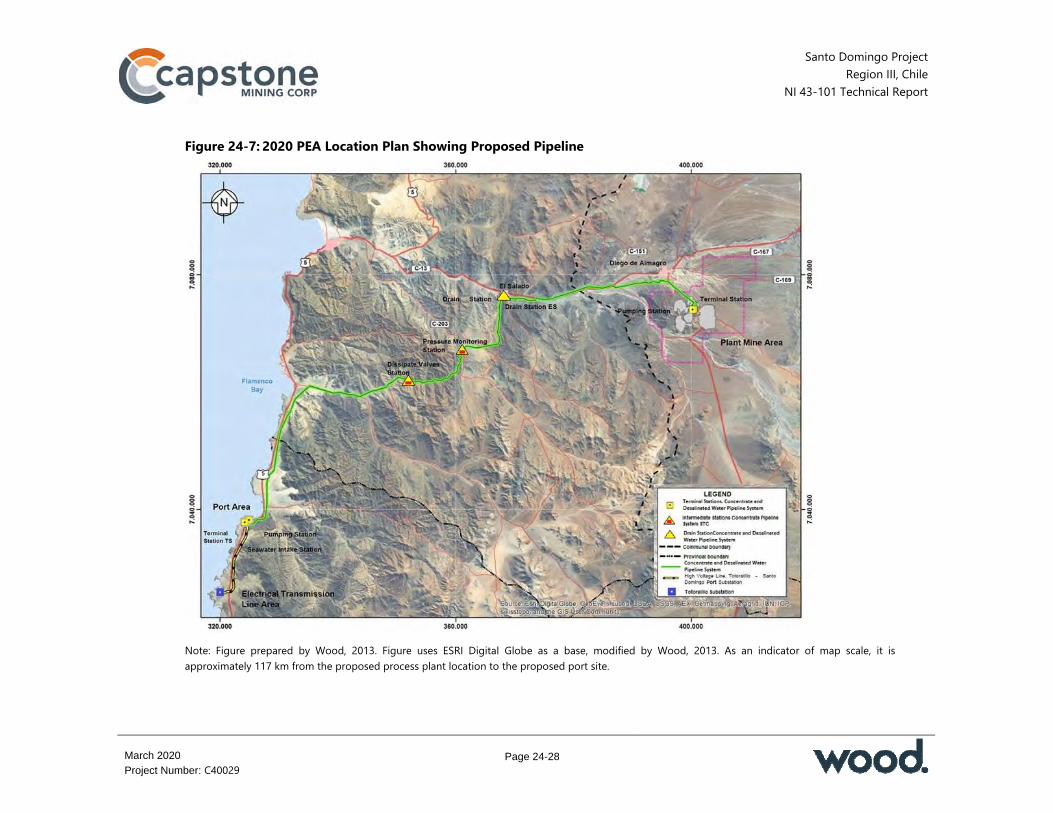
Santo Domingo Project Region III, Chile
NI 43-101 Technical Report
Page 24-28
March 2020
Project Number: C40029
Figure 24-7: 2020 PEA Location Plan Showing Proposed Pipeline
Note: Figure prepared by Wood, 2013. Figure uses ESRI Digital Globe as a base, modified by Wood, 2013. As an indicator of map scale, it is approximately 117 km from the proposed process plant location to the proposed port site.
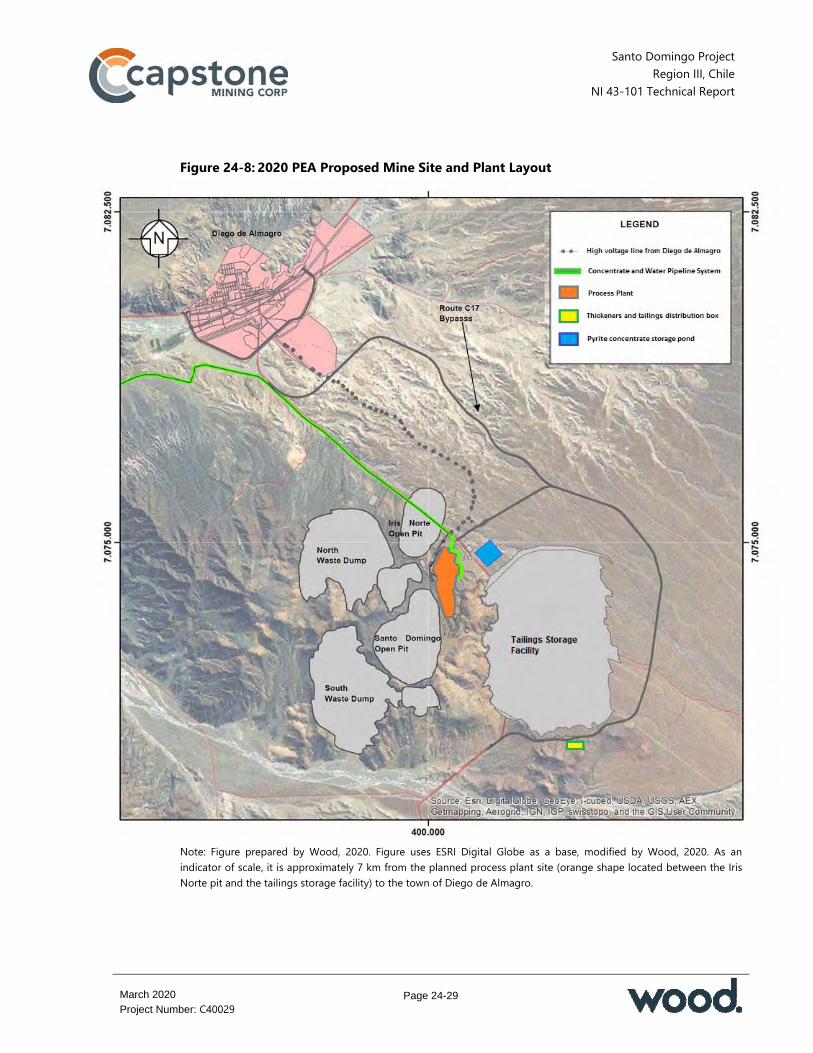
Santo Domingo Project Region III, Chile
NI 43-101 Technical Report
Page 24-29
March 2020
Project Number: C40029
Figure 24-8: 2020 PEA Proposed Mine Site and Plant Layout
Note: Figure prepared by Wood, 2020. Figure uses ESRI Digital Globe as a base, modified by Wood, 2020. As an indicator of scale, it is approximately 7 km from the planned process plant site (orange shape located between the Iris Norte pit and the tailings storage facility) to the town of Diego de Almagro.

Santo Domingo Project Region III, Chile
NI 43-101 Technical Report
Page 24-30
March 2020
Project Number: C40029
24.5.2 Access
Potential access routes from the south and north are shown in Figure 24-9 and Figure 24-10 respectively. A by-pass option around the village of El Salado is planned. Figure 24-9: 2020 PEA Access Routes from the South
Note: Figure prepared by Wood, 2013. Figure uses Google Earth backdrop, modified by Wood, 2013. As an indicator of map scale, it is approximately 117 km from the proposed process plant to the proposed port site.
N

Santo Domingo Project Region III, Chile
NI 43-101 Technical Report
Page 24-31
March 2020
Project Number: C40029
Figure 24-10: 2020 PEA Access Routes from the North
Note: Figure prepared by Wood, 2013. Figure uses Google Earth backdrop, modified by Wood, 2013.As an indicator of scale, it is approximately 117 km from the proposed process plant location to the proposed port site
It is planned to build approximately 13 km of roads on the site to connect the mine, plant and infrastructure areas. The planned port for transport and shipment of heavy machinery, equipment and materials for construction is Punta Angamos in Mejillones, Antofagasta Region, 520 km from the plant site. This port is a year-round operation and is accessed directly from Route 5 North. The proposed route for the magnetite concentrate pipeline assumes a single 15 m RoW width and a common trench for the concentrate pipeline and the desalinated water pipeline. The route was assumed to run parallel to the existing roads and use existing RoW access to avoid the construction of new roads. Ongoing access to the pipeline route during operation will be along the platform and construction road.
N
N
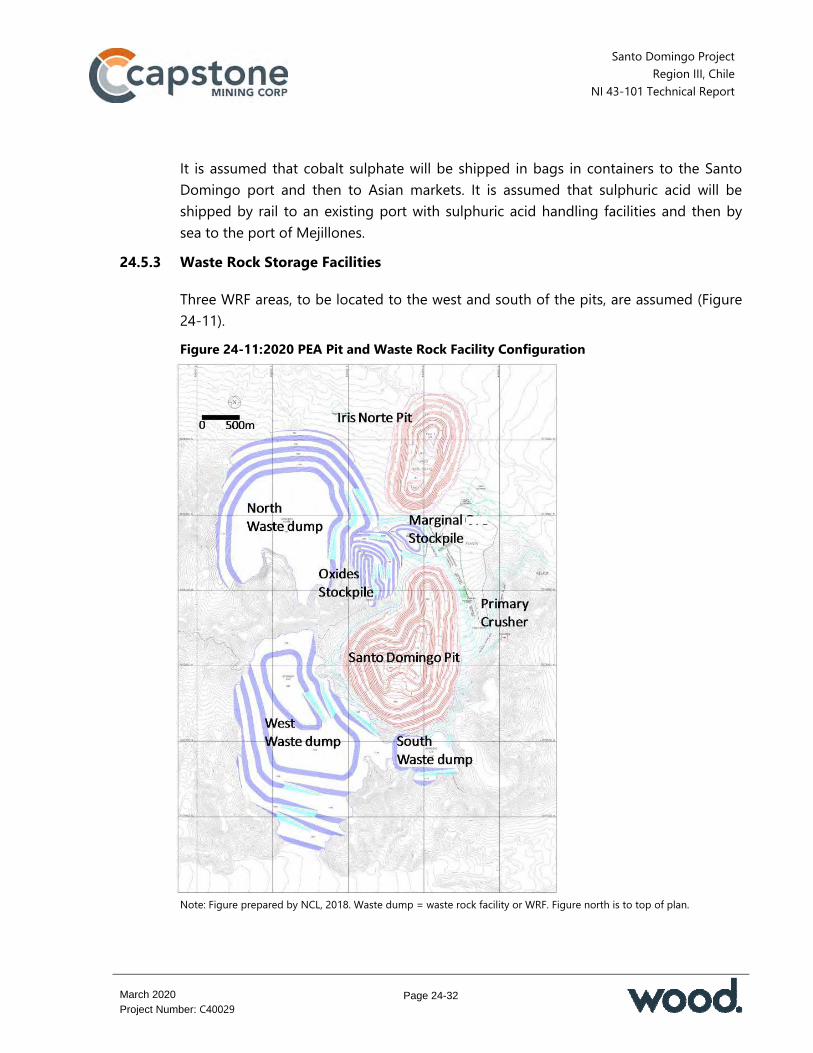
Santo Domingo Project Region III, Chile
NI 43-101 Technical Report
Page 24-32
March 2020
Project Number: C40029
It is assumed that cobalt sulphate will be shipped in bags in containers to the Santo Domingo port and then to Asian markets. It is assumed that sulphuric acid will be shipped by rail to an existing port with sulphuric acid handling facilities and then by sea to the port of Mejillones.
24.5.3 Waste Rock Storage Facilities
Three WRF areas, to be located to the west and south of the pits, are assumed (Figure 24-11). Figure 24-11: 2020 PEA Pit and Waste Rock Facility Configuration
Note: Figure prepared by NCL, 2018. Waste dump = waste rock facility or WRF. Figure north is to top of plan.

Santo Domingo Project Region III, Chile
NI 43-101 Technical Report
Page 24-33
March 2020
Project Number: C40029
Pre-stripping activities will generate approximately 44.2 Mt of waste rock that will be transported by trucks to the WRFs and 4.73 Mt will be used in the TSF starter dam. The facilities were designed in 50 m lifts. Each lift will be constructed at an approximate angle of repose of 37°. No significant acid generation is expected by Capstone from the mined waste and the dry climate conditions are also not expected by Capstone to produce sufficient water to generate drainage through the WRFs to mobilize any acid solutions.
24.5.4 Stockpiles
During the pre-production period, the ROM pad area will be constructed close to the initial pit for later re-handling to the primary crusher. The marginal mill feed material stockpile and the oxide stockpile are planned to be located between the Santo Doming and Iris Norte pits. The stockpiles were designed with 20 m lifts and 30 m set-backs to support later re-handling.
24.5.5 Water Management
Information from work completed by Knight Piésold from 2009 onwards on water resource characterization was used to support the 2020 PEA water management concepts. The mine and port will use desalinated sea water. The current plan is to produce desalinated water under a BOOT contract or an existing contractor, delivered to Capstone at the mine site and the port at an agreed price per cubic meter. The desalination facilities will consist of a sea water intake, filtration, treatment and a reverse osmosis desalination plant. Desalinated water will be used for the process and Capstone will operate potable water treatment plants for consumption in the mine and port areas and to supplement water resources in the town of Diego de Almagro. The water requirement during the construction phase will be provided by an authorized water supplier. The maximum potable water, water for construction and dust control water requirements are estimated at 15 L/s. The mineral processing system at the process plant will use fresh desalinated and recycled water. The forecast water requirement is estimated at about 400 L/s.
Santo Domingo Project Region III, Chile
NI 43-101 Technical Report
Page 24-34
March 2020
Project Number: C40029
24.5.6 Magnetite Concentrate Pipeline
The magnetite concentrate transportation pipeline and the desalinated water transportation pipeline will run parallel and will be buried in a common trench for the majority of the pipeline route. At the port and plant locations, each line will be routed separately to the respective facilities. The concentrate transportation system is designed to transport magnetite concentrate slurry from the process plant to the concentrate filter plant at the port. The main pump station will be located in the process plant area. Choke and drain stations will be provided where required along the pipeline length.
24.5.7 Pyrite Pond
A 1.3 Mm3 capacity pond will be constructed to store the cobalt-rich cleaner scavenger tailings for the first 2 years of the planned operation. The design of the pond will be undertaken prioritizing excavation when generating the containment area, to eliminate the risk of landslides. Freeboard will minimize the risk of overflows due to seismic activity in the area. The pond will be provided with a double-liner geomembrane scheme to prevent leakage and seepage water. A leak detection system will also be implemented to support monitoring. It is currently planned to empty the pond over the first 11 years of operation of the cobalt plant.
24.5.8 Building Infrastructure
Building requirements will include at a minimum: Mine and plant site: administration area (offices, lunch room, control gate, access
guard house); operations (process plant control room and dispatch office, change house and training building, dining room for process plant and mine); contractor area (lubricants shop, workshops, change house); first aid and emergency facilities; maintenance facilities (mechanical maintenance, welding, warehouse and offices); assay laboratory; primary crusher and truck operators area (lunch room)
Port: port office (police, customs and marine services); port operations (offices, control room and laboratory building); change house; lunchroom; workshop and warehouse; access control; magnetite filter plant; copper concentrate storage; desalination plant.

Santo Domingo Project Region III, Chile
NI 43-101 Technical Report
Page 24-35
March 2020
Project Number: C40029
Capstone will provide building and maintenance areas to be used by service contractors for plant and mobile equipment maintenance. The areas will include provision for mine trucks and equipment, light vehicles, a mine truck wash bay and tyre shop, a welding shop, spare parts storage area, offices, maintenance dining room and a change house. The heavy vehicle workshop building will have service bays for mobile mine equipment, light trucks, mine trucks and tracked vehicles for maintenance and routine servicing. Mine equipment maintenance will be done under a MARC contract for the first 5 years; after that Capstone will carry out its own maintenance. Accommodation for construction and operations personnel will be in one camp at the mine site using temporary units to increase the capacity during construction. These units will be removed when construction is complete. The planned location of the camp is 2.5 km from the mine and process area. During construction, the camp will have capacity for up to 3,100 beds (including 307 beds for operations staff). The proposed permanent camp will accommodate approximately 500 people. The construction camp will be retained for the cobalt circuit construction, which will be undertaken after construction of the main plant. There is no plan to retain the camp when operation of the cobalt plant starts. For ongoing construction and maintenance activities, it is planned to accommodate personnel in off-site accommodations in Diego de Almagro or other nearby locations. Ancillary infrastructure will include fire protection, compressed air systems, dust control and solid waste management facilities.
24.5.9 Port
Based upon current Capstone concentrate production estimates, the maximum required annual port capacity is 5.5 Mt/y of magnetite concentrate, 0.52 Mt/y of copper concentrate and an average of approximately 22,500 t/y of cobalt sulphate in containers. It is planned to ship magnetite concentrate using a mixture of Panamax- and Cape-size vessels. Copper concentrate is assumed to be shipped using Panamax- and Handymax-size vessels. The containers containing the bagged cobalt sulphate can be shipped using smaller vessels.

Santo Domingo Project Region III, Chile
NI 43-101 Technical Report
Page 24-36
March 2020
Project Number: C40029
24.5.9.1 Copper Concentrate Copper concentrate (including copper precipitate from the planned cobalt circuit) will be delivered to the copper concentrate storage building at the port by trucks and handled to stockpiles within the port area using front-end loaders. Copper concentrate from the stockpiles will be fed to a belt feeder which in turn will feed the copper concentrate onto a shiploader conveyor belt. The total copper concentrate storage capacity will be approximately 50,000 t.
24.5.9.2 Magnetite Concentrate Magnetite concentrate will be received at the port in an agitated receiving tank from the magnetite slurry pipeline and then pumped directly to the filter plant holding tank. The filter plant will initially contain two ceramic disc filters and four filters after Year 5, each with a filter area of 144 m2. The requirement is for two filters for the first year of operation, three filters for the second and third years of operation and four filters from Year 5 onwards as magnetite concentrate production increases. There will be a common belt feeder which receives discharge from each pair of filters. Both belt feeders will then discharge onto a conveyor which will transfer the filtered concentrate to the mobile stacker at the initial 320,000 t magnetite stockpile. Stockpile capacity will be increased in the fifth year of operation to 500,000 t. The filtered concentrate will have a moisture content of about 8%.
24.5.9.3 Cobalt Sulphate Cobalt sulphate will be shipped in 1 t bags in containers through the port to Asian markets.
24.5.9.4 Auxiliary Facilities The port will require both plant and instrument air. The compressor plant will consist of two 110 kW compressors, one accumulator and one dryer with an accumulator for instrument air. Dust suppression systems will be installed.
24.5.10 Power and Electrical
Power will be required for the port, desalination plant, mine and process facilities: Santo Domingo Port at Punta Roca Blanca: includes the desalinated water pump
station and desalination plant (excluded from the estimated electrical load,
Santo Domingo Project Region III, Chile
NI 43-101 Technical Report
Page 24-37
March 2020
Project Number: C40029
included in the unit cost of desalinated water), magnetite concentrate filtration plant, concentrate storage and handling and associated infrastructure
Mine and plant site located near Diego de Almagro: includes the mine, process plant, infrastructure and tailings facility electrical loads.
The total maximum (peak) demand during operations estimated to be approximately 112 MW (excluding the desalinated water system). The estimated average demand during operations will be approximately 85 MW. Capstone’s mine site and port site will be connected to the Chilean national grid (Sistema Eléctrico Nacional or SEN). The closest connection point to the mine site is at the Diego de Almagro (San Lorenzo) substation located about 9 km from the mine area; the closest connection point to the port is at the Totoralillo substation about 14 km from the port area. Capstone has entered into a long term PPA with a leading power company operating in the national grid system. There are no concerns that the Chilean national grid system can provide a firm and continuous electrical supply.
24.6 2020 PEA Market Studies and Contracts
24.6.1 Capstone Market Capabilities
Capstone staff and experts retained by Capstone provided information related to the metal pricing for copper, treatment and refining charges and iron ore concentrate (62% Fe content sinter fines). Capstone maintains and publishes a Strategic Resource Planning Guidance; this was provided to the QPs. Capstone’s Marketing Group is experienced and capable of establishing and implementing a marketing strategy that will provide offtake agreements with favourable NSRs and benefit all stakeholders.
24.6.2 Copper Concentrate Market
24.6.2.1 Current Market China now consumes 50% of the world’s refined copper, however, lacklustre Chinese demand is causing the end use and first use sectors to shift away from China with the largest increases in demand set to emerge from Southeast Asian countries. Overall, global market forecasts are expecting a near term demand growth rate of 0.6% due to

Santo Domingo Project Region III, Chile
NI 43-101 Technical Report
Page 24-38
March 2020
Project Number: C40029
the economic slowdown due to the COVID-19 pandemic, which is dominating markets and copper price movements. The medium to long term annual demand growth rate is estimated to be 1.6%. Refined copper is a key determinant in the growth of developed and developing nations. Copper smelters are located in various regions; however, the majority are in Asia. All the smelters are accessible from Chile, but logistic costs are a significant factor in determining which smelter location will result in the best long-term offtake arrangements, hence providing the best returns. Secondary considerations are the possibility of linking offtake agreements to financing arrangements and strategic diversification. Geographic diversification provides some risk reduction in a marketing strategy, although other factors such as credit risk and performance risk must also be considered. It is expected that the emphasis for direct sales agreements will be placed on Asian smelters unless finance-linked contracts are available.
24.6.2.2 Supply Current mine supply is considered adequate to meet demand over the foreseeable future, but near term supply disruptions due to COVID-19 and low copper prices are expected to impact the longer term market by delaying projects. The lack of spending on projects relative to projected future demand has occurred primarily because copper prices have been too low relative to project hurdle rates in an environment of rising risks (water supply, more stringent environmental regulations, rising energy costs, political stability and resource nationalism). Current mine supply is set to decline by almost 4.4 Mt through 2029 even including projects under construction. Over the period of 2020 to 2023, supply growth is expected to exceed consumption leading to several years of surpluses. However, the copper price has not reached the level needed ($3.30/lb) to provide companies with the confidence to invest in new projects. The supply/demand gap will naturally rise over time. Over the period to 2029, an average annual supply gap of just over 4.4 Mt is predicted.
24.6.2.3 Demand China remains the key contributor to the forecast growth in copper consumption through 2030. At a 1.5% copper growth rate, copper demand is expected to grow by 4.5 Mt through 2030. Renewable energy infrastructure is predicted to be the single biggest driver of global copper demand growth over the coming years. Growth from

Santo Domingo Project Region III, Chile
NI 43-101 Technical Report
Page 24-39
March 2020
Project Number: C40029
the electric vehicle segment (cars and charging infrastructure) will be small, but not insignificant.
24.6.2.4 Price Projections It is difficult to project prices out to 2030. A 14% drop in the copper price in the June–July 2018 period was not anticipated by the analysts. Predictions have to include factors such as price growth outpacing marginal cost growth, inventory draw-downs and the need for prices to be high enough over the long term to fill the predicted 2025 to 2030 gap. A relatively balanced market is expected through 2022 with small annual deficits. However, the impact of the small deficits over this period will be a reduction in global stocks. Historically, as global stocks approach two weeks consumption levels, prices tend to rise. It is forecast that the incentive price of $3.40/lb will materialize 2021, after which additional projects will be announced but these will take some years to permit and build.
24.6.2.5 Treatment and Refining Charges There is generally a smelter preference for terms fixed for a period of a year to provide stability in their income stream. Currently, the average Chinese copper smelter requires a treatment charge/refining charge (TC/RC) of $65/6.5 cents to break even. By-product credits and currency exchange rates also affect the profitability. Given that the analysis of concentrate supply/demand shows a shortage of concentrate in the future, it is reasonable to forecast lower TC/RCs. However, moving from a relatively balanced market in 2017 and 2018, where benchmark TC/RCs were agreed at $82.25/8.225 cents, 2019 benchmark terms have been agreed at $80.80/8.08 cents, recognizing that the concentrate is expected to move to a deficit. Potentially, a deficit of only 2 Mt could push TC/RCs well below the smelter breakeven point. If the deficit continues for an extended period of time, the result could be the closure of some higher cost smelters which would lead to even higher copper prices and also higher TC/RCs as the market seeks an equilibrium state. Longer-term TC/RCs of $75/7.5 cents are considered reasonable given that this provides smelters with an operating margin and still reflects a market that will be in deficit for a period of time.

Santo Domingo Project Region III, Chile
NI 43-101 Technical Report
Page 24-40
March 2020
Project Number: C40029
24.6.2.6 Forecast Copper Concentrate Product For the purposes of assessing the marketability of the copper concentrates, Capstone supplied the analysis of the copper concentrate specifications in Table 24-10. Given the expected qualitative analysis for the concentrate to be produced, the Santo Domingo concentrate would be considered a “premium” concentrate in the international smelter market. The concentrate is expected to have a higher than average copper content (30%) with no appreciable deleterious elements. Commodity traders can provide better net terms than smelters and can provide more flexibility as they can deliver to numerous locations. Because of the expected ‘clean’ composition of the Santo Domingo concentrate, Capstone considers that concentrate will be in high demand from trading companies specializing in blending complex materials with clean materials. It is anticipated the marketing strategy would include sales to both markets. Over the last 4 years Capstone’s Marketing group has engaged with numerous parties from both markets and has received expressions of interest. An analysis of the final concentrate generated at Aminpro in 2019 in the LCT of the Years 1-5 composite using desalinated water showed no deleterious elements (Table 24-11).
24.6.2.7 Copper Marketing Strategy Copper concentrates can be sold under a number of different agreements, including long-term offtake agreements or frame contracts, mid-term agreements or mid-terms, evergreen and spot contracts and trader offtake agreements. The copper concentrate will have a low gold content (around 3 g per dmt) and a low silver content (around 27 g per dmt). As a result, there will be considerable value to pricing the material on an Asian-style basis. Under Asian-style pricing silver is paid for at 90% of the full and final assayed quantity of the silver, provided that the silver content is above a minimum of 30 g per dmt. Below this threshold, silver would not normally be payable. Gold is payable on a percentage based on a sliding scale of the full and final assayed quantity, provided that there is a minimum of 1 g per dmt of gold contained. Below this threshold, gold is not payable. This will be accentuated when, occasionally, the silver content rises above 30 g per dmt and over 89% of the silver content would be payable.

Santo Domingo Project Region III, Chile
NI 43-101 Technical Report
Page 24-41
March 2020
Project Number: C40029
Table 24-10: Predicted Copper Concentrate Specification Chemical Element Unit Value
Cu % 30.3 Fe % 29.4 S % 30.9 Au g/t 3.4 Ag g/t 26.6 Hg g/t 4.6 Cl g/t 292 F % 0.013 SiO2 % 1.89 As g/t 67 Bi g/t <40 Cd g/t <10 Co g/t 416 Cr g/t 102 Pb g/t 198 Mn g/t 312 Ni g/t 79 Sb g/t 195 Se g/t 195 Sn g/t 36 Zn g/t <20 P80 µm — 44.4
Note: The specifications are from 2011 metallurgical testwork and are not smelter-derived specifications.
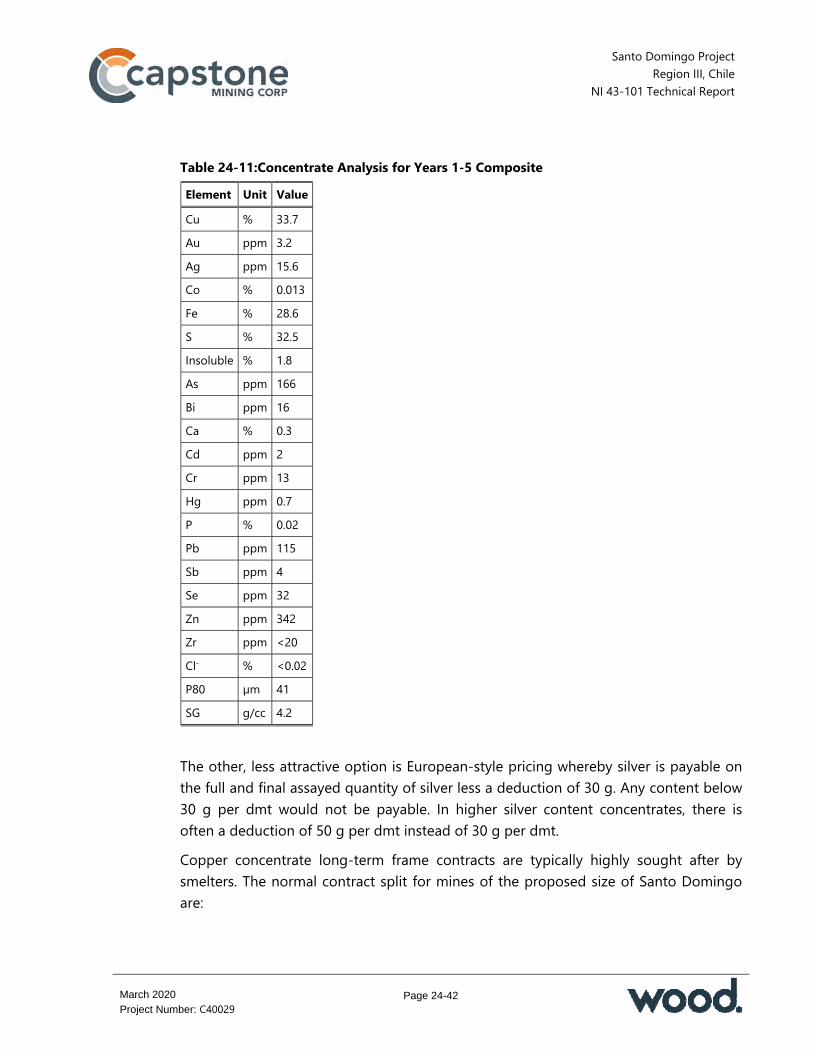
Santo Domingo Project Region III, Chile
NI 43-101 Technical Report
Page 24-42
March 2020
Project Number: C40029
Table 24-11: Concentrate Analysis for Years 1-5 Composite Element Unit Value Cu % 33.7 Au ppm 3.2 Ag ppm 15.6 Co % 0.013 Fe % 28.6 S % 32.5 Insoluble % 1.8 As ppm 166 Bi ppm 16 Ca % 0.3 Cd ppm 2 Cr ppm 13 Hg ppm 0.7 P % 0.02 Pb ppm 115 Sb ppm 4 Se ppm 32 Zn ppm 342 Zr ppm <20 Cl- % <0.02 P80 µm 41 SG g/cc 4.2
The other, less attractive option is European-style pricing whereby silver is payable on the full and final assayed quantity of silver less a deduction of 30 g. Any content below 30 g per dmt would not be payable. In higher silver content concentrates, there is often a deduction of 50 g per dmt instead of 30 g per dmt. Copper concentrate long-term frame contracts are typically highly sought after by smelters. The normal contract split for mines of the proposed size of Santo Domingo are:
Santo Domingo Project Region III, Chile
NI 43-101 Technical Report
Page 24-43
March 2020
Project Number: C40029
60–70% on long-term frame contracts with four or five major smelters 10–20% to traders on 3–5 year fixed TC/RCs or TC/RCs to be negotiated annually 20–30% spot contracts for up to 1 year with traders at fixed terms. The timing to secure sales contracts would be dependent on the progress of arrangements for financing.
24.6.2.8 Logistics It is planned to ship copper concentrate from a northern Chilean port. However, due to the low monthly shipment tonnages and low-capacity storage facilities, most of the shipments will be made using Panamax- and Handymax-size vessels. A price of $40/dmt was used in the 2020 PEA economic analysis, anticipating freight price escalation and uncertainties around proposed International Maritime Organization (IMO) requirements that vessels burn low sulphur fuel or install scrubbers to process the engine exhaust.
24.6.3 Iron Concentrate
24.6.3.1 Market Input Capstone contracted CRU in 2014 to supply a report on marketability and price projections for iron ore concentrate (62% Fe content sinter fines). Capstone also contracted CTAG in 2014 to comment on the general aspects of the iron ore business, background information, pricing structure, revenue expectations based on a CRU report, weighing and sampling and freight. During 2018, Capstone contracted Mr David Trotter, global iron ore and commodity marketing consultant, to evaluate the pellet feed market and contracted Braemar to review shipping costs. The Trotter (2018) forward pricing report prepared for Capstone estimated that prices for 62% Fe content sinter fines (Platts Iron Ore Index or IODEX) cost-and-freight (CFR) Qingdao delivery (deemed the standard product for CFR China delivery) can be expected to be in the range of $62/dmt to $72/dmt over the next 10 years. This study is based on a long-term price of $69/dmt for 62% Fe concentrate. Premiums for 65% Fe concentrate ($24/dmt), value-in-use (VIU) for 66% Fe ($1.50/dmt), magnetite content ($2.50/dmt) and low alumina ($7/dmt for each 1% below 2.5%) are expected to remain relatively stable because of the direct impact on furnace productivity and decrease in emissions. This study discounted the current premiums to approximately 80%.
Santo Domingo Project Region III, Chile
NI 43-101 Technical Report
Page 24-44
March 2020
Project Number: C40029
Braemar conducted a long-term estimate of shipping costs to include new construction and new environmental regulations on sulphide emissions. Long-term contracted prices are expected to drop from the current spot market price of $20/dmt to below $15/dmt. This study has assumed a long-term shipping cost of $20/dmt. The net result is a price of $80/dmt CFR.
24.6.3.2 Supply/Demand Iron ore is globally traded with hematite (Fe2O3) and magnetite (Fe3O4) ores making up the vast majority of the world seaborne trade with most of the supply coming from South America and Australia. Steel production dictates the demand for iron ore. China dominates the global production of steel and thus the consumption of iron ore. Other top producers include Japan, India and South Korea. The demand for pellet feed in China is expected to be strong and the dominant growth segment in the iron ore market; due to factors such as environmental restrictions on blast furnaces and sinter plants, improving blast furnace efficiencies, lack of high-grade domestic pellet feed, construction of new large-scale pellet plants, higher margins for high quality steel, increasing use of pellet feed in sintering and changing individual customer demands and technical limits. Global demand for iron ore pellet feed is expected to increase from 416 Mtpy to 655 Mtpy in 2027 (Trotter, 2018).
24.6.3.3 Pricing of High-Grade Iron Ore Fines (>65% Fe) The price of iron ore is widely accepted as the 62% Iron Ore Index as reported by price reporting companies in dollars per dmt. In 2016 the price range variability was 112% and in 2017 the price range variability was 78%. To July 2018 the price range variability has been only 26%; this represents a decrease in volatility (Trotter, 2018). In 2018 at the same time as reduced variability, the price of higher-grade iron ores (as represented by the Platts and Metal Bulletin 65 Iron Ore Index) has increased relative to the 62 Iron Ore index with a large price differential of $28 per dmt. This premium is expected to persist for higher-grade material. The premium should be considered a major part of any price forecast for iron ore products including pellet feeds. This has

Santo Domingo Project Region III, Chile
NI 43-101 Technical Report
Page 24-45
March 2020
Project Number: C40029
been mirrored to an extent by the low-grade ore index; the low-grade ores are under reduced demand and are increasingly being blended with high-grade ores. Using iron-making models it is possible to predict the scenarios which would affect the premium. Assuming a steel margin in the range $30–$100/t and a derived coke price between $170/t and $260/t the scenarios show a long-term premium between $19–$33. This corresponds to a midpoint of $26/t which can be used as a base for forecasting for the remaining 2018 and 2019. This is a large percentage of the 65% Iron Ore Index price component which is expected to remain disconnected from 62% Iron Ore Index for the period 2020–2027. The limits on alumina also help to drive up the premium for ores >65% Fe because by mass balance the total oxides should be less than 6.0%. Three of the top four iron ore suppliers (BHP, Rio Tinto, FMG) have increased alumina from an average below 2% to a combined average of 2.35% in 2018 whilst maintaining an average silica content of 4.5%. Santo Domingo pellet feed would attract the high iron grade premium and a further premium if the alumina content is less than 1% (currently at $7 per 1% of alumina below 2.5%). Further, if Capstone pellet feed maintains a silica content below 5.0% then it would not attract silica penalties in an alumina-constrained market.
24.6.3.4 Logistics Because iron ore is a relatively low-value commodity, logistics costs need to be minimized so typically VLOC vessels are used for transportation. Based on the analysis undertaken by Braemar, the new class of VLOC (Guaibamax) (325,000 dwt), of which 38 are on order in South Korea shipyards, would be the most suitable and cost-effective vessel for shipping to Eastern Asia. The 400,000 dwt Valemax vessels would also be effective. This does not preclude the use of smaller vessels in the 250,000 dwt to 300,000 dwt range.
24.6.3.5 Freight Rates Given current bunker rates, port charges, vessel values and 60 kt/d load rate with 50 kt/d discharge rate, a projected freight rate of $12.76/wmt was determined for a Chile–China routing. Allowing for inflation and other possible changes in operating costs a rate of $20/dmt has been considered conservative and appropriate for the purposes of the 2020 PEA mine plan.

Santo Domingo Project Region III, Chile
NI 43-101 Technical Report
Page 24-46
March 2020
Project Number: C40029
24.6.3.6 Forecast Iron Concentrate Specifications For the purposes of assessing the marketability of the iron ore concentrate, Capstone expects to produce an iron ore concentrate with the specifications shown in Table 24-12. Table 24-12: Predicted Iron Concentrate Specification Chemical Element Unit Value
FeT % 66.06 FeO % 23.08 SiO2 % 4.10 Al2O3 % 1.00 CaO % 0.57 MgO % 0.455 P % 0.011 S % 0.020 Cl ppm 60 Na2O % 0.145 K2O % 0.105 Mn % 0.069 Cu % 0.0081 L.O.I % 1,34 >40 µm % 21,3 Blaine cm2/g 1,896 Note: The specifications are from 2011 metallurgical testwork and are not smelter-derived specifications.
The iron concentrate will be a typical pellet feed currently in use in pellet plants. Magnetite will be the predominant mineral. The iron grade will be high (Fe >65%) and the low alumina (Al2O3) and low phosphorus (P) will likely make the concentrate suitable for most pellet plants. The suitability and demand for this pellet feed should be considered in the context of increasing use of pellets in iron making, the increased use of higher-grade iron ores generally and as a premium additive to sinter plants by blending.
Santo Domingo Project Region III, Chile
NI 43-101 Technical Report
Page 24-47
March 2020
Project Number: C40029
Steel mills have variable impurity allowances and tolerances, but typical values are SiO2 <3.5%, though in pellet plants this may be as high as 5.5%; Al2O3 <1%; Mn <0.5%; P <0.1%; S <0.1%; Cu <0.01%; and a combined Na2O and K2O <0.5%. If impurities are higher than the levels discussed, then it becomes more difficult, but not impossible, to place material with mills. The main levels of impurities expected in the iron concentrate are silica and copper. Copper is expected to be below the threshold but may, in some circumstances, represent a non-preferred feed. Silica is only likely to be a cost factor or penalty element rather than a rejectable quality issue. Silica penalties are variable but would be of the order of $1.50–$2.00/t per each 1% above 3.5%. Some mills will reject material above 6% SiO2, others will reject at higher percentages; there is a very large variance in silica tolerance. Capstone will need to be selective in finding steel mills with the right fit for the Santo Domingo iron concentrate. Iron ore in China is normally traded and priced on the basis of 62% Fe content, with premiums paid for higher iron content and discounts for lower iron content.
24.6.4 Cobalt
The cobalt circuit will produce cobalt sulphate heptahydrate, sulphuric acid, copper sulphide precipitate and power. For the 2020 PEA, no preliminary marketing was conducted for any of these revenue generating streams. Pricing assumptions were based on information derived from third-party experts and publicly-available reports.
24.6.4.1 Cobalt Sulphate Pricing for cobalt is based on the Darton Commodities Cobalt Market Analysis 2018–2019, dated February 2019. The outlook is for cobalt pricing to reach the $20/lb level in 2020 and maintain above that level for the foreseeable future. The primary driver for price support at that level is expected to be growth in the electric vehicle market. Hence, the market for cobalt sulphate is expected to offer the greatest growth potential compared with cobalt metal and other intermediate products. The expected market for cobalt sulphate would be Korea, Japan and Europe. No discount in the realized price for the contained cobalt in battery-grade sulphate would be expected in these markets. It is anticipated that battery-grade cobalt sulphate could command a premium over metallic cobalt, but no premium has been considered for the pricing assumptions used in the 2020 PEA.

Santo Domingo Project Region III, Chile
NI 43-101 Technical Report
Page 24-48
March 2020
Project Number: C40029
The pricing assumption for the 2020 PEA is for a fixed $20/lb of contained cobalt over the 2020 PEA mine life. Commercialization costs for the 2020 PEA assume that the product would be shipped from the Santo Domingo port in containerized one-tonne bags to Asian markets (excluding China). These costs are estimated to be $10.00/t for inland freight and $50.00/t for ocean freight.
24.6.4.2 Copper The cobalt recovery circuit will generate a minor amount of by-product copper sulphide precipitate. For 2020 PEA purposes, it is assumed that the filtered copper sulphide precipitate will be combined with the copper concentrate for shipping. Pricing and marketing terms are presumed to be the same as those used for the copper concentrate.
24.6.4.3 Sulphuric Acid Sulphuric acid pricing projections were based on the December 2018 Chilean Copper Commission (Cochilco) Report on the sulphuric acid market in Chile. Although there are several operations near Santo Domingo that use sulphuric acid in copper leaching operations, the market for acid in Chile is normalized to Mejillones in Region II. The 2020 PEA assumes a long-term sulphuric acid price of $70/t CIF Mejillones. Estimates of $12.50/t each were assumed for inland and ocean freight (total $25.00) to transport acid from Santo Domingo to Mejillones. These were discounted from the estimated long-term price, resulting in a revenue estimate of $45.00/t for by-product acid production.
24.6.4.4 Electricity The cobalt circuit will produce an excess of electrical power above that required for the cobalt circuit. The PPA contemplates the production of internally-generated power within the commercial terms. The excess power is assumed as a credit to the 2020 PEA operating costs for the cobalt circuit at the contracted rate.
24.6.5 Contracts
Kores has the right to purchase up to 50% of the annual production of copper concentrate and iron ore concentrate, leaving Capstone to market and sell the remaining concentrate. The Kores terms and conditions will reflect the Capstone terms negotiated independently in the market.

Santo Domingo Project Region III, Chile
NI 43-101 Technical Report
Page 24-49
March 2020
Project Number: C40029
No contracts are currently in place for Santo Domingo’s production for the copper and iron ore concentrates, cobalt sulphate or sulphuric acid. No other contracts are in place other than the PPA for power supply.
24.6.6 Comments on Section 24.6
In the opinion of the QP, the marketing studies support that there is potential for the sale of the copper and iron concentrates from Santo Domingo as follows: The copper concentrate would generally be considered clean. Chlorine and fluorine
are safely under the limits and if they are occasionally over the limit it is likely that only a nominal penalty would apply. For trading companies specializing in blending various complex copper concentrates a clean concentrate such as that from Santo Domingo would be in high demand
It is important that Capstone is ready to enter the market at an early stage to begin the process of finding a partner to buy its ultra-fine iron ore concentrate
Kores has the right to purchase up to 50% of the annual production of copper concentrate and iron ore concentrate under terms and conditions that will reflect terms negotiated independently in the market by Capstone
The plan is to produce cobalt as cobalt sulphate because the market for cobalt sulphate is expected to offer the greatest growth potential compared with cobalt metal and other intermediate products
For the 2020 PEA, no preliminary marketing was conducted for any of the planned cobalt sulphate heptahydrate, sulphuric acid, copper sulphide precipitate and power products
No contracts are currently in place for Capstone’s part of the production No other contracts are in place for Santo Domingo other than the PPA for power
supply. The QP is of the opinion that the marketing studies and metal price forecasts are acceptable for use in the economic analysis in Section 24.9.
Santo Domingo Project Region III, Chile
NI 43-101 Technical Report
Page 24-50
March 2020
Project Number: C40029
24.7 2020 PEA Environmental Studies, Permitting and Social or Community Impact
24.7.1 Baseline Studies
Baseline studies were conducted between 2007 and 2013 for the environmental characterization to support the EIA. Completed studies include physical environment (climate, meteorology), physical environment (climate, meteorology); air quality; noise; natural hazards; soils; hydrology/hydrogeology; fauna; flora; port area (setting, tides, chemical and marine environments); human environment (setting, heritage, archaeology); paleontology; and visual landscape. The EIA was presented to the authorities in October 2013. Capstone’s RCA was obtained in 2015 and will expire in July 2020. A project owner has up to 5 years after the RCA is awarded to initiate the construction of the approved works or activities. At a minimum, early works must be initiated to retain the validity of an RCA. For Santo Domingo these early works consist primarily of site access from the existing road network and some site grading. Capstone has completed the engineering evaluations and requested construction quotations for the early work and will begin construction in March 2020. This should ensure that the RCA will remain valid post July 2020. After issue of the RCA, modifications were identified at the port for the desalination plant and auxiliary facilities. These were included in an Environmental Impact Statement (DIA) submitted in September 2019; it is estimated that approval will be received in H2 2020. The cobalt circuit is planned to be located northeast of the copper concentrator area described in the approved EIA. The area where the cobalt circuit is projected to be built was previously characterized in the geological, hydrological and hydrogeological baseline studies for the EIA. However, given that the cobalt circuit will modify the original planned facilities, a new EIA (or DIA) will be required and must be approved by the SEA. It is likely that any additional baseline characterizations can be developed from the information in the original EIA or updated using secondary sources. This could include information on physical environment (climate, meteorology), hydrology/hydrogeology, geology, geomorphology and natural hazards, soils and the visual landscape.
Santo Domingo Project Region III, Chile
NI 43-101 Technical Report
Page 24-51
March 2020
Project Number: C40029
24.7.2 Permitting
24.7.2.1 Overview The approved EIA (RCA No. 119/2015) includes the following planned process-related works/facilities: Mine–plant area: open pits, WRFs and TSF, crushing, copper concentrate
production and magnetite concentrate production, cobalt circuit including sulphuric acid plant, copper concentrate filtration; camp, services support (guard house, lunchrooms, first aid facilities, temporary and permanent waste storage), power distribution, roads (internal, mining and access) and modifications of public roads and power lines
Pipeline area Port area: magnetite concentrate filtration, storage of copper and magnetite
concentrates, conveying and ship loading of concentrates, storage and loading of containers containing cobalt sulphate, desalination system
Power transmission line area: transmission lines to supply power to the mine site and port.
About 140 works and installations were identified, distributed between the four areas. The number of permits required for all facilities is estimated to be about 700 in total, with the majority (about 60%) related to the mine and plant area. Permits that have been classed as critical to ensure that timely construction and start-up as envisaged in the 2020 PEA are summarized in Table 24-13. Capstone has organized the permits in a Permitting Matrix (updated in November 2019) that will facilitate management of the status and assignment of responsibilities. During the update of the Permitting Matrix strategies were identified to reduce the risk of delays in the preparation and submission of submissions for permits.
24.7.2.2 Proposed Cobalt Circuit EIA/DIA Capstone will have to request environmental approval for the cobalt circuit using an EIA or a DIA. A preliminary analysis of Article 3 of Supreme Decree N° 40/2012, Environmental Impact Assessment Regulation, indicates that Capstone must request approval for the cobalt circuit.

Santo Domingo Project Region III, Chile
NI 43-101 Technical Report
Page 24-52
March 2020
Project Number: C40029
Table 24-13: Critical Permits Critical Permits DIA for change of desalination plant EIA Update (Consulta de Pertinencia recommended to determine if DIA or EIA required) Closure Plan* (will require update to accommodate proposed Co circuit) Santo Domingo Port Maritime Concession* DOP Permit* Public Road Route 13 and Route C-17 By-Pass Access Road Permits Permit for Construction for Fluid Containment over 5 m height or more than 50,000 m3 capacity Tailings Facility Approval* Authorization for Works in a Water Course (DGA Art.294 letter c)) Authorization for Works Modifying a Water Course Sectorial Permit to Discharge into National Waters Health Authority Approval for Brine Discharge Exploitation Method Authorization (Open Pit)* Authorization for a Stockpile or Waste Dump* Construction Permit (IFC) (approved for early works December 2019) Building Permits Final Works Reception Process Plant Operating Permit* (will require update to accommodate proposed Co circuit) Sanitary Landfill Permit Hazardous Waste Area Sewage Water Treatment Plant (SWTP) Acid Tanks Approval Acid Storage and Management Plans Acid Transport Permit
Note: * Indicates permits that have been approved.
Chilean environmental legislation allows two types of submission into the SEA, a DIA or an EIA. The type of document required depends on the magnitude of the potential impacts of the project. Mitigation, compensation and/or reparation measures may

Santo Domingo Project Region III, Chile
NI 43-101 Technical Report
Page 24-53
March 2020
Project Number: C40029
need to be adopted to control these impacts and monitoring programs may need to be implemented. For an approved EIA, it is possible that the modifications will require only a DIA. The roaster and acid plant are not as complex (in environmental approval terms) as facilities such as the TSF or the WRFs. However, the authorities will be interested in the environmental sensitivity of the area where the modifications will be located. For the cobalt circuit, the baseline results must be analyzed against the regulation and the potential impacts must be weighed along with the cumulative effects of the whole operation (original plus modifications). A preliminary analysis was completed to assess whether the transport of the sulphuric acid would change the type of environmental document required. The transport is a linear component with a high degree of environmental risk (spills of hazardous substance). A review of projects that involve the transportation of sulphuric acid, showed that most requested approval via a DIA. The following criteria were considered in the justification of the effects, characteristics or circumstances of Article 11 of Law 19,300 and Title II of D.S. N°40/2013 (Articles 5-11) that could define the need for an EIA: The operation will not exceed the effluents, emissions or waste limits that could
present a risk to community health in terms of air, noise and effluent regulations because transport will use existing roads; no effluents or waste will be disposed of; maintenance will be completed in approved installations.
The addition of the cobalt circuit does not require road improvements; therefore, no soils, flora, vegetation or fauna will be impacted. There are no additional river crossings or impacts to wetlands or protected areas along the transport routes.
The addition of the cobalt circuit includes contingency plans for spills; therefore, no soils will be impacted.
The frequency and duration of emissions to the atmosphere due to transport will not be so significant as to impact to soil, water or air quality. Noise emissions will not differ from current use of the routes, therefore, impact to fauna is not significant.
Since existing roads will be used, no significant impacts are described to protected communities, cultural patrimony or the socioeconomic conditions.

Santo Domingo Project Region III, Chile
NI 43-101 Technical Report
Page 24-54
March 2020
Project Number: C40029
One of the main items to consider whether the required document for approval is a DIA or an EIA is the level of detail needed for the description of the transport of sulphuric acid. The SEA will require very specific details about the transportation logistics; detail that has increased with the recent changes in environmental regulations. According to the Transport Guide published by SEA (Guía Transporte SEA, 2017), the description of transport activities for products or waste must include a detailed description of routes, method of transport and a description of emergency plans. In addition, the environmental authority requires traffic studies and specific environmental analysis to confirm whether impacts will occur in the area of influence. For transport of acid from the Santo Domingo site to the Mejillones port, the potential areas of interest will be around Route C-13 from Diego de Almagro and Route 1 arriving at Mejillones; most of the route will be along Route 5.
24.7.2.3 Sectorial Permits Capstone has started the sectorial permitting process and has received approvals from Sernageomin for the TSF (February 2019), copper and iron recovery process plant (December 2018), the WRFs, (September 2018), the Mine Closure Plan (July 2019) and the exploitation method permit (May 2018). For the port area, Capstone has received approval for the Maritime Concession permit (September 2015) and preliminary approval for the port infrastructure (September 2018). The planned cobalt circuit will likely require additional sectorial permits that must be included in any new EIA (or DIA) document. These may include: Archeological permits if a protected site is likely to be impacted Fauna capture and relocation, if new baseline studies indicate such is needed Flora conservation or relocation if new baseline studies indicate the presence of
protected species Updated Mine Closure Plan Construction or modification of the SWTP, or other installations for waste
treatment and disposal Approval for construction of the pyrite pond of >50,000 m3 in capacity Municipal building construction permit Permit required to meet building and zoning codes health requirements.
Santo Domingo Project Region III, Chile
NI 43-101 Technical Report
Page 24-55
March 2020
Project Number: C40029
24.7.2.4 Permit Risks Risks around general permits and the permits assumed to be on the critical path include: Changes or modifications of the configuration that were not included in the
original EIA/RCA for which new permits may be required Modifications to the existing legal framework, which could lead to new
authorizations and/or permits not considered in the 2020 PEA. The approved EIA did not include the current plan to use desalinated water for the process and the construction of one large desalination plant in the port area, as part of a BOOT contract. An update for the production and use of desalinated water (DIA) was submitted in September 2019 and approval is expected in H2 2020. This 2019 DIA did not include the cobalt circuit, therefore the planned changes relating to the cobalt plant will require a new application.
24.7.3 Closure Planning
Capstone received approval of the Closure Plan on 25 July 2019 via Exempt Resolution N°1910. Modifications and changes approved by a DIA or an EIA must be included in updates to the Closure Plan. The Closure Plan must be approved before construction starts and a bond must be delivered to the government of Chile during the first year of operation. The Closure Plan covers the mining facilities included in the EIA; this includes the mine site, port, pipeline route and transmission lines. Closure Plan approval is preceded by obtaining permits for the TSF, process plant, open pits (mine exploitation) and WRFs. Capstone developed a Closure Plan following Sernageomin’s Methodology Guide. An update to the Closure Plan must be submitted for the modifications at the port approved by the DIA and for the cobalt circuit for which approval will be requested in a new EIA or DIA. It is estimated that the main modifications to the Closure Plan due to these changes will be in dismantling costs and decontamination of the pyrite pond and acid tanks. Mining companies are required under law to provide a bond which is calculated based on the closure costs. The state can execute this bond if the mining company does not comply with the closure commitments. The bond is submitted gradually (currently over a period of 15 years) with the amount to cover 20% of the total closure cost submitted
Santo Domingo Project Region III, Chile
NI 43-101 Technical Report
Page 24-56
March 2020
Project Number: C40029
during the first year of operation, discounted at a rate defined by the Central Bank of Chile (Sernageomin, 2018). The closure phase for the Santo Domingo mine is planned to occur between 2040 and 2042, followed by the post-closure phase. The post-closure phase consists of monitoring and inspection and is scheduled to end by 2047. Landfill monitoring may continue for another 20 years to comply with the Landfill Regulation (D.S. 186/2008 of the Ministry of Health).
24.7.4 Proposed Tailings Storage Facility
The TSF is planned to be located approximately 2 km southeast of the process plant (refer to location in Figure 24-8). The TSF has been designed for a total tailings storage capacity of approximately 196 Mm³ or 314 Mt at an estimated final overall average dry density of 1.6 t/m3. Tailings will be deposited at a slurry solids concentration of 67% using the sub-aerial method from discharge points positioned in the basin of the TSF. A spillway will be constructed during the final raise of the TSF for use as a run-off discharge structure after closure. Water from the supernatant water pond will be recovered and recycled to the process throughout the operating life of the TSF. A monitoring system will be established to monitor for potential seepage. A large portion of the catchment area above the TSF will be diverted around the TSF by a 3.7 km long channel. The channel will be above the eastern side of the TSF and the diverted run-off will be discharged downstream of the TSF embankment. The TSF has been approved by the mining authority (Sernageomin) and is currently being evaluated by the water authority (DGA). Any modifications to TSF design or capacity would have to be notified to these authorities and approval for the change requested.
24.7.5 Considerations of Social and Community Impacts
The Santo Domingo property area of influence includes the Provinces of Chañaral and Copiapó in the Atacama Region and particularly the communities and towns of Diego de Almagro, Chañaral and Caldera. There are no indigenous lands or territories of any kind being claimed on the Property area. Although the lands of the Colla Community of Diego de Almagro are not within
Santo Domingo Project Region III, Chile
NI 43-101 Technical Report
Page 24-57
March 2020
Project Number: C40029
the direct area of influence, Capstone will keep lines of communication open for possible approaches or inquiries from this community. Consultations have been held in Diego de Almagro, Chañaral and Copiapó (March 2012), Diego de Almagro and Chañaral (August and September 2012), Community of Caldera (June 2013) and Diego de Almagro, Chañaral and Caldera (September 2013). Consultations included open houses, open meetings, meetings for special interest groups such as fishermen and meetings with authorities, regional and community services as well as with professional organizations. Capstone has contacted authorities from government, municipality, business and trade associations and other NGOs in the region. Capstone’s communications strategy will focus on building a positive reputation and supportive environment for development or a mining operation in the Atacama Region. Specific development strategies are directed to the communities of Diego de Almagro and Caldera. A communications plan, communications committee and crisis response management plan are being developed. A health and safety management system has been developed to meet local legal requirements and industry best practices. Capstone will implement policies, standards, plans and security procedures and will use facilities, equipment and personnel required to provide adequate security levels for its staff and facilities. The cobalt circuit will have to be incorporated into a consultation process, as required by the EIA or DIA evaluation. In addition, the communications strategy and plan must be updated to incorporate these changes. It is anticipated that the addition of the cobalt circuit will raise the following stakeholder concerns: The use of 50 trucks per day will increase traffic from the proposed mine–plant area
to the Mejillones port. Based on original commitments in the EIA, a by-pass was defined around Diego de Almagro to reduce traffic and avoid the transit of heavy vehicles through the town. New traffic studies must evaluate if additional mitigation is required or if the planned by-pass will be sufficient
Additional local employment and training will be anticipated for the modifications by stakeholders
An emergency plan for acid transport incidents must be developed, considering community reporting, training and participation.

Santo Domingo Project Region III, Chile
NI 43-101 Technical Report
Page 24-58
March 2020
Project Number: C40029
24.8 2020 PEA Capital and Operating Costs
24.8.1 Capital Cost Estimate
24.8.1.1 Introduction The capital cost estimate provides the total capital cost estimate for the 2020 PEA. A subset of the estimate that details the costs for the proposed cobalt plant is also provided to show the proportion of the 2020 PEA costs that are attributable to the planned cobalt circuit. The accuracy of the estimates contained within this PEA is estimated to be ±40%. All construction activity is assumed to be completed by construction contractors. No provision was included for Owner or engineering, procurement and construction management (EPCM) managed direct hire work in the estimate. Direct costs include direct construction labour, equipment, materials, consumables and miscellaneous items that form the permanent facilities. Indirect costs include items required to support the construction of the permanent facilities. Owner costs are Capstone’s costs prior to the start of operations. Sustaining capital costs include ongoing costs for facilities and equipment required to maintain or increase production. Contingency reflects the potential growth in capital costs excluding changes in the scope of work.
24.8.1.2 Mining Costs Sustaining capital totals $285.3 M from the beginning of metal production (Y0 H2) through Year 16. The total capital for mine equipment is $267.8 M over the mine life (Table 24-14).
24.8.1.3 Process Costs The capital costs for the process plant total $715 M and are summarized in Table 24-15.

Santo Domingo Project Region III, Chile
NI 43-101 Technical Report
Page 24-59
March 2020
Project Number: C40029
Table 24-14: 2020 PEA Mine Capital Cost Estimate Summary ($M)
Cost Area Initial Capital Sustaining Capital Total Capital
Mine development 57 — 57 Equipment purchase 81 187 268 Equipment rebuild — 93 93 Other investments 23 4 27 Dispatch 3 2 5 Total 164* 285 449
Note: * Does not include mine infrastructure ($14 M), which is included in the mine total in the summary tables. Figures have been rounded and may not sum.
Table 24-15: 2020 PEA Process Plant Capital Cost Estimate Summary
Description Cost ($ M)
Process plant general 9 Mill feed material handling 43 Grinding 115 Copper flotation and regrind 58 Magnetic separation and regrind 40 Tailings thickening and transport 30 Reagent plant 15 Copper concentrate filtration 12 Pyrite flotation 12 Roast 122 Acid plant 144 Leach/Neutralization/precipitation 20 Co solvent extraction 26 Co crystallization/packaging 16 Plant building 28 Concentrate storage pond 25 Total 715
Note: Figures have been rounded and may not sum.

Santo Domingo Project Region III, Chile
NI 43-101 Technical Report
Page 24-60
March 2020
Project Number: C40029
24.8.1.4 Tailings Storage Facility The TSF costs include all earthworks and supply and installation of materials for the underdrains, liner system, tailings distribution system and tailings water reclaim system. Costs are also included for contractor mobilization and demobilization, overhead and profit. Costs total $47.4 M, consisting of $21.8 M for the starter dam and a total of $25.7 M for TSF raises in Year 2, Year 8 and Year 12.
24.8.2 Infrastructure Capital Costs
A 9 km long 220 kV high voltage transmission line from the Diego de Almagro (San Lorenzo) substation to the mine and process plant site will be required. A 14 km long 220 kV high voltage transmission line from the Totoralillo substation to the port site is also required. The road design and capital cost estimate totals $22 M.
24.8.2.1 Concentrate Pipeline The magnetite concentrate transport was estimated at $87 M.
24.8.2.2 Port Facility The port facility cost estimate totals $122 M, which includes allocations for supply, sub-contractor and installation costs. General areas included in the estimate are: copper concentrate transport, storage and loading; magnetite concentrate handling, storage and transport; ship loading infrastructure; ship mooring and berthing infrastructure, mechanical equipment; marine works services; on-site port infrastructure; port infrastructure (on site); control, communications and safety systems; sea water supply.
24.8.2.3 Indirect Costs Indirect costs total $380 M. Areas considered in the estimate consist of engineering and procurement services (EP); construction management (CM); home and field office materials (EPCM); support engineering; accommodation camps and related services; temporary installations; water supply; power; safety and communications; waste management; third-party services; warehouse and crane; transport; commissioning activities; freight and customs; start-up and first-year spares; and first fills.
Santo Domingo Project Region III, Chile
NI 43-101 Technical Report
Page 24-61
March 2020
Project Number: C40029
24.8.2.4 Owner Costs Owner costs were estimated by Capstone and were provided to Wood to incorporate into the 2020 PEA capital cost estimate. The Owner costs total an estimated $132 M including allocations of $112 M for the iron and copper circuits and $20 M for the cobalt process plant. Owner costs include allocations for labour costs; general management, administration and finance; legal, mining property and permits; health, safety, environmental and community relations; recruitment and selection processes; training; personnel transport and vehicles; catering; third-party services; PPE; and miscellaneous (for example payroll, newsletter, travel, HR).
24.8.2.5 Contingency The overall contingency allocation is estimated to total $331 M.
24.8.2.6 Taxation Considerations Local taxes on contractor-supplied materials and installation labour were included in the direct cost estimate. IVA (value added tax) on process equipment, contractor-supplied material and contractors’ profit was not included in the estimates of indirect and direct costs. No escalation was applied.
24.8.2.7 2020 PEA Capital Cost Estimate Summary The total initial capital cost is $2,178 M, as presented in Table 24-16. Over the LOM, the sustaining capital cost is estimated at $443 M. The sustaining capital cost estimate is provided in Table 24-17. Table 24-16: 2020 PEA Initial Capital Cost Estimate (by area)
Area Cost ($ M)
Mine 178 Process plant 448 Tailings and water reclaim 49 Plant infrastructure (on site) 82 Port 147 Port infrastructure (on site) 22 External infrastructure (off site) 143

Santo Domingo Project Region III, Chile
NI 43-101 Technical Report
Page 24-62
March 2020
Project Number: C40029
Acid plant 144 Roast 122 Indirect costs 512 Contingency 331 Total 2,178
Note: Totals may not sum due to rounding.
Table 24-17: 2020 PEA Summary of Sustaining Capital by Year
Description Amount ($M)
Year 0 – H2 99 Year 1 36 Year 2 18 Year 3 22 Year 4 13 Year 5 43 Year 6 6 Year 7 4 Year 8 42 Year 9 47 Year 10 22 Year 11 5 Year 12 24 Year 13 5 Year 14 9 Year 15 34 Year 16 4 Year 17 4 Year 18 4 Total Sustaining Capital 443
Note: Totals may not sum due to rounding.
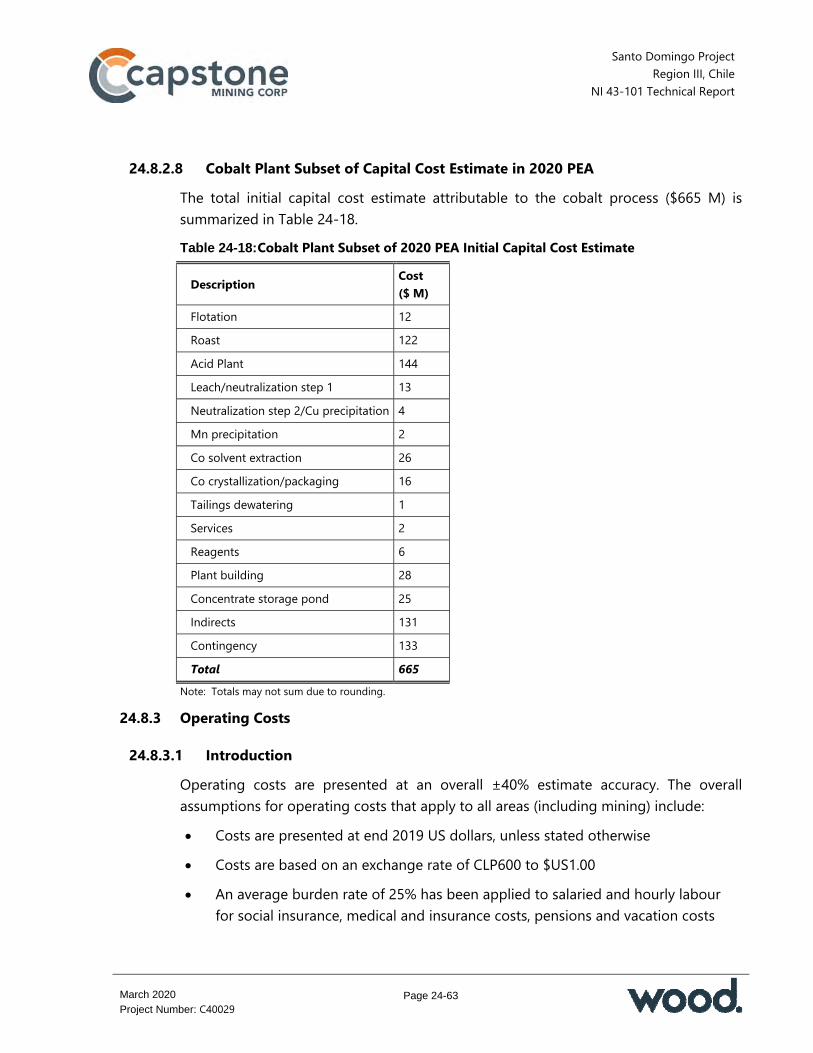
Santo Domingo Project Region III, Chile
NI 43-101 Technical Report
Page 24-63
March 2020
Project Number: C40029
24.8.2.8 Cobalt Plant Subset of Capital Cost Estimate in 2020 PEA The total initial capital cost estimate attributable to the cobalt process ($665 M) is summarized in Table 24-18. Table 24-18: Cobalt Plant Subset of 2020 PEA Initial Capital Cost Estimate
Description Cost ($ M)
Flotation 12 Roast 122 Acid Plant 144 Leach/neutralization step 1 13 Neutralization step 2/Cu precipitation 4 Mn precipitation 2 Co solvent extraction 26 Co crystallization/packaging 16 Tailings dewatering 1 Services 2 Reagents 6 Plant building 28 Concentrate storage pond 25 Indirects 131 Contingency 133 Total 665
Note: Totals may not sum due to rounding.
24.8.3 Operating Costs
24.8.3.1 Introduction Operating costs are presented at an overall ±40% estimate accuracy. The overall assumptions for operating costs that apply to all areas (including mining) include: Costs are presented at end 2019 US dollars, unless stated otherwise Costs are based on an exchange rate of CLP600 to $US1.00 An average burden rate of 25% has been applied to salaried and hourly labour
for social insurance, medical and insurance costs, pensions and vacation costs
Santo Domingo Project Region III, Chile
NI 43-101 Technical Report
Page 24-64
March 2020
Project Number: C40029
The average concentrate grade is 29% for copper and 66% for magnetite For the copper equivalent estimate, average life-of-mine prices of $3.00/lb
copper, $80/t magnetite concentrate and $20/lb cobalt were used. Operating costs for the 2020 PEA assume a maximum throughput of 65,000 t/d
for the first 5 years and 60,000 t/d for subsequent years. 24.8.3.2 Mining Costs
The mining operation is assumed to be Owner-operated. Mine operating cost forecasts are included in Table 24-19.
24.8.3.3 Process Costs The process operating cost forecast is provided in Table 24-20.
24.8.3.4 Labour Shifts with 7 x 7 and 4 x 3 rotations are used for the operations and administration areas respectively, for process, mining and overhead. Labour costs are forecast to total $205 M over the LOM.
24.8.3.5 Power The unit electricity cost is based on power delivered to the nearest electrical substations at the Diego del Almagro (San Lorenzo) substation for the mine site and the Totoralillo substation for the port site. Power costs for the LOM are $654 M. This equates to a power cost of $1.67/t of mill feed material processed.
24.8.3.6 Reagents and Consumables Reagents will include lime, flotation reagents (primary collector, secondary collector and frother), flocculants, sodium hydrosulphide and extractant and diluent for solvent extraction. Reagents are estimated to total $434 M over the LOM. This equates to a LOM average of $1.11/t mill feed material and a LOM average of $0.079/lb CuEq. Steel includes liners and ball requirements for crushers and mills. Steel requirements are estimated to total $508 M over the LOM. This equates to a LOM average of $1.30/t mill feed material and a LOM average of $0.092/lb CuEq.

Santo Domingo Project Region III, Chile
NI 43-101 Technical Report
Page 24-65
March 2020
Project Number: C40029
Table 24-19: 2020 PEA Mine Operating Costs
Item LOM Total
LOM Average ($/t Material Mined)
LOM Average ($/t Treated)
LOM Average ($/lb CuEq)
Labour 607 0.37 1.55 0.11 Maintenance 239 0.15 0.61 0.04 Diesel 1,030 0.63 2.63 0.19 Operating Spares 327 0.20 0.83 0.06 Explosives & Blasting 417 0.26 1.06 0.08 Total 2,620 1.61 6.68 0.48
Note: Costs are presented on a $/t material mined without pre-stripping. Totals may not sum due to rounding.
Table 24-20: 2020 PEA Process Operating Costs
Area LOM Total ($ M)
LOM Average ($/t)
LOM Average ($/lb CuEq)
Process operating/plant 1,747 4.5 0.318 TSF and tailings water reclaim 38 0.1 0.007 Magnetite concentrate transport system 74 0.2 0.013 Desalinated water transfer system* 532 1.4 0.097 Magnetite filtration – port 93 0.2 0.017 Fe and Cu handling, storage and loading 90 0.2 0.016 Co process plant 562 1.4 0.102 Total 3,137 8.0 0.571 Note: * Based on potential BOOT operator quote, plus Capstone management. Totals may not sum due to rounding.
24.8.3.7 Other Costs Other costs include third party contracts for the desalinated water supply, leasing, minor maintenance, operations and/or support contracts and total $821 M. This equates to a LOM average of $2.09/t mill feed material and a LOM average of $0.15/lb CuEq.
24.8.3.8 2020 PEA Operating Cost Estimate Summary The operating cost estimate by area is shown in Table 24-21. The cost of copper concentrate land transport is included in the 2020 PEA economic analysis.

Santo Domingo Project Region III, Chile
NI 43-101 Technical Report
Page 24-66
March 2020
Project Number: C40029
Table 24-21: 2020 PEA Operating Cost Estimate by Area
Area LOM Total ($ M)
LOM Average ($/t)
LOM Average ($/lb CuEq)
Process operating/plant 1,747 4.5 0.318
TSF and tailings water reclaim 38 0.1 0.007
Magnetite concentrate transport system 74 0.2 0.013
Desalinated water transfer system* 532 1.4 0.097
Magnetite filtration – port 93 0.2 0.017
Fe and Cu handling, storage and loading 90 0.2 0.016
Co Process plant 562 1.4 0.102
Total Process 3,137 8.0 0.571
G&A 417 1.1 0.076
Mining 2,620 6.7 0.477
Total 6,173 15.7 1.123
Note: * Based on potential BOOT operator quote, plus Capstone management. Totals may not sum due to rounding.
24.8.3.9 Cobalt Plant Subset of 2020 PEA Operating Cost Estimate The operating cost estimate for the cobalt process is shown in Table 24-22. Table 24-22: Cobalt Plant Subset of 2020 PEA Operating Cost Estimate
Area LOM Total ($ M)
LOM Average ($/t)
Labour 88 0.23 Energy (71) (0.18) Reagents 227 0.58 Water
consumption 80 0.20
Maintenance 225 0.57 Other costs 13 0.03 G&A 14 0.04 Total 576 1.47
Note: Totals may not sum due to rounding.

Santo Domingo Project Region III, Chile
NI 43-101 Technical Report
Page 24-67
March 2020
Project Number: C40029
24.8.4 Comment on Section 24.8
The estimated total initial LOM capital cost for the 2020 PEA is $2,178 M. Of this total, the capital costs associated with the cobalt plant are $665 M. The estimated LOM operating cost estimate for the 2020 PEA is $6,173 M. Of this total, the operating costs associated with the cobalt plant are $576 M.
24.9 2020 PEA Economic Analysis
24.9.1 Caution Statement
The results of the economic analysis to support the 2020 PEA represent forward-looking information that is subject to a number of known and unknown risks, uncertainties and other factors that may cause actual results to differ materially from those presented here. Forward-looking statements in this Report include, but are not limited to, statements with respect to future metal prices and concentrate sales contracts, assumed currency exchange rates, the estimation of Mineral Resources, dilution and recovery assumptions, the timing and amount of estimated future production, costs of production, capital expenditures, costs and timing of the development of mineral zones, estimates as to permitting time lines, requirements for additional capital, government regulation of mining operations, environmental risks, unanticipated reclamation expenses and title disputes. Additional risk can come from actual results of reclamation activities; conclusions of economic evaluations; changes in parameters as mine and process plans continue to be refined, possible variations in ore reserves, grade or recovery rates; geotechnical considerations during mining; failure of plant, equipment or processes to operate as anticipated; shipping delays and regulations; accidents, labour disputes and other risks of the mining industry; and delays in obtaining governmental approvals. Years discussed in this sub-section are presented for illustrative purposes only, as no decision has been made on mine construction by Capstone. The 2020 PEA is preliminary in nature, is based on Mineral Resources that have not been categorized as Mineral Reserves and there is no certainty that the 2020 PEA based on these Mineral Resources will be realized. Mineral Resources are not Mineral Reserves and do not have demonstrated economic viability.

Santo Domingo Project Region III, Chile
NI 43-101 Technical Report
Page 24-68
March 2020
Project Number: C40029
24.9.2 Methodology Used
The 2020 PEA has been evaluated using an 8% DCF analysis on a non-inflated, after tax basis. The 2020 PEA cash flows consist of approximately 3 years of pre-production costs and 18 years of operations. Cash inflows consist of annual revenue projections for the mine. Cash outflows include capital costs, operating costs, royalties and taxes, which are subtracted from the inflows to arrive at the annual cash flow projections. To reflect the time value of money, annual NCF projections are discounted back to the present study valuation date of end 2019 using an 8% discount rate. The discount rate appropriate for the 2020 PEA has been determined using several factors, including the type of commodity and the level of 2020 PEA risks (market risk, technical risk and political risk). The discounted present values of the cash flows are summed to arrive at the 2020 PEA NPV. An NPV sensitivity analysis to discount rates was completed using discount rates of 4%, 6%, 8% (selected rate), 10% and 12%. In addition to the NPV, the IRR and payback period were also calculated. The IRR is defined as the discount rate that results in an NPV equal to zero. Cash flows are assumed to occur on an average mid-year basis of each annual period.
24.9.3 Financial Model Parameters
The financial model is based on the subset of the Mineral Resources in the 2020 PEA mine plan outlined in Table 24-1, the mining rates and assumptions discussed in Section 24.3 and the recovery and processing rates and assumptions discussed in Section 13 and Section 24.4 respectively. The capital and operating costs, economic evaluations and reported results were estimated using the following foreign exchange rates: US dollar: 600 CLP per dollar Euro: 732 per euro UF: 28,338 CLP per UF. 2020 PEA initial capital costs and sustaining capital costs were summarized in Table 24-16 and Table 24-17, respectively. 2020 PEA operating costs were summarized in Table 24-21.
Santo Domingo Project Region III, Chile
NI 43-101 Technical Report
Page 24-69
March 2020
Project Number: C40029
Total and net LOM operating costs, as well as unit costs per tonne of mineralized material treated and per pound of payable copper are summarized in Table 24-23. The C1 cash cost as defined by Wood McKenzie is stated below: “C1 Cash Costs are the costs of mining, milling and concentrating, on-site administration and general expenses, metal concentrate treatment and refining charges and freight and marketing costs less the net value of the by-product credits.”
In the calculation of all-in costs, by-product and co-product credits are included as a credit to operating costs. Both by-product (i.e. secondary metal sales treated as a reduction of cost of sales in the financial statements) and co-product (i.e. secondary metal sales reported as sales in the financial statements) credits are treated as a reduction of all in costs. The terms are defined below: C1 cash cost per pound of payable copper produced (by product basis) = C1 cash
costs: mine, mill, G&A operating costs, plus TC/RCs and selling costs less revenue (excluding copper revenue)
C1 cash cost (co-product basis) - Copper (per pound of payable copper equivalent produced) = C1 cash costs: mine, mill, G&A operating costs, plus TC/RCs and selling costs less revenue (excluding copper, iron and cobalt revenue). Payable copper equivalent production: Payable copper production plus (iron and cobalt revenue divided by the copper price) - this converts the iron and cobalt production into copper equivalent units using the relative dollar values as the conversion factor
C1 cash costs (co-product basis) - Magnetite iron concentrate (per tonne of iron equivalent production) = C1 cash costs: mine, mill, G&A operating costs, plus TC/RCs and selling costs less revenue (excluding copper, iron and cobalt revenue). Iron equivalent production: iron production plus (copper and cobalt revenue divided by the iron price) - this converts the copper and cobalt production into iron equivalent units using the relative dollar values as the conversion factor).
Closure and reclamation costs are estimated at $164 M. Smelting and refining terms considered in the 2020 PEA are summarized in Table 24-24. Life-of-mine copper transport costs are estimated to be $48 M for land freight, $166 M for ocean freight, $3 M for insurance and $11 M for marketing (total $229 M).
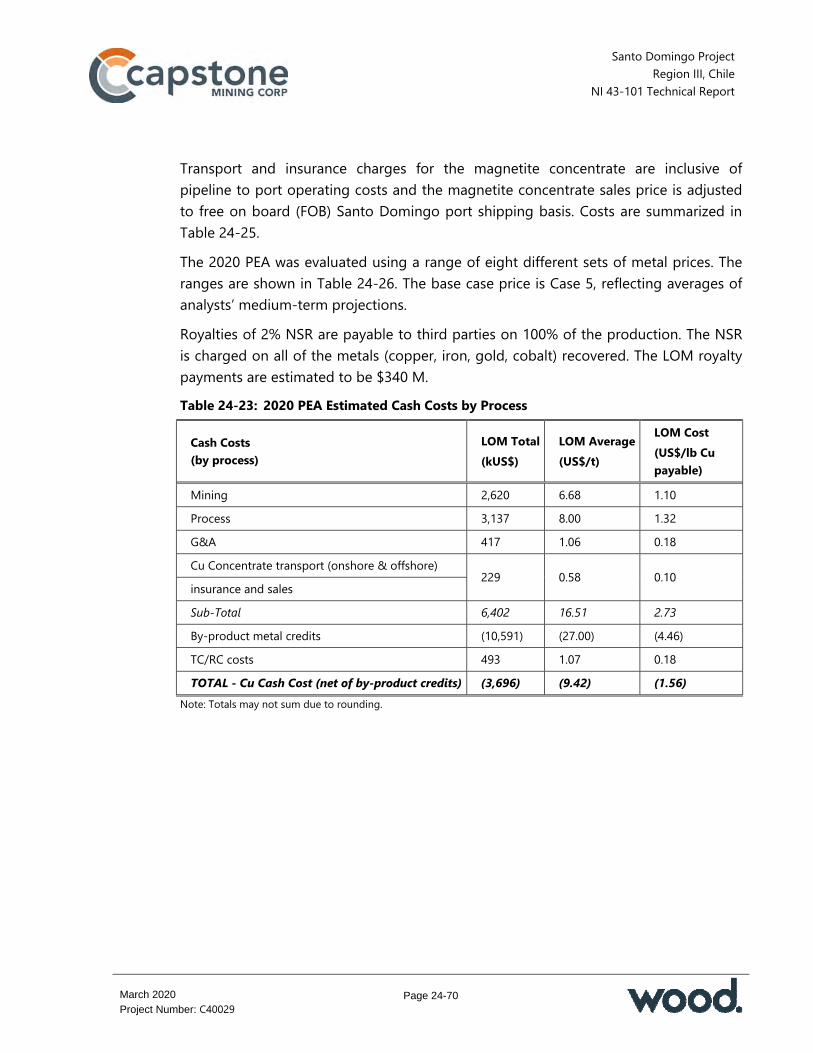
Santo Domingo Project Region III, Chile
NI 43-101 Technical Report
Page 24-70
March 2020
Project Number: C40029
Transport and insurance charges for the magnetite concentrate are inclusive of pipeline to port operating costs and the magnetite concentrate sales price is adjusted to free on board (FOB) Santo Domingo port shipping basis. Costs are summarized in Table 24-25. The 2020 PEA was evaluated using a range of eight different sets of metal prices. The ranges are shown in Table 24-26. The base case price is Case 5, reflecting averages of analysts’ medium-term projections. Royalties of 2% NSR are payable to third parties on 100% of the production. The NSR is charged on all of the metals (copper, iron, gold, cobalt) recovered. The LOM royalty payments are estimated to be $340 M. Table 24-23: 2020 PEA Estimated Cash Costs by Process
Cash Costs (by process)
LOM Total (kUS$)
LOM Average (US$/t)
LOM Cost (US$/lb Cu payable)
Mining 2,620 6.68 1.10 Process 3,137 8.00 1.32 G&A 417 1.06 0.18 Cu Concentrate transport (onshore & offshore)
229 0.58 0.10 insurance and sales Sub-Total 6,402 16.51 2.73
By-product metal credits (10,591) (27.00) (4.46) TC/RC costs 493 1.07 0.18 TOTAL - Cu Cash Cost (net of by-product credits) (3,696) (9.42) (1.56)
Note: Totals may not sum due to rounding.
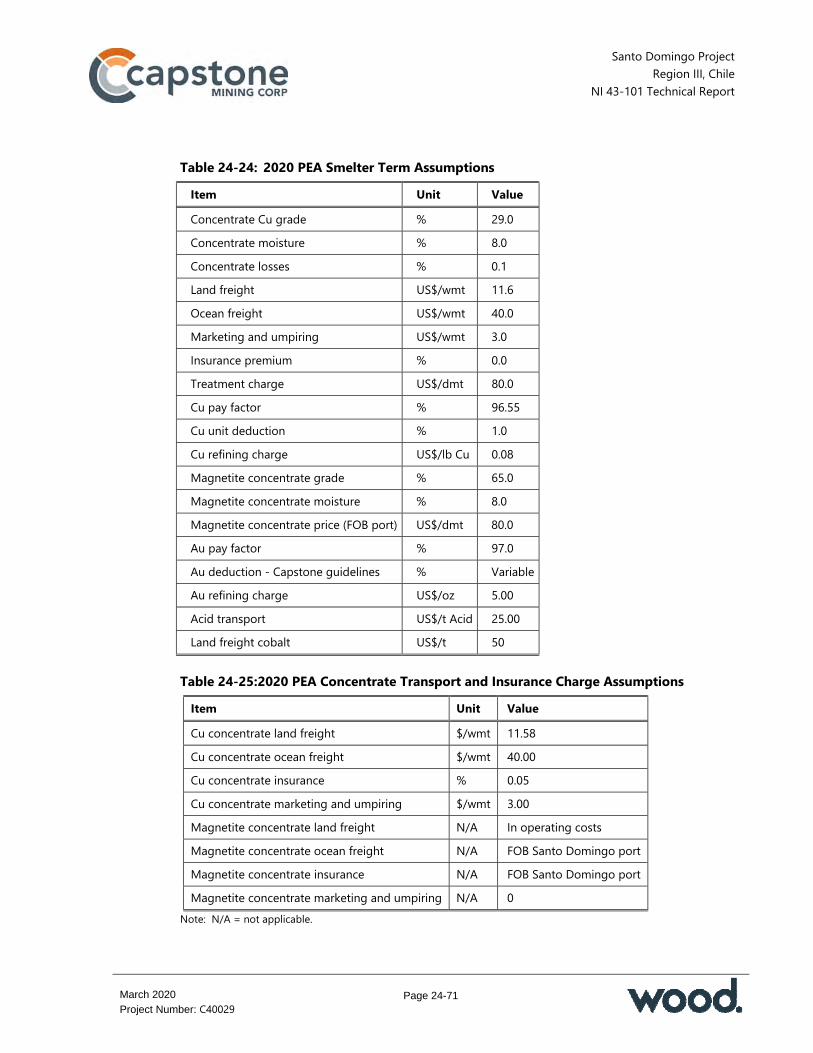
Santo Domingo Project Region III, Chile
NI 43-101 Technical Report
Page 24-71
March 2020
Project Number: C40029
Table 24-24: 2020 PEA Smelter Term Assumptions Item Unit Value Concentrate Cu grade % 29.0 Concentrate moisture % 8.0 Concentrate losses % 0.1 Land freight US$/wmt 11.6 Ocean freight US$/wmt 40.0 Marketing and umpiring US$/wmt 3.0 Insurance premium % 0.0 Treatment charge US$/dmt 80.0 Cu pay factor % 96.55 Cu unit deduction % 1.0 Cu refining charge US$/lb Cu 0.08 Magnetite concentrate grade % 65.0 Magnetite concentrate moisture % 8.0 Magnetite concentrate price (FOB port) US$/dmt 80.0 Au pay factor % 97.0 Au deduction - Capstone guidelines % Variable Au refining charge US$/oz 5.00 Acid transport US$/t Acid 25.00 Land freight cobalt US$/t 50
Table 24-25: 2020 PEA Concentrate Transport and Insurance Charge Assumptions Item Unit Value Cu concentrate land freight $/wmt 11.58 Cu concentrate ocean freight $/wmt 40.00 Cu concentrate insurance % 0.05 Cu concentrate marketing and umpiring $/wmt 3.00 Magnetite concentrate land freight N/A In operating costs Magnetite concentrate ocean freight N/A FOB Santo Domingo port Magnetite concentrate insurance N/A FOB Santo Domingo port Magnetite concentrate marketing and umpiring N/A 0
Note: N/A = not applicable.

Santo Domingo Project Region III, Chile
NI 43-101 Technical Report
Page 24-72
March 2020
Project Number: C40029
Table 24-26: 2020 PEA Metal Price Assumptions Pay Metals Unit 1 2 3 4 5 6 7 8 Copper price US$/lb 1.80 2.10 2.40 2.70 3.00 3.30 3.60 3.90 Gold price US$/oz 768 896 1,024 1,152 1,280 1,408 1,536 1,664 Iron price US$/t 48 56 64 72 80 88 96 104 Cobalt US$/lb 12 14 16 18 20 22 24 26
Note: Base case is highlighted
Working capital assumptions are that there will be the equivalent of three months of operating costs available. Working capital is $26 M in the first year of operation and a LOM maximum of $62 M (on a previous year’s cumulative basis) in Year 2 and in Year 18. The economic analysis assumes that no inflationary adjustments are made. Capital and operating costs are based on end-2019 US dollars. Possible salvage values for the mine, plant and port were not considered, due to the approximately 18-year mine life. At closure, sale of assets may present an opportunity to offset a portion of the closure and reclamation costs.
24.9.4 Taxation Considerations
The 2020 PEA was evaluated on an after-tax basis with taxes payable in four forms: Government royalty or specific mining tax Corporate income tax VAT (IVA) Tax Modernization Law. The government mining royalty is a tax on operating mine income levied on a sliding scale between 5% and 14%, depending on operating margins. The royalty is estimated to be $500 M over the LOM and is deductible as an expense against corporate income tax. The corporate income tax consists of the FCT at 27%. Total FCT payments over the LOM are estimated to be $1,909 M. The Second Category or “Additional” Tax was not evaluated for the purposes of the 2020 PEA. This Second Category Tax is levied on dividend distributions to foreign shareholders.

Santo Domingo Project Region III, Chile
NI 43-101 Technical Report
Page 24-73
March 2020
Project Number: C40029
IVA of 19% is applicable to a number of goods and services purchased; however, this tax is refundable once the mine is in operation. Other than the delay in the recovery of IVA charged during construction and the impact of the time value of money, the LOM net effect of IVA is zero. The Tax Modernization Law (TML) enacted in February 2020 was evaluated. The primary impact of the TML is the introduction of a new regional tax of 1% on investment projects in each region that exceed US$$10 million. The regional contribution must be paid by projects whose environmental permitting process started after 24 February 2020 (this could be the case for the cobalt circuit addition). The impact of this tax was analyzed and is not significant within the overall accuracy of the estimate. Because this tax was enacted after the financial model was completed it is not included in the model. The 2020 PEA evaluation was prepared on an all equity funded basis. There may be opportunities to use debt capital to fund the 2020 PEA and improve the equity return, but this will require planning to consider Chilean thin capitalization requirements, stamp duties and withholding taxes on interest. Capstone has signed a D.L. 600 Foreign Investment Contract to contribute the capital investment. The D.L. 600 Contract provides the ability to elect tax invariability treatment.
24.9.5 Financing Considerations
Wood’s economic analysis of the 2020 PEA is based on 100% owner equity financing. The reason for using the alternative approach of debt capital to fund the proposed operation is that a project with a discount rate higher than the cost of borrowing tends to show increasingly improved results as more leverage is applied and more of the risk is transferred to a third party such as a bank.
24.9.6 Results of the Economic Analysis
The economic analysis is based on a real basis (no inflation). On an after-tax basis, the cumulative net cash flow is $5,286 M, the IRR is 23% and the payback period is 3.5 years. Based on the assumptions discussed in the 2020 PEA, the cash flow analysis shows that the 2020 PEA will generate positive cash flows from the first full year of production onwards. The cash flow analysis is provided in Table 24-27.Error! Reference source not found.

Santo Domingo Project Region III, Chile
NI 43-101 Technical Report
Page 24-74
March 2020
Project Number: C40029
Cash costs are summarized in Table 24-28 and Table 24-30 for the first 5 years of the 2020 PEA mine plan and in Table 24-29 and Table 24-31 for the LOM. On a by-product basis, the gold, iron, cobalt and acid sulphuric credits offset operating costs over the LOM, resulting in a C1 cash cost of almost zero during the first 5 years and negative equivalent costs over LOM (i.e. -$1.56/lb). On the co-product basis, the gold and sulphuric acid credits result in a copper LOM C1 cash cost of $1.02/lb Cu equivalent and an iron C1 cash cost of about $27.10/dmt The cash flow summary in Table 24-32 provides a breakdown of the LOM cash flow that results in an undiscounted margin of $3.24/lb payable copper after application of all costs other than taxes. Table 24-33 provides the cash flow forecast on an annualized basis. Table 24-27: 2020 PEA Economic Analysis Forecast
Cash Flow Summary Unit Pre-tax After-tax
Cumulative net cash flow undiscounted net present value US$ M 7,695 5,286
Discounted at 4% US$ M 4,396 2,956 Discounted at 6% US$ M 3,349 2,214 Discounted at 8% US$ M 2,558 1,652 Discounted at 10% US$ M 1,953 1,222 Discounted at 12% US$ M 1,486 890 Internal rate of return % 28.1 23.0 Payback period Years 3.2 3.5
Note: Base case is highlighted

Santo Domingo Project Region III, Chile
NI 43-101 Technical Report
Page 24-75
March 2020
Project Number: C40029
Figure 24-12: 2020 PEA After Tax Cash Flow
Note: Figure prepared by Wood, 2020
Table 24-28: Summary of 2020 PEA First 5 Years Cash Costs Forecast, By-Product Basis
Cash Costs Years 1–5 (Excludes Year 0) ($ M)
Cost Per Tonne Milled ($/t)
Cost per Pound Cu Payable ($/lb)
Costs Mining 781 6.60 0.61 Process 862 7.29 0.68 G&A 117 0.99 0.09 Smelter deductions Treatment charges 163 1.38 0.13 Refining charges 101 0.86 0.08 Concentrate transport 123 1.04 0.10 Sub-total 2,148 18.16 1.69
Credits Au (221) (1.87) (0.17) Fe (1,303) (11.02) (1.03) Co (457) (3.87) (0.36) H2SO4 (185) (1.57) (0.15) Sub-total (2,166) (18.32) (1.71)
Adjusted Cash Costs Total (19) (0.16) (0.01) Note: Totals may not sum due to rounding
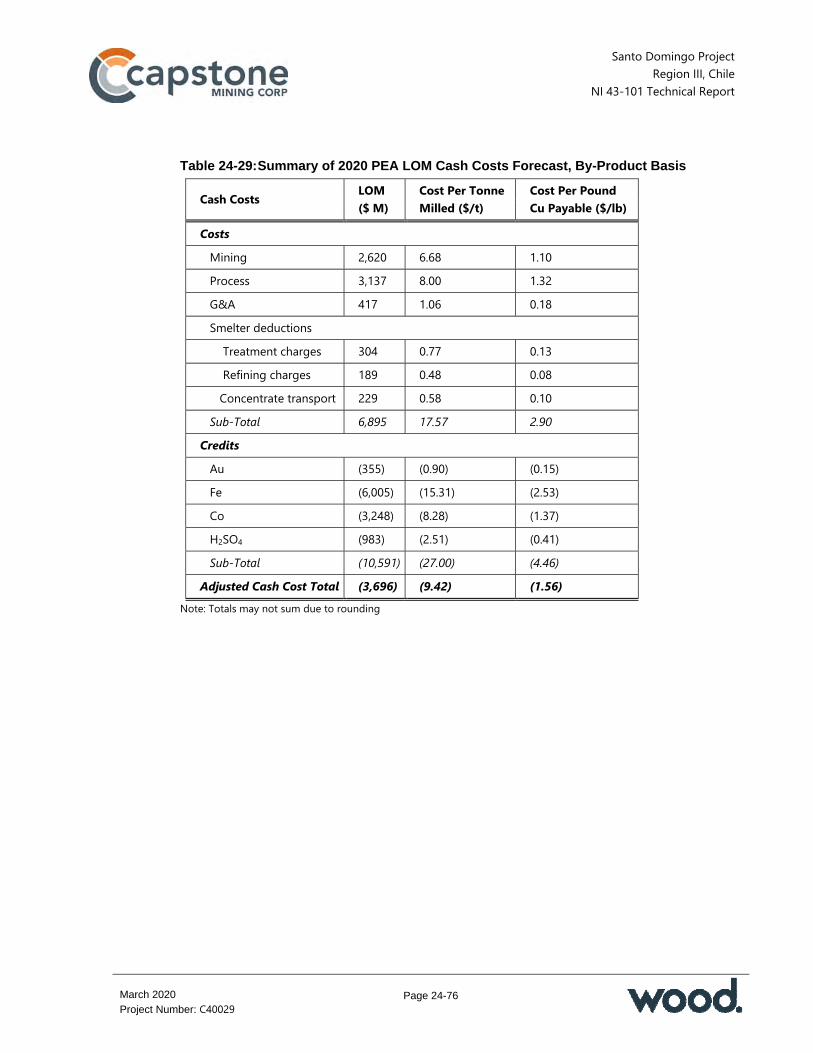
Santo Domingo Project Region III, Chile
NI 43-101 Technical Report
Page 24-76
March 2020
Project Number: C40029
Table 24-29: Summary of 2020 PEA LOM Cash Costs Forecast, By-Product Basis
Cash Costs LOM ($ M)
Cost Per Tonne Milled ($/t)
Cost Per Pound Cu Payable ($/lb)
Costs Mining 2,620 6.68 1.10 Process 3,137 8.00 1.32 G&A 417 1.06 0.18 Smelter deductions Treatment charges 304 0.77 0.13 Refining charges 189 0.48 0.08 Concentrate transport 229 0.58 0.10 Sub-Total 6,895 17.57 2.90
Credits Au (355) (0.90) (0.15) Fe (6,005) (15.31) (2.53) Co (3,248) (8.28) (1.37) H2SO4 (983) (2.51) (0.41) Sub-Total (10,591) (27.00) (4.46)
Adjusted Cash Cost Total (3,696) (9.42) (1.56) Note: Totals may not sum due to rounding

Santo Domingo Project Region III, Chile
NI 43-101 Technical Report
Page 24-77
March 2020
Project Number: C40029
Table 24-30: Summary of 2020 PEA First 5 Years Cash Costs Forecast, Co-Product Basis
Cash Costs Years 1–5 (Excludes Year 0) ($ M)
Cost Per Tonne Milled (US$/t)
Cost Per Pound Cu Payable (US$/lb equivalent)
Costs
Mining 781 6.60 0.40 Process 862 7.29 0.45 G&A 117 0.99 0.06 Treatment charges Refining charges 101 0.86 0.05 Concentrate transport 123 1.04 0.06 Sub-total 2,148 18.16 1.11 Credits
Au (221) (1.87) (0.11) Fe Co H2SO4 (185) (1.57) (0.10) Sub-total (406) (3.43) (0.21) Adjusted Cash Costs Total 1,742 14.73 0.90
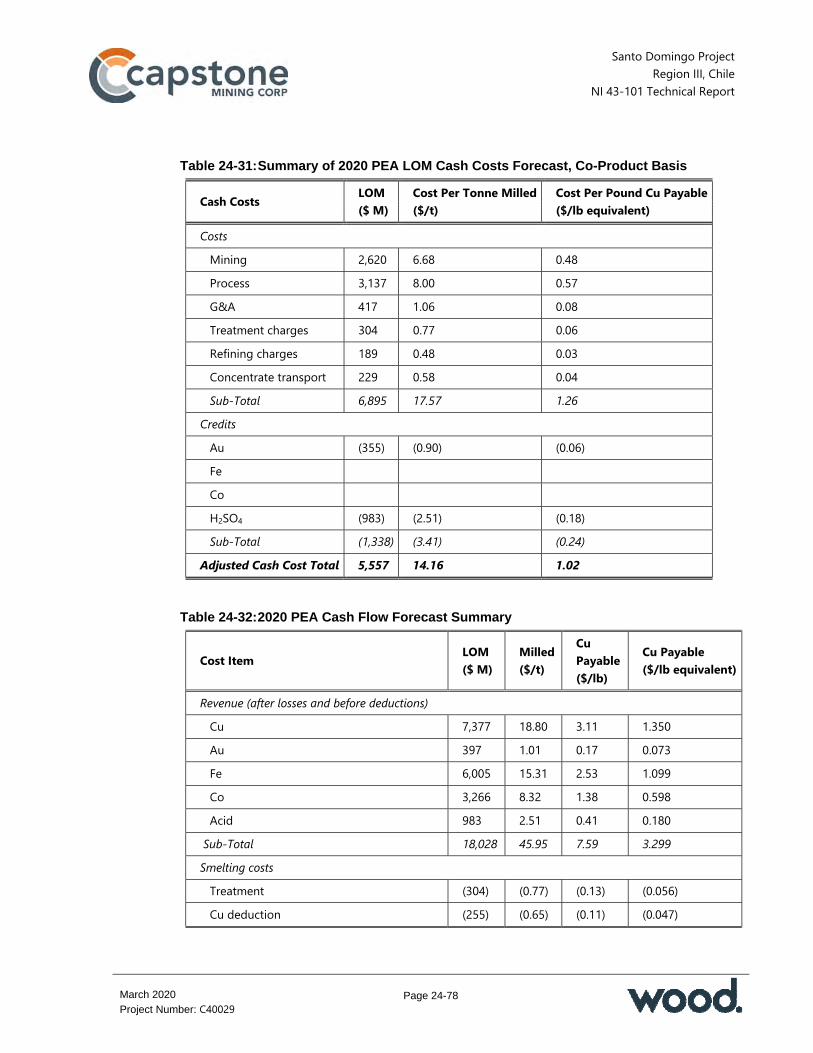
Santo Domingo Project Region III, Chile
NI 43-101 Technical Report
Page 24-78
March 2020
Project Number: C40029
Table 24-31: Summary of 2020 PEA LOM Cash Costs Forecast, Co-Product Basis
Cash Costs LOM ($ M)
Cost Per Tonne Milled ($/t)
Cost Per Pound Cu Payable ($/lb equivalent)
Costs
Mining 2,620 6.68 0.48 Process 3,137 8.00 0.57 G&A 417 1.06 0.08 Treatment charges 304 0.77 0.06 Refining charges 189 0.48 0.03 Concentrate transport 229 0.58 0.04 Sub-Total 6,895 17.57 1.26
Credits
Au (355) (0.90) (0.06) Fe Co H2SO4 (983) (2.51) (0.18) Sub-Total (1,338) (3.41) (0.24)
Adjusted Cash Cost Total 5,557 14.16 1.02
Table 24-32: 2020 PEA Cash Flow Forecast Summary
Cost Item LOM ($ M)
Milled ($/t)
Cu Payable ($/lb)
Cu Payable ($/lb equivalent)
Revenue (after losses and before deductions)
Cu 7,377 18.80 3.11 1.350 Au 397 1.01 0.17 0.073 Fe 6,005 15.31 2.53 1.099 Co 3,266 8.32 1.38 0.598 Acid 983 2.51 0.41 0.180 Sub-Total 18,028 45.95 7.59 3.299
Smelting costs
Treatment (304) (0.77) (0.13) (0.056) Cu deduction (255) (0.65) (0.11) (0.047)
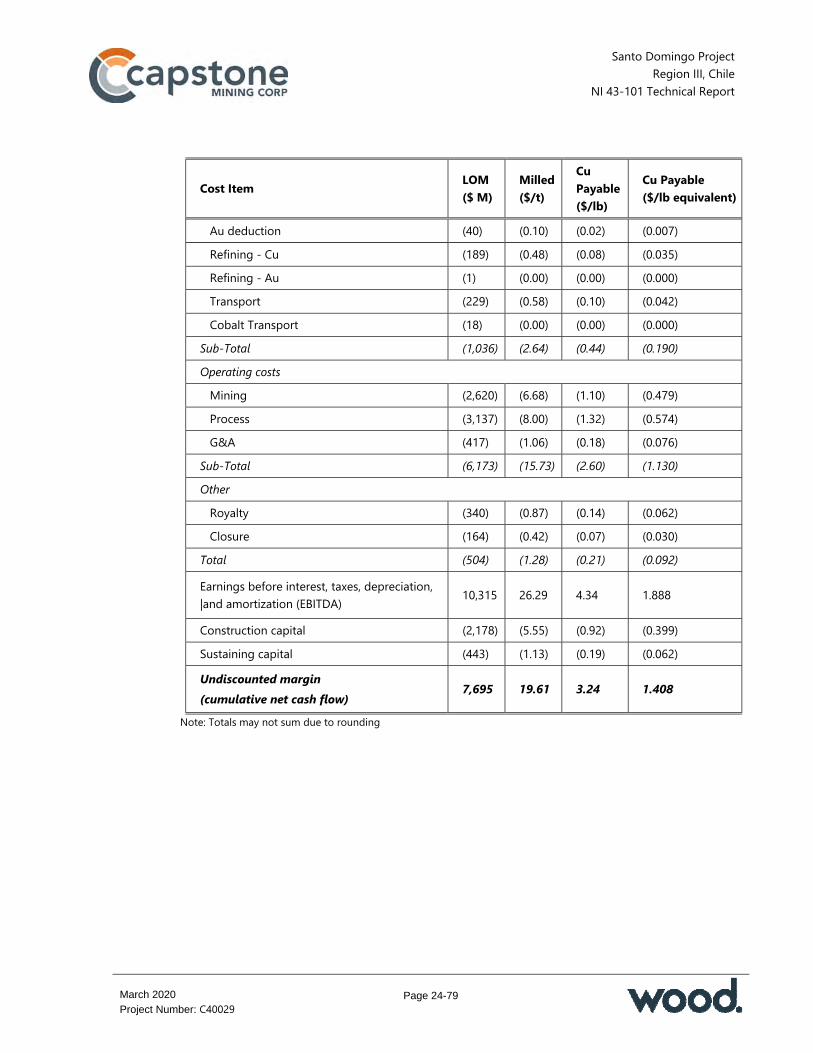
Santo Domingo Project Region III, Chile
NI 43-101 Technical Report
Page 24-79
March 2020
Project Number: C40029
Cost Item LOM ($ M)
Milled ($/t)
Cu Payable ($/lb)
Cu Payable ($/lb equivalent)
Au deduction (40) (0.10) (0.02) (0.007) Refining - Cu (189) (0.48) (0.08) (0.035) Refining - Au (1) (0.00) (0.00) (0.000) Transport (229) (0.58) (0.10) (0.042) Cobalt Transport (18) (0.00) (0.00) (0.000) Sub-Total (1,036) (2.64) (0.44) (0.190)
Operating costs
Mining (2,620) (6.68) (1.10) (0.479) Process (3,137) (8.00) (1.32) (0.574) G&A (417) (1.06) (0.18) (0.076) Sub-Total (6,173) (15.73) (2.60) (1.130)
Other
Royalty (340) (0.87) (0.14) (0.062) Closure (164) (0.42) (0.07) (0.030) Total (504) (1.28) (0.21) (0.092)
Earnings before interest, taxes, depreciation, |and amortization (EBITDA) 10,315 26.29 4.34 1.888
Construction capital (2,178) (5.55) (0.92) (0.399) Sustaining capital (443) (1.13) (0.19) (0.062) Undiscounted margin (cumulative net cash flow)
7,695 19.61 3.24 1.408
Note: Totals may not sum due to rounding
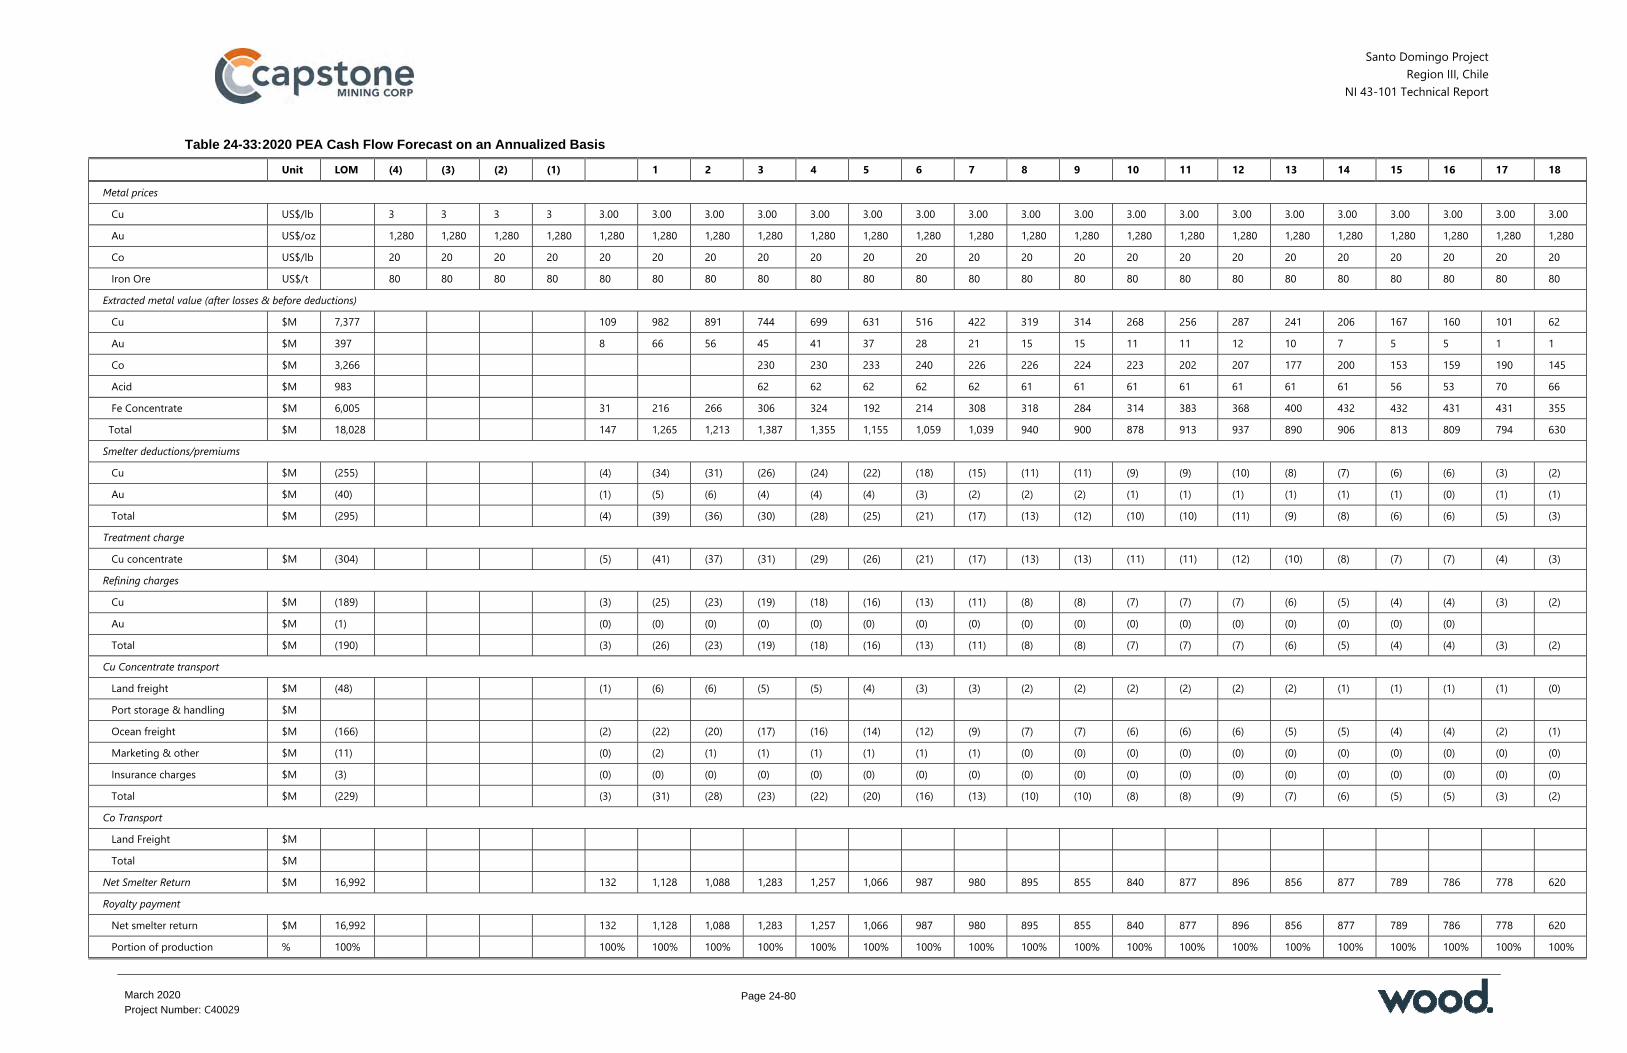
Santo Domingo Project Region III, Chile
NI 43-101 Technical Report
Page 24-80
March 2020
Project Number: C40029
Table 24-33: 2020 PEA Cash Flow Forecast on an Annualized Basis
Unit LOM (4) (3) (2) (1) 1 2 3 4 5 6 7 8 9 10 11 12 13 14 15 16 17 18 Metal prices
Cu US$/lb 3 3 3 3 3.00 3.00 3.00 3.00 3.00 3.00 3.00 3.00 3.00 3.00 3.00 3.00 3.00 3.00 3.00 3.00 3.00 3.00 3.00 Au US$/oz 1,280 1,280 1,280 1,280 1,280 1,280 1,280 1,280 1,280 1,280 1,280 1,280 1,280 1,280 1,280 1,280 1,280 1,280 1,280 1,280 1,280 1,280 1,280 Co US$/lb 20 20 20 20 20 20 20 20 20 20 20 20 20 20 20 20 20 20 20 20 20 20 20 Iron Ore US$/t 80 80 80 80 80 80 80 80 80 80 80 80 80 80 80 80 80 80 80 80 80 80 80 Extracted metal value (after losses & before deductions)
Cu $M 7,377 109 982 891 744 699 631 516 422 319 314 268 256 287 241 206 167 160 101 62 Au $M 397 8 66 56 45 41 37 28 21 15 15 11 11 12 10 7 5 5 1 1 Co $M 3,266 230 230 233 240 226 226 224 223 202 207 177 200 153 159 190 145 Acid $M 983 62 62 62 62 62 61 61 61 61 61 61 61 56 53 70 66 Fe Concentrate $M 6,005 31 216 266 306 324 192 214 308 318 284 314 383 368 400 432 432 431 431 355 Total $M 18,028 147 1,265 1,213 1,387 1,355 1,155 1,059 1,039 940 900 878 913 937 890 906 813 809 794 630 Smelter deductions/premiums
Cu $M (255) (4) (34) (31) (26) (24) (22) (18) (15) (11) (11) (9) (9) (10) (8) (7) (6) (6) (3) (2) Au $M (40) (1) (5) (6) (4) (4) (4) (3) (2) (2) (2) (1) (1) (1) (1) (1) (1) (0) (1) (1) Total $M (295) (4) (39) (36) (30) (28) (25) (21) (17) (13) (12) (10) (10) (11) (9) (8) (6) (6) (5) (3) Treatment charge
Cu concentrate $M (304) (5) (41) (37) (31) (29) (26) (21) (17) (13) (13) (11) (11) (12) (10) (8) (7) (7) (4) (3) Refining charges
Cu $M (189) (3) (25) (23) (19) (18) (16) (13) (11) (8) (8) (7) (7) (7) (6) (5) (4) (4) (3) (2) Au $M (1) (0) (0) (0) (0) (0) (0) (0) (0) (0) (0) (0) (0) (0) (0) (0) (0) (0) Total $M (190) (3) (26) (23) (19) (18) (16) (13) (11) (8) (8) (7) (7) (7) (6) (5) (4) (4) (3) (2) Cu Concentrate transport
Land freight $M (48) (1) (6) (6) (5) (5) (4) (3) (3) (2) (2) (2) (2) (2) (2) (1) (1) (1) (1) (0) Port storage & handling $M Ocean freight $M (166) (2) (22) (20) (17) (16) (14) (12) (9) (7) (7) (6) (6) (6) (5) (5) (4) (4) (2) (1) Marketing & other $M (11) (0) (2) (1) (1) (1) (1) (1) (1) (0) (0) (0) (0) (0) (0) (0) (0) (0) (0) (0) Insurance charges $M (3) (0) (0) (0) (0) (0) (0) (0) (0) (0) (0) (0) (0) (0) (0) (0) (0) (0) (0) (0) Total $M (229) (3) (31) (28) (23) (22) (20) (16) (13) (10) (10) (8) (8) (9) (7) (6) (5) (5) (3) (2) Co Transport
Land Freight $M Total $M Net Smelter Return $M 16,992 132 1,128 1,088 1,283 1,257 1,066 987 980 895 855 840 877 896 856 877 789 786 778 620 Royalty payment Net smelter return $M 16,992 132 1,128 1,088 1,283 1,257 1,066 987 980 895 855 840 877 896 856 877 789 786 778 620 Portion of production % 100% 100% 100% 100% 100% 100% 100% 100% 100% 100% 100% 100% 100% 100% 100% 100% 100% 100% 100% 100%

Santo Domingo Project Region III, Chile
NI 43-101 Technical Report
Page 24-81
March 2020
Project Number: C40029
Unit LOM (4) (3) (2) (1) 1 2 3 4 5 6 7 8 9 10 11 12 13 14 15 16 17 18 Royalty percentage of NSR % 2.00% 2.00% 2.00% 2.00% 2.00% 2.00% 2.00% 2.00% 2.00% 2.00% 2.00% 2.00% 2.00% 2.00% 2.00% 2.00% 2.00% 2.00% 2.00% 2.00% Applied royalty $M (340) (3) (23) (22) (26) (25) (21) (20) (20) (18) (17) (17) (18) (18) (17) (18) (16) (16) (16) (12) Production costs
Mining $M (2,620) (60) (145) (149) (166) (165) (157) (139) (142) (156) (165) (159) (161) (160) (138) (146) (139) (130) (80) (63) Process $M (3,137) (25) (149) (152) (187) (187) (188) (178) (179) (180) (179) (179) (181) (179) (179) (180) (168) (156) (178) (135) Tailings $M G&A $M (417) (14) (24) (22) (23) (23) (23) (23) (23) (23) (23) (23) (23) (23) (22) (22) (22) (22) (22) (14) Total $M (6,173) (99) (318) (324) (376) (375) (368) (341) (344) (359) (367) (360) (364) (362) (340) (349) (329) (308) (279) (212) Closure and salvage
Closure costs $M (114) (114) Closure costs Cobalt Plant $M (50) (50) Salvage value - mine $M Salvage value - crusher $M Total $M (164) (164) Earnings
Earnings before taxes. depreciation & amortization $M 10,315 30 788 743 881 857 677 627 616 518 471 463 496 517 499 511 444 462 483 231
Taxation
Operation incomes and expenses $M 10,819 33 810 764 907 882 698 647 636 536 488 480 514 535 516 528 460 478 499 408 Royalty payment $M (340) (3) (23) (22) (26) (25) (21) (20) (20) (18) (17) (17) (18) (18) (17) (18) (16) (16) (16) (12) Start-up expenses (corporate tax) $M (133) (133) Tax loss $M (1,388) (700) (481) (207) Tax depreciation for the First Category Income Tax $M (2,611) (596) (535) (438) (268) (272) (231) (38) (32) (21) (43) (38) (14) (13) (13) (11) (21) (19) (5) (3)
Mine closure $M (164) (27) (27) (27) (27) (27) (27) Mining royalty (specific tax for mining) $M (500) (34) (30) (35) (33) (20) (20) (21) (15) (19) (20) (23) (32) (32) (33) (29) (33) (38) (33)
Taxable income $M 5,683 (700) (481) (207) 371 552 426 569 564 482 410 405 459 445 427 439 366 383 413 359 First Category Income Tax $M 1,909 100 149 115 154 152 130 111 109 124 120 115 119 99 104 112 97 Tax depreciation for the First Category Income Tax $M 2,611 596 535 438 268 272 231 38 32 21 43 38 14 13 13 11 21 19 5 3
Regular tax depreciation $M (2,582) (179) (184) (186) (258) (260) (265) (252) (223) (224) (123) (108) (108) (50) (43) (40) (27) (21) (18) (11) Start-up expenses (corporate tax) $M 133 133 Start-up expenses (specific tax for mining) $M (133) (22) (22) (22) (22) (22) (22)
Royalty payment (2% NSR) $M 340 3 23 22 26 25 21 20 20 18 17 17 18 18 17 18 16 16 16 12 Tax loss $M 1,388 700 481 207 Mine closure $M 164 27 27 27 27 27 27
Taxable base for the mining $M 7,604 (168) 570 526 591 567 391 375 391 297 346 351 383 453 442 455 404 425 443 363

Santo Domingo Project Region III, Chile
NI 43-101 Technical Report
Page 24-82
March 2020
Project Number: C40029
Unit LOM (4) (3) (2) (1) 1 2 3 4 5 6 7 8 9 10 11 12 13 14 15 16 17 18 royalty (specific tax for mining) Tax rate for the mining royalty (specific tax for mining) 6.57% 0.00% 0.00% 0.00% 0.00% 5.96% 5.78% 5.91% 5.83% 5.08% 5.21% 5.39% 5.00% 5.55% 5.74% 5.94% 6.96% 7.20% 7.29% 7.21% 7.70% 8.58% 9.22%
Mining royalty (specific tax for mining) $M 500 34 30 35 33 20 20 21 15 19 20 23 32 32 33 29 33 38 33
Tax amount $M (2,409) (34) (30) (135) (182) (135) (173) (173) (145) (130) (130) (147) (152) (147) (152) (128) (136) (150) (130) Interim payment of absorbed earnings
Value Added Tax (VAT/IVA)
Payment value added tax purchase (IVA) (Capex) $M (279) (0) (14) (80) (112) (47) (27)
Payment value added tax costs (IVA) $M (1,221) (19) (73) (72) (78) (77) (75) (68) (67) (67) (69) (67) (67) (67) (63) (63) (59) (56) (50) (66)
Remanente IVA CF $M (0) Recuperation IVA 1,500 14 80 131 120 99 78 77 75 68 67 67 69 67 67 67 63 63 59 56 50 66
Payment Value Added IVA (1,500) (0) (14) (80) (131) (120) (99) (78) (77) (75) (68) (67) (67) (69) (67) (67) (67) (63) (63) (59) (56) (50) (66)
Capital expenditure
Construction $M (2,178) (15) (171) (625) (767) (378) (222) Sustaining $M (443) (99) (36) (18) (22) (13) (43) (6) (4) (42) (47) (22) (4) (24) (5) (9) (34) (4) (4) (4) Debt drawdown $M Debt principal repayment $M Working capital $M (26) (62) (1) (12) 1 2 8 (0) (3) (2) 2 (1) 0 6 (2) 5 5 8 71 Construction. sustaining & working capital $M (2,620) (15) (171) (625) (891) (476) (241) (34) (12) (41) 1 (4) (45) (49) (20) (5) (24) 0 (11) (29) 1 4 67
Net project cash flow
Pre-tax $M 7,695 (15) (171) (625) (861) 312 502 847 845 636 628 612 473 422 443 491 493 500 500 415 464 487 298 After tax $M 5,286 (15) (171) (625) (861) 278 472 712 663 501 455 439 328 292 313 344 341 353 348 287 327 337 167 Payback
Pre-tax cumulative net cash flow $M (15) (186) (811) (1,672) (1,360) (858) (11) 834 1,470 2,098 2,710 3,184 3,606 4,049 4,540 5,032 5,532 6,032 6,447 6,910 7,397 7,695
Pre-tax payback Years 3.2 0 1 1 1 0 After tax cumulative net cash flow $M (15) (186) (811) (1,672) (1,394) (923) (210) 452 954 1,409 1,847 2,176 2,468 2,782 3,126 3,467 3,819 4,167 4,454 4,781 5,119 5,286
After tax payback Years 3.5 0 1 1 1 0
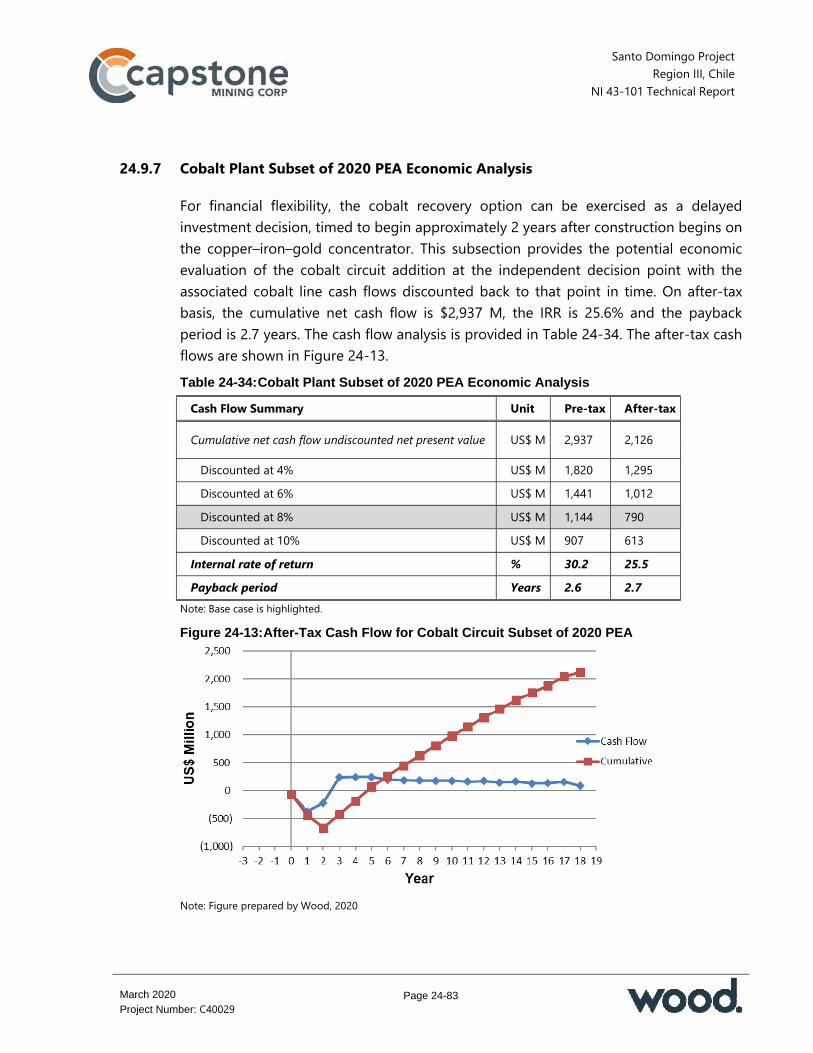
Santo Domingo Project Region III, Chile
NI 43-101 Technical Report
Page 24-83
March 2020
Project Number: C40029
24.9.7 Cobalt Plant Subset of 2020 PEA Economic Analysis
For financial flexibility, the cobalt recovery option can be exercised as a delayed investment decision, timed to begin approximately 2 years after construction begins on the copper–iron–gold concentrator. This subsection provides the potential economic evaluation of the cobalt circuit addition at the independent decision point with the associated cobalt line cash flows discounted back to that point in time. On after-tax basis, the cumulative net cash flow is $2,937 M, the IRR is 25.6% and the payback period is 2.7 years. The cash flow analysis is provided in Table 24-34. The after-tax cash flows are shown in Figure 24-13. Table 24-34: Cobalt Plant Subset of 2020 PEA Economic Analysis
Cash Flow Summary Unit Pre-tax After-tax
Cumulative net cash flow undiscounted net present value US$ M 2,937 2,126
Discounted at 4% US$ M 1,820 1,295 Discounted at 6% US$ M 1,441 1,012 Discounted at 8% US$ M 1,144 790 Discounted at 10% US$ M 907 613 Internal rate of return % 30.2 25.5 Payback period Years 2.6 2.7
Note: Base case is highlighted.
Figure 24-13: After-Tax Cash Flow for Cobalt Circuit Subset of 2020 PEA
Note: Figure prepared by Wood, 2020

Santo Domingo Project Region III, Chile
NI 43-101 Technical Report
Page 24-84
March 2020
Project Number: C40029
24.9.8 Sensitivity Analysis A sensitivity analysis was performed on the 2020 PEA financial model taking into account variations in: Metal price (copper, iron, gold and cobalt) Operating costs (including power) Capital costs Exchange rates.
Figure 24-14 shows the sensitivity of the IRR and Figure 24-15 shows the sensitivity of the NPV8% to the variations imposed in the parameters listed above. Sensitivities to copper and iron grades are not shown, because changes in copper and iron grades are mirrored by the sensitivities to changes in the copper and iron prices, respectively. The analysis shows that the 2020 PEA NPV8% is most sensitive to changes in the copper price (copper grade) and in total operating and capital expenditures. The sensitivity analysis showed that the 2020 PEA is less sensitive to changes in the iron price (iron grade) and the dollar/peso exchange rate and least sensitive to changes in power costs. Because the 2020 PEA is priced in US dollars, the effects of exchange rate variation other than the CLP do not apply in the current model, although in reality some equipment, supplies and services may be priced in other currencies such as Euro. Figure 24-14: 2020 PEA After-Tax Sensitivity of IRR
Note: Figure prepared by Wood, 2020
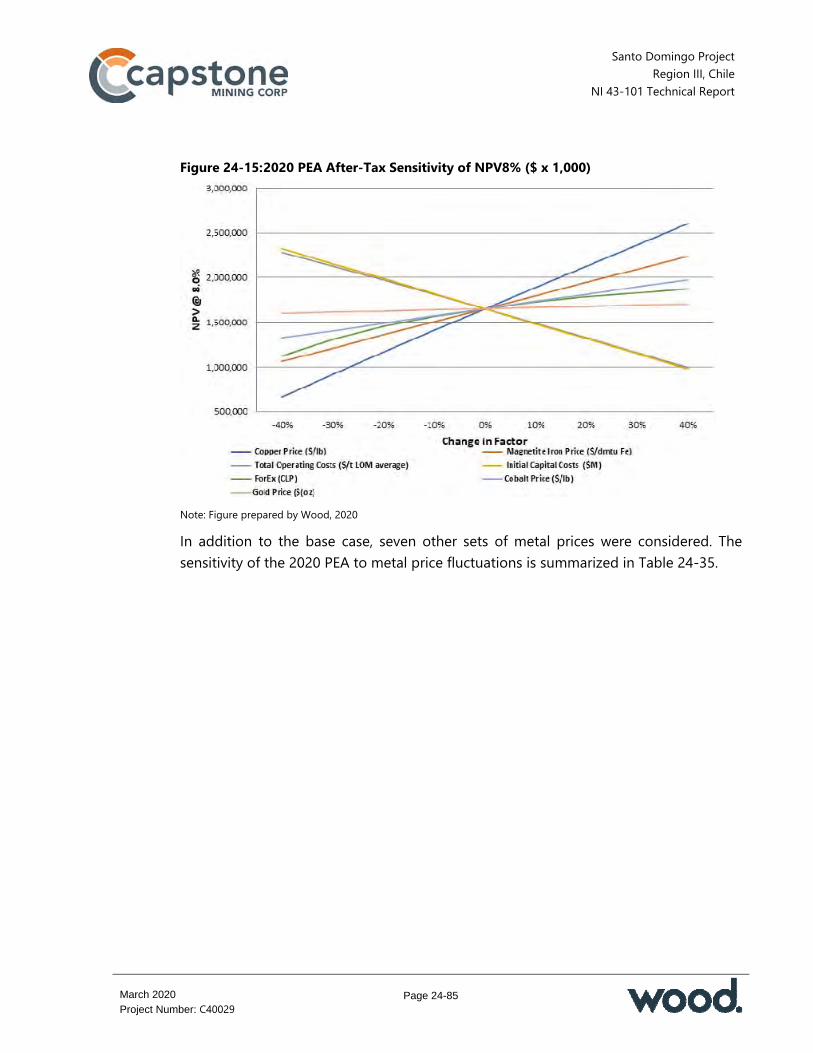
Santo Domingo Project Region III, Chile
NI 43-101 Technical Report
Page 24-85
March 2020
Project Number: C40029
Figure 24-15: 2020 PEA After-Tax Sensitivity of NPV8% ($ x 1,000)
Note: Figure prepared by Wood, 2020
In addition to the base case, seven other sets of metal prices were considered. The sensitivity of the 2020 PEA to metal price fluctuations is summarized in Table 24-35.
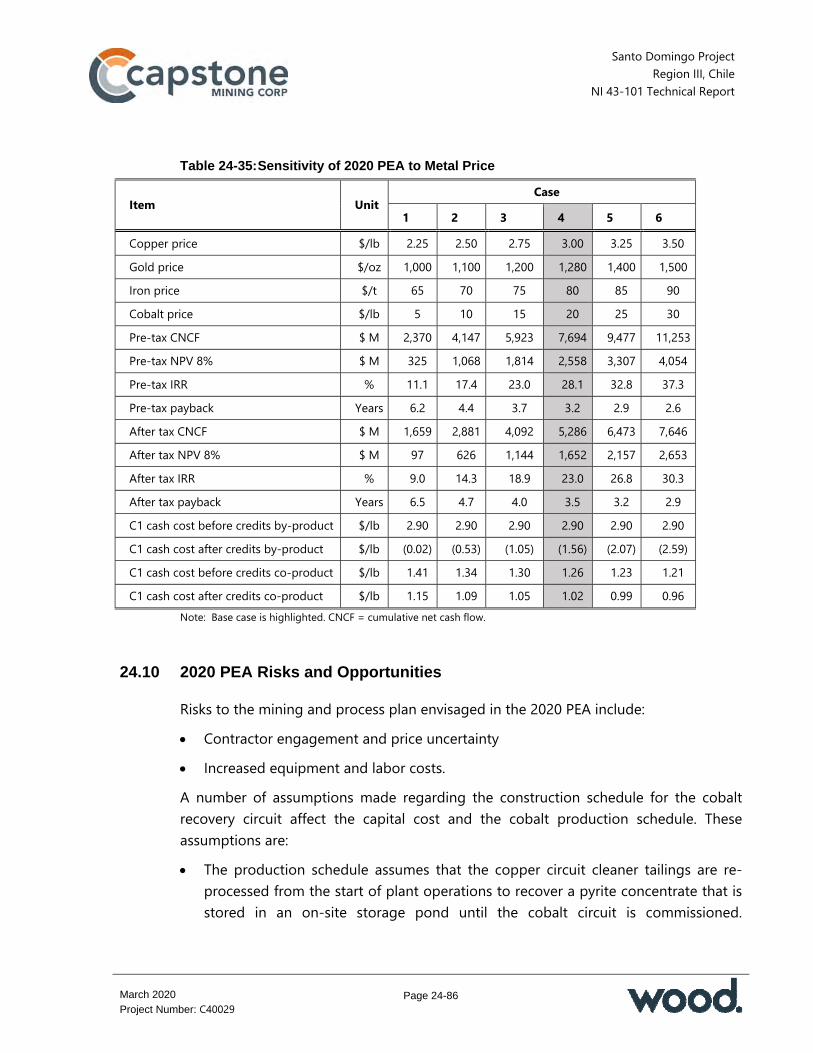
Santo Domingo Project Region III, Chile
NI 43-101 Technical Report
Page 24-86
March 2020
Project Number: C40029
Table 24-35: Sensitivity of 2020 PEA to Metal Price
Item Unit Case
1 2 3 4 5 6 Copper price $/lb 2.25 2.50 2.75 3.00 3.25 3.50 Gold price $/oz 1,000 1,100 1,200 1,280 1,400 1,500 Iron price $/t 65 70 75 80 85 90 Cobalt price $/lb 5 10 15 20 25 30 Pre-tax CNCF $ M 2,370 4,147 5,923 7,694 9,477 11,253 Pre-tax NPV 8% $ M 325 1,068 1,814 2,558 3,307 4,054 Pre-tax IRR % 11.1 17.4 23.0 28.1 32.8 37.3 Pre-tax payback Years 6.2 4.4 3.7 3.2 2.9 2.6 After tax CNCF $ M 1,659 2,881 4,092 5,286 6,473 7,646 After tax NPV 8% $ M 97 626 1,144 1,652 2,157 2,653 After tax IRR % 9.0 14.3 18.9 23.0 26.8 30.3 After tax payback Years 6.5 4.7 4.0 3.5 3.2 2.9 C1 cash cost before credits by-product $/lb 2.90 2.90 2.90 2.90 2.90 2.90 C1 cash cost after credits by-product $/lb (0.02) (0.53) (1.05) (1.56) (2.07) (2.59) C1 cash cost before credits co-product $/lb 1.41 1.34 1.30 1.26 1.23 1.21 C1 cash cost after credits co-product $/lb 1.15 1.09 1.05 1.02 0.99 0.96
Note: Base case is highlighted. CNCF = cumulative net cash flow.
24.10 2020 PEA Risks and Opportunities
Risks to the mining and process plan envisaged in the 2020 PEA include: Contractor engagement and price uncertainty Increased equipment and labor costs. A number of assumptions made regarding the construction schedule for the cobalt recovery circuit affect the capital cost and the cobalt production schedule. These assumptions are: The production schedule assumes that the copper circuit cleaner tailings are re-
processed from the start of plant operations to recover a pyrite concentrate that is stored in an on-site storage pond until the cobalt circuit is commissioned.
Santo Domingo Project Region III, Chile
NI 43-101 Technical Report
Page 24-87
March 2020
Project Number: C40029
Therefore, the decision to construct the pyrite flotation and storage facility must be made no later than 12 months prior to commissioning of the plant. Failure to build these facilities would reduce the amount of material available for recovery of cobalt and would negatively impact the economics.
Accelerating construction of the cobalt circuit would significantly reduce the capital cost associated with the construction of the long-term storage facility.
Assumptions about the Owner’s costs associated with the construction camp infrastructure and construction camp operating costs for the construction of the cobalt circuit require that the decision to build the cobalt recovery circuit is made no later than 12 months prior to commissioning of the process plant.
Opportunities identified in the 2020 PEA include: Enhance gold recovery through further metallurgical testing Incorporate autonomous haulage Share infrastructure with other local companies Consider autogenous grinding.
24.11 2020 PEA Conclusions
Using the assumptions outlined in this Report for the 2020 PEA, the 2020 PEA has a positive cash flow.

Santo Domingo Project Region III, Chile
NI 43-101 Technical Report
Page 25-1
March 2020
Project Number: C40029
25.0 INTERPRETATION AND CONCLUSIONS
25.1 Introduction
The QPs, as authors of this Report, have reviewed the data in this Report including the 2020 PEA and note the following conclusions, interpretations and opinions in the following sections, relevant to each study.
25.2 Mineral Tenure, Surface Rights, Water Rights, Royalties and Agreements
Information provided to Wood supports that the capital of Minera Santo Domingo is indirectly 70% owned by Capstone and 30% by Kores
Capstone has advised Wood that under the terms of the shareholder agreement signed between Capstone and Kores on 17 June 2011, Capstone is the operator
Mineral tenure documentation provided to Wood supports that Capstone has two groups of concessions with a total of 116 claims which cover a total of 28,897 ha and includes the areas of the planned mine site, plant area and auxiliary facilities including the port facilities. Concessions are held in the name of Minera Santo Domingo. The information provided supports that the mining tenure held is valid and is sufficient to support declaration of Mineral Resources and Mineral Reserves
Concessions are surveyed as part of grant requirements Concessions are protected under Chilean law by payment of the annual mining
license fees. Capstone advised Wood that all concession fees were current as of 28 February 2020
Capstone possess 17 provisional surface rights and 16 definitive surface rights; 6 definitive surface rights are currently in the process of approval. These easements cover 100% of the facilities and infrastructure area
The surface land in the districts of Diego de Almagro, Caldera and Chañaral where the Santo Domingo property is located are owned by the State and are managed and represented by the Ministerio de Bienes Nacionales
Capstone has developed a legal strategy to obtain all necessary surface rights to cover the mine, plant, camps, tailings storage facilities, pipelines, port and transmission line envisaged in this Report including the 2020 PEA

Santo Domingo Project Region III, Chile
NI 43-101 Technical Report
Page 25-2
March 2020
Project Number: C40029
There is sufficient suitable land available within the exploitation concessions for the planned tailings disposal, mine waste disposal and mining-related infrastructure such as the open pit, process plant, workshops and offices in this Report including the 2020 PEA
An application for water rights will not be required. The water for operations in this Report including the 2020 PEA will consist solely of desalinated sea water. A maritime concession has been obtained, which will allow the extraction of sea water
A mining tax will be payable once operations commence and is a sliding-scale tax Royalties of 2% NSR are payable to third parties on 100% of the production. The
NSR is charged on all of the metals (copper, iron, gold) recovered. The LOM royalty payments are estimated to be $340 M.
Capstone advised Wood that to the extent known, there are no other significant factors and risks that may affect access, title, or the right or ability to perform work on the property.
25.3 Geology and Mineralization
Mineralization at Santo Domingo occurs primarily in the form of IOCG deposits with related vein and skarn bodies
Drilling at 100 m centres or less at the Santo Domingo Sur deposit has outlined a 150 m to 500 m thick copper bearing, specularite-magnetite manto sequence hosted within tuffaceous sedimentary rocks and covering an area of approximately 1,300 m by 800 m. Mineralization occurs in the form of copper-bearing semi-massive to massive specularite and magnetite layers with clots and stringers of chalcopyrite. The upper parts of the manto sequence are frequently oxidized and contain various amounts of copper oxides and chalcocite
The Iris deposit is a narrow zone (100 m to 250 m wide) of copper-bearing iron mantos and breccias extending over 1,900 m that are hosted by andesitic tuffs and andesitic breccias. The dominant iron oxide at Iris is hematite and the main copper mineral is chalcopyrite
Mineralization at Iris Norte is very similar to the Iris deposit; however, part of the mineralization appears to be hosted by andesitic flows. The deposit area has been intruded by significant amounts of diorite dykes and sills. The deposit is
Santo Domingo Project Region III, Chile
NI 43-101 Technical Report
Page 25-3
March 2020
Project Number: C40029
approximately 500 m wide and has been tested over a strike length of 1,600 m. Mineralization consists of mixed magnetite and hematite mantos. The main sulphides in Iris Norte are pyrite and chalcopyrite
Drilling at the Estrellita deposit has delineated a tabular body of copper mineralization hosted by breccias and mantos along a fault zone around the Estrellita artisanal mine workings. The east–west extent of the Estrellita deposit along the Santo Domingo fault totals more than 1,000 m and the deposit remains open in both directions. Mineralization is a mixture of manto style, iron oxide and structurally-controlled, vein-style mineralization. Copper mineralization typically consists of copper oxides such as brochantite, chrysocolla, almagre, cuprite and chalcocite and transitions through a mixed zone of oxides and sulphides into a sulphide zone where the main copper mineral is chalcopyrite
25.4 Exploration, Drilling and Analytical Data Collection in Support of Mineral Resource Estimation
Modern exploration commenced in 2002. Between 2002 and June 2011 work by Far West included a regional airborne geophysical survey and interpretation of results, geological mapping, surface and drainage sampling, an IP survey, core and RC drilling and resource estimation. A preliminary assessment was conducted in 2008. Capstone acquired Far West and completed a pre-feasibility study. A feasibility study was commissioned in 2012, completed in 2014 and aspects of the study were updated in 2018
Between July 2003 and January 2019, a total of 616 core and RC holes (153,004 m) were drilled over the Property as a whole. Drilling that supports the resource estimate or was used in support of the construction of the geological models, comprises 464 holes (120,168 m)
Most drill holes are vertical because mineralization is typically horizontal or gently dipping
Drill cuttings and core were logged using a set of rock type codes. Drill collars were located using a differential GPS. Downhole surveying was conducted using accepted down-hole survey tools

Santo Domingo Project Region III, Chile
NI 43-101 Technical Report
Page 25-4
March 2020
Project Number: C40029
RPA considers that the drilling has been conducted in a manner consistent with standard industry practices. The spacing and orientation of the holes are appropriate for the deposit geometry and mineralization style
Reverse circulation drill cuttings were collected at 2 m intervals. Core was nominally sampled at 2 m intervals
Samples were shipped to an independent analytical and preparation laboratory, ALS Chemex, in Chile
Samples were analyzed for 27 elements using ICP. Gold assays were determined using fire assay with an AAS finish. Copper values over 10,000 ppm were re-assayed. All samples over 15% Fe inside the existing block model for which sample material was still available were re-assayed as a check on the Fe analyses as the initial analytical method was considered to have understated the iron content. Soluble copper analysis was conducted on some samples from the 2012 drill campaign
RPA developed regression formulae based on the specific gravity values reported by Far West Mining to convert volumes to weights, using Fe concentration as the independent variable
The QA/QC protocols have remained largely consistent throughout all programs conducted by Far West Mining and Capstone
Assay QA/QC protocols have been developed for cobalt and a review has been conducted of cobalt QA/QC data collected since 2004. Capstone is in the process of obtaining certification for cobalt for some of the reference materials in use. In RPA’s opinion, the cobalt assays meet a minimum standard for use in Mineral Resource estimation
RPA considers that sampling methods are acceptable, meet industry-standard practice, are appropriate for the mineralization style and are acceptable for Mineral Resource estimation. The quality of the analytical data is reliable and analysis and security are generally performed in accordance with exploration best practices and industry standards
Regular data verification programs have been undertaken by third-party consultants, including RPA, from 2005 to date on the data collected in support of technical reports on the Property
Santo Domingo Project Region III, Chile
NI 43-101 Technical Report
Page 25-5
March 2020
Project Number: C40029
RPA considers that as a result of this work, the data verification findings acceptably support the geological interpretations and the database quality and therefore support the use of the data in Mineral Resource estimation
25.5 Metallurgical Testwork
Metallurgical testwork completed includes physical characterization; conventional sulphide flotation using fresh water, sea water and desalinated water; settling and filtration tests on the copper concentrate; magnetic separation of magnetite; and settling and filtration tests on the magnetite concentrate. Settling testwork was also completed on final flotation tailings
A review of the work prior to 2015 showed that it would be beneficial to use desalinated water for flotation (testwork using sea water with water recirculation and the use of SMBS as a depressant slowed down flotation). The market specification for iron ore also improved using desalinated water
Fresh samples were tested in 2019 using desalinated water generating mineral kinetics that were used to model the flotation process. The flotation circuit configuration was re-examined and stage retention times were re-defined using modelling. These changes will be confirmed with further testwork or pilot plant testing
The new test procedures, use of desalinated water, improved flotation modelling techniques and the presence of cobalt mean that a more precise circuit can be designed. The work was undertaken by Aminpro who determined the configuration of the flotation circuit and forecast the recoveries of gold and copper using algorithms linked to the grades of the mine blocks
A review of the analyses of the concentrate generated from the Years 1-5 composite indicated that arsenic values were low, the silica level is acceptable and heavy minerals such as bismuth, antimony and cadmium are low. In the QP’s opinion, the levels of deleterious elements in the copper concentrate are such that no penalties are likely to be levied
Work in progress and planned in 2020 includes pilot plant testing; results will be available in Q3 2020
Using the composite and variability sample testwork results, an algorithm was developed relating the magnetic susceptibility to iron mass recovery

Santo Domingo Project Region III, Chile
NI 43-101 Technical Report
Page 25-6
March 2020
Project Number: C40029
If MagSus ≥2,000 the algorithm is: Mass Recovery of Fe = 0.0011 x (MagSus) – 3E-09 x (MagSus)2 If MagSus <2,000, then the mass recovery is assumed to be zero An average value of 65% Fe was used with the mass recovery algorithm to determine the total tonnes of magnetite concentrate
No final market specification has been concluded with an end-user for purchase of the magnetite concentrates produced. Target specifications were developed by Capstone for use in the 2014 feasibility study. The majority of concentrate samples returned elemental grade values within target specification and indicate that a marketable concentrate within specification can be produced
Additional LIMS separation work was completed in 2019 using desalinated water; this confirmed the circuit with the iron concentrate grade over 65% Fe
To quantify any potential impact on the magnetite concentrate marketability from inclusion of ANDE material in high mill feed proportions, additional targeted variability testwork is recommended to understand magnetite concentrate variations in specific zones of ANDE lithology (e.g. near barren dyke alterations) with respect to iron and silica relationships
There is upside potential if future testwork supports cobalt estimation as part of an updated Mineral Reserve estimate, such that cobalt as a by-product can be incorporated into a future economic analysis.
25.6 Mineral Resource Estimates
The Mineral Resource estimates for Santo Domingo Sur, Iris and Iris Norte were completed in 2012. The estimate for Estrellita was conducted in 2007. An estimate for cobalt was completed in 2018 and for sulphur in 2020
The Mineral Resource estimates were updated in 2018 using current metal prices, revised mass recovery and CuEq calculations, updated cut-off grades and the application of constraining pit shells
Modelling included construction of 3D wireframes that incorporated consideration of mineralized zones, fault structures and topography. In some places a nominal grade shell boundary was used. CMD data were used to model void spaces arising from artisanal mining activity

Santo Domingo Project Region III, Chile
NI 43-101 Technical Report
Page 25-7
March 2020
Project Number: C40029
A grade capping strategy was used. For Santo Domingo Sur, Iris and Iris Norte, copper was capped at 3.5% Cu, gold at 0.52 g/t Au and cobalt was capped at 1,750 ppm Co. In total, 24 Cu and 27 Au assay intervals were capped at Santo Domingo Sur, Iris and Iris Norte. These intervals represent approximately 0.2% of the total number of assays. For the 2018 estimate 27 cobalt assay intervals were capped representing approximately 0.4% of the total number of assays. Grades at Estrellita were capped at 3% Cu, 0.3 g/t Au and 1,000 ppm Co
Samples from Santo Domingo Sur, Iris and Iris Norte were composited in down-hole intervals of 4 m; those from Estrellita were composited to 2 m intervals
Grades for copper, gold, iron, cobalt, sulphur and magnetic susceptibility were interpolated into each block using OK for the Santo Domingo Sur, Iris and Iris Norte deposits. For Estrellita, OK was used to interpolate copper, gold, iron and cobalt grades into each block. An ellipsoidal search strategy with limits on the number of composites and the number of composites from any one drill hole was employed
Resource confidence categories are based on drill hole spacing Reasonable prospects for eventual economic extraction were assessed for the
Santo Domingo Sur, Iris, Iris Norte and Estrellita deposits using parameters derived from 2018 prices
Risk factors that could potentially affect the Mineral Resources estimates include changes to the assumptions used to determine reasonable prospects of eventual economic extraction, delays or other issues in reaching agreements with local communities, changes in land tenure requirements or in the permitting requirements, changes in interpretations of mineralization geometry and continuity of mineralization zones.
25.7 Mineral Reserve Estimates
Mineral Reserves amenable to open pit mining were constrained within an LG shell. An internal cut-off of $7.53/t milled was applied to all of the Mineral Reserve estimates. This internal cut-off was applied to material contained within an economic pit shell where the decision to mine a given block was determined by the pit optimization. Marginal material was calculated for the same $7.53/t cut-off, but for an NSR determined at higher metal prices

Santo Domingo Project Region III, Chile
NI 43-101 Technical Report
Page 25-8
March 2020
Project Number: C40029
To accommodate selective mining methods, any resource block with an ore percentage that was <10% was treated as waste. Blocks with an ore percentage that was higher than 90% were diluted with waste such that all high-ore blocks were considered to contain only 90% ore. Selective mining will be performed on those blocks that have an ore percentage of between 10% and 90%
A mine plan was developed to process 65/60 kt/d (21.9 to 23.7 Mt/y) with a peak total mining rate of 107.5 Mt/y. Inferred Mineral Resources were treated as waste in the mine plan
NCL performed pit optimization and mine planning without introducing any additional factors to account for dilution, as the block model was considered to be a fully diluted resource model. NCL considered a 100% mining recovery to be appropriate due to the disseminated characteristics of the ore
Proven and Probable Mineral Reserves total 392.3 Mt grading 0.30% Cu, 0.04 g/t Au and 28.2% Fe
The main factors that may affect the Mineral Reserve estimates are metallurgical recoveries and operating costs (fuel, energy and labour). The base price of the metals, even though the most important factor for revenue calculation, does not affect the Mineral Reserves estimate. The low metal price effect is due to the fact that the selected LG shell used as the guide for the practical design was based upon a 0.84 revenue factor for both the Santo Domingo and Iris Norte pits. This selected revenue factor was conservative and as such allows for a broad swing in metals pricing before any effect on the Mineral Reserves estimate occurs.
25.8 Mine Plan
Pit designs are based on optimized LG shells at a revenue factor of 0.84 with variable overall slope angles according to geotechnical domains ranging from 38° to 44°
Seven pit phases are planned; four for Santo Domingo and three for Iris Norte The mine plan will process 60,000 t/d to 65,000 t/d of feed (21.9 to 23.7 Mt/y) with
a peak total mining rate of 107.5 Mt/y in Years 1 to 4 Mill throughput will be restricted to the maximum magnetite concentrate
production of 4.5 Mt/y up to Year 10; and to 5.4 Mt/y from Year 11 onward

Santo Domingo Project Region III, Chile
NI 43-101 Technical Report
Page 25-9
March 2020
Project Number: C40029
The 15-month pre-production period requires the mining of 45 Mt of total material to expose sufficient ore to start commercial production in H2 Year 9
The total mined waste considers two main destinations for the material (the main waste storage areas and the tailings storage facility for the embankment construction) and top soil stripping and disposal to a specific stockpile location
The mined ore will be hauled to the primary crusher for direct tipping. Marginal material will be mined and hauled to a stockpile located between the Santo Domingo and Iris Norte pits until Year 13. This material will be re-handled and will become part of the plant feed in the later years. From Year 14 on, the marginal material will be sent directly to the plant
The mine is scheduled to operate seven days per week or 365 days per year. Each day will consist of two 12-hour shifts. Four mining crews will rotate (two working and two on time off) to cover the operation
This Report assumes that the mining operation will use 42 m3 hydraulic excavators and trucks with a capacity of 290 t. The fleet will be complemented with drill rigs for ore and waste delineation. Auxiliary equipment will include track dozers, wheel dozers, motor graders and a water truck
Mining and port activities are expected to be able to be conducted on a year-round basis.
25.9 Recovery Plan
The process route envisages a DSAG comminution circuit. Copper will be recovered in a flotation circuit. Magnetite will be recovered through a magnetic LIMS concentrator
A two-stage tailings thickening process will be used prior to the tailings materials being deposited in the TSF
Copper concentrate will be trucked to the shipment port; magnetite concentrate will be transferred by pipeline
The process plant water requirements will be provided from desalinated water, pumped from the port to the plant site, by a BOOT contractor
Santo Domingo Project Region III, Chile
NI 43-101 Technical Report
Page 25-10
March 2020
Project Number: C40029
The capacity of the process plant for the first 5 years will be 65,000 t/d or 23.7 Mt/y excluding the ramp up period. The throughput after the first 5 years will be 60,000 t/d or 21.9 Mt/y
The highest production rate of copper concentrate occurs during the first full year of production and is 514.1 kt of contained copper. The highest production of magnetite concentrate is around 5.4 Mt which occurs in Years 14 and 15.
25.10 Infrastructure
The planned route for transporting cargo, staff and equipment to the Santo Domingo site is from the south of the mine site by Route C-17 and from the north by Route C13. Approximately 13 km of roads will be built on the Santo Domingo site in order to connect the plant areas
The principal infrastructure will include: Santo Domingo plant site: Located at approximately 26°28’00”S and
70°00’30”W Operations camp: Located on the mine site Port facilities: Located about 43.5 km north of Caldera at Punta Roca Blanca Concentrate pipeline: 111.6 km long from the Santo Domingo plant site
location to the Santo Domingo port site at Punta Roca Blanca High voltage transmission line: from the Diego de Almagro (San Lorenzo)
substation to the proposed mine and plant site High voltage transmission line: from the Totoralillo substation to the port site
Three WRF areas, to be located to the west and south of the pits, were designed. The WRFs show a moderate to low potential for generation of acid rock drainage
The proposed locations of the marginal material and oxide stockpiles are between the Santo Domingo and Iris Norte pits
The TSF will be constructed behind a main embankment and a saddle dam from compacted, non-acid generating mine waste rock with a geo-membrane liner installed on the upstream face of the main embankment, extending into the impoundment area where it will be anchored in a cut-off trench. Tailings will be thickened to a target 67% solids prior to deposition. It is expected that the target solids content will not be reached in the early years of operation. A final capacity of approximately 314 Mt of copper and iron tailings, equivalent to a total volume of

Santo Domingo Project Region III, Chile
NI 43-101 Technical Report
Page 25-11
March 2020
Project Number: C40029
about 196 Mm³, is proposed to be deposited over the approximate 18 years of operations
Mineral processing will use desalinated water provided by a third party; there will be a desalination plant at the port operated by the third party. The nominal total requirement for water is 348.6 L/s. The water requirement during the construction phase will be provided by an authorized water supplier with a maximum of 15 L/s
Supernatant water will be recovered from the TSF throughout the operational life of the facility and will be pumped back to the process facility
Capstone has committed to provide 10 L/s of potable water to Diego de Almagro Copper concentrate will be delivered to the port by concentrate haul trucks.
Magnetite concentrate will be delivered by pipeline The approximately 111 km long concentrate pipeline route is designed to run
parallel to the existing roads and uses existing RoW access to avoid the construction of new roads
Water will be primarily supplied by the BOOT contractor operating the desalinated water system and assumes that 49 L/s will be reclaimed from the TSF
The magnetite concentrate pipeline design maximum capacity is 415 m3/hr at 68% concentration
Based upon current Capstone concentrate production requirements, the maximum required annual port capacity is 5.4 Mt/y of magnetite concentrate and 0.51 Mt/y of copper concentrate. Magnetite concentrate is planned to be shipped using a mixture of Panamax and Cape size vessels, larger vessels may be used. Copper concentrate would be shipped using Panamax and Handymax size vessels. The selected nominal loading rate will be 4,000 t/hr for magnetite concentrate and 2,000 t/hr for copper concentrate
Capstone’s mine site and port site will be connected to the Sistema Eléctrico Nacional (SEN, National Electrical System). The closest connection point between the SEN and the mine site is via a direct connection to the Diego de Almagro (San Lorenzo) substation, located about 9 km from the mine area
Capstone’s power supply strategy is consistent with the Chilean market. Capstone has signed a PPA with a leading power company operating in the national grid system.

Santo Domingo Project Region III, Chile
NI 43-101 Technical Report
Page 25-12
March 2020
Project Number: C40029
25.11 Environmental, Permitting and Social Considerations
Baseline studies were carried out for communities in the area of influence of the proposed operation and included Diego de Almagro, Inca de Oro, El Salado, Chañaral, Flamenco, Torres del Inca, Obispito and Caldera
Studies included collection of physical, marine, biotic and anthropological environment baseline data. Areas which were important during the environmental evaluation process included the impact of the 2019 Technical Report assumptions on water resources, air quality and the marine and human environments
A Closure Plan has been approved. It is estimated that the plant will produce >10,000 t/month, hence, Capstone will be required to post a guarantee. A bond based on the estimated cost of closure must be submitted to the state
Around 700 permits will be required. Some permits have been classed as critical because of the strategic importance to ensure the construction and start-up as envisaged in this Report
The EIA was submitted to the SEIA for approval on 30 October 2013. The assessment process took 22 months and the SEIA approved the environmental licence in July 2015 in RCA No. 119/2015; this is valid for 5 years until July 2020. After issue of the RCA, port modifications were made, including the desalination plant and auxiliary facilities. These were included in a DIA that was submitted in September 2019; it is estimated that approval will be received in H2 2020
The main strategic risk to the permitting assumptions is not having a permit plan that is integrated into a master schedule
A stakeholder identification study was completed and identified a number of parties that are in the direct and indirect area of influence of the proposed operation. Stakeholder communications include open houses, open meetings, themed meetings for specialist interests and meetings with authorities and regional and community groups
Capstone has found that the installations approved in the EIA may overlap with new installations by third parties; modifications may be required to approved locations for linear works (such as the pipeline route).

Santo Domingo Project Region III, Chile
NI 43-101 Technical Report
Page 25-13
March 2020
Project Number: C40029
25.12 Markets and Contracts
Kores has an agreement to purchase up to 50% of the annual production of copper concentrate and iron ore concentrate, leaving Capstone to market and sell the remaining concentrate. The Kores terms and conditions will reflect the Capstone terms negotiated independently in the market
The plan for Santo Domingo is to produce a high magnetite UF iron ore concentrate, suitable for pellet feed. Capstone has contacted a number of potential pelletizing plants that can process their iron ore concentrate as a starting point of a campaign to contract a suitable long-term offtaker. A number of potential buyers will be contacted in order to negotiate meaningful MoUs and eventually contracts
Although more difficult, because it is a speciality product, Capstone may also explore the option of contracting long term with one or more traders who may be able to sell the material to a specific end user on a long-term contract
Each steel mill complex has its own level of tolerance in terms of impurities in magnetite concentrates. The main levels of impurities as far as the Santo Domingo magnetite concentrate is concerned are silica and copper. Copper is below the threshold but may in some circumstances represent a non-preferred feed; silica is only likely to be a cost factor or penalty element rather than a rejectable quality issue
The plan is that Santo Domingo copper concentrate would generally be considered clean and the concentrate will not have any penalty elements that will be consistently above the normal thresholds. Chlorine and fluorine are under the limits at which penalties are normally applied and if they are occasionally over the limit it is likely that only a nominal penalty would apply
It is expected the concentrate envisaged in the plan for Santo Domingo will be in high demand from trading companies specialising in blending complex materials with clean materials
No contracts are currently in place for Capstone’s portion of the production for either the copper or iron ore concentrates
No other contracts are in place (except for the PPA) for any other aspects of the Santo Domingo plan.

Santo Domingo Project Region III, Chile
NI 43-101 Technical Report
Page 25-14
March 2020
Project Number: C40029
25.13 Capital Cost Estimates
The estimate is a Type 3 estimate according to Wood and ACCE International standards, with an accuracy of -10% to +15% at the 85% confidence level
All capital cost estimates are in third-quarter 2018 US dollars The estimates are based on a combination of direct quotes, benchmarking and
Capstone-supplied data The initial capital cost estimate is $1,512.3 M. The estimated sustaining capital cost
is $378.6 M. The combined initial and sustaining capital costs for the LOM are estimated to be $1,890.9 M.
25.14 Operating Cost Estimates
The estimate is considered to be feasibility study level with an accuracy of -10% to +15%
The estimates are based on a combination of direct quotes, benchmarking and Capstone-supplied data
Total process operating costs over the LOM are estimated at $2,547.6 M; G & A costs at $402.8 M and total mining costs at $2,619.6 M. The total operating cost over the LOM is estimated to be $5,570.0 M
The LOM average operating cost is $1.34/lb CuEq produced The LOM copper concentrate transport costs are estimated to be $47.3 M and are
not included in the total above. 25.15 Economic Analysis
Based on the assumptions in this Report, Santo Domingo has a positive cash flow On an after-tax basis, the cumulative net cash flow is $3,250.5 M, the IRR is 21.8%
and the payback period is 2.8 years At an 8% discount rate, the after-tax NPV is $1,031.9 M The NPV8% is most sensitive to changes in the copper price (copper grade) and in
total operating and capital expenditures. The sensitivity analysis showed that the 2019 Technical Report is less sensitive to changes in the iron price (iron grade) and the dollar/peso exchange rate and least sensitive to changes in power costs
Santo Domingo Project Region III, Chile
NI 43-101 Technical Report
Page 25-15
March 2020
Project Number: C40029
Checks were undertaken in March 2020 to confirm that the cost estimates remained current. The checks included a review of recent study work to see if this work would result in any material changes to the estimates. The review considered additional engineering information such as refinement of drawings and quantity takeoffs, review of commodity price forecasts and basic assumptions used in the cost estimation, review of the impact of power pricing as a result of the PPA, and review of the impact of a newly-enacted Chilean regional tax on the economic analysis. The results showed that if this new information was included in the cost estimates, it would not result in a material change in the outcome of the study (capital and operating costs, economic analysis). Therefore, the cost estimates and economic analyses are considered current and suitable to be included in this Report.
25.16 Risks and Opportunities
The most significant risks were evaluated in a risk review in 2018 and include: Delay in financing Schedule delays Contractor engagement and price uncertainty Increased equipment and labor costs.
Opportunities identified in 2018 include: Include cobalt in the Mineral Reserve Enhance gold recovery through further metallurgical testing Incorporate autonomous haulage Share infrastructure with other local companies Consider autogenous grinding.
Risks and opportunities will be continuously assessed and reviewed throughout the various phases of the design, construction and operation, in accordance with Capstone’s Risk Management Framework.
25.17 Conclusions
Under the feasibility study update assumptions outlined in this Report, Santo Domingo shows positive economics
Santo Domingo Project Region III, Chile
NI 43-101 Technical Report
Page 25-16
March 2020
Project Number: C40029
The QPs consider that the scientific and technical information available in the 2019 Technical Report remains current and can support a decision by Capstone to proceed with detailed mine design phase studies.
25.18 2020 Preliminary Economic Assessment
25.18.1 2020 PEA Mine Plan
The PEA mine plan is based on a subset of the Measured and Indicated Mineral Resource estimate in Section 14 and is inclusive of dilution. Mineral Resources that are not Mineral Reserves do not have demonstrated economic viability.
25.18.2 2020 PEA Recovery Plan
The PEA evaluates several processing alternatives for the production of cobalt products. A number of alternatives were rejected; however, more than one viable alternative was identified. Further work is needed to assess the best process route and test the selected process by pilot plant testing. A moderate temperature roast was selected for the economic evaluation in the PEA; however, there is reason to expect that higher cobalt and copper recoveries and more by-product power generation could be attained by roasting at a higher temperature for little additional capital expenditure
High temperature POX leaching of the pyrite concentrate was rejected in the PEA on the basis of the expected neutralization costs associated with the acid production. A source of natural limestone occurs within the pre-strip volume of the Santo Domingo pit. It is estimated that there would be enough limestone to support the neutralization requirement of a POX leach process for cobalt recovery for the planned 18-year mine life. Representative samples of this limestone material must be evaluated in additional POX testing and a trade-off study completed before definitively rejecting the POX processing option
Further testing is required to design the roasting and gas cleaning equipment for the cobalt recovery circuit. Ideally, sufficient pyrite material could be produced to permit pilot testing of the roasting circuit
Further testing of the leach solution neutralization and purification process needs to be carried out. Physical production of the cobalt sulphate was not attempted in the 2020 PEA. Bench testing of the solvent extraction circuit for cobalt purification requires larger volumes of leach solution than were available for the PEA. The leach

Santo Domingo Project Region III, Chile
NI 43-101 Technical Report
Page 25-17
March 2020
Project Number: C40029
solutions were neutralized and purified in the laboratory testing up to the level of feeding an SX circuit and the solution chemistry only was used to model the SX step
The cobalt testwork was limited to composite material representing the first 5 years of the mine plan. Projection of the results was based on modelling of the pyrite content in the resource. Further testing is required to confirm the validity of the pyrite model used to project the cobalt production for the 2020 PEA
The capital costs associated with the roasting circuit were based on three trains of stationary fluid bed reactors. It is anticipated that significant capital reductions could be realized by using circulating fluid bed reactors. However, additional testing is required to confirm the suitability of the feed material for this process.
25.18.3 2020 PEA Infrastructure
The planned route for transporting cargo, staff and equipment to the Santo Domingo site is from the south of the mine site by Route C-17 and from the north by Route C13. Approximately 13 km of roads will be built on the Santo Domingo site in order to connect the plant areas
The principal infrastructure will include: Santo Domingo plant site Operations camp Port facilities Concentrate and water pipelines High voltage transmission lines
Three WRF areas, to be located to the west and south of the pits. The WRFs show a moderate to low potential for generation of acid rock drainage. The proposed locations of the marginal material and oxide stockpiles are between the Santo Domingo and Iris Norte pits
The TSF will have a final capacity of approximately 314 Mt of copper and iron tailings, equivalent to a total volume of about 196 Mm³. Tailings will be stored behind a main embankment and a saddle. Tailings will be thickened to a target 67% solids prior to deposition. It is expected that the target solids content will not be reached in the early years of operation. Supernatant water will be recovered
Santo Domingo Project Region III, Chile
NI 43-101 Technical Report
Page 25-18
March 2020
Project Number: C40029
from the TSF throughout the operational life of the facility and will be pumped back to the process facility
Mineral processing will use desalinated water provided by a third party; there will be a desalination plant at the port operated by the third party. The nominal total requirement for water is estimated at about 400 L/s. The water requirement during the construction phase will be provided by an authorized water supplier with a maximum of 15 L/s. Water will be primarily supplied by the BOOT contractor operating the desalinated water system and assumes that 49 L/s will be reclaimed from the TSF. Capstone has committed to provide 10 L/s of potable water to Diego de Almagro
Copper concentrate will be delivered to the port by concentrate haul trucks. Magnetite concentrate will be delivered by pipeline. The approximately 111 km long concentrate pipeline route is designed to run parallel to the existing roads and uses existing RoW access to avoid the construction of new roads. The magnetite concentrate pipeline design maximum capacity is 415 m3/hr at 68% concentration
Based upon current Capstone concentrate production requirements, the maximum required annual port capacity is 5.4 Mt/y of magnetite concentrate and 0.51 Mt/y of copper concentrate
Capstone’s mine site and port site will be connected to SEN. The closest connection point between the SEN and the mine site is via a direct connection to the Diego de Almagro substation, located about 9 km from the mine area
Capstone has signed a PPA with a leading power transmission company operating in the national grid system.
25.18.4 2020 PEA Environmental, Permitting and Social Considerations
Baseline studies have been completed for the area of influence. The proposed cobalt circuit will require updates to elements of the baseline data
The EIA was submitted to the SEIA for approval on 30 October 2013. The assessment process took 22 months and the SEIA approved the environmental licence in July 2015 in RCA No. 119/2015, this is valid for 5 years until July 2020. The EIA was submitted to the SEIA for approval on 30 October 2013. A DIA to cover changes to the port area such as the desalination plant, was submitted in

Santo Domingo Project Region III, Chile
NI 43-101 Technical Report
Page 25-19
March 2020
Project Number: C40029
September 2019; it is estimated that approval will be received in H2 2020. An EIA/DIA will be required for the cobalt and acid plants envisaged in the 2020 PEA. The level of detail will be at the discretion of the Chilean authorities
A Closure Plan has been approved. The Closure Plan covers the mining facilities included in the EIA; this includes the mine site, port, pipeline route and transmission lines. An update to the Closure Plan must be submitted for the modifications at the port approved by the DIA and for the cobalt circuit for which approval will be requested in a new EIA or DIA. A closure bond is required
Around 700 permits will be required, with the majority (about 60%) related to the mine and plant area
Stakeholder identification has been conducted and communications such as open houses, open meetings, themed meetings for specialist interests and meetings with authorities, regional and community groups undertaken.
25.18.5 2020 PEA Markets and Contracts
Kores has an agreement to purchase up to 50% of the annual production of copper concentrate and iron ore concentrate, leaving Capstone to market and sell the remaining concentrate. The Kores terms and conditions will reflect the Capstone terms negotiated independently in the market
Capstone has contacted a number of potential pelletizing plants that can process their iron ore concentrate as a starting point of a campaign to contract a suitable long-term offtaker
Impurities in the magnetite concentrate include silica and copper. Copper is below the threshold but may in some circumstances represent a non-preferred feed; silica is only likely to be a cost factor or penalty element rather than a rejectable quality issue. Copper concentrate would generally be considered clean and the concentrate will not have any penalty elements that will be consistently above the normal thresholds
The expected market for cobalt sulphate would be Korea, Japan and Europe No contracts are currently in place for Capstone’s portion of the production for any
of the planned products. Other than the PPA, no other contracts are in place.

Santo Domingo Project Region III, Chile
NI 43-101 Technical Report
Page 25-20
March 2020
Project Number: C40029
25.18.6 2020 PEA Capital Cost Estimates
Capital cost estimates are presented at an overall cost accuracy of ±40% Cost estimates include contingency The total initial capital cost is $2,178 M. The estimated sustaining capital cost is
$443 M The subset of the initial capital cost estimate that is incurred by the cobalt plant is
$665 M. 25.18.7 2020 PEA Operating Cost Estimates
Operating costs are presented at an overall ±40% estimated accuracy The LOM operating cost is estimated at $6,173 M. The portion of the operating
cost estimate that pertains to the cobalt plant is $576 M. 25.18.8 2020 PEA Economic Analysis
The 2020 PEA is based on Measured and Indicated Mineral Resources. The 2020 PEA is preliminary in nature, is based on Mineral Resources that have not been categorized as Mineral Reserves and there is no certainty that the 2020 PEA based on these Mineral Resources will be realized. Mineral Resources that are not Mineral Reserves do not have demonstrated economic viability
The 2020 PEA cash flows consist of approximately 3 years of pre-production costs and 18 years of operations
On an after-tax basis, the cumulative net cash flow is $5,286 M, the IRR is 23% and the payback period is 3.5 years. Based on the assumptions discussed in the 2020 PEA, the cash flow analysis shows that the 2020 PEA will generate positive cash flows from the first full year of production onwards
On a by-product basis, the gold, iron, cobalt and sulphuric acid credits offset operating costs over the LOM, resulting in a C1 cash cost of almost zero during the first 5 years and negative equivalent costs over LOM (i.e. -$1.56/lb). On the co-product basis, the gold and sulphuric acid credits result in a copper LOM C1 cash cost of $1.02/lb Cu equivalent and an iron C1 cash cost of about $27.10/dmt
The 2020 PEA NPV8% is most sensitive to changes in the copper price (copper grade) and in total operating and capital expenditures. The sensitivity analysis

Santo Domingo Project Region III, Chile
NI 43-101 Technical Report
Page 25-21
March 2020
Project Number: C40029
showed that the 2020 PEA is less sensitive to changes in the iron price (iron grade) and the dollar/peso exchange rate and least sensitive to changes in power costs.
25.18.9 2020 PEA Risks and Opportunities
Risks to the mining and process plan envisaged in the 2020 PEA include: Contractor engagement and price uncertainty Increased equipment and labor costs Failure to construct the pyrite flotation and storage facility in the envisaged
time frame Owner’s costs may increase if the envisaged time frame in the economic
analysis is not met Opportunities include:
Enhance gold recovery through further metallurgical testing Incorporate autonomous haulage Share infrastructure with other local companies Consider autogenous grinding Accelerate construction of the cobalt circuit to reduce the capital cost
associated with the construction of pyrite concentrate storage facility. 25.18.10 2020 PEA Conclusions
Under the assumptions presented in this Report regarding the 2020 PEA, the 2020 PEA shows positive economics.

Santo Domingo Project Region III, Chile
NI 43-101 Technical Report
Page 26-1
March 2020
Project Number: C40029
26.0 RECOMMENDATIONS
26.1 Introduction
The list of recommendations is provided by the QPs in their respective areas of competence and can be completed concurrently. The total budget required to complete the proposed work programs is in the range of $5.6 M to $6.8 M.
26.2 RPA Recommendations
RPA recommends that the certification of reference materials for cobalt be completed.
A review of the mineralogy and mode of occurrence of cobalt should be undertaken to better define the controls to mineralization. On completion of this work, the resource models should be reviewed on the basis of this information and revised where appropriate.
With the updated metallurgical testwork available, a study should be undertaken to better characterize the mineral types in the model for geometallurgical purposes, including more definition of the oxide material types.
This work is budgeted at about $300,000 to $350,000, assuming a third party consultant performs the block model work, the cobalt mineralogy study and the review of the cobalt analytical QA/QC. If, on the basis of the cobalt studies, it is determined that new mineralization wireframes are required, an additional $100,000 to $125,000 should be budgeted.
26.3 Knight Piésold Recommendations
The following recommendations are made by Knight Piésold in support of detailed design: Review the water balance model and analysis with updated slurry solids contents
and, together with any updated in-place tailings density values from the additional tailings testing and the estimated beach configuration, determine the final limits of the geomembrane liner within the TSF impoundment and the need for a deeper cut-off trench for anchoring the geomembrane liner The engineering associated with this work is estimated to be $300,000
Santo Domingo Project Region III, Chile
NI 43-101 Technical Report
Page 26-2
March 2020
Project Number: C40029
The final design should include a review of the hydrology study to include the latest significant hydrological events in the area. This review may change the volume for the PMP and this may have an impact on the size of the dam The engineering associated with this work is estimated to be approximately $50,000 to $100,000
Consider the impacts of a flatter beach slope (1.5% is currently planned), which could result if the tailings slurry densities are lower than expected or the discharge system is less effective than contemplated. The freeboard at the main embankment must then be checked. The final (initial and sustaining) cost estimate for the embankment is not expected to change as a result of this, but the initial construction stage may require a higher dam, which could increase the initial capital cost estimate The engineering associated with this work is estimated to be approximately $50,000 to $100,000
Include additional vibrating wire piezometers underneath the lined area of the TSF to monitor for potential seepage and assess the effectiveness of the lining system.
Perform additional tailings tests on new samples including: Rheology Atterberg limits Specific gravity Particle size distribution (with hydrometer) Undrained settling Drained settling Air drying Coefficient of permeability Slurry consolidation – low stress Slurry consolidation – high stress ICU triaxial This testwork is estimated to require a budget of $35,000
Perform a large triaxial test on a representative sample of construction materials for the dam (Chilean authorities are asking for back-up tests for parameters used in design)
Santo Domingo Project Region III, Chile
NI 43-101 Technical Report
Page 26-3
March 2020
Project Number: C40029
A budget of $50,000 will be required to support the large triaxial testwork planned
Integrate the results of the tailings and large triaxial tests into the overall TSF design Between $10,000 and $100,000 is estimated for the integration of the results of the testwork into the overall TSF design. The range provides scope for some re-design work on the TSF if the testwork indicates that this is necessary
Perform additional site investigations to check the soluble salts content in the foundation area of the main dam. This program should include at least 10 test pits with a minimum depth of 6 m. Samples should be taken each meter for every test pit. The soluble salts content testing should extend over enough time to simulate the long-term exposure to flow that these soils may undergo The cost of these tests is estimated to be $100,000. Depending on the results of these tests, additional foundation excavation and backfill may be required for the construction of the main embankment.
26.4 Wood Recommendations
26.4.1 Metallurgy
Bench-scale metallurgical testwork and a pilot plant testwork program are recommended to optimize plant operation and potentially reduce operating costs. The following bench test programs are proposed to be conducted prior to the commencement of operation of a pilot plant: Develop a geometallurgical recovery model addressing lithologies and copper
solubility levels in plant feed to optimize mine and process plant production planning
To further optimize the mine production plan, additional targeted variability testwork is suggested to understand magnetite concentrate variations in specific zones of ANDE lithology (e.g. near barren dyke alterations) with respect to iron and silica relationships.
The recommended pilot plant is designed to be conducted prior to the completion of the basic engineering stage to:

Santo Domingo Project Region III, Chile
NI 43-101 Technical Report
Page 26-4
March 2020
Project Number: C40029
Optimize the metallurgical parameters such as chemical addition types and amounts, residence time requirements and grind and regrind sizes
Confirm equipment sizing for flotation, regrind, filtration and copper concentrate transport
Produce sufficient copper and magnetite concentrates for market evaluation Further define the optimal marketing conditions for the magnetite concentrate
with the goal of reducing operating costs. The bench-scale testwork is estimated at $300,000–$500,000. Depending on the number of physical tests completed as part of the plant optimization runs, the pilot plant costs could range from $300,000 to $1 M. It is recommended that the design be updated in the next phase of work to allow for the decrease in the P80 from 180 microns to 150 microns.
26.4.2 Environmental and Permitting
The following should be reviewed or conducted: Water crossing permit applications should be submitted to the relevant authorities
prior to the commencement of earthworks in sensitive areas, due to the length of the approval process
Capstone has found that installations approved in the EIA may overlap with new installations belonging to third parties; modifications may be required to approved locations for linear works (such as the pipeline route)
Baseline information will need to be updated for the cobalt circuit installation and the transport route for sulphuric acid. The results of these studies and more detailed design will be used to determine which of an EIA or a DIA will be required for the cobalt circuit modification.
Wood estimates that this work will require a budget of about $870,000. 26.5 Gregg Bush and MPlan Recommendations
The following recommendation are put forward by Gregg Bush and Lyn Jones for further development of the cobalt opportunity: Pyrite/cobalt flotation:
Santo Domingo Project Region III, Chile
NI 43-101 Technical Report
Page 26-5
March 2020
Project Number: C40029
Variability testing of sample sets representing all years of the Santo Domingo mine plan to confirm the implied deportment of cobalt in pyrite
Pilot scale flotation of copper circuit cleaner tailings to produce sufficient quantities of pyrite concentrate for roaster testing
Pyrite oxidation/leaching circuit optimization: Desktop trade-off evaluations of high-temperature POX leaching and roasting
are needed to confirm that roasting is the most suitable processing option Testing of the limestone unit in the Santo Domingo pre-stripping material to
confirm suitability for neutralization Optimization of roasting/leaching conditions to improve copper and cobalt
recovery Pilot roasting tests to confirm roaster operation and produce sufficient leachate
for optimization of neutralization, precipitation, cobalt SX testing and crystallization
Chemical characterization of final product cobalt sulphate Environmental characterization of final process tailings
Costs and economics: Advance engineering (using further testwork results) to produce Class 3 or
Class 4 capital and operating cost estimates Carry out a sulphuric acid marketing and pricing study to verify that there is
local off-take of the volume of acid produced in the roasting circuit Carry out a marketing study for the cobalt sulphate heptahydrate product.
The total cost for the activities outlined above is $2.8 M, broken out as follows: Trade-off studies: $100,000 Laboratory testing for process optimization and roasting: $250,000 SX/crystallization testing and small-scale piloting: $150,000 Engineering activities to support further definition: $2.3 M.
Santo Domingo Project Region III, Chile
NI 43-101 Technical Report
Page 26-6
March 2020
Project Number: C40029
26.6 Brass Recommendations
Brass has made the following recommendations in support of detailed design: Improve soil characterization by increasing geotechnical survey and soil
mechanics testing along the pipeline route. This will provide better estimates for excavation and earthmoving works. This work is estimated to require $200,000 to complete
Improve hydrological surveys to define river scour depths and improve special crossing design. The estimate for completion of this work is $75,000.
Schedule additional slurry testing on representative samples with the target concentrate size grind and with simulated amounts of flocculants (if any is used) on the final slurry product. This will improve pump sizing and pipe wall thickness distribution along the pipeline. This work is estimated at $60,000.

Santo Domingo Project Region III, Chile
NI 43-101 Technical Report
Page 27-1
March 2020
Project Number: C40029
27.0 REFERENCES
Allen, G. J., 2004: Report on the 2003 Exploration Activities in the 4c Santo Domingo Area of the Candelaria Project, Region III, Chile: report prepared for Far West Mining Ltd. and BHP Billiton
Allen, G. J., 2005: Report on the Exploration Activities in the 4a Santo Domingo Area of the Candelaria Project, Region III, Chile: report prepared for Far West Mining Ltd. and BHP Billiton, 31 July 2005
Allen, G. J., and Höy, T., 2005: Exploration Activities in the 4a (Santo Domingo) Area of the Candelaria Project, Region III, Chile: report prepared for Far West Mining Ltd.
Amec, 2014: Definitive Feasibility Study: unpublished draft report prepared by Amec, Knight Piésold, PRDW, Brass, RPA, NCL, Ghisolfo, CRU and CTAG, dated June 2014, 30 vols.
Amec International (Chile) S.A., 2008: Review of the Santo Domingo Sur and Iris Project, Region III, Chile: NI 43-101 Technical Report on the Preliminary Assessment: report prepared for Far West Mining Ltd., 30 April 2008.
Aminpro Chile, 2015: MSD-Consolidated Rougher-Cleaner Testwork and Modelling, Ref. No. P2015-016, Roger Amelunxen, October 2015.
Aminpro Chile, 2018: Programa Metalúrgico de Flotación a Nivel de Laboratorio con Agua Desalada, Ref. No. P2018-037, David Barriga and Roger Amelunxen, Octubre 2018.
Aminpro Chile, 2018: Estudio de Flotación Rougher con Agua Desalada sobre Muestras de Variabilidad para Generar los Algoritmos de Recuperación de Cobre y Oro, Ref. No. P2018-061, David Barriga, December 2018.
Aninat Schwencke and Cia, 2009: Legal Opinion Regarding the Legal Status of the Minera Lejano Oeste S.A. Mining Concessions: letter prepared 16 February 2009.
ASME Standard B31.04.2012 Ausenco Minerals and Metals, 2011: Technical Report on the Santo Domingo Project,
Chile, 28 September 2011, 295 p. Braemar ACM, 2018: Very Large Ore Carrier Review: report prepared for Capstone, 24
October 2018.
Santo Domingo Project Region III, Chile
NI 43-101 Technical Report
Page 27-2
March 2020
Project Number: C40029
Brass document numbers BPI13004-6150-EST-CS-001_Rev. 4, BPI13004-6120-EST-CS-001_Rev 4, BPI13004-6120-EST-CS-002_Rev 3, BPI13004-6150-EST-CS-002_Rev 3, Actualización de CAPEX/OPEX – Proyecto Santo Domingo, 2018.
Brown, M., Díaz, F., and Grocott, J., 1993: Displacement history of the Atacama fault system, 25°00’ - 27°00’S, northern Chile: Geological Society of America Bulletin, Volume 105, pp.129–132.
Canadian Dam Association (CDA) Dam Safety Guidelines (CDA 2007). Canadian Institute of Mining, Metallurgy and Petroleum (CIM), 2003: Estimation of
Mineral Resources and Mineral Reserves, Best Practice Guidelines: Canadian Institute of Mining, Metallurgy and Petroleum, 23 November 2003, http://www.cim.org/committees/estimation2003.pdf
Canadian Institute of Mining, Metallurgy and Petroleum (CIM), 2005: CIM Standards for Mineral Resources and Mineral Reserves, Definitions and Guidelines: Canadian Institute of Mining, Metallurgy and Petroleum, December 2005, http://www.cim.org/committees/CIMDefStds_Dec11_05.pdf.
Canadian Institute of Mining, Metallurgy and Petroleum (CIM), 2010: CIM Standards for Mineral Resources and Mineral Reserves, Definitions and Guidelines: Canadian Institute of Mining, Metallurgy and Petroleum, November 2010, http://www.cim.org/UserFiles/File/CIM_DEFINITON_STANDARDS_Nov_2010.pdf.
Canadian Securities Administrators (CSA), 2011: National Instrument 43-101, Standards of Disclosure for Mineral Projects, Canadian Securities Administrators.
Coordinador Electrico Nacional (CEN), 2018: Official Website: https://www.coordinador.cl/
Daroch, G., 2011: Hydrothermal Alteration and Mineralization of the Iron Oxide (-Cu-Au) Santo Domingo Sur Deposit, Atacama Region, Northern Chile: unpublished M.Sc. thesis, University of Arizona, Tucson, Arizona, United States, 90 p.
Decreto Supremo DS 95/2001: Reglamento del Sistema de Evaluación de Impacto Ambiental, Ministerio Secretaria General de la Presidencia.
Duran, M., 2008: Paragenesis of the Santo Domingo Sur Iron Oxide-Copper-Gold Deposit, Northern Chile: unpublished M.Sc. thesis, Queen’s University, Kingston, Ontario, Canada, 100 p.
Santo Domingo Project Region III, Chile
NI 43-101 Technical Report
Page 27-3
March 2020
Project Number: C40029
Energy Transition, 2018: Is An Energy Revolution Underway in Chile?: https://energytransition.org/2018/07/is-an-energy-revolution-underway-in-chile/.
Fraser Institute Survey, 2020: Fraser Institute Annual Survey of Mining Companies 2019: https://www.fraserinstitute.org/sites/default/files/annual-survey-of-mining-companies-2019.pdf.
Ghisolfo document, Estudio Definitivo De Factibilidad Estudio De Transporte De Concentrado De Cobre Proyecto Santo Domingo, 31 October 2018.
Ghisolfo document: 20180927 CAPEX REV 09, Actualización de Capex, Caminos y Accesos Santo Domingo, 2018
Godoy, E., and Lara, L., 1998: Hoja Quebrada Salitrosa. Región de Atacama. Mapa Geológico No. 4, escala 1:100,000: Servicio Nacional de Geología y Minería, Santiago.
Groves, D.I., Bierlein, F.P., Meinert, L.D. and Hitzman, M.W., 2010: Iron Oxide Copper-Gold (IOCG) Deposits through Earth History: Implications for Origin, Lithospheric Setting, and Distinction from Other Epigenetic Iron Oxide Deposits: Economic Geology, v. 105, no. 3, pp 641–654.
Hitzman, M. W., 2000: Iron Oxide-Cu-Au Deposits: What, Where, When and Why: in Porter, T.M. (ed.), Hydrothermal Iron Oxide Copper–Gold & Related Deposits: A Global Perspective: Australian Mineral Foundation, Adelaide, pp. 9–25.
Hopper, D., and Correa, A., 2000: The Panulcillo and Teresa de Colmo Copper Deposits: Two Contrasting Examples of Fe-Ox Cu-Au Mineralisation from the Coastal Cordillera of Chile, in Porter, T.M. (ed.) Hydrothermal Iron Oxide Copper–Gold & Related Deposits: A Global Perspective: Australian Mineral Foundation, Adelaide, pp. 177–189.
International Commission on Large Dams (ICOLD): Tailings Dams and Seismicity - Review and Recommendations, Bulletin 98 (ICOLD 1995).
ISO Standard 12162:1995. Jordan, J., and Mitchell, T., 2003: Geophysical Report on the Gravity, Ground Magnetic,
Induced Polarization and Resistivity Surveys conducted on the Candelaria Project, Region III, Chile: unpublished internal report prepared for Far West Mining Ltd. by Quantec Geofísica Ltda. of Antofagasta, Chile.

Santo Domingo Project Region III, Chile
NI 43-101 Technical Report
Page 27-4
March 2020
Project Number: C40029
Knight Piésold, 2013. Minera Santo Domingo, Santo Domingo Project, Tailings Storage Facility - Feasibility Design, Final Report, Ref. No. SA202-00156/09-11010 Rev. 0.
Knight Piésold document number SA202-0015609.10010_Rev_4.1, Estimación de Costos, 2018.
Lacroix, P. A., 2006: Technical Report on the 4A (Santo Domingo) Area of the Candelaria Project, Region III, Chile: report prepared for Far West Mining Ltd., 13 June 2006.
Lacroix, P.A., 2009: Technical Report on the Santo Domingo Property, Region III, Chile: report prepared for Far West Mining Ltd., 4 June 2009.
Lacroix, P. A., and Rennie, D. W., 2007: Technical Report on the 4A (Santo Domingo) Area of the Candelaria Project, Region III, Atacama Province, Chile: report prepared for Far West Mining Ltd., 19 October 2007.
Lang, J. R., 2003: The Candelaria Project: A Regional Exploration Program for Iron-Oxide Cu-Au Deposits in the Chilean Fe-Cu Belt: report prepared for Far West Mining Ltd.
Lang, J. R., 2003: Petrographic Descriptions and SEM Analysis of 34 Samples: Anomalies 4c3 and 4c9, and the Manto Verde Fault and Candelaria Deposits, Chile: internal report for Far West Mining Ltd., 12 June 2003.
Lang, J. R., 2003: Optical and SEM Petrography of Alteration and Ore Minerals in Seven Grain Mounts: Drillhole 4c3-03-001, Santa Teresita Area, Chile: unpublished internal report for Far West Mining Ltd., 11 November 2003.
Ley 19.300 de Bases Generales de Bases del Medio Ambiente: que comprende las modificaciones que le fueran introducidas mediante la Ley 20.417.
Mark, G., Oliver, N. H. S., Williams, P. J., Valenta, R. K., and Crookes, R. A., 2000: The evolution of the Ernest Henry Fe-oxide-(Cu-Au) hydrothermal system: in Porter, T.M., (ed)., Hydrothermal iron oxide copper-gold and related deposits: A global perspective: PGC Publishing, Adelaide, Volume 1, pp. 123–136.
Marschik, R., 2001: The Candelaria-Punta del Cobre Iron Oxide Cu-Au (-Zn-Ag) Deposits, Chile: Economic Geology, Volume 96, 2001, pp. 1799–1826.
Marschik, R., Leveille, R., and Martin, W., 2000: La Candelaria and the Punta del Cobre District, Chile: Early Cretaceous Iron-Oxide Cu-Au (-Zn-Ag) Mineralization: in

Santo Domingo Project Region III, Chile
NI 43-101 Technical Report
Page 27-5
March 2020
Project Number: C40029
Porter, T.M. (ed.), Hydrothermal Iron Oxide Copper-Gold & Related Deposits: A Global Perspective, Australian Mineral Foundation, Adelaide, pp. 163–175.
Marschik, R., and Fontboté, L., 2001: The Punta del Cobre Formation, Punta del Cobre-Candelaria area, northern Chile: Journal of South American Earth Sciences 14 (2001), pp. 401–433.
Mathur, R., Marschik, R., Ruiz, J., Munizaga, F., Leveille, R., and Martin, W., 2002: Age of Mineralization of the Candelaria Fe Oxide Cu-Au Deposit and the Origin of the Chilean Iron Belt, Based on Re-Os Isotopes: Economic Geology, Volume 97, 2002, pp. 59–71.
McLennan, V., 2018: Review of QAQC Data for Cobalt in the Santo Domingo Drilling Database, unpublished internal memo to Capstone Mining Corp., 5 p.
Ménard, J. J., 1995: Relationship between Altered Pyroxene Diorite and the Magnetite Mineralization in the Chilean Iron Belt, with Emphasis on the El Algarrobo Iron Deposits (Atacama region, Chile): Mineralium Deposita, Volume 30, pp. 268–274.
Mining Association of Canada (MAC) Guide to the Management of Tailings Facilities (MAC 1998).
Ministerio de Minería, Diario Oficial de la República de Chile: “Decreto Supremo Nº 248” Reglamento para la aprobación de Proyectos de Diseño, Construcción, Operación y Cierre de los Depósitos de Relave, (11 Abril 2007).
Moray Energy Consulting, 2018: Análisis de Largo Plazo para el Sistema Eléctrico Nacional de Chile Considerando Fuentes de Energía Variables e Intermitentes.
National Statistics Institute (INE): 2002 National Population and Housing Census and Projected Population 1990–2020.
PRDW document number C2151-2-BG-CS-001-RF and C2151-2-BG-CS-002-RE, Actualización Capex y Opex Puerto Santo Domingo, 2018.
Rennie, D. W., 2010: Technical Report on the Santo Domingo Property, Region III, Chile: report prepared for Far West Mining Ltd., 26 August 2010, 170 p.
Ross, K. V., 2005: Petrographic Study of the 4a3 Santo Domingo Area, Candelaria Project, Northern Chile: internal report prepared by Panterra Geoservices Inc. for Far West Mining Ltd., 16 May 2005.

Santo Domingo Project Region III, Chile
NI 43-101 Technical Report
Page 27-6
March 2020
Project Number: C40029
Segerstrom, K., 1960: Structural Geology of an area east of Copiapo, Atacama Province, Chile: Reports of the XXI International Geological Congress Part XVIII, pp. 14–20, Copenhagen – Denmark.
Sernageomin, 2018: Guía Metodológica De Cálculo, Determinación, y Disposición De La Garantía Financiera Que Establece La Ley 20.551, Que Regula El Cierre De Faenas e Instalaciones Mineras.
SGS Lakefield Research Limited, Canada, 2009: Various unpublished reports regarding testing of SDS and Iris samples for copper flotation prepared for Far West Mining Ltd., April–May 2009.
Sillitoe, R.H., 2003: Iron Oxide-Copper-Gold Deposits: an Andean View: Mineralium Deposita, vol 38, pp. 787–812.
Studien-Gesellschaft für Eisenerz-Aufbereitung (SGA), 2009: Various unpublished reports regarding testing of SDS and Iris samples for iron recovery prepared for Far West Mining Ltd., March and April 2009.
Trotter, D.J., 2018: Pellet Feed Market Characterization and Forward Pricing Outlook for Capstone Mining Corporation: September 2018.
Ullrich, T. D., and Clark, A. H., 1998: Evolution of the Candelaria Cu-Au deposit, III region, Chile: Geological Society of America, Annual Meeting: Toronto, pp. A-75.
Varas, J. P., 2003: Technical Report on the Candelaria Project, An Iron Oxide Copper Gold Project in the Candelaria Copper Belt of Northern Chile: report prepared for Far West Mining Ltd.
Vila, T., Lindsay, N., and Zamora, R., 1996: Geology of the Manto Verde copper deposit, Northern Chile: A Specularite-Rich, Hydrothermal-Tectonic Breccia Related to the Atacama Fault Zone: in “Andean Copper Deposits: New Discoveries, Mineralization, Styles and Metallogeny”, Soc. Econ. Geologists Special Publication No. 5, Camus, F., Sillitoe, R.H. and Petersen, R., eds., pp. 157–170.
Wood Technical Memorandum, Capex Review Update for NI-43-101, 23 November 2018.
Zamora, R., and Castillo, B., 2000: Mineralización de Fe-Cu-Au en el Distrito Mantoverde, Cordillera de la Costa, III Región de Atacama, Chile.