sap leading the digital transformation · pdf filesap –leading the digital...
TRANSCRIPT
SAP – Leading the Digital Transformation
Richard McLean Regional CFO, SAP Asia Pacific Japan Morgan Stanley 2017 Annual Asia Pacific SummitNovember 15, 2017

2© 2017 SAP SE or an SAP affiliate company. All rights reserved.
Any statements contained in this document that are not historical facts are forward-looking statements as defined in the U.S. Private Securities Litigation Reform Act of 1995. Words such as “anticipate,” “believe,” “estimate,” “expect,” “forecast,” “intend,” “may,” “plan,” “project,” “predict,” “should” and “will” and similar expressions as they relate to SAP are intended to identify such forward-looking statements. SAP undertakes no obligation to publicly update or revise any forward-looking statements. All forward-looking statements are subject to various risks and uncertainties that could cause actual results to differ materially from expectations. The factors that could affect SAP’s future financial results are discussed more fully in SAP’s filings with the U.S. Securities and Exchange Commission (“SEC”), including SAP’s most recent Annual Report on Form 20-F filed with the Securities and Exchange Commission. Readers are cautioned not to place undue reliance on these forward-looking statements, which speak only as of their dates.
Safe Harbor Statement

3© 2017 SAP SE or an SAP affiliate company. All rights reserved.
Agenda
An introduction to SAP
Helping customers win in the new digital economy
SAP’s long-term financial ambition
Why invest in SAP

4© 2017 SAP SE or an SAP affiliate company. All rights reserved.
Percent Global 2000 that Run SAP
25+industries
~365,000customers
A compelling customer base Unmatched vertical expertise
The world’s leading business software company

5© 2017 SAP SE or an SAP affiliate company. All rights reserved.
In APJ, we are driving sustainable growth in Rising Asia
42 offices in31 countries
18,000 employees
37,000 customers
2,700 partners
28 years in region APJ vision 2020 Deep industry expertise
▪ Financial Services▪ Consumer Products▪ Public Services▪ Telecommunications
▪ Energy & Resources▪ Discrete Manufacturing▪ Services/Media
▪ Sports & Entertainment▪ Healthcare
Employerof Choice
SME Focus
#1 in Cloud
DX Leadership
Customers for Life
Social Impact

6© 2017 SAP SE or an SAP affiliate company. All rights reserved.
Helping customers in APJ run better and grow sustainably

7© 2017 SAP SE or an SAP affiliate company. All rights reserved.
Agenda
An introduction to SAP
Helping customers win in the new digital economy
SAP’s long-term financial ambition
Why invest in SAP

8© 2017 SAP SE or an SAP affiliate company. All rights reserved.
In the age of digital disruption, companies need to transform to thrive
The most rooms booked. No properties owned 2B+ rides.
0 cars owned
80M subscribers watching 10B hours per month From apparel
company to fitness platform
From traditional luxury retailer to personalized digital experiences
From Tractor manufacturing to Smart Farming
From traditional motorcycles to building highly customized vehicles

9© 2017 SAP SE or an SAP affiliate company. All rights reserved.
SAP Cloud Platform is THE Digital Business Platform
Best in Class
Line of business and industry capabilities
Vibrant Ecosystem
Providing complementary solutions
End-to-End and Integrated
Broadest portfolio and out-of-the-box integrations
Scalable and Flexible
Modular approach to digital transformation
CustomerExperience
IoT& Supply Chain
WorkforceEngagement
SpendManagement
BusinessTransactions
Digital Core
IntelligentInsights
SAP HANA SAP Cloud Platform

10© 2017 SAP SE or an SAP affiliate company. All rights reserved.
SAP Digital Boardroom provides integrated real-time dataOne source of truth
Total Transparency
Across entire business operations and all SAP apps from Digital core to LoB apps
Rapid Time to Value
Leveraging predefined best practices and prebuilt integrations for fast deployment
Instant Data-Driven Insights
Ability to drive ad hoc analyses and simulation in real-time leveraging SAP BusinessObjects Cloud
Financials
Procurement
Payroll & Headcount
Contingent Labor
Sales & Marketing
Travel & Entertainment

11© 2017 SAP SE or an SAP affiliate company. All rights reserved.
Solution Ideation & Vision Global Leonardo Design Thinking and Innovation to ideate on new business models
Rapid PrototypingBring ideas to life, leveraging SAP Innovations (e.g. Machine Learning, IoT) on the SAP Cloud Platform
Digital Blueprint Create a Technology Roadmap, Identify Dependencies & Remediate Risks
Solution Accelerators Leverage industry expertise and SAP Business Content to accelerate implementation of prototypes
SAP Leonardo enables companies to re-imagine new business modelsTurns systems of record into systems of intelligence - gives customers the ability to sense, analyze, and respond

12© 2017 SAP SE or an SAP affiliate company. All rights reserved.
Agenda
An introduction to SAP
Helping customers win in the new digital economy
SAP’s long-term financial ambition
Why invest in SAP

13© 2017 SAP SE or an SAP affiliate company. All rights reserved.
39%
61%
€22.1bn
2016
70-75%
25-30%€28–29bn
2020ambition
+9pp to +14pp
Support + Cloud subscriptions revenue as share of total revenue All other revenue
Pushing towards a larger more predictable business
All figures are non-IFRS
14© 2017 SAP SE or an SAP affiliate company. All rights reserved.
20152016
2017
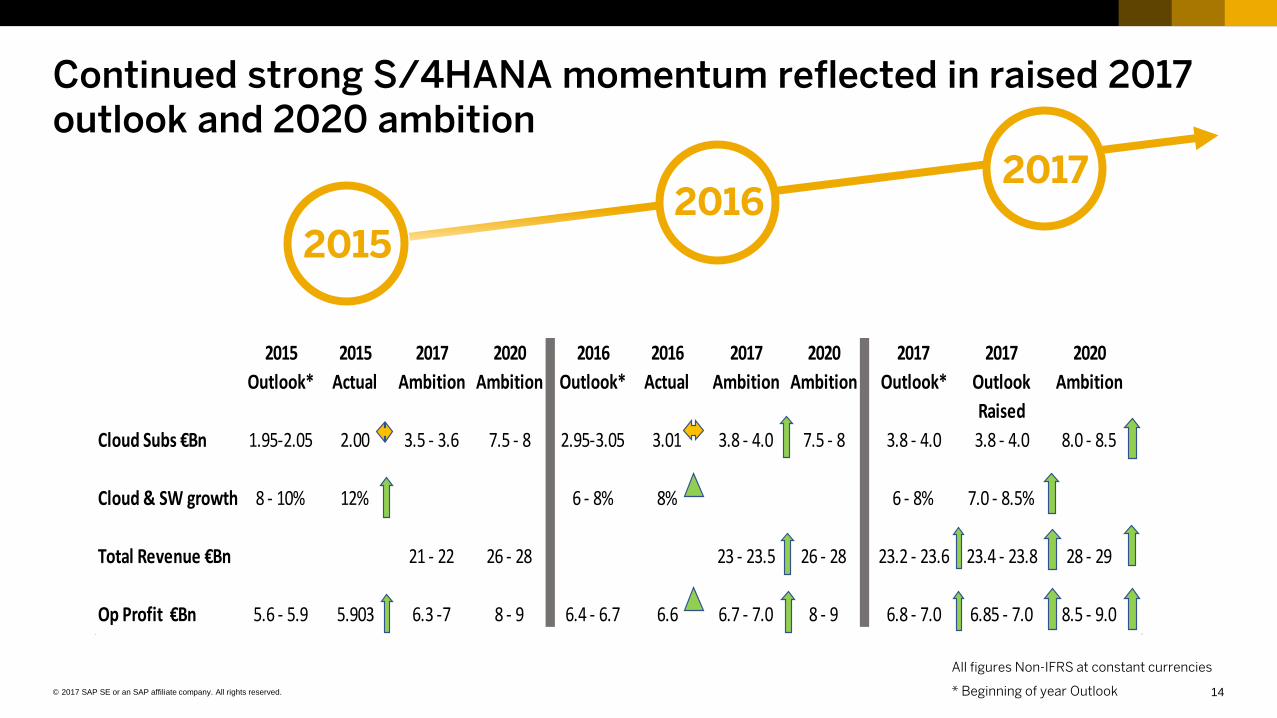
All figures Non-IFRS at constant currencies
* Beginning of year Outlook
2015 2015 2017 2020 2016 2016 2017 2020 2017 2017 2020
Outlook* Actual Ambition Ambition Outlook* Actual Ambition Ambition Outlook* Outlook Ambition
Raised
Cloud Subs €Bn 1.95-2.05 2.00 3.5 - 3.6 7.5 - 8 2.95-3.05 3.01 3.8 - 4.0 7.5 - 8 3.8 - 4.0 3.8 - 4.0 8.0 - 8.5
Cloud & SW growth 8 - 10% 12% 6 - 8% 8% 6 - 8% 7.0 - 8.5%
Total Revenue €Bn 21 - 22 26 - 28 23 - 23.5 26 - 28 23.2 - 23.6 23.4 - 23.8 28 - 29
Op Profit €Bn 5.6 - 5.9 5.903 6.3 -7 8 - 9 6.4 - 6.7 6.6 6.7 - 7.0 8 - 9 6.8 - 7.0 6.85 - 7.0 8.5 - 9.0
Continued strong S/4HANA momentum reflected in raised 2017 outlook and 2020 ambition

15© 2017 SAP SE or an SAP affiliate company. All rights reserved.
Driving increased profitability Highly profitable cloud business in the long term
2016 2018 – 2020
▪ Mix shift effects
▪ Cloud investments
▪ Services margin dampened by strategic co-innovation
▪ Cloud investments paying off. Highly standardized “converged platform” drives:
Gross margin improvement
R&D leverage (away from “any DB”)
▪ Cloud overtakes software
▪ Efficiency in each business improving and cost ratios start to improve
▪ Cloud at scale contributes to profit acceleration through increased share of renewal base
2017
▪ Mix shift effects
▪ Cloud investments
▪ Services margin improving

16© 2017 SAP SE or an SAP affiliate company. All rights reserved.
Agenda
An introduction to SAP
Helping customers win in the new digital economy
SAP’s long-term financial ambition
Why invest in SAP

18© 2017 SAP SE or an SAP affiliate company. All rights reserved.
SAP’s innovation leadership is helping customers win in the digital economy▪ SAP runs the world’s mission-critical business processes
and is perfectly positioned at the top of the IT stack –close to the end user where the business value is generated
▪ In addition, SAP has developed the most advanced in-memory platform available today: SAP HANA
▪ SAP is in the early stages of a powerful multi-year innovation cycle with SAP S/4HANA as the digital core coupled with the most comprehensive, best-in-class cloud & network portfolio
▪ SAP offers choice of deployment model (cloud, on premise or hybrid) and seamless integration
▪ SAP Leonardo’s combination of tools powered by HANA helps customers to become intelligent enterprises
SummaryWhy invest in SAP
SAP is outpacing the market▪ SAP’s broad global footprint provides resilience in an
uncertain world
▪ Powerful combination of a rapidly expanding cloud business and a growing core
▪ Successful business transformation – improve efficiency and effectiveness in each and every business
▪ Growing overall operating profit even as we continue to hire in fast growth areas such as S/4HANA, HCM, CEC, SAP Cloud Platform (PaaS), Networks, SAP Leonardo (IoT, AI/Machine Learning, Blockchain, Big Data etc)
SAP is pushing relentlessly towards a much more predictable business in the long term

Thank You
Richard McLean Regional CFO, SAP Asia Pacific Japan Morgan Stanley 2017 Annual Asia Pacific SummitNovember 15, 2017

20© 2017 SAP SE or an SAP affiliate company. All rights reserved.
Appendix
21© 2017 SAP SE or an SAP affiliate company. All rights reserved.
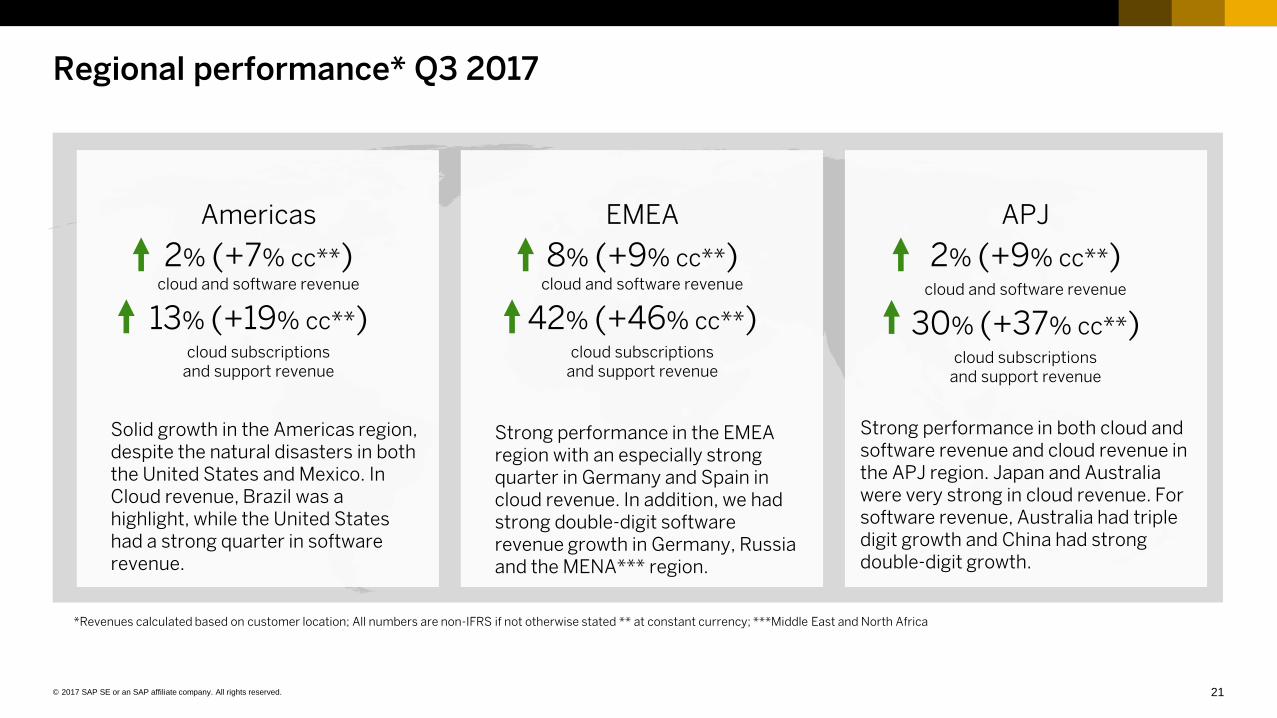
Regional performance* Q3 2017
Strong performance in the EMEA region with an especially strong quarter in Germany and Spain in cloud revenue. In addition, we had strong double-digit software revenue growth in Germany, Russia and the MENA*** region.
Strong performance in both cloud and software revenue and cloud revenue in the APJ region. Japan and Australia were very strong in cloud revenue. For software revenue, Australia had triple digit growth and China had strong double-digit growth.
Solid growth in the Americas region, despite the natural disasters in both the United States and Mexico. In Cloud revenue, Brazil was a highlight, while the United States had a strong quarter in software revenue.
*Revenues calculated based on customer location; All numbers are non-IFRS if not otherwise stated ** at constant currency; ***Middle East and North Africa
EMEA
8% (+9% cc**)cloud and software revenue
42% (+46% cc**)cloud subscriptions
and support revenue
Americas
2% (+7% cc**)cloud and software revenue
13% (+19% cc**)cloud subscriptions
and support revenue
APJ
2% (+9% cc**)cloud and software revenue
30% (+37% cc**)cloud subscriptions
and support revenue

22© 2017 SAP SE or an SAP affiliate company. All rights reserved.
Q3 2017 – Another strong quarter in our rock solid core business and fast growing cloud business, despite severe currency headwinds
€ millions, unless otherwise stated IFRS Non-IFRS
Revenue Numbers Q3/17 Q3/16 ∆ % Q3/17 Q3/16 ∆ % ∆ % at cc
Cloud subscriptions and support 937 769 22 938 769 22 27
Software licenses 1,033 1,034 0 1,033 1,034 0 3
Software support 2,687 2,653 1 2,687 2,653 1 4
Software licenses and support 3,720 3,686 1 3,720 3,687 1 4
Cloud and software 4,657 4,455 5 4,658 4,456 5 8
Services 932 920 1 932 920 1 5
Total revenue 5,590 5,375 4 5,590 5,375 4 8
Total operating expenses -4,276 -4,272 0 -3,953 -3,738 6 9
Operating profit 1,314 1,103 19 1,637 1,638 0 4
Financial income, net 73 -46 <-100 73 -46 <-100
Profit before tax 1,390 1,013 37 1,714 1,548 11
Income tax expense -398 -288 38 -500 -459 9
Profit after tax 993 725 37 1,214 1,089 11
Operating margin (in %) 23.5 20.5 3.0pp 29.3 30.5 -1.2pp -0.9pp
Earnings per share, basic (in €) 0.82 0.61 35 1.01 0.91 10

23© 2017 SAP SE or an SAP affiliate company. All rights reserved.
9M 2017 – Our overall strong business performance led to an improved share of more predictable business, now at a 66% share of revenue
€ millions, unless otherwise stated IFRS Non-IFRS
Revenue Numbers 9M/17 9M/16 ∆ % 9M/17 9M/16 ∆ % ∆ % at cc
Cloud subscriptions and support 2,775 2,166 28 2,775 2,168 28 28
Software licenses 2,814 2,682 5 2,814 2,685 5 5
Software support 8,154 7,815 4 8,154 7,815 4 4
Software licenses and support 10,968 10,497 4 10,968 10,500 4 4
Cloud and software 13,742 12,663 9 13,743 12,668 8 8
Services 2,914 2,675 9 2,914 2,675 9 8
Total revenue 16,656 15,339 9 16,657 15,343 9 8
Total operating expenses -13,743 -12,154 13 -12,252 -11,085 11 10
Operating profit 2,913 3,184 -9 4,405 4,258 3 3
Financial income, net 59 -105 <-100 59 -105 <-100
Profit before tax 2,966 2,900 2 4,458 3,973 12
Income tax expense -777 -792 -2 -1,238 -1,142 8
Profit after tax 2,189 2,108 4 3,220 2,832 14
Operating margin (in %) 17.5 20.8 -3.3pp 26.4 27.8 -1.3pp -1.2pp
Earnings per share, basic (in €) 1.81 1.77 3 2.67 2.37 13

24© 2017 SAP SE or an SAP affiliate company. All rights reserved.
Balance sheet, condensedSeptember 30, 2017, IFRS
Assets€ millions
09/30/17 12/31/16
Cash, cash equivalents and other financial assets
5,233 4,826
Trade and other receivables 4,869 5,924
Other non-financial assets 1,117 814
Total current assets 11,219 11,564
Goodwill 21,353 23,311
Intangible assets 3,038 3,786
Property, plant, and equipment 2,806 2,580
Other non-current assets 3,016 3,037
Total non-current assets 30,212 32,713
Total assets 41,430 44,277
Equity and liabilities€ millions
09/30/17 12/31/16
Trade and other payables 1,089 1,281
Provisions 266 183
Other liabilities 4,621 5,827
Deferred income, current1) 3,531 2,383
Total current liabilities 9,507 9,674
Financial liabilities 5,811 6,481
Provisions 211 217
Deferred income, non-current1) 84 143
Other non-current liabilities 1,447 1,365
Total non-current liabilities 7,553 8,205
Total liabilities 17,060 17,880
Total equity 24,370 26,397
Total equity and liabilities 41,430 44,277
1) SAP is in the final stage of migrating its processes and customer contracts to IFRS 15. At this point of the migration, there is no reliable way to report deferred cloud revenue any longer, therefore the separate disclosure of the cloud portion of deferred income is discontinued. SAP will continue to disclose new cloud bookings as the key metric to measure SAP’s sales success in the cloud.
25© 2017 SAP SE or an SAP affiliate company. All rights reserved.
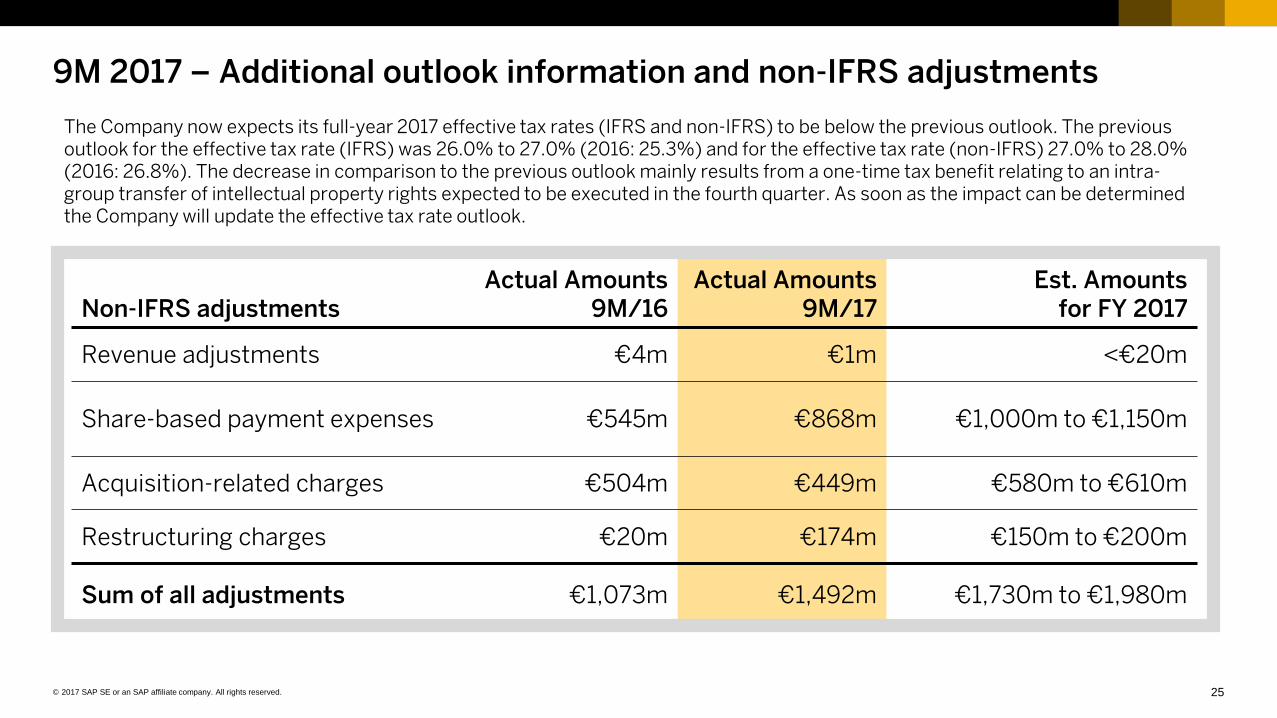
Non-IFRS adjustmentsActual Amounts
9M/16Actual Amounts
9M/17Est. Amounts
for FY 2017
Revenue adjustments €4m €1m <€20m
Share-based payment expenses €545m €868m €1,000m to €1,150m
Acquisition-related charges €504m €449m €580m to €610m
Restructuring charges €20m €174m €150m to €200m
Sum of all adjustments €1,073m €1,492m €1,730m to €1,980m
9M 2017 – Additional outlook information and non-IFRS adjustments
The Company now expects its full-year 2017 effective tax rates (IFRS and non-IFRS) to be below the previous outlook. The previous outlook for the effective tax rate (IFRS) was 26.0% to 27.0% (2016: 25.3%) and for the effective tax rate (non-IFRS) 27.0% to 28.0% (2016: 26.8%). The decrease in comparison to the previous outlook mainly results from a one-time tax benefit relating to an intra-group transfer of intellectual property rights expected to be executed in the fourth quarter. As soon as the impact can be determined the Company will update the effective tax rate outlook.