sap raises outlook backed by outstanding s/4hana · pdf file2 sap q3 2017 quarterly statement...
TRANSCRIPT

SAP Q3 2017 Quarterly Statement 1
Cloud Subscriptions & Support Revenue
in € millions
IFRS Non-IFRS
937 938 +22% +22% (+27% cc)
Total Revenue
in € millions
IFRS Non-IFRS
5,590 5,590 +4% +4% (+8% cc)
Share of Predictable Revenue
in percent
Q3 2017
65% +1 p.p.
4,455 4,456
4,657 4,658
IFRS Non-IFRS
Cloud & Software Revenuein € millions
Q3/16 Q3/17
+5% (+8% cc)+5%
1,1031,6381,314 1,637
IFRS Non-IFRS
Operating Profitin € millions
Q3/16 Q3/17
19% 0% (+4% cc)
SAP Raises Outlook Backed by Outstanding S/4HANA Momentum Digital core business soars with over 6,900 S/4HANA customers – around 70% growth year over year
Continued strong business performance despite significant currency headwinds
Software revenue stable (IFRS) and up 3% (Non-IFRS at constant currencies)
Cloud subscriptions and support revenue up 22% (IFRS) and up 27% (Non-IFRS at constant currencies)
EPS up 35% (IFRS) and up 10% (Non-IFRS)
On track to execute €500 million share buy back by year end, €288 million bought back in Q3
SAP Q3 2017 Quarterly Statement
Bill McDermott, CEO Luka Mucic, CFO
"SAP has evolved from the world's system of record to the platform for the digital revolution. Led by S/4HANA, we are delivering intelligent business applications built on the most data rich architecture ever created. We see growth in every corner of the business, which is why we are again raising our guidance for the full year.”
“I am very pleased that we continue to have excellent software revenue and that non-IFRS earnings per share are up again double-digit. We now expect a strong non-IFRS earnings per share performance for the entire year. Our performance, portfolio and pipeline make me truly confident that we will deliver on our mid-term ambitions.”

2 SAP Q3 2017 Quarterly Statement
Walldorf, Germany – October 19, 2017
SAP SE (NYSE: SAP) today announced its financial results for the third quarter 2017 ended September 30, 2017.
Business Highlights
Financial Highlights
Third Quarter 2017
SAP’s fast revenue growth in the cloud continued in the third quarter. New cloud bookings1 grew by 14% (19% at constant
currencies) in the third quarter and reached €302 million. IFRS cloud subscriptions and support revenue grew 22% year over year to
€937 million and non-IFRS cloud subscriptions and support revenue grew 22% year over year (27% at constant currencies) to €938
million. IFRS and non-IFRS software revenue was €1.03 billion, stable year over year (up 3% at constant currencies). New cloud and
software license order entry2 grew by 15% year over year in the third quarter. IFRS and non-IFRS cloud and software revenue was
€4.66 billion, an increase of 5% (8% at constant currencies). SAP’s “predictable revenue”, i.e. the total of cloud subscriptions &
support revenue and software support revenue, was 65% of total revenue, up 1 percentage point year over year.
IFRS operating profit was up 19% to €1.3 billion. Non-IFRS operating profit was stable at €1.64 billion (up 4% at constant
currencies). IFRS earnings per share increased 35% to €0.82. Non-IFRS earnings per share increased 10% to €1.01.
Operating cash flow for the first nine months was €4.13 billion, an increase of 14% year over year. Free cash flow increased 7% year
over year to €3.16 billion. At quarter end, net debt was €1.71 billion, an improvement of €2 billion year over year. SAP’s strong
growth and cash generation provide significant flexibility around capital allocation aimed at driving shareholder value. Consistent
with the Company’s announcement in the second quarter, SAP is on track to buy back €500 million in shares. As of the end of the
third quarter, the company has bought back €288 million.
SAP S/4HANA
With S/4HANA customers can massively simplify their IT landscape, run live and reinvent their business model for the digital
economy across both cloud and on-premise deployments. S/4HANA adoption grew to more than 6,900 customers, up around 70%
year over year. In the third quarter, approximately 600 additional customers signed up of which more than 40% were net new.
S/4HANA continues to be adopted by the most forward thinking global companies, including Shell and China International Marine
Containers.
SAP Leonardo
SAP Leonardo brings together deep process and industry expertise, advanced design thinking methodology and cutting edge
software capabilities such as IoT, Big Data, Machine Learning, Analytics, and Blockchain. SAP Leonardo is about orchestrating these
disruptive capabilities to create completely new ways of working and new business models. Hanon Systems (Korea) and Citco
Technology Management (USA) among many others adopted SAP Leonardo solutions in the third quarter to redefine their
businesses and become intelligent enterprises.
1 New cloud bookings is the total of all orders received in a given period the revenue from which is expected to be classified as cloud subscription and support revenue and that result from purchases by new customers and from
incremental purchases by existing customers. Consequently, orders to renew existing contracts are not included in this metric. The order amount must be committed. Consequently, due to their pay-per-use nature, business
network transaction fees which do not include a committed minimum consumption are not reflected in the bookings metric (e.g. SAP Ariba and SAP Fieldglass transaction-based fees). Amounts included in the measures are
generally annualized (annualized contract value ACV). 2 New cloud and software license order entry is the total of new cloud order entry and software license order entry. The new cloud order entry metric is identical to the new cloud bookings metric defined above except that it
considers the total contract value (TCV) of the orders where the new cloud bookings metric considers the orders’ annualized contract value (ACV). Software license order entry is the total of all orders received in a given
period, the revenue from which is expected to be classified as software license revenue. The support services commonly sold with the software licenses are not included in the software license order entry metric.
SAP Q3 2017 Quarterly Statement 3
Human Capital Management
With SuccessFactors and Fieldglass, SAP delivers total workforce management across both permanent and contingent labor,
localized for 84 countries and 42 languages. SuccessFactors Employee Central, which is the core of our HCM offering, had more
than 2,000 customers at the end of the third quarter. SAP SuccessFactors was named a leader in Forrester Research Inc.’s “The
Forrester Wave™: SaaS Human Resource Management Systems, Q3 2017.” La Liga (Spanish Football League) and Bancolombia, the
largest commercial bank in Colombia, selected SAP’s workforce management solutions in the third quarter to deliver unified, high-
quality employee experiences.
Customer Engagement and Commerce
SAP’s next generation customer engagement solutions enable businesses to manage their front office across the entire spectrum
from marketing to sales to services – seamlessly and in real-time. Businesses get a single view of their customer – be it social, retail
or e-commerce. SAP’s Customer Engagement and Commerce (CEC) solutions serve both B2C and B2B across a wide range of
industries, including retail, telco, financial services, manufacturing and the public sector. SAP’s CEC solutions once again achieved
double-digit growth in new cloud bookings and software revenue. In September, SAP announced that it would acquire Gigya. This
will further enhance SAP’s CEC solutions by allowing companies to better manage customers’ profile, preference, opt-in and
consent settings, with customers maintaining control of their data at all times.
Business Networks
Each of SAP's business network solutions provides a rich, open, global platform that connects a large ecosystem of customers,
suppliers, partners and developers delivering ever expanding content and innovation. On the Ariba Network, approximately 3 million
companies in over 180 countries collaborate and trade around $1 trillion in goods and services annually. Concur helps close to 50
million end users effortlessly process travel and expenses. With SAP Fieldglass customers manage over 3.9 million contingent
workers in more than 180 countries. Total revenue in the SAP Business Network segment was up 19% in the third quarter to €578
million at constant currencies.
Regional Revenue Performance in the Third Quarter 2017
SAP had a strong performance in the EMEA region with cloud and software revenue increasing 8% (IFRS) and 9% (non-IFRS
constant currencies). Cloud subscriptions and support revenue grew by 42% (IFRS) and 46% (non-IFRS at constant currencies)
with an especially strong quarter in Germany and Spain. In addition, SAP had strong double-digit software revenue growth in
Germany, Russia and the Middle East & North Africa (MENA) region.
The Company had solid growth in the Americas region, despite the natural disasters that plagued both the United States and
Mexico. Cloud and software revenue grew by 2% (IFRS) and 7% (non-IFRS constant currencies). Cloud subscriptions and support
revenue increased by 13% (IFRS) and 19% (non-IFRS at constant currencies). In Cloud subscriptions and support revenue Brazil
was a highlight, while the United States had a strong quarter in software revenue.
In the APJ region, SAP had a strong performance in both cloud and software revenue and cloud subscriptions and support revenue.
Cloud and software revenue was up 2% (IFRS) and 9% (non-IFRS constant currencies). Cloud subscriptions and support revenue
grew by 30% (IFRS) and 37% (non-IFRS at constant currencies). Japan and Australia were very strong in cloud subscriptions and
support revenue. For software revenue, Australia had triple digit growth and China had strong double-digit growth.

4 SAP Q3 2017 Quarterly Statement
Financial Results at a Glance
Third Quarter 20171)
IFRS Non-IFRS2)
€ million, unless otherwise stated Q3 2017 Q3 2016 ∆ in % Q3 2017 Q3 2016 ∆ in % ∆ in % const.
curr.
New Cloud Bookings3) N/A N/A N/A 302 265 14 19
Cloud subscriptions and support 937 769 22 938 769 22 27
Software licenses and support 3,720 3,686 1 3,720 3,687 1 4
Cloud and software 4,657 4,455 5 4,658 4,456 5 8
Total revenue 5,590 5,375 4 5,590 5,375 4 8
Share of predictable revenue (in %) 65 64 1pp 65 64 1pp
Operating profit 1,314 1,103 19 1,637 1,638 0 4
Profit after tax 993 725 37 1,214 1,089 11
Basic earnings per share (€) 0.82 0.61 35 1.01 0.91 10
Number of employees (FTE, September 30) 87,874 82,426 7 N/A N/A N/A N/A
Nine months ended September 20171)
IFRS Non-IFRS2)
€ million, unless otherwise stated Q1–Q3 2017
Q1–Q3 2016
∆ in % Q1–Q3 2017
Q1–Q3 2016
∆ in % ∆ in % const.
curr.
New Cloud Bookings3) N/A N/A N/A 857 664 29 30
Cloud subscriptions and support 2,775 2,166 28 2,775 2,168 28 28
Software licenses and support 10,968 10,497 4 10,968 10,500 4 4
Cloud and software 13,742 12,663 9 13,743 12,668 8 8
Total revenue 16,656 15,339 9 16,657 15,343 9 8
Share of predictable revenue (in %) 66 65 1pp 66 65 1pp
Operating profit 2,913 3,184 –9 4,405 4,258 3 3
Profit after tax 2,189 2,108 4 3,220 2,832 14
Basic earnings per share (€) 1.81 1.77 3 2.67 2.37 13
Number of employees (FTE, September 30) 87,874 82,426 7 N/A N/A N/A N/A
1) All figures are unaudited.
2) For a detailed description of SAP’s non-IFRS measures see Explanation of Non-IFRS Measures online. For a breakdown of the individual adjustments see table
“Non-IFRS Adjustments by Functional Areas” in this Quarterly Statement.
3) As this is an order entry metric, there is no IFRS equivalent.
Due to rounding, numbers may not add up precisely.
SAP Q3 2017 Quarterly Statement 5
Business Outlook 2017
The Company is raising its outlook for the full year 2017:
– Based on the strong momentum in SAP’s cloud business, the Company continues to expect full year 2017 non-IFRS cloud
subscriptions and support revenue to be in a range of €3.8 billion to €4.0 billion at constant currencies (2016: €2.99 billion).
– Due to increasing adoption of S/4HANA and our Digital Business Platform the Company now expects full year 2017 non-IFRS
cloud & software revenue to increase by 7.0% to 8.5% at constant currencies (2016: €18.43 billion). The lower end of the range
was previously 6.5%.
– The Company now expects full year 2017 non-IFRS total revenue in a range of €23.4 billion to €23.8 billion at constant currencies
(2016: €22.07 billion). The previous range was €23.3 billion to €23.7 billion at constant currencies.
– The Company now expects full-year 2017 non-IFRS operating profit to be in a range of €6.85 billion to €7.0 billion at constant
currencies (2016: €6.63 billion). The lower end of the range was previously €6.8 billion.
While the Company's full-year 2017 business outlook is at constant currencies, actual currency reported figures are expected to
continue to be impacted by exchange rate fluctuations. If exchange rates remain at the September 2017 average level for the rest of
the year, we expect non-IFRS cloud and software revenue and non-IFRS operating profit growth rates to experience a currency
headwind in a range of -5 to -8pp in Q4 2017 (-1 to -3pp for the full year 2017).
The Company now expects its full-year 2017 effective tax rates (IFRS and non-IFRS) to be below the previous outlook. The previous
outlook for the effective tax rate (IFRS) was 26.0% to 27.0% (2016: 25.3%) and for the effective tax rate (non-IFRS) 27.0% to
28.0% (2016: 26.8%). The decrease in comparison to the previous outlook mainly results from a one-time tax benefit relating to an
intra-group transfer of intellectual property rights expected to be executed in the fourth quarter. As soon as the impact can be
determined the Company will update the effective tax rate outlook.
6 SAP Q3 2017 Quarterly Statement
Additional Information
Extension of the SAP Executive Board
The Supervisory Board of SAP SE has named Christian Klein (Chief Operating Officer) to the SAP Executive Board heading the new
board area Global Business Operations effective January 1, 2018.
Additionally, the Supervisory Board of SAP SE has extended Michael Kleinemeier’s Executive Board contract until December 31,
2019.
Acquisition of Gigya, Inc.
On September 24, 2017, SAP announced that it has entered into an agreement to acquire US-based Gigya, Inc., a market leader for
customer identity and access management. The transaction is expected to close in the final quarter of 2017, subject to regulatory
approval.
General Remarks about this Quarterly Statement and the SAP Integrated Report
Since Q1 2016, we issue a quarterly statement for each of the four fiscal quarters. Additionally, we issue a half year report and a full
year integrated report. SAP’s 2016 Integrated Report and Annual Report to Shareholders, and 2016 Annual Report on Form 20-F
were published on February 28, 2017, and are available for download at www.sapintegratedreport.com.
For a more detailed description of all of SAP’s non-IFRS measures and their limitations as well as our constant currency and free
cash flow figures see Explanation of Non-IFRS Measures online.
Webcast
SAP senior management will host a financial analyst conference call today at 2:00 PM (CET) / 1:00 PM (GMT) / 8:00 AM (Eastern) /
5:00 AM (Pacific). The call will be webcast live on the Company’s website at www.sap.com/investor and will be available for replay.
Supplementary financial information pertaining to the third quarter results can be found at www.sap.com/investor.
About SAP
As market leader in enterprise application software, SAP (NYSE: SAP) helps companies of all sizes and industries run better. From
back office to boardroom, warehouse to storefront, desktop to mobile device – SAP empowers people and organizations to work
together more efficiently and use business insight more effectively to stay ahead of the competition. SAP applications and services
enable more than 365,000 business and public sector customers to operate profitably, adapt continuously, and grow sustainably.
For more information, visit www.sap.com.
For more information, financial community only:
Stefan Gruber +49 (6227) 7-44872 [email protected], CET
Follow SAP Investor Relations on Twitter at @sapinvestor.
For more information, press only:
Nicola Leske +49 (6227) 7-50852 [email protected], CET
Daniel Reinhardt +49 (6227) 7-40201 [email protected], CET
Rajiv Sekhri +49 (6227) 7-74871 [email protected], CET
For customers interested in learning more about SAP products:
Global Customer Center: +49 180 534-34-24
United States Only: +1 (800) 872-1SAP (+1-800-872-1727)
Note to editors:
To preview and download broadcast-standard stock footage and press photos digitally, please visit www.sap.com/photos. On this
platform, you can find high resolution material for your media channels. To view video stories on diverse topics, visit www.sap-
tv.com. From this site, you can embed videos into your own Web pages, share video via e-mail links and subscribe to RSS feeds from
SAP TV.
SAP Q3 2017 Quarterly Statement 7
Any statements contained in this document that are not historical facts are forward-looking statements as defined in the U.S. Private Securities Litigation
Reform Act of 1995. Words such as “anticipate,” “believe,” “estimate,” “expect,” “forecast,” “intend,” “may,” “plan,” “project,” “predict,” “should” and “will” and
similar expressions as they relate to SAP are intended to identify such forward-looking statements. SAP undertakes no obligation to publicly update or revise any
forward-looking statements. All forward-looking statements are subject to various risks and uncertainties that could cause actual results to differ materially from
expectations. The factors that could affect SAP's future financial results are discussed more fully in SAP's filings with the U.S. Securities and Exchange
Commission ("SEC"), including SAP's most recent Annual Report on Form 20-F filed with the SEC. Readers are cautioned not to place undue reliance on these
forward-looking statements, which speak only as of their dates.
© 2017 SAP SE. All rights reserved.
No part of this publication may be reproduced or transmitted in any form or for any purpose without the express permission of SAP SE. The information
contained herein may be changed without prior notice.
Some software products marketed by SAP SE and its distributors contain proprietary software components of other software vendors. National product
specifications may vary.
These materials are provided by SAP SE and its affiliated companies ("SAP Group") for informational purposes only, without representation or warranty of any
kind, and SAP Group shall not be liable for errors or omissions with respect to the materials. The only warranties for SAP Group products and services are those
that are set forth in the express warranty statements accompanying such products and services, if any. Nothing herein should be construed as constituting an
additional warranty.
SAP and other SAP products and services mentioned herein as well as their respective logos are trademarks or registered trademarks of SAP SE (or an SAP
affiliate company) in Germany and other countries. Please see http://www.sap.com/corporate-en/legal/copyright/index.epx#trademark for additional
trademark information and notices.

8 SAP Q3 2017 Quarterly Statement
Financial and Non-Financial Key Facts (IFRS and Non-IFRS)
€ millions, unless otherwise stated Q1
2016 Q2
2016 Q3
2016 Q4
2016 TY
2016 Q1
2017 Q2
2017 Q3
2017
Revenues
Cloud subscriptions and support (IFRS) 677 720 769 827 2,993 905 932 937
Cloud subscriptions and support (non-IFRS) 678 721 769 827 2,995 906 932 938
% change – yoy 33 30 28 31 30 34 29 22
% change constant currency – yoy 33 33 29 29 31 30 27 27
Software licenses (IFRS) 609 1,040 1,034 2,177 4,860 691 1,090 1,033
Software licenses (non-IFRS) 609 1,042 1,034 2,177 4,862 691 1,090 1,033
% change – yoy –13 6 2 1 1 13 5 0
% change constant currency – yoy –10 10 2 0 1 10 4 3
Software support (IFRS) 2,564 2,598 2,653 2,756 10,571 2,731 2,736 2,687
Software support (non-IFRS) 2,564 2,598 2,653 2,756 10,572 2,731 2,736 2,687
% change – yoy 5 3 6 6 5 7 5 1
% change constant currency – yoy 5 6 6 5 6 3 4 4
Software licenses and support (IFRS) 3,172 3,639 3,686 4,933 15,431 3,422 3,826 3,720
Software licenses and support (non-IFRS) 3,173 3,640 3,687 4,934 15,434 3,422 3,826 3,720
% change – yoy 1 4 5 4 3 8 5 1
% change constant currency – yoy 2 7 5 3 4 5 4 4
Cloud and software (IFRS) 3,850 4,359 4,455 5,760 18,424 4,328 4,757 4,657
Cloud and software (non-IFRS) 3,851 4,361 4,456 5,761 18,428 4,328 4,758 4,658
% change – yoy 5 7 8 7 7 12 9 5
% change constant currency – yoy 6 11 9 6 8 9 8 8
Total revenue (IFRS) 4,727 5,237 5,375 6,724 22,062 5,285 5,782 5,590
Total revenue (non-IFRS) 4,728 5,239 5,375 6,724 22,067 5,285 5,782 5,590
% change – yoy 5 5 8 6 6 12 10 4
% change constant currency – yoy 6 9 8 5 7 8 9 8
Share of predictable revenue (IFRS, in %) 69 63 64 53 61 69 63 65
Share of predictable revenue (non-IFRS, in %) 69 63 64 53 61 69 63 65
Profits
Operating profit (IFRS) 813 1,269 1,103 1,950 5,135 673 926 1,314
Operating profit (non-IFRS) 1,104 1,516 1,638 2,375 6,633 1,198 1,570 1,637
% change 5 9 1 4 4 8 4 0
% change constant currency 4 11 1 2 4 2 3 4
Profit after tax (IFRS) 570 813 725 1,526 3,634 530 666 993
Profit after tax (non-IFRS) 763 979 1,089 1,826 4,658 887 1,120 1,214
% change 9 2 –7 9 3 16 14 11
Margins
Cloud subscriptions and support gross margin (IFRS, in %) 57.0 56.6 56.3 54.8 56.1 57.7 56.0 54.8
Cloud subscriptions and support gross margin (non-IFRS, in %) 65.9 64.8 64.5 62.7 64.4 64.6 62.4 60.8
Software license and support gross margin (IFRS, in %) 84.2 86.1 85.4 87.1 85.9 83.3 85.3 86.2
Software license and support gross margin (non-IFRS, in %) 85.9 87.4 87.4 88.4 87.4 85.1 86.6 87.3
Cloud and software gross margin (IFRS, in %) 79.4 81.2 80.4 82.4 81.0 77.9 79.6 79.9
Cloud and software gross margin (non-IFRS, in %) 82.3 83.6 83.4 84.7 83.7 80.8 81.8 82.0
Gross margin (IFRS, in %) 66.9 70.4 69.3 73.0 70.2 66.7 69.0 70.1
Gross margin (non-IFRS, in %) 69.6 72.6 72.7 75.5 72.9 69.9 71.5 72.5
Operating margin (IFRS, in %) 17.2 24.2 20.5 29.0 23.3 12.7 16.0 23.5
Operating margin (non-IFRS, in %) 23.4 28.9 30.5 35.3 30.1 22.7 27.2 29.3
AT&S segment – Cloud subscriptions and support gross margin (in %)
54 52 51 49 52 52 49 47
AT&S segment – Gross margin (in %) 70 73 74 77 74 70 72 73
AT&S segment – Segment margin (in %) 34 39 40 45 40 32 37 39

SAP Q3 2017 Quarterly Statement 9
€ millions, unless otherwise stated Q1
2016 Q2
2016 Q3
2016 Q4
2016 TY
2016 Q1
2017 Q2
2017 Q3
2017
SAP BN segment – Cloud subscriptions and support gross margin (in %)
75 76 77 75 76 77 77 76
SAP BN segment – Gross margin (in %) 67 68 68 66 67 68 68 68
SAP BN segment – Segment margin (in %) 17 18 20 16 18 16 17 17
Key Profit Ratios
Effective tax rate (IFRS, in %) 23.3 28.9 28.4 22.3 25.3 20.6 26.6 28.6
Effective tax rate (non-IFRS, in %) 26.2 29.6 29.7 23.5 26.8 25.7 27.8 29.2
Earnings per share, basic (IFRS, in €) 0.48 0.68 0.61 1.27 3.04 0.43 0.56 0.82
Earnings per share, basic (non-IFRS, in €) 0.64 0.82 0.91 1.53 3.90 0.73 0.94 1.01
Order Entry
New Cloud Bookings 145 255 265 483 1,147 215 340 302
Deferred income (current)1) 5,265 4,470 3,373 2,383 2,383 6,215 4,898 3,531
Orders – Number of on-premise software deals (in transactions) 12,884 14,468 13,048 16,891 57,291 13,115 14,361 13,889
Share of orders greater than € 5 million based on total software order entry volume (in %)
17 29 26 34 29 27 31 29
Share of orders smaller than € 1 million based on total software order entry volume (in %)
48 38 40 35 38 46 40 41
Liquidity and Cash Flow
Net cash flows from operating activities 2,482 439 707 1,000 4,628 2,872 642 611
Free cash flow 2,313 202 446 665 3,627 2,581 322 258
% of total revenue (IFRS) 49 4 8 10 16 49 6 5
% of profit after tax (IFRS) 406 25 61 44 100 487 48 26
Group liquidity, gross 5,853 4,347 4,388 4,673 4,673 7,345 4,927 4,960
Group debt –9,080 –8,593 –8,134 –7,826 –7,826 –7,805 –6,716 –6,667
Group liquidity, net –3,227 –4,245 –3,746 –3,153 –3,153 –460 –1,789 –1,706
Days' sales outstanding (DSO, in days)2) 72 73 74 74 74 72 72 72
Financial Position
Cash and cash equivalents 5,743 4,206 4,112 3,702 3,702 5,937 4,236 4,220
Goodwill 21,922 22,354 22,279 23,311 23,311 23,091 21,949 21,353
Total assets 42,884 41,788 41,604 44,277 44,277 47,724 42,900 41,430
Equity ratio (total equity in % of total assets) 53 55 57 60 60 56 57 59
Non-Financials
Number of employees (quarter end)3) 78,230 79,962 82,426 84,183 84,183 85,751 87,114 87,874
Employee retention (in %, rolling 12 months) 92.0 92.6 93.4 93.7 93.7 94.1 94.3 94.2
Women in management (in %, quarter end) 23.6 24.1 24.3 24.5 24.5 24.8 25.0 25.2
Greenhouse gas emissions (in kilotons) 120 95 85 80 380 100 55 80
1) SAP is in the final stage of migrating its processes and customer contracts to IFRS 15. At this point of the migration, there is no reliable way to report deferred
cloud revenue any longer, therefore the separate disclosure of the cloud portion of deferred income is discontinued. SAP will continue to disclose new cloud
bookings as the key metric to measure SAP’s sales success in the cloud.
2) Days’ sales outstanding measures the length of time it takes to collect receivables. SAP calculates DSO by dividing the average invoiced accounts receivables
balance of the last 12 months by the average monthly sales of the last 12 months.
3) In full-time equivalents
Due to rounding, numbers may not add up precisely.
10 SAP Q3 2017 Quarterly Statement
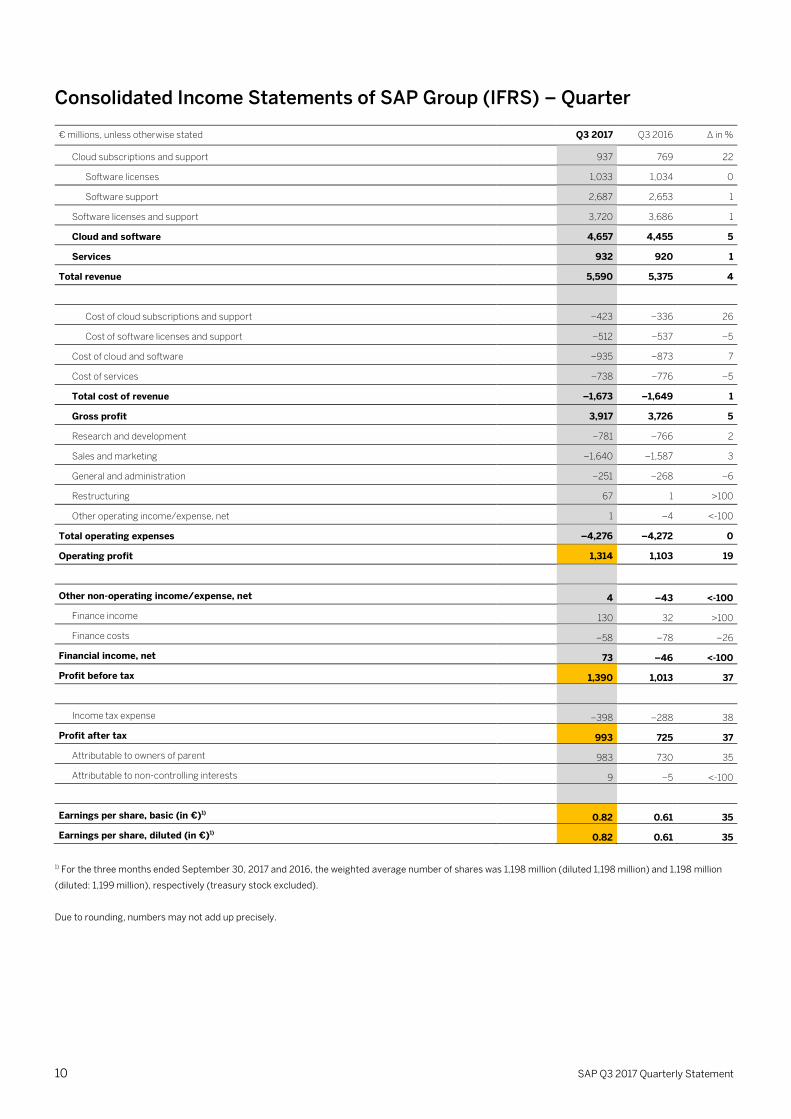
Consolidated Income Statements of SAP Group (IFRS) – Quarter
€ millions, unless otherwise stated Q3 2017 Q3 2016 ∆ in %
Cloud subscriptions and support 937 769 22
Software licenses 1,033 1,034 0
Software support 2,687 2,653 1
Software licenses and support 3,720 3,686 1
Cloud and software 4,657 4,455 5
Services 932 920 1
Total revenue 5,590 5,375 4
Cost of cloud subscriptions and support –423 –336 26
Cost of software licenses and support –512 –537 –5
Cost of cloud and software –935 –873 7
Cost of services –738 –776 –5
Total cost of revenue –1,673 –1,649 1
Gross profit 3,917 3,726 5
Research and development –781 –766 2
Sales and marketing –1,640 –1,587 3
General and administration –251 –268 –6
Restructuring 67 1 >100
Other operating income/expense, net 1 –4 <-100
Total operating expenses –4,276 –4,272 0
Operating profit 1,314 1,103 19
Other non-operating income/expense, net 4 –43 <-100
Finance income 130 32 >100
Finance costs –58 –78 –26
Financial income, net 73 –46 <-100
Profit before tax 1,390 1,013 37
Income tax expense –398 –288 38
Profit after tax 993 725 37
Attributable to owners of parent 983 730 35
Attributable to non-controlling interests 9 –5 <-100
Earnings per share, basic (in €)1) 0.82 0.61 35
Earnings per share, diluted (in €)1) 0.82 0.61 35
1) For the three months ended September 30, 2017 and 2016, the weighted average number of shares was 1,198 million (diluted 1,198 million) and 1,198 million
(diluted: 1,199 million), respectively (treasury stock excluded).
Due to rounding, numbers may not add up precisely.
SAP Q3 2017 Quarterly Statement 11
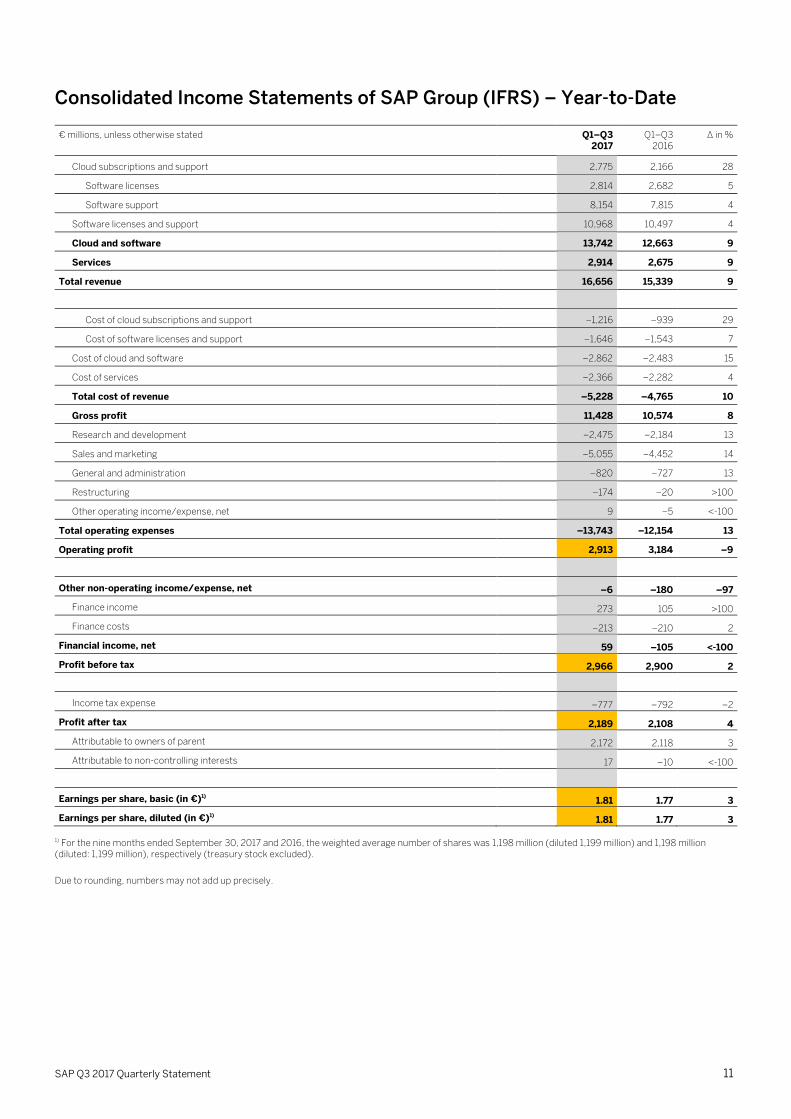
Consolidated Income Statements of SAP Group (IFRS) – Year-to-Date
€ millions, unless otherwise stated Q1–Q3 2017
Q1–Q3 2016
∆ in %
Cloud subscriptions and support 2,775 2,166 28
Software licenses 2,814 2,682 5
Software support 8,154 7,815 4
Software licenses and support 10,968 10,497 4
Cloud and software 13,742 12,663 9
Services 2,914 2,675 9
Total revenue 16,656 15,339 9
Cost of cloud subscriptions and support –1,216 –939 29
Cost of software licenses and support –1,646 –1,543 7
Cost of cloud and software –2,862 –2,483 15
Cost of services –2,366 –2,282 4
Total cost of revenue –5,228 –4,765 10
Gross profit 11,428 10,574 8
Research and development –2,475 –2,184 13
Sales and marketing –5,055 –4,452 14
General and administration –820 –727 13
Restructuring –174 –20 >100
Other operating income/expense, net 9 –5 <-100
Total operating expenses –13,743 –12,154 13
Operating profit 2,913 3,184 –9
Other non-operating income/expense, net –6 –180 –97
Finance income 273 105 >100
Finance costs –213 –210 2
Financial income, net 59 –105 <-100
Profit before tax 2,966 2,900 2
Income tax expense –777 –792 –2
Profit after tax 2,189 2,108 4
Attributable to owners of parent 2,172 2,118 3
Attributable to non-controlling interests 17 –10 <-100
Earnings per share, basic (in €)1) 1.81 1.77 3
Earnings per share, diluted (in €)1) 1.81 1.77 3
1) For the nine months ended September 30, 2017 and 2016, the weighted average number of shares was 1,198 million (diluted 1,199 million) and 1,198 million (diluted: 1,199 million), respectively (treasury stock excluded).
Due to rounding, numbers may not add up precisely.

12 SAP Q3 2017 Quarterly Statement
Consolidated Statements of Financial Position of SAP Group (IFRS)
as at September 30, 2017 and December 31, 2016
€ millions 2017 2016
Cash and cash equivalents 4,220 3,702
Other financial assets 1,013 1,124
Trade and other receivables 4,869 5,924
Other non-financial assets 756 581
Tax assets 361 233
Total current assets 11,219 11,564
Goodwill 21,353 23,311
Intangible assets 3,038 3,786
Property, plant, and equipment 2,806 2,580
Other financial assets 1,233 1,358
Trade and other receivables 124 126
Other non-financial assets 552 532
Tax assets 434 450
Deferred tax assets 672 571
Total non-current assets 30,212 32,713
Total assets 41,430 44,277
€ millions 2017 2016
Trade and other payables 1,089 1,281
Tax liabilities 256 316
Financial liabilities 1,289 1,813
Other non-financial liabilities 3,077 3,699
Provisions 266 183
Deferred income 3,531 2,383
Total current liabilities 9,507 9,674
Trade and other payables 118 127
Tax liabilities 442 365
Financial liabilities 5,811 6,481
Other non-financial liabilities 465 461
Provisions 211 217
Deferred tax liabilities 422 411
Deferred income 84 143
Total non-current liabilities 7,553 8,205
Total liabilities 17,060 17,880
Issued capital 1,229 1,229
Share premium 568 599
Retained earnings 22,992 22,302
Other components of equity 960 3,346
Treasury shares –1,379 –1,099
Equity attributable to owners of parent 24,369 26,376
Non-controlling interests 1 21
Total equity 24,370 26,397
Total equity and liabilities 41,430 44,277
Due to rounding, numbers may not add up precisely.

SAP Q3 2017 Quarterly Statement 13
Consolidated Statements of Cash Flows of SAP Group (IFRS)
€ millions Q1–Q3 2017 Q1–Q3 2016
Profit after tax 2,189 2,108
Adjustments to reconcile profit after tax to net cash flows from operating activities:
Depreciation and amortization 961 932
Income tax expense 777 792
Financial income, net –59 105
Decrease/increase in sales and bad debt allowances on trade receivables –15 61
Other adjustments for non-cash items –35 8
Decrease/increase in trade and other receivables 731 290
Decrease/increase in other assets –338 –351
Decrease/increase in trade payables, provisions, and other liabilities –456 –583
Decrease/increase in deferred income 1,480 1,402
Interest paid –145 –145
Interest received 53 57
Income tax paid, net of refunds –1,016 –1,048
Net cash flows from operating activities 4,125 3,628
Business combinations, net of cash and cash equivalents acquired –22 –54
Purchase of intangible assets or property, plant, and equipment –964 –666
Proceeds from sales of intangible assets or property, plant, and equipment 77 48
Purchase of equity or debt instruments of other entities –2,098 –559
Proceeds from sales of equity or debt instruments of other entities 2,371 457
Net cash flows from investing activities –636 –773
Dividends paid –1,499 –1,378
Dividends paid on non-controlling interests –39 0
Purchase of treasury shares –288 0
Proceeds from reissuance of treasury shares 0 24
Proceeds from borrowings 27 401
Repayments of borrowings –1,007 –1,394
Transactions with non-controlling interests 0 3
Net cash flows from financing activities –2,806 –2,345
Effect of foreign currency rates on cash and cash equivalents –165 192
Net decrease/increase in cash and cash equivalents 518 702
Cash and cash equivalents at the beginning of the period 3,702 3,411
Cash and cash equivalents at the end of the period 4,220 4,112
Due to rounding, numbers may not add up precisely.

14 SAP Q3 2017 Quarterly Statement
Segment Reporting – Quarter
Applications, Technology & Services1)
€ millions, unless otherwise stated Q3 2017 Q3 2016 ∆ in % ∆ in %
Actual Currency
Constant Currency
Actual Currency
Actual Currency
Constant Currency
Cloud subscriptions and support – SaaS/PaaS2) 408 424 307 33 38
Cloud subscriptions and support – IaaS3) 77 80 58 34 39
Cloud subscriptions and support 485 504 365 33 38
Software licenses 1,042 1,076 1,033 1 4
Software support 2,683 2,767 2,647 1 5
Software licenses and support 3,725 3,842 3,680 1 4
Cloud and software 4,210 4,346 4,045 4 7
Services 823 850 824 0 3
Total segment revenue 5,033 5,196 4,869 3 7
Cost of cloud subscriptions and support – SaaS/PaaS2) –178 –184 –120 48 53
Cost of cloud subscriptions and support – IaaS3) –79 –81 –57 39 42
Cost of cloud subscriptions and support –257 –265 –177 45 50
Cost of software licenses and support –466 –478 –466 0 3
Cost of cloud and software –723 –743 –643 12 16
Cost of services –632 –648 –636 –1 2
Total cost of revenue –1,355 –1,391 –1,279 6 9
Segment gross profit 3,677 3,805 3,589 2 6
Other segment expenses –1,730 –1,779 –1,633 6 9
Segment profit 1,947 2,026 1,956 0 4
Margins
Cloud subscriptions and support gross margin – SaaS/PaaS2) (in %) 56 57 61 –4pp –4pp
Cloud subscriptions and support gross margin – IaaS3) (in %) –3 –1 1 –4pp –2pp
Cloud subscriptions and support gross margin (in %) 47 47 51 –4pp –4pp
Gross margin (in %) 73 73 74 –1pp –0pp
Segment margin (in %) 39 39 40 –1pp –1pp
1) The segment that focuses on our small and medium-sized customers is no longer an operating segment, and its activities were included in the Applications,
Technology & Services segment. We have retrospectively adjusted the revenue and results for the Applications, Technology & Services segment to reflect this
change.
2) Software as a Service/Platform as a Service
3) Infrastructure as a Service
Due to rounding, numbers may not add up precisely.
SAP Q3 2017 Quarterly Statement 15
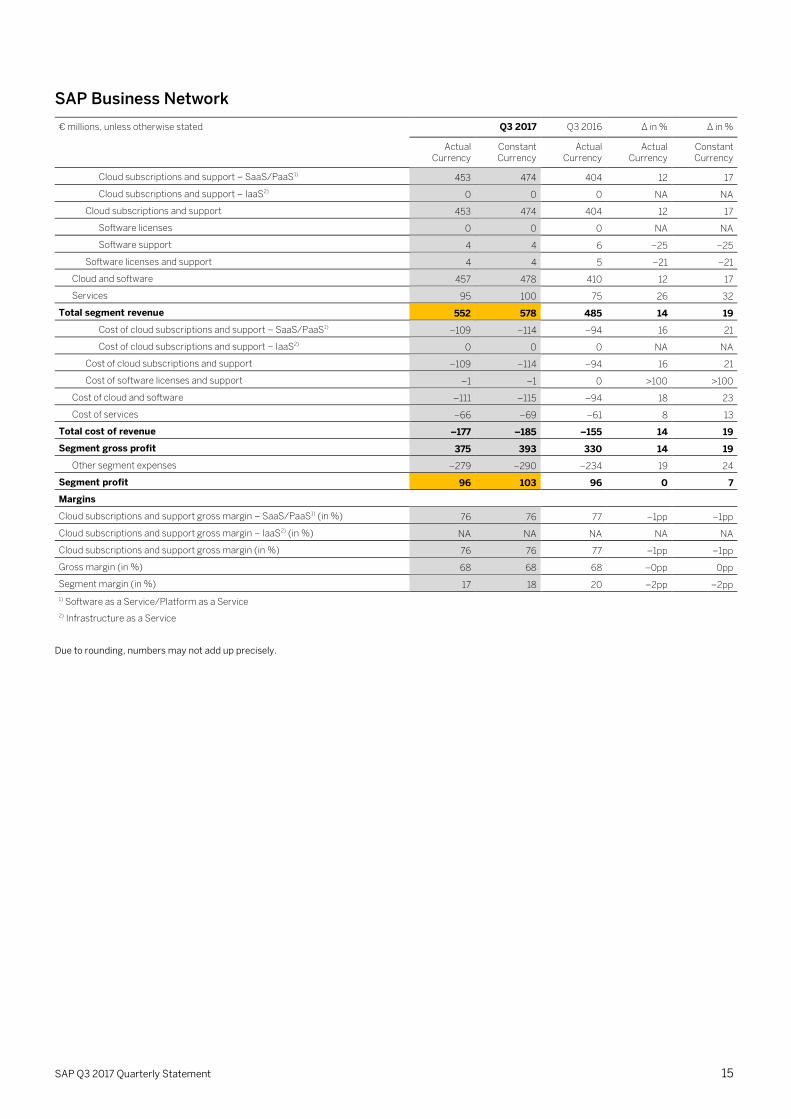
SAP Business Network
€ millions, unless otherwise stated Q3 2017 Q3 2016 ∆ in % ∆ in %
Actual Currency
Constant Currency
Actual Currency
Actual Currency
Constant Currency
Cloud subscriptions and support – SaaS/PaaS1) 453 474 404 12 17
Cloud subscriptions and support – IaaS2) 0 0 0 NA NA
Cloud subscriptions and support 453 474 404 12 17
Software licenses 0 0 0 NA NA
Software support 4 4 6 –25 –25
Software licenses and support 4 4 5 –21 –21
Cloud and software 457 478 410 12 17
Services 95 100 75 26 32
Total segment revenue 552 578 485 14 19
Cost of cloud subscriptions and support – SaaS/PaaS1) –109 –114 –94 16 21
Cost of cloud subscriptions and support – IaaS2) 0 0 0 NA NA
Cost of cloud subscriptions and support –109 –114 –94 16 21
Cost of software licenses and support –1 –1 0 >100 >100
Cost of cloud and software –111 –115 –94 18 23
Cost of services –66 –69 –61 8 13
Total cost of revenue –177 –185 –155 14 19
Segment gross profit 375 393 330 14 19
Other segment expenses –279 –290 –234 19 24
Segment profit 96 103 96 0 7
Margins
Cloud subscriptions and support gross margin – SaaS/PaaS1) (in %) 76 76 77 –1pp –1pp
Cloud subscriptions and support gross margin – IaaS2) (in %) NA NA NA NA NA
Cloud subscriptions and support gross margin (in %) 76 76 77 –1pp –1pp
Gross margin (in %) 68 68 68 –0pp 0pp
Segment margin (in %) 17 18 20 –2pp –2pp
1) Software as a Service/Platform as a Service
2) Infrastructure as a Service
Due to rounding, numbers may not add up precisely.

16 SAP Q3 2017 Quarterly Statement
Reconciliation of Cloud Subscription Revenues and Margins
€ millions, unless otherwise stated Q3 2017 Q3 2016 ∆ in % ∆ in %
Actual
Currency Constant Currency
Actual Currency
Actual Currency
Constant Currency
Cloud subscriptions and support revenue – SaaS/PaaS1)
SAP Business Network segment 453 474 404 12 17
Other 409 424 307 33 38
Total 861 898 711 21 26
Cloud subscriptions and support revenue – IaaS2)
77 80 58 34 39
Cloud subscriptions and support revenue 938 978 769 22 27
Cloud subscriptions and support gross margin – SaaS/PaaS1) (in %)
SAP Business Network segment 76 76 77 –1pp –1pp
Other 56 57 60 –4pp –4pp
Total 66 67 70 –3pp –3pp
Cloud subscriptions and support gross margin – IaaS2) (in %)
–3 –1 1 –4pp –2pp
Cloud subscriptions and support gross margin (in %)
61 61 65 –4pp –3pp
1) Software as a Service/Platform as a Service 2) Infrastructure as a Service
Due to rounding, numbers may not add up precisely.

SAP Q3 2017 Quarterly Statement 17
Segment Reporting – Year-to-Date
Applications, Technology & Services1)
€ millions, unless otherwise stated Q1–Q3 2017 Q1–Q3 2016 ∆ in % ∆ in %
Actual Currency
Constant Currency
Actual Currency
Actual Currency
Constant Currency
Cloud subscriptions and support – SaaS/PaaS2) 1,163 1,162 856 36 36
Cloud subscriptions and support – IaaS3) 234 235 146 60 60
Cloud subscriptions and support 1,397 1,396 1,002 39 39
Software licenses 2,813 2,821 2,685 5 5
Software support 8,139 8,101 7,796 4 4
Software licenses and support 10,953 10,922 10,481 4 4
Cloud and software 12,350 12,318 11,483 8 7
Services 2,569 2,557 2,455 5 4
Total segment revenue 14,919 14,875 13,938 7 7
Cost of cloud subscriptions and support – SaaS/PaaS2) –489 –487 –317 54 53
Cost of cloud subscriptions and support – IaaS3) –222 –221 –159 39 39
Cost of cloud subscriptions and support –710 –707 –476 49 48
Cost of software licenses and support –1,472 –1,465 –1,399 5 5
Cost of cloud and software –2,182 –2,173 –1,876 16 16
Cost of services –2,030 –2,021 –1,983 2 2
Total cost of revenue –4,212 –4,193 –3,859 9 9
Segment gross profit 10,707 10,682 10,079 6 6
Other segment expenses –5,348 –5,336 –4,802 11 11
Segment profit 5,359 5,346 5,277 2 1
Margins
Cloud subscriptions and support gross margin – SaaS/PaaS2) (in %) 58 58 63 –5pp –5pp
Cloud subscriptions and support gross margin – IaaS3) (in %) 5 6 –9 14pp 15pp
Cloud subscriptions and support gross margin (in %) 49 49 52 –3pp –3pp
Gross margin (in %) 72 72 72 –1pp –1pp
Segment margin (in %) 36 36 38 –2pp –2pp
1) The segment that focuses on our small and medium-sized customers is no longer an operating segment, and its activities were included in the Applications,
Technology & Services segment. We have retrospectively adjusted the revenue and results for the Applications, Technology & Services segment to reflect this
change.
2) Software as a Service/Platform as a Service
3) Infrastructure as a Service
Due to rounding, numbers may not add up precisely.
18 SAP Q3 2017 Quarterly Statement
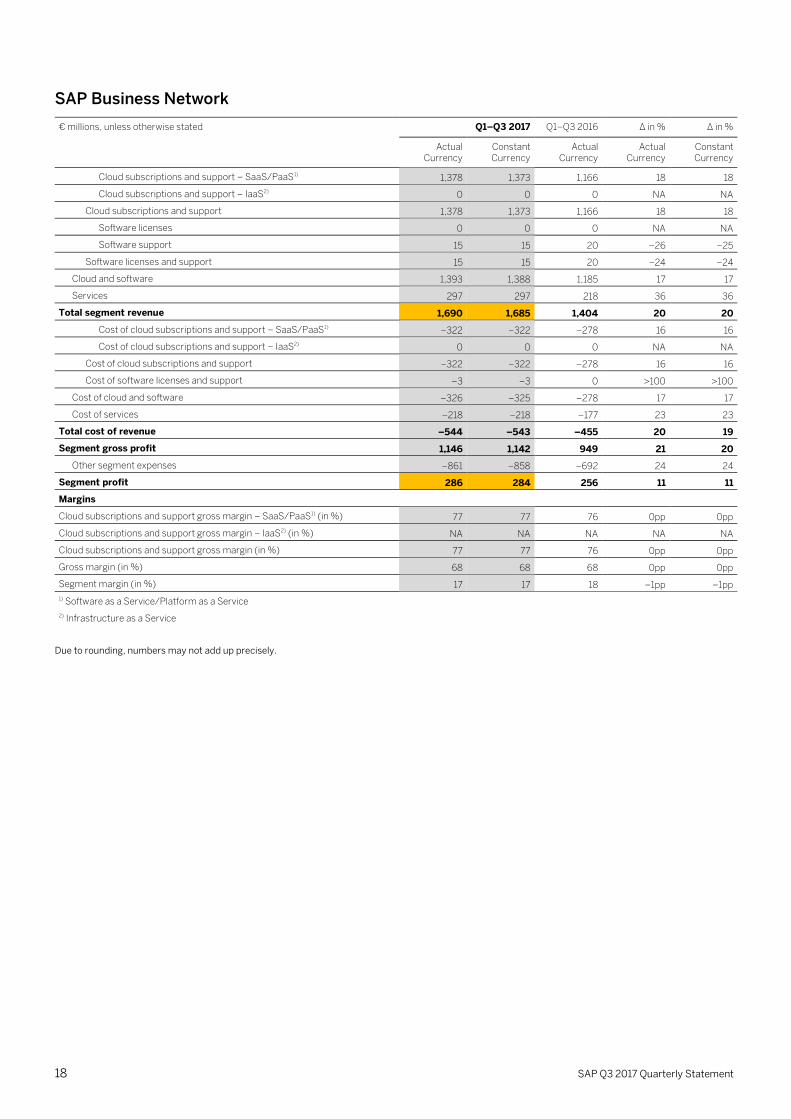
SAP Business Network
€ millions, unless otherwise stated Q1–Q3 2017 Q1–Q3 2016 ∆ in % ∆ in %
Actual Currency
Constant Currency
Actual Currency
Actual Currency
Constant Currency
Cloud subscriptions and support – SaaS/PaaS1) 1,378 1,373 1,166 18 18
Cloud subscriptions and support – IaaS2) 0 0 0 NA NA
Cloud subscriptions and support 1,378 1,373 1,166 18 18
Software licenses 0 0 0 NA NA
Software support 15 15 20 –26 –25
Software licenses and support 15 15 20 –24 –24
Cloud and software 1,393 1,388 1,185 17 17
Services 297 297 218 36 36
Total segment revenue 1,690 1,685 1,404 20 20
Cost of cloud subscriptions and support – SaaS/PaaS1) –322 –322 –278 16 16
Cost of cloud subscriptions and support – IaaS2) 0 0 0 NA NA
Cost of cloud subscriptions and support –322 –322 –278 16 16
Cost of software licenses and support –3 –3 0 >100 >100
Cost of cloud and software –326 –325 –278 17 17
Cost of services –218 –218 –177 23 23
Total cost of revenue –544 –543 –455 20 19
Segment gross profit 1,146 1,142 949 21 20
Other segment expenses –861 –858 –692 24 24
Segment profit 286 284 256 11 11
Margins
Cloud subscriptions and support gross margin – SaaS/PaaS1) (in %) 77 77 76 0pp 0pp
Cloud subscriptions and support gross margin – IaaS2) (in %) NA NA NA NA NA
Cloud subscriptions and support gross margin (in %) 77 77 76 0pp 0pp
Gross margin (in %) 68 68 68 0pp 0pp
Segment margin (in %) 17 17 18 –1pp –1pp
1) Software as a Service/Platform as a Service
2) Infrastructure as a Service
Due to rounding, numbers may not add up precisely.
SAP Q3 2017 Quarterly Statement 19
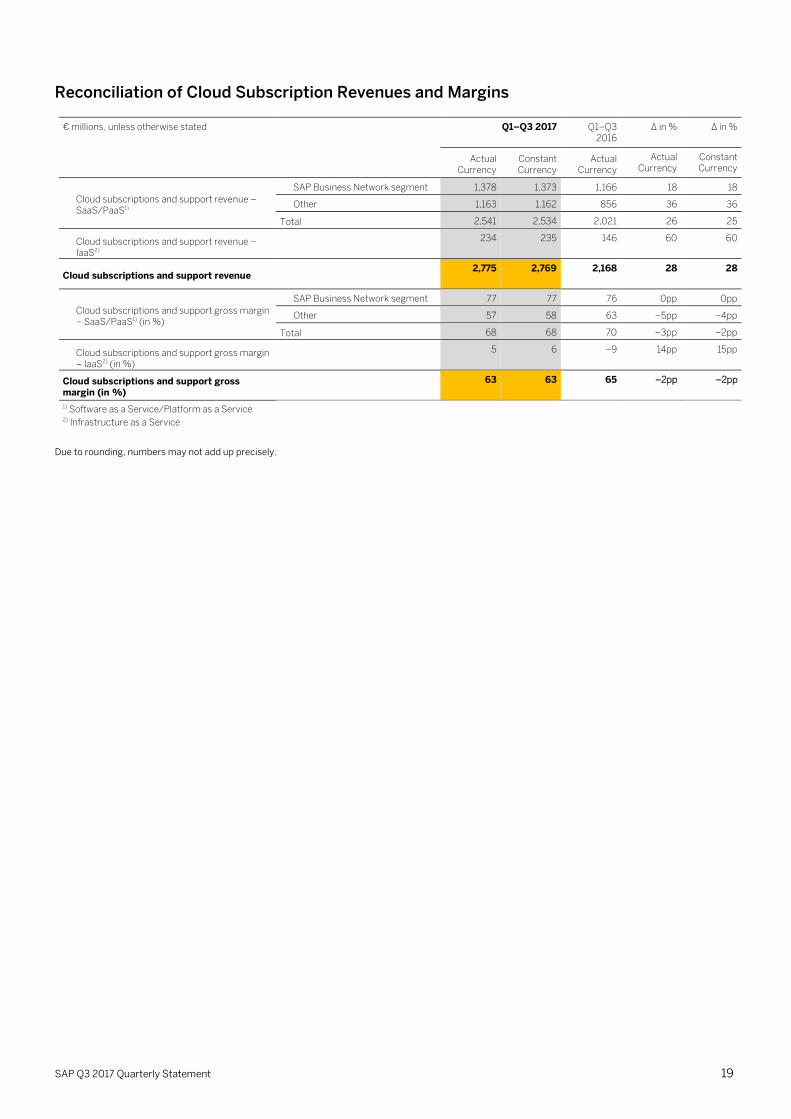
Reconciliation of Cloud Subscription Revenues and Margins
€ millions, unless otherwise stated Q1–Q3 2017 Q1–Q3 2016
∆ in % ∆ in %
Actual
Currency Constant Currency
Actual Currency
Actual Currency
Constant Currency
Cloud subscriptions and support revenue – SaaS/PaaS1)
SAP Business Network segment 1,378 1,373 1,166 18 18
Other 1,163 1,162 856 36 36
Total 2,541 2,534 2,021 26 25
Cloud subscriptions and support revenue – IaaS2)
234 235 146 60 60
Cloud subscriptions and support revenue 2,775 2,769 2,168 28 28
Cloud subscriptions and support gross margin – SaaS/PaaS1) (in %)
SAP Business Network segment 77 77 76 0pp 0pp
Other 57 58 63 –5pp –4pp
Total 68 68 70 –3pp –2pp
Cloud subscriptions and support gross margin – IaaS2) (in %)
5 6 –9 14pp 15pp
Cloud subscriptions and support gross margin (in %)
63 63 65 –2pp –2pp
1) Software as a Service/Platform as a Service 2) Infrastructure as a Service
Due to rounding, numbers may not add up precisely.

20 SAP Q3 2017 Quarterly Statement
Reconciliation from Non-IFRS Numbers to IFRS Numbers – Quarter
€ millions, unless otherwise stated Q3 2017 Q3 2016 ∆ in %
IFRS Adj.1) Non-IFRS1)
Currency Impact2)
Non-IFRS Constant
Currency2)
IFRS Adj.1) Non-IFRS1)
IFRS Non-IFRS1)
Non-IFRS Constant
Currency2)
Revenue Numbers
Cloud subscriptions and support 937 0 938 41 978 769 0 769 22 22 27
Software licenses 1,033 0 1,033 33 1,067 1,034 0 1,034 0 0 3
Software support 2,687 0 2,687 84 2,771 2,653 0 2,653 1 1 4
Software licenses and support 3,720 0 3,720 117 3,837 3,686 0 3,687 1 1 4
Cloud and software 4,657 0 4,658 158 4,815 4,455 1 4,456 5 5 8
Services 932 0 932 32 965 920 0 920 1 1 5
Total revenue 5,590 0 5,590 190 5,780 5,375 1 5,375 4 4 8
Operating Expense Numbers
Cost of cloud subscriptions and support
–423 56 –368 –336 63 –273 26 35
Cost of software licenses and support
–512 41 –471 –537 71 –465 –5 1
Cost of cloud and software –935 97 –839 –873 135 –738 7 14
Cost of services –738 41 –697 –776 45 –732 –5 –5
Total cost of revenue –1,673 137 –1,536 –1,649 179 –1,469 1 4
Gross profit 3,917 138 4,055 3,726 180 3,906 5 4
Research and development –781 64 –717 –766 86 –679 2 6
Sales and marketing –1,640 162 –1,478 –1,587 214 –1,373 3 8
General and administration –251 28 –223 –268 56 –211 –6 6
Restructuring 67 –67 0 1 –1 0 >100 NA
Other operating income/expense, net
1 0 1 –4 0 –4 <-100 <-100
Total operating expenses –4,276 323 –3,953 –118 –4,071 –4,272 534 –3,738 0 6 9
Profit Numbers
Operating profit 1,314 323 1,637 72 1,709 1,103 535 1,638 19 0 4
Other non-operating income/expense, net
4 0 4 –43 0 –43 <-100 <-100
Finance income 130 0 130 32 0 32 >100 >100
Finance costs –58 0 –58 –78 0 –78 –26 –26
Financial income, net 73 0 73 –46 0 –46 <-100 <-100
Profit before tax 1,390 323 1,714 1,013 535 1,548 37 11
Income tax expense –398 –102 –500 –288 –171 –459 38 9
Profit after tax 993 221 1,214 725 364 1,089 37 11
Attributable to owners of parent 983 221 1,204 730 364 1,094 35 10
Attributable to non-controlling interests
9 0 9 –5 0 –5 <-100 <-100
Key Ratios
Operating margin (in %) 23.5 29.3 29.6 20.5 30.5 3.0pp –1.2pp –0.9pp
Effective tax rate (in %)3) 28.6 29.2 28.4 29.7 0.2pp –0.5pp
Earnings per share, basic (in €) 0.82 1.01 0.61 0.91 35 10
1) Adjustments in the revenue line items are for software support revenue, cloud subscriptions and support revenue, and other similarly recurring revenues that
entities acquired by SAP would have recognized had they remained stand-alone entities but that SAP is not permitted to recognize as revenue under IFRS as a
result of business combination accounting rules. Adjustments in the operating expense line items are for acquisition-related charges, share-based payment
expenses, as well as restructuring expenses.

SAP Q3 2017 Quarterly Statement 21
2) Constant currency revenue and operating income figures are calculated by translating revenue and operating income of the current period using the average
exchange rates from the previous year's respective period instead of the current period. Constant currency period-over-period changes are calculated by
comparing the current year's non-IFRS constant currency numbers with the non-IFRS number of the previous year's respective period.
For a more detailed description of these adjustments and their limitations as well as our constant currency figures, see our Web site www.sap.com/corporate-
en/investors/newsandreports/reporting-framework.epx under “Non-IFRS Measures, Adjustments and Full-Year Estimates”.
3) The difference between our effective tax rate (IFRS) and effective tax rate (non-IFRS) in Q3 2017 mainly results from tax effects of acquisition-related charges.
The difference between our effective tax rate (IFRS) and effective tax rate (non-IFRS) in Q3 2016 mainly results from tax effects of acquisition-related charges
and share-based payment expenses.
Due to rounding, numbers may not add up precisely.
22 SAP Q3 2017 Quarterly Statement
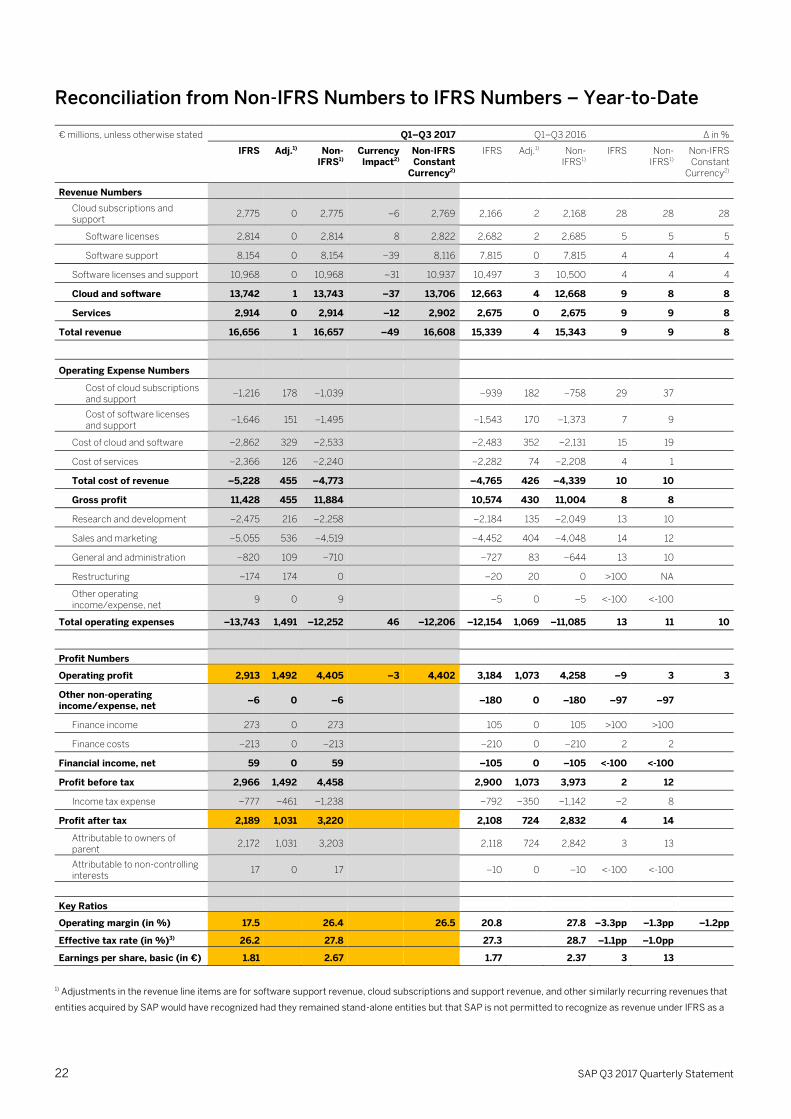
Reconciliation from Non-IFRS Numbers to IFRS Numbers – Year-to-Date
€ millions, unless otherwise stated Q1–Q3 2017 Q1–Q3 2016 ∆ in %
IFRS Adj.1) Non-IFRS1)
Currency Impact2)
Non-IFRS Constant
Currency2)
IFRS Adj.1) Non-IFRS1)
IFRS Non-IFRS1)
Non-IFRS Constant
Currency2)
Revenue Numbers
Cloud subscriptions and support
2,775 0 2,775 –6 2,769 2,166 2 2,168 28 28 28
Software licenses 2,814 0 2,814 8 2,822 2,682 2 2,685 5 5 5
Software support 8,154 0 8,154 –39 8,116 7,815 0 7,815 4 4 4
Software licenses and support 10,968 0 10,968 –31 10,937 10,497 3 10,500 4 4 4
Cloud and software 13,742 1 13,743 –37 13,706 12,663 4 12,668 9 8 8
Services 2,914 0 2,914 –12 2,902 2,675 0 2,675 9 9 8
Total revenue 16,656 1 16,657 –49 16,608 15,339 4 15,343 9 9 8
Operating Expense Numbers
Cost of cloud subscriptions and support
–1,216 178 –1,039 –939 182 –758 29 37
Cost of software licenses and support
–1,646 151 –1,495 –1,543 170 –1,373 7 9
Cost of cloud and software –2,862 329 –2,533 –2,483 352 –2,131 15 19
Cost of services –2,366 126 –2,240 –2,282 74 –2,208 4 1
Total cost of revenue –5,228 455 –4,773 –4,765 426 –4,339 10 10
Gross profit 11,428 455 11,884 10,574 430 11,004 8 8
Research and development –2,475 216 –2,258 –2,184 135 –2,049 13 10
Sales and marketing –5,055 536 –4,519 –4,452 404 –4,048 14 12
General and administration –820 109 –710 –727 83 –644 13 10
Restructuring –174 174 0 –20 20 0 >100 NA
Other operating income/expense, net
9 0 9 –5 0 –5 <-100 <-100
Total operating expenses –13,743 1,491 –12,252 46 –12,206 –12,154 1,069 –11,085 13 11 10
Profit Numbers
Operating profit 2,913 1,492 4,405 –3 4,402 3,184 1,073 4,258 –9 3 3
Other non-operating income/expense, net
–6 0 –6 –180 0 –180 –97 –97
Finance income 273 0 273 105 0 105 >100 >100
Finance costs –213 0 –213 –210 0 –210 2 2
Financial income, net 59 0 59 –105 0 –105 <-100 <-100
Profit before tax 2,966 1,492 4,458 2,900 1,073 3,973 2 12
Income tax expense –777 –461 –1,238 –792 –350 –1,142 –2 8
Profit after tax 2,189 1,031 3,220 2,108 724 2,832 4 14
Attributable to owners of parent
2,172 1,031 3,203 2,118 724 2,842 3 13
Attributable to non-controlling interests
17 0 17 –10 0 –10 <-100 <-100
Key Ratios
Operating margin (in %) 17.5 26.4 26.5 20.8 27.8 –3.3pp –1.3pp –1.2pp
Effective tax rate (in %)3) 26.2 27.8 27.3 28.7 –1.1pp –1.0pp
Earnings per share, basic (in €) 1.81 2.67 1.77 2.37 3 13
1) Adjustments in the revenue line items are for software support revenue, cloud subscriptions and support revenue, and other similarly recurring revenues that
entities acquired by SAP would have recognized had they remained stand-alone entities but that SAP is not permitted to recognize as revenue under IFRS as a

SAP Q3 2017 Quarterly Statement 23
result of business combination accounting rules. Adjustments in the operating expense line items are for acquisition-related charges, share-based payment
expenses, as well as restructuring expenses.
2) Constant currency revenue and operating income figures are calculated by translating revenue and operating income of the current period using the average
exchange rates from the previous year's respective period instead of the current period. Constant currency period-over-period changes are calculated by
comparing the current year's non-IFRS constant currency numbers with the non-IFRS number of the previous year's respective period.
For a more detailed description of these adjustments and their limitations as well as our constant currency figures, see our Web site www.sap.com/corporate-
en/investors/newsandreports/reporting-framework.epx under “Non-IFRS Measures, Adjustments and Full-Year Estimates”.
3) The difference between our effective tax rate (IFRS) and effective tax rate (non-IFRS) in the first nine months of 2017 and 2016 mainly results from tax effects
of acquisition-related charges and share-based payment expenses.
Due to rounding, numbers may not add up precisely.

24 SAP Q3 2017 Quarterly Statement
Non-IFRS Adjustments – Actuals and Estimates
€ millions Estimated Amounts for Full Year 2017
Q3 2017 Q1–Q3 2017
Q3 2016 Q1–Q3 2016
Operating profit (IFRS) 1,314 2,913 1,103 3,184
Revenue adjustments <20 0 1 1 4
Adjustment for acquisition-related charges 580 to 610 140 449 168 504
Adjustment for share-based payment expenses 1,000 to 1,150 250 868 368 545
Adjustment for restructuring1) 150 to 200 –67 174 –1 20
Operating expense adjustments 323 1,491 534 1,069
Operating profit adjustments 323 1,492 535 1,073
Operating profit (non-IFRS) 1,637 4,405 1,638 4,258
1) reflects our expectations for restructuring activities in our services and support business
SAP Q3 2017 Quarterly Statement 25
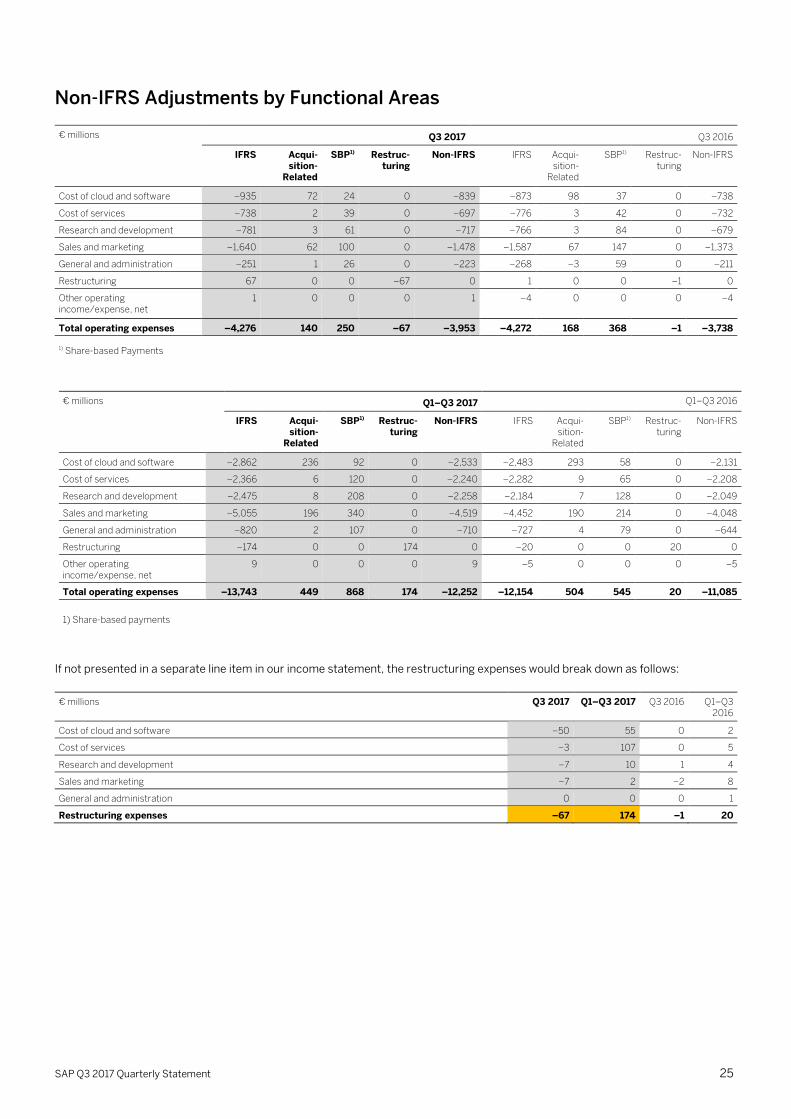
Non-IFRS Adjustments by Functional Areas
€ millions Q3 2017 Q3 2016
IFRS Acqui-sition-
Related
SBP1) Restruc-turing
Non-IFRS IFRS Acqui- sition-
Related
SBP1) Restruc-turing
Non-IFRS
Cost of cloud and software –935 72 24 0 –839 –873 98 37 0 –738
Cost of services –738 2 39 0 –697 –776 3 42 0 –732
Research and development –781 3 61 0 –717 –766 3 84 0 –679
Sales and marketing –1,640 62 100 0 –1,478 –1,587 67 147 0 –1,373
General and administration –251 1 26 0 –223 –268 –3 59 0 –211
Restructuring 67 0 0 –67 0 1 0 0 –1 0
Other operating income/expense, net
1 0 0 0 1 –4 0 0 0 –4
Total operating expenses –4,276 140 250 –67 –3,953 –4,272 168 368 –1 –3,738
1) Share-based Payments
€ millions Q1–Q3 2017 Q1–Q3 2016
IFRS Acqui- sition-
Related
SBP1) Restruc-turing
Non-IFRS IFRS Acqui- sition-
Related
SBP1) Restruc-turing
Non-IFRS
Cost of cloud and software –2,862 236 92 0 –2,533 –2,483 293 58 0 –2,131
Cost of services –2,366 6 120 0 –2,240 –2,282 9 65 0 –2,208
Research and development –2,475 8 208 0 –2,258 –2,184 7 128 0 –2,049
Sales and marketing –5,055 196 340 0 –4,519 –4,452 190 214 0 –4,048
General and administration –820 2 107 0 –710 –727 4 79 0 –644
Restructuring –174 0 0 174 0 –20 0 0 20 0
Other operating income/expense, net
9 0 0 0 9 –5 0 0 0 –5
Total operating expenses –13,743 449 868 174 –12,252 –12,154 504 545 20 –11,085
1) Share-based payments
If not presented in a separate line item in our income statement, the restructuring expenses would break down as follows:
€ millions Q3 2017 Q1–Q3 2017 Q3 2016 Q1–Q3 2016
Cost of cloud and software –50 55 0 2
Cost of services –3 107 0 5
Research and development –7 10 1 4
Sales and marketing –7 2 –2 8
General and administration 0 0 0 1
Restructuring expenses –67 174 –1 20
26 SAP Q3 2017 Quarterly Statement
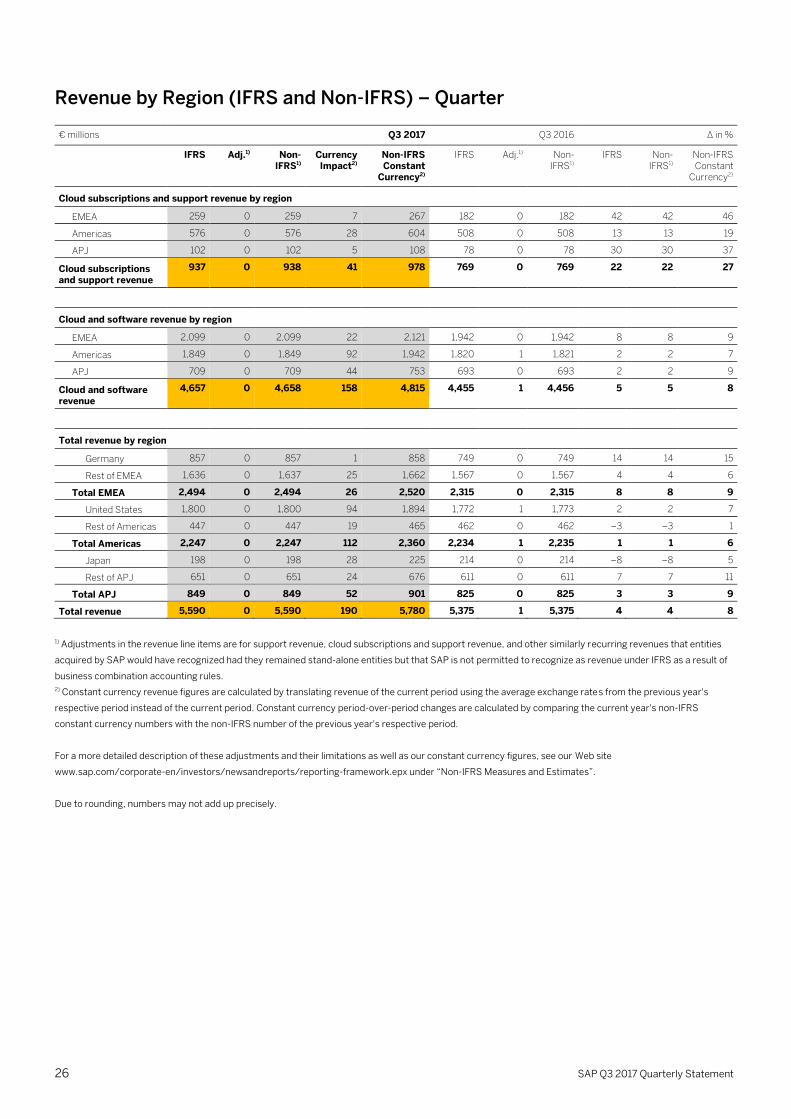
Revenue by Region (IFRS and Non-IFRS) – Quarter
€ millions Q3 2017 Q3 2016 ∆ in %
IFRS Adj.1) Non-IFRS1)
Currency Impact2)
Non-IFRS Constant
Currency2)
IFRS Adj.1) Non-IFRS1)
IFRS Non-IFRS1)
Non-IFRS Constant
Currency2)
Cloud subscriptions and support revenue by region
EMEA 259 0 259 7 267 182 0 182 42 42 46
Americas 576 0 576 28 604 508 0 508 13 13 19
APJ 102 0 102 5 108 78 0 78 30 30 37
Cloud subscriptions and support revenue
937 0 938 41 978 769 0 769 22 22 27
Cloud and software revenue by region
EMEA 2,099 0 2,099 22 2,121 1,942 0 1,942 8 8 9
Americas 1,849 0 1,849 92 1,942 1,820 1 1,821 2 2 7
APJ 709 0 709 44 753 693 0 693 2 2 9
Cloud and software revenue
4,657 0 4,658 158 4,815 4,455 1 4,456 5 5 8
Total revenue by region
Germany 857 0 857 1 858 749 0 749 14 14 15
Rest of EMEA 1,636 0 1,637 25 1,662 1,567 0 1,567 4 4 6
Total EMEA 2,494 0 2,494 26 2,520 2,315 0 2,315 8 8 9
United States 1,800 0 1,800 94 1,894 1,772 1 1,773 2 2 7
Rest of Americas 447 0 447 19 465 462 0 462 –3 –3 1
Total Americas 2,247 0 2,247 112 2,360 2,234 1 2,235 1 1 6
Japan 198 0 198 28 225 214 0 214 –8 –8 5
Rest of APJ 651 0 651 24 676 611 0 611 7 7 11
Total APJ 849 0 849 52 901 825 0 825 3 3 9
Total revenue 5,590 0 5,590 190 5,780 5,375 1 5,375 4 4 8
1) Adjustments in the revenue line items are for support revenue, cloud subscriptions and support revenue, and other similarly recurring revenues that entities
acquired by SAP would have recognized had they remained stand-alone entities but that SAP is not permitted to recognize as revenue under IFRS as a result of
business combination accounting rules.
2) Constant currency revenue figures are calculated by translating revenue of the current period using the average exchange rates from the previous year's
respective period instead of the current period. Constant currency period-over-period changes are calculated by comparing the current year's non-IFRS
constant currency numbers with the non-IFRS number of the previous year's respective period.
For a more detailed description of these adjustments and their limitations as well as our constant currency figures, see our Web site
www.sap.com/corporate-en/investors/newsandreports/reporting-framework.epx under “Non-IFRS Measures and Estimates”.
Due to rounding, numbers may not add up precisely.

SAP Q3 2017 Quarterly Statement 27
Revenue by Region (IFRS and Non-IFRS) – Year-to-Date
€ millions Q1–Q3 2017 Q1–Q3 2016 ∆ in %
IFRS Adj.1) Non-IFRS1)
Currency Impact2)
Non-IFRS Constant
Currency2)
IFRS Adj.1) Non-IFRS1)
IFRS Non-IFRS1)
Non-IFRS Constant
Currency2)
Cloud subscriptions and support revenue by region
EMEA 738 0 738 6 744 511 0 512 44 44 45
Americas 1,735 0 1,735 –9 1,726 1,450 1 1,451 20 20 19
APJ 302 0 302 –3 299 205 0 205 47 47 46
Cloud subscriptions and support revenue
2,775 0 2,775 –6 2,769 2,166 2 2,168 28 28 28
Cloud and software revenue by region
EMEA 5,992 0 5,992 –22 5,970 5,499 1 5,499 9 9 9
Americas 5,572 1 5,573 –18 5,555 5,213 4 5,216 7 7 6
APJ 2,178 0 2,178 3 2,182 1,952 0 1,952 12 12 12
Cloud and software revenue
13,742 1 13,743 –37 13,706 12,663 4 12,668 9 8 8
Total revenue by region
Germany 2,312 0 2,312 –2 2,310 2,035 0 2,035 14 14 14
Rest of EMEA 4,886 0 4,886 –22 4,864 4,597 1 4,597 6 6 6
Total EMEA 7,198 0 7,199 –24 7,174 6,632 1 6,632 9 9 8
United States 5,488 1 5,488 –7 5,481 5,116 4 5,120 7 7 7
Rest of Americas 1,358 0 1,358 –19 1,339 1,260 0 1,260 8 8 6
Total Americas 6,846 1 6,847 –27 6,820 6,376 4 6,380 7 7 7
Japan 647 0 647 23 670 583 0 583 11 11 15
Rest of APJ 1,964 0 1,964 –20 1,944 1,748 0 1,748 12 12 11
Total APJ 2,612 0 2,612 2 2,614 2,331 0 2,331 12 12 12
Total revenue 16,656 1 16,657 –49 16,608 15,339 4 15,343 9 9 8
1) Adjustments in the revenue line items are for support revenue, cloud subscriptions and support revenue, and other similarly recurring revenues that entities
acquired by SAP would have recognized had they remained stand-alone entities but that SAP is not permitted to recognize as revenue under IFRS as a result of
business combination accounting rules.
2) Constant currency revenue figures are calculated by translating revenue of the current period using the average exchange rates from the previous year's
respective period instead of the current period. Constant currency period-over-period changes are calculated by comparing the current year's non-IFRS
constant currency numbers with the non-IFRS number of the previous year's respective period.
For a more detailed description of these adjustments and their limitations as well as our constant currency figures, see our Web site
www.sap.com/corporate-en/investors/newsandreports/reporting-framework.epx under “Non-IFRS Measures and Estimates”.
Due to rounding, numbers may not add up precisely.
28 SAP Q3 2017 Quarterly Statement
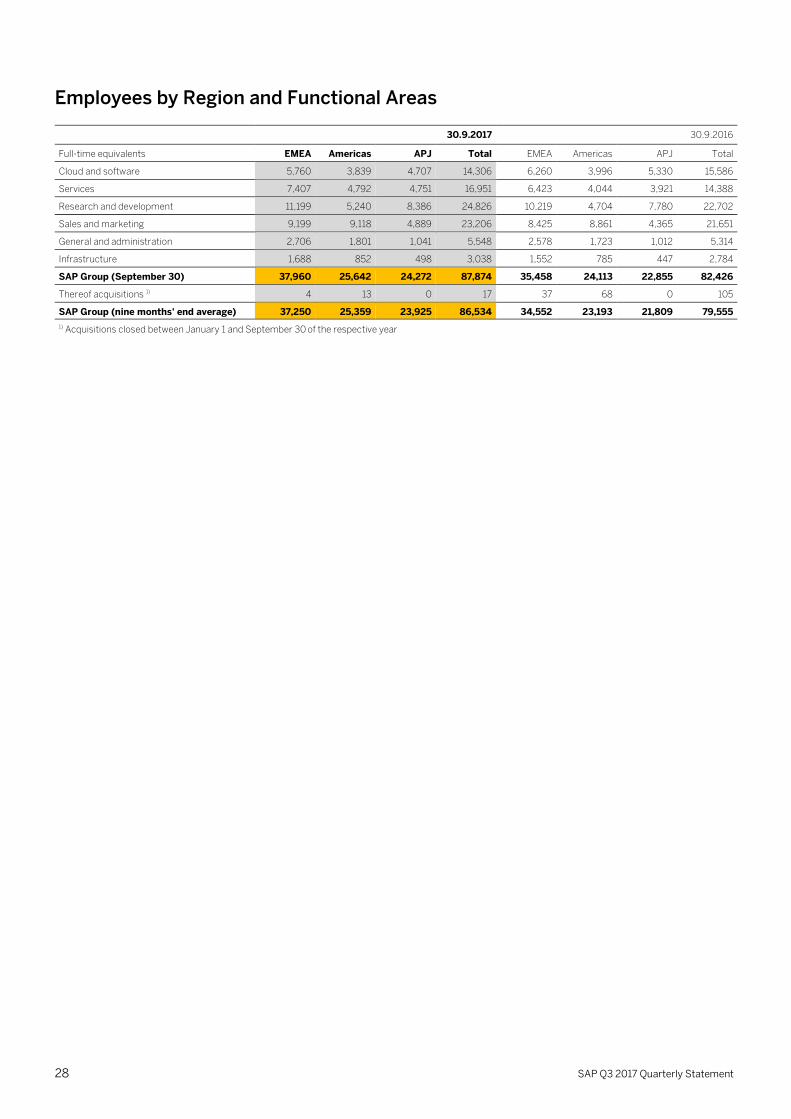
Employees by Region and Functional Areas
30.9.2017 30.9.2016
Full-time equivalents EMEA Americas APJ Total EMEA Americas APJ Total
Cloud and software 5,760 3,839 4,707 14,306 6,260 3,996 5,330 15,586
Services 7,407 4,792 4,751 16,951 6,423 4,044 3,921 14,388
Research and development 11,199 5,240 8,386 24,826 10,219 4,704 7,780 22,702
Sales and marketing 9,199 9,118 4,889 23,206 8,425 8,861 4,365 21,651
General and administration 2,706 1,801 1,041 5,548 2,578 1,723 1,012 5,314
Infrastructure 1,688 852 498 3,038 1,552 785 447 2,784
SAP Group (September 30) 37,960 25,642 24,272 87,874 35,458 24,113 22,855 82,426
Thereof acquisitions 1) 4 13 0 17 37 68 0 105
SAP Group (nine months' end average) 37,250 25,359 23,925 86,534 34,552 23,193 21,809 79,555
1) Acquisitions closed between January 1 and September 30 of the respective year

SAP Q3 2017 Quarterly Statement 29
Any statements contained in this document that are not historical facts are forward-looking statements as defined in the U.S. Private Securities Litigation
Reform Act of 1995. Words such as “anticipate,” “believe,” “estimate,” “expect,” “forecast,” “intend,” “may,” “plan,” “project,” “predict,” “should” and “will” and
similar expressions as they relate to SAP are intended to identify such forward-looking statements. SAP undertakes no obligation to publicly update or revise any
forward-looking statements. All forward-looking statements are subject to various risks and uncertainties that could cause actual results to differ materially from
expectations. The factors that could affect SAP's future financial results are discussed more fully in SAP's filings with the U.S. Securities and Exchange
Commission ("SEC"), including SAP's most recent Annual Report on Form 20-F filed with the SEC. Readers are cautioned not to place undue reliance on these
forward-looking statements, which speak only as of their dates.
© 2017 SAP SE. All rights reserved.
No part of this publication may be reproduced or transmitted in any form or for any purpose without the express permission of SAP SE. The information
contained herein may be changed without prior notice.
Some software products marketed by SAP SE and its distributors contain proprietary software components of other software vendors. National product
specifications may vary.
These materials are provided by SAP SE and its affiliated companies ("SAP Group") for informational purposes only, without representation or warranty of any
kind, and SAP Group shall not be liable for errors or omissions with respect to the materials. The only warranties for SAP Group products and services are those
that are set forth in the express warranty statements accompanying such products and services, if any. Nothing herein should be construed as constituting an
additional warranty.
SAP and other SAP products and services mentioned herein as well as their respective logos are trademarks or registered trademarks of SAP SE (or an SAP
affiliate company) in Germany and other countries. Please see http://www.sap.com/corporate-en/legal/copyright/index.epx#trademark for additional
trademark information and notices.