sapporo 20/06/2007susy 2010: performances with early data c.guyot 1 data quality and strategies for...
TRANSCRIPT
Sapporo 20/06/2007 Susy 2010: Performances with early data C.Guyot
1
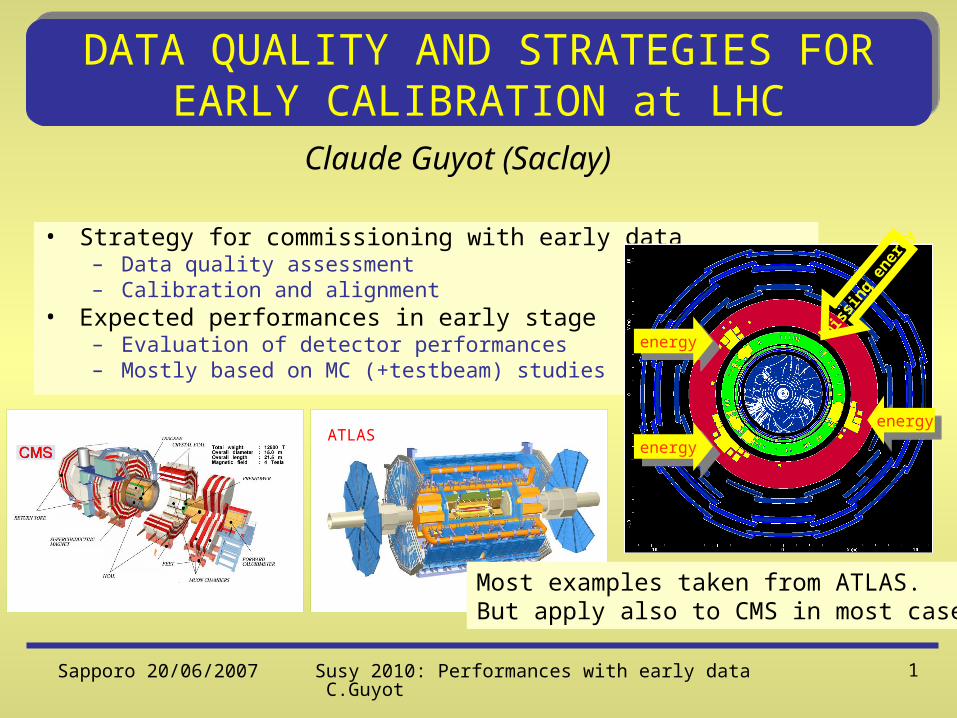
DATA QUALITY AND STRATEGIES FOR EARLY CALIBRATION at LHC
• Strategy for commissioning with early data– Data quality assessment– Calibration and alignment
• Expected performances in early stage– Evaluation of detector performances– Mostly based on MC (+testbeam) studies
Claude Guyot (Saclay)
ATLAS
Most examples taken from ATLAS.But apply also to CMS in most cases
energyenergy
energyenergyenergyenergy
mis
sing
ene
rgy

Sapporo 20/06/2007 Susy 2010: Performances with early data C.Guyot
2
Expected luminosities for the first year
Proposed scenario for early physics:
First collisions at 14 TeV: July 2008 ? after system and beam commissioning ~4 months of proton-proton physics run in 2008 phase 1: 43 bunches, L ~ 5 x 1030 phase 2: 75 ns, L ~1 x 1031 3 x 1031 End 2008: pilot run 25 ns, L ~ 1 x 1032
Integrated luminosity end of 2008: 100 - 300 pb-1 ? (100 pb-1 = 120 effective days @ 1031 cm-2s-1)
Restart in spring 2009 with L ~ a few 1032
=> Integrated luminosity end of 2009: 1-3 fb-1 ?

Sapporo 20/06/2007 Susy 2010: Performances with early data C.Guyot
3
How many events per experiment for calibration at the beginning ?
similar statisticsto CDF, D0 today
l e or Assumed selection efficiency:W l, Z ll : 20%tt l+X : 1.5% (no b-tag, inside mass bin)
+ lots of minimum-bias and jets (107 events in 2 weeks of data taking if 20% of trigger bandwidth allocated)
100 pb-1 3 months at 1031 or few days at 1032 , =50%
1 fb-1 6 month at 1032, =50%
F. Gianotti
Sapporo 20/06/2007 Susy 2010: Performances with early data C.Guyot
4
Data Quality Will Drive the Success of LHC Experiments
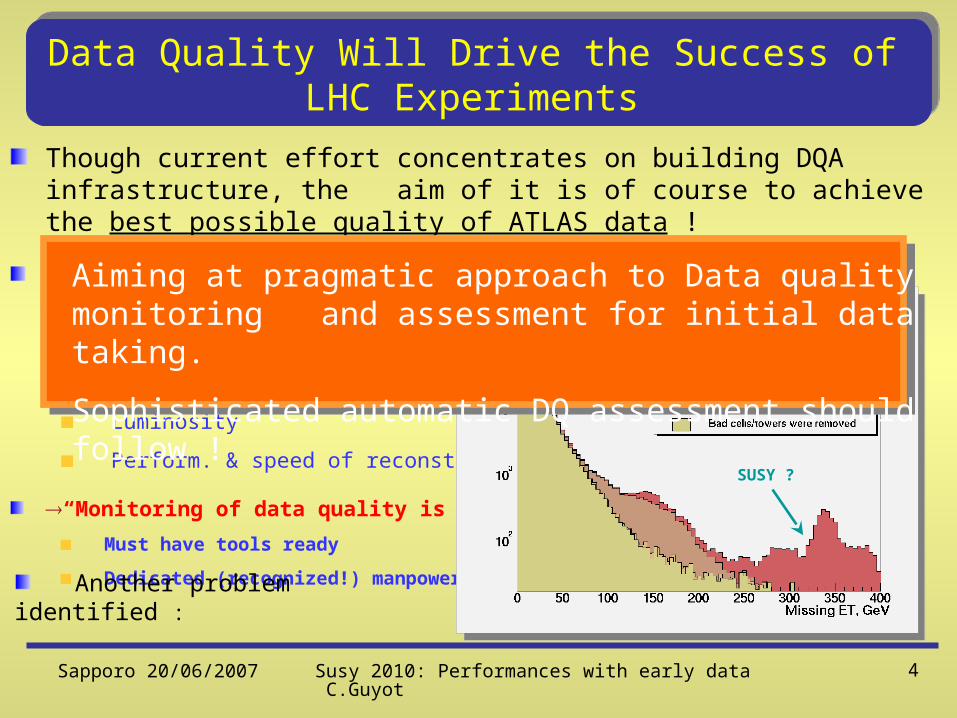
Though current effort concentrates on building DQA infrastructure, the aim of it is of course to achieve the best possible quality of ATLAS data !
CDF, DØ found that physics output of first 3 years of Run II was limited (a.o.) by:
Calorimeter calibration and noise
Tracking and calorimeter alignment
Luminosity
Perform. & speed of reconstruction
“Monitoring of data quality is the key”
Must have tools ready
Dedicated (recognized!) manpower
Another problem identified :
“Too high standards, perfectionism”
DØ Run II, V. Shary, CALOR04
SUSY ?
Aiming at pragmatic approach to Data quality monitoring and assessment for initial data taking.
Sophisticated automatic DQ assessment should follow !
Sapporo 20/06/2007 Susy 2010: Performances with early data C.Guyot
5
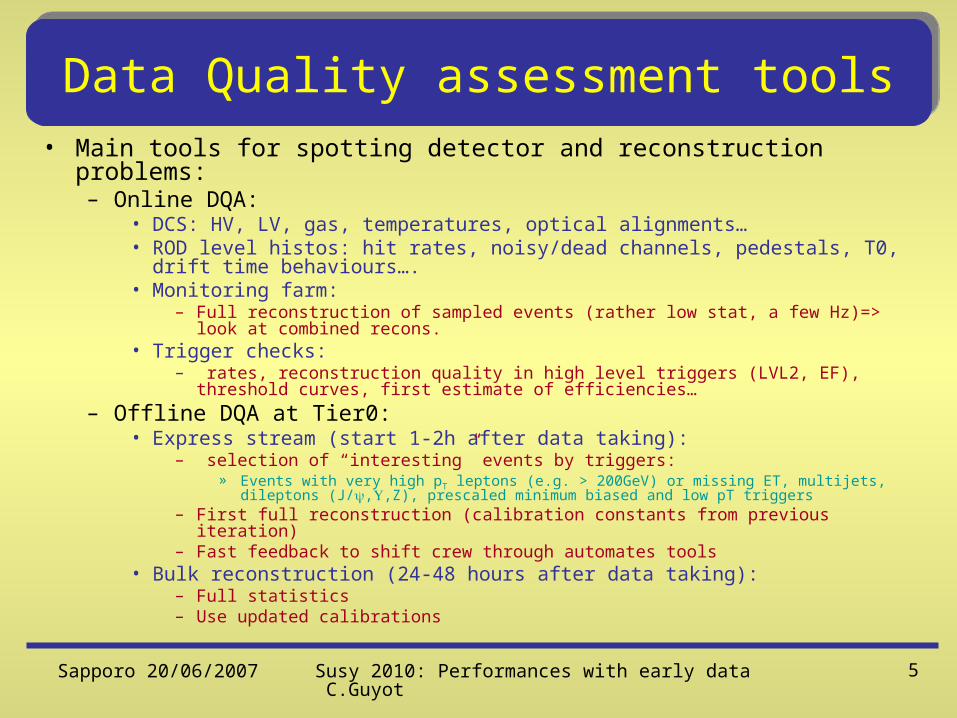
Data Quality assessment tools• Main tools for spotting detector and reconstruction problems:
– Online DQA:• DCS: HV, LV, gas, temperatures, optical alignments…• ROD level histos: hit rates, noisy/dead channels, pedestals, T0, drift
time behaviours….• Monitoring farm:
– Full reconstruction of sampled events (rather low stat, a few Hz)=> look at combined recons.
• Trigger checks:– rates, reconstruction quality in high level triggers (LVL2, EF), threshold
curves, first estimate of efficiencies…– Offline DQA at Tier0:
• Express stream (start 1-2h after data taking):– selection of “interesting” events by triggers:
» Events with very high pT leptons (e.g. > 200GeV) or missing ET, multijets, dileptons (J/,,Z), prescaled minimum biased and low pT triggers
– First full reconstruction (calibration constants from previous iteration)– Fast feedback to shift crew through automates tools
• Bulk reconstruction (24-48 hours after data taking):– Full statistics– Use updated calibrations

Sapporo 20/06/2007 Susy 2010: Performances with early data C.Guyot
6
Data flow and Data Quality Assessment in ATLAS
RA
W d
ata
str
ea
ms:
20
0H
z,
32
0M
B/s
express Calibrationstream
ES
D 1
00
MB
/sA
OD
20
MB
/s
Prompt bulk reconstruction
T1
tra
nsf
er
T1 (Late Reprocessing)
updated calib
Offline DQA 1
Offline DQA 1
updated status
updated status
status updates
CERN Tier0 storage DB from onlineConfig, Calib
DCS, DQ status
+ Calib/align+ DQ status+ Archives
Xpressrecons Calibration
/Alignmentprocessing
Time
Offline DQA 1
Offline DQA 1
status updates
+ Calib/align+ DQ status+ Archives
2h
8h
24h
3 m
on
ths
Online DQA
Online DQA
RODs
Front-end
Trigger Level 1
Trigger Level 2
Event Builder
EF EF EF EF
SFOs
On
line
Da
te B
ase
+ Shift Log+ DQ status+ Archives
Detector Control System
Monitoring farm
Online
~500nodes
>1000 nodes

Sapporo 20/06/2007 Susy 2010: Performances with early data C.Guyot
7
ATLAS CMS
INNER TRACKER
• Silicon pixels + strips• TRT with particle identification• B = 2T
• /pT ~ 2.6% (at 100 GeV, = 0)
• Silicon pixels + strips• No dedicated particle identification• B = 4T
• /pT ~ 1.2% (at 100 GeV, = 0)
MAGNETS
• Solenoid + Air-core muon toroids• Calorimeters outside field • 4 magnets
• Solenoid• Calorimeters inside field• 1 magnet
EM CALORIMETER
• Pb-liquid argon• /E ~ 10% / E 0.5% • Uniform longitudinal segmentation • Saturation at ~ 3 TeV
• PbWO4 crystals • /E ~ 3–5% / E 0.7% • No longitudinal segmentation• Saturation at 1.7 TeV
HAD CALORIMETER• Fe+scint. + Cu-liquid argon (10 ) • /E ~ 50% / E 0.03
• Brass+scint.• /E ~ 100% / E 0.05
MUON SPECTROMETER• Air /pT ~ 10.5% at 1 TeV
(standalone)
• Fe /pT ~ 5% at 1 TeV
(combined with tracker)
ATLAS & CMS: Performance Overview
Sapporo 20/06/2007 Susy 2010: Performances with early data C.Guyot
8
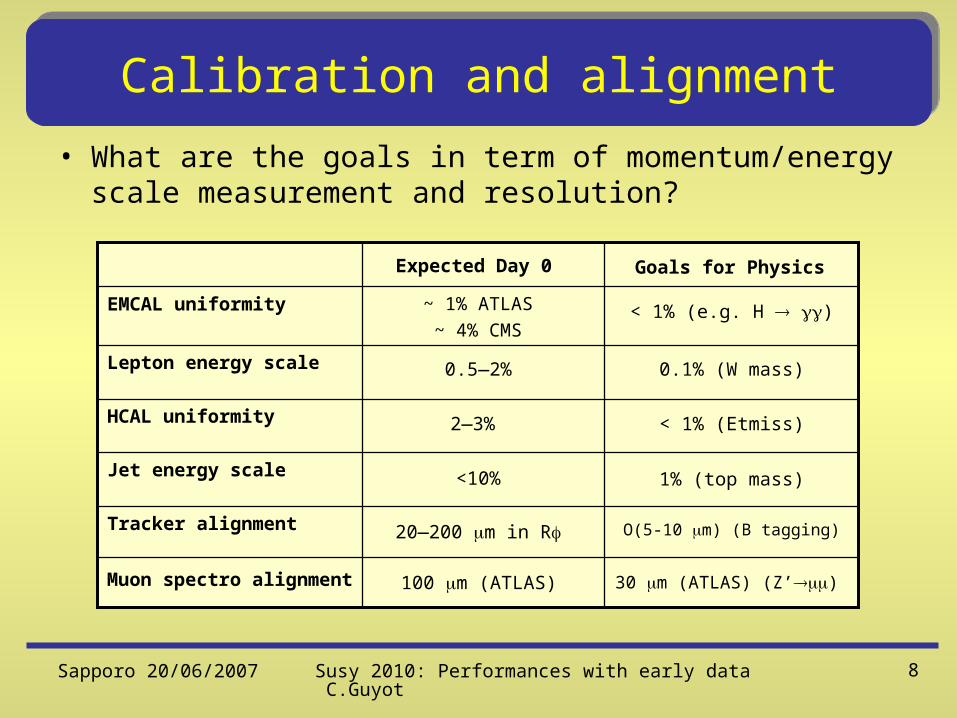
Calibration and alignment
• What are the goals in term of momentum/energy scale measurement and resolution?
O(5-10 m) (B tagging)20—200 m in RTracker alignment
1% (top mass)<10%Jet energy scale
< 1% (Etmiss)2—3% HCAL uniformity
0.1% (W mass)0.5—2%Lepton energy scale
< 1% (e.g. H )~ 1% ATLAS~ 4% CMS
EMCAL uniformity
Goals for PhysicsExpected Day 0
Muon spectro alignment 100 m (ATLAS) 30 m (ATLAS) (Z’)
Sapporo 20/06/2007 Susy 2010: Performances with early data C.Guyot
9
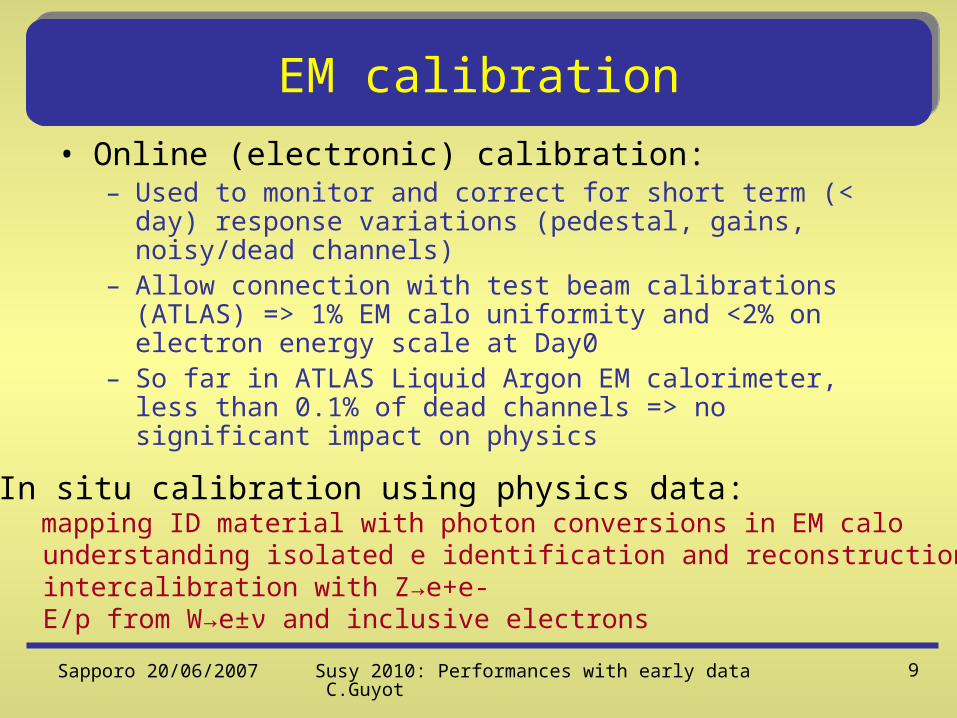
EM calibration
• Online (electronic) calibration:– Used to monitor and correct for short term (< day)
response variations (pedestal, gains, noisy/dead channels)
– Allow connection with test beam calibrations (ATLAS) => 1% EM calo uniformity and <2% on electron energy scale at Day0
– So far in ATLAS Liquid Argon EM calorimeter, less than 0.1% of dead channels => no significant impact on physics
•In situ calibration using physics data: mapping ID material with photon conversions in EM calo understanding isolated e identification and reconstruction intercalibration with Z→e+e- E/p from W→e±ν and inclusive electrons
Sapporo 20/06/2007 Susy 2010: Performances with early data C.Guyot
10
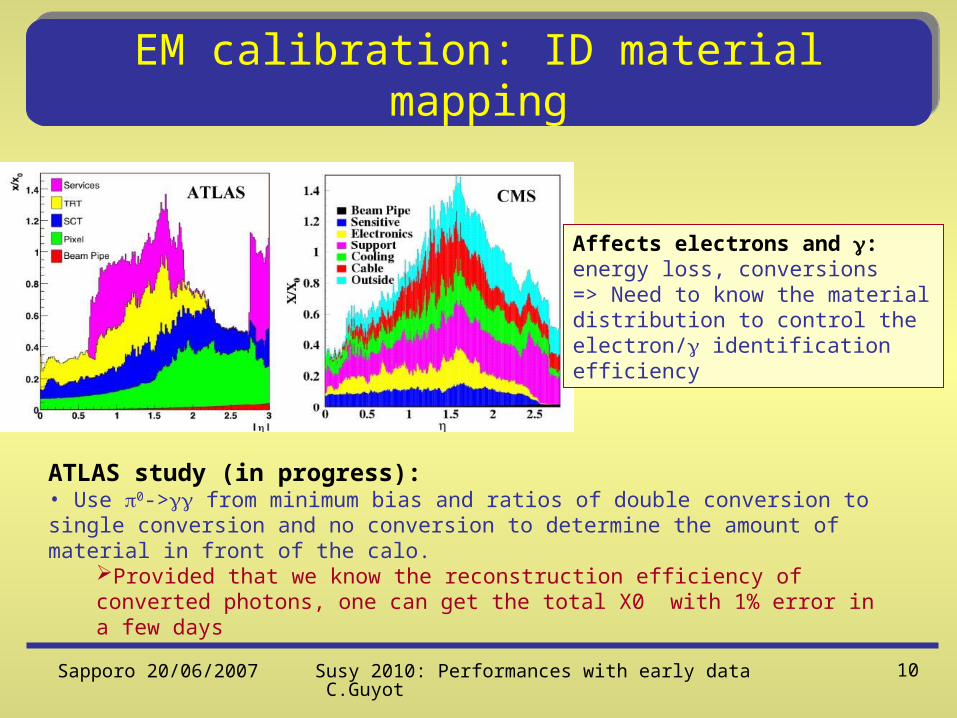
EM calibration: ID material mapping
Affects electrons and : energy loss, conversions => Need to know the material distribution to control the electron/ identification efficiency
ATLAS study (in progress):• Use 0-> from minimum bias and ratios of double conversion to single conversion and no conversion to determine the amount of material in front of the calo.
Provided that we know the reconstruction efficiency of converted photons, one can get the total X0 with 1% error in a few days

Sapporo 20/06/2007 Susy 2010: Performances with early data C.Guyot
11
Events for EM calibration
• Expected statistics of interesting events for calibration and for assessing the EM calorimetry performances
Only at very low lumi
Low energy calibrationUniformity studies
•Use W samples for E/P (calo/tracker) studies•Challenge: How to extrapolate from medium Z->ee energies to very high energies (>200GeV) => rely on test beam and MC simulations
Sapporo 20/06/2007 Susy 2010: Performances with early data C.Guyot
12
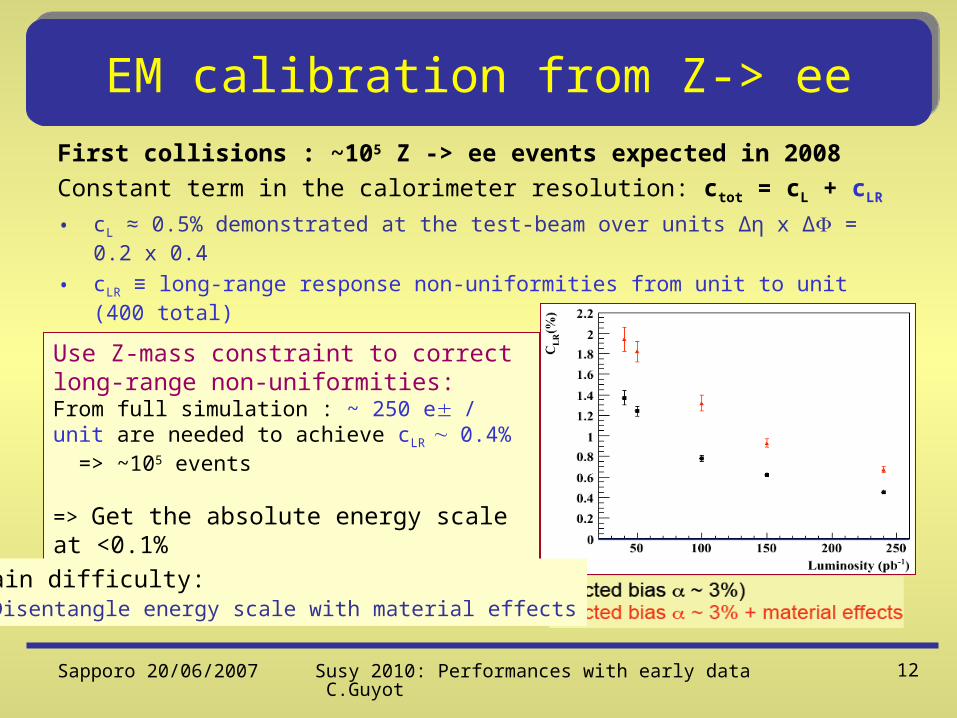
EM calibration from Z-> eeFirst collisions : ~105 Z -> ee events expected in 2008Constant term in the calorimeter resolution: ctot = cL + cLR
• cL ≈ 0.5% demonstrated at the test-beam over units Δη x Δ = 0.2 x 0.4
• cLR ≡ long-range response non-uniformities from unit to unit (400 total)
(module-to-module variations, different upstream material, etc.)
Use Z-mass constraint to correct long-range non-uniformities:From full simulation : ~ 250 e/ unit are needed to achieve cLR 0.4% => ~105 events
=> Get the absolute energy scale at <0.1%
Main difficulty: Disentangle energy scale with material effects
Sapporo 20/06/2007 Susy 2010: Performances with early data C.Guyot
13
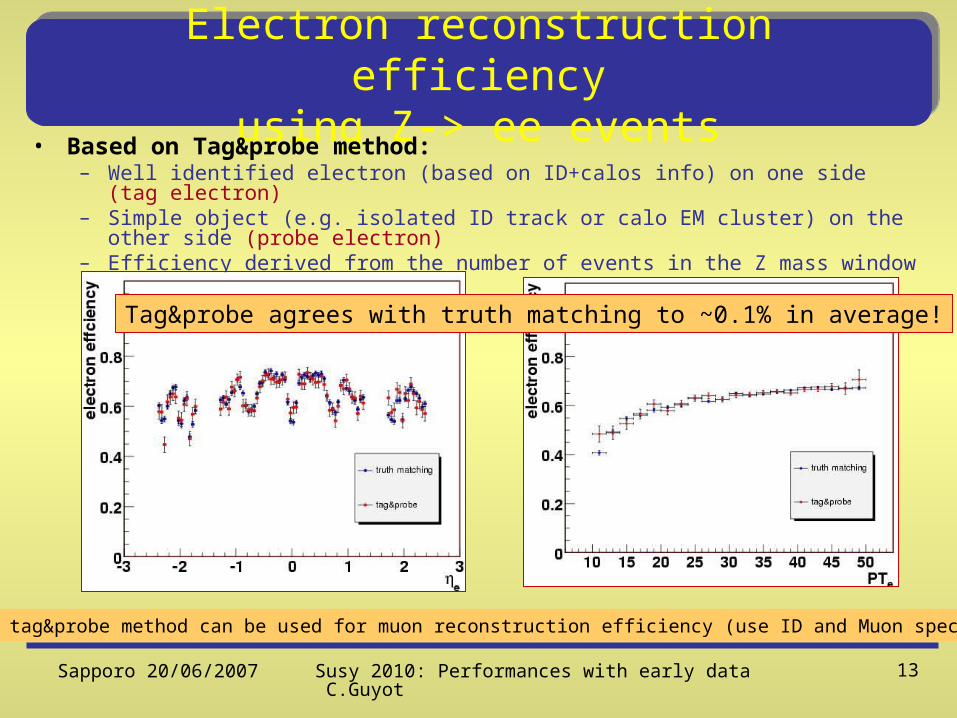
Electron reconstruction efficiencyusing Z-> ee events
• Based on Tag&probe method:– Well identified electron (based on ID+calos info) on one side (tag electron)– Simple object (e.g. isolated ID track or calo EM cluster) on the other side
(probe electron)– Efficiency derived from the number of events in the Z mass window
Tag&probe agrees with truth matching to ~0.1% in average!
A similar tag&probe method can be used for muon reconstruction efficiency (use ID and Muon spectrometer)
Sapporo 20/06/2007 Susy 2010: Performances with early data C.Guyot
14
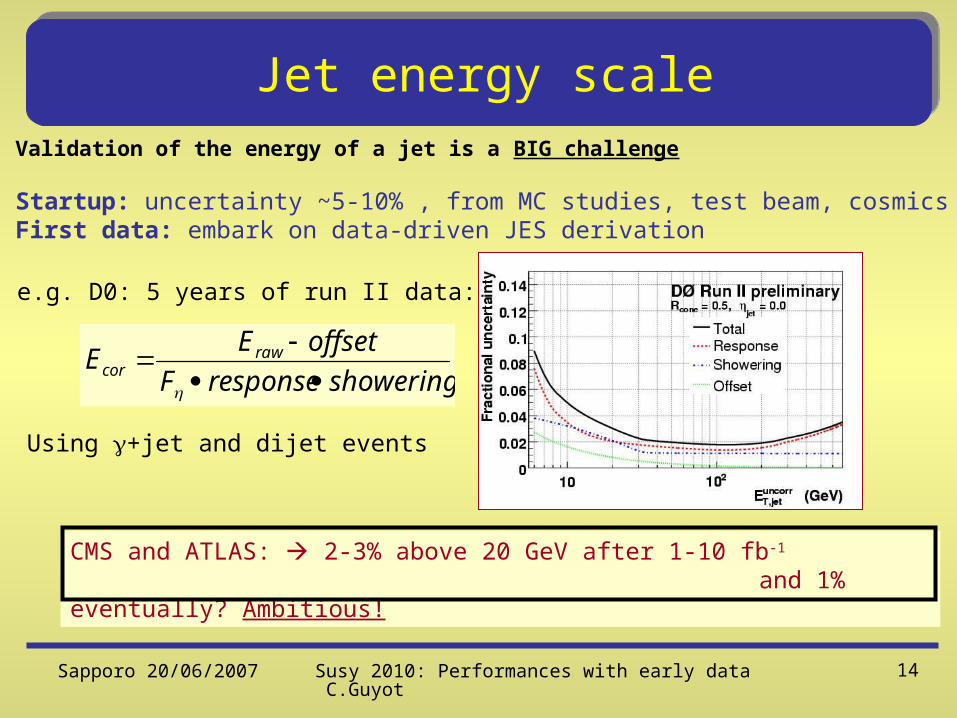
Jet energy scaleValidation of the energy of a jet is a BIG challenge
Startup: uncertainty ~5-10% , from MC studies, test beam, cosmicsFirst data: embark on data-driven JES derivation
e.g. D0: 5 years of run II data:
showeringresponseF
offsetEE rawcor
Using +jet and dijet events
CMS and ATLAS: 2-3% above 20 GeV after 1-10 fb-1
and 1% eventually? Ambitious!

Sapporo 20/06/2007 Susy 2010: Performances with early data C.Guyot
15
Jet energy scale calibration (1)
Jet energy calibration can be divided in 4 steps1. Calorimeter tower/cluster reconstruction2. jet making (cone 0.4/0.7, kT…)
3. jet calibration from calorimeter to particle scale4. jet calibration from particle scale to the parton scale
Difficulties:• Different response to EM and non EM showers•Correct for escaping and invisible energy (K0, neutrons, dead matter in calo..)
Sapporo 20/06/2007 Susy 2010: Performances with early data C.Guyot
16
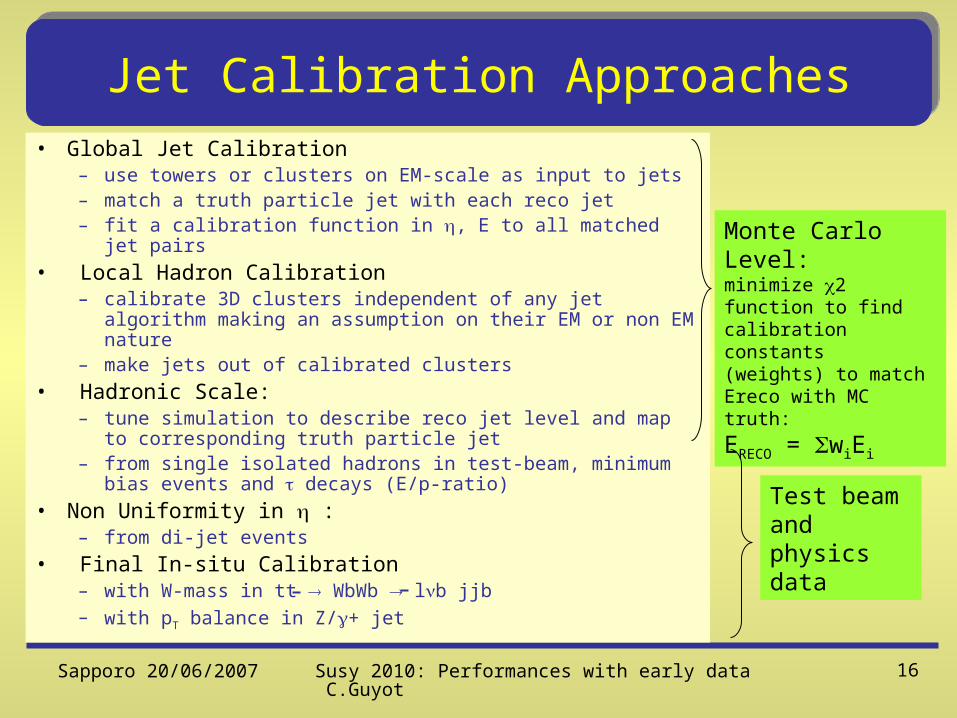
Jet Calibration Approaches• Global Jet Calibration
– use towers or clusters on EM-scale as input to jets– match a truth particle jet with each reco jet– fit a calibration function in , E to all matched jet pairs
• Local Hadron Calibration– calibrate 3D clusters independent of any jet algorithm
making an assumption on their EM or non EM nature– make jets out of calibrated clusters
• Hadronic Scale:– tune simulation to describe reco jet level and map to
corresponding truth particle jet– from single isolated hadrons in test-beam, minimum
bias events and decays (E/p-ratio)• Non Uniformity in :
– from di-jet events• Final In-situ Calibration
– with W-mass in tt WbWb lb jjb– with pT balance in Z/+ jet
Monte Carlo Level:minimize 2 function to find calibration constants(weights) to match Ereco with MC truth:
ERECO = ΣwiEi
Test beam and physics data
Sapporo 20/06/2007 Susy 2010: Performances with early data C.Guyot
17
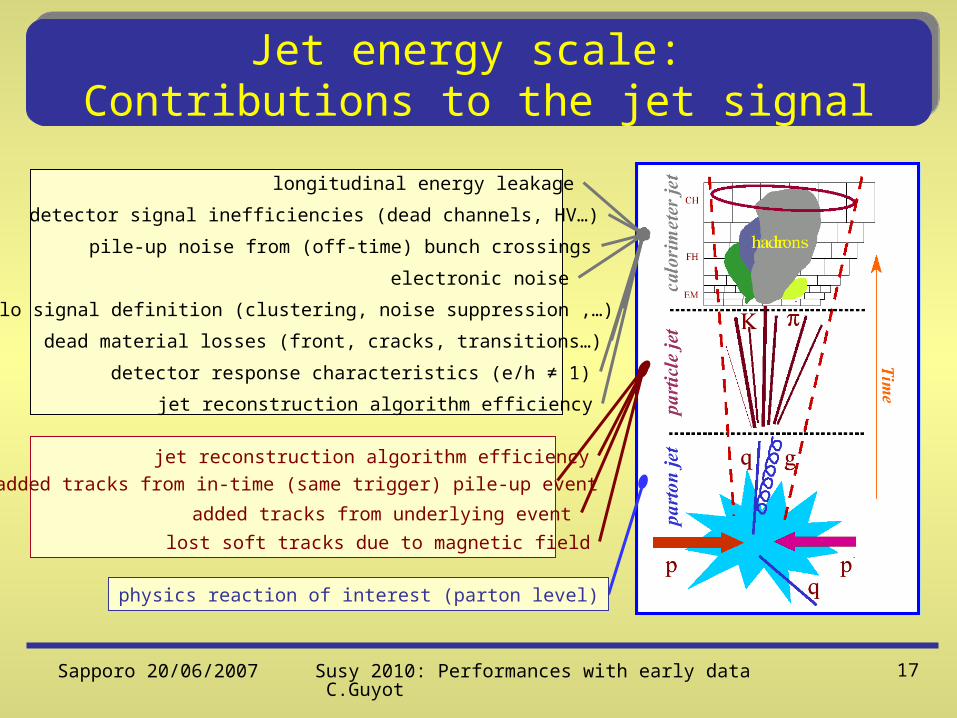
Jet energy scale: Contributions to the jet signal
physics reaction of interest (parton level)
detector response characteristics (e/h ≠ 1)
electronic noise
dead material losses (front, cracks, transitions…)
pile-up noise from (off-time) bunch crossings
detector signal inefficiencies (dead channels, HV…)
longitudinal energy leakage
calo signal definition (clustering, noise suppression ,…)
jet reconstruction algorithm efficiency
lost soft tracks due to magnetic field
added tracks from underlying event
jet reconstruction algorithm efficiency
added tracks from in-time (same trigger) pile-up event
Sapporo 20/06/2007 Susy 2010: Performances with early data C.Guyot
18
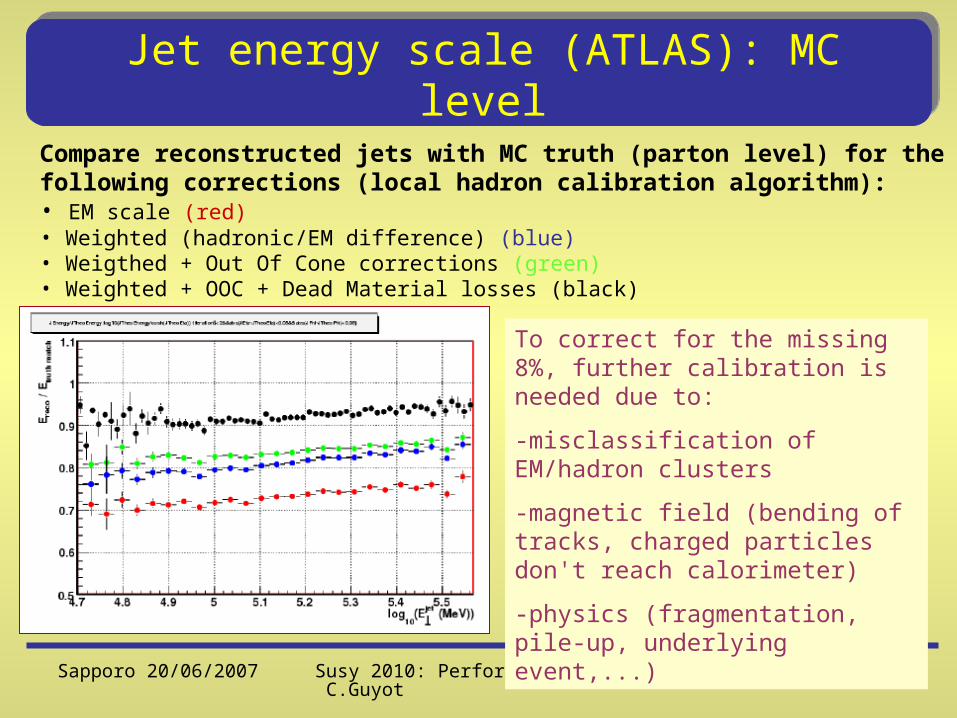
Jet energy scale (ATLAS): MC level
To correct for the missing 8%, further calibration is needed due to:
-misclassification of EM/hadron clusters
-magnetic field (bending of tracks, charged particles don't reach calorimeter)
-physics (fragmentation, pile-up, underlying event,...)
Compare reconstructed jets with MC truth (parton level) for the following corrections (local hadron calibration algorithm):• EM scale (red) • Weighted (hadronic/EM difference) (blue)• Weigthed + Out Of Cone corrections (green)• Weighted + OOC + Dead Material losses (black)
Sapporo 20/06/2007 Susy 2010: Performances with early data C.Guyot
19
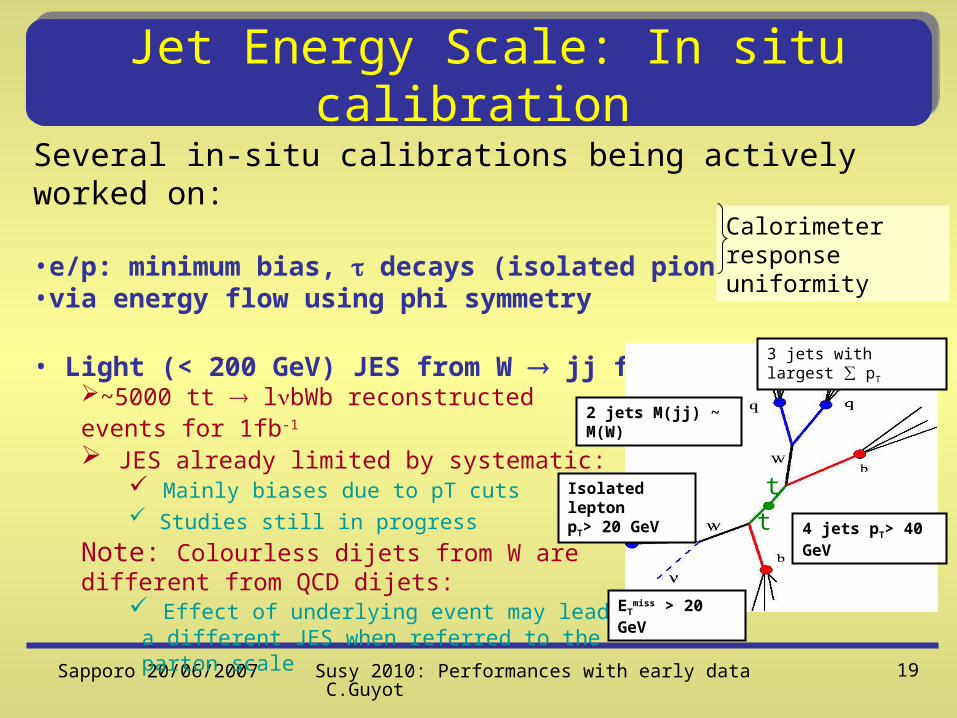
Jet Energy Scale: In situ calibration
Several in-situ calibrations being actively worked on:
•e/p: minimum bias, decays (isolated pions)•via energy flow using phi symmetry
• Light (< 200 GeV) JES from W jj from tt events~5000 tt lbWb reconstructed events for 1fb-1 JES already limited by systematic:
Mainly biases due to pT cuts Studies still in progress
Note: Colourless dijets from W are different from QCD dijets:
Effect of underlying event may lead to a different JES when referred to the parton scale
Calorimeter response uniformity
Isolated lepton pT> 20 GeV
ETmiss > 20 GeV
4 jets pT> 40 GeV
2 jets M(jj) ~ M(W)
3 jets with largest ∑ pT
t
t

Sapporo 20/06/2007 Susy 2010: Performances with early data C.Guyot
20
Jet at EM scale
Jet at particle scale
Potential biases:• sensitivity to ISR/FSR (more to ISR)• contributions from the underlying event • dependent corrections • jet clustering effects • pileup effect (high lumi)
Jet Energy Scale: In situ calibration (2)
• /(Z->ll) + jets energy balance

Sapporo 20/06/2007 Susy 2010: Performances with early data C.Guyot
21
Jet Energy Scale: In situ calibration (3)
• pT balance in QCD dijet for dependence
• Bootstrapping for high energy scale
Basic idea: – select events with at least 3 jets, one having significantly more pT than all others– Balance this jet with the vectorsum of all others
Advantage: - Huge statistics availableDisadvantage: - Indirect method, JES is determined in respect to a lower pT region which has to be sufficiently known- Intercalibration in and required to utilize full statistics

Sapporo 20/06/2007 Susy 2010: Performances with early data C.Guyot
22
Jet Energy Scale: In situ calibration (4)
Bootstrapping
10 Million eventsJES assumed to be known up to 380 GeV
300k eventsJES assumed to be known up to 350 GeV

Sapporo 20/06/2007 Susy 2010: Performances with early data C.Guyot
23
Conclusion on Jet Energy Calibration
Sapporo 20/06/2007 Susy 2010: Performances with early data C.Guyot
24
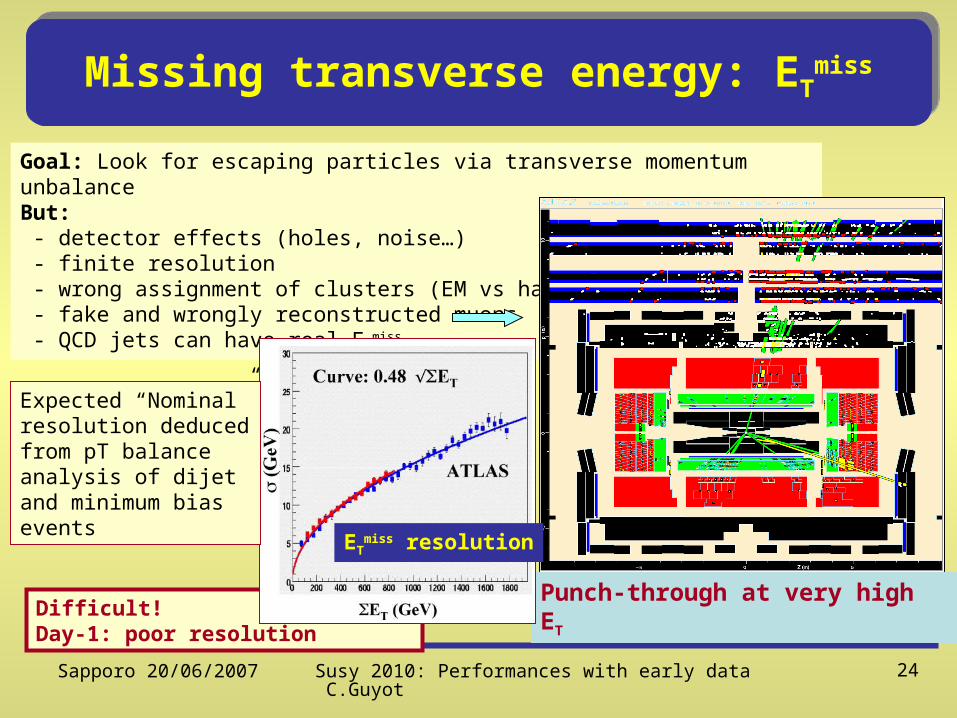
Missing transverse energy: ETmiss
Goal: Look for escaping particles via transverse momentum unbalanceBut: - detector effects (holes, noise…) - finite resolution - wrong assignment of clusters (EM vs hadron) - fake and wrongly reconstructed muons - QCD jets can have real ET
miss
Difficult! Day-1: poor resolution
Punch-through at very high ET
ETmiss resolution
Expected “Nominal” resolution deduced from pT balance analysis of dijet and minimum bias events
Sapporo 20/06/2007 Susy 2010: Performances with early data C.Guyot
25
Missing ET performance assessment
In situ ETmiss scale determination from Z lepton-hadron channel
• Use Single lepton Trigger events
• Select Z lepton-hadron candidates (Opposite Sign lepton-hadron)
• Reconstruct the invariant Z mass (need assumptions on neutrino directions)
• Subtract the backgrounds using the Same Sign lepton-hadron events
• Use the reconstructed invariant mass to tune the EtMiss scale with the first data: what can we do with 100pb-1 ?
In 100 pb-1, expect: ~150000 Z
~ 70000 Z lepton-hadron
~ 7000 with pTe or pTmu> 15GeV

Sapporo 20/06/2007 Susy 2010: Performances with early data C.Guyot
26
In situ EtMiss scale determination from Z lepton-hadron channel
Backgrounds: Inclusive W e (filter cuts: pte>10GeV, |h|<2.7) Inclusive W (filter cuts: ptm>5GeV, |h|<2.8) tt decaying to at least 1 lepton Z ee (filter: mee> 60 GeV, 1e: |h|<2.7, pt>10 GeV) Jets…bb events NOT PRODUCED yet
starting from 70000 Z lepton-hadron events, only ~215 events are selected
The same event sample (with different cuts) can be used to assess the jet scale from the reconstructed visible mass
~5% on EtMiss scale achievable after ~3 months
Sapporo 20/06/2007 Susy 2010: Performances with early data C.Guyot
27
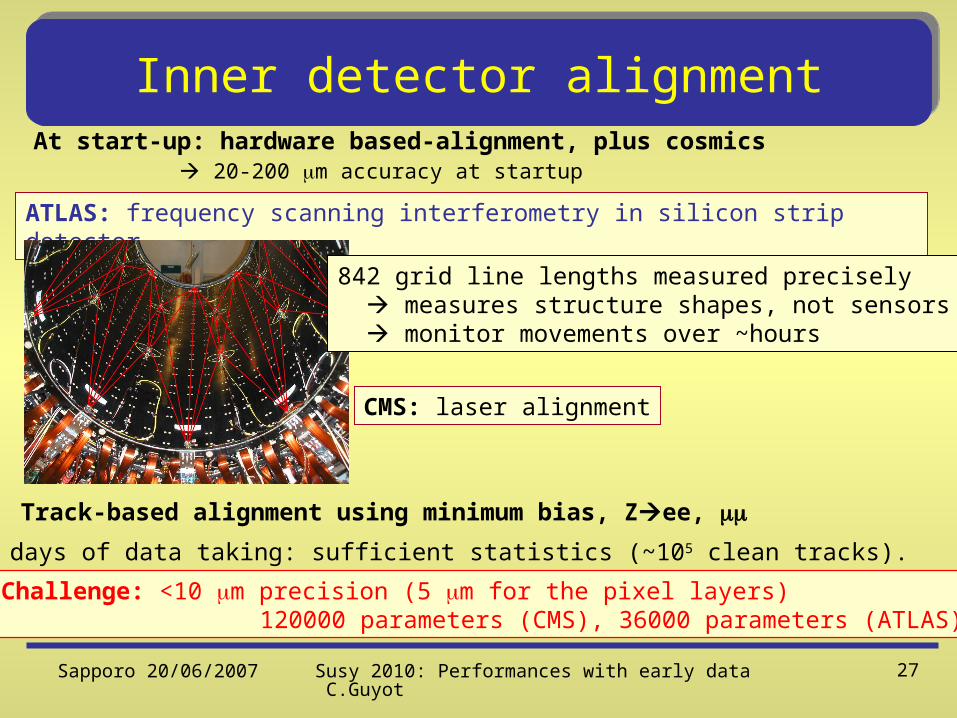
Inner detector alignmentAt start-up: hardware based-alignment, plus cosmics
ATLAS: frequency scanning interferometry in silicon strip detector
CMS: laser alignment
Track-based alignment using minimum bias, Zee,
20-200 m accuracy at startup
842 grid line lengths measured precisely measures structure shapes, not sensors monitor movements over ~hours
Few days of data taking: sufficient statistics (~105 clean tracks).
Challenge: <10 m precision (5 m for the pixel layers) 120000 parameters (CMS), 36000 parameters (ATLAS)
Sapporo 20/06/2007 Susy 2010: Performances with early data C.Guyot
28
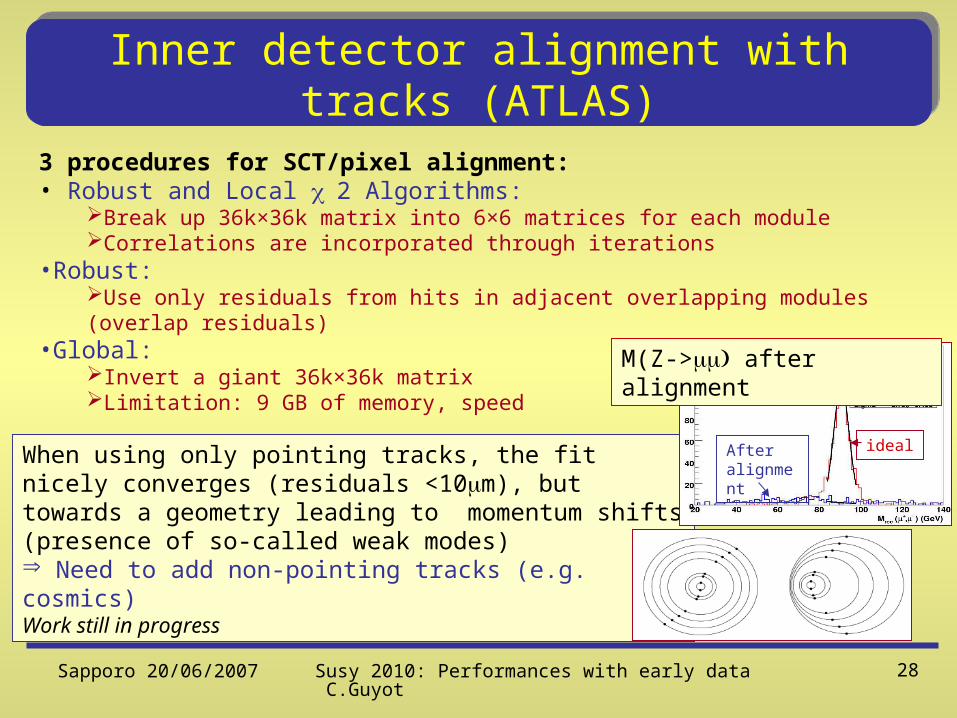
When using only pointing tracks, the fit nicely converges (residuals <10m), but towards a geometry leading to momentum shifts (presence of so-called weak modes) Need to add non-pointing tracks (e.g. cosmics)Work still in progress
Inner detector alignment with tracks (ATLAS)
3 procedures for SCT/pixel alignment:• Robust and Local 2 Algorithms:
Break up 36k×36k matrix into 6×6 matrices for each moduleCorrelations are incorporated through iterations
•Robust:Use only residuals from hits in adjacent overlapping modules (overlap residuals)
•Global:Invert a giant 36k×36k matrixLimitation: 9 GB of memory, speed
idealAfteralignment
M(Z-> after alignment
Sapporo 20/06/2007 Susy 2010: Performances with early data C.Guyot
29
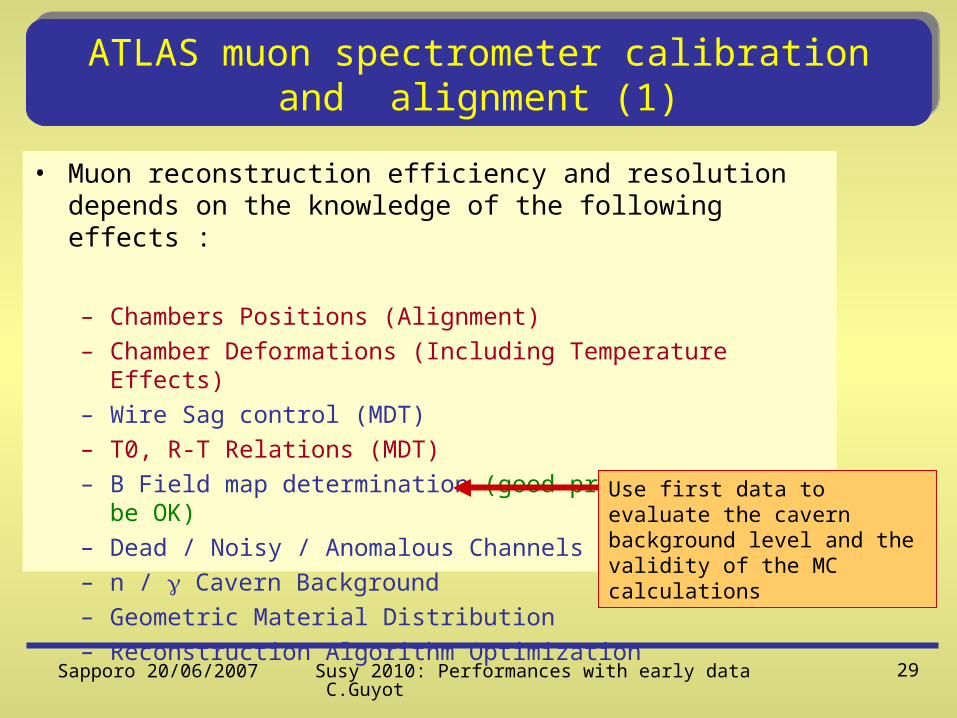
ATLAS muon spectrometer calibration and alignment (1)
• Muon reconstruction efficiency and resolution depends on the knowledge of the following effects :
– Chambers Positions (Alignment)– Chamber Deformations (Including Temperature Effects)– Wire Sag control (MDT)– T0, R-T Relations (MDT)– B Field map determination (good progress,should be OK)– Dead / Noisy / Anomalous Channels (data quality)– n / Cavern Background– Geometric Material Distribution– Reconstruction Algorithm Optimization
Use first data to evaluate the cavern background level and the validity of the MC calculations
Sapporo 20/06/2007 Susy 2010: Performances with early data C.Guyot
30
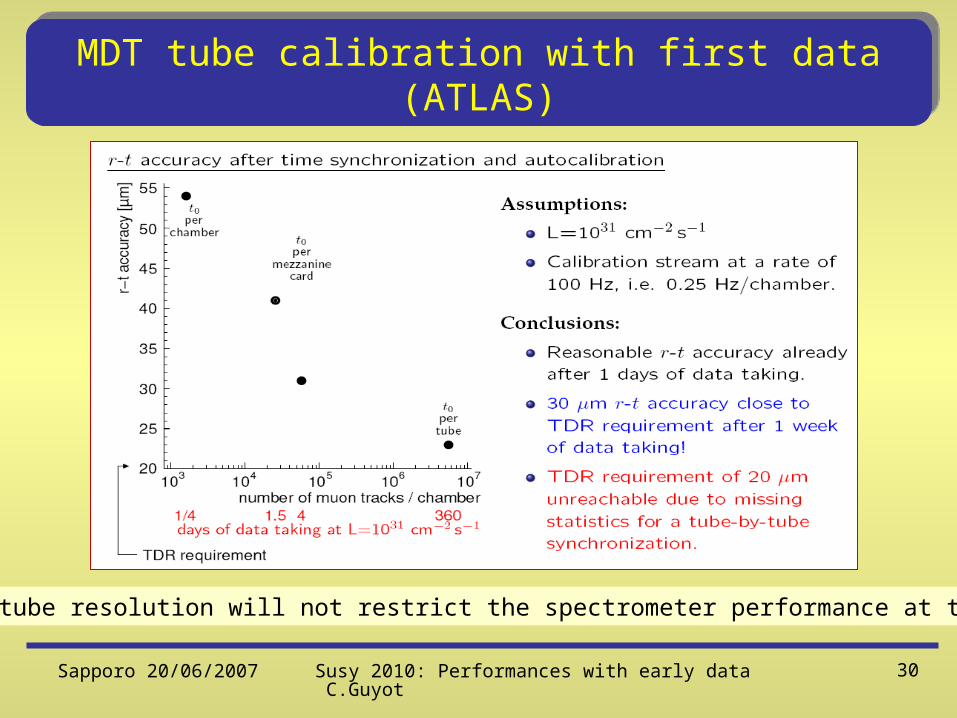
MDT tube calibration with first data (ATLAS)
Single tube resolution will not restrict the spectrometer performance at the start

Sapporo 20/06/2007 Susy 2010: Performances with early data C.Guyot
31
Muon spectrometer alignment (ATLAS)
Muon spectrometer alignment primarily based on optical systems (~10000 CCD/CMOS sensors)
End CapBarrel
In the absolute mode (based on positioning and calibration precision of the sensors), a level of ~100-200 m on sagitta measurement should be reached.But, from X-ray tomography, we know that a significant fraction of the sensors are badly positioned (>500m, especially in the barrel)
Sapporo 20/06/2007 Susy 2010: Performances with early data C.Guyot
32
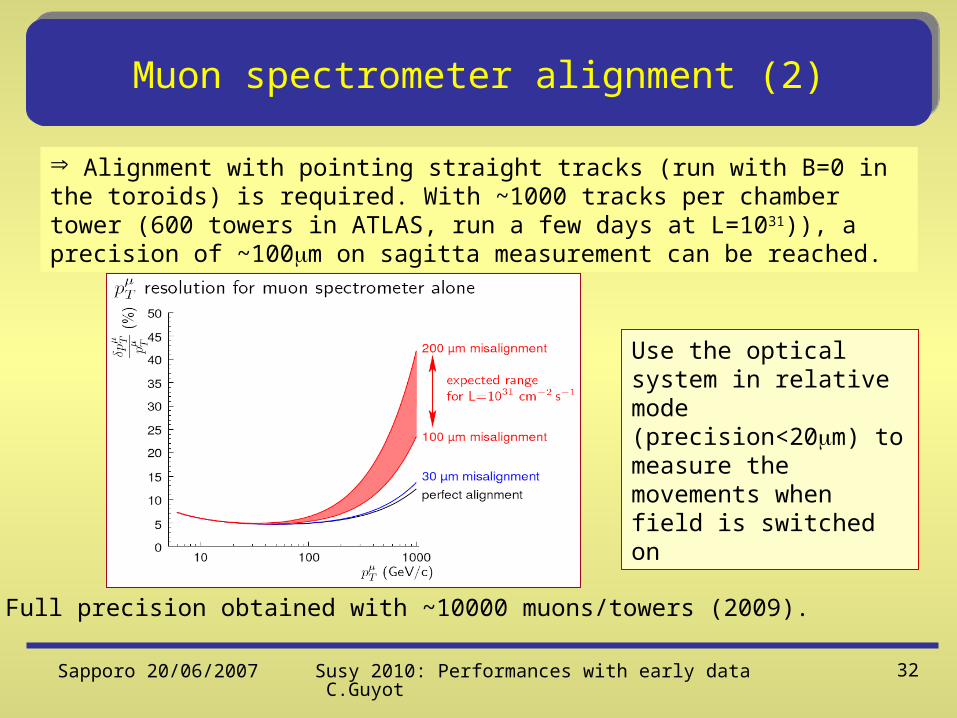
Muon spectrometer alignment (2)
Alignment with pointing straight tracks (run with B=0 in the toroids) is required. With ~1000 tracks per chamber tower (600 towers in ATLAS, run a few days at L=1031)), a precision of ~100m on sagitta measurement can be reached.
Full precision obtained with ~10000 muons/towers (2009).
Use the optical system in relative mode (precision<20m) to measure the movements when field is switched on

Sapporo 20/06/2007 Susy 2010: Performances with early data C.Guyot
33
High mass di-muon pairs
High mass: sensitive to Z’, graviton resonances, etc.Also: large extra dimensions: deviations from SM spectrum
Impact of misalignments on signal and Drell Yan background reconstruction

Sapporo 20/06/2007 Susy 2010: Performances with early data C.Guyot
34
Summary and comments (1) Not an exhaustive review!No discussed:-Tau calibration-B tagging-All trigger level calibrations-Trigger efficiencies assessment (using pass-through triggers)-B field -Relative ID-Muon spectro alignment with tracks (ATLAS)-Very low energy muon identification (calo only or calo + first muon layer)-Gamma, jet pointing precisions..…+- Test beam results- Simulation aspects (detector description and Geant4 tuning to reproduce the detectors response at test beams-Software infrastructures (online + offline)-….many other topics related to Data Quality!
Thanks to the numerous ATLAS collegues who provided me with a lot of this material

Sapporo 20/06/2007 Susy 2010: Performances with early data C.Guyot
35
Summary and comments (2)
•Hope that we can start LHC operations with reasonably efficient and calibrated detectors:
E.g. <2% on e/ and energy scale, <5% on jet scale and <10% on ETmiss.Should be sufficient for hunting the possible non-standard phenomena which can show up with the first data (Susy, Black holes!...)
•Data Quality Assessment will be of utmost importanceDQA software infrastructure should be ready in time for fast feedback on the hardware side:
Dead/noisy channels, cabling maps, wrong calibration/ alignment constants,…Fast feedback on trigger from trigger performance assessment is also mandatory
Keep it simple at the start (few basic histos) but flexible (changing conditions)
• Commissioning is very important: Do as much as possible with cosmics and beam halo prior to collisions:
e.g. alignment, dead/noisy channels, cabling maps…DQA tools