sar test report - fccid.io · sar test report report no.: ... the xl robot series have many...
TRANSCRIPT

Page 1 of 108
SAR Test Report
Report No.: AGC09674170301FH01
FCC ID : 2AAE9CAPHG43
APPLICATION PURPOSE : Original Equipment
PRODUCT DESIGNATION : Smartphone-Miracle 6.0 S
BRAND NAME : CellAllure
MODEL NAME : Miracle 6.0 S, CAPHG43
CLIENT : GNJ Manufacturing Inc.
DATE OF ISSUE : Mar. 29,2017
STANDARD(S) : IEEE Std. 1528:2013 FCC 47CFR § 2.1093 IEEE/ANSI C95.1:2005
REPORT VERSION : V1.0
Attestation of Global Compliance(Shenzhen) Co., Ltd.
CAUTION: This report shall not be reproduced except in full without the written permission of the test laboratory and shall not be quoted out of context.

Report No.: AGC09674170301FH01 Page 2 of 108
Report Revise Record
Report Version Revise Time Issued Date Valid Version Notes
V1.0 / Mar. 29,2017 Valid Original Report

Report No.: AGC09674170301FH01 Page 3 of 108
Test Report Certification Applicant Name GNJ Manufacturing Inc.
Applicant Address 5811 West Hallandale Beach Blvd. West Park , FL 33023
Manufacturer Name GNJ Manufacturing Inc.
Manufacturer Address 4/F, Blk A, No.48 Industrial Park, ZhongKai HiTech Zone, Huizhou City, GuangDong Province
Product Designation Smartphone-Miracle 6.0 S
Brand Name CellAllure
Model Name Miracle 6.0 S, CAPHG43
Different Description All the models are the same, only different in model names.The test model is Miracle 6.0S.
EUT Voltage DC3.7V by battery
Applicable Standard IEEE Std. 1528:2013 FCC 47CFR § 2.1093 IEEE/ANSI C95.1:2005
Test Date Mar. 21,2017 to Mar. 24,2017
Performed Location Attestation of Global Compliance(Shenzhen) Co., Ltd.
2 F, Building 2, No.1-No.4, Chaxi Sanwei Technical Industrial Park, Gushu, Xixiang Street, Bao'an District, Shenzhen, China
Report Template AGCRT-US-3G3/SAR (2016-01-01)
Tested By
Eric Zhou(Zhou Yongkang)
Mar. 24,2017
Checked By
Angela Li(Li Jiao)
Mar. 29,2017
Authorized By
Solger Zhang(Zhang Hongyi)
Authorized Officer Mar. 29,2017

Report No.: AGC09674170301FH01 Page 4 of 108
TABLE OF CONTENTS
1. SUMMARY OF MAXIMUM SAR VALUE ......................................................................................................... 5
2. GENERAL INFORMATION ............................................................................................................................... 6
2.1. EUT DESCRIPTION......................................................................................................................................... 6
3. SAR MEASUREMENT SYSTEM ........................................................................................................................ 8
3.1. THE SATIMO SYSTEM USED FOR PERFORMING COMPLIANCE TESTS CONSISTS OF FOLLOWING ITEMS .................. 8 3.2. COMOSAR E-FIELD PROBE .......................................................................................................................... 9 3.3. ROBOT .......................................................................................................................................................... 9 3.4. VIDEO POSITIONING SYSTEM ........................................................................................................................ 10 3.5. DEVICE HOLDER .......................................................................................................................................... 10 3.6. SAM TWIN PHANTOM ................................................................................................................................... 11
4. SAR MEASUREMENT PROCEDURE .............................................................................................................. 12
4.1. SPECIFIC ABSORPTION RATE (SAR) .............................................................................................................. 12 4.2. SAR MEASUREMENT PROCEDURE ................................................................................................................ 13 4.3. RF EXPOSURE CONDITIONS ......................................................................................................................... 15
5. TISSUE SIMULATING LIQUID ......................................................................................................................... 17
5.1. THE COMPOSITION OF THE TISSUE SIMULATING LIQUID..................................................................................... 17 5.2. TISSUE DIELECTRIC PARAMETERS FOR HEAD AND BODY PHANTOMS ............................................................... 17 5.3. TISSUE CALIBRATION RESULT ....................................................................................................................... 18
6. SAR SYSTEM CHECK PROCEDURE ........................................................................................................... 20
6.1. SAR SYSTEM CHECK PROCEDURES ............................................................................................................. 20 6.2. SAR SYSTEM CHECK ................................................................................................................................... 21
7. EUT TEST POSITION ...................................................................................................................................... 22
7.1. DEFINE TWO IMAGINARY LINES ON THE HANDSET ........................................................................................... 22 7.2. CHEEK POSITION ......................................................................................................................................... 23 7.3. TILT POSITION .............................................................................................................................................. 23 7.4. BODY WORN POSITION ................................................................................................................................ 24
8. SAR EXPOSURE LIMITS ............................................................................................................................... 25
9. TEST EQUIPMENT LIST ................................................................................................................................ 26
10. MEASUREMENT UNCERTAINTY ................................................................................................................ 27
11. CONDUCTED POWER MEASUREMENT ..................................................................................................... 30
12. TEST RESULTS ........................................................................................................................................... 38
12.1. SAR TEST RESULTS SUMMARY................................................................................................................... 38
APPENDIX A. SAR SYSTEM CHECK DATA ..................................................................................................... 50
APPENDIX B. SAR MEASUREMENT DATA ...................................................................................................... 62
APPENDIX C. TEST SETUP PHOTOGRAPHS ................................................................................................ 102
APPENDIX D. CALIBRATION DATA ............................................................................................................... 108

Report No.: AGC09674170301FH01 Page 5 of 108
1. SUMMARY OF MAXIMUM SAR VALUE The maximum results of Specific Absorption Rate (SAR) found during testing for EUT are as follows:
Frequency Band Highest Reported 1g-SAR(W/Kg) SAR Test Limit
(W/Kg) Head Body-worn
GSM 850 0.127 0.738
1.6
PCS 1900 0.074 0.833
UMTS Band II 0.057 0.769
UMTS Band V 0.074 1.225
WIFI 2.4G 0.083 0.260
Simultaneous Reported SAR
1.485
SAR Test Result PASS
This device is compliance with Specific Absorption Rate (SAR) for general population/uncontrolled exposure limits (1.6W/Kg) specified in IEEE Std. 1528:2013; FCC 47CFR § 2.1093; IEEE/ANSI C95.1:2005 and the following specific FCC Test Procedures:
·KDB 447498 D01 General RF Exposure Guidance v06
·KDB 648474 D04 Handset SAR v01r03
·KDB 865664 D01 SAR Measurement 100MHz to 6GHz v01r04
·KDB 941225 D01 3G SAR Procedures v03r01
·KDB 941225 D06 Hotspot Mode v02r01
·KDB 248227 D01 802 11 Wi-Fi SAR v02r02

Report No.: AGC09674170301FH01 Page 6 of 108
2. GENERAL INFORMATION
2.1. EUT Description
General Information
Product Designation Smartphone-Miracle 6.0 S
Test Model Miracle 6.0 S
Hardware Version T828-W-V1.3
Software Version T828W_V1_B_LJ_A9P_CELLALLUER60_v2-1_2017_03_23
Device Category Portable
RF Exposure Environment Uncontrolled
Antenna Type Internal
GSM and GPRS
Support Band GSM 850 PCS 1900 GSM 900 DCS 1800
GPRS Type Class B
GPRS Class Class 12(1Tx+4Rx, 2Tx+3Rx, 3Tx+2Rx, 4Tx+1Rx)
TX Frequency Range GSM 850 : 820-850MHz;; PCS 1900: 1850-1910MHz;
RX Frequency Range GSM 850 : 869~894MHz; PCS 1900: 1930~1990MHz
Release Version R99
Type of modulation GMSK for GSM/GPRS;
Antenna Gain 1.31dBi
Max. Average Power GSM850: 32.12dBm ;PCS1900: 28.93dBm
WCDMA
Support Band UMTS FDD Band II UMTS FDD Band V UMTS FDD Band I UMTS FDD Band VIII
HS Type HSPA(HSUPA/HSDPA)
TX Frequency Range WCDMA FDD Band II: 1850-1910MHz;WCDMA FDD Band V: 820-850MHz
RX Frequency Range WCDMA FDD Band II: 1930-1990MHz;WCDMA FDD Band V: 869-894MHz
Release Version Rel-6
Type of modulation HSDPA:QPSK/16QAM; HSUPA:BPSK; WCDMA:QPSK
Antenna Gain 1.31dBi
Max. Average Power Band II: 21.50dBm; Band V: 21.06 dBm

Report No.: AGC09674170301FH01 Page 7 of 108
EUT Description( Continue)
Bluetooth
Bluetooth Version V2.0 V2.1 V2.1+EDR V3.0 V3.0+HS V4.0 V4.1
Operation Frequency 2402~2480MHz
Type of modulation GFSK ∏/4-DQPSK 8-DPSK
Peak Power 5.875dBm
Antenna Gain 2.13dBi
WIFI
WIFI Specification 802.11a 802.11b 802.11g 802.11n(20) 802.11n(40)
Operation Frequency 2412~2462MHz
Avg. Burst Power 11b:16.04dBm,11g:14.08dBm,11n(20):13.70dBm,11n(40):14.46dBm
Antenna Gain 2.13dBi
Accessories
Battery Brand name: CellAllure Model No. : CASPR43-06 Voltage and Capacitance: 3.7 V & 2500mAh
Adapter Brand name: CellAllure Model No. : IFoo T55 Input: AC 100-240V, 50/60Hz, 0.15A Output: DC 5V, 1A
Earphone Brand name: N/A Model No. : N/A
Note:1.CMU200 can measure the average power and Peak power at the same time 2.The sample used for testing is end product.
Product Type
Production unit Identical Prototype

Report No.: AGC09674170301FH01 Page 8 of 108
3. SAR MEASUREMENT SYSTEM
3.1. The SATIMO system used for performing compliance tests consists of following items
The COMOSAR system for performing compliance tests consists of the following items:
· The PC. It controls most of the bench devices and stores measurement data.A computer running WinXP and
the Opensar software.
· The E-Field probe. The probe is a 3-axis system made of 3 distinct dipoles. Each dipole returns a voltage in
function of the ambient electric field.
· The Keithley multimeter measures each probe dipole voltages.
· The SAM phantom simulates a human head. The measurement of the electric field is made inside the
phantom.
· The liquids simulate the dielectric properties of the human head tissues.
· The network emulator controls the mobile phone under test.
· The validation dipoles are used to measure a reference SAR. They are used to periodically check the bench to
make sure that there is no drift of the system characteristics over time.
·The phantom, the device holder and other accessories according to the targeted measurement.

Report No.: AGC09674170301FH01 Page 9 of 108
3.2. COMOSAR E-Field Probe
The SAR measurement is conducted with the dosimetric probe manufactured by SATIMO. The probe is specially designed and calibrated for use in liquid with high permittivity. The dosimetric probe has special calibration in liquid at different frequency. SATIMO conducts the probe calibration in compliance with international and national standards (e.g. IEEE 1528 and relevant KDB files.) The calibration data are in Appendix D.
Isotropic E-Field Probe Specification
Model SSE5
Manufacture MVG
Identification No. SN 14/16 EP308
Frequency 0.3GHz-3.7GHz Linearity:±0.08dB(300MHz -3.7GHz)
Dynamic Range 0.01W/Kg-100W/Kg Linearity:±0.08dB
Dimensions
Overall length:330mm Length of individual dipoles:4.5mm Maximum external diameter:8mm Probe Tip external diameter:5mm Distance between dipoles/ probe extremity:2.7mm
Application
High precision dosimetric measurements in any exposure scenario (e.g., very strong gradient fields). Only probe which enables compliance testing for frequencies up to 3 GHz with precision of better 30%.
3.3. Robot The COMOSAR system uses the KUKA robot from SATIMO SA (France).For the 6-axis controller COMOSAR system, the KUKA robot controller version from SATIMO is used. The XL robot series have many features that are important for our application: � High precision (repeatability 0.02 mm) � High reliability (industrial design) � Jerk-free straight movements � Low ELF interference (the closed metallic construction shields against motor control fields) � 6-axis controller

Report No.: AGC09674170301FH01 Page 10 of 108
3.4. Video Positioning System The video positioning system is used in OpenSAR to check the probe. Which is composed of a camera, LED, mirror and mechanical parts.The camera is piloted by the main computer with firewire link. During the process, the actual position of the probe tip with respect to the robot arm is measured, as well as the probe length and the horizontal probe offset. The software then corrects all movements, such that the robot coordinates are valid for the probe tip. The repeatability of this process is better than 0.1 mm. If a position has been taught with an aligned probe, the same position will be reached with another aligned probe within 0.1 mm, even if the other probe has different dimensions. During probe rotations, the probe tip will keep its actual position.
3.5. Device Holder The COMOSAR device holder is designed to cope with different positions given in the standard. It has two scales for the device rotation (with respect to the body axis) and the device inclination (with respect to the line between the ear reference points). The rotation center for both scales is the ear reference point (EPR). Thus the device needs no repositioning when changing the angles. The COMOSAR device holder has been made out of low-loss POM material having the following dielectric parameters: relative permittivity εr =3 and loss tangent δ = 0.02. The amount of dielectric material has been reduced in the closest vicinity of the device, since measurements have suggested that the influence of the clamp on the test results could thus be lowered.

Report No.: AGC09674170301FH01 Page 11 of 108
3.6. SAM Twin Phantom The SAM twin phantom is a fiberglass shell phantom with 2mm shell thickness (except the ear region where shell thickness increases to 6mm). It has three measurement areas: � Left head � Right head � Flat phantom
The bottom plate contains three pair of bolts for locking the device holder. The device holder positions are adjusted to the standard measurement positions in the three sections. A white cover is provided to tap the phantom during off-periods to prevent water evaporation and changes in the liquid parameters. On the phantom top, three reference markers are provided to identify the phantom position with respect to the robot.

Report No.: AGC09674170301FH01 Page 12 of 108
4. SAR MEASUREMENT PROCEDURE
4.1. Specific Absorption Rate (SAR)
SAR is related to the rate at which energy is absorbed per unit mass in object exposed to a radio field. The SAR distribution in a biological body is complicated and is usually carried out by experimental techniques or numerical modeling. The standard recommends limits for two tiers of groups, occupational/controlled and occupational/uncontrolled, based on a person’s awareness and ability to exercise control over his or her exposure. In general, occupational/controlled exposure limits are higher than the limits for general population/uncontrolled.
The SAR definition is the time derivative (rate) of the incremental energy (dW) absorbed by (dissipated in) an incremental mass (dm) contained in a volume element(dv) of given mass density (ρ). The equation description is as below:
SAR is expressed in units of Watts per kilogram (W/Kg) SAR can be obtained using either of the following equations:
Where SAR is the specific absorption rate in watts per kilogram;
E is the r.m.s. value of the electric field strength in the tissue in volts per meter; ζ is the conductivity of the tissue in siemens per metre;
ρ is the density of the tissue in kilograms per cubic metre; ch is the heat capacity of the tissue in joules per kilogram and Kelvin;
dT
dt│t = 0 is the initial time derivative of temperature in the tissue in kelvins per second

Report No.: AGC09674170301FH01 Page 13 of 108
4.2. SAR Measurement Procedure
Step 1: Power Reference Measurement
The Power Reference Measurement and Power Drift Measurement are for monitoring the power drift of the device under test in the batch process. The minimum distance of probe sensors to surface is 2.7mm This distance cannot be smaller than the distance os sensor calibration points to probe tip as `defined in the probe properties,
Step 2: Area Scan
The Area Scan is used as a fast scan in two dimensions to find the area of high field values, before doing a fine measurement around the hot spot. The sophisticated interpolation routines implemented in SATIMO software can find the maximum locations even in relatively coarse grids. When an Area Scan has measured all reachable points, it computes the field maximal found in the scanned area, within a range of the global maximum. The range (in db) is specified in the standards for compliance testing. For example, a 2db range is required in IEEE Standard 1528, whereby 3db is a requirement when compliance is assessed in accordance with the ARIB standard (Japan) If one Zoom Scan follows the Area Scan, then only the absolute maximum will be taken as reference. For cases where multiple maximum are detected, the number of Zoom Scan has to be increased accordingly.
Area Scan Parameters extracted from KDB 865664 D01 SAR Measurement 100MHz to 6GHz
Step 3: Zoom Scan
Zoom Scan are used to assess the peak spatial SAR value within a cubic average volume containing 1g abd 10g of simulated tissue. The Zoom Scan measures points(refer to table below) within a cube whose base faces are centered on the maxima found in a preceding area scan job within the same procedure. When the measurement is done, the Zoom Scan evaluates the averaged SAR for 1g and 10g and displays these values next to the job’s label.

Report No.: AGC09674170301FH01 Page 14 of 108
Zoom Scan Parameters extracted from KDB865664 d01 SAR Measurement 100MHz to 6GHz
Step 4: Power Drift Measurement
The Power Drift Measurement measures the field at the same location as the most recent power reference measurement within the same procedure, and with the same settings. The Power Drift Measurement gives the field difference in dB from the reading conducted within the same settings. This allows a user to monitor the power drift of the device under test within a batch process. The measurement procedure is the same as Step 1.

Report No.: AGC09674170301FH01 Page 15 of 108
4.3. RF Exposure Conditions Test Configuration and setting:
The EUT is a model of GSM Portable Mobile Station (MS). It supports GSM/GPRS, WCDMA/HSPA, BT, WIFI, and support hot spot mode.
For WWAN SAR testing, the device was controlled by using a base station emulator. Communication between the device and the emulator were established by air link. The distance between the EUT and the antenna is larger than 50cm, and the output power radiated from the emulator antenna is at least 30db smaller than the output power of EUT.
For WLAN testing, the EUT is configured with the WLAN continuous TX tool through engineering command. Antenna Location: (the back view)
EUT Top Edge Edge 1
EUT Right Edge EUT Left Edge Edge 2 Edge 4
EUT Bottom Edge Edge 3
BT&WIFI Antenna
166mm
129mm
WWAN Antenna
82mm
55mm
138mm

Report No.: AGC09674170301FH01 Page 16 of 108
For WWAN mode:
Test Configurations Antenna to
edges/surface SAR
required Note
Head
Left Touch Yes --
Left Tilt Yes --
Right Touch Yes --
Right Tilt Yes --
Body
Back <25mm Yes --
Front <25mm Yes --
Hotspot
Back <25mm Yes --
Front <25mm Yes --
Edge 1 (Top) 3mm Yes --
Edge 2 (Right) 55mm No SAR is not required for the distance between the antenna and the edge is >25mm as per KDB 941225 D06 Hotspot SAR
Edge 3 (Bottom) 129mm No SAR is not required for the distance between the antenna and the edge is >25mm as per KDB 941225 D06 Hotspot SAR
Edge 4 (Left) 3mm Yes --
For WLAN mode:
Test Configurations Antenna to
edges/surface SAR
required Note
Head
Left Touch Yes --
Left Tilt Yes --
Right Touch Yes --
Right Tilt Yes --
Body
Back <25mm Yes --
Front <25mm Yes --
Hotspot
Back <25mm Yes --
Front <25mm Yes --
Edge 1 (Top) 23mm Yes --
Edge 2 (Right) 3mm Yes --
Edge 3 (Bottom) 138mm No SAR is not required for the distance between the antenna and the edge is >25mm as per KDB 941225 D06 Hotspot SAR
Edge 4 (Left) 67mm No SAR is not required for the distance between the antenna and the edge is >25mm as per KDB 941225 D06 Hotspot SAR
Report No.: AGC09674170301FH01 Page 17 of 108
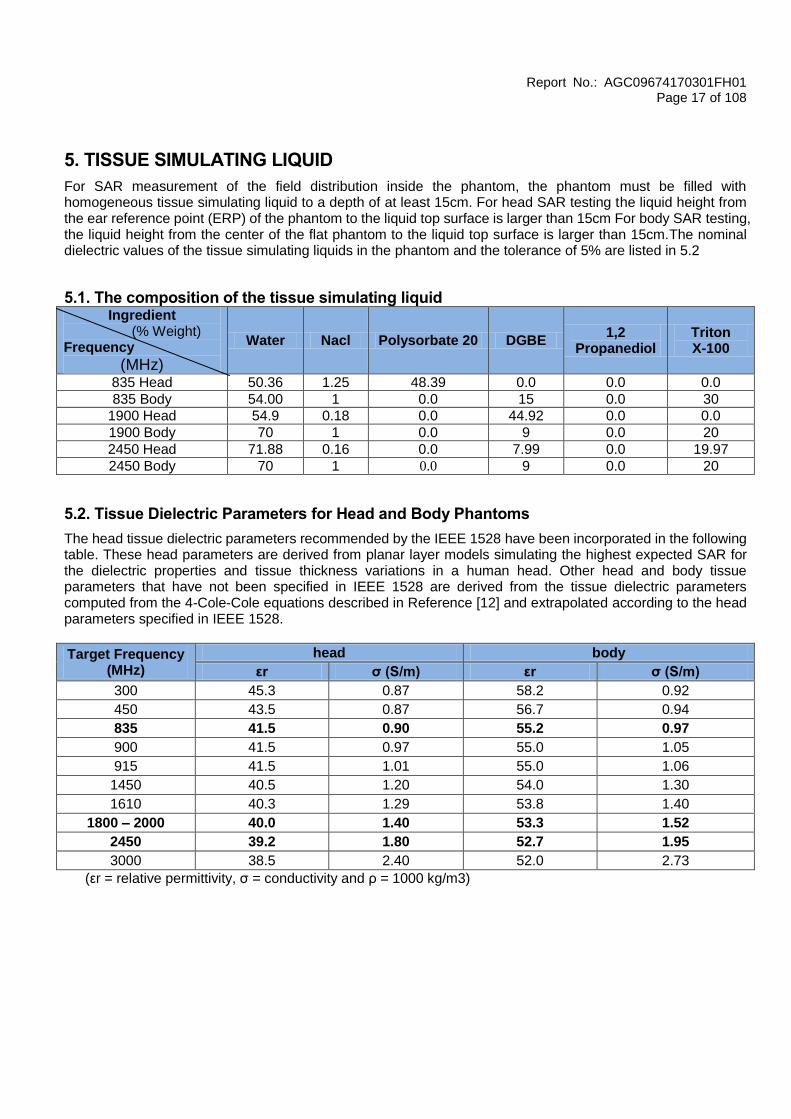
5. TISSUE SIMULATING LIQUID
For SAR measurement of the field distribution inside the phantom, the phantom must be filled with homogeneous tissue simulating liquid to a depth of at least 15cm. For head SAR testing the liquid height from the ear reference point (ERP) of the phantom to the liquid top surface is larger than 15cm For body SAR testing, the liquid height from the center of the flat phantom to the liquid top surface is larger than 15cm.The nominal dielectric values of the tissue simulating liquids in the phantom and the tolerance of 5% are listed in 5.2
5.1. The composition of the tissue simulating liquid Ingredient
(% Weight) Frequency
(MHz)
Water Nacl Polysorbate 20 DGBE 1,2
Propanediol Triton X-100
835 Head 50.36 1.25 48.39 0.0 0.0 0.0
835 Body 54.00 1 0.0 15 0.0 30
1900 Head 54.9 0.18 0.0 44.92 0.0 0.0
1900 Body 70 1 0.0 9 0.0 20
2450 Head 71.88 0.16 0.0 7.99 0.0 19.97
2450 Body 70 1 0.0 9 0.0 20
5.2. Tissue Dielectric Parameters for Head and Body Phantoms
The head tissue dielectric parameters recommended by the IEEE 1528 have been incorporated in the following table. These head parameters are derived from planar layer models simulating the highest expected SAR for the dielectric properties and tissue thickness variations in a human head. Other head and body tissue parameters that have not been specified in IEEE 1528 are derived from the tissue dielectric parameters computed from the 4-Cole-Cole equations described in Reference [12] and extrapolated according to the head parameters specified in IEEE 1528.
Target Frequency (MHz)
head body
εr σ (S/m) εr σ (S/m)
300 45.3 0.87 58.2 0.92
450 43.5 0.87 56.7 0.94
835 41.5 0.90 55.2 0.97
900 41.5 0.97 55.0 1.05
915 41.5 1.01 55.0 1.06
1450 40.5 1.20 54.0 1.30
1610 40.3 1.29 53.8 1.40
1800 – 2000 40.0 1.40 53.3 1.52
2450 39.2 1.80 52.7 1.95
3000 38.5 2.40 52.0 2.73
(εr = relative permittivity, ζ = conductivity and ρ = 1000 kg/m3)

Report No.: AGC09674170301FH01 Page 18 of 108
5.3. Tissue Calibration Result
The dielectric parameters of the liquids were verified prior to the SAR evaluation using SATIMO Dielectric Probe Kit and R&S Network Analyzer ZVL6.
Tissue Stimulant Measurement for 835MHz
Head
Fr. (MHz)
Dielectric Parameters (±5%) Tissue Temp [oC]
Test time εr 41.5 (39.425-43.575) δ[s/m] 0.90(0.855-0.945)
824.2 42.86 0.87
21.2 Mar.
21,2017
826.4 42.31 0.88
835 41.97 0.89
836.6 41.52 0.89
846.6 41.09 0.90
848.8 40.68 0.91
Body
Fr. (MHz)
Dielectric Parameters (±5%) Tissue Temp [oC]
Test time εr 55.20(52.44-57-96) δ[s/m]0.97(0.9215-1.0185)
824.2 56.37 0.93
21.3 Mar.
21,2017
826.4 55.84 0.94
835 55.41 0.95
836.6 55.03 0.96
846.6 54.65 0.97
848.8 54.13 0.98
Tissue Stimulant Measurement for 1900MHz
Head
Fr. (MHz)
Dielectric Parameters (±5%) Tissue Temp [oC]
Test time εr40.00(38.00-42.00) δ[s/m]1.40(1.33-1.47)
1850.2 41.48 1.34
20.2 Mar.
22,2017
1852.4 41.26 1.35
1880 40.88 1.38
1900 40.42 1.40
1907.6 40.01 1.42
1909.8 39.52 1.43
Body
Fr. (MHz)
Dielectric Parameters (±5%) Tissue Temp [oC]
Test time εr53.30(50.635-55.965) δ[s/m]1.52(1.444-1.596)
1850.2 54.69 1.45
20.5 Mar.
22,2017
1852.4 54.47 1.46
1880 53.79 1.49
1900 53.55 1.51
1907.6 53.14 1.52
1909.8 52.88 1.53

Report No.: AGC09674170301FH01 Page 19 of 108
Tissue Stimulant Measurement for 2450MHz
Head
Fr. (MHz)
Dielectric Parameters (±5%) Tissue Temp [oC]
Test time εr39.2(37.24-41.16) δ[s/m]1.80(1.71-1.89)
2412 40.89 1.73
21.8 Mar.
24,2017
2437 40.42 1.75
2450 39.98 1.77
2462 39.52 1.82
Body
Fr. (MHz)
Dielectric Parameters (±5%) Tissue Temp [oC]
Test time εr52.7(50.065-55.335) δ[s/m]1.95(1.8525-2.0475)
2412 54.85 1.88
21.5 Mar.
24,2017
2437 54.37 1.90
2450 53.96 1.93
2462 53.42 1.95

Report No.: AGC09674170301FH01 Page 20 of 108
6. SAR SYSTEM CHECK PROCEDURE
6.1. SAR System Check Procedures SAR system check is required to confirm measurement accuracy, according to the tissue dielectric media, probe calibration points and other system operating parameters required for measuring the SAR of a test device. The system verification must be performed for each frequency band and within the valid range of each probe calibration point required for testing the device. The same SAR probe(s) and tissue-equivalent media combinations used with each specific SAR system for system verification must be used for device testing. When multiple probe calibration points are required to cover substantially large transmission bands, independent system verifications are required for each probe calibration point. A system verification must be performed before each series of SAR measurements using the same probe calibration point and tissue-equivalent medium. Additional system verification should be considered according to the conditions of the tissue-equivalent medium and measured tissue dielectric parameters, typically every three to four days when the liquid parameters are remeasured or sooner when marginal liquid parameters are used at the beginning of a series of measurements.
Each SATIMO system is equipped with one or more system check kits. These units, together with the predefined measurement procedures within the SATIMO software, enable the user to conduct the system check and system validation. System kit includes a dipole, and dipole device holder.
The system check verifies that the system operates within its specifications. It’s performed daily or before every SAR measurement. The system check uses normal SAR measurement in the flat section of the phantom with a matched dipole at a specified distance. The system check setup is shown as below.

Report No.: AGC09674170301FH01 Page 21 of 108
6.2. SAR System Check 6.2.1. Dipoles
The dipoles used is based on the IEEE-1528 standard, and is complied with mechanical and electrical specifications in line with the requirements of IEEE. the table below provides details for the mechanical and electrical Specifications for the dipoles.
Frequency L (mm) h (mm) d (mm)
835MHz 161.0 89.8 3.6
1900MHz 68 39.5 3.6
2450MHz 51.5 30.4 3.6
6.2.2. System Check Result System Performance Check at 835MHz&1900MHz &2450MHz for Head
Validation Kit: SN29/15 DIP 0G835-383&SN 29/15 DIP 1G900-389& SN 29/15DIP 2G450-393
Frequency [MHz]
Target Value(W/Kg)
Reference Result (± 10%)
Tested Value(W/Kg)
Tissue Temp.
[°C] Test time
1g 10g 1g 10g 1g 10g
835 10.04 6.43 9.036-11.044 5.787 -7.073 10.581 6.514 21.2 Mar. 21,2017
1900 41.44 21.33 37.296-45.584 19.197-23.463 39.047 21.501 20.2 Mar. 22,2017
2450 54.53 24.30 49.077-59.983 21.87-26.730 50.465 23.647 21.8 Mar. 24,2017
System Performance Check at 835 MHz &1900MHz & 2450MHz for Body
Frequency [MHz]
Target Value(W/Kg)
Reference Result (± 10%)
Tested Value(W/Kg)
Tissue Temp.
[°C] Test time
1g 10g 1g 10g 1g 10g
835 9.85 6.45 8.865-10.835 5.805-7.095 9.859 6.332 21.3 Mar. 21,2017
1900 39.38 20.86 35.442-43.318 18.774-22.946 39.168 19.757 20.5 Mar. 22,2017
2450 49.92 23.16 44.928-54.912 20.844-25.476 49.294 22.657 21.5 Mar. 24,2017

Report No.: AGC09674170301FH01 Page 22 of 108
7. EUT TEST POSITION
This EUT was tested in Right Cheek, Right Tilted, Left Cheek, Left Tilted, Body back, Body front and 4 edges.
7.1. Define Two Imaginary Lines on the Handset
(1)The vertical centerline passes through two points on the front side of the handset the midpoint of the width wt of the handset at the level of the acoustic output, and the midpoint of the width wb of the handset.
(2)The horizontal line is perpendicular to the vertical centerline and passes through the center of the acoustic output. The horizontal line is also tangential to the face of the handset at point A.
(3)The two lines intersect at point A. Note that for many handsets, point A coincides with the center of the acoustic output; however, the acoustic output may be located elsewhere on the horizontal line. Also note that the vertical centerline is not necessarily to the front face of the handset, especially for clamshell handsets, handsets with flip covers, and other irregularly shaped handsets.

Report No.: AGC09674170301FH01 Page 23 of 108
7.2. Cheek Position
(1) To position the device with the vertical center line of the body of the device and the horizontal line crossing the center picec in a plane parallel to the sagittal plane of the phantom. While maintaining the device in this plane, align the vertical center line with the reference plane containing the ear and mouth reference point (M: Mouth, RE: Right Ear, and LE: Left Ear) and align the center of the ear piece with the line RE-LE.
(2) To move the device towards the phantom with the ear piece aligned with the the line LE-RE until the phone touched the ear. While maintaining the device in the reference plane and maintaining the phone contact with ear, move the bottom of the phone until any point on the front side is in contact with the cheek of the phantom or until contact with the ear is lost
7.3. Tilt Position
(1) To position the device in the “cheek” position described above.
(2) While maintaining the device in the reference plane described above and pivoting against the ear, moves it outward away from the mouth by an angle of 15 degrees or until with the ear is lost.

Report No.: AGC09674170301FH01 Page 24 of 108
7.4. Body Worn Position
(1) To position the EUT parallel to the phantom surface.
(2) To adjust the EUT parallel to the flat phantom.
(3) To adjust the distance between the EUT surface and the flat phantom to 5mm.
Report No.: AGC09674170301FH01 Page 25 of 108
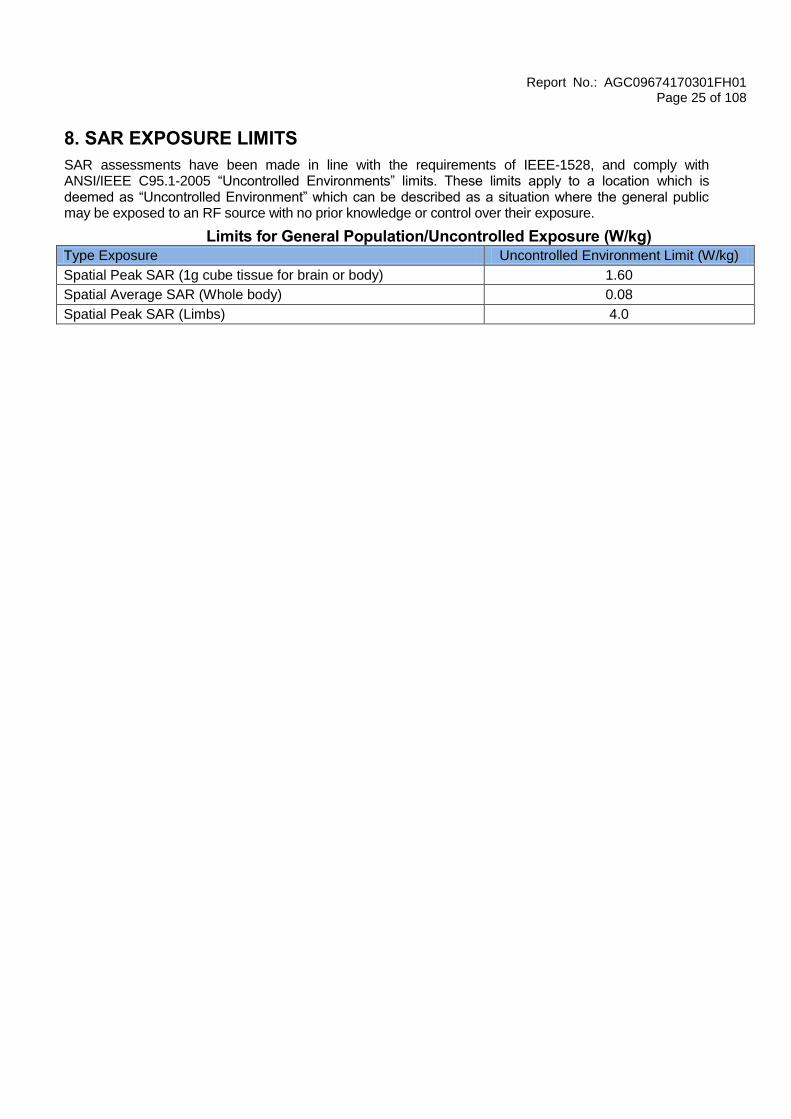
8. SAR EXPOSURE LIMITS
SAR assessments have been made in line with the requirements of IEEE-1528, and comply with ANSI/IEEE C95.1-2005 “Uncontrolled Environments” limits. These limits apply to a location which is deemed as “Uncontrolled Environment” which can be described as a situation where the general public may be exposed to an RF source with no prior knowledge or control over their exposure.
Limits for General Population/Uncontrolled Exposure (W/kg) Type Exposure Uncontrolled Environment Limit (W/kg)
Spatial Peak SAR (1g cube tissue for brain or body) 1.60
Spatial Average SAR (Whole body) 0.08
Spatial Peak SAR (Limbs) 4.0

Report No.: AGC09674170301FH01 Page 26 of 108
9. TEST EQUIPMENT LIST Equipment description
Manufacturer/ Model
Identification No. Current calibration
date Next calibration
date
SAR Probe MVG SN 14/16 EP308 12/05/2016 12/04/2017
TISSUE Probe SATIMO SN 23/16 OCPG 75 07/05/2016 07/04/2017
Phantom SATIMO SN_4511_SAM90 Validated. No cal
required. Validated. No cal
required.
Liquid SATIMO - Validated. No cal
required. Validated. No cal
required.
Comm Tester Agilent-8960 GB46310822 03/02/2017 03/01/2018
Multimeter Keithley 2000 1188656 03/02/2017 03/01/2018
Dipole SATIMO SID835 SN29/15 DIP 0G835-383
07/05/2016 07/04/2019
Dipole SATIMO SID1900 SN 29/15 DIP 1G900-389
07/05/2016 07/04/2019
Dipole SATIMO SID2450 SN29/15 DIP 2G450-393
07/05/2016 07/04/2019
Signal Generator Agilent-E4438C US41461365 03/02/2017 03/01/2018
Vector Analyzer Agilent / E4440A US40420298 07/02/2016 07/01/2017
Network Analyzer Rhode & Schwarz
ZVL6 SN100132 03/02/2017 03/01/2018
Attenuator Warison
/WATT-6SR1211 N/A N/A N/A
Attenuator Mini-circuits /
VAT-10+ N/A N/A N/A
Amplifier EM30180 SN060552 03/02/2017 03/01/2018
Directional Couple
Werlatone/ C5571-10
SN99463 07/02/2016 07/01/2017
Directional Couple
Werlatone/ C6026-10
SN99482 07/02/2016 07/01/2017
Power Sensor NRP-Z21 1137.6000.02 10/10/2016 10/09/2017
Power Sensor NRP-Z23 US38261498 03/02/2017 03/01/2018
Power Viewer R&S V2.3.1.0 N/A N/A
Note: Per KDB 865664 Dipole SAR Validation, AGC Lab has adopted 3 years calibration intervals. On annual basis, every measurement dipole has been evaluated and is in compliance with the following criteria: 1. There is no physical damage on the dipole; 2. System validation with specific dipole is within 10% of calibrated value; 3. Return-loss is within 20% of calibrated measurement; 4. Impedance is within 5Ω of calibrated measurement.

Report No.: AGC09674170301FH01 Page 27 of 108
10. MEASUREMENT UNCERTAINTY
SATIMO Uncertainty-SN 14/16 EP308 Measurement uncertainty for DUT averaged over 1 gram / 10 gram.(Head)
Uncertainty Component Sec. Tol (+- %)
Prob. Dist.
Div. Ci (1g) Ci (10g)
1g Ui (+-%)
10g Ui (+-%)
Vi
Measurement System
Probe calibration E.2.1 5.831 N 1 1 1 5.83 5.83 ∞
Probe Modulation E2.5 3.0 R 3 1 1 1.73 1.73 ∞
Axial Isotropy E.2.2 0.6 R 3 1 1 0.36 0.35 ∞
Hemispherical Isotropy E.2.2 0.9 R 3 1 1 0.52 0.52 ∞
Boundary effect E.2.3 1.0 R 3 1 1 0.58 0.58 ∞
Linearity E.2.4 1.91 R 3 1 1 0.69 0.69 ∞
System detection limits E.2.4 1.0 R 3 1 1 0.58 0.58 ∞
Readout Electronics E.2.6 0.02 N 1 1 1 0.02 0.02 ∞
Response Time E.2.7 3.0 R 3 1 1 1.73 1.73 ∞
Integration Time E.2.8 2.0 R 3 1 1 1.15 1.15 ∞
RF Ambient Noise E.6.1 3.0 R 3 1 1 1.73 1.73 ∞
RF Ambient Reflection E.6.1 3.0 R 3 1 1 1.73 1.73 ∞
Probe Positioner E.6.2 2.0 R 3 1 1 1.15 1.15 ∞
Probe Positioning E.6.3 0.05 R 3 1 1 0.03 0.03 ∞
Post-processing E.5 5.0 R 3 1 1 2.89 2.89 ∞
Test sample Related
Device Positioning E.4.2 0.03 N 1 1 1 3.60 3.60 ∞
Device Holder E.4.1 5 N 1 1 1 2.90 2.90 ∞
Measurement SAR Drift E.2.9 0.65 R 3 1 1 2.89 2.89 ∞
Power Scaling E.6.5 5 R 3 1 1 0.00 0.00 ∞
Phantom and set-up
Phantom Uncertainty E.3.1 0.05 R 3 1 1 0.03 0.03 ∞
Uncertainty in SAR correction for deviations in permittivity and conductivity
E.3.2 1.9 N 1 1 0.84 1.90 1.60 ∞
Liquid Conductivity(Meas.)
E.3.3 5 N 1 0.78 0.71 3.90 3.55 M
Liquid Permittivity(Meas.)
E.3.3 5 N 1 0.23 0.26 1.15 1.30 M
Liquid Conductivity-temperature uncertainty
E.3.4 5 R 3 0.78 0.71 2.25 2.05 ∞
Liquid Permittivity-temperature uncertainty
E.3.4 5 R 3 0.23 0.26 0.66 0.75 ∞
Combined Standard Uncertainty
RSS 10.39 10.118 ∞
Expanded Uncertainty (95% Confidence interval)
k 20.86 20.315

Report No.: AGC09674170301FH01 Page 28 of 108
SATIMO Uncertainty-SN 14/16 EP308 System validation uncertainty for Dipole averaged over 1 gram / 10 gram.( Head)
Uncertainty Component Sec. Tol (+- %)
Prob. Dist.
Div. Ci (1g) Ci (10g)
1g Ui (+-%)
10g Ui (+-%)
Vi
Measurement System
Probe calibration E.2.1 5.831 N 1 1 1 5.83 5.83 ∞
Probe Modulation E.2.5 3.0 R 3 1 1 1.73 1.73 ∞
Axial Isotropy E.2.2 0.6 R 3 1 1 1.44 1.44 ∞
Hemispherical Isotropy E.2.2 0.9 R 3 1 1 0.52 0.52 ∞
Boundary effect E.2.3 1.0 R 3 1 1 0.58 0.58 ∞
Linearity E.2.4 1.2 R 3 1 1 0.69 0.69 ∞
System detection limits E.2.4 1.0 R 3 1 1 0.58 0.58 ∞
Readout Electronics E.2.6 0.02 N 1 1 1 0.02 0.02 ∞
Response Time E.2.7 3.0 R 3 1 1 1.73 1.73 ∞
Integration Time E.2.8 2.0 R 3 1 1 1.15 1.15 ∞
RF Ambient Noise E.6.1 3.0 R 3 1 1 1.73 1.73 ∞
RF Ambient Reflection E.6.1 3.0 R 3 1 1 1.73 1.73 ∞
Probe Positioner E.6.1 2.0 R 3 1 1 1.15 1.15 ∞
Probe Positioning E.6.2 0.05 R 3 1 1 0.03 0.03 ∞
Post-processing E.6.3 5.0 R 3 1 1 2.89 2.89 ∞
System validation source(dipole)
Deviation of exp. dipole E6.4 5 R 1 1 1 5.00 5.00 ∞
Dipole Axis to Liquid Dist.
8,E.6.6 5.0 R 3 1 1 2.89 2.89 ∞
Input power & SAR drift 8,6.6.4 1 R 3 1 1 0.58 0.58 ∞
Phantom and set-up
Phantom Uncertainty E.3.1 0.05 R 3 1 1 0.03 0.03 ∞
Uncertainty in SAR correction for deviations in permittivity and conductivity
E.3.2 1.9 N 1 1 0.84 1.90 1.60 ∞
Liquid Conductivity(Meas.)
E.3.3 5 N 1 0.78 0.71 3.90 3.55 M
Liquid Permittivity(Meas.)
E.3.3 5 N 1 0.23 0.26 1.15 1.30 M
Liquid Conductivity-temperature uncertainty
E.3.4 5 R 3 0.78 0.71 2.25 2.05 ∞
Liquid Permittivity-temperature uncertainty
E.3.4 5 R 3 0.23 0.26 0.66 0.75 ∞
Combined Standard Uncertainty
RSS 11.17 10.920 ∞
Expanded Uncertainty (95% Confidence interval)
k 20.879 20.333

Report No.: AGC09674170301FH01 Page 29 of 108
SATIMO Uncertainty-SN 14/16 EP308 System Check uncertainty for Dipole averaged over 1 gram / 10 gram.( Head)
Uncertainty Component Sec. Tol (+- %)
Prob. Dist.
Div. Ci (1g) Ci (10g)
1g Ui (+-%)
10g Ui (+-%)
Vi
Measurement System
Modulation response E.2.5 3.0 R 3 0 0 0.00 0.00 ∞
Boundary effect E.2.3 1.0 R 3 0 0 0.00 0.00 ∞
System detection limits E.2.4 1.0 R 3 0 0 0.00 0.00 ∞
Readout Electronics E.2.6 0.02 N 1 0 0 0.00 0.00 ∞
Response Time E.2.7 3.0 R 3 0 0 0.00 0.00 ∞
Integration Time E.2.8 2.0 R 3 0 0 0.00 0.00 ∞
RF Ambient Noise E.6.1 3.0 R 3 0 0 0.00 0.00 ∞
RF Ambient Reflection E.6.1 3.0 R 3 0 0 0.00 0.00 ∞
Probe Positioner E.6.1 2.0 R 3 1 1 1.15 1.15 ∞
Probe Positioning E.6.2 0.05 R 3 1 1 0.03 0.03 ∞
Post-processing E.6.3 5.0 R 3 0 0 0.00 0.00 ∞
Field source
Deviation of exp. dipole E6.4 5 R 1 1 1 5.00 5.00 ∞
Dipole Axis to Liquid Dist.
8,E.6.6 4.7 R 3 1 1 2.71 2.71 ∞
Input power & SAR drift 8,6.6.4 1 R 3 1 1 0.58 0.58 ∞
Phantom and set-up
Phantom Uncertainty E.3.1 0.05 R 3 1 1 0.03 0.03 ∞
Uncertainty in SAR correction for deviations in permittivity and conductivity
E.3.2 1.9 N 1 1 0.84 1.90 1.60 ∞
Liquid Conductivity(Meas.)
E.3.3 5 N 1 0.78 0.71 3.90 3.55 M
Liquid Permittivity(Meas.)
E.3.3 5 N 1 0.23 0.26 1.15 1.30 M
Liquid Conductivity-temperature uncertainty
E.3.4 5 R 3 0.78 0.71 2.25 2.05 ∞
Liquid Permittivity-temperature uncertainty
E.3.4 5 R 3 0.23 0.26 0.66 0.75 ∞
Combined Standard Uncertainty
RSS 7.076 6.667 ∞
Expanded Uncertainty (95% Confidence interval)
k 14.152 13.334

Report No.: AGC09674170301FH01 Page 30 of 108
11. CONDUCTED POWER MEASUREMENT GSM BAND
Mode Frequency(MHz) Avg. Burst
Power(dBm) Duty cycle
Factor(dBm) Frame
Power(dBm)
Maximum Power <1>
GSM 850
824.2 31.95 -9 22.95
836.6 32.12 -9 23.12
848.8 32.07 -9 23.07
GPRS 850
(1 Slot)
824.2 29.76 -9 20.76
836.6 31.10 -9 22.10
848.8 31.13 -9 22.13
GPRS 850
(2 Slot)
824.2 28.74 -6 22.74
836.6 28.56 -6 22.56
848.8 29.03 -6 23.03
GPRS 850
(3 Slot)
824.2 26.31 -4.26 22.05
836.6 27.05 -4.26 22.79
848.8 26.74 -4.26 22.48
GPRS 850
(4 Slot)
824.2 25.95 -3 22.95
836.6 25.74 -3 22.74
848.8 25.74 -3 22.74
Maximum Power <2>
GSM 850
824.2 31.21 -9 22.21
836.6 31.54 -9 22.54
848.8 31.49 -9 22.49
GPRS 850
(1 Slot)
824.2 29.21 -9 20.21
836.6 31.05 -9 22.05
848.8 31.07 -9 22.07
GPRS 850
(2 Slot)
824.2 28.23 -6 22.23
836.6 28.56 -6 22.56
848.8 28.84 -6 22.84
GPRS 850
(3 Slot)
824.2 26.21 -4.26 21.95
836.6 26.12 -4.26 21.86
848.8 26.23 -4.26 21.97
GPRS 850
(4 Slot)
824.2 25.33 -3 22.33
836.6 25.22 -3 22.22
848.8 25.26 -3 22.26

Report No.: AGC09674170301FH01 Page 31 of 108
GSM BAND CONTINUE
Mode Frequency(MHz) Avg. Burst
Power(dBm) Duty cycle
Factor(dBm) Frame
Power(dBm)
Maximum Power <1>
PCS1900
1850.2 28.93 -9 19.93
1880 28.82 -9 19.82
1909.8 28.79 -9 19.79
GPRS1900
(1 Slot)
1850.2 27.89 -9 18.89
1880 27.81 -9 18.81
1909.8 27.49 -9 18.49
GPRS1900
(2 Slot)
1850.2 25.86 -6 19.86
1880 25.74 -6 19.74
1909.8 25.68 -6 19.68
GPRS1900
(3 Slot)
1850.2 24.26 -4.26 20.00
1880 24.25 -4.26 19.99
1909.8 24.21 -4.26 19.95
GPRS1900
(4 Slot)
1850.2 22.87 -3 19.87
1880 22.81 -3 19.81
1909.8 22.73 -3 19.73
Maximum Power <2>
PCS1900
1850.2 27.41 -9 18.41
1880 27.39 -9 18.39
1909.8 27.35 -9 18.35
GPRS1900
(1 Slot)
1850.2 27.02 -9 18.02
1880 27.12 -9 18.12
1909.8 27.06 -9 18.06
GPRS1900
(2 Slot)
1850.2 25.33 -6 19.33
1880 25.52 -6 19.52
1909.8 25.41 -6 19.41
GPRS1900
(3 Slot)
1850.2 24.12 -4.26 19.86
1880 24.23 -4.26 19.97
1909.8 24.20 -4.26 19.94
GPRS1900
(4 Slot)
1850.2 22.87 -3 19.87
1880 22.81 -3 19.81
1909.8 22.73 -3 19.73
Note 1: The Frame Power (Source-based time-averaged Power) is scaled the maximum burst average power based on time slots. The calculated methods are show as following: Frame Power = Max burst power (1 Up Slot) – 9 dB Frame Power = Max burst power (2 Up Slot) – 6 dB Frame Power = Max burst power (3 Up Slot) – 4.26 dB Frame Power = Max burst power (4 Up Slot) – 3 dB Note 2: SAR is not required for GPRS (1 Slot) Mode because its output power is less than of Voice Mode

Report No.: AGC09674170301FH01 Page 32 of 108
UMTS BAND HSDPA Setup Configuration:
·The EUT was connected to Base Station Agilent E5515C referred to the Setup Configuration.
·The RF path losses were compensated into the measurements.
·A call was established between EUT and Based Station with following setting:
(1) Set Gain Factors(c and d) parameters set according to each
(2) Set RMC 12.2Kbps+HSDPA mode.
(3) Set Cell Power=-86dBm
(4) Set HS-DSCH Configuration Type to FRC (H-set 1, QPSK)
(5) Select HSDPA Uplink Parameters
(6) Set Delta ACK, Delta NACK and Delta CQI=8
(7) Set Ack - Nack Repetition Factor to 3
(8) Set CQI Feedback Cycle (k) to 4ms
(9) Set CQI Repetition Factor to 2
(10) Power Ctrl Mode=All Up bits
·The transmitted maximum output power was recorded.
Table C.10.2.4: values for transmitter characteristics tests with HS-DPCCH
Sub-test c (Note5) d d
(SF) c/d
HS (Note1, Note
2)
CM (dB) (Note 3)
MPR (dB)
(Note 3)
1 2/15 15/15 64 2/15 4/15 0.0 0.0
2 12/15(Note 4) 15/15(Note 4) 64 12/15(Note 4) 24/15 1.0 0.0
3 15/15 8/15 64 15/8 30/15 1.5 0.5
4 15/15 4/15 64 15/4 30/15 1.5 0.5
Note 1: ∆ACK, ∆NACK and ∆CQI = 30/15 with = 30/15 * . Note 2: For the HS-DPCCH power mask requirement test in clause 5.2C, 5.7A, and the Error Vector Magnitude (EVM) with HS-DPCCH test in clause 5.13.1A, and HSDPA EVM with phase discontinuity in clause
5.13.1AA, ∆ACK and ∆NACK = 30/15 with = 30/15 * , and ∆CQI = 24/15 with = 24/15 * .
Note 3: CM = 1 for c/d =12/15, hs/ c=24/15. For all other combinations of DPDCH, DPCCH and HS-DPCCH the MPR is based on the relative CM difference. This is applicable for only UEs that support HSDPA in release 6 and later releases. Note 4: For subtest 2 the c/ d ratio of 12/15 for the TFC during the measurement period (TF1, TF0) is achieved by setting the signalled gain factors for the reference TFC (TF1, TF1) to c = 11/15 and d = 15/15.
hs c
hs c hs c

Report No.: AGC09674170301FH01 Page 33 of 108
HSUPA Setup Configuration: · The EUT was connected to Base Station Agilent E5515C referred to the Setup Configuration.
· The RF path losses were compensated into the measurements.
· A call was established between EUT and Base Station with following setting * :
(1) Call Configs = 5.2B, 5.9B, 5.10B, and 5.13.2B with QPSK
(2) Set the Gain Factors (βc and βd) and parameters (AG Index) were set according to each specific sub-test in the following table, C11.1.3, quoted from the TS 34.121
(3) Set Cell Power = -86 dBm
(4) Set Channel Type = 12.2k + HSPA
(5) Set UE Target Power
(6) Power Ctrl Mode= Alternating bits
(7) Set and observe the E-TFCI
(8) Confirm that E-TFCI is equal to the target E-TFCI of 75 for sub-test 1, and other subtest’s E-TFCI
· The transmitted maximum output power was recorded.
Table C.11.1.3: values for transmitter characteristics tests with HS-DPCCH and E-DCH
Sub-test
c d d (SF
) c/d
HS (Note
1) ec
ed (Note 4) (Note 5)
ed (SF
)
ed (Code
s)
CM (dB)
(Note 2)
MPR (dB)
(Note 2)
(Note 6)
AG Index (Note
5)
E-TFCI
1 11/15 (Note
3)
15/15 (Note
3) 64
11/15 (Note
3) 22/15
209/225
1309/225 4 1 1.0 0.0 20 75
2 6/15 15/15 64 6/15 12/15 12/15 94/75 4 1 3.0 2.0 12 67
3 15/15 9/15 64 15/9 30/15 30/15
ed1: 47/15
ed2: 47/15
4 4
2 2.0 1.0 15 92
4 2/15 15/15 64 2/15 4/15 2/15 56/75 4 1 3.0 2.0 17 71
5 15/15 0 - - 5/15 5/15 47/15 4 1 1.0 0.0 12 67
Note 1: For sub-test 1 to 4, ∆ACK, ∆NACK and ∆CQI = 30/15 with = 30/15 * . For sub-test 5, ∆ACK,
∆NACK and ∆CQI = 5/15 with = 5/15 * .
Note 2: CM = 1 for c/d =12/15, hs/ c=24/15. For all other combinations of DPDCH, DPCCH, HS- DPCCH, E-DPDCH and E-DPCCH the MPR is based on the relative CM difference. Note 3: For subtest 1 the c/ d ratio of 11/15 for the TFC during the measurement period (TF1, TF0) is achieved by setting the signalled gain factors for the reference TFC (TF1, TF1) to c = 10/15 and d = 15/15. Note 4: In case of testing by UE using E-DPDCH Physical Layer category 1, Sub-test 3 is omitted according to TS25.306 Table 5.1g.
Note 5: ed cannot be set directly; it is set by Absolute Grant Value. Note 6: For subtests 2, 3 and 4, UE may perform E-DPDCH power scaling at max power which could results in slightly smaller MPR values.
hs c
hs c

Report No.: AGC09674170301FH01 Page 34 of 108
UMTS BAND II
Mode Frequency
(MHz)
Avg. Burst Power
(dBm)
WCDMA 1900
RMC
1852.4 20.56
1880 21.04
1907.6 20.84
WCDMA 1900
AMR
1852.4 20.94
1880 21.37
1907.6 21.08
HSDPA
Subtest 1
1852.4 20.58
1880 21.50
1907.6 20.60
HSDPA
Subtest 2
1852.4 20.44
1880 20.64
1907.6 20.54
HSDPA
Subtest 3
1852.4 20.21
1880 21.49
1907.6 20.71
HSDPA
Subtest 4
1852.4 19.58
1880 20.34
1907.6 20.45
HSUPA
Subtest 1
1852.4 20.07
1880 20.39
1907.6 20.34
HSUPA
Subtest 2
1852.4 20.34
1880 20.40
1907.6 20.48
HSUPA
Subtest 3
1852.4 20.62
1880 20.28
1907.6 20.39
HSUPA
Subtest 4
1852.4 20.54
1880 20.61
1907.6 20.47
HSUPA
Subtest 5
1852.4 20.16
1880 20.42
1907.6 20.63

Report No.: AGC09674170301FH01 Page 35 of 108
UMTS BAND V
Mode Frequency
(MHz)
Avg. Burst Power
(dBm)
WCDMA 850
RMC
826.4 20.48
836.6 20.44
846.6 20.29
WCDMA 850
AMR
826.4 20.91
836.6 20.28
846.6 20.60
HSDPA
Subtest 1
826.4 20.89
836.6 20.17
846.6 20.14
HSDPA
Subtest 2
826.4 20.69
836.6 20.93
846.6 20.28
HSDPA
Subtest 3
826.4 20.25
836.6 20.23
846.6 20.68
HSDPA
Subtest 4
826.4 20.56
836.6 20.41
846.6 20.50
HSUPA
Subtest 1
826.4 20.86
836.6 20.93
846.6 20.35
HSUPA
Subtest 2
826.4 20.70
836.6 20.46
846.6 20.84
HSUPA
Subtest 3
826.4 21.06
836.6 20.57
846.6 20.13
HSUPA
Subtest 4
826.4 20.46
836.6 20.75
846.6 20.26
HSUPA
Subtest 5
826.4 20.64
836.6 20.18
846.6 20.73

Report No.: AGC09674170301FH01 Page 36 of 108
According to 3GPP 25.101 sub-clause 6.2.2 , the maximum output power is allowed to be reduced by following the table.
Table 6.1aA: UE maximum output power with HS-DPCCH and E-DCH
UE Transmit Channel Configuration CM(db) MPR(db)
For all combinations of ,DPDCH,DPCCH HS-DPDCH,E-DPDCH and E-DPCCH
0≤ CM≤3.5 MAX(CM-1,0)
Note: CM=1 for c/ d=12/15, hs/ c=24/15.For all other combinations of DPDCH, DPCCH, HS-DPCCH,
E-DPDCH and E-DPCCH the MPR is based on the relative CM difference.
The device supports MPR to solve linearity issues (ACLR or SEM) due to the higher peak-to average ratios (PAR) of the HSUPA signal. This prevents saturating the full range of the TX DAC inside of device and provides a reduced power output to the RF transceiver chip according to the Cubic Metric (a function of the combinations of DPDCH, DPCCH, HS-DPCCH, E-DPDCH and E-DPCCH).
When E-DPDCH channels are present the beta gains on those channels are reduced firsts to try to get the power under the allowed limit. If the beta gains are lowered as far as possible, then a hard limiting is applied at the maximum allowed level.
The SW currently recalculates the cubic metric every time the beta gains on the E-DPDCH are reduced. The cubic metric will likely get lower each time this is done .However, there is no reported reduction of maximum output power in the HSUPA mode since the device also provides a compensation for the power back-off by increasing the gain of TX_AGC in the transceiver (PA) device.
The end effect is that the DUT output power is identical to the case where there is no MPR in the device.

Report No.: AGC09674170301FH01 Page 37 of 108
WIFI
Mode Data Rate (Mbps) Channel Frequency(MHz) Avg. Burst
Power(dBm)
802.11b 1
01 2412 16.04
06 2437 15.43
11 2462 14.75
802.11g 6
01 2412 11.31
06 2437 13.63
11 2462 14.08
802.11n(20) 6.5
01 2412 12.72
06 2437 13.70
11 2462 13.63
802.11n(40) 13.5
03 2422 14.46
06 2437 13.62
09 2452 13.29
Bluetooth_V3.0
Modulation Channel Frequency(MHz) Peak Power
(dBm)
GFSK
0 2402 5.875
39 2441 5.285
78 2480 4.111
π /4-DQPSK
0 2402 5.443
39 2441 4.990
78 2480 4.102
8-DPSK
0 2402 5.113
39 2441 4.701
78 2480 3.752
Bluetooth_V4.0
Modulation Channel Frequency(MHz) Peak Power
(dBm)
GFSK
0 2402 -2.044
19 2440 -2.464
39 2480 -3.663
Report No.: AGC09674170301FH01 Page 38 of 108
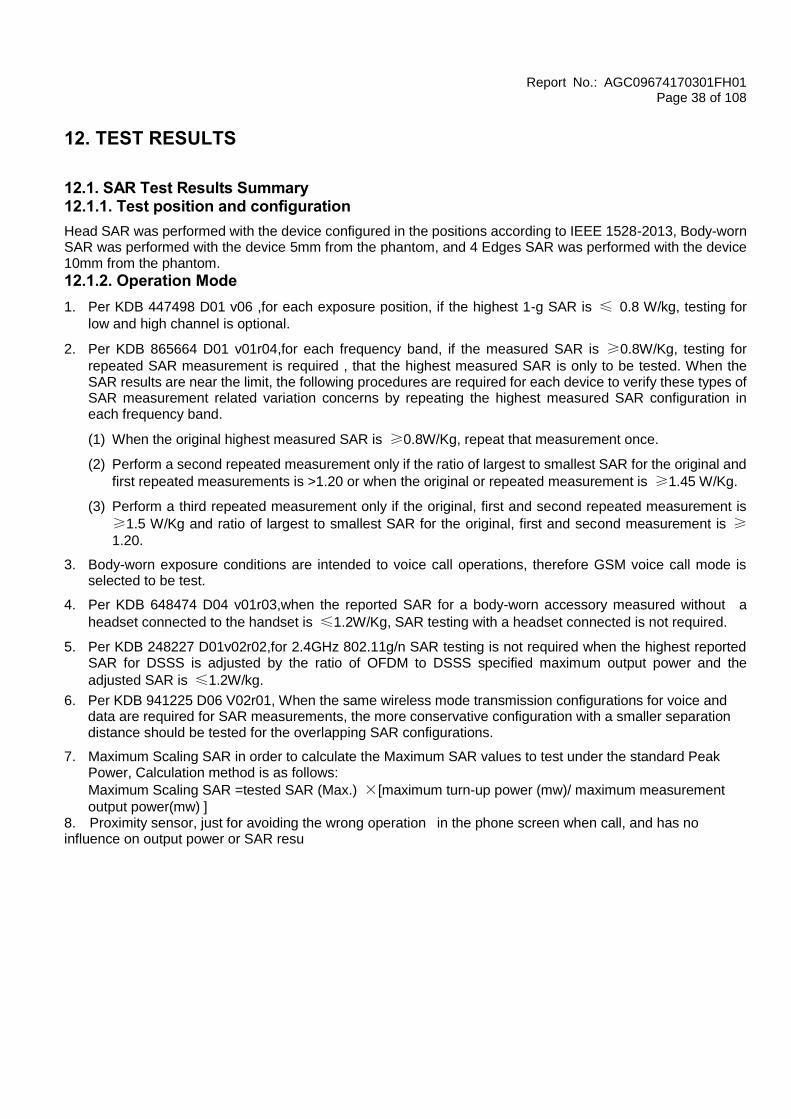
12. TEST RESULTS
12.1. SAR Test Results Summary 12.1.1. Test position and configuration
Head SAR was performed with the device configured in the positions according to IEEE 1528-2013, Body-worn SAR was performed with the device 5mm from the phantom, and 4 Edges SAR was performed with the device 10mm from the phantom.
12.1.2. Operation Mode
1. Per KDB 447498 D01 v06 ,for each exposure position, if the highest 1-g SAR is ≤ 0.8 W/kg, testing for
low and high channel is optional.
2. Per KDB 865664 D01 v01r04,for each frequency band, if the measured SAR is ≥0.8W/Kg, testing for
repeated SAR measurement is required , that the highest measured SAR is only to be tested. When the SAR results are near the limit, the following procedures are required for each device to verify these types of SAR measurement related variation concerns by repeating the highest measured SAR configuration in each frequency band.
(1) When the original highest measured SAR is ≥0.8W/Kg, repeat that measurement once.
(2) Perform a second repeated measurement only if the ratio of largest to smallest SAR for the original and
first repeated measurements is >1.20 or when the original or repeated measurement is ≥1.45 W/Kg.
(3) Perform a third repeated measurement only if the original, first and second repeated measurement is
≥1.5 W/Kg and ratio of largest to smallest SAR for the original, first and second measurement is ≥1.20.
3. Body-worn exposure conditions are intended to voice call operations, therefore GSM voice call mode is selected to be test.
4. Per KDB 648474 D04 v01r03,when the reported SAR for a body-worn accessory measured without a
headset connected to the handset is ≤1.2W/Kg, SAR testing with a headset connected is not required.
5. Per KDB 248227 D01v02r02,for 2.4GHz 802.11g/n SAR testing is not required when the highest reported SAR for DSSS is adjusted by the ratio of OFDM to DSSS specified maximum output power and the
adjusted SAR is ≤1.2W/kg.
6. Per KDB 941225 D06 V02r01, When the same wireless mode transmission configurations for voice and data are required for SAR measurements, the more conservative configuration with a smaller separation distance should be tested for the overlapping SAR configurations.
7. Maximum Scaling SAR in order to calculate the Maximum SAR values to test under the standard Peak Power, Calculation method is as follows:
Maximum Scaling SAR =tested SAR (Max.) ×[maximum turn-up power (mw)/ maximum measurement
output power(mw) ] 8. Proximity sensor, just for avoiding the wrong operation in the phone screen when call, and has no influence on output power or SAR resu

Report No.: AGC09674170301FH01 Page 39 of 108
12.1.3. Test Result SAR MEASUREMENT
Depth of Liquid (cm):>15 Relative Humidity (%): 55.5
Product: Smartphone-Miracle 6.0 S
Test Mode: GSM850 with GMSK modulation
Position Mode Ch. Fr.
(MHz)
Power Drift
(<±5%)
SAR (1g)
(W/kg)
Max. Tune-up Power (dBm)
Meas. output Power (dBm)
Scaled SAR
(W/Kg)
Limit (W/kg)
SIM 1 Card
Left Cheek voice 190 836.6 -0.25 0.062 32.50 32.12 0.068 1.6
Left Tilt voice 190 836.6 1.22 0.059 32.50 32.12 0.064 1.6
Right Cheek voice 190 836.6 0.02 0.089 32.50 32.12 0.097 1.6
Right Tilt voice 190 836.6 0.23 0.090 32.50 32.12 0.098 1.6
Body back voice 190 836.6 -0.55 0.659 32.50 32.12 0.719 1.6
Body front voice 190 836.6 -0.63 0.056 32.50 32.12 0.061 1.6
Left Cheek GPRS-2 slot 190 836.6 -0.44 0.056 29.03 28.56 0.062 1.6
Left Tilt GPRS-2 slot 190 836.6 -0.23 0.081 29.03 28.56 0.090 1.6
Right Cheek GPRS-2 slot 190 836.6 1.55 0.114 29.03 28.56 0.127 1.6
Right Tilt GPRS-2 slot 190 836.6 0.23 0.096 29.03 28.56 0.107 1.6
Body back GPRS-2 slot 190 836.6 -0.55 0.662 29.03 28.56 0.738 1.6
Body front GPRS-2 slot 190 836.6 0.23 0.075 29.03 28.56 0.084 1.6
Edge 1 (Top) GPRS-2 slot 190 836.6 -1.55 0.078 29.03 28.56 0.087 1.6
Edge 2(Right) GPRS-2 slot 190 836.6 0.23 0.048 29.03 28.56 0.053 1.6
Edge 3(Bottom) GPRS-2 slot 190 836.6 -1.23 0.009 29.03 28.56 0.010 1.6
Edge 4(Left) GPRS-2 slot 190 836.6 0.02 0.097 29.03 28.56 0.108 1.6
SIM 2 Card
Right Cheek GPRS-2 slot 190 836.6 -0.44 0.104 29.03 28.56 0.116 1.6
Body back GPRS-2 slot 190 836.6 0.23 0.661 29.03 28.56 0.737 1.6
Note: · When the 1-g Reported SAR is ≤ 0.8 W/kg, testing for low and high channel is optional. Refer to KDB 447498.
·The test separation for body back and body front is 5mm of all above table. ·The test separation for 4 Edges is 10mm of all above table.

Report No.: AGC09674170301FH01 Page 40 of 108
SAR MEASUREMENT
Depth of Liquid (cm):>15 Relative Humidity (%): 54.9
Product: Smartphone-Miracle 6.0 S
Test Mode: PCS1900 with GMSK modulation
Position Mode Ch. Fr.
(MHz)
Power Drift
(<±5%)
SAR (1g)
(W/kg)
Max. Tune-up Power (dBm)
Meas. output Power (dBm)
Scaled SAR
(W/Kg)
Limit (W/kg)
SIM 1 Card
Left Cheek voice 661 1880.0 -0.23 0.024 29.00 28.82 0.025 1.6
Left Tilt voice 661 1880.0 -1.55 0.032 29.00 28.82 0.033 1.6
Right Cheek voice 661 1880.0 0.23 0.037 29.00 28.82 0.039 1.6
Right Tilt voice 661 1880.0 -0.02 0.041 29.00 28.82 0.043 1.6
Body back voice 661 1880.0 -0.66 0.388 29.00 28.82 0.404 1.6
Body front voice 661 1880.0 0.31 0.031 29.00 28.82 0.032 1.6
Left Cheek GPRS-3 slot 661 1880.0 -1.55 0.037 24.50 24.25 0.039 1.6
Left Tilt GPRS-3 slot 661 1880.0 0.23 0.044 24.50 24.25 0.047 1.6
Right Cheek GPRS-3 slot 661 1880.0 1.55 0.070 24.50 24.25 0.074 1.6
Right Tilt GPRS-3 slot 661 1880.0 0.02 0.069 24.50 24.25 0.073 1.6
Body back GPRS-3 slot 512 1850.2 -0.23 0.680 24.50 24.26 0.719 1.6
Body back GPRS-3 slot 661 1880.0 0.63 0.774 24.50 24.25 0.820 1.6
Body back GPRS-3 slot 810 1909.8 -0.77 0.779 24.50 24.21 0.833 1.6
Body front GPRS-3 slot 661 1880.0 0.23 0.034 24.50 24.25 0.036 1.6
Edge 1 (Top) GPRS-3 slot 661 1880.0 -1.23 0.047 24.50 24.25 0.050 1.6
Edge 2(Right) GPRS-3 slot 661 1880.0 0.02 0.009 24.50 24.25 0.010 1.6
Edge 3(Bottom) GPRS-3 slot 661 1880.0 0.23 0.013 24.50 24.25 0.014 1.6
Edge 4(Left) GPRS-3 slot 661 1880.0 -0.33 0.162 24.50 24.25 0.172 1.6
SIM 2 Card
Right Cheek GPRS-3 slot 661 1880.0 -0.15 0.056 24.50 24.23 0.060 1.6
Body back GPRS-3 slot 810 1909.8 -1.22 0.692 24.50 24.20 0.741 1.6
Note: · When the 1-g Reported SAR is ≤ 0.8 W/kg, testing for low and high channel is optional. Refer to KDB 447498.
·The test separation for body back and body front is 5mm of all above table. ·The test separation for 4 Edges is 10mm of all above table.

Report No.: AGC09674170301FH01 Page 41 of 108
SAR MEASUREMENT
Depth of Liquid (cm):>15 Relative Humidity (%): 54.9
Product: Smartphone-Miracle 6.0 S
Test Mode: WCDMA Band II with QPSK modulation
Position Mode Ch. Fr.
(MHz)
Power Drift
(<±5%)
SAR (1g)
(W/kg)
Max. Tune-up Power (dBm)
Meas. output Power (dBm)
Scaled SAR
(W/Kg)
Limit (W/kg)
Left Cheek HSDPA Subtest 1 9400 1880 -0.55 0.029 22.00 21.50 0.033 1.6
Left Tilt HSDPA Subtest 1 9400 1880 0.23 0.032 22.00 21.50 0.036 1.6
Right Cheek HSDPA Subtest 1 9400 1880 0.23 0.040 22.00 21.50 0.045 1.6
Right Tilt HSDPA Subtest 1 9400 1880 -0.42 0.051 22.00 21.50 0.057 1.6
Body back HSDPA Subtest 1 9400 1880 0.23 0.685 22.00 21.50 0.769 1.6
Body front HSDPA Subtest 1 9400 1880 1.55 0.041 22.00 21.50 0.046 1.6
Edge 1 (Top) HSDPA Subtest 1 9400 1880 -0.32 0.031 22.00 21.50 0.035 1.6
Edge 2(Right) HSDPA Subtest 1 9400 1880 -1.55 0.007 22.00 21.50 0.008 1.6
Edge 3(Bottom) HSDPA Subtest 1 9400 1880 0.26 0.009 22.00 21.50 0.010 1.6
Edge 4(Left) HSDPA Subtest 1 9400 1880 0.32 0.088 22.00 21.50 0.099 1.6
Note: · When the 1-g Reported SAR is ≤ 0.8 W/kg, testing for low and high channel is optional. Refer to KDB 447498.
·The test separation for body back and body front is 5mm of all above table. ·The test separation for 4 Edges is 10mm of all above table.

Report No.: AGC09674170301FH01 Page 42 of 108
SAR MEASUREMENT
Depth of Liquid (cm):>15 Relative Humidity (%): 55.5
Product: Smartphone-Miracle 6.0 S
Test Mode: WCDMA Band V with QPSK modulation
Position Mode Ch. Fr.
(MHz)
Power Drift
(<±5%)
SAR (1g)
(W/kg)
Max. Tune-up Power (dBm)
Meas. output Power (dBm)
Scaled SAR
(W/Kg)
Limit (W/kg)
Left Cheek HSUPA Subtest 3 4183 836.6 -0.23 0.046 21.06 20.57 0.051 1.6
Left Tilt HSUPA Subtest 3 4183 836.6 0.33 0.048 21.06 20.57 0.054 1.6
Right Cheek HSUPA Subtest 3 4183 836.6 0.23 0.059 21.06 20.57 0.066 1.6
Right Tilt HSUPA Subtest 3 4183 836.6 1.55 0.066 21.06 20.57 0.074 1.6
Body back HSUPA Subtest 3 4132 826.4 -0.20 1.008 21.06 21.06 1.008 1.6
Body back HSUPA Subtest 3 4183 836.6 0.23 0.995 21.06 20.57 1.114 1.6
Body back HSUPA Subtest 3 4233 846.6 1.66 0.989 21.06 20.13 1.225 1.6
Body front HSUPA Subtest 3 4183 836.6 0.32 0.062 21.06 20.57 0.069 1.6
Edge 1 (Top) HSUPA Subtest 3 4183 836.6 -0.02 0.033 21.06 20.57 0.037 1.6
Edge 2(Right) HSUPA Subtest 3 4183 836.6 0.56 0.028 21.06 20.57 0.031 1.6
Edge 3(Bottom) HSUPA Subtest 3 4183 836.6 0.32 0.005 21.06 20.57 0.006 1.6
Edge 4(Left) HSUPA Subtest 3 4183 836.6 -1.33 0.045 21.06 20.57 0.050 1.6
Note: · When the 1-g Reported SAR is ≤ 0.8 W/kg, testing for low and high channel is optional. Refer to KDB 447498.
·The test separation for body back and body front is 5mm of all above table. ·The test separation for 4 Edges is 10mm of all above table.

Report No.: AGC09674170301FH01 Page 43 of 108
SAR MEASUREMENT
Depth of Liquid (cm):>15 Relative Humidity (%): 52.7
Product: Smartphone-Miracle 6.0 S
Test Mode:802.11b
Position Mode Ch. Fr.
(MHz)
Power Drift
(<±5%)
SAR (1g)
(W/kg)
Max. Tune-up Power (dBm)
Meas. output Power (dBm)
Scaled SAR
(W/Kg)
Limit (W/kg)
Left Cheek DTS 01 2412 -0.06 0.080 16.20 16.04 0.083 1.6
Left Tilt DTS 01 2412 0.23 0.068 16.20 16.04 0.071 1.6
Right Cheek DTS 01 2412 1.33 0.046 16.20 16.04 0.048 1.6
Right Tilt DTS 01 2412 -0.02 0.031 16.20 16.04 0.032 1.6
Body back DTS 01 2412 0.56 0.251 16.20 16.04 0.260 1.6
Body front DTS 01 2412 0.32 0.030 16.20 16.04 0.031 1.6
Edge 1 (Top) DTS 01 2412 0.23 0.032 16.20 16.04 0.033 1.6
Edge 2(Right) DTS 01 2412 -1.22 0.068 16.20 16.04 0.071 1.6
Edge 3(Bottom) DTS 01 2412 -0.02 0.003 16.20 16.04 0.003 1.6
Edge 4(Left) DTS 01 2412 0.36 0.003 16.20 16.04 0.003 1.6
Note: · According to KDB248227, SAR is not required for 802.11n HT20/HT40 channels when the maximum average output power is less than 1/4 dB higher than that measured on the corresponding 802.11a/b channels.
· All of above “DTS” means data transmitters. ·The test separation for body back and body front is 5mm of all above table. ·The test separation for 4 Edges is 10mm of all above table.
Repeated SAR
Product: Smartphone-Miracle 6.0 S
Test Mode: PCS1900 & WCDMA Band V
Position Mode Ch. Fr.
(MHz)
Power Drift
(<±5%)
Once SAR (1g)
(W/kg)
Power Drift
(<±5%)
Twice SAR (1g)
(W/kg)
Power Drift
(<±5%)
Third SAR (1g)
(W/kg)
Limit (W/kg)
Body back
GPRS-3 slot 810 1909.8 -0.02 0.777 -- -- -- -- 1.6
Body back
HSUPA Subtest 3
4132 826.4 -0.63 1.006 -- -- -- -- 1.6

Report No.: AGC09674170301FH01 Page 44 of 108
Simultaneous Multi-band Transmission Evaluation: Application Simultaneous Transmission information:
NO Simultaneous state Portable Handset
Head Body-worn Hotspot
1 GSM(voice)+WLAN 2.4GHz (data) Yes Yes -
2 WCDMA(voice)+WLAN 2.4GHz (data) Yes Yes -
3 GSM(voice)+Bluetooth(data) - Yes -
4 WCDMA(voice)+Bluetooth(data) - Yes -
5 GSM (Data) + Bluetooth(data) - Yes Yes
6 GSM (Data) + WLAN 2.4GHz (data) Yes Yes Yes
7 WCDMA (Data) + Bluetooth(data) -- Yes Yes
8 WCDMA (Data) + WLAN 2.4GHz (data) Yes Yes Yes
NOTE: 1. WIFI and BT share the same antenna, and cannot transmit simultaneously. 2. Simultaneous with every transmitter must be the same test position. 3. KDB 447498 D01, BT SAR is excluded as below table. 4. KDB 447498 D01, for handsets the test separation distance is determined by the smallest distance
between the outer surface of the device and the user; which is 0mm for head SAR and 5mm for body-worn SAR.
5. According to KDB 447498 D01 4.3.1, Standalone SAR test exclusion is as follow:
For 100 MHz to 6 GHz and test separation distances ≤ 50 mm, the 1-g and 10-g SAR test exclusion
thresholds are determined by the following:
[(max. power of channel, including tune-up tolerance, mW) / (min. test separation distance, mm)] · [√
f(GHz)] ≤ 3.0 for 1-g SAR, and ≤ 7.5 for 10-g extremity SAR30
, where
·f(GHz) is the RF channel transmit frequency in GHz
·Power and distance are rounded to the nearest mW and mm before calculation31
·The result is rounded to one decimal place for comparison
·The values 3.0 and 7.5 are referred to as numeric thresholds in step b) below
The test exclusions are applicable only when the minimum test separation distance is ≤ 50 mm, and for
transmission frequencies between 100 MHz and 6 GHz. When the minimum test separation distance is < 5 mm, a distance of 5 mm according to 4.1 f) is applied to determine SAR test exclusion.
6. If the test separation distance is <5mm, 5mm is used for excluded SAR calculation. 7. According to KDB 447498 D01 4.3.2, simultaneous transmission SAR test exclusion is as follow:
(1) Simultaneous transmission SAR test exclusion is determined for each operating configuration and exposure condition according to the reported standalone SAR of each applicable simultaneous transmitting antenna.
(2) Any transmitters and antennas should be considered when calculating simultaneous mode. (3) For mobile phone and PC, it’s the sum of all transmitters and antennas at the same mode with same
position in each applicable exposure condition (4)When the standalone SAR test exclusion of section 4.3.2 is applied to an antenna that transmits
simultaneously with other antennas, the standalone SAR must be estimated according to the following to det (max. power of channel, including tune-up tolerance, mW)/(min. test separation distance, mm)]·[√f(GHz)/x] W/kg for test separation distances ≤ 50 mm; where x = 7.5 for 1-g SAR, and x = 18.75 for 10-g SAR.

Report No.: AGC09674170301FH01 Page 45 of 108
8. When the sum of SAR is larger than the limit, SAR test exclusion is determined by the SAR to peak location separation ratio. The simultaneous transmitting antennas in each operating mode and exposure condition combination must be considered one pair at a time to determine the SAR to peak location separation ratio to qualify for test exclusion. The ratio is determined by (SAR1 + SAR2)1.5/Ri, rounded to two decimal digits, and must be ≤ 0.04 for all antenna pairs in the configuration to qualify for 1-g SAR test exclusion.
Estimated SAR
Max Power including Tune-up Tolerance Separation
Distance (mm) Estimated SAR
(W/kg) dBm mW
BT
Head 6 3.98 0 0.165
Body 6 3.98 5 0.165
10 0.082

Report No.: AGC09674170301FH01 Page 46 of 108
Sum of the SAR for GSM 850 &Wi-Fi & BT:
RF Exposure Conditions
Test Position
Simultaneous Transmission Scenario Σ1-g SAR
(W/Kg) SPLSR
(Yes/No) GSM 850 WI-Fi
DTS Band Bluetooth
Head (voice)
Left Touch 0.068 0.083 0.151 No
Left Tilt 0.064 0.071 0.135 No
Right Touch 0.097 0.048 0.145 No
Right Tilt 0.098 0.032 0.130 No
Body-worn (voice)
Rear 0.719 0.260 0.979 No
0.719 0.165 0.884 No
Front 0.061 0.031 0.092 No
0.061 0.165 0.226 No
Head (Data)
Left Touch 0.062 0.083 0.145 No
Left Tilt 0.090 0.071 0.161 No
Right Touch 0.127 0.048 0.175 No
Right Tilt 0.107 0.032 0.139 No
Body-worn (Data)
Rear 0.738 0.165 0.903 No
0.738 0.260 0.998 No
Front 0.084 0.165 0.249 No
0.084 0.031 0.115 No
Body-worn (Hotspot)
Edge 1 0.087 0.033 0.120 No
Edge 2 0.053 0.071 0.124 No
Edge 3 0.010 0.003 0.013 No
Edge 4 0.108 0.003 0.111 No
Edge 1 0.087 0.082 0.169 No
Edge 2 0.053 0.082 0.135 No
Edge 3 0.010 0.082 0.092 No
Edge 4 0.108 0.082 0.190 No
Note:
·According to KDB 447498 D01 General RF Exposure Guidance, when the simultaneous transmission SAR is less than1.6 W/Kg, SPLSR assessment is not required.
·SPLSR mean is “The SAR to Peak Location Separation Ratio “

Report No.: AGC09674170301FH01 Page 47 of 108
Sum of the SAR for PCS 1900 &Wi-Fi & BT:
RF Exposure Conditions
Test Position
Simultaneous Transmission Scenario Σ1-g SAR
(W/Kg) SPLSR
(Yes/No) PCS 1900 WI-Fi
DTS Band Bluetooth
Head (voice)
Left Touch 0.025 0.083 0.108 No
Left Tilt 0.033 0.071 0.104 No
Right Touch 0.039 0.048 0.087 No
Right Tilt 0.043 0.032 0.075 No
Body-worn (voice)
Rear 0.404 0.260 0.664 No
0.404 0.165 0.569 No
Front 0.032 0.031 0.063 No
0.032 0.165 0.197 No
Head (Data)
Left Touch 0.039 0.083 0.122 No
Left Tilt 0.047 0.071 0.118 No
Right Touch 0.074 0.048 0.122 No
Right Tilt 0.073 0.032 0.105 No
Body-worn (Data)
Rear 0.833 0.165 0.998 No
0.833 0.260 1.093 No
Front 0.036 0.165 0.201 No
0.036 0.031 0.067 No
Body-worn (Hotspot)
Edge 1 0.050 0.033 0.083 No
Edge 2 0.010 0.071 0.081 No
Edge 3 0.014 0.003 0.017 No
Edge 4 0.172 0.003 0.175 No
Edge 1 0.050 0.082 0.132 No
Edge 2 0.010 0.082 0.092 No
Edge 3 0.014 0.082 0.096 No
Edge 4 0.172 0.082 0.254 No
Note:
·According to KDB 447498 D01 General RF Exposure Guidance, when the simultaneous transmission SAR is less than1.6 W/Kg, SPLSR assessment is not required.
·SPLSR mean is “The SAR to Peak Location Separation Ratio “

Report No.: AGC09674170301FH01 Page 48 of 108
Sum of the SAR for WCDMA Band II&Wi-Fi & BT:
RF Exposure Conditions
Test Position
Simultaneous Transmission Scenario Σ1-g SAR
(W/Kg) SPLSR
(Yes/No) WCDMA Band II
Wi-Fi DTS Band
Bluetooth
Head
Left Touch 0.032 0.083 0.115 No
Left Tilt 0.036 0.071 0.107 No
Right Touch 0.044 0.048 0.092 No
Right Tilt 0.057 0.032 0.089 No
Body-worn
Rear 0.769 0.260 1.029 No
Front 0.046 0.031 0.077 No
Edge 1 0.035 0.033 0.068 No
Edge 2 0.008 0.071 0.079 No
Edge 3 0.010 0.003 0.013 No
Edge 4 0.099 0.003 0.102 No
Rear 0.769 0.165 0.934 No
Front 0.046 0.165 0.211 No
Edge 1 0.035 0.082 0.117 No
Edge 2 0.008 0.082 0.090 No
Edge 3 0.010 0.082 0.092 No
Edge 4 0.099 0.082 0.181 No
Note:
·According to KDB 447498 D01 General RF Exposure Guidance, when the simultaneous transmission SAR is less than1.6 W/Kg, SPLSR assessment is not required.
·SPLSR mean is “The SAR to Peak Location Separation Ratio “

Report No.: AGC09674170301FH01 Page 49 of 108
Sum of the SAR for WCDMA Band V &Wi-Fi & BT:
RF Exposure Conditions
Test Position
Simultaneous Transmission Scenario Σ1-g SAR
(W/Kg) SPLSR
(Yes/No) WCDMA Band V
Wi-Fi DTS Band
Bluetooth
Head
Left Touch 0.051 0.083 0.134 No
Left Tilt 0.054 0.071 0.125 No
Right Touch 0.066 0.048 0.114 No
Right Tilt 0.074 0.032 0.106 No
Body-worn
Rear 1.225 0.260 1.485 No
Front 0.069 0.031 0.100 No
Edge 1 0.037 0.033 0.070 No
Edge 2 0.031 0.071 0.102 No
Edge 3 0.006 0.003 0.009 No
Edge 4 0.050 0.003 0.053 No
Rear 1.225 0.165 1.390 No
Front 0.069 0.165 0.234 No
Edge 1 0.037 0.082 0.119 No
Edge 2 0.031 0.082 0.113 No
Edge 3 0.006 0.082 0.088 No
Edge 4 0.050 0.082 0.132 No
Note:
·According to KDB 447498 D01 General RF Exposure Guidance, when the simultaneous transmission SAR is less than1.6 W/Kg, SPLSR assessment is not required.
·SPLSR mean is “The SAR to Peak Location Separation Ratio “

Report No.: AGC09674170301FH01 Page 50 of 108
APPENDIX A. SAR SYSTEM CHECK DATA Test Laboratory: AGC Lab Date: Mar. 21,2017 System Check Head 835 MHz DUT: Dipole 835 MHz Type: SID 835 Communication System CW; Communication System Band: D835 (835.0 MHz); Duty Cycle: 1:1; Conv.F=5.72
Frequency: 835 MHz; Medium parameters used: f = 835 MHz; ζ =0.89mho/m; ε r =41.97; ρ = 1000 kg/m³ ;
Phantom section: Flat Section; Input Power=18dBm
Ambient temperature (℃):21.4, Liquid temperature (℃): 21.2
SATIMO Configuration
• Probe: SSE5; Calibrated: 12/05/2016; Serial No.: SN 14/16 EP308
• Sensor-Surface: 4mm (Mechanical Surface Detection)
• Phantom: SAM twin phantom
• Measurement SW: OpenSAR V4_02_32
Configuration/System Check 835MHz Head/Area Scan: Measurement grid: dx=8mm, dy=8mm Configuration/System Check 835MHz Head/Zoom Scan: Measurement grid: dx=8mm,dy=8mm, dz=5mm
SURFACE SAR VOLUME SAR
Maximum location: X=1.00, Y=1.00
SAR Peak: 1.05W/kg
SAR 10g (W/Kg) 0.411023
SAR 1g (W/Kg) 0.667591

Report No.: AGC09674170301FH01 Page 51 of 108
Z (mm) 0.00 4.00 9.00 14.00 19.00 24.00 29.00
SAR
(W/Kg)
1.0035 0.7011 0.4462 0.2912 0.1915 0.1275 0.0858
3D screen shot Hot spot position

Report No.: AGC09674170301FH01 Page 52 of 108
Test Laboratory: AGC Lab Date: Mar. 21,2017 System Check Body 835 MHz DUT: Dipole 835 MHz Type: SID 835 Communication System CW; Communication System Band: D835 (835.0 MHz); Duty Cycle: 1:1; Conv.F=5.94
Frequency: 835 MHz; Medium parameters used: f = 835 MHz; ζ =0.95 mho/m; ε r =55.41; ρ = 1000 kg/m³ ;
Phantom section: Flat Section; Input Power=18dBm
Ambient temperature (℃):21.4, Liquid temperature (℃): 21.3
SATIMO Configuration
• Probe: SSE5; Calibrated: 12/05/2016; Serial No.: SN 14/16 EP308
• Sensor-Surface: 4mm (Mechanical Surface Detection)
• Phantom: SAM twin phantom
• Measurement SW: OpenSAR V4_02_32
Configuration/System Check 835MHz Body/Area Scan: Measurement grid: dx=8mm, dy=8mm Configuration/System Check 835MHz Body/Zoom Scan: Measurement grid: dx=8mm,dy=8mm, dz=5mm
SURFACE SAR VOLUME SAR
Maximum location: X=1.00, Y=0.00
SAR Peak: 0.91 W/kg
SAR 10g (W/Kg) 0.399523
SAR 1g (W/Kg) 0.622053

Report No.: AGC09674170301FH01 Page 53 of 108
Z (mm) 0.00 4.00 9.00 14.00 19.00 24.00 29.00
SAR
(W/Kg)
0.9035 0.6458 0.4257 0.2883 0.1971 0.1362 0.0951
3D screen shot Hot spot position

Report No.: AGC09674170301FH01 Page 54 of 108
Test Laboratory: AGC Lab Date: Mar. 22,2017 System Check Head 1900MHz DUT: Dipole 1900 MHz; Type: SID 1900 Communication System: CW; Communication System Band: D1900 (1900.0 MHz); Duty Cycle:1:1; Conv.F=5.74
Frequency: 1900 MHz; Medium parameters used: f = 1900 MHz; ζ =1.40mho/m; ε r =40.42; ρ = 1000 kg/m³ ;
Phantom section: Flat Section; Input Power=18dBm
Ambient temperature (℃):21.4, Liquid temperature (℃): 20.2
SATIMO Configuration:
• Probe: SSE5; Calibrated: 12/05/2016; Serial No.: SN 14/16 EP308
• Sensor-Surface: 4mm (Mechanical Surface Detection)
• Phantom: SAM twin phantom
• Measurement SW: OpenSAR V4_02_32
Configuration/System Check 1900MHz Head/Area Scan: Measurement grid: dx=8mm, dy=8mm Configuration/System Check 1900MHz Head/Zoom Scan: Measurement grid: dx=8mm,dy=8mm, dz=5mm
SURFACE SAR VOLUME SAR
Maximum location: X=0.00, Y=-1.00
SAR Peak: 3.89 W/kg
SAR 10g (W/Kg) 1.356652
SAR 1g (W/Kg) 2.463688

Report No.: AGC09674170301FH01 Page 55 of 108
Z (mm) 0.00 4.00 9.00 14.00 19.00 24.00 29.00
SAR
(W/Kg)
3.8591 2.4345 1.3328 0.7559 0.4314 0.2518 0.1477
3D screen shot Hot spot position

Report No.: AGC09674170301FH01 Page 56 of 108
Test Laboratory: AGC Lab Date: Mar. 22,2017 System Check Body 1900MHz DUT: Dipole 1900 MHz; Type: SID 1900 Communication System: CW; Communication System Band: D1900 (1900.0 MHz); Duty Cycle:1:1; Conv.F=5.90
Frequency: 1900 MHz; Medium parameters used: f = 1900 MHz; ζ =1.51 mho/m; ε r =53.55; ρ = 1000 kg/m³ ;
Phantom section: Flat Section; Input Power=18dBm
Ambient temperature (℃):21.4, Liquid temperature (℃): 20.5
SATIMO Configuration:
• Probe: SSE5; Calibrated: 12/05/2016; Serial No.: SN 14/16 EP308
• Sensor-Surface: 4mm (Mechanical Surface Detection)
• Phantom: SAM twin phantom
• Measurement SW: OpenSAR V4_02_32
Configuration/System Check 1900MHz Body/Area Scan: Measurement grid: dx=8mm, dy=8mm Configuration/System Check 1900MHz Body/Zoom Scan: Measurement grid: dx=8mm,dy=8mm, dz=5mm
SURFACE SAR VOLUME SAR
Maximum location: X=-1.00, Y=-2.00
SAR Peak: 4.18 W/kg
SAR 10g (W/Kg) 1.246592
SAR 1g (W/Kg) 2.471364

Report No.: AGC09674170301FH01 Page 57 of 108
Z (mm) 0.00 4.00 9.00 14.00 19.00 24.00 29.00
SAR
(W/Kg)
4.2228 2.6131 1.3879 0.7642 0.4233 0.2374 0.1338
3D screen shot Hot spot position

Report No.: AGC09674170301FH01 Page 58 of 108
Test Laboratory: AGC Lab Date: Mar. 24,2017 System Check Head 2450 MHz DUT: Dipole 2450 MHz Type: SID 2450 Communication System CW; Communication System Band: D2450 (2450.0 MHz); Duty Cycle: 1:1; Conv.F=5.19
Frequency: 2450 MHz; Medium parameters used: f = 2450 MHz; ζ =1.77 mho/m; ε r =39.98; ρ = 1000 kg/m³ ;
Phantom section: Flat Section; Input Power=18dBm
Ambient temperature (℃):22.2, Liquid temperature (℃): 21.8
SATIMO Configuration
• Probe: SSE5; Calibrated: 12/05/2016; Serial No.: SN 14/16 EP308
• Sensor-Surface: 4mm (Mechanical Surface Detection)
• Phantom: SAM twin phantom
• Measurement SW: OpenSAR V4_02_32
Configuration/System Check 2450MHz Head/Area Scan: Measurement grid: dx=8mm, dy=8mm Configuration/System Check 2450MHz Head/Zoom Scan: Measurement grid: dx=5mm,dy=5mm, dz=5mm
SURFACE SAR VOLUME SAR
Maximum location: X=0.00, Y=0.00
SAR Peak: 5.91 W/kg
SAR 10g (W/Kg) 1.492013
SAR 1g (W/Kg) 3.184102

Report No.: AGC09674170301FH01 Page 59 of 108
Z (mm) 0.00 4.00 9.00 14.00 19.00 24.00 29.00
SAR
(W/Kg)
5.9689 3.4274 1.5942 0.7636 0.3653 0.1777 0.0869
3D screen shot Hot spot position

Report No.: AGC09674170301FH01 Page 60 of 108
Test Laboratory: AGC Lab Date: Mar. 24,2017 System Check Body 2450 MHz DUT: Dipole 2450 MHz Type: SID 2450 Communication System CW; Communication System Band: D2450 (2450.0 MHz); Duty Cycle: 1:1; Conv.F=5.33
Frequency: 2450 MHz; Medium parameters used: f = 2450 MHz; ζ =1.93 mho/m; ε r =53.96; ρ = 1000 kg/m³ ;
Phantom section: Flat Section; Input Power=18dBm
Ambient temperature (℃):22.2, Liquid temperature (℃): 21.5
SATIMO Configuration
• Probe: SSE5; Calibrated: 12/05/2016; Serial No.: SN 14/16 EP308
• Sensor-Surface: 4mm (Mechanical Surface Detection)
• Phantom: SAM twin phantom
• Measurement SW: OpenSAR V4_02_32
Configuration/System Check 2450MHz Body/Area Scan: Measurement grid: dx=8mm, dy=8mm Configuration/System Check 2450MHz Body/Zoom Scan: Measurement grid: dx=5mm,dy=5mm, dz=5mm
SURFACE SAR VOLUME SAR
Maximum location: X=0.00, Y=0.00
SAR Peak: 5.71 W/kg
SAR 10g (W/Kg) 1.429536
SAR 1g (W/Kg) 3.110235
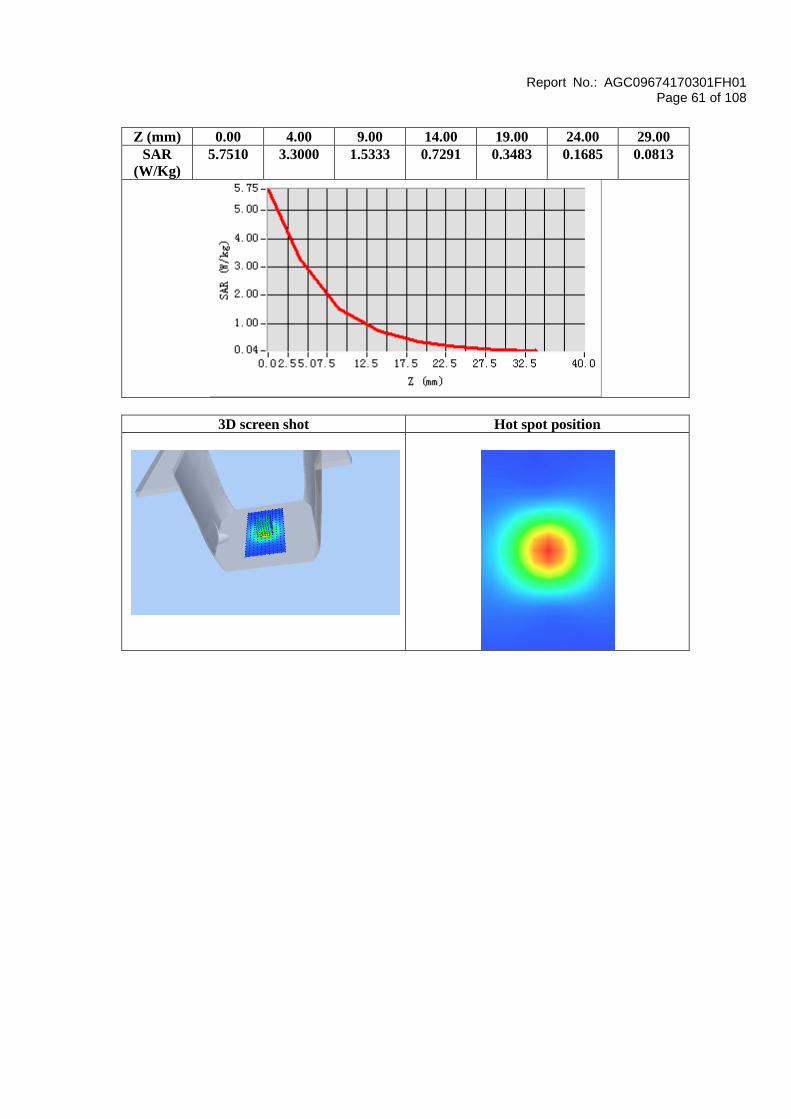
Report No.: AGC09674170301FH01 Page 61 of 108
Z (mm) 0.00 4.00 9.00 14.00 19.00 24.00 29.00
SAR
(W/Kg)
5.7510 3.3000 1.5333 0.7291 0.3483 0.1685 0.0813
3D screen shot Hot spot position

Report No.: AGC09674170301FH01 Page 62 of 108
APPENDIX B. SAR MEASUREMENT DATA Test Laboratory: AGC Lab Date: Mar. 21,2017 GSM 850 Mid- Tilt-Right <SIM 1> DUT: Smartphone-Miracle 6.0 S; Type: Miracle 6.0 S Communication System: Generic GSM; Communication System Band: GSM 850; Duty Cycle: 1:8.3; Conv.F=5.72;
Frequency: 836.6 MHz; Medium parameters used: f = 835 MHz; ζ = 0.89 mho/m; ε r = 41.52; ρ = 1000 kg/m³ ;
Phantom section: Right Section
Ambient temperature (℃): 21.4, Liquid temperature (℃): 21.2
SATIMO Configuration:
• Probe: SSE5; Calibrated: 12/05/2016; Serial No.: SN 14/16 EP308
• Sensor-Surface: 4mm (Mechanical Surface Detection)
• Phantom: SAM twin phantom
• Measurement SW: OpenSAR V4_02_32
Configuration/GSM 850 Mid-Tilt-Right/Area Scan: Measurement grid: dx=8mm, dy=8mm Configuration/GSM 850 Mid-Tilt-Right/Zoom Scan: Measurement grid: dx=8mm,dy=8mm, dz=5mm;
Area Scan sam_direct_droit2_surf8mm.txt
ZoomScan 5x5x7,dx=8mm dy=8mm dz=5mm,Complete
Phantom Right head
Device Position Tilt
Band GSM 850
Channels Middle
Signal TDMA (Crest factor: 8.0)
SURFACE SAR VOLUME SAR
Maximum location: X=8.00, Y=33.00
SAR Peak: 0.14 W/kg
SAR 10g (W/Kg) 0.057192
SAR 1g (W/Kg) 0.089853

Report No.: AGC09674170301FH01 Page 63 of 108
Z (mm) 0.00 4.00 9.00 14.00 19.00 24.00 29.00
SAR
(W/Kg)
0.1256 0.0928 0.0639 0.0393 0.0297 0.0202 0.0148
3D screen shot Hot spot position

Report No.: AGC09674170301FH01 Page 64 of 108
Test Laboratory: AGC Lab Date: Mar. 21,2017 GSM 850 Mid- Body- Back (MS)<SIM 1> DUT: Smartphone-Miracle 6.0 S; Type: Miracle 6.0 S Communication System: Generic GSM; Communication System Band: GSM 850; Duty Cycle: 1:8.3; Conv.F=5.94;
Frequency: 836.6 MHz; Medium parameters used: f = 835 MHz; ζ = 0.96 mho/m; ε r = 55.03; ρ = 1000 kg/m³ ;
Phantom section: Flat Section Ambient temperature (℃): 21.4, Liquid temperature (℃): 21.3
SATIMO Configuration:
• Probe: SSE5; Calibrated: 12/05/2016; Serial No.: SN 14/16 EP308
• Sensor-Surface: 4mm (Mechanical Surface Detection)
• Phantom: SAM twin phantom
• Measurement SW: OpenSAR V4_02_32
Configuration/GSM 850 Mid-Body-Back/Area Scan: Measurement grid: dx=8mm, dy=8mm Configuration/GSM 850 Mid-Body-Back/Zoom Scan: Measurement grid: dx=8mm,dy=8mm, dz=5mm;
Area Scan sam_direct_droit2_surf8mm.txt
ZoomScan 5x5x7,dx=8mm dy=8mm dz=5mm,Complete
Phantom Validation plane
Device Position Body Back
Band GSM 850
Channels Middle
Signal TDMA (Crest factor: 8.0)
SURFACE SAR VOLUME SAR
Maximum location: X=22.00, Y=3.00
SAR Peak: 1.11 W/kg
SAR 10g (W/Kg) 0.376895
SAR 1g (W/Kg) 0.659392

Report No.: AGC09674170301FH01 Page 65 of 108
Z (mm) 0.00 4.00 9.00 14.00 19.00 24.00 29.00
SAR
(W/Kg)
1.0445 0.7083 0.4332 0.2447 0.1622 0.1017 0.0651
3D screen shot Hot spot position

Report No.: AGC09674170301FH01 Page 66 of 108
Test Laboratory: AGC Lab Date: Mar. 21,2017 GPRS 850 Mid- Touch-Right (2up) <SIM 1> DUT: Smartphone-Miracle 6.0 S; Type: Miracle 6.0 S Communication System: GPRS-2 Slot; Communication System Band: GSM 850; Duty Cycle: 1:4.2; Conv.F=5.72
Frequency: 836.6 MHz; Medium parameters used: f = 835 MHz; ζ = 0.89 mho/m; ε r = 41.52; ρ = 1000 kg/m³;
Phantom section: Right Section Ambient temperature (℃): 21.4, Liquid temperature (℃): 21.2
SATIMO Configuration:
• Probe: SSE5; Calibrated: 12/05/2016; Serial No.: SN 14/16 EP308
• Sensor-Surface: 4mm (Mechanical Surface Detection)
• Phantom: SAM twin phantom
• Measurement SW: OpenSAR V4_02_32
Configuration/GPRS 850 Mid-Touch-Right/Area Scan: Measurement grid: dx=8mm, dy=8mm Configuration/GPRS 850 Mid-Touch-Right/Zoom Scan: Measurement grid: dx=8mm,dy=8mm, dz=5mm;
Area Scan sam_direct_droit2_surf8mm.txt
Zoom Scan 5x5x7,dx=8mm dy=8mm dz=5mm,Complete
Phantom Right head
Device Position Cheek
Band GSM 850
Channels Middle
Signal TDMA (Crest factor: 4.0)
SURFACE SAR VOLUME SAR
Maximum location: X=-14.00, Y=32.00
SAR Peak: 0.16 W/kg
SAR 10g (W/Kg) 0.077664
SAR 1g (W/Kg) 0.114412

Report No.: AGC09674170301FH01 Page 67 of 108
Z (mm) 0.00 4.00 9.00 14.00 19.00 24.00 29.00
SAR
(W/Kg)
0.1483 0.1203 0.0908 0.0642 0.0472 0.0338 0.0244
3D screen shot Hot spot position

Report No.: AGC09674170301FH01 Page 68 of 108
Test Laboratory: AGC Lab Date: Mar. 21,2017 GPRS 850 Mid- Body- Back (2up) <SIM 1> DUT: Smartphone-Miracle 6.0 S; Type: Miracle 6.0 S Communication System: GPRS-2 Slot; Communication System Band: GSM 850; Duty Cycle: 1:4.2; Conv.F=5.94;
Frequency: 836.6 MHz; Medium parameters used: f = 835 MHz; ζ = 0.96 mho/m; ε r = 55.03; ρ = 1000 kg/m³ ;
Phantom section: Flat Section Ambient temperature (℃): 21.4, Liquid temperature (℃): 21.3
SATIMO Configuration:
• Probe: SSE5; Calibrated: 12/05/2016; Serial No.: SN 14/16 EP308
• Sensor-Surface: 4mm (Mechanical Surface Detection)
• Phantom: SAM twin phantom
• Measurement SW: OpenSAR V4_02_32
Configuration/GPRS 850 Mid-Body-Back/Area Scan: Measurement grid: dx=8mm, dy=8mm Configuration/GPRS 850 Mid-Body-Back/Zoom Scan: Measurement grid: dx=8mm,dy=8mm, dz=5mm;
Area Scan sam_direct_droit2_surf8mm.txt
Zoom Scan 5x5x7,dx=8mm dy=8mm dz=5mm,Complete
Phantom Validation plane
Device Position Body Back
Band GSM 850
Channels Middle
Signal TDMA (Crest factor: 4.0)
SURFACE SAR VOLUME SAR
Maximum location: X=21.00, Y=2.00
SAR Peak: 0.99 W/kg
SAR 10g (W/Kg) 0.409957
SAR 1g (W/Kg) 0.662498

Report No.: AGC09674170301FH01 Page 69 of 108
Z (mm) 0.00 4.00 9.00 14.00 19.00 24.00 29.00
SAR
(W/Kg)
0.9557 0.7068 0.4675 0.2936 0.1843 0.1209 0.0797
3D screen shot Hot spot position

Report No.: AGC09674170301FH01 Page 70 of 108
Test Laboratory: AGC Lab Date: Mar. 21,2017 GPRS 850 Mid- Touch-Right (2up) <SIM 2> DUT: Smartphone-Miracle 6.0 S; Type: Miracle 6.0 S Communication System: GPRS-2 Slot; Communication System Band: GSM 850; Duty Cycle: 1:4.2; Conv.F=5.72
Frequency: 836.6 MHz; Medium parameters used: f = 835 MHz; ζ = 0.89 mho/m; ε r = 41.52; ρ = 1000 kg/m³;
Phantom section: Right Section Ambient temperature (℃): 21.4, Liquid temperature (℃): 21.2
SATIMO Configuration:
• Probe: SSE5; Calibrated: 12/05/2016; Serial No.: SN 14/16 EP308
• Sensor-Surface: 4mm (Mechanical Surface Detection)
• Phantom: SAM twin phantom
• Measurement SW: OpenSAR V4_02_32
Configuration/GPRS 850 Mid-Touch-Right/Area Scan: Measurement grid: dx=8mm, dy=8mm Configuration/GPRS 850 Mid-Touch-Right/Zoom Scan: Measurement grid: dx=8mm,dy=8mm, dz=5mm;
Area Scan sam_direct_droit2_surf8mm.txt
Zoom Scan 5x5x7,dx=8mm dy=8mm dz=5mm,Complete
Phantom Right head
Device Position Cheek
Band GSM 850
Channels Middle
Signal TDMA (Crest factor: 4.0)
SURFACE SAR VOLUME SAR
Maximum location: X=-30.00, Y=25.00
SAR Peak: 0.15 W/kg
SAR 10g (W/Kg) 0.069913
SAR 1g (W/Kg) 0.104058

Report No.: AGC09674170301FH01 Page 71 of 108
Z (mm) 0.00 4.00 9.00 14.00 19.00 24.00 29.00
SAR
(W/Kg)
0.1340 0.1087 0.0810 0.0586 0.0416 0.0304 0.0225
3D screen shot Hot spot position

Report No.: AGC09674170301FH01 Page 72 of 108
Test Laboratory: AGC Lab Date: Mar. 21,2017 GPRS 850 Mid- Body- Back (2up) <SIM 2> DUT: Smartphone-Miracle 6.0 S; Type: Miracle 6.0 S Communication System: GPRS-2 Slot; Communication System Band: GSM 850; Duty Cycle: 1:4.2; Conv.F=5.94;
Frequency: 836.6 MHz; Medium parameters used: f = 835 MHz; ζ = 0.96 mho/m; ε r = 55.03; ρ = 1000 kg/m³ ;
Phantom section: Flat Section Ambient temperature (℃): 21.4, Liquid temperature (℃): 21.3
SATIMO Configuration:
• Probe: SSE5; Calibrated: 12/05/2016; Serial No.: SN 14/16 EP308
• Sensor-Surface: 4mm (Mechanical Surface Detection)
• Phantom: SAM twin phantom
• Measurement SW: OpenSAR V4_02_32
Configuration/GPRS 850 Mid-Body-Back/Area Scan: Measurement grid: dx=8mm, dy=8mm Configuration/GPRS 850 Mid-Body-Back/Zoom Scan: Measurement grid: dx=8mm,dy=8mm, dz=5mm;
Area Scan sam_direct_droit2_surf8mm.txt
Zoom Scan 5x5x7,dx=8mm dy=8mm dz=5mm,Complete
Phantom Validation plane
Device Position Body Back
Band GSM 850
Channels Middle
Signal TDMA (Crest factor: 4.0)
SURFACE SAR VOLUME SAR
Maximum location: X=21.00, Y=2.00
SAR Peak: 0.99 W/kg
SAR 10g (W/Kg) 0.409688
SAR 1g (W/Kg) 0.660805

Report No.: AGC09674170301FH01 Page 73 of 108
Z (mm) 0.00 4.00 9.00 14.00 19.00 24.00 29.00
SAR
(W/Kg)
0.9557 0.7062 0.4672 0.2935 0.1841 0.1206 0.0795
3D screen shot Hot spot position

Report No.: AGC09674170301FH01 Page 74 of 108
Test Laboratory: AGC Lab Date: Mar. 22,2017 PCS 1900 Mid-Tilt-Right <SIM 1> DUT: Smartphone-Miracle 6.0 S; Type: Miracle 6.0 S Communication System: Generic GSM; Communication System Band: PCS 1900; Duty Cycle: 1:8.3; Conv.F=5.74;
Frequency: 1880 MHz; Medium parameters used: f = 1900 MHz; ζ = 1.38 mho/m; ε r = 40.88; ρ = 1000 kg/m³ ;
Phantom section: Right Section Ambient temperature (℃): 21.4, Liquid temperature (℃): 20.2
SATIMO Configuration:
• Probe: SSE5; Calibrated: 12/05/2016; Serial No.: SN 14/16 EP308
• Sensor-Surface: 4mm (Mechanical Surface Detection)
• Phantom: SAM twin phantom
• Measurement SW: OpenSAR V4_02_32
Configuration/PCS1900 Mid-Tilt-Right/Area Scan: Measurement grid: dx=8mm, dy=8mm Configuration/PCS1900 Mid-Tilt-Right/Zoom Scan: Measurement grid: dx=8mm,dy=8mm, dz=5mm;
Area Scan sam_direct_droit2_surf8mm.txt
ZoomScan 5x5x7,dx=8mm dy=8mm dz=5mm,Complete
Phantom Right head
Device Position Tilt
Band PCS 1900
Channels Middle
Signal TDMA (Crest factor: 8.0)
SURFACE SAR VOLUME SAR
Maximum location: X=-1.00, Y=21.00
SAR Peak: 0.07 W/kg
SAR 10g (W/Kg) 0.019971
SAR 1g (W/Kg) 0.041243

Report No.: AGC09674170301FH01 Page 75 of 108
Z (mm) 0.00 4.00 9.00 14.00 19.00 24.00 29.00
SAR
(W/Kg)
0.0724 0.0440 0.0225 0.0111 0.0058 0.0030 0.0014
3D screen shot Hot spot position

Report No.: AGC09674170301FH01 Page 76 of 108
Test Laboratory: AGC Lab Date: Mar. 22,2017 PCS 1900 Mid-Body-Back (MS)<SIM 1> DUT: Smartphone-Miracle 6.0 S; Type: Miracle 6.0 S Communication System: Generic GSM; Communication System Band: PCS 1900; Duty Cycle: 1:8.3; Conv.F=5.90;
Frequency: 1880 MHz; Medium parameters used: f = 1900 MHz; ζ = 1.49 mho/m; ε r = 53.79; ρ = 1000 kg/m³ ;
Phantom section: Flat Section Ambient temperature (℃): 21.4, Liquid temperature (℃): 20.5
SATIMO Configuration:
• Probe: SSE5; Calibrated: 12/05/2016; Serial No.: SN 14/16 EP308
• Sensor-Surface: 4mm (Mechanical Surface Detection)
• Phantom: SAM twin phantom
• Measurement SW: OpenSAR V4_02_32
Configuration/PCS1900 Mid-Body-Back/Area Scan: Measurement grid: dx=8mm, dy=8mm Configuration/PCS1900 Mid-Body-Back/Zoom Scan: Measurement grid: dx=8mm,dy=8mm, dz=5mm;
Area Scan sam_direct_droit2_surf8mm.txt
ZoomScan 5x5x7,dx=8mm dy=8mm dz=5mm,Complete
Phantom Validation plane
Device Position Body Back
Band PCS 1900
Channels Middle
Signal TDMA (Crest factor: 8.0)
SURFACE SAR VOLUME SAR
Maximum location: X=22.00, Y=5.00
SAR Peak: 0.66 W/kg
SAR 10g (W/Kg) 0.190183
SAR 1g (W/Kg) 0.388270

Report No.: AGC09674170301FH01 Page 77 of 108
Z (mm) 0.00 4.00 9.00 14.00 19.00 24.00 29.00
SAR
(W/Kg)
0.6416 0.4223 0.2411 0.1373 0.0752 0.0396 0.0229
3D screen shot Hot spot position
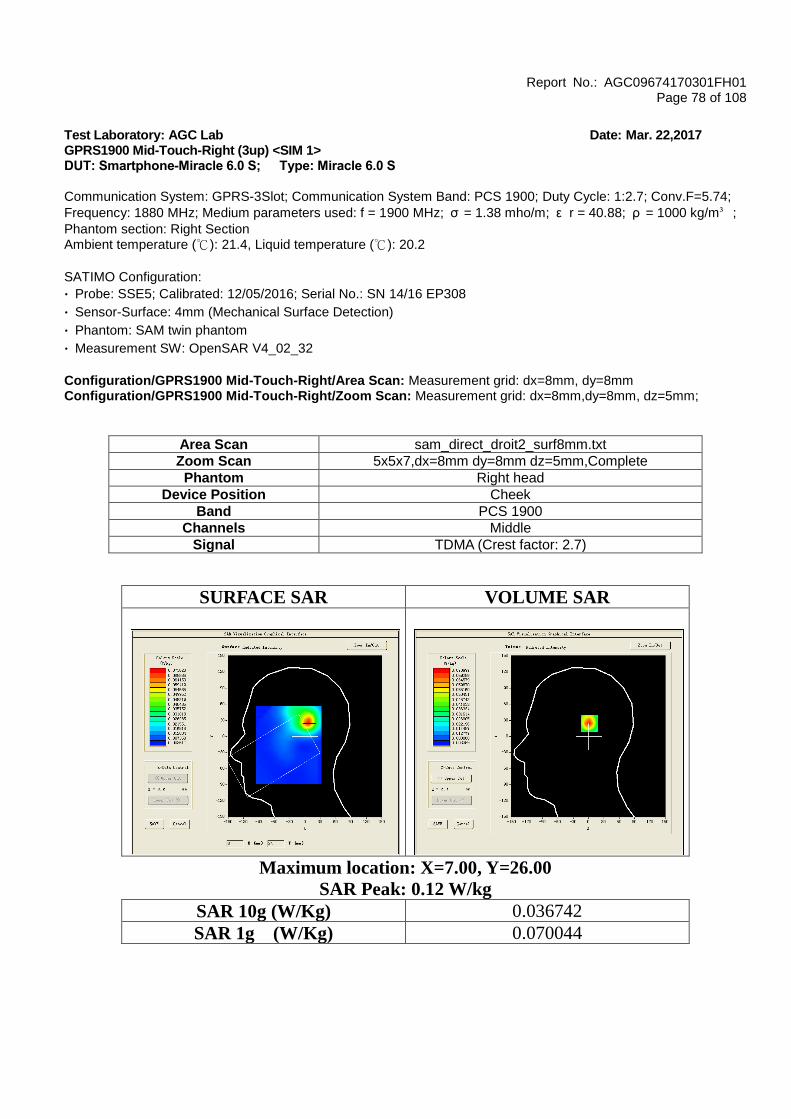
Report No.: AGC09674170301FH01 Page 78 of 108
Test Laboratory: AGC Lab Date: Mar. 22,2017 GPRS1900 Mid-Touch-Right (3up) <SIM 1> DUT: Smartphone-Miracle 6.0 S; Type: Miracle 6.0 S Communication System: GPRS-3Slot; Communication System Band: PCS 1900; Duty Cycle: 1:2.7; Conv.F=5.74;
Frequency: 1880 MHz; Medium parameters used: f = 1900 MHz; ζ = 1.38 mho/m; ε r = 40.88; ρ = 1000 kg/m³ ;
Phantom section: Right Section Ambient temperature (℃): 21.4, Liquid temperature (℃): 20.2
SATIMO Configuration:
• Probe: SSE5; Calibrated: 12/05/2016; Serial No.: SN 14/16 EP308
• Sensor-Surface: 4mm (Mechanical Surface Detection)
• Phantom: SAM twin phantom
• Measurement SW: OpenSAR V4_02_32
Configuration/GPRS1900 Mid-Touch-Right/Area Scan: Measurement grid: dx=8mm, dy=8mm Configuration/GPRS1900 Mid-Touch-Right/Zoom Scan: Measurement grid: dx=8mm,dy=8mm, dz=5mm;
Area Scan sam_direct_droit2_surf8mm.txt
Zoom Scan 5x5x7,dx=8mm dy=8mm dz=5mm,Complete
Phantom Right head
Device Position Cheek
Band PCS 1900
Channels Middle
Signal TDMA (Crest factor: 2.7)
SURFACE SAR VOLUME SAR
Maximum location: X=7.00, Y=26.00
SAR Peak: 0.12 W/kg
SAR 10g (W/Kg) 0.036742
SAR 1g (W/Kg) 0.070044
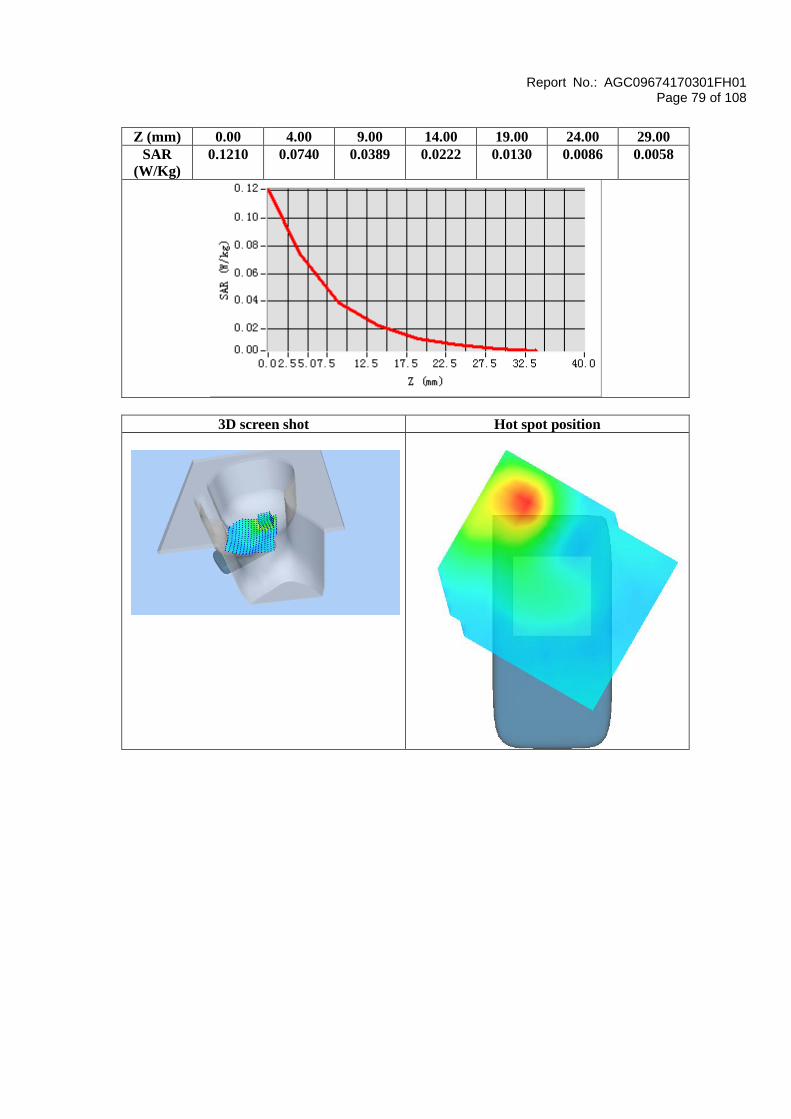
Report No.: AGC09674170301FH01 Page 79 of 108
Z (mm) 0.00 4.00 9.00 14.00 19.00 24.00 29.00
SAR
(W/Kg)
0.1210 0.0740 0.0389 0.0222 0.0130 0.0086 0.0058
3D screen shot Hot spot position

Report No.: AGC09674170301FH01 Page 80 of 108
Test Laboratory: AGC Lab Date: Mar. 22,2017 GPRS 1900 High-Body-Back (3up) <SIM 1> DUT: Smartphone-Miracle 6.0 S; Type: Miracle 6.0 S Communication System: GPRS-3Slot; Communication System Band: PCS 1900; Duty Cycle: 1:2.7; Conv.F=5.90;
Frequency: 1909.8 MHz; Medium parameters used: f = 1900 MHz; ζ = 1.53mho/m; ε r = 52.88; ρ = 1000 kg/m³ ;
Phantom section: Flat Section Ambient temperature (℃): 21.4, Liquid temperature (℃): 20.5
SATIMO Configuration:
• Probe: SSE5; Calibrated: 12/05/2016; Serial No.: SN 14/16 EP308
• Sensor-Surface: 4mm (Mechanical Surface Detection)
• Phantom: SAM twin phantom
• Measurement SW: OpenSAR V4_02_32
Configuration/GPRS1900 High -Body-Back/Area Scan: Measurement grid: dx=8mm, dy=8mm Configuration/GPRS1900 High -Body-Back/Zoom Scan: Measurement grid: dx=8mm,dy=8mm, dz=5mm;
Area Scan sam_direct_droit2_surf8mm.txt
Zoom Scan 5x5x7,dx=8mm dy=8mm dz=5mm,Complete
Phantom Validation plane
Device Position Body Back
Band PCS 1900
Channels High
Signal TDMA (Crest factor: 2.7)
SURFACE SAR VOLUME SAR
Maximum location: X=16.00, Y=16.00
SAR Peak: 1.37 W/kg
SAR 10g (W/Kg) 0.369036
SAR 1g (W/Kg) 0.778894
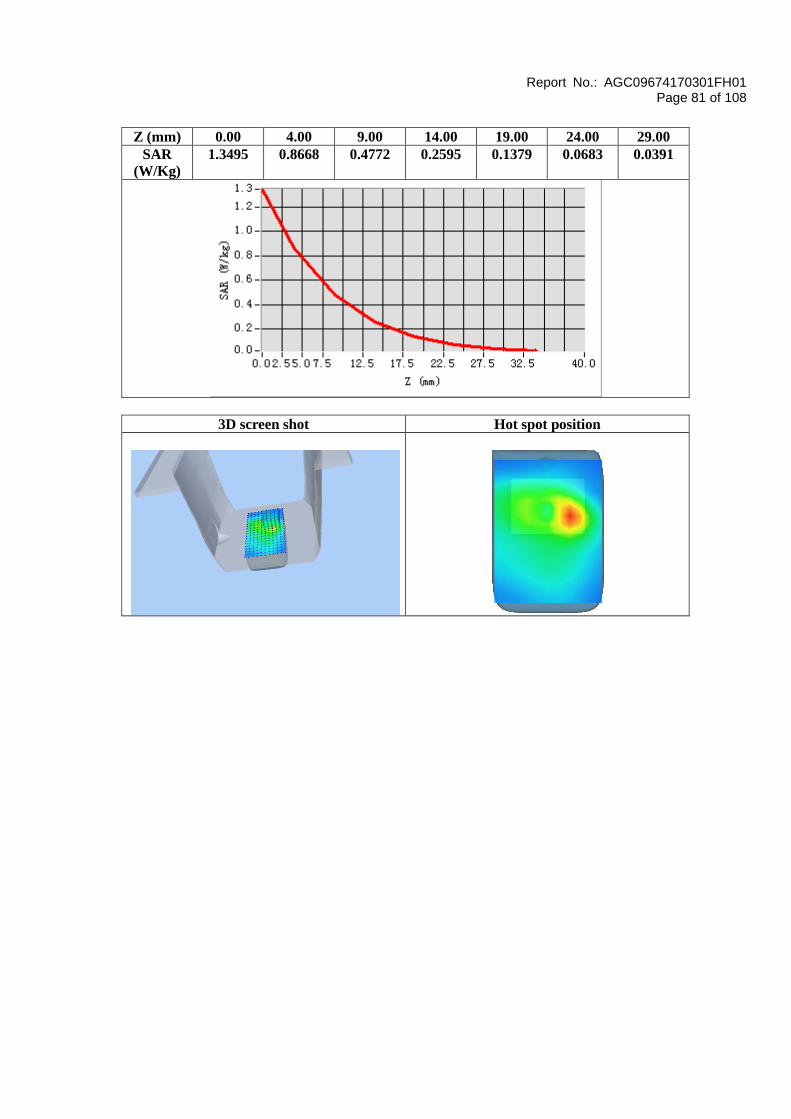
Report No.: AGC09674170301FH01 Page 81 of 108
Z (mm) 0.00 4.00 9.00 14.00 19.00 24.00 29.00
SAR
(W/Kg)
1.3495 0.8668 0.4772 0.2595 0.1379 0.0683 0.0391
3D screen shot Hot spot position

Report No.: AGC09674170301FH01 Page 82 of 108
Test Laboratory: AGC Lab Date: Mar. 22,2017 GPRS1900 Mid-Touch-Right (3up) <SIM 2> DUT: Smartphone-Miracle 6.0 S; Type: Miracle 6.0 S Communication System: GPRS-3Slot; Communication System Band: PCS 1900; Duty Cycle: 1:2.7; Conv.F=5.74;
Frequency: 1880 MHz; Medium parameters used: f = 1900 MHz; ζ = 1.38 mho/m; ε r = 40.88; ρ = 1000 kg/m³ ;
Phantom section: Right Section Ambient temperature (℃): 21.4, Liquid temperature (℃): 20.2
SATIMO Configuration:
• Probe: SSE5; Calibrated: 12/05/2016; Serial No.: SN 14/16 EP308
• Sensor-Surface: 4mm (Mechanical Surface Detection)
• Phantom: SAM twin phantom
• Measurement SW: OpenSAR V4_02_32
Configuration/GPRS1900 Mid-Touch-Right/Area Scan: Measurement grid: dx=8mm, dy=8mm Configuration/GPRS1900 Mid-Touch-Right/Zoom Scan: Measurement grid: dx=8mm,dy=8mm, dz=5mm;
Area Scan sam_direct_droit2_surf8mm.txt
Zoom Scan 5x5x7,dx=8mm dy=8mm dz=5mm,Complete
Phantom Right head
Device Position Cheek
Band PCS 1900
Channels Middle
Signal TDMA (Crest factor: 2.7)
SURFACE SAR VOLUME SAR
Maximum location: X=-16.00, Y=34.00
SAR Peak: 0.09 W/kg
SAR 10g (W/Kg) 0.033466
SAR 1g (W/Kg) 0.055520

Report No.: AGC09674170301FH01 Page 83 of 108
Z (mm) 0.00 4.00 9.00 14.00 19.00 24.00 29.00
SAR
(W/Kg)
0.0845 0.0565 0.0334 0.0190 0.0125 0.0071 0.0059
3D screen shot Hot spot position

Report No.: AGC09674170301FH01 Page 84 of 108
Test Laboratory: AGC Lab Date: Mar. 22,2017 GPRS 1900 High-Body-Back (3up) <SIM 2> DUT: Smartphone-Miracle 6.0 S; Type: Miracle 6.0 S Communication System: GPRS-3Slot; Communication System Band: PCS 1900; Duty Cycle: 1:2.7; Conv.F=5.90;
Frequency: 1909.8 MHz; Medium parameters used: f = 1900 MHz; ζ = 1.53mho/m; ε r = 52.88; ρ = 1000 kg/m³ ;
Phantom section: Flat Section Ambient temperature (℃): 21.4, Liquid temperature (℃): 20.5
SATIMO Configuration:
• Probe: SSE5; Calibrated: 12/05/2016; Serial No.: SN 14/16 EP308
• Sensor-Surface: 4mm (Mechanical Surface Detection)
• Phantom: SAM twin phantom
• Measurement SW: OpenSAR V4_02_32
Configuration/GPRS1900 High -Body-Back/Area Scan: Measurement grid: dx=8mm, dy=8mm Configuration/GPRS1900 High -Body-Back/Zoom Scan: Measurement grid: dx=8mm,dy=8mm, dz=5mm;
Area Scan sam_direct_droit2_surf8mm.txt
Zoom Scan 5x5x7,dx=8mm dy=8mm dz=5mm,Complete
Phantom Validation plane
Device Position Body Back
Band PCS 1900
Channels High
Signal TDMA (Crest factor: 2.7)
SURFACE SAR VOLUME SAR
Maximum location: X=16.00, Y=16.00
SAR Peak: 1.28 W/kg
SAR 10g (W/Kg) 0.316962
SAR 1g (W/Kg) 0.692062

Report No.: AGC09674170301FH01 Page 85 of 108
Z (mm) 0.00 4.00 9.00 14.00 19.00 24.00 29.00
SAR
(W/Kg)
1.2872 0.7691 0.3890 0.2070 0.1132 0.0624 0.0335
3D screen shot Hot spot position

Report No.: AGC09674170301FH01 Page 86 of 108
Test Laboratory: AGC Lab Date: Mar. 22,2017 WCDMA Band Ⅱ Mid-Tilt-Right <HSDPA Subtest 1>
DUT: Smartphone-Miracle 6.0 S; Type: Miracle 6.0 S
Communication System: UMTS; Communication System Band: Band Ⅱ UTRA/FDD ;Duty Cycle:1:1; Conv.F=5.74;
Frequency: 1880 MHz; Medium parameters used: f = 1900 MHz; ζ = 1.38 mho/m;ε r =40.88; ρ = 1000 kg/m³ ;
Phantom section: Right Section
Ambient temperature (℃): 21.4, Liquid temperature (℃): 20.2
SATIMO Configuration:
• Probe: SSE5; Calibrated: 12/05/2016; Serial No.: SN 14/16 EP308
• Sensor-Surface: 4mm (Mechanical Surface Detection)
• Phantom: SAM twin phantom
• Measurement SW: OpenSAR V4_02_32
Configuration/WCDMA Band Ⅱ Mid-Tilt-Right/Area Scan: Measurement grid: dx=8mm, dy=8mm
Configuration/WCDMA Band Ⅱ Mid-Tilt-Right/Zoom Scan: Measurement grid: dx=8mm,dy=8mm, dz=5mm;
Area Scan sam_direct_droit2_surf8mm.txt
ZoomScan 5x5x7,dx=8mm dy=8mm dz=5mm,Complete
Phantom Right head
Device Position Tilt
Band WCDMA band Ⅱ
Channels Middle
Signal CDMA (Crest factor: 1.0)
SURFACE SAR VOLUME SAR
Maximum location: X=6.00, Y=24.00
SAR Peak: 0.09 W/kg
SAR 10g (W/Kg) 0.025646
SAR 1g (W/Kg) 0.050507

Report No.: AGC09674170301FH01 Page 87 of 108
Z (mm) 0.00 4.00 9.00 14.00 19.00 24.00 29.00
SAR
(W/Kg)
0.0907 0.0536 0.0269 0.0145 0.0084 0.0053 0.0033
3D screen shot Hot spot position

Report No.: AGC09674170301FH01 Page 88 of 108
Test Laboratory: AGC Lab Date: Mar. 22,2017 WCDMA Band Ⅱ Mid-Body-Towards Grounds (HSDPA Subtest 1)
DUT: Smartphone-Miracle 6.0 S; Type: Miracle 6.0 S
Communication System: UMTS; Communication System Band: Band Ⅱ UTRA/FDD ;Duty Cycle:1:1; Conv.F=5.90;
Frequency: 1880 MHz; Medium parameters used: f = 1900 MHz; ζ =1.49 mho/m; ε r =53.79; ρ = 1000 kg/m³ ;
Phantom section: Flat Section
Ambient temperature (℃): 21.4, Liquid temperature (℃): 20.5
SATIMO Configuration:
• Probe: SSE5; Calibrated: 12/05/2016; Serial No.: SN 14/16 EP308
• Sensor-Surface: 4mm (Mechanical Surface Detection)
• Phantom: SAM twin phantom
• Measurement SW: OpenSAR V4_02_32
Configuration/ WCDMA band Ⅱ Mid-Body-back/Area Scan: Measurement grid: dx=8mm, dy=8mm
Configuration/ WCDMA band Ⅱ Mid-Body-back/Zoom Scan: Measurement grid: dx=8mm,dy=8mm, dz=5m;
Area Scan sam_direct_droit2_surf8mm.txt
ZoomScan 5x5x7,dx=8mm dy=8mm dz=5mm,Complete
Phantom Validation plane
Device Position Body Back
Band WCDMA band Ⅱ
Channels Middle
Signal CDMA (Crest factor: 1.0)
SURFACE SAR VOLUME SAR
Maximum location: X=16.00, Y=16.00
SAR Peak: 1.21 W/kg
SAR 10g (W/Kg) 0.319039
SAR 1g (W/Kg) 0.685246

Report No.: AGC09674170301FH01 Page 89 of 108
Z (mm) 0.00 4.00 9.00 14.00 19.00 24.00 29.00
SAR
(W/Kg)
1.2274 0.7769 0.4180 0.2274 0.1164 0.0680 0.0373
3D screen shot Hot spot position

Report No.: AGC09674170301FH01 Page 90 of 108
Test Laboratory: AGC Lab Date: Mar. 21,2017
WCDMA Band Ⅴ Mid-Tilt-Right (HSUPA Subtest 3)
DUT: Smartphone-Miracle 6.0 S; Type: Miracle 6.0 S
Communication System: UMTS; Communication System Band: BAND Ⅴ UTRA/FDD ; Duty Cycle:1: 1; Conv.F=5.72;
Frequency: 836.6 MHz; Medium parameters used: f = 835MHz; ζ = 0.89 mho/m; ε r = 41.52; ρ = 1000 kg/m³ ;
Phantom section: Right Section
Ambient temperature (℃): 21.4, Liquid temperature (℃): 21.2
SATIMO Configuration:
• Probe: SSE5; Calibrated: 12/05/2016; Serial No.: SN 14/16 EP308
• Sensor-Surface: 4mm (Mechanical Surface Detection)
• Phantom: SAM twin phantom
• Measurement SW: OpenSAR V4_02_32
Configuration/ WCDMA BandⅤMid-Tilt-Right/Area Scan: Measurement grid: dx=8mm, dy=8mm
Configuration/ WCDMA BandⅤMid-Tilt-Right/Zoom Scan: Measurement grid: dx=8mm,dy=8mm, dz=5mm;
Area Scan sam_direct_droit2_surf8mm.txt
Zoom Scan 5x5x7,dx=8mm dy=8mm dz=5mm,Complete
Phantom Right head
Device Position Tilt
Band WCDMA Band Ⅴ
Channels Middle
Signal CDMA (Crest factor: 1.0)
SURFACE SAR VOLUME SAR
Maximum location: X=9.00, Y=26.00
SAR Peak: 0.10 W/kg
SAR 10g (W/Kg) 0.041642
SAR 1g (W/Kg) 0.065868

Report No.: AGC09674170301FH01 Page 91 of 108
Z (mm) 0.00 4.00 9.00 14.00 19.00 24.00 29.00
SAR
(W/Kg)
0.0998 0.0689 0.0443 0.0305 0.0217 0.0155 0.0114
3D screen shot Hot spot position

Report No.: AGC09674170301FH01 Page 92 of 108
Test Laboratory: AGC Lab Date: Mar. 21,2017
WCDMA Band Ⅴ Low-Body-Towards Grounds (HSUPA Subtest 3)
DUT: Smartphone-Miracle 6.0 S; Type: Miracle 6.0 S
Communication System: UMTS; Communication System Band: BAND Ⅴ UTRA/FDD; Duty Cycle:1: 1; Conv.F=5.94;
Frequency: 826.4 MHz; Medium parameters used: f = 835MHz; ζ =0.94 mho/m; ε r =55.84; ρ = 1000 kg/m³ ;
Phantom section: Flat Section
Ambient temperature (℃): 21.4, Liquid temperature (℃): 21.3
SATIMO Configuration:
• Probe: SSE5; Calibrated: 12/05/2016; Serial No.: SN 14/16 EP308
• Sensor-Surface: 4mm (Mechanical Surface Detection)
• Phantom: SAM twin phantom
• Measurement SW: OpenSAR V4_02_32
Configuration/ WCDMA BandⅤLow -Body-Back/Area Scan: Measurement grid: dx=8mm, dy=8mm
Configuration/ WCDMA BandⅤLow -Body-Back/Zoom Scan: Measurement grid: dx=8mm,dy=8mm, dz=5mm;
Area Scan sam_direct_droit2_surf8mm.txt
ZoomScan 5x5x7,dx=8mm dy=8mm dz=5mm,Complete
Phantom Validation plane
Device Position Body Back
Band WCDMA Band Ⅴ
Channels Low
Signal CDMA (Crest factor: 1.0)
SURFACE SAR VOLUME SAR
Maximum location: X=15.00, Y=16.00
SAR Peak: 1.71 W/kg
SAR 10g (W/Kg) 0.561691
SAR 1g (W/Kg) 1.008059

Report No.: AGC09674170301FH01 Page 93 of 108
Z (mm) 0.00 4.00 9.00 14.00 19.00 24.00 29.00
SAR
(W/Kg)
1.7122 1.0776 0.5966 0.3504 0.2146 0.1353 0.0871
3D screen shot Hot spot position

Report No.: AGC09674170301FH01 Page 94 of 108
WIFI MODE Test Laboratory: AGC Lab Date: Mar. 24,2017 802.11b Low-Touch-Left DUT: Smartphone-Miracle 6.0 S; Type: Miracle 6.0 S Communication System: Wi-Fi; Communication System Band: 802.11b; Duty Cycle: 1:1; Conv.F=5.19;
Frequency: 2412 MHz; Medium parameters used: f = 2450 MHz; ζ =1.73 mho/m; ε r =40.89 ρ = 1000 kg/m³ ;
Phantom section: Left Section Ambient temperature (℃):22.2, Liquid temperature (℃): 21.8
SATIMO Configuration:
• Probe: SSE5; Calibrated: 12/05/2016; Serial No.: SN 14/16 EP308
• Sensor-Surface: 4mm (Mechanical Surface Detection)
• Phantom: SAM twin phantom
• Measurement SW: OpenSAR V4_02_32
Configuration/802.11b Low- Touch-Left/Area Scan: Measurement grid: dx=8mm, dy=8mm Configuration/802.11b Low- Touch-Left/Zoom Scan: Measurement grid: dx=5mm,dy=5mm, dz=5mm
Area Scan sam_direct_droit2_surf8mm.txt
ZoomScan 7x7x7,dx=5mm dy=5mm dz=5mm
Phantom Left head
Device Position Cheek
Band 2450MHz
Channels Low
Signal Crest factor: 1.0
SURFACE SAR VOLUME SAR
Maximum location: X=-16.00, Y=17.00
SAR Peak: 0.15 W/kg
SAR 10g (W/Kg) 0.039400
SAR 1g (W/Kg) 0.080257

Report No.: AGC09674170301FH01 Page 95 of 108
Z (mm) 0.00 4.00 9.00 14.00 19.00 24.00 29.00
SAR
(W/Kg)
0.1454 0.0864 0.0424 0.0206 0.0099 0.0061 0.0034
3D screen shot Hot spot position

Report No.: AGC09674170301FH01 Page 96 of 108
Test Laboratory: AGC Lab Date: Mar. 24,2017 802.11b Low-Body-Worn- Back DUT: Smartphone-Miracle 6.0 S; Type: Miracle 6.0 S Communication System: Wi-Fi; Communication System Band: 802.11b; Duty Cycle: 1:1; Conv.F=5.33;
Frequency: 2412 MHz; Medium parameters used: f = 2450 MHz; ζ =1.88 mho/m; ε r =54.85; ρ = 1000 kg/m³ ;
Phantom section: Flat Section Ambient temperature (℃):22.2, Liquid temperature (℃): 21.5
SATIMO Configuration:
• Probe: SSE5; Calibrated: 12/05/2016; Serial No.: SN 14/16 EP308
• Sensor-Surface: 4mm (Mechanical Surface Detection)
• Phantom: SAM twin phantom
• Measurement SW: OpenSAR V4_02_32
Configuration/802.11b Low- Body- Back /Area Scan: Measurement grid: dx=8mm, dy=8mm Configuration/802.11b Low- Body- Back /Zoom Scan: Measurement grid: dx=5mm,dy=5mm, dz=5mm;
Area Scan sam_direct_droit2_surf8mm.txt
ZoomScan 7x7x7,dx=5mm dy=5mm dz=5mm
Phantom Validation plane
Device Position Body Back
Band 2450MHz
Channels Low
Signal Crest factor: 1.0
SURFACE SAR VOLUME SAR
Maximum location: X=-10.00, Y=7.00
SAR Peak: 0.48 W/kg
SAR 10g (W/Kg) 0.109432
SAR 1g (W/Kg) 0.250532
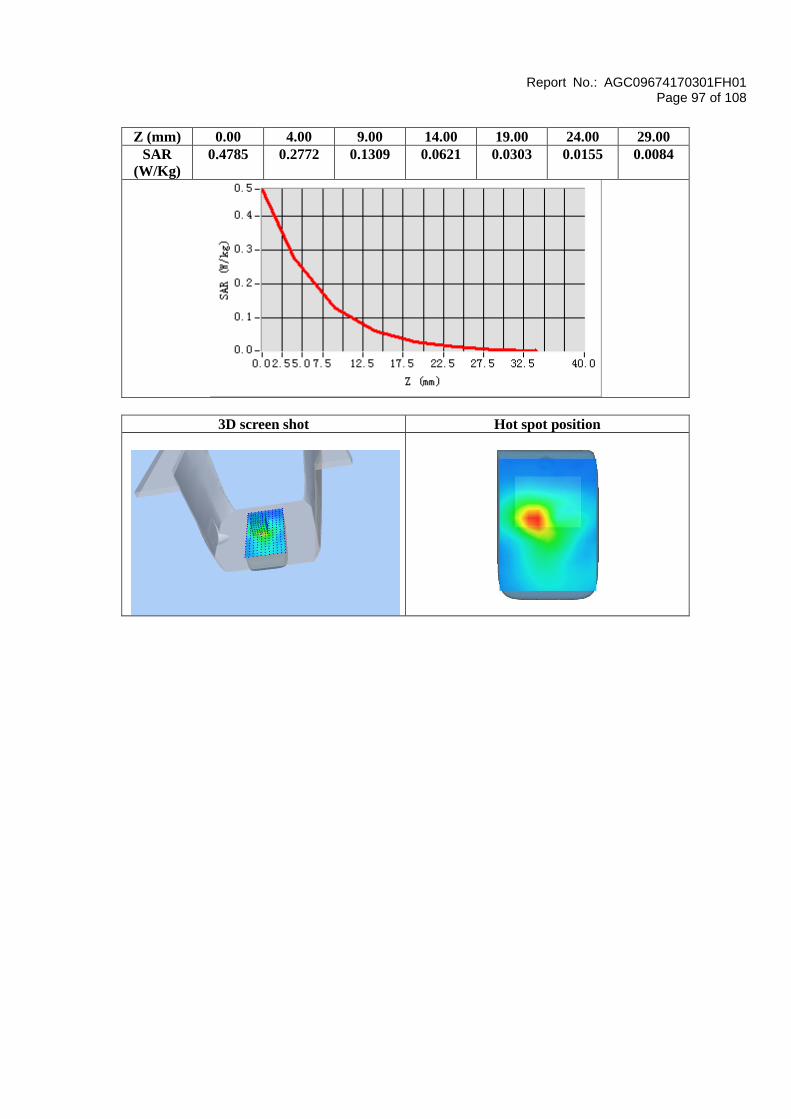
Report No.: AGC09674170301FH01 Page 97 of 108
Z (mm) 0.00 4.00 9.00 14.00 19.00 24.00 29.00
SAR
(W/Kg)
0.4785 0.2772 0.1309 0.0621 0.0303 0.0155 0.0084
3D screen shot Hot spot position

Report No.: AGC09674170301FH01 Page 98 of 108
Repeated SAR Test Laboratory: AGC Lab Date: Mar. 22,2017 GPRS 1900 High-Body-Back (3up) <SIM 1> DUT: Smartphone-Miracle 6.0 S; Type: Miracle 6.0 S Communication System: GPRS-3Slot; Communication System Band: PCS 1900; Duty Cycle: 1:2.7; Conv.F=5.90;
Frequency: 1909.8 MHz; Medium parameters used: f = 1900 MHz; ζ = 1.53mho/m; ε r = 52.88; ρ = 1000 kg/m³ ;
Phantom section: Flat Section
Ambient temperature (℃): 21.4, Liquid temperature (℃): 20.5
SATIMO Configuration:
• Probe: SSE5; Calibrated: 12/05/2016; Serial No.: SN 14/16 EP308
• Sensor-Surface: 4mm (Mechanical Surface Detection)
• Phantom: SAM twin phantom
• Measurement SW: OpenSAR V4_02_32
Configuration/GPRS1900 High -Body-Back/Area Scan: Measurement grid: dx=8mm, dy=8mm Configuration/GPRS1900 High -Body-Back/Zoom Scan: Measurement grid: dx=8mm,dy=8mm, dz=5mm;
Area Scan sam_direct_droit2_surf8mm.txt
Zoom Scan 5x5x7,dx=8mm dy=8mm dz=5mm,Complete
Phantom Validation plane
Device Position Body Back
Band PCS 1900
Channels High
Signal TDMA (Crest factor: 2.7)
SURFACE SAR VOLUME SAR
Maximum location: X=16.00, Y=16.00
SAR Peak: 1.37 W/kg
SAR 10g (W/Kg) 0.368306
SAR 1g (W/Kg) 0.777390

Report No.: AGC09674170301FH01 Page 99 of 108
Z (mm) 0.00 4.00 9.00 14.00 19.00 24.00 29.00
SAR
(W/Kg)
1.3489 0.8667 0.4770 0.2587 0.1369 0.0675 0.0387
3D screen shot Hot spot position

Report No.: AGC09674170301FH01 Page 100 of 108
Test Laboratory: AGC Lab Date: Mar. 21,2017
WCDMA Band Ⅴ Low-Body-Towards Grounds (HSUPA Subtest 3)
DUT: Smartphone-Miracle 6.0 S; Type: Miracle 6.0 S
Communication System: UMTS; Communication System Band: BAND Ⅴ UTRA/FDD; Duty Cycle:1: 1; Conv.F=5.94;
Frequency: 826.4 MHz; Medium parameters used: f = 835MHz; ζ =0.94 mho/m; ε r =55.84; ρ = 1000 kg/m³ ;
Phantom section: Flat Section
Ambient temperature (℃): 21.4, Liquid temperature (℃): 21.3
SATIMO Configuration:
• Probe: SSE5; Calibrated: 12/05/2016; Serial No.: SN 14/16 EP308
• Sensor-Surface: 4mm (Mechanical Surface Detection)
• Phantom: SAM twin phantom
• Measurement SW: OpenSAR V4_02_32
Configuration/ WCDMA BandⅤLow -Body-Back/Area Scan: Measurement grid: dx=8mm, dy=8mm
Configuration/ WCDMA BandⅤLow -Body-Back/Zoom Scan: Measurement grid: dx=8mm,dy=8mm, dz=5mm;
Area Scan sam_direct_droit2_surf8mm.txt
ZoomScan 5x5x7,dx=8mm dy=8mm dz=5mm,Complete
Phantom Validation plane
Device Position Body Back
Band WCDMA Band Ⅴ
Channels Low
Signal CDMA (Crest factor: 1.0)
SURFACE SAR VOLUME SAR
Maximum location: X=15.00, Y=16.00
SAR Peak: 1.69 W/kg
SAR 10g (W/Kg) 0.560226
SAR 1g (W/Kg) 1.006382

Report No.: AGC09674170301FH01 Page 101 of 108
Z (mm) 0.00 4.00 9.00 14.00 19.00 24.00 29.00
SAR
(W/Kg)
1.6974 1.0690 0.5921 0.3480 0.2130 0.1344 0.0866
3D screen shot Hot spot position

Report No.: AGC09674170301FH01 Page 102 of 108
APPENDIX C. TEST SETUP PHOTOGRAPHS
LEFT- CHEEK TOUCH
LEFT-TILT 15
0

Report No.: AGC09674170301FH01 Page 103 of 108
RIGHT- CHEEK TOUCH
RIGHT-TILT 15
0

Report No.: AGC09674170301FH01 Page 104 of 108
Body Back 5mm
Body Front 5mm

Report No.: AGC09674170301FH01 Page 105 of 108
Edge 1(Top) 10mm-Hotspot Mode
Edge 2(Right) 10mm-Hotspot Mode
10mm

Report No.: AGC09674170301FH01 Page 106 of 108
Edge 3(Bottom) 10mm-Hotspot Mode
Edge 4(Left) 10mm-Hotspot Mode

Report No.: AGC09674170301FH01 Page 107 of 108
DEPTH OF THE LIQUID IN THE PHANTOM—ZOOM IN
Note:The position used in the measurement were according to IEEE 1528-2013
835MHz head 835MHz body
1900MHz head 1900MHz body
2450MHz head 2450MHz body

Report No.: AGC09674170301FH01 Page 108 of 108
APPENDIX D. CALIBRATION DATA
Refer to Attached files.