sara catarina santos silva definition and implementation of … · development and integration of...
TRANSCRIPT

Escola de Engenharia
Sara Catarina Santos Silva
Definition and Implementation o f a Metadata
Application Profile of the SusCity Project
Tese de Mestrado em
Engenharia e Gestão de Sistemas de Informação
Trabalho efetuado sob a orientação da
Professora Doutora Ana Alice Baptista
Março 2017

ii
Resumo
As cidades são o centro do desenvolvimento económico e social, onde uma percentagem
significativa da população mundial reside, tendo este número tendência a aumentar num futuro
próximo. Por esta razão, a eficiência de recursos é fundamental para a sustentabilidade das
cidades e, desta necessidade, nasceu o conceito de Cidade Inteligente.
O projeto SusCity baseia-se neste conceito; É um projeto que se enquadra no âmbito do
protocolo com o MIT e foca-se no desenvolvimento e integração de novas ferramentas e serviços
para aumentar a eficiência dos recursos urbanos.
O SusCity divide-se em seis pacotes de trabalho sendo que, esta dissertação se foca na
tarefa “Publicar dados abertos da cidade” compreendida no pacote de trabalho número dois a
cargo da Universidade do Minho. Consequentemente, o objetivo desta dissertação passa pela
definição e implementação de uma framework para publicar dados abertos no âmbito deste
projeto.
Para realizar o trabalho recorrer-se-á à metodologia Me4MAP. Esta metodologia tem como
objetivo o suporte para o desenvolvimento e implementação de um MAP e tem como ponto de
partida o RUP e a framework de Singapore estabelecida pela DCMI. Encontra-se divida em quatro
fases sendo elas, definição do âmbito, construção, desenvolvimento e validação e cinco atividades,
definição dos requisitos funcionais, modelo de domínio, description set profile e guias de utilização
e sintaxe.
Até ao momento, foi desenvolvido este documento referente ao estado de arte. Após a
entrega deste documento passar-se-á à implementação da metodologia Me4MAP tendo em
consideração os dados fornecidos pelos parceiros do projeto.
Palavras-chave: Web Semântica, Cidade Inteligente, Dados Abertos, Metadados, Interoperabilidade Semântica, Perfil de Aplicação.

iii
Abstract
Cities are at the centre of economic and social development and where a significant percentage of
the world’s population lives and this number is likely to increase in the near future. Resource
efficiency is, therefore, fundamental to the sustainability of cities, and from this need, the concept
of Smart City is born.
The SusCity project was based on this idea; An MIT project that focuses on the
development and integration of new tools and services to increase the efficiency of urban resources.
This project is divided into six work packages, and this dissertation focuses on the task
“Publish city open data” in work package two. Hence, this dissertation aims at a definition and
implementation of an application profile to publish Open Data under the scope of the SusCity
project.
In this dissertation, the Me4MAP methodology will be used. This method aims to support
the development and implementation of a Metadata Application Profile (MAP) and has as starting
points the Singapore Framework and RUP. It is divided into four phases, scope definition,
construction, development and validation and five activities, functional requirements, domain
model, description set profile, usage guidelines and syntax guidelines.
Until now, a literature review was carried out. From this point on, the Me4MAP
methodology will be implemented taking into account the data provided by the project partners.
Keywords: Semantic Web, Smart City, Open Data, Metadata, Semantic Interoperability, Metadata
Application Profile

iv
Table of Contents
Chapter 1
1 Introduction .................................................................................................................................... 1
1.1 Contextualization .................................................................................................................... 1
1.2 Motivation for the Study .......................................................................................................... 3
1.3 Relevance of the Study in the Field of Information Systems ..................................................... 3
1.4 Thesis Organization ................................................................................................................ 4
2 State of the Art ............................................................................................................................... 5
2.1 Smart Cities ........................................................................................................................... 5
2.1.1 Smart Cities Initiatives .................................................................................................... 6
2.2 Open Data ............................................................................................................................. 9
2.2.1 Open Data and Smart Cities .........................................................................................14
2.2.2 Open Data Initiatives ....................................................................................................17
2.3 Linked Open Data ................................................................................................................22
2.3.1 Metadata and Metadata Schemas ................................................................................26
2.3.2 Metadata Application Profile .........................................................................................28
2.3.3 From Open Data to Linked Open Data ..........................................................................31
2.3.4 LOD and Smart Cities ..................................................................................................34
2.3.5 LOD and Smart Cities Initiatives ...................................................................................35
3 Study to be Carried Out ................................................................................................................40
3.1 Conceptualization of the problem to be studied and its underlying objectives .........................40
3.2 Methodological Approach .....................................................................................................42
3.3 Activities Plan .......................................................................................................................46
4 Final Considerations .....................................................................................................................48
5 References ...................................................................................................................................49

v
List of Tables
Table 1 - Delivery dates for the dissertation ....................................................................................... 47

vi
List of Figures
Figure 1 - SmartSantander Logical architecture and building blocks ...................................................... 7
Figure 2 - Santander Dados Abiertos Web Site ..................................................................................... 8
Figure 3 - Amsterdam Smart City Web Site ......................................................................................... 9
Figure 4 - RDS Proposal .................................................................................................................. 13
Figure 5 - Motivation for Opening Data (EUROCITIES, 2013) .............................................................. 17
Figure 6 - Open Data Platform LifeCycle ........................................................................................... 18
Figure 7 - Amsterdam Open Data Site .............................................................................................. 20
Figure 8 - Amsterdam Open Data Dataset ......................................................................................... 21
Figure 9 - London Data Store Site .................................................................................................... 22
Figure 10 - RDF Graph with two nodes ............................................................................................. 24
Figure 11 - MAP Model applied with the Singapore Framework (Nilsson et al., 2008) ........................... 30
Figure 12 - Me4MAP V0.2 phases (Malta & Baptista, 2013) ............................................................... 31
Figure 13 - 5 Star Open Data Model ................................................................................................. 31
Figure 14 - Cost and benefits of 1-star web data (Bauer & Kaltenböck, 2012) ...................................... 32
Figure 15 - Cost and benefits of 2-stars web data (Bauer & Kaltenböck, 2012) .................................... 32
Figure 16 - Cost and benefits of 3-stars web data (Bauer & Kaltenböck, 2012) ................................... 33
Figure 17 - Cost and benefits of 4-stars web data (Bauer & Kaltenböck, 2012) .................................... 33
Figure 18 - Cost and benefits of 5-stars web data (Bauer & Kaltenböck, 2012) .................................... 34
Figure 19 - Software Components architecture of the IES Cities Platform ............................................. 37
Figure 20 - IES Cities from a citizen’s perspective .............................................................................. 37
Figure 21 - IES Cities user’s manager ............................................................................................... 38
Figure 22 - IES Cities from the municipally perspective ...................................................................... 38
Figure 23 - IES Cities from a developer perspective ........................................................................... 39
Figure 24 - IES Cities from a developer perspective .................................................................... 39
Figure 25 - Star City Application ...................................................................................................... 40
Figure 26 - Me4MAP phases (Malta & Baptista, 2013) ....................................................................... 43
Figure 27 - Me2MAP V0.2 life-cycle development model (Malta & Baptista, 2013) ................................ 44
Figure 28 - Example of a Domain Model (Coyle & Baker, 2009) .......................................................... 45

vii
List of Acronyms
AGLS Australian Government Locator Service AP Application Profile CC Creative Commons CR Candidate Recommendation DCAM Dublin Core Abstract Model DCAP Dublin Core Application Profile DCMES Dublin Core Metadata Element Set DCMI Dublin Core Metadata Initiative DCTERMS DSR
Dublin Core Metadata Initiative Metadata Terms Design Science Research
DSP Description Set Profile EU European Union FCT Fundação para a Ciência e a Tecnologia FOAF Friend of a Friend vocabulary GIS HTTP
Geographic Information System HyperText Transfer Protocol
ICT Information and Communication Technologies IEFT Internet Engineering Task Force IoT Internet of Things IRI Internationalized Resource Identifier ISO International Organization for Standardization LOD MAP
Linked Open Data Metadata Application Profile
NGO Non-governmental organisation OWL Web Ontology Language PR Proposed Recommendation PRISMA PlafoRms Interoperable Cloud for SMArt-Government RDF Resource Description Framework RDFS RDS
Resource Description Framework Schema Responsible Data Science
RUP Rational Unified Process URI Uniform Resource Identifier URL SKOS
Uniform Resource Locators Simple Knowledge Organisations Systems
W3C World Wide Web Consortium WD Working Draft WP Work Package WR W3C Recommendation XML eXtensible Markup Language

1
1 Introduction
1.1 Contextualization
Cities are at the heart of economic and social development, where a significant percentage of the
world’s population resides, and this number is likely to increase in a nearby future. Resource
efficiency is, therefore, fundamental to the sustainability of cities, and from this need, the concept
of Smart City is born. A Smart City is a city that invests in human and social capital, traditional
(transport) and modern (ICT) infrastructures to enable a sustainable economic development and
ensure a high quality of life with the intelligent management of natural resources (Caragliu, Del Bo,
& Nijkamp, 2011).
The SusCity project was born from this concept of Smart City; An MIT Portugal project,
funded by FCT, Ministry of Education and Science of Portugal, EDP, ADENE, R&D Nester, Novabase
and iTds and created in partnership with INESCPorto, R&D Nester, IST-ID, iTds, MIT, lnEG, Adene,
Coimbra University, EDP, Minho’s University, Novabase, IBM, Faculty of Sciences of the University
of Lisbon, idMEC and Lisbon City Council. SusCity is a project that focuses on the development
and integration of new tools and services to increase the efficiency of urban resources. The SusCity
is distributed into six Work Packages (WP) and this dissertation is developed under the scope of
WP2 “Information Services and Data Processing Platform” task six “Publish City Open Data”, and
the goal is to research and develop mechanisms for selecting and making the data available under
a Linked Open Data (LOD) perspective.
Organisations that provide public services are the ones that contain data about cities. For this
project, it is crucial that partners such as EDP and ADENE release their data to the public as Open
Data. The Open Knowledge International1 defines Open Data as data that is freely available for
anyone to use and republish as they wish, without any copyright restrictions, patents or any other
mechanism of control.
Tim Berners-Lee (2005), the father of the web and LOD, refers to the Semantic Web as a Web
of machine-readable information whose meaning is well-defined by standards. These standards are
used to facilitate an exchange of data and metadata by promoting consistency in the Web. A
Standard or a Recommendation is a specification or set of guidelines with a high level of maturity,
1 https://okfn.org/

2
and that has passed an extensive process of evaluation and is ready to be adopted by the
community.
These Standards and Recommendations are developed by rename organisations, in the field
of open data and LOD, like the DCMI and W3C and with the community that is going to adopt
them. In LOD it is essential to obey to these Standards because they aim Semantic Interoperability.
Semantic Interoperability is defined to be “the ability of computer systems to exchange data with
unambiguous, shared meaning. Semantic Interoperability is a requirement to enable computable
machine logic, inferencing, knowledge discovery, and data federation between information
systems”2.
Metadata and Metadata Schemas play a significant role in the development of the Semantic
Web. The Semantic Web links data together, and metadata can provide the connections as well
as the description of the content. Metadata is known to be anything that describes anything or
“data about data” (Baca, 2016) and, a metadata schema is a set of metadata elements defined
for a particular purpose in an individual context (Coyle & Baker, 2009). Although metadata is an
integral part of the Semantic Web, metadata on its own is far from sufficient. Again, we need
standards to encode and represent knowledge so tasks can be performed in an efficient and
comprehensible manner. A variety of enabling technologies have been developed over the last
few years that are critical for metadata encoding and manipulation such as XML and XML
Schema, RDF and RDFS and OWL (Greenberg, Sutton, & Campbell, 2003).
The DCMI defines an Application Profile as a set of metadata elements, policies, and
guidelines defined for a particular application. These elements can be from one or more elements
sets allowing us to use several element sets including ones created by us. With this, all the
functional requirements of an application can be covered. It is considered a best practice that
everyone that creates an Application Profile, should document the policies and best practices
appropriate to the application.
These are some of the key aspects that constitute the Semantic Web. In the following sections
of this document, these are going to be cover in more detail.
2 https://www.ncoic.org/home

3
1.2 Motivation for the Study This study aims to create an Application Profile for the SusCity data and to publish the data under
a LOD perspective. This data is about energy and energy efficiency in buildings. A research work
was carried out, prior to this dissertation, to investigate if Application Profiles, Properties and
Vocabularies regarding energy and energy efficiency in buildings existed. The conclusion of this
study was that such resources were almost non-existing. Hence, the opportunity of this work is to
create and publish them on the Web for everyone’s use. With this, the aim is to contribute to the
LOD community and to promote Semantic Interoperability.
1.3 Relevance of the Study in the Field of Information Systems
Information Systems have become the backbone for most organisations. In almost every sector –
education, finance, government, healthcare, manufacturing, and business large or small –
information systems play a prominent role (van der Aalst & Stahl, 2011).
“Information Systems are combinations of hardware, software, and telecommunications
networks that people build and use to collect, create, and distribute useful data, typically in
organisational settings” (Jessup & Valacich, 2008). In practice, the achievement of cooperation
between these different components depends on the effectiveness of the interoperation between
participating systems. The interoperation between participating systems is where it can be best
shown the relevance of the Semantic Web in the field of Information Systems. The Semantic Web
relies on the effectiveness of interoperation between systems; it aims interoperability at a global
level where data can flow without borders.
Most of the Web’s content is intended for humans to read, not for computer programs to
manipulate meaningfully. They do not have reliable ways to process the semantic values of things.
The Semantic Theory, in which the Semantic Web relies on, provides an account of “meaning” in
which the logical connection of terms establishes interoperability between systems (Shadbolt,
Berners-Lee, & Hall, 2006). This interoperability comes from the fact that, every system uses the
same term to define the same thing.
The scientific impact of this dissertation is the definition of an Application Profile (AP) and
possibly metadata schemas, controlled vocabularies and properties for open data concerning
energy and energy efficiency of buildings.

4
The technical contribution is gained through the publishing and implementation of the
developed Application Profile, Properties and Vocabularies in a LOD platform.
1.4 Thesis Organization
This thesis proposal is organised into four chapters. Chapter two introduces a reflection of concepts
such as Smart City, Open Data and Linked Open Data. For each concept, is presented some
initiatives related to them. Chapter three exposes the characterization of the study. In here the
project’s objectives, the methodological approach and the activities plan are portrayed. At the end
of this documents are the final considerations.
5
2 State of the Art
2.1 Smart Cities
Cities are the centre of economic and social development. Where a large percentage of the world’s
population lives, and this number only tends to increase in a nearby future. Due to vast and complex
congregations of people, resource efficiency is fundamental to the sustainability of the city, and
from this need arises the concept of “Smart City”. This concept is used all over the world with
different nomenclatures, context, and meanings resulting in its inconsistent usage (Chourabi et al.,
2012). Cities present a set of characteristics very different from one another's, mainly because of
its historical evolution, present aspects or future provisions. The development of the concept of a
“Smart City” rises from a complex association between technology, society, economy,
administration and politics. Because of this, the expansion of this concept is going to diverge from
city to city aiming their specific goals, visions, and policies (Ramalho, 2015).
According to Ramalho (2015), there is clearly three broadly visions from which a “Smart
City” can be viewed. He defends that the development of a “Smart City” should be approached
from a perspective of administration, or from a societal and urban planning appulse or even from
the development of information and communication technologies (ICT). Despite this, a “Smart City”
could mitigate the problems caused by the urban population growth and rapid urbanisation
(Chourabi et al., 2012). Most of these problems can be related to traffic jams, environment
pollution, and natural resource limits (Pan et al., 2013). The early identification of problems related
to population growth would also allow to monitor, analyse and plan the city to improve the
efficiency, equity and quality of life of its citizens in real time (Batty et al., 2012).
For much of the 20th century, the idea that a city could be smart was something that came
out of a science fiction movie. Currently, this is no longer an idea since the massive proliferation
of intelligent computable devices anticipated that a city could indeed become smart with the help
of ICT infrastructure. In this regard, Betty et al (2012) labels a Smart City as a city in which ICT
merges with traditional infrastructures. This ICT perspective of a Smart City is the one that is going
to be pursued in this dissertation because this is the one that relates the most with the work that
is going to be developed. From this technological point of view, smartness means that we want our
cities to be understandable, to have the capability of learning and to be self-aware so, the analysis
and mining of sensed data from dynamic cities are a necessary step towards making a city smart
(Pan et al., 2013).

6
The first step to publish a City Open Data is to collect its data. The favoured way is to
publish raw data. Tim Berners-Lee in a 2009 TED talk3 advocated the release of data as raw data
(“Raw data now!”). Raw data is unadulterated data that is collected from the source. In some
cases, the release of raw data may not be possible because of privacy issues. Nevertheless, this
problem can be overcome by anonymizing the data. The full potential of open data relies on LOD
that makes possible to discover relationships between different data. The most common formats
of LOD are RDFa, JSON-LD, Turtle and N-Triples and RDF/XML. These are the formats that are
going to be used to publish the SusCity data.
In the following section, some smart cities initiatives are presented to illustrate the full
potential of this concept.
2.1.1 Smart Cities Initiatives
The use of programs to support the development of smart cities with the use of ICT aim at
promoting economic competitiveness, better quality of life to its citizens and to promote
environmental sustainability (Nam & Pardo, 2011).
In 2012, there were approximately 143 ongoing or complete smart cities projects around the
world. Among these initiatives, about 35 projects in North America and 47 projects in Europe were
leading efforts to implement smart technologies to address and resolve some more immediate
urban problems (Alemu, Stevens, & Ross, 2012).
In the next section, some smart cities initiatives are presented.
2.1.1.1 SmartSantander
The SmartStantander project is one of the projects of the Future Internet Research and
Experimentation initiative of the European Commission and represents a unique, in a world city-
scale, experimental research facility (Sanchez et al., 2014). This project envisions the deployment
of 20,000 sensors in Belgrade, Guilford, Lübeck, and Santander. SmartStantander’s project aims
to produce the following key target outcomes: 1) An architectural reference model for open real-
world Internet of Things experimentation facilities; 2) A scalable, heterogeneous and trustable large-
3 http://www.ted.com/talks/tim_berners_lee_on_the_next_web/

7
scale real-world experimental facility; 3) A representative set of implemented use cases for the
experimental facility; and 4) A large of set of Future Internet experiments and results (Sanchez et
al., 2014).
Figure 1 - SmartSantander Logical architecture and building blocks
The city of Santander has an Open Data platform named Santander Datos Abiertos4 where
they publish the city’s data. The purpose of this platform is to increase transparency between the
city of Santander and its citizens, to promote the reuse of public information and to be a source of
innovation.
In Santander Open Data Platform there are about 88 datasets available about traffic,
transportation, science, technology, environment, culture and infrastructures. The municipality of
Santander advocates for the data to be published in different formats such as XML, HTML, JSON,
N3, RDF, CSV, TURTLE, JSON-LD, ATOM, RSS, SHP, WKT, KMZ and XLS. At the time of the search,
December 2016, 82 datasets in XML were found, 83 in HTML, 82 in JSON, 82 in N3, 83 in RDF,
84 in CSV, 82 in TURTLE, 82 in JSON-LD, 82 ATOM and 15 in RSS. These numbers show that the
website cares deeply about LOD since the majority of their datasets are in LOD formats.
4 http://datos.santander.es/

8
Figure 2 - Santander Dados Abiertos Web Site
2.1.1.2 Amsterdam SmartCity
Amsterdam Smart City5 is a platform of the Amsterdam Metropolitan Area that appeals the
contribution of business, residents, the municipality and knowledge institutions to solve urban
issues.
This initiative has a project regarding Open Data that involved a development of an Open
Data Platform. data.amsterdam.nl aims at strengthening the economy of the Amsterdam
metropolitan area by opening public data sources to citizens and businesses. With this, citizens,
businesses, research institutions and other parties, are enabled to develop services that wouldn’t
be possible before.
This project was initiated by the Amsterdam Economic Board, Waag Society, Vrije University,
Universiteit van Amsterdam and 2CoolMonkeys. The project was partly financed by the European
Regional Development Fund of the European Union. Since 2015, Gemeente Amsterdam (OIS) is
managing data.amsterdam.nl.
This platform focuses on six different themes such as Circular City, Citizens & Living, Energy
Water & Waste, Governance & Education, Infrastructure & Technology and Mobility.
On the website, at the date of the search, December 2016, is possible to see that there are
about 306 datasets from which 35 were added in the last 12 months from 41 different publishers.
The data is available in the following formats, XLS, HTML, JSON, CSV, XML, PDF and, WMS.
5 https://amsterdamsmartcity.com

9
Figure 3 - Amsterdam Smart City Web Site
2.1.1.3 Smart London
London is the biggest city in Europe, but size comes with a lot of urban problems as well, such as
transport, energy, and healthcare related. The Smart London approach is about improving the lives
of Londoners with the use of, but not limited to Open Data & transparency.
Regarding Open Data & Transparency, the London DataStore6 was created to make public
data open and accessible to citizens. From this data, numerous apps were developed by the
community that helped the city of London to function better.
In London DataStore the topics of the available data are very broad and go from health,
transports, business, sports, culture and the environment. There are about 75 publishers that
release open data to citizens.
2.2 Open Data
“Information is power. But, like all power, there are those who want to keep it for themselves.”
Aaron Swartz
Human rights are described as the fundamental rights that people acquire, just by the fact of being
human. In the 1948 United Nations Universal Declaration of Human Rights7 it is settled that these
rights include cultural, economic, and political rights, such as the right to life, liberty, education,
6 https://data.london.gov.uk/ 7http://www.un.org/en/universal-declaration-human-rights/

10
and equality before the law, the right of association, belief, free speech, religion, movements, and
information.
Amid Information rights is the right to create and communicate information (e.g., freedom
of expression, freedom of associations), to control others’ access to information (e.g., privacy and
intellectual property), and rights to access information (e.g., free of thought, the right to read)
(Mathiesen, 2008). Open data targets the last one, the right to access information.
John Wilbanks, Vice President of Science at Creative Commons once said “Numerous
scientists have pointed out the irony that right at the historical moment when we have the
technologies to permit worldwide availability and distributed process of scientific data, broadening
collaboration and accelerating the pace and depth of discovery ... we are busy locking up that data
and preventing the use of correspondingly advanced technologies on knowledge.” The digital world
is the only place where something can be shared and those who share it do not lose anything, they
still continue with the exact same thing that they had before doing it. Imagine the follow, in the real
world if I had 5 candies and if I shared 3 candies with my friends I would only have 2 candies left.
In the digital world, I could share as many candies as I would like to and I would have the exact
amount of candies that I had before sharing. Why not take advantage of this, especially regarding
scientific data, where there is so much underlying knowledge waiting to be discovered. At this
moment we have the technology, the only thing missing is people's compliance. Currently, one of
the leading organisations working with this movement of opening scientific data is the Open
Knowledge International.
The Open Knowledge International is a community-based organisation that promotes open
knowledge, which encompasses Open Data, free culture, the public domain, and other areas of
the knowledge commons. Founded in 2004, the Open Knowledge International has grown into an
international network of communities that develop tools, applications, and guidelines enabling the
opening up of data, and subsequently the discovery and use of that data. Its working groups are in
fields as broad as government, science, transport, education, open access, economics, personal
data and privacy.
Their call is that “Open knowledge can empower everyone, enabling people to work
together to tackle local and global challenges, understand our world, expose inefficiency and
challenge inequality and hold governments and companies to account”8. In today’s world
information is power and is a key to knowledge and everything around us. With this, they want to
8 https://okfn.org/about/ (Access 22/02/2017)

11
promote everyone’s access to information and the ability to use it. They envision “a world where
knowledge creates power to the many and not a few”9.
The Open Knowledge International acknowledges “Open Data as data that can be freely
used, re-used and redistributed by anyone – subject only, at most, to the requirement to attribute
and share alike”. They defend that everyone should be able to make informed decisions about
many subjects, such as the place we live, what we buy or who gets our vote. The ultimate intent is
to increase transparency between citizens and data holders with the use of Open Data.
One crucial aspect for Open Data is the matter that everyone can use it as it wishes, even
to create commercial value. To guarantee this premise is imperative to license the data to assure
data users that they will not suffer any repercussions from using the data. The Open Data
Commons10, an organisation that develops legal tools for Open Data and is part of the Open
Knowledge Foundation Network, presents three different types of licences for Open Data. 1) Public
Domain Dedication and Licence (PDDL) this permit places the data(base) in the public domain that
is, the author ultimately gives up his rights respecting the data(base). 2) Attribution Licence (ODC-
By) with this licence the user is free to share, create and adapt as he wishes as long as he attributes
any public use of the database, or works produced from the database, in the specified manner in
the licence. 3) Open Database Licence (ODC-ODbL), the data user, is also free to share, create
and adapt as long as he attribute(s) any public use of the database, or works produced from the
database, in the manner specified in the licence. Also, if the user publicly uses any adapted version
of the database, or work produced from an adapted database, he must also release that adapted
database under the same licence, and finally he must keep the data(base) open.
Like the Open Data Commons, the Creative commons (CC)11 also provides licences to Open
Data. Creative Commons (CC) licences are the most used and recognised standard licences for
providing access to data and other resources. These licences permit the free of charge copying,
reuse, distribution and, in some cases, the modification of the original creator’s creative work,
without having to obtain permission every single time from the rights holder. Similarly to Open Data
Commons these licences also have various derivations regarding the different type of uses that one
can make.
Every day, extraordinary amounts of digital information are created about nearly every
aspect of our lives. Many believe that locked within all that data is the key to knowledge about how
9 https://okfn.org/ (Access 22/02/2017) 10 https://opendatacommons.org/ 11 https://creativecommons.org/

12
to cure diseases, create business value, and govern our world more effectively. The idea with Open
Data is to make data available to the public that concerns citizens and enables everyone to use it
without any charge. With this opening, we locate ourselves in a state of collective intelligence where
everyone can see what we are doing and can even contribute with feedback. The fundamental idea
is that, under the right circumstances, groups can generate better alternatives and make better
decisions than even the smartest people can do on their own.
Open Data should be made available in open, non-proprietary and easily processable,
machine readable formats that enable the reuse and redistribution of data. An open and non-
proprietary format is one where the specifications for the software are available to anyone, free of
charge so that anyone can use the specifications in their software without any limitations on re-use
imposed by intellectual property rights. Besides this, there is a set of principle that must be taken
into account when releasing or using data. The FORCE1112 is a community of scholars, librarians,
archivists, publishers and research funders that work together to facilitate the change toward
knowledge creation and sharing. This community released the FAIR data principles13 that are a set
of guiding principles that aims to make the data Findable, Accessible, Interoperable, and Re-usable
to do this, semantic web technologies such as RDF and IRIs are used. Another initiative to use and
share data in a responsible way was conducted by leading Dutch research groups from multiple
disciplines that joined forces and created the Responsible Data Science14 (RDS) consortium, where
they state that the data should be confidential and accurate. The results derived from the data
should be fair and transparent. (See figure 4)
12 https://www.force11.org/ 13 https://www.force11.org/group/fairgroup/fairprinciples 14 http://www.responsibledatascience.org/

13
Figure 4 - RDS Proposal
While the opening of data is expected to create benefits such as 1) political and social, 2)
economic, and 3) operational and technical benefits (Janssen, Charalabidis, & Zuiderwijk, 2012).
It is also projected to produce benefits like stimulating innovation and therefore promoting
economic growth. Increase the transparency between the publisher and the consumer of data
because the user itself can verify whether the conclusions drawn from the data are correct and
justified. It can also strengthen accountability, build trust, and improve citizen satisfaction. These
benefits increase when the data is about what governments are doing, and this is increasingly
recognised as an essential precondition to the meaningful exercise of democratic accountability
and deliberation (Janssen et al., 2012). To account democratic responsibilities and to improve the
citizen's trust is why government data is one of the more requested to be open.
While the opening of data can potentially provide numerous benefits, it can also entail
some barriers. The nature of these barriers can be at an institutional level, or about the task
complexity of handling the data, the use of open data and participation in the open data process,
legislation, information quality, and at the technical level (Janssen et al., 2012). The most
common barriers are related to either data providers, that do not wish to publicise data, or data
users, that don’t have the ability to use the data a straightforward manner. With this it rises
another problem, such as Gurstein M (2011) said, even though the notion of Open Data alleges
that everyone can benefit from it, this can actual not be the reality. In Gurstein opinion, only a
few number of “lucky” people with the resources and technical expertise can fully benefit from
it. He mentions that the majority of people would fall short in this concept because of some
factors such as Internet access, or because people do not understand the language in which the

14
data is presented, or lack the technical and professional requirements for interpreting and making
use of the data.
On this subject, one could agree with the fact that Gurstein M. said that because of some
significant events such as internet access or even lack of technical expertise, that Open Data may
not reach every citizen of the world. Nevertheless, this should not dismiss the social impact that
open data can bring to society. The fact is that many movements for example such as the creation
of the World Wide Web would also fall short with reaching every people in the world when it first
appeared. Only with its development and with people compliance it was possible for the Web to
have an enormous influence in the world and people’s lives and, the same thing may be expected
with Open Data. Tim Berners-Lee, the inventor of the Web, perfectly describes this idea, he said
“Tough I was privileged to lead the effort that gave rise to the Web in the mid-1990s, it has long
passed the point of being something designed by a single person or even a single organisation. It
has become a public resource for many individuals, communities, companies, and governments
depend on. And from its beginning, it is a medium that has been created and sustained by the
cooperative efforts of people all over the world”. The conclusion to this is that yes, maybe only a
few number of "lucky" people can fully work with the concept of open data. However, for a greater
good of the society, these people need to work together in a state of collective intelligence and
collaboration for the world to benefit from it. The data itself may present some barriers, but
everything in the world does, and that shouldn't dismiss the impact that open data can have in
every citizen of the world. While only this lucky people can create something with open data,
everyone can use it and benefit from it.
2.2.1 Open Data and Smart Cities
From the previous section, we known that Open Data is data that anyone can access, use and
share. It can help us all to better understand and interact with our cities, whether it is information
on local housing, real-time train time from rail companies, or finding supermarket locations from
retailers.
The Open Data Institute15, one of the leading initiatives regarding Open Data, claims that a
smart city is an open city and keeping infrastructure and markets open is the only scalable way to
ensure equitable and secure growth in our cities. This opening means that we need data to take
15 http://theodi.org/

15
full advantage of what our city offers and to improve its citizen’s quality of life while fostering
innovation and therefore promoting economic growth.
Bettine Tratz-Ryan, research vice president at Gartner, said that for citizens “Developing
‘smartness’ in their eyes means developing contextual applications for them”. A contextual
application is an application that will augment the ability to perceive and act at the moment based
on where we are, who we are with and our past experiences. A perfect example of a contextual
application is Google Now. Google Now is an intelligent personal assistant developed by Google
that answers user’s questions, makes recommendations, performs actions, and delivers user’s
information that it predicts (based on their search habits).
In recent years, due to citizens increasingly demand access to meaningful data, cities are
responding by building platforms that improve the municipality service and urban quality of life with
the promotion of Open Data. These data platforms should be as accessible as possible and meet
the needs of coders, who have the technical expertise and can use the platform to retrieve data;
data owners, who want the identity of the organisation to be reflective in the portal; and the ‘general’
audience, who can look for information about data and develop applications. With this data, citizens
can take the initiative, “do it for themselves”, innovate and co-create. Indeed there is a concept
named “citizen science” that is known to be a partnership between volunteers and scientists to
answser real-world questions. This concept emerged in 1995 and (Irwin, 1995) reclaimed two
dimensions of the relationship between science and citizens: 1) that science should be responsive
to citizens’ concerns and needs; and 2) that citizens themselves can produce reliable scientific
knowledge. Actually, collaborations between scientists and volunteers have the potential to broaden
the scope of research and enhance the ability to collect scientific data (Cohn, 2008). This means
that citizens themselves can help to produce open data or create something through it. About this
ability of citizens to collect data, there is another concept known as “Humans as sensors” where
individuals can make observations about the physical world around them (Wang et al., 2014). With
this in mind, sites such as Wikimapia16 and OpenStreetMap17 are empowering citizens to create a
global patchwork of geographic information (Goodchild, 2007), to create a world map done by
citizens. This increase in civic participation promotes a wave of Open Data Innovation which can
lead the city one step closer to become a "Smart City".
16 http://wikimapia.org 17 www.openstreetmap.org

16
Before publishing the data on to this Open Data Platforms some key steps must be taken to make
full use of it. The EuroCities Handbook suggest that the first step that must be taken by cities who
want to release their data, is to decide what data is going to be open. It is a good idea that cities
focus on data about issues of high local relevance that have the greatest potential to raise interest
amoung its citizens. Then, they need political support, about open data policies and the
engagement of all the city administration organisation in developing approaches to address
disclosure and access to data. Working with stakeholders is also of high relevance because, in
most cases, the developer of services will not be the public organisation itself, but companies,
interest groups, non-governmental organisations (NGOs), individual citizens, and students. The city
should support stakeholders to promote the data and bring the right people together through, for
example, local hackathons and data demonstration days. The city should also promote data literacy
amongst citizens to overcome scepticism related to this being a relatively new concept. The city
must also overcome privacy issues of the data by aggregating the data to the right level and seek
legal support from open data initiatives. Finally, the last step is all about data quality. There can be
issues concerning the quality of data but, rather than seeing this as a barrier, the public’s
organisations can use it as an opportunity to receive feedback and improve its quality.
To reveal the benefits and motivation of a city to open its data the working group of
EUROCITIES in collaboration with the EU Open Cities project, conducted a survey, in 2011, where
thirteen cities responded. This study found that the primary motivation for open data is the goal of
achieving transparency in governmental and administrative processes (100%). Likewise, of great
importance for cities is the subject of ‘innovation’ (92%). The reuse of the datasets (76%), efficiency
gains (76%) as the potential of creating economic value (69%) was also motivation for open data in
cities. Only about half of the cities (53%) viewed ‘citizen participation’ and ‘crowdsourcing ideas’
as a stimulus for open data. (See figure 5).

17
Figure 5 - Motivation for Opening Data (EUROCITIES, 2013)
While these Open Data Platforms may have many benefits, it also encounters barriers to its use
and adoption. The top barrier of these platforms is its perceived poor quality of data available on
the platforms. This poor quality of Open data includes poor metadata, failure to use the right format
for different audiences, and difficulty in locating data of interest.
2.2.2 Open Data Initiatives
With transparency at aim, cities are adopting the concept of Open Data to increase the trust of its
citizens. In the following section, some initiatives regarding Open Data and smart cities are
presented.
2.2.2.1 Open Cities – Open Data Platform18 19
Open Cities is a project co-founded by the European Union that enables cities throughout Europe to publish their data as Open Data. This project promotes the creation of a civic web and mobile applications, having in mind the improvement of quality in services, lower costs and improved transparency between the city and its citizens.
Developed by Fraunhofer, the Open Cities Open Data Platform is an open source platform that can be easily customised to match a public or private organisation’s requirements.
18 https://github.com/fraunhoferfokus/opendata-platform 19 http://open-data.fokus.fraunhofer.de/en/platform/

18
These platforms support the entire Open Data lifecycle process, which includes identifying, publishing, discovering, enriching, and consuming data.
The standard configuration of the platform uses CKAN (Comprehensive Knowledge Archive Network) backend for storing the metadata. CKAN provides numerous features including customizable metadata schemas and Liferay based frontend it also has a repository for linked data based on Virtuoso20.
Unlike other platforms (e.g, Socrata21), this platform is free and it is available as open source software under the AGPL22 (Affero General Public License) terms. This license states the Open Data Platform as free software, that can be redistributed and modified.
Figure 6 - Open Data Platform LifeCycle
2.2.2.2 Open Data Europe Portal
The European Union Open Data Portal23 was launched in December of 2012 and is a single point
of access to a wide range of data held by EU institutions, agencies and other bodies. This portal
allows to search, explore, link, download and reuse the available data to commercial and non-
commercial purposes, through a catalogue of common metadata. Because of this catalogue, users
can access data stored in EU institutions, agencies and other body’s websites. This portal also
uses semantic technologies to allow to search the metadata catalogue via an interactive search
engine (Data tab) and through SPARQL queries (Linked data tab).
20 https://virtuoso.openlinksw.com/ 21 https://socrata.com/ 22 https://www.gnu.org/licenses/agpl-3.0.html 23 open-data.europa.eu

19
Ordinary users can engage with this portal by suggesting which data they would like to see
available, give feedback on the quality of the data obtained and share information with other users
about how they used the data.
The portal is available in 24 EU official languages but, most metadata is available in a
limited number of languages (English, French and German).
The reuse policy of this portal is implemented by the Decision of 12 of December 2011 –
Reuse of Commission documents24. In this Decision, reuse is defined as “the use of documents by
persons or legal entities of documents, for commercial or non-commercial purposes other than the
initial purpose for which the documents were produced”. Conditions for the reuse of documents
can be applied. Those conditions, which shall not restrict the reuse, include the following: (i) the
obligation for the reuser to acknowledge the source of the documents; (ii) the obligation not to
distort the original meaning or message of the documents; (iii) the non-liability of the Commission
for any consequence stemming from the reuse. Any other conditions can be imposed with an open
licence or a disclaimer setting out the conditions.
When the site was visited on the 4th January of 2017, 64 publishers were EU institutions,
bodies or departments (e.g., Directorate – General for Communication, European Parliament,
Eurostat, publications officer, European Central Bank, and others). There was a total of 9255
datasets available to use.
The data is released in many formats, and each dataset can be released in multiple formats.
The most commonly use form to release data is ZIP (32%). ZIP is a property format, which means
that it needs a particular software to be able to use its data. The use of proprietary formats goes
against of the commonly accepted formats for open data which requires them to be machine
readable and non-proprietary. The second, third and fourth, most used formats, HTML, text, XML
respectively correspond to 60% of the formats in which the datasets are released. These formats
are machine-readable and non-proprietary.
24 http://eur-lex.europa.eu/LexUriServ/LexUriServ.do?uri=OJ:L:2011:330:0039:0042:EN:PDF

20
2.2.2.3 Amsterdam Open Data25
The city of Amsterdam has an Open Data portal that currently uses DataPress. DataPress is an
open source company that creates websites for hosting Open Data in the cloud. It uses WordPress
and CKAN, an open-source data portal platform. The Amsterdam Open Data portal aims at
strengthening the economy of Amsterdam by unlocking available (public) data sources to citizens
and businesses. With this data citizens and businesses can develop services that would not be
possible before. With the Amsterdam Open Data portal they wish to get everyone involved in data
publishing, so it was created an interface that made it easy to publish and view data.
Some of the main benefits appointed by the project owner, Jasper Soetendal26 are: (i)
Transparency, in his view, in a well-functioning democratic society citizens need to know what their
government is doing. They must be able to freely access government data; (ii) Releasing social and
commercial value, by opening up data, this portal can help drive the creation of innovative business
and services that can deliver social and commercial value; (iii) Participatory Governance, with open
data citizens, are able to contribute in the process of governance; and (iv) Efficiency, Opening up
data to the public, may lead to internal efficiency as well. Since everybody can access the data, it
means that the data is available internally as well.
Figure 7 - Amsterdam Open Data Site
25 data.amsterdam.nl 26 https://amsterdamsmartcity.com/projects/dataamsterdamnl
21
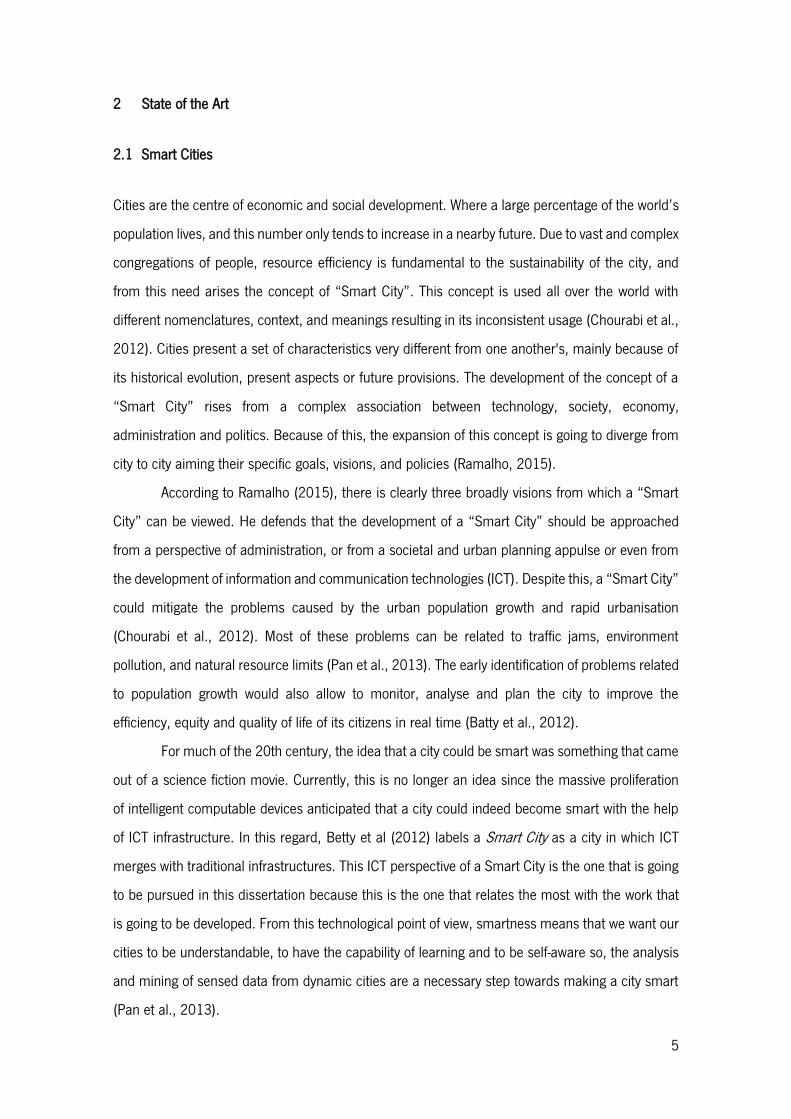
The site was visited on the 3rd of January of 2017, the first thing that could be noticed was the
incompressible language (Dutch) in what the site was presented. When looking for a language
setting, it could not be found.
The same thing happened with the language in what the data was presented. To confirm
this, a dataset called “Activiteiten” was downloaded and opened (See fig. 6)
Figure 8 - Amsterdam Open Data Dataset
As it can be seeing through the image all attributes, except for their names and an attribute called
TitleEN, are in Dutch. Language is one of the most common barriers in Open Data. If the data is
in some language that only a significantly low number of people understand, it may never reach its
full potential. They can also argue that this data is for the use of the City’s citizens as it only
concerns them.
The data that this portal offers is in CSV, DIV, JSON, KML, PDF, txt; WFS, WMS, XLS and XML.
2.2.2.4 London Data Store27
Over 600 datasets detailing life in London have been put up online as Open Data enabling the free
reuse by anyone who wishes it. The topics of the datasets are very broad and include information
about, for example, planning decisions, crime rates, abandoned vehicles, house prices, road
accidents and many others. The data available in this data store is published in XLS, CSV, PDF,
XML, SHP, TSV, IMG and some other formats.
27 https://data.london.gov.uk/

22
Figure 9 - London Data Store Site
At the time the site was visited, on the 3rd of January of 2017, there were 689 datasets that seem
to be regularly updated. As we can see from the image, the latest updated was made 3 hours prior
to this visit in a 2014 dataset about Greenhouse gas inventory. This regular update in datasets
goes accordingly to the Open Data Principle of the Open Government Data28 that data should be
timely, that is, the value of the data must be preserved and that it should be made available
(updated) as quickly as necessary. Despite this, the formats in which the data is released do not
meet the requirements of interoperability and non-proprietary. As we can see through the image
506 datasets, which is more than half of the available datasets, were released in an XLS format.
This format is not a non-proprietary since it can only be open using Microsoft Excel. Of the 689
datasets, 313 that correspond to 45,42% of the datasets, were released in a non-proprietary format.
2.3 Linked Open Data
The World Wide Web has radically changed our lives and the way we share knowledge by lowering
the barrier of publishing and accessing documents as part of a global information space (Bizer,
Heath, & Berners-Lee, 2011). The notion of a Sematic Web was presented by Berners-Lee et al.,
2001. They stated that the Semantic Web is not a separate Web but an extension of the current
28 https://opengovdata.org/

23
one, in which information is given well-defined meaning, better-enabling computers and people to
work in cooperation. In recent years, we have been seeing a revolution of the Web from a “Web of
documents” into a “Web of data”. This change, as well as the availability of large collections of
sensor generated data (“Internet of Things”), and others types of data is leading to a new
generation of Web applications (Ferraram, Nikolov, & Scharffe, 2013). Because of this, the linking
task between different data is more crucial than ever. From this need, the concept of Linked Open
Data is presented as using the Web to create typed links between data from different sources.
Linked Open Data refers to data published on the Web in such a way it is machine-readable, its
meaning is explicitly defined, it is linked to other external data sets, and can, in turn, be associated
with/from external datasets (Bizer et al., 2011). The linking of data is the main point of the
Semantic Web because with this we can derive information and meaning from data.
Most of the Web’s content is designed for humans to read, not for computer programs to
manipulate meaningfully. Computers do not have reliable ways to process the semantic value of
things. The Semantic theory, in which the Semantic Web relies on, provides an account of
“meaning” in which the logical connection of terms establishes interoperability between systems
(Shadbolt et al., 2006). This interoperability comes from the fact that, every system uses the same
term to define the same thing and, the meaning of each term can be retrieved by the relation of
that term with other terms.
Until now, we have seen that for the Semantic Web to function we have to be able to link
different sources of data to gather its semantic value. However, it is also needed for computers to
have access to structured collections of information and sets of inference rules (Berners-Lee et al.,
2001). Computers can use this to automate reasoning and to create new sets of rules from the
data that is available to them.
Linked Open Data relies on two technologies that are fundamental to the Web (Bizer et al.,
2011): Resource Identifiers (IRI, URL) and the HyperText Transfer Protocol (HTTP).
Internationalized Resource Identifier (IRIs) are an essential part of the Semantic Web. They ensure
that concepts are not just words but are tied to a unique definition that everyone can find on the
Web (Berners-Lee et al., 2001). When an IRI is associated with a resource, anyone that wishes can
link to it, refer to it, or retrieve a representation of it. Uniform Resource Locators (URLs) in addition
to identifying a resource, like an IRI, provide a way of locating the resource by describing its primary
access mechanism (access protocol). The most common used access protocol is HTTP that
provides a universal mechanism for retrieving resources that can be serialised as stream or bytes

24
or retrieving descriptions of entities that cannot themselves be sent across the network in this way
(physical object) (Bizer et al., 2011).
Another important technology for developing the Semantic Web is Resource Description
Framework (RDF). In the beginning, when RDF first appeared it relied in eXtensible Markup
Language (XML). XML is used to describe a class of data objects and partially explains the
behaviour of computer programs which process them (Bray, Paoli, Sperberg-McQueen, Maler, &
Yergeau, 2008). In short, XML allows users to add arbitrary structure to their documents but says
nothing about the meaning of its structure (Berners-Lee et al., 2001). What is missing in XML is
the relation between the data and its semantic value. A machine cannot understand what the data
is about with XML. For this RDF can be used. RDF is a framework for expressing information about
resources. This resources can be anything, documents, physical objects, places, people and
abstract concepts. The primary use of RDF is for machines to process information. With RDF
information can be exchanged between applications without loss of meaning (Manola et al., 2014).
Its core structure of syntax is a set of triples, and these triples allow the formation of webs of
information about related things. Each triple is formed by a subject, a predicate, and an object (see
fig. 10) (Cyganiak et al., 2014). RDF formulates statements such as humans form sentences, this
is why RDF is so intuitive. To a set of triples, we call an RDF graph.
Another way to represent RDF is with the use of textual syntaxes that are used to do textual
representations of RDF graphs. RDF/XML is one example but has become outdated because it was
not as human-friendly as others, such as Turtle.
Figure 10 - RDF Graph with two nodes
An RDF triple consists of three components: (i) the subject, that can be an IRI or a blank
node; (ii) the predicate, which is an IRI and, (iii) the object that is an IRI, a literal or a blank node.
A component of an RDF triple can be described with (i) IRIs and (ii) Blank node is a node
representing some resource for which an IRI or literal is not given. A blank node can only be used

25
in the subject or object part of an RDF triple (Chen, Zhang, Chen, & Guo, 2012), and (iii) Literals.
Literals are used for values such as strings, numbers, and dates (Cyganiak et al., 2014).
In 2001, when Tim Berners-Lee et. al, first introduced the Semantic Web, they also
introduced the concept of collections of information that they called Ontology. They adapted the
idea from philosophy where is used as a theory about the nature of existence. In computer science,
an ontology can be described as “… means to formally model the structure of a system, i.e., the
relevant entities and relations that emerge from its observation. Moreover, which are useful for our
purposes” (Staab & Studer, 2009). One of the main tasks of the Semantic Web research is to
encode human knowledge into ontologies. This encoding is a particularly challenging task, and one
of the most challenging problems is the adaptation of these ontologies to new insights (Klein,
2004). To represent this knowledge and the relation between deferent entities, we present three
languages: Resource Description Framework Schema (RDFS), Web Ontology Language (OWL) and
Simple Knowledge Organisations Systems (SKOS).
RDF describes resources with classes, properties, and values. Additionally, RDF also needs
a way to define classes and properties. These classes and properties must be defined using
extensions of RDF, such as RDFS that provides a data modelling vocabulary for RDF data. RDFS
took the basic RDF specification and extended it to support the expression of structured
vocabularies (Brickley & Guha, 2014). RDFS is sufficiently expressive to describe a class hierarchy,
contrary to RDF that only provides the set of triples with no relation between them (Ossenbruggen,
Hardman, & Rutledge, 2006). One may consider that the expressivity of RDFS is roughly limited to
a subclass hierarchy and a property hierarchy, with domain and range definitions of these
properties and not enough to create Ontologies on the Web (Antoniou & Harmelen, 2004). OWL
was created from this identified need for a more powerful ontology modelling language. The OWL
was built upon RDF and RDFS and have the same kind of syntax as these two (Antoniou &
Harmelen, 2004) and it is used to do knowledge representation. On the other hand, one could use
SKOS that is an RDF vocabulary for making thesauri, controlled vocabularies and subject headings
available on the web (Miles & Bechhofer, 2009). Unlike OWL, SKOS is not a language for knowledge
representation but rather a language for knowledge organisation. One could see the use of SKOS
as a useful alternative to OWL when there is no need for a rich expressive logic (Jupp, 2010).
Linked Open Data would not be useful if we do not have a way to retrieve information from
it. A standard way to do this is to use the SPARQL language. In January 2008, SPARQL became a
W3C Recommendation.

26
W3C defined the SPARQL language as a set of specifications that provide languages and
protocols with a way to query and manipulate RDF graph content on the Web or in an RDF store.
The SPARQL queries are composed by three parts (Pérez, Arenas, & Gutierrez, 2009). 1) The
pattern matching part, consists of matching patterns in RDF graphs; 2) Solution modifiers, once
we have the result from the pattern matching part, we can modify those values applying classical
operators; and 3) output of SPARQL queries. This output can be of three types: yes/no queries,
selection of values of the variable which matches the patterns defined, or the construction of a new
RDF graph.
2.3.1 Metadata and Metadata Schemas
In last decade, we have seen a growth of digital repositories, due to new technologies, and
particularly because of the World Wide Web. Because of this, there has been a tremendous increase
in the need for data management, an intense interest in metadata in a wide range of communities,
and extensive development of metadata schemas (Greenberg, 2005). The definition of metadata
is best known as “data about data” this means that metadata is anything that describes anything
else (Baca, 2016). With metadata, we can describe everything that we want, but representing
different types of resources requires several types of metadata and metadata standards (Rühle,
Baker, & Johnston, 2011). Metadata should follow clear rules in metadata schemas (or schemes).
A metadata schema or Vocabulary schema specifies the names of elements and their
semantic value. These metadata elements have a very specific meaning inside de schema. The
definition of each element is known as the semantics of the schema (Niso, 2004). Besides this,
each element of the schema has defined rules for the values that are associated with the element
(Malta, 2014).
Currently, there are hundreds of vocabularies schemas being used, here are presented five
examples:
Dublin Core Metadata Element Set (DCMES)29 : This is a vocabulary that was created
by the Dublin Core Metadata Initiative (DCMI), a pioneer and one of the most influential
initiatives regarding metadata. The DCMES is a vocabulary composed of fifteen
properties for use in resource description. The nature of its elements is broad and
generic and can be used to describe a broad range of resources. More recently, was
29 http://dublincore.org/documents/dces/

27
created the DCMI Metadata Terms (DCTERMS) where were added properties to the
fifteen already created.
Schema.org30 : In 2011, the major search engines such as Bing, Google, and Yahoo
(later joined by Yandex) came together with the goal of providing a single schema
across a wide range of topics. This idea was to present webmasters (a person
responsible for maintaining one or more websites) with a single vocabulary that they
could use to represent a variety of things. The vocabularies are developed by an open
community process. Schema.org is a vocabulary that can be used with different
encodings, including RDFa, Microdata and JSON-LD. This vocabulary covers entities,
relationships between entities and actions.
DBpedia31: DBpedia is a crowd-sourced community effort to extract structured
information from Wikipedia and make that information available on the web. For each
entity retrieved from Wikipedia, BDpedia defines a globally unique identifier that can
be dereferenced according to Linked Data principles (Berners-Lee, 2006). Then they
publish RDF links pointing from DBpedia into other Web data sources. The DBpedia
covers a wide range of topics such as geographic information, people, companies,
films, music, genes, drugs, books and scientific publications.
Friend of a Friend (FOAF) vocabulary32: Defines terms for describing persons, their
activities and their relations to other people and object. The FOAF terms are grouped
into three specific categories:
o Core – classes, and properties that form the core of FOAF;
o Social Web – terms for describing Internet accounts, address books and other
Web-bases activities;
o Linked Data Utilities – set of terms that are useful to the Web community.
Australian Government Locator Service (AGLS) Metadata Standard33 - Is a metadata
schema created by the Australian Governments and is primarily concern with
describing government services and information resources for discovery and retrieval
purposes, although its further development aims to facilitate the transaction of
government business online (McKemmish, Acland, Ward, & Reed, 1999).
30 http://schema.org/ 31 http://wiki.dbpedia.org 32 http://xmlns.com/foaf/spec/ 33 http://www.agls.gov.au/

28
The use of international standards when we are talking about interoperability is fundamental. Many
organisations create standards for the community to adopt. Next, some examples are ilustrated:
The Internet Engineering Task Force (IETF)34: In their site, is stated that their mission is to
“make the Internet work better”. They do that with the development of documents that
include protocol standards, best current practices, and informational documents of various
kinds;
International Organization for Standardization (ISO)35: ISO is an independent, non-
governmental international organisation that develops standards for a broad range of
domains. Currently, they have published more than 21000 international standards;
World Wide Web Consortium (W3C)36: An organisation founded in 1994 by Tim Berners-
Lee that is the main international standards organisation for the Web. The W3C standard
formation process consists of four maturity levels: (i) Working Draft (WD), the very first step
to standardisation and is published for review by the community; (ii) Candidate
Recommendation (CR), is more mature than the WD and the group responsible for the
standard is satisfied that the standard meets its goal; (iii) Proposed Recommendation (PR),
this standard has passes the prior two levels and the user of the standard provide input
about their experience using it. At this stage, the document is submitted to the W3C
Advisory Council for final approval and (iv) W3C Recommendation (WR) the most mature
stage of development and its ready for the community to adopt it.
In the Semantic Web, the metadata schemas and standards allow some level of interoperability
between different agents that are communicating. This schemas and standards work similarly,
in some way or form, to the existing protocols in the Web. Nevertheless, they are not enough
to respond to the complex system that is the Semantic Web. Another way to favour
interoperability in the Semantic Web is with the use of Metadata Application Profiles.
2.3.2 Metadata Application Profile
The remark about the Semantic Web is that one can mix and match vocabularies to fit their current
needs. For example, in RDF code, one could use the DCTERMS to describe the more generic
features about some resource and combine it with FOAF to describe the relations between people.
34 https://www.ietf.org/ 35 http://www.iso.org/iso/home.html 36 https://www.w3.org/

29
Also, if any vocabulary that fits the requested needs cannot be found, one of the remarkable
features that the Semantic Web allows, is to create one. In this situation, one could add to the
DCTERMS or FOAF, another metadata schema that fits the requirements. This is only possible
because similarly to the Web, the Semantic Web is distributed in nature and this means that we
can say things about things even if those things were not created by us.
DCMI developed the Dublin Core Abstract Model (DCAM). The DCAM defines the nature of the
components used and describes how those elements are combined to create information
structures (Powell, Nilsson, & Naeve, 2007). One of these data structures is the Dublin Core
Application Profile (DCAP), and it is described in the Singapore Framework for Dublin Core
Application Profiles, that is currently a DCMI Recommended Resource (Nilsson, Baker, & Johnston,
2008). From this point on, the term Metadata Application Profile (MAP) is going to be used instead
of DCAP. The use of DCAP instead of MAP can lead to misinterpretation about what really is a
DCAP. The name, Dublin Core Application Profile can make a reader think that we are talking about
an application profile that uses Dublin Core elements and, that is not the case, a DCAP or MAP
can use a variety of elements and it is not restricted to Dublin Core terms.
The Singapore Framework is used to design metadata applications for maximum
interoperability and reusability. According to DCMI, there is a set of rules that need to be followed
to develop a MAP:
Functional Requirements: The functional requirements are a mandatory step and it
describes the functions that the Application Profile (AP) will support;
Domain Model: The domain model it is also a mandatory step. This model describes
the entities of the AP and the relation between them;
Description Set Profile (DSP): This is another mandatory step. The aim of this phase
is to evaluate which metadata records are valid to the AP that is being developed;
User guidelines: the optional usage guidelines describe how to apply the AP;
Encoding syntax guidelines: another optional step that defines the profile syntax.
The development of a MAP is a stepwise process where each stage is built from the results of the
previous step. This can be verified through Figure 11 which present the MAP model defined by
DCMI.
The Singapore Framework came to organise a community of PA implementers, explaining
the steps that they should follow to reach the higher level of interoperability.

30
Although the MAP is a crucial resource, organisations need data models that support their
interoperability needs, and because of the complexity of the design, development, and
implementation, this process requires methodological support. The development method for
Metadata Application Profile (Me4MAP) was developed to answer this need. This method is based
on the Singapore Framework (Nilsson et al., 2008) and has as starting point the Rational Unified
Process (RUP) (Kruchten, 2004), a software development process.
Each component of the Singapore Framework is defined on Me4MAP. Using RUP as a
basis, Me4MAP sets the way through the MAP development: it establishes the activities, when they
should take place, how they interconnect, and which deliverables they will bring out (Malta &
Baptista, 2013).
Me4MAP is divided into four phases (see figure 12): Scope Definition, Construction,
Development, and Validation. The phases are transversal to the project development. (Malta &
Baptista, 2013).
Figure 11 - MAP Model applied with the Singapore Framework (Nilsson et al., 2008)

31
Figure 12 - Me4MAP V0.2 phases (Malta & Baptista, 2013)
2.3.3 From Open Data to Linked Open Data
To fully benefit from Open Data, it is critical to put information and data into a context that creates
new knowledge and empowers great services and applications. As LOD facilitates innovation and
knowledge creation from interlinked data, it is an important mechanism for information
management and integration on the Web (Bauer & Kaltenböck, 2012).
The path to transform Open Data into Linked Open Data is best described by Sir Tim
Berners-Lee on its website called 5-star Open Data37.
Figure 13 - 5 Star Open Data Model
37 http://5stardata.info/en/

32
Michael Hausenblas38 adapted the model to explain the cost and benefits for both publishers and
consumers of LOD:
Figure 14 - Cost and benefits of 1-star web data (Bauer & Kaltenböck, 2012)
Figure 15 - Cost and benefits of 2-stars web data (Bauer & Kaltenböck, 2012)
38 http://semanticweb.org/wiki/Michael_Hausenblas

33
Figure 16 - Cost and benefits of 3-stars web data (Bauer & Kaltenböck, 2012)
Figure 17 - Cost and benefits of 4-stars web data (Bauer & Kaltenböck, 2012)

34
Figure 18 - Cost and benefits of 5-stars web data (Bauer & Kaltenböck, 2012)
Another benefit that it is worthy of mentioning is the return from linking data. LOD is about linking
and the semantic value of things. With LOD we can have a global decentralised system, a system
that is capable of creating new relations between subjects, even if those relations are not explicit.
From this, new knowledge can be discovered, relations that we never thought about are now clear
as water. This is one of the benefits of LOD that has not yet been completely explored but, one
could believe that the future walks in this direction.
2.3.4 LOD and Smart Cities
Smart Cities are becoming more and more popular, and each city deploys its own system, which
may not be interoperable with another’s city system. Currently, there is no unified and interoperable
system which could be reused and redeployed in future smart cities (Gyrard & Serrano, 2015).
Since cities have large amounts of data, heterogeneous in nature and with different quality and
security requirements, research on the opening process, data re-engineering, linking, formalisation
and consumption are of primary interest in smart cities (Alani et al., 2007). The semantic web
technologies could be used to address some of these challenges.
The Internet of Things (IoT) is considered an essential aspect of Smart Cities, one could
also say that LOD together with IoT is a key requirement for Smart Cities. If the government and
other organisations would open up their datasets, particular their sensor networks over the Internet
and using LOD, this could indeed “enable” Smart Cities. Sensors expose their data in a structured

35
way and (potentially) linked to other datasets. These two technologies together would facilitate data
integration from multiple heterogeneous sources, enable the development of information filtering
systems, support knowledge discovery tasks and this could result in applications that are not yet
foreseen (Consoli et al., 2014).
In a Smart City, there is a variety of data sources that offer data to be processed. This data
can be about everything that makes a city such as transports, education, health care, crime,
economy and, energy and energy efficiency of buildings like the data from the SusCity project. The
heterogeneity in this data gives rise to challenges in several dimensions. Even devices of the same
type will deliver data in heterogeneous formats or different units of measurements bringing
heterogeneity issues (Bischof et al., 2014). These issues are part of the challenges that need to be
considered when city data is intended to be released to the public. Usually, the data retrieved from
the sensors has to be treated to be release to city’s citizens. Raw data in this approach, may not
be the best approach because of its volume and privacy issues. Aggregated and filtered data can
be more easily discoverable and have more value to the final user. That data is eventually integrated
into higher-level services and applications (Barnaghi, Sheth, & Henson, 2013).
2.3.5 LOD and Smart Cities Initiatives
The focus of a Smart City is urban resource efficiency. LOD can be used to better understand the
use of those resources and to suggest improvements. To do that, the data has to be published
under a LOD perspective and has to be available for everyone’s use. In the following section, some
initiatives regarding LOD and Smart Cities are presented to better understand the relation between
these two subjects.
2.3.5.1 IES CITIES39 40
The IES CITIES is a platform designed to facilitate the development of urban apps that exploit public
data offered by councils and enriched by citizens. This solution address the needs of three main
stakeholders in a city: (i) citizens consuming useful data services in different domains but also
contributing with complementary data to the city, (ii) companies leveraging the JSON-based RESTful
API provided by the IES CITIES to create citizen-centric Linked Data urban apps, and (iii) the City
39 http://iescities.eu/ 40 https://iescities.com/IESCities/

36
Council, using the platform to publicise its urban datasets and track services assembled around
them (López-de-Ipiña, Vanhecke, Peña, De Nies, & Mannens, 2013).
Currently, the cities that are using this platform are Zaragoza, Bristol, Roveroto and
Majadahonda.
The IES CITIES is composed of the following elements: (i) a mobile application, namely the IES
CITIES players, which allows the user to search for available urban apps, based on their location
and filters, (ii) a server that acts as a mediator among urban apps front-ends and back-ends.
The IES CITIES platform works as follows. First, the municipality registers with the IES Cities
server its datasets descriptions. It indicates where the dataset can be located and accessed (URI),
what is the original format of the data (CSV, RDF, XML, and others) and a description of the dataset
expressed in JSON-Schema. Secondly, a developer can find and choose which datasets are of his
interest by browsing the IES Cities dataset repository. The search can be done with the RESTful
JSON-based API, which issues queries over the datasets (JSON data structures) and retrieves
results also in JSON. Thirdly, the developer registers the application in the platform, providing
details such as where the application is (URI), its type (Google play, Local app repository, Web, and
others.) and a description of its functionalities. Finally, end users can search and find the
application.
One important point about the IES CITIES project is that involves citizens in the creation of LOD
which demonstrates how citizens' involvement in the management of a city can be increased by
allowing them to participate actively. These services also show the IES Cities platform’s added
value for public bodies, which can publish open data with a common machine-readable format
(JSON).

37
Figure 19 - Software Components architecture of the IES Cities Platform
In figure 20 it is possible to see the IES Cities from a citizen’s perspective. The Citizen can access
City Datasets (point 1) City applications (point 2). When an application is selected the user can see
its details (point 3) and, finally there is a personal area where the user can register (point 4).
Figure 20 - IES Cities from a citizen’s perspective
Figures 21 and 22 illustrate the IES Cities platform from a municipality perspective. In figure 21
the municipality can manage the users of the platform. This user can be Admin or Developers.
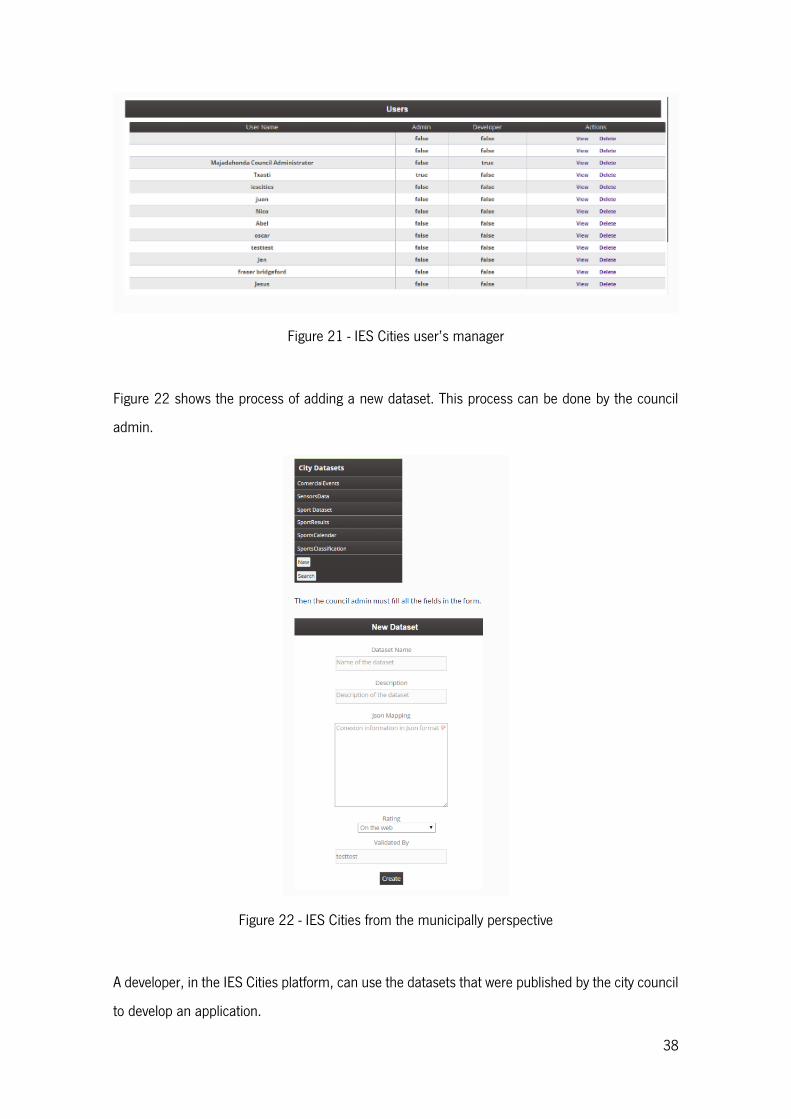
38
Figure 21 - IES Cities user’s manager
Figure 22 shows the process of adding a new dataset. This process can be done by the council
admin.
Figure 22 - IES Cities from the municipally perspective
A developer, in the IES Cities platform, can use the datasets that were published by the city council
to develop an application.

39
Figure 23 - IES Cities from a developer perspective
After creating an App the developer can add the app to the platform.
Figure 24 - IES Cities from a developer perspective
2.3.5.2 STAR-CITY41
Star-City integrates sensor data using a variety of formats and volumes. Star-City is a system that
supports traffic analytics and reasoning for cities with the integration of sensor data. This system,
showcased in Dublin, Ireland, demonstrates how the severity of road traffic congestion can be
smoothly analysed, diagnosed, explored and predicted using semantic web technologies.
This system is used on a daily and real-time basis to understand not only how traffic condition
is evolving over time, but also why.
Star-City completely relies on the W3C Semantic Web stack, e.g., OWL 2 and RDF for
representing the semantics of information and delivering inference outcomes (Lécué et al., 2014).
41 http://researcher.watson.ibm.com/researcher/view_group.php?id=5101

40
Figure 25 - Star City Application
3 Study to be Carried Out
In this chapter, it is presented the conceptualization of the problem of this dissertation and its
underlying objectives and the methodological approach that is going to be used.
3.1 Conceptualization of the problem to be studied and its underlying objectives
SusCity is a project that relies on the concept of smart cities, and many of the data that produces
are about energy and energy efficiency in buildings. A smart city has many strands, and the same
happens with SusCity. It is divided into six WPs, each containing a set of tasks. This dissertation is
going to focus on WP 2 and the task 6 “Publish City Open Data”. In this task, we are going to
research and develop methods for selecting and making data available under a LOD perspective.
This study aims to create an application profile for the SusCity data and to publish the
SusCity under a LOD perspective. This data is about energy and energy efficiency in buildings. To
do this, a research work was carried out, prior to this dissertation, to investigate if Application
Profiles, Properties and Vocabularies regarding energy efficiency in buildings existed. The
conclusion of this study was that such resources were almost non-existing. Hence, the opportunity

41
of this work is to create and publish them on the web for everyone’s use. With this, the aim is to
contribute to the LOD community and to promote semantic interoperability.
To do this work the Me4MAP methodology is going to be used. Certain phases of this
methodology are not going to be implemented because we already know the data that we are going
to deal with.
At the end of the project we aim that the SusCity data is going to be release in LOD for
everyone’s use.
To publish LOD data, the first thing that it is needed to be done is to look for Application
Profiles, Properties and Vocabularies that “fit” that data, in this case, data about energy and energy
efficiency in buildings. For this, a study was conducted, prior to this dissertation, where it was
concluded that these resources do not exist in the required number or do not exist at all.
The lack of Applications Profiles, Properties and Vocabularies about energy and energy
efficiency in buildings, are both the problem and the motivation of this dissertation because this
means that they are going to have to be created. The development of these resources is an
opportunity to contribute to the Semantic Web community by enriching its domain and to make
them available so, when other people want to make their data about energy or energy efficiency in
buildings available under LOD, they can rely on the properties and vocabularies that we have
created. . Another opportunity of this thesis is to improve and promote semantic interoperability.
Because of the creation of Application Profiles, Properties and Vocabularies, computers will now
have the ability to understand the semantic values and semantics of the attributes of the properties
and the relations between different datasets used in energy-related data.
In the creation of Properties and Vocabularies, one should use the technologies that the
Semantic Web relies on such as, but not limited to (i) RDF, that is a framework for expressing
information about resources; (ii) RDFS that took the basic RDF specification and extended it to
support the expression of structured vocabularies (Brickley & Guha, 2014); and (iii) SKOS. Both
RDFS and SKOS are applications of RDF. These techniques are going to be used not only in the
data but also in the data catalogue (MAP).
With all of this in mind, this thesis aims to:
Make the SusCity data available under a LOD perspective;
Develop of a Benchmarking report of LOD platforms;
Develop of an Application Profile for the SusCity data;
Define and implement the SusCity LOD prototype.
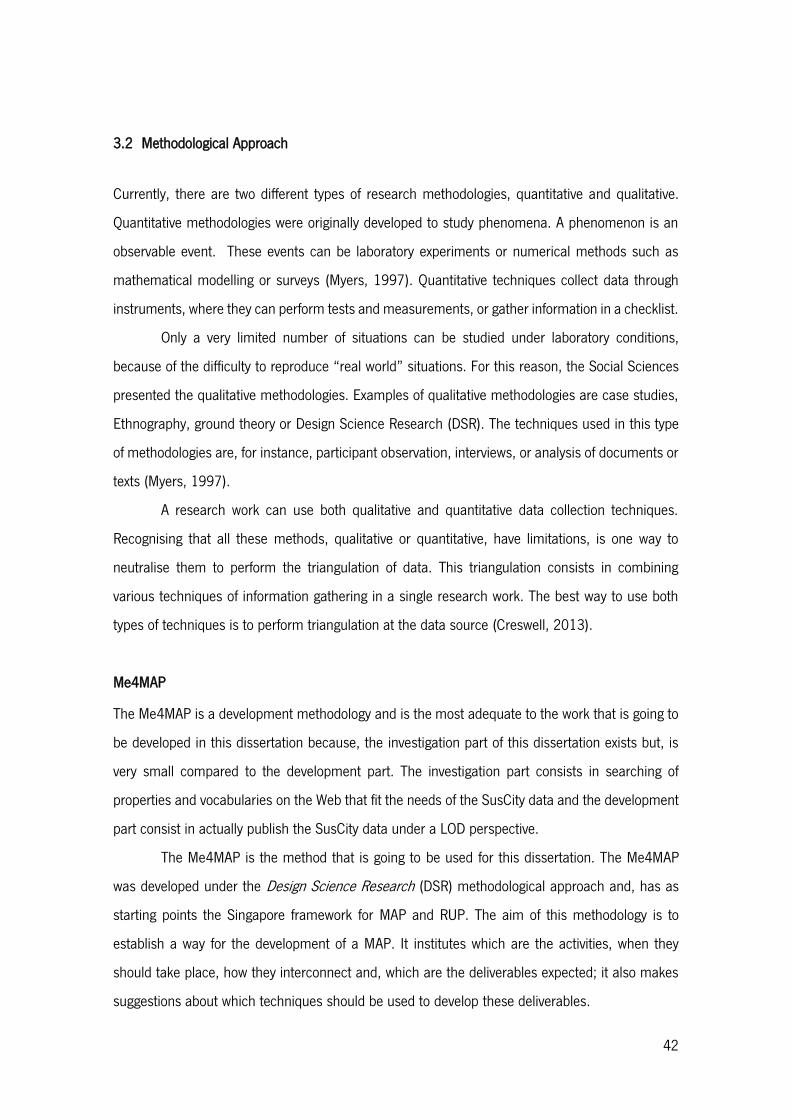
42
3.2 Methodological Approach
Currently, there are two different types of research methodologies, quantitative and qualitative.
Quantitative methodologies were originally developed to study phenomena. A phenomenon is an
observable event. These events can be laboratory experiments or numerical methods such as
mathematical modelling or surveys (Myers, 1997). Quantitative techniques collect data through
instruments, where they can perform tests and measurements, or gather information in a checklist.
Only a very limited number of situations can be studied under laboratory conditions,
because of the difficulty to reproduce “real world” situations. For this reason, the Social Sciences
presented the qualitative methodologies. Examples of qualitative methodologies are case studies,
Ethnography, ground theory or Design Science Research (DSR). The techniques used in this type
of methodologies are, for instance, participant observation, interviews, or analysis of documents or
texts (Myers, 1997).
A research work can use both qualitative and quantitative data collection techniques.
Recognising that all these methods, qualitative or quantitative, have limitations, is one way to
neutralise them to perform the triangulation of data. This triangulation consists in combining
various techniques of information gathering in a single research work. The best way to use both
types of techniques is to perform triangulation at the data source (Creswell, 2013).
Me4MAP
The Me4MAP is a development methodology and is the most adequate to the work that is going to
be developed in this dissertation because, the investigation part of this dissertation exists but, is
very small compared to the development part. The investigation part consists in searching of
properties and vocabularies on the Web that fit the needs of the SusCity data and the development
part consist in actually publish the SusCity data under a LOD perspective.
The Me4MAP is the method that is going to be used for this dissertation. The Me4MAP
was developed under the Design Science Research (DSR) methodological approach and, has as
starting points the Singapore framework for MAP and RUP. The aim of this methodology is to
establish a way for the development of a MAP. It institutes which are the activities, when they
should take place, how they interconnect and, which are the deliverables expected; it also makes
suggestions about which techniques should be used to develop these deliverables.

43
Me4MAP is divided into four phases (see fig.22): Scope Definition, Construction,
Development, and Validation. The phases are transversal to the project development. (Malta &
Baptista, 2013).
Figure 26 - Me4MAP phases (Malta & Baptista, 2013)
The planning of the work begins in the first phase “Scope Definition” and, the goal of this phase is
to define de MAP application scope and organise the work. Some part of the Functional
Requirements Singapore Stage 1 is developed in the phase. In the Construction phase, the Domain
Model Singapore Stage 2 development is initiated. Next, in the Description Set Profile (DSP)
Singapore Stage 3 is built in the Development Phase. The development phase is the climax off all
construction done until this moment since de DSP Singapore Stage 3 development work is based
on the Domain Model Singapore Stage 2, and it is the Singapore Stage 3 that defines the MAP.
Finally, in the Validation phase, the MAP is validated. The Guidelines, Singapore stage four and five
are developed throughout the last three steps (Construction, Development and Validation) (Malta
& Baptista, 2013). To have a better understanding of the life-cycle development model for
Me4MAP, see figure 27.

44
Figure 27 - Me2MAP V0.2 life-cycle development model (Malta & Baptista, 2013)
For this dissertation, the functional requirements phase is going to be skipped because
there aren’t any functional requirements defined. Because of this, the work is going to start by de
Domain Model (Singapore Stage 2). This model is used to describe what things the metadata
describes, and the relationships between them and, it is considered to be the blueprint for the
construction of the AP (Coyle & Baker, 2009). To design the Domain Model, the available data
from the project’s partners is going to be analysed, to gain a better understanding of what are the
entities and the relation between them.

45
Figure 28 - Example of a Domain Model (Coyle & Baker, 2009)
After the Domain Model, the next phase is Singapore Stage 3, the Description Set Profile.
The Me4MAP defines the need to develop two mandatory tasks, the Integration Dossier and the
Validation Dossier.
The Integration Dossier is composed by three deliverables (all mandatory): A Detailed Data
Model Diagram, that represents the Domain Model in detail; a State Of The Art Report, that reports
the existing metadata schemas, in this case about energy and energy efficiency in buildings; and
a Document of Integration, this document is built having in mind the detailed domain model and
the state of the art report. In this deliverable, it is shown every attribute, and its constraints
described by the properties of the metadata schemas chosen to represent the project data.
Similarly to the Integration Dossier, the Validation Dossier is also composed by three
mandatory deliverables, a Validation Report, that is developed having in mind the Vision of the
project; a Document of Validation, in which each element of the metadata is populated with the
data that corresponds to the resource and, finally a Questionnaire that aims verify if there is any
data that has no description from the MAP.
The Singapore Stages four and five consists in the development of the Usage Guidelines
and the Syntax Guidelines. The Usage Guidelines aim to respond to the “how” and “why” of the
AP. Ideally, they explain each property and anticipate the decisions that must be made while
creating a metadata record (Coyle & Baker, 2009). The Syntax Guidelines describe “any application
profile-specific syntaxes and/or syntax guidelines” (Coyle & Baker, 2009). The Singapore Stages

46
four and five are optional, but they are going to be developed in this project. They help the future
users of the AP to understand it better and to apply it in an expected way.
3.3 Activities Plan
The goal of this master’s thesis is to create an application profile for the SusCity data and to release the SusCity’s data to the public under a LOD perspective. To achieve this goal, the following tasks will be carried out:
T1. Development of State of the Art report on LOD under the scope of Smart Cities; T2. Study and analysis of fundamentals and technical recommendations of international
organisations under the scope of LOD; T3. Benchmarking report of LOD platforms (results in R1);
o Search for available LOD platforms; o Analyse which platforms are used by the LOD community; o See which LOD platforms are open; o See which platforms support LOD.
T4. Application Profile (results in R2); o Develop the Domain Model; o Develop the Description Set Profile; o Develop the Usage and Syntax Guidelines.
T5. Development and implementation of the SusCity LOD prototype (results in R3); o Implement the prototype in a LOD database and with SPARQL endpoint; o Conduct Laboratory tests;
T6. Writing of the dissertation (results in R4); T7. Writing and submission of a Scientific Article (results in R5).
The following results are expected from the above tasks:
R1. Benchmarking Report: R2. SusCity’s Application Profile: R3. SusCity LOD prototype: R4. Dissertation report. R5. Scientific Article.
This dissertation started in September 2016, and it will be completed in October 2017. In the following table, the deliveries dates are established for the project’s tasks.

47
November January March May July October T1. Development of State of the Art report on LOD under the scope of Smart Cities
X
T2. Study and analysis of fundamentals and technical recommendations of international organisations under the scope of LOD
X
T3. Benchmarking report of LOD platforms
X
T4. Application Profile X T5. Development and implementation of the SusCity LOD prototype
X
T6. Writing of the dissertation X X X X X X T7. Writing and submission of a Scientific Article
X X X X X X
Table 1 - Delivery dates for the dissertation

48
4 Final Considerations
Until now, the work was developed has intended. The development of the State of the Art about
LOD under the scope of Smart Cities and the study and analysis of the technical specification of
international organisations under LOD are completed. The next immediate task is to carry a
Benchmarking report about LOD platforms and continue to follow the activities plan.

49
5 References
1. Alani, H., Dupplaw, D., Sheridan, J., O’Hara, K., Darlington, J., Shadbolt, N., & Tullo, C.
(2007). Unlocking the potential of public sector information with semantic web technology.
Em The semantic web (pp. 708–721). Springer. Obtido de
http://link.springer.com/chapter/10.1007/978-3-540-76298-0_51
2. Alemu, G., Stevens, B., & Ross, P. (2012). Towards a conceptual framework for user‐driven
semantic metadata interoperability in digital libraries: A social constructivist approach.
New Library World, 113 (1/2), 38–54. https://doi.org/10.1108/03074801211199031
3. Antoniou, G., & Harmelen, F. van. (2004). Web Ontology Language: OWL. In P. D. S. Staab &
P. D. R. Studer (Eds.), Handbook on Ontologies (pp. 67–92). Springer Berlin Heidelberg.
https://doi.org/10.1007/978-3-540-24750-0_4
4. Baca, M. (2016). Introduction to Metadata: Third Edition. Getty Publications.
5. Barnaghi, P., Sheth, A., & Henson, C. (2013). From Data to Actionable Knowledge: Big Data
Challenges in the Web of Things [Guest Editors’ Introduction]. IEEE Intelligent Systems,
28(6), 6–11. https://doi.org/10.1109/MIS.2013.142
6. Batty, M., Axhausen, K. W., Giannotti, F., Pozdnoukhov, A., Bazzani, A., Wachowicz, M., …
Portugali, Y. (2012). Smart cities of the future. The European Physical Journal Special
Topics, 214(1), 481–518. https://doi.org/10.1140/epjst/e2012-01703-3
7. Bauer, F., & Kaltenböck, M. (2012). Linked Open Data: The Essentials. Edition Mono.
Obtained from http://www. semantic-web.at/LOD-TheEssentials.pdf
8. Berners-Lee, T. (2006, Julho 27). Linked Data - Design Issues. Obtained 24/01/2017, from
https://www.w3.org/DesignIssues/LinkedData.html
9. Berners-Lee, T., Hendler, J., Lassila, O., & others. (2001). The semantic web. Scientific
american, 284(5), 28–37.

50
10. Bischof, S., Karapantelakis, A., Nechifor, C.-S., Sheth, A. P., Mileo, A., & Barnaghi, P. (2014).
Semantic modelling of smart city data. Obtained from
http://corescholar.libraries.wright.edu/knoesis/572/
11. Bizer, C., Heath, T., & Berners-Lee, T. (2011). Linked Data - The Story So Far. International
Journal on Semantic Web and Information Systems.
12. Bray, T., Paoli, J., Sperberg-McQueen, C. M., Maler, E., & Yergeau, F. (2008, November 26).
Extensible Markup Language (XML) 1.0 [W3C Recommendation]. Obtained 24/01/2017
13. Brickley, D., & Guha, R. . (2014, February 25). RDF Schema 1.1 [W3C Recommendation].
Obtained 24/01/2017, from https://www.w3.org/TR/rdf-schema/
14. Caragliu, A., Del Bo, C., & Nijkamp, P. (2011). Smart Cities in Europe. Journal of Urban
Technology, 18(2), 65–82. https://doi.org/10.1080/10630732.2011.601117
15. Chen, L., Zhang, H., Chen, Y., & Guo, W. (2012). Blank Nodes in RDF. Journal of Software,
7(9). https://doi.org/10.4304/jsw.7.9.1993-1999
16. Chourabi, H., Nam, T., Walker, S., Gil-Garcia, J. R., Mellouli, S., Nahon, K., … Scholl, H. J.
(2012). Understanding Smart Cities: An Integrative Framework. Em 2012 45th Hawaii
International Conference on System Science (HICSS) (pp. 2289–2297).
https://doi.org/10.1109/HICSS.2012.615
17. Cohn, J. P. (2008). Citizen Science: Can Volunteers Do Real Research? BioScience, 58(3),
192. https://doi.org/10.1641/B580303
18. Consoli, S., Mongiovì, M., Recupero, D., Peroni, S., Gangemi, A., Nuzzolese, A., & Presutti, V.
(2014). Producing Linked Data for Smart Cities: the case of Catania. Semantic Web
Journal. Obtained from http://www.semantic-web-journal.net/system/files/swj930.pdf

51
19. Coyle, K., & Baker, T. (2009, May 18). Guidelines for Dublin Core Application Profiles [This is
a DCMI Recommended Resource]. Obtained 04/10/2016, from
http://dublincore.org/documents/profile-guidelines/
20. Creswell, J. W. (2013). Research Design: Qualitative, Quantitative, and Mixed Methods
Approaches. SAGE Publications.
21. Cyganiak, R., Wood, D., Lanthaler, M., Klyne, G., Carroll, J. J., & McBride, B. (2014,
February 25). RDF 1.1 Concepts and Abstract Syntax [W3C Recommendation]. Obtained
25/01/2017, from https://www.w3.org/TR/rdf11-concepts/
22. EUROCITIES. (2013). Open Data guidebook.
23. Ferraram, A., Nikolov, A., & Scharffe, F. (2013). Data Linking for the Semantic Web. From
Semantic Web: Ontology and Knowledge Base Enabled Tools, Services and Application.
Information Science Reference.
24. Goodchild, M. F. (2007). Citizens as sensors: the world of volunteered geography.
GeoJournal, 69(4), 211–221. https://doi.org/10.1007/s10708-007-9111-y
25. Greenberg, J. (2005). Understanding Metadata and Metadata Schemes. Cataloging &
Classification Quarterly, 40(3–4), 17–36. https://doi.org/10.1300/J104v40n03_02
26. Greenberg, J., Sutton, S., & Campbell, D. G. (2003). Metadata: A Fundamental Component
of the Semantic Web. Bulletin of the American Society for Information Science and
Technology, 29(4), 16–18. https://doi.org/10.1002/bult.282
27. Gyrard, A., & Serrano, M. (2015). A Unified Semantic Engine for Internet of Things and Smart
Cities: From Sensor Data to End-Users Applications. From 2015 IEEE International
Conference on Data Science and Data Intensive Systems (pp. 718–725).
https://doi.org/10.1109/DSDIS.2015.59

52
28. Irwin, A. (1995). Citizen Science: A Study of People, Expertise and Sustainable Development.
Psychology Press.
29. Janssen, M., Charalabidis, Y., & Zuiderwijk, A. (2012). Benefits, Adoption Barriers and Myths
of Open Data and Open Government. Information Systems Management, 29(4), 258–
268. https://doi.org/10.1080/10580530.2012.716740
30. Jessup, L. M., & Valacich, J. S. (2008). Information Systems Today: Managing in the Digital
World. Pearson Prentice Hall.
31. Jupp, S. (2010, Janeiro 22). Simple Knowledge Organisation System (SKOS). Obtained
23/02/2017, from http://ontogenesis.knowledgeblog.org/240
32. Klein, M. (2004, Novembro). Change Management for Distributed Ontologies. Obtained from
http://www.cs.vu.nl/~mcaklein/thesis/thesis.pdf
33. Kruchten, P. (2004). The Rational Unified Process: An Introduction. Addison-Wesley
Professional.
34. Lécué, F., Tallevi-Diotallevi, S., Hayes, J., Tucker, R., Bicer, V., Sbodio, M. L., & Tommasi, P.
(2014). STAR-CITY: semantic traffic analytics and reasoning for CITY (pp. 179–188).
ACM Press. https://doi.org/10.1145/2557500.2557537
35. López-de-Ipiña, D., Vanhecke, S., Peña, O., De Nies, T., & Mannens, E. (2013). Citizen-
Centric Linked Data Apps for Smart Cities. Em UCAmI (pp. 70–77). Springer. Obtained
from http://link.springer.com/content/pdf/10.1007%252F978-3-319-03176-
7.pdf#page=84
36. Malta, M. C. (2014, September 25). Methodological contribution to the development of
application profiles in the context of the semantic Web. Minho’s University. Obtained
from http://repositorium.sdum.uminho.pt/handle/1822/30262?mode=full

53
36. Malta, M. C., & Baptista, A. A. (2013). A method for the development of dublin core
application profiles (Me4DCAP V0. 2): detailed description. Em Proceedings of the 2013
International Conference on Dublin Core and Metadata Applications (pp. 90–103).
Lisbon: Citeseer. Obtained from
http://citeseerx.ist.psu.edu/viewdoc/download?doi=10.1.1.671.405&rep=rep1&type=pd
f
37. Manola, F., Miller, E., McBride, B., Schreiber, G., & Yves, R. (2014, June 24). RDF 1.1
Primer [W3C Working Group Note]. Obtained 25/01/2017, from
https://www.w3.org/TR/2014/NOTE-rdf11-primer-20140624/
38. Mathiesen, K. (2008). Access to information as a human right. Available at SSRN 1264666.
Obtained from http://papers.ssrn.com/sol3/papers.cfm?abstract_id=1264666
39. McKemmish, S., Acland, G., Ward, N., & Reed, B. (1999). Describing Records in Context in
the Continuum: the Australian Recordkeeping Metadata Schema. Archivaria, 48(Issue
Fall).
40. Miles, A., & Bechhofer, S. (2009). SKOS Simple Knowledge Organization System Reference.
Obtido Obtained 23/02/2017, from https://www.w3.org/TR/skos-reference/
41. Myers, M. D. (1997). Qualitative research in information systems. Management Information
Systems Quarterly, 21(2), 241–242.
42. Nam, T., & Pardo, T. A. (2011). Conceptualizing smart city with dimensions of technology,
people, and institutions. Em Proceedings of the 12th Annual International Digital
Government Research Conference: Digital Government Innovation in Challenging Times
(pp. 282–291). ACM. Obtained from http://dl.acm.org/citation.cfm?id=2037602

54
43. Nilsson, M., Baker, T., & Johnston, P. (2008, January 14). The Singapore Framework for
Dublin Core Application Profiles [This is a DCMI Recommended Resource]. Obtained
04/10/2016, from http://dublincore.org/documents/singapore-framework/
44. Niso, P. (2004). NISO Press Booklets.
45. Ossenbruggen, J. van, Hardman, L., & Rutledge, L. (2006). Hypermedia and the Semantic
Web: A Research Agenda. Journal of Digital Information, 3(1). Obtained from
https://journals.tdl.org/jodi/index.php/jodi/article/view/78
46. Pan, G., Qi, G., Zhang, W., Li, S., Wu, Z., & Yang, L. (2013). Trace analysis and mining for
smart cities: issues, methods, and applications. IEEE Communications Magazine, 121.
Obtained from
http://citeseerx.ist.psu.edu/viewdoc/download?doi=10.1.1.307.9769&rep=rep1&type=
47. Pérez, J., Arenas, M., & Gutierrez, C. (2009). Semantics and complexity of SPARQL. ACM
Transactions on Database Systems (TODS), 34(3).
48. Powell, A., Nilsson, M., & Naeve, A. (2007, Junho 4). DCMI Abstract Model [This is a DCMI
Recommendation]. Obtained 06/10/2016, from
http://dublincore.org/documents/2007/06/04/abstract-model/
49. Ramalho, J. L. B. R. (2015). Smart Cities-Fazer uma Avaliação do Estado da Arte do Conceito
e Hierquizar, Com Base Numa Metodologia de Decisão, as Medidas a Implementar no
Território de Intervenção da Energaia. Obtained from https://repositorio-
aberto.up.pt/handle/10216/80465
50. Rühle, S., Baker, T., & Johnston, P. (2011, Junho 9). User Guide - DCMI_MediaWiki.
Obtained 27/01/2017, from http://wiki.dublincore.org/index.php/User_Guide

55
51. Sanchez, L., Muñoz, L., Galache, J. A., Sotres, P., Santana, J. R., Gutierrez, V., … Pfisterer,
D. (2014). SmartSantander: IoT experimentation over a smart city testbed. Computer
Networks, 61, 217–238. https://doi.org/10.1016/j.bjp.2013.12.020
52. Shadbolt, N., Berners-Lee, T., & Hall, W. (2006). The Semantic Web Revisited. IEEE
Intelligent Systems, 21(3), 96–101. https://doi.org/10.1109/MIS.2006.62
53. Staab, S., & Studer, R. (Eds.). (2009). Handbook on Ontologies. Berlin, Heidelberg: Springer
Berlin Heidelberg. https://doi.org/10.1007/978-3-540-92673-3
54. van der Aalst, W. M., & Stahl, C. (2011). Modeling business processes: a petri net-oriented
approach. MIT press.
55. Wang, D., Amin, M. T., Li, S., Abdelzaher, T., Kaplan, L., Gu, S., … Le, H. (2014). Using
humans as sensors: An estimation-theoretic perspective. Em IPSN-14 Proceedings of the
13th International Symposium on Information Processing in Sensor Networks (pp. 35–
46). https://doi.org/10.1109/IPSN.2014.6846739