sarec irp 2016 response - department of energy · irp solar pv cost assumptions appear to be...
TRANSCRIPT

SAREC IRP & IEP 2016 Response Public hearings in Johannesburg and Cape Town: December 2016

Overview of SAREC response
General comments on the process, policy and structure of electricity sector
The arbitrary constraint on Renewable Energy technologies
Incorrect cost assumptions
Problematic procurement gap for renewables
Comments on the IEP
Conclusion

General points on process and policy
SAREC welcomes release IEP and IRP updates - SA guided for too long by outdated policy
However, process shortcomings of IRP make meaningful initial response difficult: ◦ Time allowed for verbal input too short for a considered public response
◦ ‘Least cost’ base case not yet achieved
◦ Tariff trajectory to assess scenario options absent
◦ Detailed scenario results not published - key appendices on learning rates, discount rate and other assumptions missing (7.3, 7.4, 7.5)

General points on process and policy
Continued high share of large power build programmes bring implementation risks associated with uncertainty: • Cost escalations, demand shifts, climate change policy...
Renewable power does not come with these risks: ◦ Private sector bears risk of delivery and cost overruns (not the electricity consumer as is the
case with Medupi, Kusile, nuclear)
◦ Modular, flexible and responsive energy mix with scalable, quick to build technologies
◦ Requires little by way of Government or Eskom capex investment

Risk Allocation
In the REIPP, opportunity cost and risk taken on entirely by the IPP By comparison, Eskom build project risk extended to tax payers Based on track record, Eskom new build costs not reflected accurately in the IRP The country has no assurance that extensive delays and cost overruns will not be repeated

Renewables must be unconstrained
Running a constrained base case does not produce a reliable ‘least cost’ outcome. Our BRICS peers are investing heavily in smart grids to absorb large amounts of RE Large quantities of transformation capacity exists - 101 197 MVA Dx, 143 440 MVA Tx1
Required grid upgrades are mostly self-funded by IPPs and included in REI4P bid costs Less large-scale transmission required for properly distributed RE (vs centralised plants) IRP model already takes network stability into account (standard model parameter) Eskom System Operator already has ability to manage grid despite variable generation However, raw unconstrained RE model outputs2 result in “boom-bust” cycles, so capacity additions have to be smoothed out.
1: Eskom Integrated Report 2016 2: Slide 29 of 22 Nov 2016 IRP update presentation
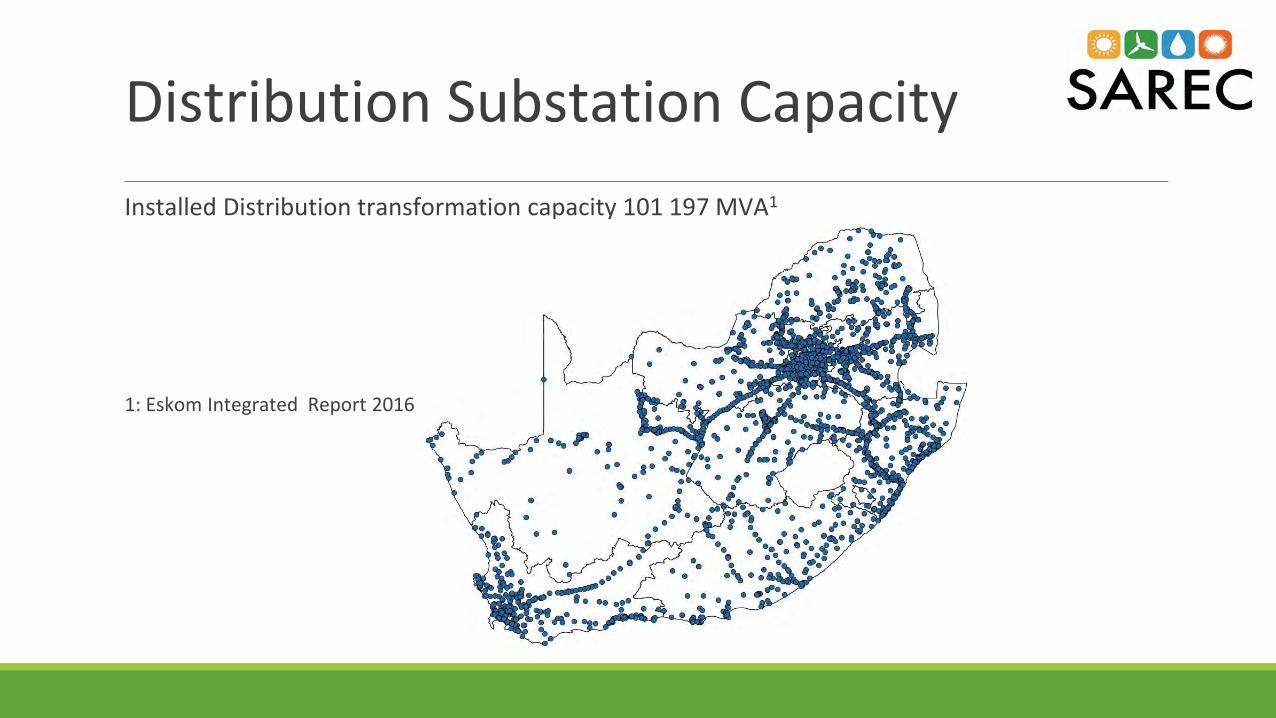
Distribution Substation Capacity Installed Distribution transformation capacity 101 197 MVA1
1: Eskom Integrated Report 2016

Transmission Substation Capacity Installed Transmission transformation capacity 143 440 MVA1
1: Eskom Integrated Report 2016

Managing the grid: System Operation
Eskom System Operator contracts various generation or demand side managed load reserves in order to balance supply and demand to maintain the stability of the national grid. These are then dispatched by National Control according to a set of rules, the types of reserves are the following:
Instantaneous reserve - available within 10 seconds. Regulating Reserve - responds within 10 sec and fully activated within 10 min Ten-minute Reserve - responds within 10 minutes Supplemental reserve- can respond in 6 hours or less Emergency reserves should be fully activated within 10 minutes.

Managing the grid: System Operation forecast
The System operator has previously contracted, and intends to contract sufficient reserves to mitigate the short and mid term variations in renewable energy productions (which can be forecasted accurately despite being weather dependent)

RE targets unambitious vs rest of world
Note Japan and Australia, similarly to SA do not have continental interconnections, yet still have high RE penetration and do not intend stopping

Electricity sector restructuring Fundamental constraints to implementation of an updated IRP:
◦ Eskom track record of flouting government electricity policy (e.g. current refusal to sign REIPPPP power purchase agreements under ministerial determinations and IRP2010)
◦ Eskom cannot be allowed to be both player and decision-maker (abuse of monopoly)
What is the point of an IRP if it will simply be ignored by Eskom later? Therefore SAREC calls for:
◦ new market structure around power procurement, build and grid expansion – if we go with grid constrained argument
◦ separation of Eskom’s generation unit from the rest, whether through an ISMO or otherwise

Inaccurate cost inputs Both solar and wind input costs do not reflect current market pricing
◦ Planning should apply most recent available market rates
◦ the IRP claims to use REIPPPP round 4 figures – the model outputs suggest otherwise
For wind the LCOE assumptions must be based on latest REIPPPP expedited round figures: ◦ 58c/kWh according to CSIR/IPP office in 2015 terms used in the IRP
◦ or 62c/kWh in 2016 if rest of IRP assumptions are updated
LCOE assumption of R0.97/kWh for nuclear dangerously optimistic, unsubstantiated1: ◦ CSIR optimistic figure (April 2016): R1.17/kWh (concurred by Rosatom)
◦ Updated EPRI report (Aug 2015): R1,50 to R1,83/kWh
R11.55/$ exchange rate assumption too low, RE impacted far less than nuclear Learning rates too conservative for renewables
◦ PV capex forecast in 2050 already achieved in large scale plants
◦ does not even capture recent rapid decline in solar panel costs 1: IRP 2016 (rev1) refers to a DoE study not published as part of the IRP, hence not open for public review

Solar PV specific cost issues PV Cost Assumptions: Capital Costs
This was submitted to Department of Energy in August 2016, and clearly not used.
Draft IRP: 2015: R17 860 ; 2050: R14 221
IRP Solar PV cost assumptions appear to be incorrect by 35 years.
Technology Size (MW)
Total plant construction costs (single axis tracker) 75 ZAR/kW (2016) [R13,500]
Total plant construction costs (single axis tracker) 50 ZAR/kW (2016) [R14,750]
Total plant construction costs (single axis tracker) 10 ZAR/kW (2016) [R17,948]
Total plant construction costs (fixed tilt, rooftop) 1 ZAR/kW (2016) [R14,000]

CO2 and water externalities Notes on CSIR graphs:
Business-as-Usual(BAU): aligned with IRP 2010, updated demand forecast, no new optimisation
Re-Optimised: least-cost re-optimisation of the widening 2020-40 demand/supply gap
Not clear if and how the IRP has quantified and incorporated CO2 and water externalities
This equates to providing free basic water to 600 000 households per annum

Problematic gap in the Base Case
from procured determinations (committed)
from IRP2016 Base Case (future procurement)
No wind in 2021-22, only 200MW in 2023, very little PV in 2021-22. Likely effects:
• Investment uncertainty • no orders for local factories • likely factory closures with associated
job losses • retards localisation efforts
(manufacturing investments)
Need stable or increasing annual policy certainty and implementation roll-out to create investment certainty, maximise localisation benefits and optimise supply chains

Comments on IEP For electricity sector, based on outdated assumptions, not aligned to IRP figures, inputs
and assumptions at all
Should only be updated AFTER IRP is complete, then re-published for public comment
PV potential much more optimistic than IRP Wind potential less optimistic than IRP
◦ The assumptions are based on the 1995 Diab Wind Atlas
◦ Several more accurate wind atlas studies have been published since
◦ Most importantly: 2014 Wind Atlas of South Africa is ignored

Conclusions
Publication of the IRP is welcomed and a least cost should be promulgated in 2017.
Public consultation process will be strengthened by 2 week extension. Least cost, rational planning has not yet been achieved.
The artificial constraint on RE needs to be removed.
Market-related cost assumptions must be applied.
Practical implementation experience of the REI4P is instructive – construction timeframes, investment attracted.
Need for power sector reform urgent and in the national interest.
