saskatchewan small business profile 2017publications.gov.sk.ca/documents/310/93239-small...
TRANSCRIPT

Saskatchewan Small Business Profile 2017
October 2017Ministry of the EconomyPerformance and Strategic Initiatives Divisionsaskatchewan.ca

Table of Contents
Introduction ............................................................................................................. 1
Key Facts ..................................................................................................................... 2
1. Business by Size .............................................................................................. 3
2. Small Business Trends: 2006 to 2016 ................................................. 5
3. Small Business Trends by Province ..................................................... 6
4. Number of Businesses by Sector ........................................................ 7
5. Regional Analysis ............................................................................................ 8
6. Employment by Business Size ............................................................... 9
7. Employment by Sector ........................................................................... 10
8. Employment by Province ....................................................................... 11
9. Self-Employment Trends: 2006-2016 ............................................. 12
10. Self-Employment by Age .................................................................... 14
11. Self-Employment by Province.......................................................... 15
12. Earnings by Sector ................................................................................... 16
13. Earnings by Province .............................................................................. 17
14. Payroll by Business Size ......................................................................... 18
15. Small Business Contribution to GDP ........................................... 19
Sources of Data ................................................................................................... 20
Saskatchewan Small Business Profile 2017 1
Small business is big business in Saskatchewan. Small businesses – businesses with fewer than 50 employees – account for over 98.8% of the more than 150,000 business enterprises in the province. They are active in virtually every sector of the economy, providing vital inputs that keep the wheels of industry turning. Small businesses are a source of innovative products and services that contribute to the quality of life we all enjoy.
In 2016, small businesses employed 31.1% of Saskatchewan’s workers, and paid out over $6.2 billion (B) in wages and salaries, which was 25.7% of the province’s total payroll. 31% of Saskatchewan’s gross domestic product (GDP) was attributed to small business. Saskatchewan ranks third among the provinces for the share of its total economic output generated by small businesses.
Small business in Saskatchewan is growing.The province consistently ranks near the top of the nation for its business environment, as reported by independent organizations like the Canadian Federation of Independent Business and the Fraser Institute. Although a downturn in the resource sector resulted in a slight decline in small businesses and small business employment in 2016, Saskatchewan’s business-friendly policies and strong economy in recent years have generally been reflected in a growing small business sector. For example, in the last five years, small business employment in the construction sector has increased by 14.1%, and employment for professional, scientific and technical services has increased by 8.1%.
Employees are sharing the gains of a prospering small business sector. Over the last 10 years, wages paid by Saskatchewan
1 The Business Register contains stratification, collection and response information for Canadian businesses. The Business Register maintains a complete, up to date and unduplicated list of all active businesses in Canada that have a corporate income tax (T2) account, are an employer or have a GST account. Industry breakdowns are based on the North American Industry Classification System (NAICS).
2 The SEPH covers employer businesses and reports on number of payroll employees and average weekly earnings. Self-employed persons who are not on payroll are not included in the SEPH data. Also not included are employees in agriculture, fishing and trapping industries, private household services, religious organizations, and military personnel of defence services.
small businesses grew by an average of 3.1%, which is the second fastest compared to other provinces. Nominal wages in 2016 were 36.1% higher than they were in 2006.
This paper briefly attempts to profile a dynamic, diverse sector of the provincial economy. It is intended to shed light on the performance of Saskatchewan small businesses and to highlight issues that policy makers and business leaders should consider to ensure the ongoing competitiveness of this vibrant economic sector.
Technical NoteIn this report, businesses are classified according to number of employees. Small businesses are classified as those with fewer than 50 employees (including business establishments that do not keep payroll employment, known as “non-employer”, or “indeterminate”), medium-sized businesses are those with 50 to 499 employees, while businesses with 500 or more employees are considered to be large enterprises.
This report looks at the role of small business establishments in Saskatchewan through recent trends. It reports on a number of key indicators, including the number of small businesses operating in Saskatchewan, the industry breakdown of small businesses, growth in small business employment, and the small business sector’s contribution to the provincial economy.
The paper also compares activities in the small business sector to medium- and large-sized enterprises. Trends in the small business sector are examined in a historical context, as well as in comparison to small businesses in other
provinces and the national average.
The main data for this report were obtained from Statistics Canada’s Business Register1 and the Survey of Employment, Payroll, and Hours (SEPH2). Other data were obtained from Statistics Canada’s Labour Force Survey and the Statistical Service of B.C. (B.C. Stats).
It is important to note a methodological change by Statistics Canada in 2014: the status of “Indeterminate” was revised to “Without employees.” This caused a shift in the categorization of approximately 70,000 businesses across Canada to the “Without Employees” category.
Introduction
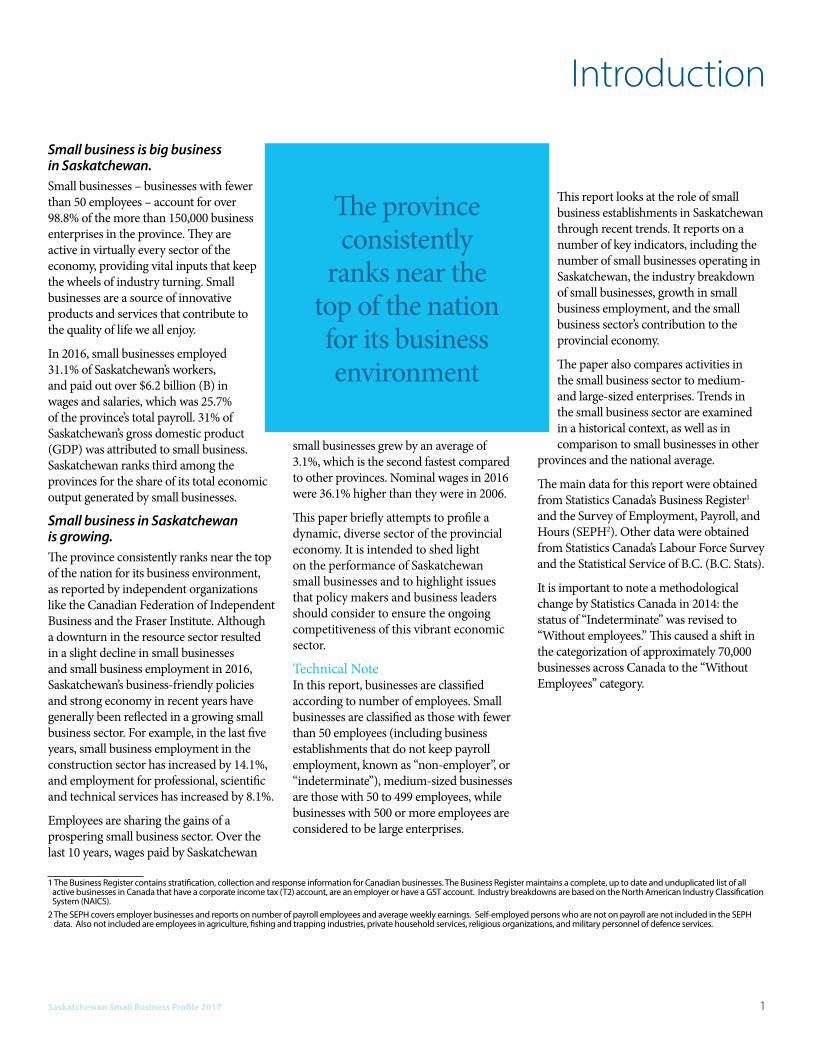
The province consistently
ranks near the top of the nation for its business environment

2 Saskatchewan Small Business Profile 2017
Key Facts
Most businesses are small businessesApproximately 99% of the businesses in Saskatchewan are small businesses. In 2016, there were over 148,500 small businesses operating in the province.
A highly productive sectorSmall businesses contributed 31% of Saskatchewan’s GDP in 2016, which ranked third in Canada.
Saskatchewan has a high concentration of small businessesThere are 129 small businesses per thousand people in Saskatchewan, which is the highest rate in the country and above the national average of 105.
A source of quality jobsOver one-quarter of Saskatchewan’s payroll earnings are from small businesses. Earnings of small business employees in Saskatchewan are the third highest in Canada, and have the second highest growth rate among the provinces.
Photo credit: Hillberg & Berk
“Saskatchewan’s economy supports fast-growing companies like mine.”
- Rachel Mielke, founder and CEO of Hillberg & Berk
Saskatchewan Small Business Profile 2017 3
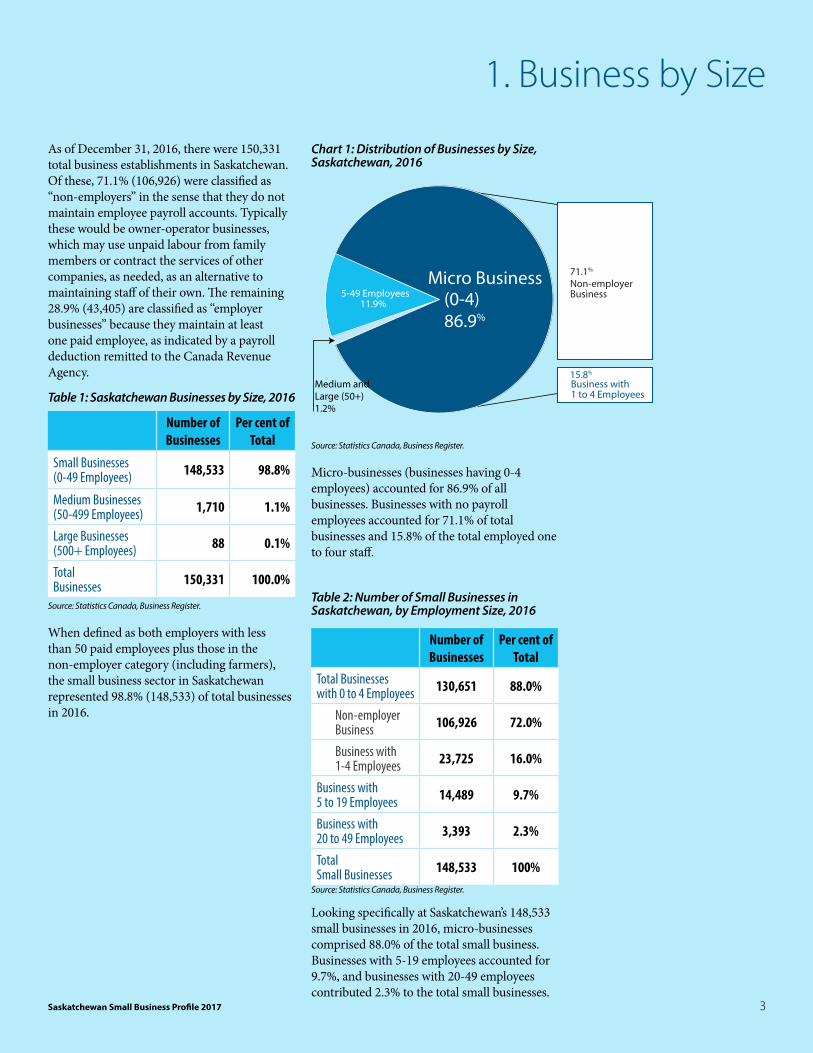
As of December 31, 2016, there were 150,331 total business establishments in Saskatchewan. Of these, 71.1% (106,926) were classified as “non-employers” in the sense that they do not maintain employee payroll accounts. Typically these would be owner-operator businesses, which may use unpaid labour from family members or contract the services of other companies, as needed, as an alternative to maintaining staff of their own. The remaining 28.9% (43,405) are classified as “employer businesses” because they maintain at least one paid employee, as indicated by a payroll deduction remitted to the Canada Revenue Agency.
Table 1: Saskatchewan Businesses by Size, 2016
Number of Businesses
Per cent of Total
Small Businesses (0-49 Employees) 148,533 98.8%
Medium Businesses (50-499 Employees) 1,710 1.1%
Large Businesses (500+ Employees) 88 0.1%
Total Businesses 150,331 100.0%
Source: Statistics Canada, Business Register.
When defined as both employers with less than 50 paid employees plus those in the non-employer category (including farmers), the small business sector in Saskatchewan represented 98.8% (148,533) of total businesses in 2016.
Chart 1: Distribution of Businesses by Size, Saskatchewan, 2016
Medium and Large (50+) 1.2%
5-49 Employees11.9%
Non-employer Business
71.1%
Business with1 to 4 Employees
15.8%
Micro Business (0-4)86.9%
Source: Statistics Canada, Business Register.
Micro-businesses (businesses having 0-4 employees) accounted for 86.9% of all businesses. Businesses with no payroll employees accounted for 71.1% of total businesses and 15.8% of the total employed one to four staff.
Table 2: Number of Small Businesses in Saskatchewan, by Employment Size, 2016
Number of Businesses
Per cent of Total
Total Businesses with 0 to 4 Employees 130,651 88.0%
Non-employer Business 106,926 72.0%
Business with 1-4 Employees 23,725 16.0%
Business with 5 to 19 Employees 14,489 9.7%
Business with 20 to 49 Employees 3,393 2.3%
Total Small Businesses 148,533 100%
Source: Statistics Canada, Business Register.
Looking specifically at Saskatchewan’s 148,533 small businesses in 2016, micro-businesses comprised 88.0% of the total small business. Businesses with 5-19 employees accounted for 9.7%, and businesses with 20-49 employees contributed 2.3% to the total small businesses.
1. Business by Size

Inter-Provincial Comparisons – Business CountAs of December 31, 2016, there were 3.9 million (M) business establishments in Canada. Of these, more than half (58.9%) were located in Ontario and Québec, and 35.8% were in the western provinces. The remaining 5.3% were spread among the Atlantic provinces (5.0%) and the territories (0.3%). In each of the provinces, more than 97.9% of businesses had fewer than 50 employees.
4 Saskatchewan Small Business Profile 2017
Chart 2: Small Businesses Per 1,000 Population by Province, 2016
129 124 121
102 102 9989
81 80 75
0
20
40
60
80
100
120
140
SK AB BC PE ON QC MB NS NL NB
Source: Statistics Canada, Business Register. Note: All accounts for Canada include the numbers of businesses for the Northwest Territories, the Yukon, and Nunavut.
Saskatchewan has the highest per capita count of small business establishments among Canadian provinces, with a rate of 129 businesses per 1,000 people. The national average was 105 per 1,000 population. The large agriculture sector in Saskatchewan is part of the reason for Saskatchewan’s high small business count. In 2016 there were 39,047 businesses in the agriculture sector, of which 39,035 were small businesses.

Saskatchewan Small Business Profile 2017 5
As of 2015, incorporated companies that show a minimum of $30,000 in revenue (taxable or non-taxable) without payroll employees are considered non-employer businesses. This methodological change by Statistics Canada dramatically shifted the number of non-employer businesses compared to previous years. The number of small businesses in Saskatchewan was up by 56,302 (+61.0%) in 2016, compared to 2006, but it is not clear how much of the growth is a result of methodological changes and how much is the actual increase in the number of non-employer businesses. Most of the growth occurred in small businesses with no payroll employees (+51,643), as a consequence of the change in methodology, while those with payroll employees increased by a smaller amount (+4,659 or 12.6%).
Chart 3: Breakdown of Employer/Non-Employer Small Businesses, Saskatchewan, 2012-2016
38% 38% 29% 28% 28%
62% 62%
71% 72% 72%
-10,000
10,000
30,000
50,000
70,000
90,000
110,000
130,000
150,000
2012 2013 2014 2015 2016
Small Businesses with Employees Non-Employer Small Businesses
Source: Statistics Canada, Business Register.
From 2015 to 2016, the number of small businesses decreased by 0.8% (-1,231), with a loss in employer businesses (-108) and a loss in non-employer businesses (-1,170). Between 2006 and 2016, the increase of 61.0% in the number of small businesses can be explained by the shift caused by the change in methodology for the non-employer businesses (+93.4%), together with an increase in employer businesses (+12.6%). Medium-sized enterprises increased by 7.8% (+124), and the number of large enterprises remained the same during this period3.
Table 3: Changes in Total Business Count
% change 2015-16
% change 2006-16
Non-Employer -1.1% 93.4%Small (1-49) -0.1% 12.6%Medium (50-499) -2.7% 7.8%Large (500+) 0.0% 0.0%Total all Small Business(0-49) -0.8% 61.0%
Source: Statistics Canada, Business Register.
3 Changes in business count do not necessarily indicate the true number of new or discontinued businesses. Some businesses may move between size categories as they reduce or increase staff, adding to the count in the new category, and simultaneously reducing the count in the old category.
2. Small Business Trends: 2006 to 2016

6 Saskatchewan Small Business Profile 2017
Saskatchewan had 41,607 small business establishments with payroll employees in 2016, which represented 3.4% of the 1.2M small employer establishments in Canada, and 9.5% of those in Western Canada (439,724). Saskatchewan’s share was fifth-highest in Canada.
The number of Saskatchewan small businesses with payroll employees decreased by 0.1% in the 2015-2016 period, which was sixth among Canadian provinces, and below the Canadian average of a 0.9% increase. During the 10-year period 2006-2016, the number of small employer businesses in Saskatchewan grew by 12.6%, which was the sixth-highest growth rate in Canada and below the Canadian average (+19.6%).
Chart 4: Growth in Small Businesses with Payroll Employees, Canada and Provinces, 2015-2016
PE2.3%
ON2.1%
BC1.9%
MB1.1%
QC0.0%
SK-0.1%
NB-0.2%
NS-0.6%
NL-1.2%
AB-1.3%
Canada 0.9%
-1.5%
-1.0%
-0.5%
0.0%
0.5%
1.0%
1.5%
2.0%
2.5%
3.0%
Source: Statistics Canada, Business Register.
In 2016, there were 36 small businesses with payroll employees per 1,000 population in Saskatchewan, compared to the national average of 33 businesses per 1,000 population.
3. Small Business Trends by Province

Saskatchewan Small Business Profile 2017 7
In 2016, there were more small businesses in Saskatchewan’s agriculture sector (39,047) than in any other sector of the economy. The agriculture sector4 accounted for 12.3% of employer small businesses (5,123) and 31.7% of non-employer businesses (33,912).
Goods-producing industries comprise 41.9% of all the small businesses in Saskatchewan. This is largely due to the fact that
the largest individual sector, agriculture, accounts for 28.6% of all small businesses in Saskatchewan. Finance, insurance and real estate (19.6%) represents the highest percentage of small businesses in the service sector.
After agriculture, finance, insurance and real estate, and business services held the next highest share of non-employer small businesses, with 24.5% and 9.0% of the total, respectively. Wholesale and retail trade had the highest share of small businesses with payroll employees (16.9%).
4 The agriculture sector includes agriculture, forestry, fishing and hunting, as well as related support activities.
4. Number of Businesses by Sector
Chart 5: Industry Distribution of Saskatchewan Small Businesses (0-49 Employees), 2016
Agriculture28.6%
Mining and Oil & Gas Extraction 1.9%Manufacturing1.3%Construction10.0%
Utilities 0.1%Transportation and Warehousing 4.9%Wholesale and Retail Trade
7.9%
Finance, Insurance and Real Estate19.6%
Education Services0.7%
Health and Social 4.8%
Accommodation Services2.5%
Business Services and Food9.5%
Other8.5%
Goods Services Other
Source: Statistics Canada, Business Register.
Chart 6: Comparison of Non-employer and Employer Small Businesses, 2016
0% 10% 20% 30% 40%
Utilities
Education Services
Manufacturing
Accommodation and Food
Mining and Oil & Gas Extraction
Health and Social Services
Wholesale and Retail Trade
Transportation and Warehousing
Other
Construction
Business Services
Finance, Insurance and Real Estate
Agriculture
Non-employer Businesses
Small Employer Businesses
Source: Statistics Canada, Business Register.
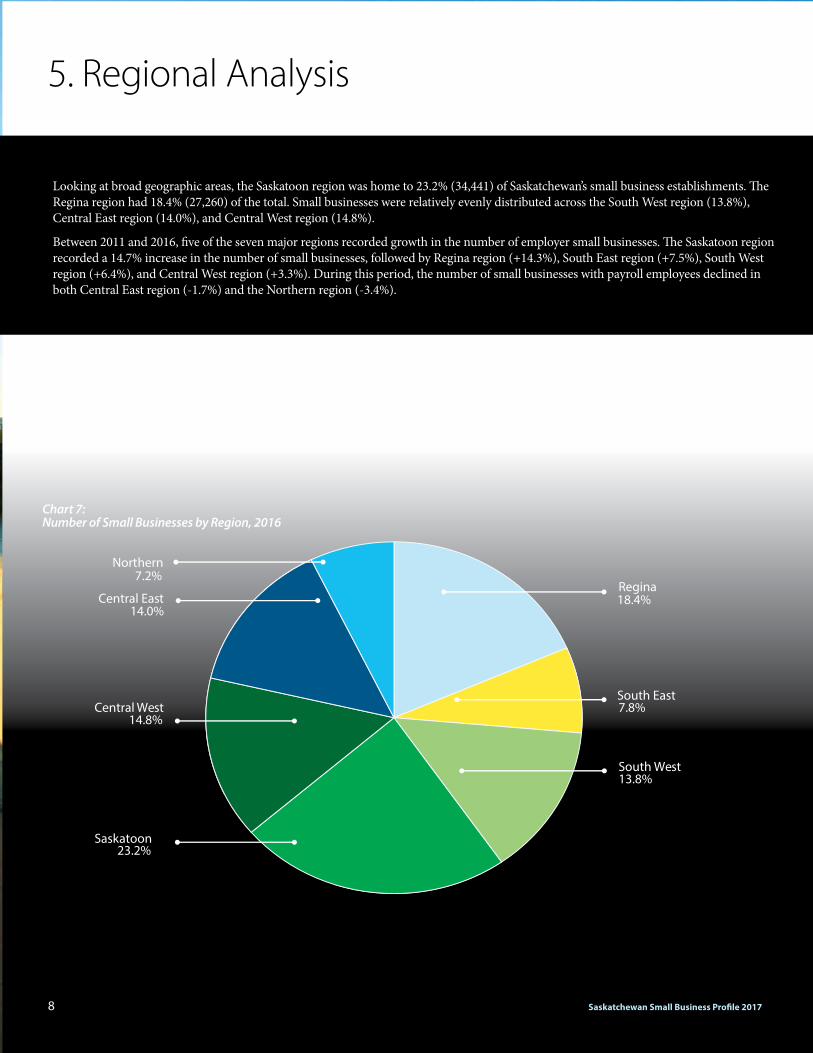
Northern7.2%
Central East14.0%
Central West14.8%
Saskatoon23.2%
Regina18.4%
South East7.8%
South West13.8%
Chart 7: Number of Small Businesses by Region, 2016
8 Saskatchewan Small Business Profile 2017
Looking at broad geographic areas, the Saskatoon region was home to 23.2% (34,441) of Saskatchewan’s small business establishments. The Regina region had 18.4% (27,260) of the total. Small businesses were relatively evenly distributed across the South West region (13.8%), Central East region (14.0%), and Central West region (14.8%).
Between 2011 and 2016, five of the seven major regions recorded growth in the number of employer small businesses. The Saskatoon region recorded a 14.7% increase in the number of small businesses, followed by Regina region (+14.3%), South East region (+7.5%), South West region (+6.4%), and Central West region (+3.3%). During this period, the number of small businesses with payroll employees declined in both Central East region (-1.7%) and the Northern region (-3.4%).
5. Regional Analysis

Saskatchewan Small Business Profile 2017 9
According to the Survey of Employment, Payroll and Hours (SEPH) data, in 2016, 470,735 employees were on payroll in Saskatchewan. Although large enterprises only comprise 0.1% of Saskatchewan businesses, they employ 47.1% of all employees (221,616). Small enterprises employ 31.1% (146,576) of the total, and medium-sized enterprises employ 21.8% (102,543).
Distribution of Saskatchewan Employment by Size of Business, 2016Source: Survey of Employment, Payroll and Hours.
Between 2006 and 2016, the small business share of total employees declined slightly from 32.4% to 31.1%. During the same period, the share of total employees associated with large enterprises declined from 47.5% to 47.1%, while medium-sized businesses’ share of total employment increased from 20.1% to 21.8%.
Small businesses were responsible for 14,770 net new jobs between 2006 and 2016. Enterprises with 20-49 employees (+7,219) were responsible for most of the jobs created by the small business sector. The number of jobs in medium-sized businesses went up by 20,716 between 2006 and 2016.
Between 2015 and 2016, payroll employment decreased among small businesses (-3,208), large businesses (-2,102), and medium-sized businesses (-873). Overall, payroll employment was down by 6,183 (-1.3%) from 2015 to 2016.
Table 5: Number of Employees by Business Size, 2006 to 2016
2006 2015 2016 change 2015-16
%change2015-16
change2006-16
%change2006-16
All Sizes 406,615 476,918 470,735 -6,183 -1.3% 64,120 15.8%
Small (0-49) 131,806 149,784 146,576 -3,208 -2.1% 14,770 11.2%
Medium (50-499) 81,827 103,416 102,543 -873 -0.8% 20,716 25.3%
Large (500+) 192,982 223,718 221,616 -2,102 -0.9% 28,634 14.8%Source: Statistics Canada, CANSIM Table 281-0042.Note that self-employed persons who are not on payroll are not included. Also not included are employees in agriculture, fishing and trapping industries, private household services, religious organizations, and military personnel of defence services.
6. Employment by Business Size
Table 4: Share of Payroll Employees, 2016
% change2015-16
% change2006-16
Share2016
Share2006
Small (0-49) -2.1% 11.2% 31.1% 32.4%
Medium (50-499) -0.8% 25.3% 21.8% 20.1%
Large (500+) -0.9% 14.8% 47.1% 47.5%Source: Survey of Employment, Payrolls and Hours (SEPH).
0 - 4 Employees 6.3%5 - 9 Employees 14.5%20 - 49 Employees 10.4%
50 - 99 Employees 7.7%100 - 299 Employees 10.7%300 - 499 Employees 3.4%
Large Businesses: 47.1%
Medium Businesses: 21.8%
Small Businesses: 31.1%
500+ Employees 47.1%

10 Saskatchewan Small Business Profile 2017
In 2016, five industry sectors had the majority of their workers employed by small businesses. These sectors included other services5 (73.7%), construction (63.0%), real estate and rental and leasing (62.2%), professional, scientific and technical services (56.1%), and accommodation and food services (55.9%).
In another three sectors, at least one-third of the work force was employed by small enterprises: administrative and support (38.5%), transportation and warehousing (34.0%), and retail trade (33.6%).
Since 2011 the sectors with the highest percentage employment growth have been construction (+14.1%), public administration (+11.9%), accommodation and food services (+10.9%), professional, scientific and technical services (+8.1%), and educational services (+7.6%). The sectors with the largest employment loses have been and mining and oil and gas extraction (-13.0%), wholesale trade (-10.8%), manufacturing (-6.1%), finance and insurance (-3.8%) and retail trade (-2.9%).Chart 8: Saskatchewan Small Business Employment Change, Top and Bottom Five Sectors, 2011-2016
5 Other Services includes repair & maintenance, personal & laundry services, religious, grant-making, civic & professional and related organizations, and private households.
7. Employment by Sector
-13.0%
-10.8%
-6.1%
-3.8%
-2.9%
7.6%
8.1%
10.9%
11.9%
14.1%
-20% -10% 0% 10% 20%
Mining and Oil and Gas Extraction
Wholesale Trade
Manufacturing
Finance and Insurance
Retail Trade
Educational Services
Professional, Scienti�c and Technical Services
Accommodation and Food Services
Public Administration
Construction
Source: Statistics Canada, CANSIM Table 281-0042.

8. Employment by Province
Saskatchewan Small Business Profile 2017 11
In 2016, there were 4.9M small business employees in Canada. Ontario had 1.8M small business employees, or 35.9% of the Canadian total. B.C. (761,457) and Alberta (611,720) were home to 15.5% and 12.5% of Canadian small business employees, respectively. Small enterprises in Manitoba employed 166,570 (3.4% of the national total), and there were 146,576 employees in Saskatchewan small businesses (3.0% of the national total). Together, the four western provinces had almost 1.7M small business employees in 2016, or 34.4% of the Canadian total.
In Saskatchewan, the small business sector’s share of provincial payroll employment was 31.1% in 2016, just below the national average (31.3%). B.C., at 36.6%, had the highest proportion of payroll employment derived from small businesses, followed by P.E.I. (33.2%), Québec (32.9%), and New Brunswick (32.3%). Nova Scotia had the lowest share at 28.4%. Saskatchewan ranked sixth among the provinces in terms of the proportion of employment derived from small businesses.
Among the provinces, Saskatchewan had the sixth-highest growth rate in small business employment between 2006 and 2016. Small business jobs in Saskatchewan grew, on average, by 1.1% per year, ahead of P.E.I (+0.4%), Nova Scotia (+0.3%), Québec (+0.2%), and New Brunswick (+0.2%). For western provinces, small business employment grew in Manitoba by 1.4%, B.C. by 1.3%, and Alberta by 1.2% per year, on average. The national average was 1.0%.
Chart 9: Small Business Payroll Employment Average Annual Growth Rate, 2006-2016
1.4% 1.4% 1.3% 1.3% 1.2% 1.1% 0.4% 0.3% 0.2% 0.2%
Canada 1.0%
0.0%
0.2%
0.4%
0.6%
0.8%
1.0%
1.2%
1.4%
1.6%
ON MB NL BC AB SK PE NS QC NBSource: Statistics Canada, CANSIM Table 281-0042.
Source: Statistics Canada, CANSIM Table 281-0042.

12 Saskatchewan Small Business Profile 2017
Statistics Canada’s Labour Force Survey identifies self-employed workers as working owners of a business, persons who work on their own account but do not have a business, and persons working without pay in a family business. The data include farmers6.
In 2016, the number of self-employed (including farmers) accounted for 18.4% of total employment in Saskatchewan. This is down from 27.0% of total employment in 1986, and 19.5% in 2006.
The number of self-employed workers increased by 9,000 (9.4%) from 95,800 in 2006 to 104,800 in 2016. The number of self-employed increased by 300 people from 2015 to 2016.
Chart 10: Saskatchewan Self-Employment, 2006-2016
16.0%
17.0%
18.0%
19.0%
20.0%
21.0%
22.0%
80
85
90
95
100
105
2006 2007 2008 2009 2010 2011 2012 2013 2014 2015 2016
('000
s)
Self Employment % of Total EmploymentSource: Statistics Canada, Labour Force Survey.
6 Self-employed businesses can be operated as an unincorporated or incorporated entity and within each of these categories can be further classified as operating with paid help or without paid help. Another category of self-employed workers consists of unpaid members of family businesses. This produces five categories of self-employed workers in the province.
9. Self-Employment Trends: 2006-2016

Saskatchewan Small Business Profile 2017 13
The net increase of 9,000 in the number of self-employed people in Saskatchewan between 2006 and 2016 is due to the gain of 14,700 self-employed people in the non-agriculture sectors coinciding with a loss of 5,700 people in agriculture sector.
Chart 11: Saskatchewan Self-Employment, Agriculture versus Non-Agriculture, 2006-2016
56.8 58 60.3 65.1 67 67.1 69.8 71.5 75.1 71.2 71.5
39 35.9 34.7 34.6 35.7 32.3 33.3 35.9 35.6 33.3 33.3
0
20
40
60
80
100
120
2006 2007 2008 2009 2010 2011 2012 2013 2014 2015 2016
('000
s)
Non-Agriculture AgricultureSource: Statistics Canada, Labour Force Survey
Self-employed people tend to work more hours than workers employed by other people. In 2016, 39.8% of self-employed workers worked more than 50 hours per week, compared to just 4.8% of employees.
Chart 12: Hours Worked (per week), Self-Employed vs. Employees, Saskatchewan, 2016
20.1%
11.9%
28.2%
39.8%
17.4%
25.6%
52.2%
4.8%
1-29 hours
30-39 hours
40-49 hours
50+ hours
Self-employed Employees
Source: Statistics Canada, Labour Force Survey.
14 Saskatchewan Small Business Profile 2017
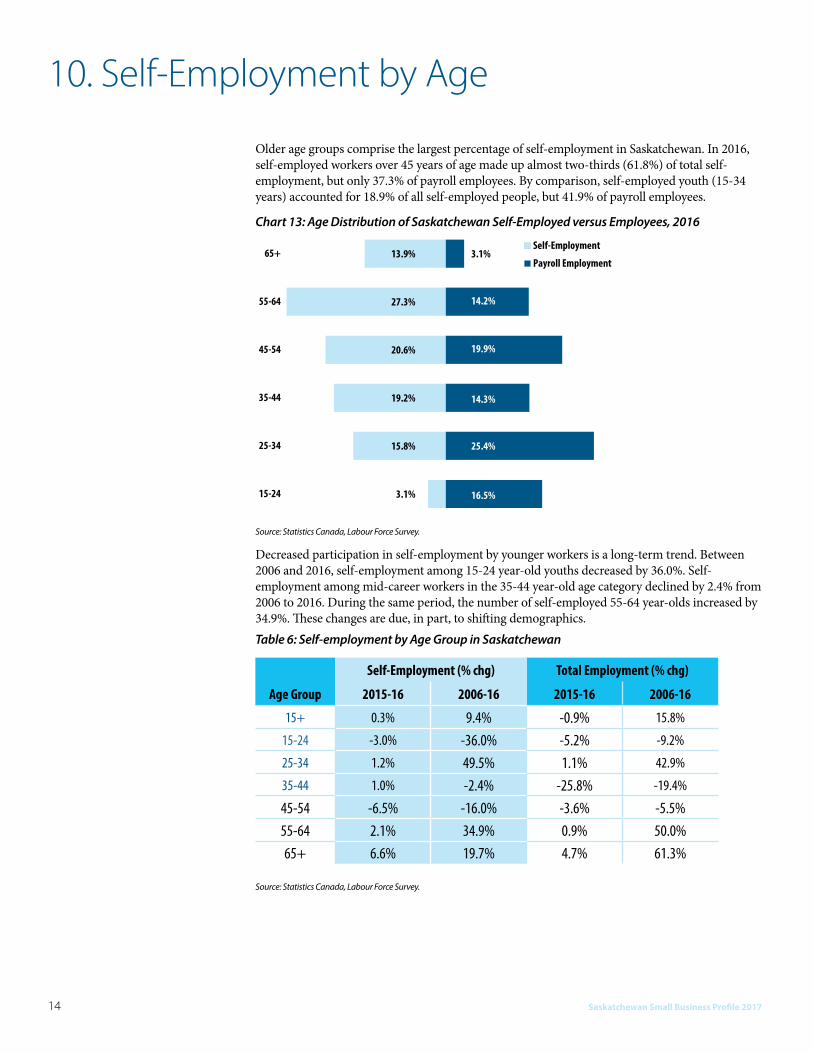
Older age groups comprise the largest percentage of self-employment in Saskatchewan. In 2016, self-employed workers over 45 years of age made up almost two-thirds (61.8%) of total self-employment, but only 37.3% of payroll employees. By comparison, self-employed youth (15-34 years) accounted for 18.9% of all self-employed people, but 41.9% of payroll employees.
Chart 13: Age Distribution of Saskatchewan Self-Employed versus Employees, 2016
3.1%
15.8%
19.2%
20.6%
27.3%
13.9%
16.5%
25.4%
14.3%
19.9%
14.2%
3.1%
15-24
25-34
35-44
45-54
55-64
65+Self-Employment
Payroll Employment
Source: Statistics Canada, Labour Force Survey.
Decreased participation in self-employment by younger workers is a long-term trend. Between 2006 and 2016, self-employment among 15-24 year-old youths decreased by 36.0%. Self-employment among mid-career workers in the 35-44 year-old age category declined by 2.4% from 2006 to 2016. During the same period, the number of self-employed 55-64 year-olds increased by 34.9%. These changes are due, in part, to shifting demographics. Table 6: Self-employment by Age Group in Saskatchewan
Self-Employment (% chg) Total Employment (% chg)
Age Group 2015-16 2006-16 2015-16 2006-16
15+ 0.3% 9.4% -0.9% 15.8%
15-24 -3.0% -36.0% -5.2% -9.2%
25-34 1.2% 49.5% 1.1% 42.9%
35-44 1.0% -2.4% -25.8% -19.4%
45-54 -6.5% -16.0% -3.6% -5.5%55-64 2.1% 34.9% 0.9% 50.0%65+ 6.6% 19.7% 4.7% 61.3%
Source: Statistics Canada, Labour Force Survey.
10. Self-Employment by Age

Saskatchewan Small Business Profile 2017 15
In 2016, Saskatchewan had a total of 104,800 self-employed persons, the fifth-largest number in Canada, ahead of Manitoba and the four Atlantic provinces.
Compared to other provinces, Saskatchewan had the largest proportion of self-employed individuals in the workforce, at 18.4%. This exceeded the national average of 15.3%. B.C. (17.7%), Alberta (16.5%), and Ontario (15.7%) also exceeded the national average.
For the non-agricultural sector, 13.6% of total employment was self-employed in Saskatchewan, behind B.C. (17.4%), Alberta (15.2%), and Ontario (15.2%). Virtually all of Newfoundland and Labrador’s self-employment was in the non-agricultural sector so there is no difference between total self-employment and non-agricultural self-employment.
Chart 14: Self Employment as % of Total Employment, 2016
18.4
%
17.7
%
16.5
%
15.7
%
14.4
%
13.6
%
13.4
%
13.1
%
12.3
%
9.8%
13.6
%
17.4
%
15.2
%
15.2
%
13.2
%
11.5
%
12.9
%
12.9
%
11.9
%
9.8%
Canada All Sectors 15.3%
6.0%
8.0%
10.0%
12.0%
14.0%
16.0%
18.0%
20.0%
SK BC AB ON PE MB QC NS NB NL
All Sectors Non-agriculture Sectors
Source: Statistics Canada, Labour Force Survey.
11. Self-Employment by Province
Compared to other provinces, Saskatchewan
had the largest proportion of self-employed
individuals in the workforce

16 Saskatchewan Small Business Profile 2017
In 2016, small business employees in the mining, oil and gas extraction sector ($1,319), finance and insurance ($1,174), wholesale trade ($1,085), construction ($1,068), transportation and warehousing ($974), manufacturing ($967), public administration ($855), and real estate and rental and leasing ($848) had higher average weekly earnings than the Saskatchewan average for all small businesses ($816).
At the other end of the scale, small business employees in arts, entertainment and recreation ($445), educational services ($602), retail trade ($664), healthcare and social assistance ($769), administrative and support ($770) and other services ($783) earned below the provincial average in 2016.
12. Earnings by Sector
$1,319
$1,174
$1,085
$1,068
$974
$967
$855
$848
$783
$770
$769
$664
$602
$445
$0 $500 $1,000 $1,500
Mining and Oil & Gas
Finance & Insurance
Wholesale Trade
Construction
Transportation & Warehousing
Manufacturing
Public Administration
Real Estate, Rental & Leasing
Other Services
Administrative & Support
Healthcare & Social Assistance
Retail Trade
Educational Services
Arts, Entertainment & Recreation
Chart 15: Saskatchewan Small Business Average Weekly Earnings by Sector, 2016 (Industrial Aggregate $816)Source: Statistics Canada, CANSIM Table 281-0044.

Saskatchewan Small Business Profile 2017 17
In 2016, average weekly earnings in Saskatchewan’s small businesses were, at $816, the third -highest in Canada. Small business earnings in Saskatchewan were about 0.9% higher than the Canadian average ($809).
In Saskatchewan, small business employee earnings grew, on average, by 3.1% per year between 2006 and 2016, the second-highest growth rate in Canada. The national average was 2.0% per year. Small business employee earnings in six provinces grew at or above the national growth rate.
Chart 16: Small Business Average Weekly Earnings (Average Annual Growth Rate), 2006-2016
3.2% 3.1% 2.4% 2.4% 2.2% 2.0% 1.9% 1.9% 1.9% 1.8%
Canada 2.0%
0.0%
1.0%
2.0%
3.0%
4.0%
NL SK AB MB PE NS NB BC QC ONSource: Statistics Canada, CANSIM Table 281-0044
In absolute terms, the largest increase in average weekly earnings for small businesses between 2006 and 2016 occurred in Saskatchewan ($217). Newfoundland and Labrador ($211) and Alberta ($201) ranked second and third, respectively. New Brunswick ($121) had the smallest increase among the 10 provinces.
Small business employees working in Alberta earned the most in 2016, at $945 per week, followed by Ontario at $841 and Saskatchewan at $816. Small business employees in P.E.I. received the lowest weekly earnings, at $673 on average, in 2016.
13. Earnings by Province

18 Saskatchewan Small Business Profile 2017
In 2016, small businesses paid out approximately $6.2B in payroll and accounted for 25.7% of the total wages and salaries paid to workers in Saskatchewan. B.C., at 32.1%, had the highest proportion of payroll attributed to small businesses, followed by P.E.I. at 27.3%. The national average stood at 26.5%. Saskatchewan’s share was the fifth-highest in Canada.
Chart 17: Small Business Sector’s Share of Total Provincial Payroll, 2016
32.1
%
27.3
%
26.8
%
26.7
%
25.7
%
25.5
%
25.0
%
24.3
%
24.0
%
23.4
%
Canada 26.5%
20.0%
22.0%
24.0%
26.0%
28.0%
30.0%
32.0%
34.0%
BC PE QC AB SK NB ON NS MB NL
Source: Statistics Canada, CANSIM Table 281-0044
Micro-businesses, businesses with fewer than five employees, accounted for $1.3B or 5.6% of the total, whereas businesses with 5-19 employees had a payroll of $2.8B or 11.6% of the total. Those with 20-49 employees paid out $2.1B or 8.5% of the total payroll.
In 2016, large businesses (500 or more employees) accounted for more than half of the total payroll (53.9% or $13.0B), while medium-sized businesses (50-499 employees) accounted for 21.0% or $5.1B of the total.
14. Payroll by Business Size

Saskatchewan Small Business Profile 2017 19
Small businesses contribute to the provincial economy as producers of goods and services, as consumers, and as employers.
In 2016, small businesses accounted for 31% of Saskatchewan’s GDP.7 From 2006 to 2016, small business GDP for Saskatchewan exceeded or matched the corresponding national average nine times. The Canadian average was estimated to be 31% in 2016.
Chart 18: Small Business Contribution to GDP, 2016
35% 34% 31% 30% 29% 28% 28% 27% 25% 25%
Canada 31%
10%
15%
20%
25%
30%
35%
40%
AB BC SK QC PE ON MB NS NB NL
Source: Statistical Service of British Columbia.
7 B.C. Stats has developed a method to determine the contribution of small businesses to GDP, using the income-based approach of the System of National Accounts. B.C. Stats’ definition of “small business” covers businesses with fewer than 50 employees, plus those operated by the self-employed.
15. Small Business Contribution to GDP
In 2016, small businesses accounted
for 31% of Saskatchewan’s GDP.

Sources of DataStatistics Canada defines “businesses” as different types of organization from both the public and private sectors, such as a corporation, a self-employed individual, a government entity, a non-profit organization, a partnership, or financial fund. A business is viewed as an integrated structure composed of legal and non-legal operating units, and is assigned a NAICS code.
Statistics Canada, Business Register, Business Establishment Counts, Canada and Provinces, NAICS, End-of-Year Business Count.
Statistics Canada, CANSIM Table 281-0042 - Employment by Enterprise SEPH for all Employees, for selected industries classified using the NAICS, Annual (Persons).
Statistics Canada, CANSIM Table 281-0044 - Average Weekly Earnings by Enterprise SEPH for all Employees, for selected industries classified using the NAICS, Annual (Dollars).
Statistics Canada, LFS, Employment by Class of Worker, Public and Private Sector, Employees and Self-Employed, Sex, Industry, Canada, Provinces, Annual Average.
Statistics Canada, Survey of Suppliers of Business Financing.
Statistical Service of B.C., Small Business Contribution to GDP Estimates based on income-based approach of the System of National Accounts.
For more information, please contact us:Saskatchewan Ministry of the Economy
Performance and Strategic Initiatives Division219 Robin Crescent
Saskatoon, Saskatchewan S7L 6M8Ph: 306-933-7200Fax: 306-933-8244