saskia penelope gütter - university of st. gallenfile/dis4276.pdf · lean practices in...
TRANSCRIPT
Lean Practices in Pharmaceutical Manufacturing - An empirical investigation
DISSERTATION
of the University of St.Gallen,
School of Management,
Economics, Law, Social Sciences
and International Affairs
to obtain the title of
Doctor of Philosophy in Management
submitted by
Saskia Penelope Gütter
from
Germany
Approved on the application of
Prof. Dr. Thomas Friedli
and
Prof. Dr. Oliver Gassmann
Dissertation No. 4276
Difo-Druck GmbH, Bamberg 2014

The University of St.Gallen, School of Management, Economics, Law, Social
Science and International Affaires hereby consents to the printing of the present
dissertation, without hereby expressing any opinion on the views herein expressed.
St.Gallen, May 19, 2014
The President:
Prof. Dr. Thomas Bieger

Vorwort
Die vorliegende Dissertation entstand während meiner Tätigkeit als
wissenschaftliche Mitarbeiterin am Lehrstuhl für Produktionsmanagement des
Instituts für Technologiemanagement der Universität St.Gallen. Von 2009 bis 2012
hatte ich die Gelegenheit, im Rahmen zahlreicher Beratungs- und
Forschungsprojekte Einblick in das Management produzierender Unternehmen
verschiedenster Industrien zu nehmen und so mein Wissen und meinen Horizont zu
erweitern.
Mein besonderer Dank gilt meinem Mann, Rudolf Gütter, und seiner unermüdlichen
Geduld. Seine Motivation und Unterstützung haben mir den nötigen Rückhalt für
die Beendigung dieser Arbeit gegeben.
Bedanken möchte ich mich auch bei meiner Familie, insbesondere meiner Mutter,
die mich während meiner gesamten Studienzeit unterstützt und ermutigt hat.
Mein weiterer Dank gebührt meinem Doktorvater Prof. Dr. Thomas Friedli, der
mich mit seinen Ideen und seinem Fachwissen unterstützt und mir ein freies und
eigenständiges Arbeiten in vielen interessanten Projekten ermöglicht hat. Herrn
Prof. Dr. Oliver Gassmann danke ich für die Übernahme des Korreferates.
Franziska Ebert, Maria Fischl, Andreas Hinz, Andreas Mundt, Maike Scherrer,
Simone Thomas, Stefan Thomas und Caroline Ubieto sind neben Arbeitskollegen
und Diskussionspartnern gute Freunde geworden und haben die Jahre in St.Gallen
zu einer unvergesslichen Zeit gemacht. Dies gilt ebenso Roman Frick, Weini Zhang
und Renate Policzer. Meinen Kollegen am Lehrstuhl möchte ich für inspirierende
Diskussionen und ein einzigartiges Arbeitsumfeld danken.
Saskia Gütter
Januar 2014

Abstract
In recent years pharmaceutical companies faced a lot of changes in their business
environment. Especially the newly arisen cost pressure forces them to focus more
on manufacturing than they were used to. They are in the good position that other
industries already had the same experience. Adequate tools have been developed
which they can adapt to their own environment. A lot of studies exist which explain
and analyse these tools mainly under the term lean production. Lean production is
composed of different lean practices and their implementation supports a plant’s
success in manufacturing. Even if a lot of research has been done, researchers do
not have a common understanding of the topic and different models and approaches
exist. Especially the relations between the single lean practices are not analysed in
detail. Further, their interaction with different production strategies is unclear.
Therefore, identifying production strategies in pharmaceutical manufacturing and
based thereon analysing the level of lean implementation and the relations between
single lean practices is the subject of this research.
Based on literature a map of relations between lean practices is drawn. It serves as a
foundation for identifying the influence of single lean practices on each other. A
quantitative analysis with a sample of 208 sites identifies 17 lean practices used in
pharmaceutical manufacturing. Further, four strategic groups are developed each
focusing on a different set of the competitive priorities delivery, flexibility, costs,
and quality. These strategic groups are empirically analysed to understand how they
differ concerning the 17 lean practices. The general level of implementation is
investigated per group. Within the groups the practices are tested for differences in
implementation level to find those practices that are most relevant. In a last step, the
correlations between the practices in a group are calculated and filled into the map
of relations.
The results show that the implementation of lean practices depends on the strategic
goals of a production site. Independent from the strategic group, lean practices are
highly related and therefore should not be implemented separately. This research
contributes to theory by linking production strategy to the process of lean
implementation in pharmaceutical manufacturing. It provides a comprehensive
overview of relations between lean practices and offers an approach on how to
decide which practices to implement. These findings provide guidance for managers
facing lean implementation.

Zusammenfassung
Das Umfeld pharmazeutischer Unternehmen hat sich stark verändert. Vor allem der
entstandene Kostendruck zwingt sie, sich mehr als bisher auf den
Produktionsbereich zu fokussieren. Sie können dabei auf Erfahrungen anderer
Branchen zurückgreifen und müssen dort entwickelte Tools nur anpassen. Viele
Studien erklären und analysieren diese Tools unter dem Begriff Lean Production. Er
vereint verschiedene Lean Praktiken, deren Umsetzung den Produktionserfolg
fördert. Trotz intensiver Forschung auf dem Gebiet der Lean Production gibt es kein
einheitliches Verständnis welche Lean Praktiken zu unterscheiden sind,
verschiedene Modelle und Ansätze existieren. Die Beziehungen zwischen den
einzelnen Praktiken sind nicht im Detail analysiert und das Zusammenspiel mit
verschiedenen Produktionsstrategien ist unklar. Daher ist es das Ziel dieser Arbeit
Produktionsstrategien in der pharmazeutischen Produktion zu identifizieren und
darauf aufbauend den Grad an Lean Implementierung sowie die Beziehungen
zwischen den einzelnen Lean Praktiken zu analysieren.
Literaturbasiert wird ein Beziehungsnetz zwischen Lean Praktiken gezeichnet. Es
dient als Grundlage für die Identifizierung des Einflusses der einzelnen Praktiken
aufeinander. Eine quantitative Analyse mit einer Stichprobe von 208 Standorten
identifiziert 17 Lean Praktiken, die in der pharmazeutischen Produktion eingesetzt
werden. Zudem werden vier strategische Gruppen entwickelt, die sich jeweils auf
ein anderes Set der Wettbewerbsvorteile Lieferung, Flexibilität, Kosten und Qualität
fokussieren. Die strategischen Gruppen werden empirisch auf Unterschiede
bezüglich der 17 Lean Praktiken untersucht. Es wird das allgemeine
Implementierungsniveau pro Gruppe untersucht sowie Unterschiede im
Implementierungsniveau der Praktiken innerhalb der Gruppen. In einem letzten
Schritt werden innerhalb der Gruppen die Korrelationen zwischen den Praktiken
berechnet und in das Beziehungsnetz eingetragen.
Die Ergebnisse zeigen, dass die Lean Implementierung von den strategischen Zielen
eines Produktionsstandortes abhängt. Unabhängig von der strategischen Gruppe
lässt sich feststellen, dass einzelne Lean Praktiken stark mit einander verbunden
sind und daher gemeinsam implementiert werden sollten. Die Verknüpfung der
Produktionsstrategie mit dem Prozess der Lean Implementierung ermöglicht einen
umfassenden Überblick über die Beziehungen zwischen Lean Praktiken und bietet
einen Entscheidungsansatz für Managern, welche Praktiken zu implementieren sind.

Table of Contents I
Table of Contents
List of Abbreviations ............................................................................................... V
List of Figures ........................................................................................................ VII
List of Tables ........................................................................................................... IX
1 Introduction ...................................................................................................... 1
1.1 Research motivation .................................................................................. 1
1.1.1 Research interest .......................................................................... 1
1.1.2 Practical relevance ....................................................................... 2
1.1.3 Theoretical gaps ........................................................................... 3
1.2 Research objective ..................................................................................... 4
1.3 Research design ......................................................................................... 5
1.3.1 Research process .......................................................................... 5
1.3.2 Research methodology ................................................................. 6
1.3.3 Research theory ............................................................................ 7
1.4 Layout of the dissertation .......................................................................... 8
2 Theoretical framework .................................................................................. 10
2.1 Lean manufacturing ................................................................................. 10
2.1.1 Evolution of lean manufacturing ................................................ 10
2.1.2 Lean manufacturing practices .................................................... 11
2.2 Production strategy .................................................................................. 14
2.2.1 Competitive priorities and improvement actions ....................... 14
2.2.2 Configurations of manufacturing strategy ................................. 16

II Table of Contents
2.3 Summary and framework development .................................................. 18
3 Mapping of relations between lean practices .............................................. 19
3.1 Detailed literature analysis ...................................................................... 19
3.2 Causal loop diagram of relations ............................................................ 21
3.2.1 Linkages between single lean practices ..................................... 22
3.2.2 Linkages between lean practices and goals of lean bundles ...... 24
3.2.3 Feedback loops ........................................................................... 24
3.3 Summary mapping of relations ............................................................... 25
4 Empirical analysis .......................................................................................... 26
4.1 Data gathering and data set ..................................................................... 26
4.2 Factor analysis: Identification of lean practices ...................................... 28
4.2.1 Identification of variables .......................................................... 29
4.2.2 Factor extraction method ........................................................... 30
4.2.3 Number of factors, rotation and interpretation .......................... 31
4.2.3.1 Total productive maintenance (TPM) ......................... 32
4.2.3.2 Total quality management (TQM) .............................. 34
4.2.3.3 Just-in time (JIT) ......................................................... 36
4.2.3.4 Effective management system (EMS) ........................ 40
4.2.4 Summary factor analysis ............................................................ 42
4.3 Adaption of the map of relations ............................................................. 44
4.4 Cluster analysis: Development of strategic groups ................................. 47
4.4.1 Identification of clustering variables ......................................... 48
4.4.2 Outlier analysis .......................................................................... 49
4.4.3 Hierarchical clustering ............................................................... 49

Table of Contents III
4.4.4 Non-hierarchical clustering ........................................................ 51
4.4.5 Validation of the groups ............................................................. 51
4.4.5.1 Cluster 1: Do all .......................................................... 53
4.4.5.2 Cluster 2: Flexible deliverers ...................................... 53
4.4.5.3 Cluster 3: Flexible starters .......................................... 53
4.4.5.4 Cluster 4: Efficient conformers ................................... 54
4.5 Comparison of strategic groups ............................................................... 54
4.5.1 Analysis of variance and multiple comparisons ........................ 54
4.5.1.1 Do all ........................................................................... 59
4.5.1.2 Flexible deliverers ....................................................... 59
4.5.1.3 Flexible starters ........................................................... 60
4.5.1.4 Efficient conformers ................................................... 61
4.5.1.5 Summary ..................................................................... 61
4.5.2 Within-cluster paired-sample t-tests .......................................... 62
4.5.2.1 Do all ........................................................................... 63
4.5.2.2 Flexible deliverers ....................................................... 65
4.5.2.3 Flexible starters ........................................................... 66
4.5.2.4 Efficient conformers ................................................... 68
4.5.2.5 Summary ..................................................................... 69
4.5.3 Correlations between lean practices ........................................... 70
4.5.3.1 Do all ........................................................................... 71
4.5.3.2 Flexible deliverers ....................................................... 74
4.5.3.3 Flexible starters ........................................................... 78
4.5.3.4 Efficient conformers ................................................... 81
4.5.3.5 General view ............................................................... 85

IV Table of Contents
4.5.3.6 Summary ..................................................................... 87
4.6 Summary empirical analysis ................................................................... 88
5 Conclusion ...................................................................................................... 92
5.1 Contributions to theory ........................................................................... 92
5.2 Contributions to practice ......................................................................... 92
5.3 Limitation and future research ................................................................ 93
References ................................................................................................................ 95
Appendix A: Overview lean practices and bundles ........................................... 106
Appendix B: OPEX questionnaire (excerpt of questions) ................................ 115
Appendix C: Details cluster analysis .................................................................. 122
Curriculum Vitae .................................................................................................. 125

List of Abbreviations V
List of Abbreviations
ANOVA Analysis of variance
Bn Billion
CFA Confirmatory Factor Analysis
CITC Corrected Item to Total Correlation
CLD Causal Loop Diagram
CP Competitive Priority
DOH (Inventory) Days on Hand
ed. Edition
Ed(s). Editor(s)
EFA Exploratory Factor Analysis
e.g. Exempli gratia (for example)
EI Employee Involvement
EMS Effective Management Systems
et al. Et alii (and others)
etc. Et cetera
FTE Full Time Equivalent
JIT Just-in Time
KMO Kaiser-Meyer-Olkin- criterion
MSA Measure of Sampling Adequacy
No. Number
n.s. Not significant
OEE Overall Equipment Effectiveness
OPEX Operational Excellence (research project and survey)
PCA Principle Component Analysis

VI List of Abbreviations
p. / pp. Page / Pages
SCM Supply Chain Management
SD System Dynamics
SE Standard Error
SPC Statistical Process Control
TPM Total Productive Maintenance
TPS Toyota Production System
TQM Total Quality Management

List of Figures VII
List of Figures
Figure 1: Research process ......................................................................................... 5
Figure 2: Research approach....................................................................................... 6
Figure 3: Example Causal Loop Diagram .................................................................. 7
Figure 4: Research structure ....................................................................................... 9
Figure 5: Research framework .................................................................................. 18
Figure 6: CLD of lean practices ................................................................................ 22
Figure 7: Procedure used for factor analysis ............................................................ 28
Figure 8: Lean practices identified in pharmaceutical manufacturing ..................... 43
Figure 9: Adapted map of relations between lean practices ..................................... 46
Figure 10: Procedure used for cluster analysis ......................................................... 47
Figure 11: Implementation levels for do all-cluster ................................................. 59
Figure 12: Implementation levels for flexible deliverers-cluster ............................. 60
Figure 13: Implementation levels for flexible starters-cluster .................................. 60
Figure 14: Implementation levels for efficient conformers-cluster .......................... 61
Figure 15: Correlations for do all-cluster ................................................................. 71
Figure 16: Correlations for flexible deliverers-cluster ............................................. 74
Figure 17: Correlations for flexible starters-cluster.................................................. 78
Figure 18: Correlations for efficient conformers-cluster .......................................... 82
Figure 19: Influence - importance do all-cluster ...................................................... 88
Figure 20: Influence - importance flexible deliverers-cluster .................................. 89
Figure 21: Influence - importance flexible starters-cluster ...................................... 90
Figure 22: Influence - importance efficient conformers-cluster ............................... 90
Figure B- 1: General information and competitive priorities ................................. 115
Figure B- 2: Four categories of lean practices ........................................................ 120
Figure B- 3: Key performance indicators for the goals of lean bundles................. 121
Figure C- 1: Dendrogram – outlier analysis ........................................................... 122

VIII List of Figures
Figure C- 2: Dendrogram – hierarchical clustering ................................................ 123
Figure C- 3: Number of clusters based on agglomeration coefficients .................. 124

List of Tables IX
List of Tables
Table 1: Taxonomies in production strategy ............................................................ 17
Table 2: Attribution of lean practices to lean bundles .............................................. 21
Table 3: Direction of relations between lean practices ............................................. 23
Table 4: Lean practices according to their influence ................................................ 23
Table 5: Size of pharmaceutical production sites ..................................................... 27
Table 6: Total productive maintenance – Initial items ............................................. 33
Table 7: Total productive maintenance – Scale reliability scores ............................ 33
Table 8: Total productive maintenance – EFA category level ................................. 34
Table 9: Total quality management – Initial items ................................................... 34
Table 10: Total quality management – Scale reliability scores ................................ 35
Table 11: Total quality management – EFA category level ..................................... 36
Table 12: Just-in time – Initial items ........................................................................ 37
Table 13: Just-in time – Scale reliability scores ....................................................... 38
Table 14: Just-in time – EFA category level ............................................................ 39
Table 15: Effective management system – Initial items ........................................... 40
Table 16: Effective management system – Scale reliability scores .......................... 41
Table 17: Effective management system – EFA category level ............................... 42
Table 18: Implementation of lean practices .............................................................. 44
Table 19: Assignement of the lean practices ............................................................ 45
Table 20: Measures for the goals of lean bundles .................................................... 46
Table 21: Competitive priorities used ....................................................................... 48
Table 22: Competitive priorities – EFA ................................................................... 49
Table 23: Analysis of agglomeration coefficient - Ward's method .......................... 50
Table 24: Final cluster results - K-means method .................................................... 51
Table 25: Competitive priorities emphasised by strategic groups ............................ 52
Table 26: Implementation of lean practices by competitive priority clusters .......... 58

X List of Tables
Table 27: Pairwise t-test for do all-cluster................................................................ 64
Table 28: Pairwise t-test for flexible deliverers-cluster ........................................... 66
Table 29: Pairwise t-test for flexible starters-cluster ................................................ 68
Table 30: Pairwise t-test for efficient conformers-cluster ........................................ 69
Table 31: Interpretation of the correlation coefficient ............................................. 70
Table 32: Lean practices and their influence for do all-cluster ................................ 73
Table 33: Lean practices and their influence for flexible deliverers-cluster ............ 77
Table 34: Lean practices and their influence for flexible starters-cluster ................ 80
Table 35: Lean practices and their influence for efficient conformers-cluster ........ 84
Table 36: Observable correlations in all four clusters .............................................. 85

Introduction 1
1 Introduction
Research motivation 1.1
1.1.1 Research interest
Over the last years markets became more competitive and global. The changing
environment forces companies to be more flexible (Dreyer & Grønhaug, 2004) in
order to face this challenge. The importance of aligning production to customer
needs while still being able to efficiently manufacture good quality is rising. The
perception of manufacturing’s strategic role is increasing (Ward et al., 2007) and
companies start to improve their production system in terms of efficiency and
effectiveness to develop competitive advantages (Grichnik et al., 2008; Voss, 2005).
A popular approach to reach this aim is the concept of lean production which allows
a company to on the one hand improve productivity of processes and assets and on
the other hand to boost flexibility. It can be understood as "(...) an integrated
manufacturing system that is intended to maximize the capacity utilization and
minimize the buffer inventories of a given operation through minimizing system
variability (related to arrival rates, processing times, and process conformance to
specifications)" (de Treville & Antonakis, 2006, p. 102). Over the last decades lean
has become an often used term in operations management and several studies have
shown that the implementation and use of lean practices leads to superior
performance compared to competitors that do not implement such practices (Cua et
al., 2001; de Menezes et al., 2010). Consequently, the adoption of lean production is
a central challenge for manufacturing firms. Although there is quite a number of
comprehensive literature on lean and its elements (see Appendix A) every company
has its own idea of how to get started. When discussing with representatives from
the industry it becomes obvious that not all managers have a holistic view of lean
and that they rely on single elements without seeing the whole. Therefore, they are
not able to use the full potential lean is able to provide (Scherrer-Rathje et al.,
2009). Another point is the often missing consistency of the implemented practices
with a plant’s business strategy (Flynn & Flynn, 2004).
A lot of companies already implemented elements of lean years ago whereas others
are still on their way to implement them. Particular industries, like the
pharmaceutical industry and process industries in general, are lacking behind in
2 Introduction
adopting lean (Melton, 2005). On the other hand, having started to introduce lean
later than other industries they now have the chance to learn from others and the
problems they were confronted with on their journey to lean.
To be able to fully capture these learning possibilities it is necessary to deeper
analyse the lean concept. This analysis includes on the one hand the relations that
exist between single lean practices and on the other hand the manufacturing strategy
a company is pursuing that might have an influence on the success or failure of lean
implementation.
The influence of the manufacturing strategy pursued on the implementation level of
some lean practices as well as the relations between lean practices on a higher level
are identified in theory. In contrast, the influences that exist on a lower level are not
fully captured yet. But it might be that exactly these influences are the reason for
the failure of companies to fully and successfully implement lean and therewith to
achieve perfection as proclaimed by Womack and Jones (1996). Therefore, this
research should help to promote companies in being more successful while
implementing lean.
1.1.2 Practical relevance
For many years pharmaceutical companies were in the favourable position of
having a stable environment with excellent profit opportunities (Kickuth, 2005)
further secured by patents. Meanwhile, the situation changed and they have to deal
with more dynamics and intense competition (Gronauer & Friedli, 2010).
Additionally, a lot of patents are expiring resulting in a reduced brand spending of
US$127Bn through 2016 (IMS Health, 2012). The focus had to shift from
innovation as the key to success to other areas, like manufacturing, that have been
neglected in the past (FDA, 2004). The importance of this shift becomes obvious
when looking at the manufacturing costs that, depending on the company type,
account for up to 50% of the overall costs (OPEX Benchmarking, 2011). Most
pharmaceutical companies reacted to the changed environment by starting to
implement efficiency initiatives (Friedli et al., 2010) based on lean production.
Their content and structure often follow the methods and tools used in other
industries especially the automotive sector. The Pharmaceutical Executive stated in
2009:"Just as Toyota revolutionized automaking with its Lean production system,
pharma executives are aiming to secure their industry's brave new future by
adopting the Lean philosophy and tools." Considering the first experiences of

Introduction 3
pharmaceutical production sites, results are until now not as good as they might be
e.g. the average Overall Equipment Effectiveness (OEE) in pharma is 30%, good
companies reach 74% but in other industries the average is at 92% (Benson, 2004).
This shows that pharmaceutical companies are still struggling with the
implementation of lean maybe because of simply copying the standardised tools of
other industries or companies. But to be successful, the initiatives need to be aligned
to the particularities of the industry as well as the business strategy of the single
manufacturing plants (Dean & Snell, 1996). In literature and practice; there is a
variety of programs available under the term lean production. Analysing the
relations between the single elements of these programs can help to better
understand the impact of implementing specific lean practices and to choose the
right ones according to the own strategy. Therefore it is vital for pharmaceutical
manufacturing sites to envision their production strategy and the competitive
priorities they pursue.
1.1.3 Theoretical gaps
When looking at the existing literature, as done in chapter 2, various theoretical
gaps can be identified. These will be discussed in the following section.
There is no common way of naming and structuring lean practices.
As shown in Appendix A a lot of different approaches to name and structure lean
practices exist. The same name can stand for different practices and the
differentiation between practice, principle or technique is not always clear (Sousa &
Voss, 2002). Therefore a first step in this research will be to structure and define the
practices used in order to generate a common understanding.
Recent publications are mainly focusing on single lean bundles and the associated practices. The complex interrelations that exist between single practices are not considered.
Only focusing on some lean practices can lead to results that lack a holistic view.
Studies show that not the implementation of single practices leads to superior
performance but the aligned use of different practices (Cua et al., 2001). Until now
it is not possible to say in detail which configuration of which practices enables the
best results. Therefore the interrelations between the practices have to be examined.

4 Introduction
There is no approach that allows a company to decide depending on the production strategy followed how to start the lean implementation.
Different studies integrated production strategy into their investigation on lean
implementation (Christiansen et al., 2003). Results were that the production strategy
can have a significant influence on the choice which lean practices are
implemented. As proclaimed by the contingency theory, there has to be "fit"
between the structure of the company and the environment (Drazin & Van de Ven,
1985). The aim should be to have an implementation plan for lean practices
depending on the respective production strategy of the plant.
Research objective 1.2
The objectives of this research are fourfold. First, this research seeks to identify and
structure the practices associated with lean production in general. Identifying and
defining these practices is crucial for the second step which is devoted to the
examination of interrelations between the single practices. These interrelations are
structured in a map which will be adapted to pharmaceutical manufacturing in a
third step. Forth, this research aims to proposing an approach which allows a
pharmaceutical production site the implementation of lean according to the specific
strategic approach followed.
The following central research question can be derived:
How are single lean practices interconnected and how does their interaction
support the implementation of lean in pharmaceutical manufacturing against
the background of different manufacturing strategies?
To answer this research question the following sub-questions need to be discussed
in detail:
(1) Which lean practices exist and how can they be structured?
(2) Which direct and indirect influences exist between the single lean practices?
(3) Which different manufacturing strategies exist in pharmaceutical
manufacturing and how are single lean practices related to them?
(4) In which sequence has a plant to adopt and foster single lean practices to
achieve positive impact with regard to the manufacturing strategy followed?

Introduction 5
Research design 1.3
1.3.1 Research process
This research is based on the understanding of business administration as an applied
social science (Hill & Ulrich, 1979) which faces the problems of designing,
controlling, and developing purpose-oriented social systems (Ulrich, 1984).
Companies are recognized as complex social systems and a full controllability is
dismissed (Ulrich, 1984).
The starting point of the research process connects actual problems in the
pharmaceutical industry with relevant questions from the area of lean
manufacturing. The motivation of this research stems from problems faced by
practitioners and, like proclaimed by Ulrich (1991), has the aim to contribute to the
knowledge base by generating practical solutions for manufacturing companies.
These are namely solutions to support managers in the systematic implementation
of lean practices in their production sites. The concretisation and reprocessing of the
research topic puts forward the connections between practitioners’ problems and
new areas of research. It shows that the current reality is only a starting point for
analysing possible future realities in the research process (Ulrich, 1984).
The research process is therefore understood as an iterative learning process which
enriches empirically gained results with insights from practice to gain theoretical
conclusions.
The basis is Kubicek’s (1977) iterative heuristic as shown in Figure 1.
Figure 1: Research process (Kubicek, 1977; Tomczak, 1992; Gassmann, 1999)
To gain an initial understanding of a specific problem and possible solutions,
Questions addressed to reality
(Preliminary)theoretical knowledge
Critical reflectionData collection
Differentiation, abstraction Literature review
First findings from practice
Practical problems
Practical phenomenaResearch as an
iterative learning process
Field workTheory

6 Introduction
literature is reviewed and relevant theories are identified. Further, this specific
problem is reflected in practice and questions are raised. To answer these questions
empirical data is collected and critically reflected. This reflection leads to
differentiation, abstraction and changes in perspective of the original problem and
new questions are raised. Thus, theoretical knowledge is incrementally generated
and added to the existing knowledge base.
1.3.2 Research methodology
The research methodology used is a combination of quantitative and qualitative
research with a focus on the quantitative part. As suggested by Weick (1989) three
systematic processes are involved: literature review, use of data, and use of intuition
and assumptions. This three step approach is illustrated in Figure 2.
Figure 2: Research approach
In a first step, a broad review of lean management and general operations
management literature is conducted to extract and define the lean practices relevant
for the research question. They are enriched by insights from discussions with
industry representatives on their experience with lean. A map of relations is
developed based on these practices and interconnections identified in previous
research (see chapter 3). Therefore the methodology of System Dynamics (SD),
namely Causal Loop Diagrams is used. System dynamics is an approach to analyse,
understand and structure complex problems by showing dependencies between
single items that are part of the problem. It is a combination of the modelling,
simulation and control of complex dynamic systems, originating from Jay W.
Forrester (1961, 1969, and 1989). The approach leads to a continuous improvement
of model quality and insights into the domain or issue modelled. However in most
cases where system dynamics is used mathematical models and simulation are

Introduction 7
omitted. Anyway, this approach called Causal Loop Diagram (CLD) gives good
insights and learning possibilities as shown by Senge (1990). A CLD consists of the
crucial variables of a system which are in relationship to each other. This
relationship is displayed by using arrows, each having a positive or negative causal
link. A positive causal link implies that the variables are changing in the same
direction; accordingly a negative causal link means that the variables are changing
in opposite directions, when one increases the other decreases. When all linkages
are displayed feedback loops can be identified. Two kinds of feedback loops exist:
loops with a positive polarity - reinforcing loops (R) - and loops with a negative
polarity - balancing loops (B) (Meadows, 2008). An example is illustrated in Figure
3 below.
Figure 3: Example Causal Loop Diagram
The next step focuses on the statistical examination of this map based on data from
205 pharmaceutical production plants gathered in an on-going questionnaire based
survey on operational excellence. The map of relations is analysed for different
strategic groups that were formed from the 205 production plants as previous
research shows that the strategy plays an important role in the selection of lean
practices (e.g. Christiansen et al., 2003). To test the map of relations factor analysis,
cluster analysis, analysis of variance, and correlation analysis are used.
1.3.3 Research theory
Contingency theory has become popular in operations management research over
recent years and is especially useful in areas where operations management theory
is not yet fully developed (Sousa & Voss, 2008). Basically, contingency theory
states that context and structure have to be synchronised to allow an organization to
perform well (Drazin & Van de Ven, 1985; Donaldson, 2001). This "fit" is reflected
externally by the adaptation of internal structures to the environment and internally
by aligning structures and processes in the organization, but there is not one
universally efficient organizational structure (Friedli, 2006).
Lean production can be seen as a highly interrelated system. From a contingency
perspective lean practices are interrelated response variables. Response variables
Birth rate Population Death rate+
+
+
-BR

8 Introduction
are actions an organization can take in response to contextual or contingency factors
(Sousa & Voss, 2008). These variables have to be aligned not only with the
contextual factors but also among each other. Internal fit can consequently be seen
as an alignment between the single lean practices while external fit reflects the
alignment of lean practices and environmental factors like plant size.
Another theoretical view on lean is the configurational perspective. Configurations
are defined as "any multidimensional constellation of conceptually distinct
characteristics that commonly occur together" (Meyer at al., 1993 cited from Shah
& Ward, 2007) and are used when the representation with contingency relationships
is not possible. Shah and Ward (2007) see lean production as a configuration of
practices that needs to be explained as a whole and not focussing on single
elements. Here they see the contribution to superior performance as well as the
difficulty of imitation by competitors.
Contingency theory has also been criticised, mainly in three points. Kieser (2002)
notes, that only one specific form of structure is seen to properly support the
organization for any given context. The consequence would be that there is no
variety in the design of organizational structures in a specific situational context.
Furthermore, the situational context has to be seen as given by the organization and
therefore cannot be influenced (Kieser, 2002). In addition, it is felt that contingency
theory only provides limited explanatory power as the independence of the
examined contexts is not proven (Kreikebaum, 1998).
Layout of the dissertation 1.4
The thesis is organised into five chapters. The organization is outlined in Figure 4.
• The first chapter provides a general overview of the research motivation, the
research question and research design as well as the methods used to answer
the research question.
• Chapter 2 presents a literature review of management principles and
operations management research that is relevant to this study. Implications
for the current work are derived and based on them a framework is
developed.
• Chapter 3 develops a map of relations between lean practices based on
findings from literature. This map serves as the basis for the following
empirical investigation.

Introduction 9
• Chapter 4 presents the results of an empirical investigation of pharmaceutical
production sites. Based on a cluster analysis, strategic groups are identified
and the relations between lean practices implemented in these groups are
analysed. The analysis shows which lean practices should be implemented
first according to the strategic group.
• Finally, Chapter 5 concludes the thesis by summarising and discussing the
implications of this study and its contributions to theory and practice.
Limitations and possible directions for future research are highlighted.
Figure 4: Research structure
Chapter 1
Introduction
Research motivation Research objective Research design
Layout of the dissertation
Chapter 2
Theoretical framework
Lean manufacturing Production strategySummary and
framework development
Chapter 3
Mapping of relations between lean practices
Detailed literature analysis
CLD of relationsSummary mapping of
relations
Chapter 4
Empirical analysis
Adaption of the map of relations
Data gathering and data set
Identification of lean practices
Comparison of strategic groups
Development of strategic groups
Summary empirical analysis
Chapter 5
Conclusion
Contribution to theory Contribution to practiceLimitations and future research

10 Theoretical framework
2 Theoretical framework
The research at hand is based on operations management literature, especially from
the areas production management methods and production strategy. In the following
chapter first the three related research streams, which form the basis for the actual
discussion on lean, are reviewed. Further, the single elements normally included in
lean studies are identified. Second, a short review of content-related manufacturing
and production strategy literature is conducted and the relationship between lean
manufacturing and production strategy is suggested.
Lean manufacturing 2.1
2.1.1 Evolution of lean manufacturing
When analysing the evolution of lean manufacturing three related research streams
have to be considered. Starting point is the Toyota Production System (TPS)
described by Ohno in the late 1970ies in Japan. Ohno, who was responsible for the
development of the Toyota Production System (TPS) since the 50ies first published
his book "Toyota Production System: Beyond Large Scale Production" in English in
1988 (publication in Japan 1978). He defines TPS and describes its main underlying
components as elimination of waste, zero defects and continuous improvement.
Almost simultaneously, in 1984, Hayes and Wheelwright start studies under the
term “World Class Manufacturing” aiming to analyse which factors are able to
explain the extraordinary success of some manufacturing companies. They found
out two central dimensions: the effectiveness of the production system and the
efficiency of the applied practices used in production.
Hereby effectiveness stands for the role of manufacturing in a company and its
ability to support the company's strategy and to develop a unique position. This
unique position or competitive advantage is reached via the so called competitive
priorities, those factors manufacturing has to aim for (for details see 2.2).
Efficiency is measured by a unique combination of practices coming from the six
dimensions workforce skills and capabilities, management technical competence,
competing trough quality, workforce participation, rebuilding manufacturing
engineering, and incremental improvement approaches (Hayes & Wheelwright,
1984). These dimensions which should lead to a superior operational performance

Theoretical framework 11
have been discussed and expanded by others (e.g. Hall, 1987; Schonberger, 1986).
At the beginning of the 90ies the International Motor Vehicle Program started a
detailed study to examine new Japanese techniques in production (mainly the
Toyota Production System) which they named "lean production". This term was
first used by Krafcik in 1988.
Some of the conclusions drawn are published in "The Machine that Changed the
World" by Womack et al. (1990). The book was the first attempt to gather all
practices discussed under lean manufacturing in one holistic consideration
(Karlsson & Ahlström, 1996). It does not only focus on analysing production but
also on product development, procurement and distribution. In their second book
"Lean Thinking" (1996) Womack and Jones define the central practices which lead
to lean production as follows: specify value, identify the value stream, create flow,
establish pull and seek for perfection. The book can be understood as a guide on
how to practically apply lean in any organization and achieve the lean production
system they described in 1990 (Garnett et al., 1998).
In 1995, Voss stated an already high level of research into lean which even was
increasing in the following years. Nevertheless, the three related research streams
have in common that they all propose certain practices which should be
implemented to reach a better performance. These practices will be discussed in
detail in the following section.
2.1.2 Lean manufacturing practices
Since these first academic publications about lean there has been a big boom
concerning this topic and a lot of theoretic papers and studies were published. In
contrast to the early publications about lean these works see lean from a practical
perspective, focussing more on practices, tools, and techniques that are directly
observable (Hines et al., 2004; Liker & Meier, 2006; Pettersen, 2009; Shah & Ward,
2007). As there is no general agreement under researchers on how to define the
dimensions of lean a lot of different approaches and understandings of lean exist;
concepts are changing over time, the same item is used to display different concepts
or, the other way round, different items are used to display the same concept (Shah
& Ward, 2007). Furthermore Sousa & Voss (2002) stress the fact that studies on
lean are using different levels (principle, practices or techniques) of the single
concepts without showing clearly which level they are addressing. Even more
problematic from their point of view is the use of the terms themselves; "practices",

12 Theoretical framework
"factors", and "implementation constructs" are standing for the same level of a
concept.
In this research lean practices are understood as "... the observable facet (...), and it
is through them that managers work to realize organizational improvements."
(Sousa & Voss, 2002, p. 92).
Generally, papers dealing with lean practices build bundles grouping different
aspects of the lean concept (e.g. Cua et al., 2001; Kickuth, 2005; McKone et al.,
2001; Shah & Ward, 2003). Comparing various authors shows that no common
understanding exists, which practices belong to which bundles. An illustrative
example is the paper of Dow et al. (1999) which provides insight into the different
number of dimensions of quality management practices perceived by different
authors. In the different models displaying lean the bundles are mostly
differentiated between Total Productive Maintenance (TPM), Total Quality
Management (TQM), Just-in Time (JIT), and Effective Management System
(EMS). Some papers also include Supply Chain Management (SCM) and Employee
Involvement (EI).
Unlike the work of Womack et al. (1990) the studies mainly focus on single aspects
of lean and their influence on (manufacturing) performance figures. Kannan and
Tan (2005) find that commitment to quality and understanding of supply chain
dynamics have the greatest effect on manufacturing performance. McKone et al.
(2001) investigate the effect of Total Productive Maintenance (TPM) on
manufacturing performance by also considering Total Quality Management (TQM)
and Just-in Time (JIT) practices. They find that multiple manufacturing practices in
a plant are mutually supportive and cannot be seen as independent. Higher levels of
TPM implementation are associated with higher levels of JIT and TQM
implementation.
On the other hand there are also some studies that focus explicitly on lean
manufacturing as an integrated system. Cua et al. (2001), as one of the first, show
that the joint implementation of lean manufacturing practices has an influence on
the manufacturing performance. Depending on the strategic importance of single
performance dimensions different configurations of the practices are useful. De
Menezes et al. (2010) investigate in their paper if early implementers of lean
practices really have an advantage with regard to productivity. The outcome is that
integration, early adoption and continuous improvement may be linked to

Theoretical framework 13
organizational performance. Others go even further and also integrate context
variables in their study, e.g. Shah and Ward (2003) examine how plant size, plant
age and unionization status can potentially influence the implementation of 22 lean
manufacturing practices. Many researchers propose that the combined use of
different practices leads to a better result in performance because the practices are
complementary and inter-related. This linkage has also been examined by Kickuth
(2005) who supposes that the best way to implement manufacturing practices is to
first focus on TPM for stable equipment, then on TQM for stable processes and
finally on JIT to reduce inventories and fixed assets. Simultaneously, all these more
technically related practices are supported by EMS practices. De Treville and
Antonakis (2006) lay the focus in their paper more on these people oriented
practices and show that a certain level of lean implementation can increase workers'
motivation. Concerning the implementation process there is no agreement on which
sequence to follow. Hayes et al. (1988) suggest parallel implementation as they
consider that lean practices cannot be isolated. Ferdows and de Mayer (1990)
defend a sequential implementation as there is a natural sequence and efforts and
resources may be limited. Also Womack and Jones (1996) opt for different phases
of implementation. Zayko et al. (1997) describe a sequential process of lean
implementation which is empirically based.
In an attempt to further structure and clarify the field of lean research Shah and
Ward (2007) identify 48 practices/ tools that were previously associated with lean
production by other researchers. Based on a factor analysis they propose that ten
highly inter-related factors can represent lean production including both internal and
external dimensions. Later research works do not use these factors but continue to
form their own lean bundles with a variety of practices included. Appendix A shows
the different lean bundles and practices used by different authors in a chronological
order. The terminology of the respective publication is used.
It is obvious that a lot of research has been done in the field of lean and its
underlying practices. Different papers analyse different lean bundles and their
interrelations but there is no approach which systematically displays the
interrelations between the single practices associated with lean.

14 Theoretical framework
Production strategy 2.2
As one of the first, Skinner (1978) stresses the importance of production for the
overall success of a company and therewith its function as a competitive weapon.
Since then, in academia as well as in practice the interest in this topic is raising
(Kathuria, 2000). Essentially, there are two literature streams in production strategy.
The content-related literature deals with competitive priorities and decision
categories or improvement actions (Christiansen et al., 2003). The focus of process-
related literature is on the influence of environment and business strategy. For the
research at hand the content-related literature is considered. In addition to
displaying the actual status of literature on competitive priorities and improvement
actions, research dealing with typologies or taxonomies of production strategy is
analysed.
2.2.1 Competitive priorities and improvement actions
Competitive priorities are crucial dimension of the production strategy. Skinner
(1969, 1974) defined these manufacturing objectives as costs, quality, delivery and
flexibility. There is consensus in literature that the three factors costs, quality, and
delivery a fundamental. They can be found in most of the studies (Ward et al.,
1996). A later literature analysis by Dangayach and Deshmukh (2001) of 260 papers
showed that costs, quality, delivery dependability, delivery speed, flexibility and
innovation are mostly used in content-related literature to name competitive
priorities. Other studies (Christiansen et al., 2003; Frohlich & Dixon, 2001) also
included service as a seventh factor. Nevertheless, research mostly sees production
strategy as a combination of the four basic competitive priorities (Boyer & Lewis,
Implications for the research proposal
I 1: Implementing lean manufacturing practices as an integrated system augments
the positive impact on manufacturing performance.
I 2: Various lean practices and interrelations can be derived from the existing
literature. Most publications focus on single bundles of practices.
I 3: Researchers are not in agreement of how to structure the single practices.

Theoretical framework 15
2002) as defined by Skinner (1969, 1974).
In this research the focus will also be on costs, quality, delivery, and flexibility. The
factor innovation will be excluded as it is mainly seen as relevant for research and
development and not for production. There are trends in pharmaceutical
manufacturing to integrate research and development into production, but yet the
factor can be neglected. In the pharmaceutical industry also service can be
excluded.
There are different opinions about the way to use competitive priorities. Under the
term trade-off a discussion on how many competitive priorities a company can
focus is held. Skinner (1992) pointed out that it is necessary to focus on one or two
of the factors only in order to be able to assign resources. The decision is depending
on the business strategy as well as the technical feasibility. The simultaneous focus
on several competitive priorities is not possible as improving one factor leads to the
decline of another factor. This opinion is also shared by others (Boyer & Lewis,
2002). But there is also criticism of this assumption, Schonberger (1986) even
completely neglected the occurrence of trade-offs. But also the complete neglection
of trade-offs is rejected. Other authors (Ferdows et al., 1986; Mapes et al., 1997;
Noble, 1995; Noble, 1997; Roth & Miller, 1992) showed that it is possible to focus
on more than one or two competitive priorities and that the sequence in which they
are adopted is relevant to avoid trade-offs. This sequence is reflected in the sand
cone model (De Meyer & Ferdows, 1990). It states that the sequence of adoption
should be quality, dependability, speed, and cost efficiency.
Often, competitive priorities are used to build typologies or taxonomies of
production strategy (see Table 1). These typologies or taxonomies help to reduce
complexity and to identify similarities (see chapter 2.2.2). Further, they show that
focusing on more than one competitive priority is possible.
As already stated by Hayes and Wheelwright (1984) a unique combination of
practices is vital for success. These practices are included in the production strategy
literature under the term improvement actions (e.g. Total Quality Management).
They should be directly linked to the competitive priorities, allowing managers to
choose those practices that support their aims best (Kim & Arnold, 1996). Even
though there is a lot of research dealing with the linkage of competitive priorities
and improvement actions, the analyses are often just focussing on single practices
(Ketokivi & Schroeder, 2004). This picture is similar to the one drawn for the

16 Theoretical framework
analysis of the implementation of lean manufacturing practices (see chapter 2.1.2).
2.2.2 Configurations of production strategy
Configurations can be divided into typologies and taxonomies. They describe the
production strategy and can be built based on competitive priorities. Typologies are
ideal types each representing a unique combination of criteria whereas taxonomies
are classifications of real organizations which form representative and mutually
exclusive groups (Bozarth & McDermott, 1998). Often, the results are analysed
using cluster or factor analysis. Table 1 provides a short overview of competitive
priority based taxonomies in production strategy literature.
The single studies use different dimensions and the database is varying by size,
country, and industry. Nevertheless, the strategic types proposed resemble each
other. These strategic types will serve as references for interpreting and naming the
taxonomies that will be developed for pharmaceutical production sites in this
research.
Implications for the research proposal
I 4: The production strategy is defined by using competitive priorities.
I 5: Competitive priorities are the basis for developing taxonomies of strategic
types which help to identify similarities between plants.
I 6: Competitive priorities and improvement actions like lean production are
linked to each other.

Theoretical framework 17
Table 1: Taxonomies in production strategy (Bozarth & McDermott, 1998;
Deflorin, 2007; Martín-Peña & Díaz-Garrido, 2008; own analysis)
Author Strategic types
• high-performance products group • cost • flexibility
• manufacturing innovators • delivery • quality
• marketing-oriented group • delivery network • after-sales service
• caretakers • low price • design flexibility • advertising
• marketeers • dependability • conformance • broad distribution
• innovators • speed • performance • broad line
• volume flexibility
• efficiency • after-sales service
• delivery deadlines • low cost-quality manufacturers • flexibility
• manufacturers focused on delivery • quality
• variant producers • cost • quality
• innovators • in-time delivery • product performance
• mass producers • quick delivery
• mass customizers
• starters • cost
• efficient conformers • delivery
• speedy conformers • flexibility
• do all • quality
• designers • low price • performance quality
• specialists • delivery dependability • after-sales service
• caretakers • delivery speed • broad product line
• idlers • volume flexibility
• servers • design flexibility
• mass customizers • conformance quality
• low pricers • price • customization • time to market
• quality deliverers • delivery reliability • design/ innovation
• speedy deliverers • delivery speed • product features
• aesthetic designers • quality conformance • product variety
• all-rounders • cost • quality
• efficient innovators • delivery
• differentiators • flexibility
• quality customizers • cost • after-sales service
• low emphasizers • delivery
• mass servers • flexibility
• specialized contractors • quality
• experts • price • conformance quality • product design/ -quality
• logisticians • dependable deliveries • customer service
• classics • faster deliveries • product range
• service provider • order size flexibility
• speedy conformers • cost
• starters • delivery
• efficient conformers • flexibility
• agile • quality
Miller & Roth(1994)
Avella et al.(1996, 1999)
Classification variables
de Meyer(1992)
• after sales service
Kathuria et al.(2010)
Deflorin(2007)
• flexible manufacturers focused on the market
• new products more frequently
• changes in product design
• more innovative products
Zhao et al.(2006)
Frohlich & Dixon(2001)
Christiansen et al.(2003)
Sum et al.(2004)
Sweeney & Szwejczewlski(1996, 2000)
Kathuria(2000)

18 Theoretical framework
Summary and framework development 2.3
The aim of the research at hand is to show, how single lean practices are
interconnected and how their interaction supports the implementation of lean
against the background of different production strategies. To answer these questions
a research framework is developed based on the implications from literature. It
allows showing which aspects will be examined and how they are positioned to
each other. It is the basis for the following analyses.
Figure 5: Research framework
fit
Strategic type
costs
qualitydelivery
Interrelated lean practices
fithousekeeping
setup time reduction
supplier quality management
pull system
management support and commitment
TQM
EMS
JIT
JIT
TPM

Mapping of relations between lean practices 19
3 Mapping of relations between lean practices
The literature review in chapter 2 showed that there has been a lot of research on
lean practices in the last years. All of them investigated different relations in detail
and came to conclusions which practices influence each other. In this chapter the
single lean practices and their relations identified in previous research are gathered
and mapped. As described in chapter 1.3.2 a CLD is used to display the relations.
The map developed will serve as a basis for the identification of relations between
lean practices in pharmaceutical manufacturing. This chapter is mainly based on a
paper by Gütter (2010).
Detailed literature analysis 3.1
A combination of keyword search in databases and the “snowball” method is used
for literature analysis. Keyword search is used for the identification of relevant
articles. As described in chapter 2.1.2 different authors used different names for the
single lean practices, therefore using only keyword search in databases could be
misleading. For the “snowball” method a relevant article in the topic which was
identified by keyword search is chosen as a seed and the papers cited in this article
as well as the papers that cite the article are found by e.g. using the Web of
Knowledge1. From the articles found the ones relevant for the actual research need
to be extracted.
Literature on lean which is dealing with different lean bundles was identified as
relevant for the actual research. Papers from all kinds of industries were included.
From these papers, the lean practices described and their relations were gathered.
Lean practices rarely named or without stated interrelations to other practices were
not included in the analysis. Building on prior research the single lean practices
identified are grouped to the lean bundles TPM, TQM, JIT and EMS as done by
Cua et al. (2001) in their integrating framework. A similar framework was
developed by Kickuth (2005) for pharmaceutical manufacturing. As far as possible
these two frameworks were used.
1 webofknowledge.com

20 Mapping of relations between lean practices
In the following, the single bundles are explained. Table 2 depicts the classification
made by Cua et al. (2001), Kickuth (2005), and the classification derived from the
literature review.
The practices in the TPM bundle are focusing on the maximisation of equipment
effectiveness (Nakajima, 1988) which is defined as stable running machines with a
high availability rate. Three lean practices are assigned to the TPM bundle:
preventive maintenance, according to Cua et al. (2001), technology assessment and
usage following Kickuth (2005) which includes Cua’s technology emphasis and
proprietary equipment, and housekeeping as stated by McKone et al. (2001) and
Kickuth (2005).
The TQM bundle reflects a holistic quality management approach (Powell, 1995)
that involves supplier, workforce, customers, and management into the continuous
improvement of quality. The lean practices included in the bundle are almost the
same as in the frameworks of Cua et al. (2001) and Kickuth (2005). To stress the
importance of variance reduction in processes the practice statistical process control
(SPC) is included as in Shah and Ward (2007).
The reduction and finally the elimination of waste (Ohno, 1988) is the goal of the
JIT practice bundle. Compared to the framework of Cua et al. (2001), which
includes five lean practices, most of the practices stayed the same, only with
different names. In addition, three practices have been added following Shah and
Ward (2003). These practices are: lot size reduction, cycle time reduction, and
continuous product flow.
The lean bundles defined so far are all more technically focused. They are
supported by management and strategy focused lean practices gathered in the
bundle EMS. According to Shah and Ward (2003) lower level lean practices can be
grouped into two main factors. One factor is named flexible, cross-functional work
force and consists of job rotation, job design, and formal, cross-functional training.
The second factor, self-directed work teams, includes organization in work teams
and employee involvement in problem solving groups. As a third practice
management commitment and support was included to not only stress the role of
employees but also the role of management.

Mapping of relations between lean practices 21
Table 2: Attribution of lean practices to lean bundles
As a next step the lean practices identified in the literature review are structured
using a CLD.
Causal loop diagram of relations 3.2
A CLD helps to structure the relation between the single lean practices and
therewith shows their dependencies. It also gives a first idea of which practices are
very connected to others and therewith strongly influence the implementation of
lean in a plant.
In addition to the lean practices identified in the literature review also the goals of
the technically oriented lean bundles are included into the CLD; they are marked in
bold. The goals are improved equipment performance for TPM, quality
improvement and stable processes for TQM, and elimination of excess inventories
for JIT. Including the goals of the bundles helps to see if the lean practices assigned
to one lean bundle have more causal relations to the goal of this specific bundle than
to those of other bundles.
The relations displayed in the CLD were primarily taken from de Menezes et al.
(2010), Shah and Ward (2007, 2003), Kannan and Tan (2005), Ahmad et al. (2003),
Cua et al. (2001), McKone et al. (2001) and Dow et al. (1999). But also inputs from
other papers were considered.
Cua et al. 2001 Kickuth 2005 Literature review
Autonomous & planned maintenance Preventive maintenance Preventive maintenanceTechnology emphasis Effective technology usage HousekeepingProprietary equipment development Housekeeping Technology assessment and usage
Cross-functional product design Cross-functional product design Cross-functional product designProcess management Process management Process mgmt. and variance reductionSupplier quality management Supplier quality management Supplier quality managementCustomer involvement Customer integration Customer involvement
Statistical process control (SPC)
Setup time reduction Setup time reduction Setup time reductionPull system production Pull system Pull systemJIT delivery by suppliers Planning adherence JIT delivery by suppliersEquipment layout Layout optimization Equipment layout optimizationDaily schedule adherence Planning adherence
Cycle time reductionLot size reductionContinuous product flow
Committed leadership Direction setting Mgmt. support and commitmentStrategic planning Mgmt. commitment & company culture Self-directed working teamsCross-functional training Flexible, cross-functional workforceEmployee involvementInformation and feedback Functional integration& qualification
TQM basic techniques/ TQM
JIT basic techniques/ JIT
Human - and strategic-oriented practices/ Effective management system
TPM basic techniques/ TPM
Employee involvement & continuousimprovement

22 Mapping of relations between lean practices
Figure 6: CLD of lean practices
The map of relations will be discussed in the following regarding three aspects: the
linkages between the single lean practices, the linkages between the lean practices
and the goals of the lean bundles, and the reinforced feedback loops.
3.2.1 Linkages between single lean practices
A high number of linkages can be observed between the single lean practices
themselves and the goals of the bundles TPM, TQM, and JIT. It is obvious that
some practices show more direct as well as indirect relations than others. Besides
the number of relations also the direction of the relations are interesting, as the
implementation of a practice that has a positive influence on another practice
supports the overall implementation of lean in a plant. There are, on the one hand,
lean practices that are only or mainly influencing others and on the other hand there
are lean practices that are only or mainly being influenced. Table 3 structures the
lean practices following this approach.
pull system
continuousproduct flow
setup timereduction
quality improvementand stable processes
elimination ofexcess inventories
lot size reduction
process managementand variance reduction
self-directedworking teams
supplier qualitymanagement
preventivemaintenance
++
JIT delivery bysuppliers
+ +
SPC
+
equipment layoutoptimization
++
+
flexible, cross-functionalworkforce
+
+
+
customerinvolvement
+
+
+management support
and commitment +
+
+
++
technologyassesment and usage
++
housekeeping
improved equipmentperformance
cycle timereduction
+
+
+
+
++
++ +
+
+
+
+
+
+
planning adherence
+
cross-functionalproduct design
+
+
+
+ ++
+
+
+

Mapping of relations between lean practices 23
Table 3: Direction of relations between lean practices
To have the highest impact on the overall implementation of lean in a plant, the
early adoption of lean practices that are only or mainly influencing others seems
most promising. Table 4 sorts the lean practices regarding their influence on other
practices. It distinguishes between the overall number of direct and indirect
influences and the number of direct influences. Considering also the indirect
linkages shows that some practices have more influence than it seems in the first
place. An example is the practice housekeeping with only one direct linkage to
improved equipment performance (following McKone et al. 2001) but six indirect
linkages.
Table 4: Lean practices according to their influence
Following the assumption that lean practices that influence several other lean
practices have the highest influence on the overall success of lean implementation,
Only influencing Mainly influencing Balanced Mainly being influenced Only being influenced
• Housekeeping • JIT delivery by suppliers • Preventive maintenance • Planning adherence• Technology assessment and usage • Lot size reduction • Cycle time reduction• Cross-functional product design • Continuous product flow• Supplier quality management • Self-directed working teams• Customer involvement • Pull system• Statistical process control (SPC)• Setup time reduction• Equipment layout optimization• Mgmt. support and commitment
• Process mgmt. and variance reduction
• Flexible, cross-functional workforce
PracticeNumber of influences
thereof direct
Mgmt. support and commitment 11 4
Flexible, cross-functional workforce 10 4Setup time reduction 10 3
Lot size reduction 9 5Equipment layout optimization 9 2
Supplier quality management 8 3
Continuous product flow 7 4Self-directed working teams 7 3Pull system 7 2Customer involvement 7 2JIT delivery by suppliers 7 2Preventive maintenance 7 2Process mgmt. and variance reduction 7 2Housekeeping 7 1Technology assessment and usage 7 1Cross-functional product design 7 1Statistical process control (SPC) 7 1
Cycle time reduction 5 1
Planning adherence 0 0

24 Mapping of relations between lean practices
eight lean practices seem worth to focus on. These eight lean practices have a lot of
direct and/ or indirect relations with others: management support and commitment
(EMS), flexible, cross-functional workforce (EMS), setup time reduction (JIT), lot
size reduction (JIT), equipment layout optimization (JIT), supplier quality
management (TQM), continuous product flow (JIT), and self-directed working
teams (EMS). Interestingly, all practices coming from the bundle Effective
Management System (EMS) are among these practices with a lot of relations. It
shows how important these people and culture oriented lean practices are for the
overall implementation of the more technical practices of TPM, TQM, and JIT.
3.2.2 Linkages between lean practices and goals of lean bundles
When looking at the goals of the single lean bundles it becomes obvious that the
lean practices stemming from the relevant bundle have the most influences.
Nevertheless, they are also influenced by lean practices from other bundles. The
goals are also influencing each other; the JIT goal is influenced by the TPM as well
as the TQM goal. Further, the TQM goal is also influenced by the JIT goal. The
assumption of Kickuth (2005), that practices assigned to the JIT bundle are the last
to implement because they are facilitated by the other bundles, is supported. Also
the finding of Shah and Ward (2007) can be confirmed, stating that practices
associated with the TPM bundle have least direct relations to other lean practices.
3.2.3 Feedback loops
As explained in chapter 1.3.2 two kinds of feedback loops exist. For the relations
between lean practices five reinforced feedback loops were identified. They are
marked with bold arrows in Figure 6. All of the feedback loops include the goals of
the bundles TPM, TQM, and JIT. Hence, the conclusion of e.g. McKone et al.
(2001), that multiple manufacturing practices in a plant are mutually supportive and
therewith not independent, is supported.
An example for a direct feedback loop can be found between the TQM goal quality
improvement and stable processes and the JIT goal elimination of excess
inventories. Ahmad et al. (2003) stated that lower inventories, which lead to a
higher number of turns, ease the detection of quality problems. This helps to
improve the internal quality. A higher level of quality enables a plant to have a
lower level of inventory as the reliability of the process output is better.

Mapping of relations between lean practices 25
Summary mapping of relations 3.3
From literature 19 lean practices could be extracted and analysed regarding their
direct as well as indirect linkages to each other. A map was developed using a
Causal Loop Diagram. It shows that some lean practices are more connected than
others. Eight practices were identified that seem to have a high influence on a
successful lean implementation as their implementation positively influences the
implementation of other practices. This is a first hint for manufacturing managers
which lean practices to focus on.
So far, relations between lean practices were analysed based on literature and
therewith for manufacturing in general. The next chapter investigates which of the
lean practices identified in literature can also be found in pharmaceutical
manufacturing. The investigation is based on data from a survey in the
pharmaceutical industry. It will test the linkages empirically.

26 Empirical analysis
4 Empirical analysis
This chapter is divided into 6 parts. First, the data set is described. Then, the lean
practices used in pharmaceutical manufacturing are identified and the map derived
from literature is adapted accordingly. After that, strategic groups are developed and
characterized. Subsequently, the relationships between the strategic groups and their
use of lean practices are analysed based on the adapted map from chapter 3. Finally,
the sequence of adopting lean practices to positively impact manufacturing
performance is discussed.
Data gathering and data set 4.1
This research uses data collected in the project Operational Excellence in the
Pharmaceutical Industry (OPEX). The OPEX project started in 2004 at the Institute
of Technology Management at the University of St.Gallen. The study focuses on the
implementation of different lean practices and associated key performance
indicators in pharmaceutical production. Further, details on the production structure
and the production strategy are questioned. The OPEX database consists of data
from 208 pharmaceutical production sites.
The OPEX project is questionnaire based. For the development of the questionnaire
three steps were taken. First, based on a thorough literature review a model to
display lean management was adapted from existing models especially taking into
account the model of the Toyota Production System. The model was discussed with
experts from the automotive and the pharmaceutical industry and some adaptations
have been made. Second, a prototype questionnaire was developed based on the
model. The questionnaire consists of approximately 370 variables that can be
classified into different types of data. Approximately 200 variables are directly
measureable information, like key performance indicators. The other variables are
measured using a five‐point Likert scale, ranging from 1 = ʺstrongly disagreeʺ to 5
=ʺstrongly agreeʺ and including an option ʺdon’t knowʺ. According to Bortz &
Schuster (2010) the Likert scale can be regarded as an interval scale, which will be
done in this research. Constructs from preceding research were used whenever
possible to obtain high construct validity. Where it was necessary to develop new
scales they were built with close proximity to elaborated constructs. Third, the
prototype questionnaire was pre‐tested to ensure that the questions are interpreted

Empirical analysis 27
correctly. This test included on the one hand a discussion with seven experts and on
the other hand nine production plants filling in the questionnaire (Kickuth, 2005). In
case of unclear questions these were adapted. The measurement items used in this
work can be found in Appendix B.
The questionnaire was sent to pharmaceutical production sites all over the world.
Nevertheless, the location of St.Gallen leaded to an emphasis of the data on Europe
due to accessibility of production sites on other continents. The sample of target
firms is partly taken from the institute’s industry data base. In addition, existing
personal contacts and publicly available information (websites, industry
associations etc.) complemented the sample to avoid convenience sampling. In total
about 1050 production sites were identified and contacted by telephone or e‐mail
from which 208 responses returned. This makes a return rate of approximately 20%.
The respondents are managers from the area quality, production, operational
excellence, or site leaders.
From the 208 questionnaires returned, data from three sites was not used due to
missing values. Thus, the final sample consists of 205 pharmaceutical production
sites. Most of the participating plants are from European countries (89%), but some
questionnaires were also returned by plants located outside of Europe. Thereof, 7%
are from American countries and 4% from Asian countries. The participating
pharmaceutical production sites are of different size, measured with the number of
FTEs (full time equivalents).
Table 5: Size of pharmaceutical production sites
More than half of the sites have over 250 FTEs, nevertheless most sites employ
between 100 to 499 FTEs.
Number of FTEs Sample
1 to 49 3%
50 to 99 12%
100 to 249 31%
250 to 499 35%
500 to 999 14%1000 or more 5%

28 Empirical analysis
Factor analysis: Identification of lean practices 4.2
To check if the relations between items and corresponding lean practices that were
derived from theory can be empirically confirmed for pharmaceutical production
sites an exploratory factor analysis was conducted. This approach also opened the
possibility to find other constellations than assumed. Nevertheless, the practices
derived from theory were used as a basis for interpreting the resulting factors. This
is in line with Hair et al. (2006), who state that the analysis is most efficient when
the factors extracted correspond to the previously conceptually defined dimensions.
Factor analysis helps to define the underlying structure of variables (R factor
analysis). It is based on the assumption that there are latent variables which cannot
be observed directly. These so called factors influence the values of the observable
variables and are the reason for correlations between these values. Consequently,
variables can only be used for factor analysis if a correlation value can be calculated
among all variables. This is always possible for metric variables. Aim of the factor
analysis is to empirically determine the number and quality of theses latent
variables and therewith condense the information provided. The basic objective is
the grouping of highly intercorrelated variables (Hair et al., 2006).
There are two main types of factor analysis: the Exploratory Factor Analysis (EFA)
and the Confirmatory Factor Analysis (CFA). As the CFA demands an a priori
specification of the number of factors and other parameters, normally an EFA is
conducted as a start. Based on the results a CFA can be performed if necessary.
Figure 7: Procedure used for factor analysis
Identification of variables
Factor extraction method
Number of factors
Rotation of factors
Interpretation

Empirical analysis 29
Figure 7 shows the procedure used for the factor analysis in this research. Before
starting with the actual factor extraction in steps two to four, the underlying
variables have to be defined and checked for their usability in the analysis. After
extracting the factors the results need to be interpreted. The following sections
describe each of the steps in greater detail.
4.2.1 Identification of variables
The items related to the four categories of lean practices, as asked in the
questionnaire discussed in chapter 4.1, were the basis for the factor analysis. Some
tests had to be performed to ensure their usability for a factor analysis. Descriptive
statistics and missing item analysis were conducted for each of those 105 items. The
missing item analysis did not show any problems. Nevertheless, two items from the
category EMS were excluded from further analysis as they were only provided in 31
respectively 76 of the cases. In the following, the terms “item” and “variable” will
be used interchangeably.
With these 103 items the suggested number of at least five observations per variable
(Hair et al., 2006) cannot be reached for an analysis across multiple categories.
Therefore the factor analysis is conducted separately per category of lean practices.
Generally, there have to be more observations than variables with a minimum
number of 50 observations in total.
A first overview of the variables in the single categories can be obtained by
calculating the correlation matrix. It contains the bivariate correlations between the
single variables but does not yet give evidence if connected variables can be
explained by a common factor. This correlation matrix is the basis for performing
the factor analysis. Therefore, it has to be tested if the correlation matrix is suitable
for such an analysis.
One common criterion for testing the correlation matrix is the Measure of Sampling
Adequacy (MSA) proposed by Kaiser, Meyer and Olkin. It ranges on a scale from 0
to 1 and shows how well each variable is predicted by the other variables without
error. Aim is a value of above 0.80 but a value of 0.50 is still acceptable for a factor
analysis (Backhaus, 2006). The anti-image correlation matrix shows these values
per variable and indicates if variables should be excluded from further analysis. If
there are unacceptable values the variable with the lowest MSA should be deleted
first and then the correlation matrix should be recalculated. This procedure should
be performed until no unacceptable values are left.

30 Empirical analysis
The Bartlett test of sphericity is another possibility to test for correlations among the
variables. However, a higher number of observations leads to a higher chance of
detecting correlations among the variables.
As well, scale reliability can be ensured by calculating the Corrected Item to Total
Correlation (CITC) and Cronbach’s alpha if item deleted. According to Kerlinger
(1978) an item should not be used if the item’s correlation with its corrected item
total is less than 0.30. If the item is regarded to be essential for the category a
slightly lower CITC can be accepted. Cronbach’s alpha is a measure for internal
consistency that varies between 0 and 1. A value of above 0.70 is regarded as
essential for existing scales (Nunnally, 1978).
Using these criteria in total 16 (2 TPM, 6 TQM, 4 JIT, 4 EMS) items were deleted
thereof six (1 TPM, 1 TQM, 1 JIT, 3 EMS) were revers-coded. Previous research
has also indicated lower item reliability with reverse-coded items (Flynn et al.,
1990). For the following factor extraction 87 items can be used. Further details
concerning the items can be found in chapter 4.2.3.1 to chapter 4.2.3.4.
4.2.2 Factor extraction method
As the variables are specified, the next step is the selection of the factor extraction
method. There are two basic methods available, the Common Factor Analysis and
the (Principle) Component Analysis. The difference is the variance that is
considered in each method. The variance of a variable is composed of three parts.
First, there is the common variance that is shared with all other variables. It is
estimated by the so called communality. The second form of variance is the specific
or unique variance that cannot be explained by other variables and is only
associated to one specific variable. The third form of variance is the error variance
that is caused during data gathering or based on measurement errors or random
components (Hair et al., 2006). The Component Analysis considers the total
variance and is best used when having the primary goal of reducing data. The
interpretation focuses on finding a collective term for the variables assigned to one
factor. The Common Factor Analysis considers only the common variance and has
the primary goal of identifying the latent dimensions. The interpretation focuses on
finding a name for the reason for which the variables load on a factor. As the aim of
this research is to reduce data for further analysis the Principle Component Analysis
(PCA) is chosen.

Empirical analysis 31
4.2.3 Number of factors, rotation and interpretation
After identifying the variables and choosing the factor extraction method the actual
factor analysis can be performed. Aim of the factor analysis is to find as little
factors as possible that represent the data as good as possible in terms of explaining
more variance than another factor structure would do. Preferably, these factors
should be independent. There is no formal mathematical rule to decide on the
number of factors that should be extracted. However, some stopping criteria exist
(Hair et al., 2006):
• Latent Root criterion/ Kaiser criterion: Only factors which explain more
variance than a single variable should be extracted. For component analysis
the variance explained by one variable is 1, therefore all factors with an
eigenvalue >1 are regarded as significant. The results for this method are best
when the number of variables ranges between 20 and 50. Otherwise too few
(<20) or too many (>50) factors might be extracted.
• A Priori criterion: The exact number of factors is known before starting the
analysis.
• Percentage of Variance criterion: A specific amount of variance should be
explained by the factors extracted. In social science normally 60% of the
variance should be explained by the factor solution.
• Scree Test criterion: The latent roots are plotted against the number of
factors in the order of their extraction. This graph is used to determine the
appropriate number of factors by searching the point at which the curve first
starts to straighten. Generally, the Scree Test results in suggesting more
factors than the Latent Root criterion.
In practice, several criteria are used to extract factors and the results are compared
to find the best solution. Also the conceptual foundation is considered. This
approach is also chosen to extract the right number of lean practices.
After deciding on the number of factors to extract it has to be defined which
variables load on which factor. To ease the assignment a simple factor pattern is the
aim, meaning that each variable only has significant loadings on one factor. A
loading is regarded as significant if it is bigger than 0.50. From practical
considerations also smaller loadings can be added to the interpretation (Hair et al.,
2006). If variables load on more than one factor they are cross-loading and the
interpretation is more difficult. Rotation methods are used to eliminate these cross-

32 Empirical analysis
loadings. Two different types of factor rotation exist: orthogonal factor rotation and
oblique factor rotation. With orthogonal rotation the factors remain uncorrelated
whereas oblique rotation leads to correlated factors. Orthogonal rotation methods
are preferred when data reduction and the use in further statistical analysis is the
research goal. One commonly used orthogonal rotation method is VARIMAX
rotation which is also used in this research.
Following these two decisions the factors are extracted for the four categories of
lean. To assess the appropriate number of factors to retain multiple factor analyses
were run, specifying three to six factors for each category. After a VARIMAX
rotation the item loading tables were compared and the one with the cleanest factor
structure was chosen (Costello & Osborne, 2005). Also managerial interpretation
was considered in the selection process. Results suggested that for the category
TPM a 3-factor solution, for the category TQM a 4-factor solution, and for the
category JIT and the category EMS a 5-factor solution was best. All items had
loadings higher than 0.50 on their respective factor or could be confirmed by using
the Fürntratt criteria (Fürntratt, 1969). Eigen values lay above 2, and the percentage
of variance explained ranged from 58% to 65% (TPM 2.4/58.2%, TQM 2.6/ 60.5%,
JIT 2.3/ 65.2%, EMS 2.2/ 63.1%). The factor structure shows similarities to past
research. The internal consistency of each factor was examined using Cronbach’s
alpha. As all scales are above or approaching 0.70, internal consistency is indicated.
The detailed results for each of the four categories and their interpretation are
presented in the following sections (4.2.3.1 through 4.2.3.4) by using three tables.
The tables are: 1) items used for the construct, 2) scale reliability scores, and 3)
construct level EFA results and Cronbach’s alpha. Definitions for the theoretically
expected lean practices can be found in Kickuth (2005); only changes in the
definition are commented.
4.2.3.1 Total productive maintenance (TPM)
Originally, 17 items grouped to three practices were meant to establish the category
total productive maintenance (TPM). The three practices are: preventive
maintenance, technology assessment and usage, and housekeeping. The practices
and the items theoretically related to each of the practices are shown in Table 6.

Empirical analysis 33
Table 6: Total productive maintenance – Initial items
Table 7 presents the results of the reliability analysis for each of the items in the
category total productive maintenance. CITC scores were above the 0.30 cut-off
except for two items. The CITC score for TPM8 was 0.165 and for TPM12 0.050,
therefore they were dropped. Also the scores for Cronbach’s alpha if item deleted
indicated the removal of those two items. A second reliability analysis was
conducted and each of the remaining items reached a CITC score of above 0.30.
Table 7: Total productive maintenance – Scale reliability scores
The Exploratory Factor Analysis (EFA) was run as explained above and its results
are displayed in Table 8. Three factors corresponding to the theoretically expected
practices were extracted on the category level. They account for 58.2% of the
variance explained. All items had loadings higher than 0.50 on their respective
factor. The eigenvalues for the factors and their Cronbach’s alpha were suitable.
Practice Item name Item label
TPM1TPM2TPM3TPM4TPM5TPM6TPM7TPM8
TPM9TPM10TPM11TPM12TPM13TPM14
TPM15TPM16TPM17
House-keeping
Our employees strive to keep our plant neat and clean. Our plant procedures emphasize putting all tools and fixtures in their place.We have a housekeeping checklist to continuously monitor the condition and cleanness of our machines and equipment.
Technology assesment and usage
Our plant is situated at the leading edge of technology in our industry.We are constantly screening the market for new production technology and assess new technology concerning its technical and financial benefit. We are using new technology very effectively.We rely on vendors for all of our equipment.Part of our equipment is protected by the firm`s patents.Proprietary process technology and equipment help us gain a competitive advantage.
Preventive maintenance
We have a formal program for maintaining our machines and equipment.Maintenance plans and checklists are posted closely to our machines and maintenance jobs are documented.We emphasize good maintenance as a strategy for increasing quality and planning for compliance. All potential bottleneck machines are identified and supplied with additional spare parts. We continuously optimize our maintenance program based on a dedicated failure analysis.Our maintenance department focuses on assisting machine operators perform their own preventive maintenance. Our machine operators are actively involved into the decision making process when we decide to buy new machines. Our machines are mainly maintained internally. We try to avoid external maintenance service as far as possible.
Item name Initial CITCCronbach's alpha if item
deleted
Initial Cronbach's
alpha (scale)Final CITC
TPM1 .336 .853 .855 .386TPM2 .455 .849 .493TPM3 .576 .844 .592TPM4 .561 .844 .544TPM5 .616 .841 .602TPM6 .670 .838 .566TPM7 .710 .834 .486TPM8 .165 .861 Item droppedTPM9 .553 .843 .569TPM10 .565 .843 .557TPM11 .497 .846 .609TPM12 .050 .866 Item droppedTPM13 .414 .850 .371TPM14 .390 .854 .380TPM15 .568 .844 .522TPM16 .523 .845 .487TPM17 .386 .852 .429

34 Empirical analysis
Table 8: Total productive maintenance – EFA category level
4.2.3.2 Total quality management (TQM)
Originally, 26 items grouped to four practices were meant to establish the category
total quality management (TQM). The four practices are: process management,
cross functional product development, customer involvement, and supplier quality
management. The practices and the items theoretically related to each of the
practices are shown in Table 9.
Table 9: Total quality management – Initial items
Table 10 presents the results of the reliability analysis for each of the items in the
category total quality management. CITC scores were above the 0.30 cut-off except
Practice Item nameFactor loading
Eigen valueCronbach's
alphaTPM1 .702 3.561 .819
TPM2 .777
TPM3 .648
TPM4 .636
TPM5 .636
TPM6 .586
TPM7 .595
TPM9 .760 2.810 .790
TPM10 .734
TPM11 .715
TPM13 .625
TPM14 .734
TPM15 .801 2.352 .783
TPM16 .832
TPM17 .771
Preventive maintenance
Technology assesment and usage
House-keeping
Practice Item name Item label
TQM1TQM2TQM3TQM4TQM5TQM6TQM7TQM8
TQM9TQM10TQM11TQM12TQM13
TQM14TQM15TQM16TQM17TQM18TQM19
TQM20TQM21TQM22TQM23TQM24TQM25TQM26
Supplier quality
management
Quality is our number one criterion in selecting suppliers.We rank our suppliers, therefore we conduct supplier qualification and audits.We use mostly suppliers that we have validated.For a large percentage of suppliers we do not perform any inspections of the incoming parts/ materials.Inspections of incoming materials are usually performed in proportion to the past quality performance or type of supplier.Basically, we inspect 100% of our incoming shipments. We jointly have improvement programs with our suppliers to increase our performance.
Customer involvement
We are frequently in close contact with our customers.Our customers frequently give us feedback on quality and delivery performance.We regularly survey our customer`s requirements.We regularly conduct customer satisfaction surveys. On time delivery is our philosophy.We jointly have improvement programs with our customers to increase our performance.
Cross functional product
development
Manufacturing engineers are involved to a great extent in the development of a new drug formulation and the development of the necessary production processes. In our company product and process development are closely linked to each other.Due to close collaboration between the R&D and the manufacturing department, we could significantly shorten our time for product launches in our plant.For the last couple of years we have not had any delays in product launches at our plant. For product and process transfers between different units or sites standardized procedures exist, which ensure a fast, stable and complied knowledge transfer.
Process management
In our company direct and indirect processes are well documented.We continuously measure the quality of our processes by using process measures (e.g. On-time-in-full delivery rate).Our process measures are directly linked to our plant objectives.In our company there are dedicated process owners who are responsible for planning, management and improvement of their processes. A large percentage of equipment on the shop floor is currently under statistical process control (SPC).We make use of statistical process control to reduce variances in processes. For root cause analysis we have standardized tools to get a deeper understanding of the influencing factors (e.g. DMAIC).We operate with a high level of PAT implementation for real time process monitoring and controlling.

Empirical analysis 35
for seven items. The CITC scores for TQM17, TQM19, TQM20, TQM23, and
TQM25 as well as the scores for Cronbach’s alpha if item deleted indicated their
removal. After a second reliability analysis also TQM24 was dropped. A third
reliability analysis was conducted and each of the remaining items reached a CITC
score of above 0.30. TQM21 and TQM22 only reached a score close to 0.30. As
their scores for Cronbach’s alpha if item deleted were suitable and as they were
essential for the practice they were assigned to, those two items were kept.
Table 10: Total quality management – Scale reliability scores
The Exploratory Factor Analysis (EFA) was run as explained above and its results
are displayed in Table 11. Four factors were extracted on the category level. They
account for 60.5% of the variance explained. Three items had loadings lower than
0.50 on their respective factor but could be assigned using the Fürntratt criteria. The
eigenvalues for the single factors as well as their Cronbach’s alpha were suitable.
Item name Initial CITCCronbach's alpha if item
deleted
Initial Cronbach's
alpha (scale)
Final CITC
(2nd
loop)
TQM1 .432 .841 .847 .473TQM2 .623 .835 .627TQM3 .493 .839 .527TQM4 .623 .834 .659TQM5 .488 .838 .527TQM6 .391 .841 .466TQM7 .514 .836 .537TQM8 .322 .844 .353TQM9 .657 .831 .690TQM10 .608 .833 .628TQM11 .655 .832 .700TQM12 .388 .841 .418TQM13 .587 .834 .613TQM14 .407 .841 .374TQM15 .498 .838 .472TQM16 .446 .839 .376TQM17 .136 .853 Item droppedTQM18 .369 .842 .319TQM19 .205 .848 Item droppedTQM20 .083 .850 Item droppedTQM21 .305 .844 .288TQM22 .228 .846 .271TQM23 .075 .852 Item droppedTQM24 .251 .847 Item droppedTQM25 .085 .853 Item droppedTQM26 .411 .841 .356

36 Empirical analysis
Table 11: Total quality management – EFA category level
The four factors extracted are not corresponding to the theoretically expected four
practices. Items loading on other practices than expected were assigned to this new
practice if it was also comprehensible from a content perspective.
In contrast to the theoretically expected practice process management the factor
analysis revealed a more detailed understanding of processes. Sites that emphasize a
cross-functional process development also seem to be more focused on process
control, especially on the use of statistical process control. This is included in the
factor cross-functional process development and process control. Process
measurement and reliability is a second factor aiming at processes. It focusses more
on the on-time aspect of processes than on their exact development over time. In
addition to the theoretical understanding of supplier quality management, the aspect
of supplier development and management in general is stressed by the factor
supplier management and development. Some items related to customer
involvement could not be assigned to the respective factor. Therefore the
theoretically assumed factor is renamed as customer focus and satisfaction.
4.2.3.3 Just-in time (JIT)
Originally, 30 items grouped to four practices were meant to establish the category
just-in time (JIT). The four practices are: set-up time reduction, pull production,
Practice Item nameFactor loading
Eigen valueCronbach's
alphaTQM5 .766 3.658 .824
TQM6 .769
TQM8 .648
TQM9 .566
TQM10 .652
TQM11 .518
TQM2 .494 3.070 .758
TQM3 .448
TQM7 .685
TQM12 .768
TQM13 .585
TQM18 .527
TQM1 .545 2.703 .711
TQM4 .620
TQM21 .762
TQM22 .591
TQM26 .725
TQM14 .779 2.664 .654
TQM15 .840
TQM16 .490
Process measurement and reliability
Cross-functional process
development and process
control
Supplier management
and development
Customer focus and
satisfaction

Empirical analysis 37
layout optimization, and planning adherence. The practices and the items
theoretically related to each of the practices are shown in Table 12.
Table 12: Just-in time – Initial items
Table 13 presents the results of the reliability analysis for each of the items in the
category just-in time. CITC scores were above the 0.30 cut-off except for four
items. The CITC score for JIT4 was 0.096, for JIT9 0.194, for JIT11 0.108 and for
JIT12 0.164, therefore they were dropped. Also the scores for Cronbach’s alpha if
item deleted indicated the removal of those four items. A second reliability analysis
was conducted and each of the remaining items reached a CITC score of above
0.30.
Practice Item name Item label
JIT1JIT2JIT3JIT4JIT5JIT6
JIT7JIT8JIT9JIT10JIT11JIT12JIT13JIT14
JIT15JIT16JIT17JIT18JIT19JIT20JIT21JIT22JIT23JIT24
JIT25JIT26JIT27JIT28JIT29JIT30
Set-up time reduction
We are continuously working to lower set-up and cleaning times in our plant.We have low set-up times for equipment in our plant.Our crews practice set-ups regularly to reduce the time required.To increase the flexibility, we put high priority on reducing batch sizes in our plant. We have managed to schedule a big portion of our set-ups so that the regular up-time of our machines is usually not effected.
Optimized set-up and cleaning procedures are documented as best-practice process and rolled-out throughout the whole plant.
Currently our manufacturing processes from raw material to finished goods involve almost no interruptions and can be described as a full continuous flow.At the moment we are strongly working to reach the status of a full continuous flow with no interruption between raw material to finished goods.
Pull production
Our production schedule is designed to allow for catching up, due to production stoppings because of problems (e.g. quality problems).We use a pull system (kanban squares, containers or signals) for production control.We mainly produce according to forecasts.Suppliers are integrated and vendors fill our kanban containers, rather than filling our purchasing orders. We value long-term associations with suppliers more than frequent changes in suppliers.We depend on on-time delivery from our suppliers.We deliver to our customers in a demand-oriented JIT way instead of a stock-oriented approach.
We mainly produce one unit when the customer orders one. We normally do not produce to stock.
We use "Value Stream Mapping" as a methodology to visualize and optimize processes.
We have laid out the shop floor so that processes and machines are in close proximity to each other
Planning adherence
We usually meet our production plans every day.We know the root causes of variance in our production schedule and are continuously trying to eliminate them.To increase our planning adherence we share data with customers and suppliers based on a rolling production plan.We have smoothly leveled our production capacity throughout the whole production process. Our plant has flexible working shift models so that we can easily adjust our production capacity according to current demand changes.
A smoothly leveled production schedule is preferred to a high level of capacity utilization.
Layout optimization
Our processes are located close together so that material handling and part storage are minimized.Products are classified into groups with similar processing requirements to reduce set-up times.Products are classified into groups with similar routing requirements to reduce transportation time.The layout of the shop floor facilitates low inventories and fast throughput.As we have classified our products based on their specific requirements our shop floor lay-out can be characterized as separated into "mini-plants". Currently our manufacturing processes are highly synchronized over all steps by one tact.

38 Empirical analysis
Table 13: Just-in time – Scale reliability scores
The Exploratory Factor Analysis (EFA) was run as explained above and its results
are displayed in Table 14. Five factors were extracted on the category level. They
account for 65.2% of the variance explained. Three items had loadings lower than
0.50 on their respective factor but could be assigned using the Fürntratt criteria. The
eigenvalues for the single factors as well as their Cronbach’s alpha were suitable.
Item name
Initial CITC
Cronbach's alpha if item
deleted
Initial Cronbach's
alpha (scale)Final CITC
JIT1 .447 .923 .924 .916JIT2 .583 .921 .916JIT3 .838 .917 .913JIT4 .096 .928 Item droppedJIT5 .682 .920 .916JIT6 .578 .921 .918JIT7 .492 .922 .918JIT8 .686 .919 .916JIT9 .194 .926 Item droppedJIT10 .581 .922 .918JIT11 .108 .926 Item droppedJIT12 .164 .926 Item droppedJIT13 .397 .924 .919JIT14 .567 .921 .920JIT15 .564 .922 .918JIT16 .372 .923 .919JIT17 .777 .917 .915JIT18 .787 .917 .913JIT19 .486 .922 .919JIT20 .737 .918 .914JIT21 .782 .918 .913JIT22 .412 .924 .920JIT23 .677 .919 .919JIT24 .529 .922 .919JIT25 .560 .921 .919JIT26 .617 .921 .915JIT27 .342 .924 .920JIT28 .707 .920 .915JIT29 .388 .923 .920JIT30 .431 .923 .918

Empirical analysis 39
Table 14: Just-in time – EFA category level
The five factors extracted are not corresponding to the theoretically expected four
practices. Items loading on other practices than expected were assigned to this new
practice if it was also comprehensible from a content perspective.
Apparently, sites that are focussing on set-up time reduction are also optimizing
their layout. Therefore these two practices are not independent and result in one
factor named optimization of set-up times and layout. The initial practice planning
adherence was too focused and is now included in optimized production planning
and control. A stronger emphasis on the process aspect is indicated by the EFA
results; it is reflected in the factor process driven organization. From the
theoretically expected factor pull production three items were dropped during the
reliability analysis, this results in a slight shift of contents. An additional factor
continuous flow production was extracted, based on items that were formerly
included in the practice layout optimization.
Practice Item nameFactor loading
Eigen value
Cronbach's alpha
JIT1 .757 4.009 .762
JIT3 .540
JIT5 .643
JIT10 .555
JIT17 .590
JIT23 .763
JIT2 .488 3.825 .783
JIT6 .503
JIT8 .533
JIT19 .591
JIT25 .652
JIT26 .649
JIT27 .857
JIT15 .712 3.628 .813
JIT16 .732
JIT18 .675
JIT24 .714
JIT29 .581
JIT7 .721 3.155 .720
JIT13 .496
JIT14 .748
JIT28 .562
JIT30 .611
JIT20 .427 2.330 .758
JIT21 .610
JIT22 .861
Optimized production
planning and controll
Optimization of set-up times
and layout
Process driven organisation
Pull production
Continuous flow
production

40 Empirical analysis
4.2.3.4 Effective management system (EMS)
Originally, 30 items grouped to four practices were meant to establish the category
effective management system (EMS). The four practices are: direction setting,
management commitment and company culture, employee involvement and
continuous improvement, and functional integration and qualification. The practices
and the items theoretically related to each of the practices are shown in Table 15.
Table 15: Effective management system – Initial items
Table 16 presents the results of the reliability analysis for each of the items in the
category effective management system. As mentioned in chapter 4.2.1 the items
EMS12 and EMS16 were excluded from further analysis. CITC scores were above
the 0.30 cut-off except for three items. The CITC score for EMS10 was 0.259, for
EMS13 0.263, and for EMS1411 0.229. As the score for Cronbach’s alpha if item
deleted did not indicate the removal of EMS13, only EMS10 and EMS14 were
dropped. After a second reliability analysis also EMS13 and EMS9 were dropped.
A third reliability analysis was conducted and each of the remaining items reached a
CITC score of above 0.30.
Practice Item name Item label
EMS1
EMS2
EMS3
EMS4
EMS5
EMS6
EMS7
EMS8
EMS9
EMS10
EMS11
EMS12
EMS13
EMS14
EMS15
EMS16
EMS17
EMS18
EMS19
EMS20
EMS21
EMS22
EMS23
EMS24
EMS25
EMS26
EMS27
EMS28
EMS29
EMS30
Supervisors include their employees in solving problems.
Our plant forms cross-functional project teams to solve problems.
The company takes care of the employees.
Functional integration
and qualification
Each of our employees within our work teams is cross-trained so that they can fill-in for others when necessary.
At our plant we have implemented a formal program to increase the flexibility of our production workers. Employees rotate to maintain their qualification.
In our company there are monthly open feedback meetings.
The information of these official feedback meetings is used systematically in further training.
We continuously invest in training and qualification of our workers. We have a dedicated development and qualification program for our production workers.
Our employees continuously strive to reduce any kind of waste in every process (e.g. waste of time, waste of production space etc.).
Command and control is seen as the most effective leadership style rather than open culture.
Employee involvement
and continuous
improvement
We have implemented tools and methods to deploy a continuous improvement process.
Our employees are involved in writing policies and procedures (concerning Site Vision down to Standard Operating Procedures)
Shop-floor employees actively drive suggestion programs.
Our work teams cannot take significant actions without supervisors or middle managers approval.
Our employees have the authority to correct problems when they occur.
Occurring problems should be solved by supervisors.
Management commitment
and company culture
Plant management empowers employees to continuously improve the processes and to reduce failure and scrap rates.
Plant management is personally involved in improvement projects.
There is too much competition and too little cooperation between the departments.
The communication is made via official channels.
The company has an open communication culture. There is a good flow of information between the departments and the different management levels.
About innovations we are informed early enough.
Problems (e.g. reclamations etc.) are always traced back to their origin to identify root causes and to prevent doing the same mistakes twice.
The achievement of high quality standards is primarily the task of our QA/ QC departments.
Direction setting
Our production site has an exposed site vision and strategy that is closely related to our corporate mission statement.
Our vision, mission and strategy is broadly communicated and lived by our employees.
Goals and objectives of the manufacturing unit are closely linked and consistent with corporate objectives. The production site has a clear focus.
The overall objectives of the production site are closely linked to the team or personal objectives of our shop-floor teams and employees.
Our manufacturing managers (Head of manufacturing, Site-leader etc.) have a good understanding of how the corporate/ divisional strategy is formed.
Our manufacturing managers know exactly what the most important criteria for manufacturing jobs are (i.e. low costs, delivery, quality etc.).

Empirical analysis 41
Table 16: Effective management system – Scale reliability scores
The Exploratory Factor Analysis (EFA) was run as explained above and its results
are displayed Table 17. Five factors were extracted on the category level. They
account for 63.1% of the variance explained. Two items had loadings lower than
0.50 on their respective factor but could be assigned using the Fürntratt criteria. The
eigenvalues for the single factors as well as their Cronbach’s alpha were suitable.
Item name Initial CITCCronbach's alpha if item
deleted
Initial Cronbach's
alpha (scale)
Final CITC
(2nd
loop)
EMS1 .565 .901 .906 .562
EMS2 .703 .898 .690
EMS3 .670 .900 .670
EMS4 .655 .899 .654
EMS5 .506 .903 .499
EMS6 .549 .902 .548
EMS7 .568 .902 .539
EMS8 .645 .901 .634
EMS9 .309 .906 Item dropped
EMS10 .259 .907 Item dropped
EMS11 .685 .900 .656
EMS13 .263 .906 Item dropped
EMS14 .229 .910 Item dropped
EMS15 .634 .900 .908
EMS17 .487 .903 .911
EMS18 .406 .904 .912
EMS19 .423 .904 .912
EMS20 .373 .905 .914
EMS21 .573 .901 .909
EMS22 .533 .902 .911
EMS23 .492 .903 .911
EMS24 .568 .902 .910
EMS25 .524 .903 .911
EMS26 .430 .904 .912
EMS27 .355 .905 .914
EMS28 .529 .902 .911
EMS29 .574 .901 .909
EMS30 .474 .903 .911

42 Empirical analysis
Table 17: Effective management system – EFA category level
The five factors extracted are not corresponding to the theoretically expected four
practices. Items loading on other practices than expected were assigned to this new
practice if it was also comprehensible from a content perspective.
Shared vision and culture is not only focussed on direction setting as derived from
theory but also includes cultural aspects. As the cultural aspect is assigned to the
first factor, the second factor is now named management commitment. The practice
functional integration and qualification could be confirmed and was enlarged by
one item. Also the practice employee involvement and continuous improvement was
confirmed, but in addition a fifth practice named employee empowerment could be
separated.
4.2.4 Summary factor analysis
The factor analysis identified 17 lean practices assigned to four categories that are
actually used in the pharmaceutical industry. These practices are for TPM:
Practice Item nameFactor loading
Eigen valueCronbach's
alphaEMS1 .847 4.222 .866
EMS2 .842
EMS3 .715
EMS5 .618
EMS11 .540
EMS25 .513
EMS4 .534 3.267 .818
EMS6 .719
EMS7 .551
EMS8 .597
EMS23 .721
EMS18 .438 3.011 .789
EMS26 .654
EMS27 .778
EMS28 .643
EMS29 .664
EMS30 .567
EMS15 .491 2.407 .731
EMS17 .512
EMS19 .719
EMS24 .607
EMS20 .834 2.230 .762
EMS21 .720
EMS22 .668
Shared vision and culture
Management commitment
Functional integration and qualification
Employee involvement
and continuous improvement
Employee empowerment

Empirical analysis 43
preventive maintenance, technology assessment and usage, and housekeeping; for
TQM: cross-functional process development and process control, process
measurement and reliability, supplier management and development, and customer
focus and satisfaction; for JIT: optimization of set-up times and layout, optimized
production planning and control, process driven organization, pull production, and
continuous flow production; and for EMS: shared vision and culture, management
commitment, functional integration and qualification, employee involvement and
continuous improvement, and employee empowerment. They are again displayed in
Figure 8.
Figure 8: Lean practices identified in pharmaceutical manufacturing
The following table shows the level of implementation of the single lean practices
in pharmaceutical manufacturing. It also includes the standard error of the average
value and a ranking of the practices, the lower the number the higher the
implementation. This table gives a first overview of the importance of the single
lean practices based on their level of implementation.
TPM TQM
JIT EMS
Cross-functional process development and process control
Process measurement and reliability
Supplier management and development
Customer focus and satisfaction
Optimization of set-up times and layout
Preventive maintenance
Housekeeping
Technology assessment and usage
Optimized production planning and control
Process driven organisation
Pull production
Continuous flow production
Shared vision and culture
Management commitment
Functional integration and qualification
Employee involvement and continuous improvement
Employee empowerment

44 Empirical analysis
Table 18: Implementation of lean practices
After identifying the lean practices used in pharmaceutical manufacturing the map
developed in chapter 3 has to be adapted.
Adaption of the map of relations 4.3
The map developed in chapter 3 is based on lean adoption in general and not only
for pharmaceutical production sites, therefore some adaptations need to be done
before using it for further analysis.
As an outcome of the factor analysis in chapter 4.2.4 17 lean practices could be
identified for pharmaceutical manufacturing that need to be matched with the
practices in the CLD. This leads on the one hand to the combination of some
practices and on the other hand to the deletion of practices that do not seem to be
applicable to pharmaceutical manufacturing according to the survey data. Table 19
shows the name of the single lean practices in the original mapping and the name of
the corresponding lean practices in pharmaceutical manufacturing.
Practice Mean SEPreventive maintenance 3.59 0.05 7Technology assessment and usage 2.91 0.06 14Housekeeping 3.98 0.06 3Cross-functional process development and process control 2.94 0.06 13Process measurement and reliability 3.69 0.05 5Supplier management and development 3.68 0.05 6Customer focus and satisfaction 3.76 0.06 4Optimization of set-up times and layout 2.71 0.05 16Optimized production planning and control 3.11 0.05 12Process driven organisation 3.40 0.06 9Pull production 3.13 0.05 11Continuous flow production 2.48 0.12 17Shared vision and culture 3.99 0.05 2Management commitment 4.13 0.04 1Functional integration and qualification 3.29 0.06 10Employee involvement and continuous improvement 3.50 0.06 8Employee empowerment 2.86 0.09 15
Rank

Empirical analysis 45
Table 19: Assignement of the lean practices
Supplier quality management and JIT delivery by suppliers were derived from
literature as two different lean practices, apparently this is not the case for
pharmaceutical production sites, and therefore the two are merged into supplier
management and development. The same holds true for SPC and process
management and variance reduction which are therefore also merged. The practice
management support and commitment derived from literature includes aspects of
both shared vision and culture and management commitment resulting from the
factor analysis, therefore these two practices are combined into one practice for
further analyses. The practice self-directed working teams is a combination of
employee empowerment and employee involvement and continuous improvement.
The factor analysis revealed that both practices can be regarded separately in the
pharmaceutical context. Based on literature, the practice self-directed working
teams was merged from different concepts, these are now split up again and the
influences in the map are adapted according to literature (dotted lines). Apparently
cycle time reduction and lot size reduction cannot be seen as independent lean
practices in pharmaceutical manufacturing; they are eliminated and the influences
are adapted (dotted lines).
The map including all changes in wording and influences is displayed in Figure 9. It
will be used in the following to display the correlations between lean practices in
strength and in direction.
Practices derived from literature Practices derived from EFA
preventive maintenance preventive maintenance
technology assessment and usage technology assessment and usage
housekeeping housekeeping
cross-functional product design cross-functional process development and process control
process management and variance reduction / SPC process measurement and reliability
supplier quality management / JIT delivery by suppliers supplier management and development
customer involvement customer focus and satisfaction
setup time reduction optimization of set-up times and layout
planning adherence optimized production planning and control
equipment layout optimization process driven organisation
pull system pull production
continuous product flow continuous flow production
management support and commitment shared vision and culture / management commitment
flexible, cross-functional workforce functional integration and qualification
employee involvement and continuous improvement
employee empowerment self-directed working teams

46 Empirical analysis
Figure 9: Adapted map of relations between lean practices
Also the measurement of the goals of the technically oriented lean bundles needs to
be defined for pharmaceutical manufacturing. The following table shows the key
performance indicators that will be used; a definition can be found in Appendix B.
Table 20: Measures for the goals of lean bundles
The lean practices used in pharmaceutical manufacturing and their level of
implementation were identified in this chapter. Further, their interconnections in
general were shown based on the adapted map from literature. As the aim is to
analyse the implementation and interconnection of lean practices in relation to
different competitive priorities, strategic groups need to be formed in a next step.
pull production
continuous flowproduction
optimization of set-uptimes and layout
quality improvementand stable processes
elimination ofexcess inventories
processmmeasurement and
reliability
employeeempowerment
supplier managementand development
preventivemaintenance
++
process drivenorganization
++
+
functional integrationand qualification
+
+
customer focus andsatisfaction
management commitment& shared vision and culture +
+
+
++
technologyassesment and usage
++
housekeeping
improved equipmentperformance+
+
+
++
++ +
+
++
+
+
optimized productionplanning and control
cross-functionalprocess
developmentand process
control +
+
+
++ +
+
employee involvement andcontinuous improvement
++
+
++
+
TPM:improved equipment performance
TQM:quality improvement and stable processes
JIT:elimination of excess inventories
OEE availability Complaint rate supplier Inventory days on handLoading Rejected batches Service level - deliveryMaintenance cost Complaint rate customer Production schedule accuracyUnplanned maintenance Cost of quality Production flexibility upsideAverage TPM level Average TQM level Set-up times
Material turnsAverage JIT level

Empirical analysis 47
Cluster analysis: Development of strategic groups 4.4
To develop strategic groups for pharmaceutical production sites cluster analysis was
used. It is a statistical method that categorizes objects or variables into homogenous
groups. The aim is to maximise the homogeneity of objects in the same cluster
while simultaneously maximizing the heterogeneity between the single clusters
(Hair et al., 2006). Two decisions are vital for the result of a cluster analysis: 1) the
decision which clustering algorithm to use and 2) the definition of the appropriate
number of clusters. The definition of the appropriate number of clusters does not
follow a clear process but is depending on the choice of the researcher (Janssen &
Laatz, 2010).
The two groups of clustering algorithms most frequently used are hierarchical and
non-hierarchical methods. Hierarchical methods have in common that they form
clusters by making a single pass through the data (Shah, 2002); objects that were
clustered once will not be rearranged later on (Backhaus, 2008). In contrast, non-
hierarchical methods or K-means methods allow a re-grouping of objects until
optima is reached, but they demand an initial partition and a fixed number of
clusters. A combination of both types of methods is recommended. A hierarchical
method is used to define the number of clusters and their centroids, and based on
this input a non-hierarchical method is run to refine the clusters (Ketchen & Shook,
1996; Shah, 2002).
Figure 10: Procedure used for cluster analysis
Identification of clustering variables
Outlier analysis
Hierarchical clustering: Ward’s method
Non-hierarchical clustering: K-means
Validation

48 Empirical analysis
Figure 10 shows the procedure used for the cluster analysis in this research. Before
starting with clustering, the underlying variables have to be identified and outliers
have to be excluded. The exclusion of outliers ensures that there is no distortion of
results. The next two steps include the actual clustering. First, the appropriate
number of clusters is defined using Ward’s method and second, the results are used
to define the final clusters. Finally, the results are validated. The following sections
describe each of the steps in greater detail.
4.4.1 Identification of clustering variables
A set of competitive priorities should be the basis for clustering of sites into
strategic groups. In the OPEX questionnaire it was asked for competitive priorities
the respondents planned to pursue (see Appendix B). The competitive priorities
used and the single variables, assigned to them in the OPEX questionnaire, are
shown in Table 21. Their content has been discussed in chapter 2.2.
Table 21: Competitive priorities used
Highly correlated variables may lead to a distortion of the results if they are not
weighted differently. As it is not possible to determine in advance how the weights
are distributed, a factor analysis is a good solution to create independent factors
(Backhaus, 2008). The 13 variables from Table 21 were tested to see if they are
determined by underlying dimensions. The KMO and Bartlett’s test with a MSA
value of 0.813 indicated that a factor analysis can be performed. A principal
component analysis with VARIMAX rotation was used analogue chapter 4.2 and
resulted in four factors (Table 22).
Competitive priority
Item name Item label
CP1
CP2
CP3
CP4
CP5
CP6
CP7
CP8
CP9
CP10
CP11
CP12
CP13 Increase capital investment productivity
Costs
Reduction of lead time
Quality
Service level
Reduction of cycle time
Reduction of set-up and cleaning time
Increase of flexibility of machines and labour
Acceleration of new product introductions
Increase of supplier quality performance
Reduction of process variance through statistical process control
Reduction of scrap rate
Flexibility
Increase on time delivery rate
Reduction of stock
Increase asset utilisation
Increase employee productivity

Empirical analysis 49
Table 22: Competitive priorities – EFA
The four factors extracted did not completely correspond to the theoretically
expected four competitive priorities but the changes were logical from a content
perspective. For quality all items could be assigned as expected, also for costs all
items except one could be confirmed. The content of the expected factor service
level was broadened by including three items; therefore the factor was renamed
delivery. Flexibility now only consists of two items. The scores for each factor were
calculated by adding up the individual scores for each of the corresponding
variables and dividing the result by the number of variables (Shah, 2002). The
variables are then standardised because some measures of similarity are influenced
by differences in variance. As suggested by Field (2000) the conversion to Z-scores
is used.
4.4.2 Outlier analysis
A dendrogram from a hierarchical cluster analysis based on the method single
linkage was used to identify outliers (Backhaus, 2008). The elimination of outliers
leads to better results of the following analysis. Five cases were excluded from
further analysis, resulting in a final sample of 200 cases (see Appendix C).
4.4.3 Hierarchical clustering
A two-stage approach was used to classify pharmaceutical production sites based on
their strategic orientation. In a first step Ward’s method with the squared Euclidean
distance measure was applied to determine the appropriate number of clusters. It
was chosen as it is able to create groups with low within cluster differences and
high between cluster differences (Backhaus et al., 2008). As suggested by Ketchen
& Shook (1996), the number of clusters was selected using multiple techniques.
Competitive priority
Item nameFactor loading
Eigen valueCronbach's
alphaCP1 .742 2.726 .819
CP2 .716
CP8 .727
CP9 .596
CP10 .635
CP11 .843 2.008 .790
CP12 .662
CP13 .728
CP3 .809 1.587 .790
CP4 .857
CP5 .860 1.490 .783
CP6 .589
CP7 .431
Quality
Delivery
Costs
Flexibility

50 Empirical analysis
Based on Lehmann (1979) the number of clusters should be limited to between n/30
and n/60, where n is the sample size. With 200 cases the final number of clusters
should be between three and seven.
Visual inspection of the dendrogram indicated a four cluster solution (see Appendix
C).
The agglomeration coefficient was used to create an elbow-diagram. An “elbow” in
the graph suggests that dissimilar clusters were combined and therewith indicates
the appropriate number of clusters. The interpretation of the graph may be difficult
as there can be no real elbow or several elbows (Ketchen & Shook, 1996). The data
slightly pointed to a four cluster solution (see Appendix C).
Finally, the incremental and percentage change in the agglomeration coefficient
were calculated. A large increase indicates the appropriate number of clusters as it
implies that dissimilar clusters were merged. It might be the case that no jumps or
several jumps can be observed. Table 23 shows the results for a seven to a one
cluster solution.
Table 23: Analysis of agglomeration coefficient - Ward's method
The largest increase in incremental change was from a two to a one cluster solution,
the second largest increase from a three to a two cluster solution and in percentage
change from a four to a three cluster solution. As a two cluster solution is not
corresponding to Lehmann’s (1979) guideline either a three or a four cluster
solution should be considered. Taking all techniques into account a four cluster
solution is chosen.
Cluster membership from Ward’s method was saved and cluster means were
computed.
Number of clusters
Agglomeration coefficient
Incremental change in coefficient
Percentage change in coefficient
7 263.64 19.29 7.3%6 282.92 21.84 7.7%5 304.76 33.14 10.9%4 337.90 83.83 24.8%3 421.73 85.03 20.2%2 506.76 205.77 40.6%1 712.53 - -

Empirical analysis 51
4.4.4 Non-hierarchical clustering
To adjust and optimize the results from Ward’s method K-means clustering
algorithm was used. The cluster centres obtained during hierarchical clustering were
used as initials for non-hierarchical clustering (Jensen, 2008 (in Herman); Shah,
2002). The final results are displayed in Table 24 showing the number of sites per
group and the cluster means of the clustering variables for each of the groups. A
positive value indicates a higher emphasis on the clustering variable than the
average; a negative value indicates a lower emphasis on the respective clustering
variable.
Table 24: Final cluster results - K-means method
200 sites were classified into four groups of varying size. Forty-nine sites formed
group one, seventy sites group two, forty-eight sites group three, and thirty-three
sites were part of group four. Group one had high positive loadings on all four
clustering variables whereas group three had (high) negative loadings on them. The
other two groups showed loadings in between.
The interpretation of the groups is based on the most important competitive priority
within a group and significant differences in emphasis among groups.
4.4.5 Validation of the groups
Often, the significance of differences of the cluster centres of variables across
groups is examined by conducting a univariate analysis of variance (ANOVA). It is
a parametric test which requires at least interval-scaled data and a normal curve of
distribution (Janssen & Laatz, 2010). Although the assumptions are met, non-
parametric tests will be used in this case as they are always an alternative (Brosius,
2011). Non-parametric tests do not use the values of the variables but e.g. their
frequency which leads to a lower discriminant power of the tests. Nevertheless, the
results are clear enough to allow a validation of the cluster analysis’ results.
The four groups which were identified in the previous chapter are independent
samples. To analyse if they show a different tendency in distribution the Kruskal-
1 49.000
1 2 3 4 2 70.000
Delivery .92048 .22568 -.80923 -.29485 3 48.000
Flexibility .79559 .32749 -.12338 -1.59837 4 33.000
Costs 1.01978 .00914 -.89295 .08479 200.000
Quality 1.00309 -.02818 -.99145 .24227 .000Missing
Final Cluster Centers
Cluster
Number of Cases in each Cluster
Cluster
Valid

52 Empirical analysis
Wallis H-test is used. It is a non-parametric version of a univariate ANOVA and
tests the hypothesis “there is no difference between the groups concerning the
evaluation of the factors”. Results show that the hypothesis can be rejected for all
four factors at a significance level of α=0.000. This means the groups differ
concerning the evaluation of the factors. Details are displayed in Table 25.
The Kruskal-Wallis H-test only shows if the groups differ, therefore a second test is
performed. The post-hoc Mann-Whitney U-test analyses the difference of each
factor of one group to another by testing the hypothesis “variables do not differ in
the two samples of strategic groups”. For this reason, it is an alternative to a
parametric t-test. Results show that the hypothesis has to be accepted for two cases
(see Table 25). The variables costs and quality do not differ in the two samples of
strategic groups, namely group 2 (flexible deliverers) and group 4 (efficient
conformers).
Table 25: Competitive priorities emphasised by strategic groups
The results from cluster analysis, Kruskal-Wallis H-test, and post-hoc Mann-
Whitney U-test are summarised in Table 25. Also the names of the groups, derived
later in this research, are included. For better interpretability the average values per
group are calculated instead of the standardised values. The highest possible value
1 2 3 4
Do All Flexible deliverers Flexible starters Efficient conformers F = Chi square
n = 49 n = 70 n = 48 n = 33 p = Symp. sig.
DeliveryCluster mean 4.69 (2, 3, 4) 4.19 (1, 3, 4) 3.46 (1, 2, 4) 3.82 (1, 2, 3) F = 103.047SE 0.05 0.06 0.07 0.10 p = 0.000Rank 2 2 3 3
FlexibilityCluster mean 4.65 (2, 3, 4) 4.21 (1, 3, 4) 3.79 (1, 2, 4) 2.41 (1, 2, 3) F = 109.093SE 0.06 0.06 0.10 0.07 p = 0.000Rank 3 1 1 4
CostsCluster mean 4.74 (2, 3, 4) 4.09 (1, 3) 3.51 (1, 2, 4) 4.14 (1, 3) F = 99.789SE 0.05 0.06 0.07 0.08 p = 0.000Rank 1 3 2 1
QualityCluster mean 4.43 (2, 3, 4) 3.71 (1, 3) 3.03 (1, 2, 4) 3.90 (1, 3) F = 105.972SE 0.06 0.05 0.07 0.08 p = 0.000Rank 4 4 4 2
Competitive priority

Empirical analysis 53
would be 5.0, the lowest 1.0. Further, the standard error of the average value per
group and the rank are included. The rank shows the relevance of a factor in a
group. The numbers in parentheses mark those factors which differ between groups
at a significance level of α=0.05.
Building on these results the single groups can be described and named.
4.4.5.1 Cluster 1: Do all
The first group of 49 production sites has the highest emphasis on all competitive
priorities compared to the other three groups. The group’s emphasis on all four
priorities is simultaneously high and exceeds 4.4, which leads to the name do all
analogue to Kathuria (2000). Further, the emphasis on all competitive priorities is
significantly different from that in the other three groups and therewith separates
this group from the rest. This group represents about 25% of all cases in the four
clusters.
4.4.5.2 Cluster 2: Flexible deliverers
The second group, being with 70 production sites the largest, has the highest
emphasis on both delivery and flexibility. Compared to the other groups it has the
second highest emphasis and values are significantly different. This group is similar
to Deflorin’s (2007) logisticians that have a focus on fast and punctual delivery as
well as high volume flexibility combined with a broad range of products. Some
similarities also exist with Christiansen et al.’s speedy deliverers and Kathuria’s
speedy conformers. This group, reflecting 35% of all cases in the four clusters, is
therefore named flexible deliverers. Concerning costs and quality there is no
significant difference in emphasis compared to group four.
4.4.5.3 Cluster 3: Flexible starters
The third group of 48 production sites has a significantly lower emphasis on
delivery, costs and quality compared to the other three groups. Only flexibility is
ranked significantly higher than by group four members, nevertheless is it still
below the average emphasis as can be seen on the standardised values in Table 24.
The group is similar to Miller and Roth’s (1994) caretakers or Kathuria’s (2000)
starters, which also have a low emphasis on the development of competitive
priorities. The emphasis is below 3.80 on all four priorities, with the highest (3.79)
on flexibility. The sites in this group appear to be emphasising flexibility in order to

54 Empirical analysis
be able to introduce new products quickly and to make fast changes in
manufacturing. This is in contrast to Miller and Roth’s or Kathuria’s groups which
have a focus on price or quality. The group is therefore named flexible starters. It
accounts for 24% of all cases.
4.4.5.4 Cluster 4: Efficient conformers
The final group of 33 production sites has a high emphasis on costs and also on
quality. It is the only group for which quality does not have the lowest emphasis.
Nevertheless, the values are not significantly different from the second group. It
resembles almost completely the efficient conformers from Kathuria (2000) and is
therefore equally named. It consists of 16% of all cases.
Pharmaceutical production sites can be divided into the four strategic groups do all,
flexible deliverers, flexible starters, and efficient conformers, which are focusing on
different sets of competitive priorities. The strategic groups could be verified by
existing literature; this strengthens their validity.
In the next chapter the relation between the strategic groups and the implementation
of the 17 lean practices identified in chapter 4.2.4 and structured in chapter 4.3 are
investigated. This should show if different strategic groups demand a different
implementation of lean practices.
Comparison of strategic groups 4.5
The four strategic groups identified and described in chapter 4.4 are examined
concerning their implementation of the 17 lean practices from chapter 4.2.4. This
examination is considering the general level of implementation by displaying means
and ranks as well as differences in implementation among groups by using analysis
of variance. Further, the map from chapter 4.3 is filled with data and the relations
between lean practices are tested for the different strategic groups using
correlations.
4.5.1 Analysis of variance and multiple comparisons
Analysis of variance (ANOVA) is a statistical method to compare the means of
more than two groups based on the F-value. To ensure validity of the ANOVA’s
results the following assumptions have to be met (Hair et al., 2006; Brosius, 2011;
Janssen & Laatz, 2010):

Empirical analysis 55
• The dependant variable is measured at least at interval level.
• The population of the dependant variable is normally distributed. This can be
tested using Q-Q plots, histograms, and tests of normality like Kolmogorov-
Smirnov (n≥50) or Shapiro-Wilk (n<50).
• Variances in the different groups are equal for the variables examined. To
test for homogeneity of variances the Levene test is used.
• Cases are selected on random.
• In case of a one-way ANOVA the samples have to be independent.
Independent means that the composition of one sample is not depending on
the composition of the other sample.
Nevertheless, according to Herrmann & Seilheimer (2000) the F-test is relatively
robust concerning the violation of the assumption of normal distribution and
homogeneity of variance. This is especially the case for large samples and groups of
equal size. If the assumptions for an ANOVA are not met, non-parametric tests can
be performed. As the assumptions of non-parametric test are weaker than those of
parametric test their results are consequently not as sharp and clear as those of
parametric tests. For more than two independent samples the Kruskal-Wallis test
(see 4.4.5) should be performed.
For the analysis in this chapter the independent variable is the strategic group, the
dependent variables are the single lean practices. Although multiple dependent
variables are considered, a univariate approach is chosen. Following Bortz &
Schuster (2010) a univariate approach should be used if the aim is to explore mutual
relationships of the dependent variables and their importance for group differences.
For testing hypotheses and identifying variables which contribute most to
differences in samples, a multivariate approach would be chosen.
First, a one-way ANOVA is used to test the null hypothesis that all groups are
random samples of the same population and therewith have equal means. If this null
hypothesis can be rejected multiple comparisons are conducted as a second step to
see in detail which groups differ in their means. There are various possibilities of
tests to conduct multiple comparisons, mainly distinguishing between equal
variance assumed and equal variance not assumed. They will be explained in detail
later on.
Before the ANOVAs can be calculated the assumptions have to be checked:
• The dependant variable for each ANOVA is one of the lean practices. They

56 Empirical analysis
are measured on a five-point Likert scale which can be regarded as interval
level.
• The 17 dependant variables are tested for normal distribution using Q-Q
plots, histograms, and Kolmogorov-Smirnov and Shapiro-Wilk tests. For 14
lean practices a normal distribution could be confirmed. The practices
housekeeping, continuous flow production, and management commitment are
not normally distributed. For these three practices a non-parametric Kruskal-
Wallis test is performed in addition to the parametric tests. As the number of
observations is higher than 30 also the central limit theorem applies (Bortz &
Schuster, 2010), allowing the use of parametric tests.
• The Levene test for homogeneity of variance reveals that only cross-
functional process development and process control does not have equal
variances in the different groups. In addition to the tests for equal variance
assumed also tests for equal variance not assumed will be conducted.
• The selection of cases on random is given and the samples are independent.
As the assumptions are met the ANOVAs are calculated to test the hypothesis
“there is no difference between the groups concerning the implementation of the
lean practices”. Results show that the hypothesis can be rejected for ten of the 17
lean practices at a significance level of α=0.05. The non-parametric Kruskal-Wallis
test produces the same results. One or more groups are different from each other in
ten lean practices from the categories TQM, JIT, and EMS: cross-functional process
development and process control, process measurement and reliability, supplier
management and development, customer focus and satisfaction, optimization of set-
up times and layout, optimized production planning and control, continuous flow
production, shared vision and culture, management commitment, and employee
involvement and continuous improvement. Lean practices from the category TPM as
well as four other practices do not seem to differ significantly in implementation
between groups. Details are displayed in Table 26.
The ten factors, the groups show significant differences for, are investigated in
greater detail by calculating multiple comparisons as post-hoc tests. As two of the
ten factors are not normally distributed, parametric as well as non-parametric tests
are applied. Further, one of ten factors is not homogeneous in variance which also
requires a different test. All tests are conducted with a significance level of α=0.05.
For homogeneous variances the tests Bonferroni, Scheffé, Tukey, and Waller-
Duncan are applied. For the one factor that is not homogeneous in variance the tests

Empirical analysis 57
Tamhane-T2 and Games-Howell are chosen. The single tests are shortly explained
in the next paragraph. In addition, the factors with non-normal distribution are
analysed by applying the Mann-Whitney U-test (see 4.4.5).
Bonferroni is based on the single t-test between group means but it corrects the
error that occurs from multiple testing. The results are also exact for peer groups of
different size. The Scheffé test is based on the F-distribution and is relatively
conservative as it only reports bigger differences in means as significant. The results
are also exact for peer groups of different size. Besides pairwise comparisons it also
offers homogeneous subsets. Turkey’s test is also conducting pairwise comparisons
based on the Student distribution. It is the most common and robust method as it is
not strongly influenced by violations of its assumptions.
The Waller-Duncan test is comparing means based on the t-statistic by using a
Bayesian approach; output is a set of homogeneous subgroups. The speciality of this
test is the possibility to control the Type II Error.
Tamhane-T2 test is based on the t-statistic and offers rather conservative estimates.
For equal variances the results are identical to those of Bonferroni. Games-Howell
is used for pairwise comparisons if variances are not equal. It can also be used in
case of non-normality of the variables.
The results from the one-way ANOVA, Kruskal-Wallis test, and the post-hoc tests
are summarised in Table 26. The average values of the implementation level of the
single lean practices per group are calculated. Further, the standard error of the
average value per group and the rank are included. The rank shows the relevance of
a lean practice in a group measured by its level of implementation. The numbers in
parentheses mark those factors which differ between groups at a significance level
of α=0.05.

58 Empirical analysis
Table 26: Implementation of lean practices by competitive priority clusters
2 3 4
Lean practice Flexible deliverers Flexible starters Efficient conformers F = valuen = 70 n = 48 n = 33 p = propability
Preventive maintenanceCluster mean 3.77 3.53 3.44 3.75 F = 2.629SE 0.08 0.09 0.11 0.11 p = 0.051Rank 7 6 6 4
Technology assessment and usageCluster mean 3.13 2.93 2.80 2.70 F = 1.968SE 0.12 0.10 0.11 0.16 p = 0.120Rank 14 13 12 14
HousekeepingCluster mean 4.18 3.95 3.85 3.95 F =1.316SE 0.12 0.10 0.12 0.16 p = 0.270Rank 3 2 2 3
Cross-functional process development and process controlCluster mean 3.25 (3, 4) 3.00 2.76 (1) 2.63 (1) F = 4.319SE 0.12 0.10 0.11 0.19 p = 0.006Rank 12 12 13 15
Process measurement and reliabilityCluster mean 4.05 (2, 3, 4) 3.67 (1) 3.54 (1) 3.39 (1) F = 6.436SE 0.11 0.09 0.10 0.14 p = 0.000Rank 4 5 4 7
Supplier management and developmentCluster mean 3.99 (3, 4) 3.69 3.45 (1) 3.55 (1) F = 5.433SE 0.09 0.08 0.11 0.13 p = 0.001Rank 5 4 5 5
Customer focus and satisfactionCluster mean 4.05 (3, 4) 3.81 3.54 (1) 3.53 (1) F = 4.133SE 0.11 0.11 0.12 0.11 p = 0.007Rank 4 3 4 6
Optimization of set-up times and layoutCluster mean 3.05 (3, 4) 2.71 2.57 (1) 2.48 (1) F = 5.636SE 0.09 0.09 0.09 0.15 p = 0.001Rank 15 16 15 16
Optimized production planning and controlCluster mean 3.34 (4) 3.08 3.00 2.98 (1) F = 3.027SE 0.09 0.08 0.08 0.13 p = 0.031Rank 10 11 11 12
Process driven organisationCluster mean 3.57 3.43 3.42 3.11 F = 2.201SE 0.12 0.09 0.10 0.16 p = 0.089Rank 8 8 7 10
Pull productionCluster mean 3.30 3.12 3.08 2.99 F = 1.298SE 0.11 0.09 0.10 0.13 p = 0.277Rank 11 10 10 11
Continuous flow productionCluster mean 2.81 2.85 (3, 4) 2.12 (2) 2.23 (2) F = 2.963SE 0.30 0.21 0.21 0.20 p = 0.037Rank 16 15 16 17
Shared vision and cultureCluster mean 4.29 (2, 3) 3.95 (1) 3.78 (1) 3.99 F = 5.520SE 0.08 0.07 0.10 0.12 p = 0.001Rank 2 2 3 2
Management commitmentCluster mean 4.52 (2, 3, 4) 4.08 (1) 3.93 (1) 4.01 (1) F = 10.870SE 0.07 0.07 0.08 0.11 p = 0.000Rank 1 1 1 1
Functional integration and qualificationCluster mean 3.54 3.19 3.20 3.20 F = 2.153SE 0.12 0.09 0.13 0.15 p = 0.095Rank 9 9 9 9
Employee involvement and continuous improvementCluster mean 3.87 (3, 4) 3.52 3.29 (1) 3.33 (1) F = 5.594SE 0.11 0.09 0.11 0.11 p = 0.001Rank 6 7 8 8
Employee empowermentCluster mean 3.19 2.91 2.65 2.86 F = 1.129SE 0.24 0.18 0.16 0.19 p = 0.343Rank 13 14 14 13
1
Do Alln = 49

Empirical analysis 59
The plants belonging to the do all group have for all except one lean practice the
highest level of implementation. Only the flexible deliverers put higher emphasize
on continuous flow production. In nine of ten cases where lean practices are
significantly different from each other in one or more groups, the do all group is
involved.
4.5.1.1 Do all
Implementation levels for the do all group range on a scale of one to five between
4.52 for management commitment and 2.81 for continuous flow production. For the
do all group the five (due to equal values six) highest implemented lean practices
are: management commitment (4.52), shared vision and culture (4.29),
housekeeping (4.18), process measurement and reliability and customer focus and
satisfaction (both 4.05), and supplier management and development (3.99).
Figure 11: Implementation levels for do all-cluster
4.5.1.2 Flexible deliverers
The group flexible deliverers puts its focus on the implementation of the following
lean practices: management commitment (4.08), housekeeping and shared vision
and culture (both 3.95), customer focus and satisfaction (3.81), supplier
management and development (3.69), and process measurement and reliability
(3.67).
3,19
Preventive maintenance
3,87
Optimized production planning and control
3,54
Continuous flow production 2,81
Cross-functional process development and process control
3,30
Functional integration and qualification
3,57
Pull production
3,34
Optimization of set-up times and layout 3,05
Employee involvement and continuous improvement
3,99
3,25
Supplier management and development
4,18
3,13
Employee empowerment
Process driven organisation
3,77
Housekeeping
Customer focus and satisfaction 4,05
Process measurement and reliability 4,05
Shared vision and culture 4,29
Management commitment 4,52
Technology assessment and usage

60 Empirical analysis
Figure 12: Implementation levels for flexible deliverers-cluster
4.5.1.3 Flexible starters
The flexible starters have the highest implementation levels for: management
commitment (3.93), housekeeping (3.85), shared vision and culture (3.78), process
measurement and reliability and customer focus and satisfaction (both 3.54), and
supplier management and development (3.45).
Figure 13: Implementation levels for flexible starters-cluster
2,93
Employee involvement and continuous improvement
3,53
Pull production
3,19
Optimization of set-up times and layout 2,71
Cross-functional process development and process control
3,08
Functional integration and qualification
3,43
Optimized production planning and control
3,12
Continuous flow production 2,85
Preventive maintenance
3,67
3,00
Process measurement and reliability
3,95
2,91
Technology assessment and usage
Process driven organisation
3,52
Shared vision and culture
Supplier management and development 3,69
Customer focus and satisfaction 3,81
Housekeeping 3,95
Management commitment 4,08
Employee empowerment
2,76
Process driven organisation
3,44
Pull production
3,20
Continuous flow production 2,12
Technology assessment and usage
3,00
Functional integration and qualification
3,29
Optimized production planning and control
3,08
Optimization of set-up times and layout 2,57
Preventive maintenance
3,45
2,80
Supplier management and development
3,78
2,65
Cross-functional process development and process control
Employee involvement and continuous improvement
3,42
Shared vision and culture
Customer focus and satisfaction 3,54
Process measurement and reliability 3,54
Housekeeping 3,85
Management commitment 3,93
Employee empowerment

Empirical analysis 61
4.5.1.4 Efficient conformers
For the group efficient conformers the implementation of the following five lean
practices is rated highest: management commitment (4.01), shared vision and
culture (3.99), housekeeping (3.95), preventive maintenance (3.75), and supplier
management and development (3.55).
Figure 14: Implementation levels for efficient conformers-cluster
4.5.1.5 Summary
For all four groups the implementation of the lean practice management
commitment is the highest. The do all group significantly differs in the
implementation from the other three groups, which have similar implementation
levels. Except for the flexible starters all groups have the second highest
implementation level for shared vision and culture another lean practice coming
from the category EMS. The group do all also significantly differs from the flexible
deliverers and the flexible starters in the implementation of this lean practice.
Housekeeping is implemented third respectively second highest with no significant
difference between groups. Supplier management and development is also among
the highest implemented practices for all groups with significant differences
between the groups do all, flexible starters, and efficient conformers. All groups
except the efficient conformers have high implementation levels for the practices
process measurement and reliability and customer focus and satisfaction. For the
first practice the do all group significantly differs from all other groups, for the
2,70
Employee involvement and continuous improvement
3,39
Pull production
3,11
Continuous flow production 2,23
Employee empowerment
2,98
Process driven organisation
3,20
Optimized production planning and control
2,99
Optimization of set-up times and layout 2,48
Process measurement and reliability
3,53
2,86
Customer focus and satisfaction
3,95
2,63
Technology assessment and usage
Functional integration and qualification
3,33
Housekeeping
Supplier management and development 3,55
Preventive maintenance 3,75
Shared vision and culture 3,99
Management commitment 4,01
Cross-functional process development and process control

62 Empirical analysis
second practice only from the flexible starters and the efficient conformers. The
efficient conformers are the only group that has preventive maintenance among the
five highest implemented lean practices.
A similar picture can be seen for the five lean practices that are implemented lowest
in the single groups. The lean practice continuous flow production has the lowest
implementation except for the flexible deliverers which significantly differ from the
flexible starters and the efficient conformers. It is the only lean practice where the
implementation level of the do all group is not higher than that of the other three
groups. The second lowest implementation level, respectively the lowest for flexible
deliverers, can be found with the lean practice optimization of set-up times and
layout. The do all group significantly differs from the flexible starters and the
efficient conformers. There are also low implementation levels for the lean practices
employee empowerment, technology assessment and usage, as well as cross-
functional process development and process control. For the last practice the values
from the groups do all, flexible starters, and efficient conformers significantly
differ.
The remaining lean practices show significant differences between groups in two
cases. For optimized production planning and control the do all and the efficient
conformers groups differ; for employee involvement and continuous improvement
the groups do all, flexible starters, and efficient conformers show significant
differences.
This shows that independent from the strategic group the same lean practices are
regarded as important and are therefore implemented but partly with varying levels
between groups. The same holds true for those lean practices regarded as least
important and therewith lowest implemented.
To better understand the importance of single lean practices for the competitive
priority groups, their implementation levels in a specific group are compared in
detail. For this comparison within-cluster paired-sample t-tests are conducted.
4.5.2 Within-cluster paired-sample t-tests
Within-cluster paired-sample t-tests are a good possibility to enlighten the
relationship between the lean practices implemented in the strategic groups, as it
tests if there is a difference in the implementation level. A paired-sample t-test is
used as the variables are not independent. All values are filled in by the same plants

Empirical analysis 63
and it is assumed that the implementation of the single lean practices is connected
(Brosius, 2011). An assumption for the use of a paired-sample t-test is the normal
distribution of the difference values. For samples larger than 30 pairs of
observations the central limit theorem is applicable and it can be assumed that they
are normally distributed (Bortz & Schuster, 2010). Again, it is tested whether there
is a difference between the means of single lean practices. In line with the results
for the paired-sample tests also paired sample correlations are provided. If the
correlation of the list of measurements is not positive, but instead negative, the
paired-sample t-test loses power. This means that the probability that existing
differences are identified as significant is declining. In this case the non-parametric
Wilcoxon test can be used. Only if the difference value is very high the reduced test
power has no influence.
For the paired samples examined 29 out of 544 have a negative correlation from
which two are significant at the 0.05 level or less and two on the 0.10 level or less.
Those being significant on the 0.05 level or less show a difference value of 0.224
and 0.097and those at the 0.10 level or less of 0.881 and 0.667. The last two values
are high enough to assume that even with a lower power the results are right, the
first two values indicate, that a Wilcoxon test should be calculated. The Wilcoxon
test leads to the same results as the paired-sample t-test; therefor in the following
the results from the t-test will be reported. All combinations shown in Table 27 to
Table 30 are significantly different at the 0.05 level or less, except those marked "*"
which are significantly different at the 0.10 level or less. The results for the single
strategic groups are described in detail always considering the level of
implementation measured for each lean practice (see Table 26).
4.5.2.1 Do all
The do all group shows a significantly better implementation of management
commitment compared to all other lean practices. The same holds true for shared
vision and culture which is only implemented lower than management commitment
and equal to housekeeping. Housekeeping is implemented significantly higher than
twelve other lean practices. It shows a lower level of implementation than
management commitment and the same implementation level as shared vision and
culture, process measurement and reliability, and customer focus and satisfaction.
Process measurement and reliability as well as customer focus and satisfaction are
implemented significantly higher than ten other lean practices but they show lower

64 Empirical analysis
levels of implementation than management commitment and shared vision and
culture. Their implementation levels are equal to those of housekeeping, customer
focus and satisfaction (process measurement and reliability, respectively), supplier
management and development, and employee involvement and continuous
improvement. Supplier management and development as the last one of the highest
implemented lean practices has a significantly higher implementation level than ten
other practices as well but different to process measurement and reliability and
customer focus and satisfaction it has a significantly lower implementation level
than housekeeping. The analysis shows that also employee involvement and
continuous improvement should be considered as one of the top implemented
practices as it does not significantly differ from those ranked fourth and fifth. Also
preventive maintenance seems to be part of the higher implemented practices as it is
not significantly different from employee involvement and continuous improvement.
All practices implemented lower than preventive maintenance significantly differ
from the practices named so far.
Table 27: Pairwise t-test for do all-cluster
Concerning the rank of lean practices this shows that especially management
commitment is significantly outstanding for the do all group. The second highest
priority is already equal to the third highest which does not significantly differ from
Lean Practice
1 2 3 4 5 6 7 8 9 10 11 12 13 14 15 16 17
1 + - + - - - + + +* + + - - +*
2 - - - - -* - - - - -
3 + +* + + + + + - + + +
4 - - - - - - - -
5 + + + + + - - + +
6 + + + + + - - + +
7 + + + + + - - +
8 - - - - - - -
9 - - - - -
10 + - - -
11 + - - -* -
12 - - -* -
13 - + + +
14 + + +
15 -
16
17
1 Preventive maintenance, 2 Technology assessment and usage, 3 Housekeeping, 4 Cross-functional process development and process control,5 Process measurement and reliability, 6 Supplier management and development, 7 Customer focus and satisfaction, 8 Optimization of set-up times and layout, 9 Optimized production planning and control, 10 Process driven organisation, 11 Pull production, 12 Continuous flow production, 13 Shared vision and culture, 14 Management commitment, 15 Functional integration and qualification, 16 Employee involvement and continuous improvement,17 Employee empowerment
+ (-) practice on the right side is significantly higher (lower) implemented than practice on top * practices significantly differ at α = 0.10

Empirical analysis 65
the two practices coming after. This picture is continued until the lean practice of
preventive maintenance. It can be regarded as a splitting point for the most
important lean practices in the do all group. The do all group has the strongest focus
on management commitment from all groups. This strong focus may be necessary as
they concentrate on a lot of different competitive priorities and therefore need a
committed management even more than others.
4.5.2.2 Flexible deliverers
The flexible deliverers group shows a significantly better implementation of
management commitment compared to all other lean practices except for
housekeeping and shared vision and culture. The same holds true for housekeeping
which is only implemented equal to management commitment, shared vision and
culture, and customer focus and satisfaction. Shared vision and culture is
implemented significantly higher than thirteen other lean practices. It shows the
same implementation level as housekeeping, management commitment, and
customer focus and satisfaction. Customer focus and satisfaction is implemented
significantly higher than eleven other lean practices but it shows a lower level of
implementation than management commitment. Its implementation level is equal to
those of housekeeping, shared vision and culture, process measurement and
reliability, and supplier management and development. Supplier management and
development has a significantly higher implementation level than ten other practices
but different to the practices mentioned before it is significantly lower implemented
than management commitment, shared vision and culture, and housekeeping. Its
implementation level is equal to customer focus and satisfaction, process
measurement and reliability, and preventive maintenance. Process measurement
and reliability as the last of the highest implemented lean practices has a
significantly higher implementation level than nine other practices. Equally to
supplier management and development it is implemented significantly lower than
three other lean practices but the implementation level is equal to customer focus
and satisfaction, supplier management and development, preventive maintenance,
and employee involvement and continuous improvement. The analysis shows that
also preventive maintenance should be considered as one of the top implemented
practices as it does not significantly differ from those ranked fourth and fifth. It is
also implemented equally to employee involvement and continuous improvement as
well as process driven organization. Also employee involvement and continuous
improvement seems to be part of the higher implemented practices as it is not

66 Empirical analysis
significantly different from process measurement and reliability, ranked fifth. Its
implementation is also equal to preventive maintenance and process driven
organization. All practices implemented lower than process driven organization
significantly differ from the practices named so far.
In contrast to the do all group the flexible deliverers do not have a significantly
higher implementation of one outstanding practice. Instead management
commitment, housekeeping, and shared vision and culture form a triad. Following
their strategic focus on fast and punctual delivery the flexible deliverers have
implemented customer focus and satisfaction on an equal level to housekeeping and
shared vision and culture. Like for the do all group there can be found a splitting
point for the most important lean practices. In this case process driven organization
is the last practice to be included, which corresponds to the strategic focus of the
group.
Table 28: Pairwise t-test for flexible deliverers-cluster
4.5.2.3 Flexible starters
The flexible starters group shows a significantly better implementation of
management commitment compared to all other lean practices except for
housekeeping. The same holds true for housekeeping which is only implemented
Lean Practice
1 2 3 4 5 6 7 8 9 10 11 12 13 14 15 16 17
1 + - + - + + + + - - + +
2 - - - - + -* - - - - -
3 + + + + + + + + + + +
4 - - - + - + - - -* -
5 + + + + + - - + +* +
6 + + + + + - - + +
7 + + + + + - + + +
8 - - - - - - -
9 - + - - - +
10 + + - - +* +
11 + - - -
12 - - - -
13 -* + + +
14 + + +
15 - +
16 +
17
1 Preventive maintenance, 2 Technology assessment and usage, 3 Housekeeping, 4 Cross-functional process development and process control,5 Process measurement and reliability, 6 Supplier management and development, 7 Customer focus and satisfaction, 8 Optimization of set-up times and layout, 9 Optimized production planning and control, 10 Process driven organisation, 11 Pull production, 12 Continuous flow production, 13 Shared vision and culture, 14 Management commitment, 15 Functional integration and qualification, 16 Employee involvement and continuous improvement,17 Employee empowerment
+ (-) practice on the right side is significantly higher (lower) implemented than practice on top * practices significantly differ at α = 0.10

Empirical analysis 67
equal to management commitment and shared vision and culture. Shared vision and
culture is implemented significantly higher than fourteen other lean practices. It
shows the same implementation level as housekeeping but a significantly lower
implementation than management commitment. In contrast to the two clusters
analysed before the following practices are significantly different to those three lean
practices. As the name flexible starters indicates this group has a low emphasis on
the development of competitive priorities and therefore apparently has not
implemented as much lean practices as the other clusters. In their implementation
process they seem to focus on some practices only. Customer focus and satisfaction
as well as process measurement and reliability are implemented significantly higher
than nine other lean practices but show a lower level of implementation than
management commitment, housekeeping, and vision and culture. Their
implementation level is equal to those of supplier management and development,
preventive maintenance, and process driven organization. Supplier management
and development has a significantly higher implementation level than seven other
practices and is implemented significantly lower than the top three practices. Its
implementation level is equal to customer focus and satisfaction, process
measurement and reliability, preventive maintenance, process driven organization,
employee involvement and continuous improvement, and functional integration and
qualification.
This large number of equally implemented practices on an intermediate level
reflects again the starting position of the flexible starters. All practices following are
implemented equally to at least one other practice without the splitting point that
could be found in the other two clusters.

68 Empirical analysis
Table 29: Pairwise t-test for flexible starters-cluster
4.5.2.4 Efficient conformers
The efficient conformers group shows a significantly better implementation of
management commitment compared to all other lean practices except for
housekeeping and shared vision and culture. The same holds true for shared vision
and culture which is only implemented equal to management commitment and
housekeeping. Housekeeping is implemented significantly higher than thirteen other
lean practices. It shows the same implementation level as management commitment,
shared vision and culture and preventive maintenance. Preventive maintenance is
implemented significantly higher than eleven other lean practices but it shows a
lower level of implementation than management commitment and shared vision and
culture. Its implementation level is equal to those of housekeeping, supplier
management and development, and customer focus and satisfaction. Supplier
management and development has a significantly higher implementation level than
ten other practices but it is significantly lower implemented than management
commitment, shared vision and culture, and housekeeping. Its implementation level
is equal to preventive maintenance, customer focus and satisfaction, and process
measurement and reliability. Like for the group flexible starters there are several
Lean Practice
1 2 3 4 5 6 7 8 9 10 11 12 13 14 15 16 17
1 + - + + + + + - - +
2 - - - - +* - -* + - - - -
3 + + + +* + + + + + + + +
4 - - - +* - - - + - - - -
5 + + + + - - + +* +
6 + + + + - - +
7 + + + + -* - + +* +
8 - - - + - - - -
9 - + - - - +
10 + + - - +
11 + - -
12 - - - - -*
13 -* + + +
14 + + +
15 +
16 +
17
1 Preventive maintenance, 2 Technology assessment and usage, 3 Housekeeping, 4 Cross-functional process development and process control,5 Process measurement and reliability, 6 Supplier management and development, 7 Customer focus and satisfaction, 8 Optimization of set-up times and layout, 9 Optimized production planning and control, 10 Process driven organisation, 11 Pull production, 12 Continuous flow production, 13 Shared vision and culture, 14 Management commitment, 15 Functional integration and qualification, 16 Employee involvement and continuous improvement,17 Employee empowerment
+ (-) practice on the right side is significantly higher (lower) implemented than practice on top * practices significantly differ at α = 0.10

Empirical analysis 69
lean practices following which have equal implementation levels and no splitting
point can be found. Only the lowest implemented lean practice continuous flow
production can be separated from the others.
In contrast to all other groups examined before the efficient conformers do neither
have outstanding practices nor do they have a splitting point which separates higher
implemented practices from those that are lower implemented. The strategic focus
on costs and quality is not clearly reflected in the implementation of the different
lean practises.
Table 30: Pairwise t-test for efficient conformers-cluster
4.5.2.5 Summary
This analysis shows that even if the strategic groups focus more or less on the same
lean practices, there are differences in the emphasis on the practices within the
groups. Especially the do all group has a focus on one practice, management
commitment, so that its implementation level is clearly above other practices.
Further, a splitting point, separating the most important lean practices from the
others, could be identified. A contrast is the efficient conformers-cluster where no
clear separation of the practices could be observed.
Lean Practice
1 2 3 4 5 6 7 8 9 10 11 12 13 14 15 16 17
1 + + + + + + + + -* -* + + +
2 - - - - -* -* - - - - -
3 + + + + + + + + + + + +
4 - - - -* - -* - - - -
5 + + + + + - - +
6 + + + + + - - + +* +
7 + + + + + - - + +
8 - - - +* - - - - -
9 + - - -* -
10 + - -
11 + - - -
12 - - - - -
13 + + +
14 + + +
15 +*
16 +
17
1 Preventive maintenance, 2 Technology assessment and usage, 3 Housekeeping, 4 Cross-functional process development and process control,5 Process measurement and reliability, 6 Supplier management and development, 7 Customer focus and satisfaction, 8 Optimization of set-up times and layout, 9 Optimized production planning and control, 10 Process driven organisation, 11 Pull production, 12 Continuous flow production, 13 Shared vision and culture, 14 Management commitment, 15 Functional integration and qualification, 16 Employee involvement and continuous improvement,17 Employee empowerment
+ (-) practice on the right side is significantly higher (lower) implemented than practice on top * practices significantly differ at α = 0.10

70 Empirical analysis
Besides allowing an evaluation of the different levels of implementation of the
single lean practices in the groups, the paired-sample t-test also provides insights
into the correlations between the lean practices. These will be detailed in the next
chapter.
4.5.3 Correlations between lean practices
For each of the four clusters the correlations between the single lean practices
derived from the paired-sample t-test (see page 62) are analysed. Further, the
correlations between the lean practices and the goals of the single lean bundles are
calculated. They are then filled into the map developed in chapter 3 and adapted in
chapter 4.3. If there is no significant correlation the arrows are deleted, otherwise
the level of correlation is added to the arrow. In case of management commitment &
shared vision and culture the arrow is not deleted but instead n.s. (not significant) is
added if only one correlation could be confirmed. The use of the map helps to not
only display the strength of correlations but also their direction. As the correlation
coefficient itself does not contain any direction of influence, the direction is
obtained by the literature analysis the map is based on. All correlations shown are
linear and significant at the 0.05 level or less. They are based on Pearson’s
correlation coefficient which demands interval-scaled data. As mentioned before the
five-point Likert scale can be treated as interval level (Bortz & Schuster, 2010)
The different clusters show different correlations between the lean practices and
between lean practices and the goals of the single lean bundles. Also the strength of
the single correlations is different. Table 31 shows a guideline for interpretation
according to Brosius (2011).
Table 31: Interpretation of the correlation coefficient
The values are no strict limits and the interpretation should always consider the
context of the question to be answered.
In the following part the map is displayed for each of the strategic groups and
interpreted. Finally, the results are compared and evaluated.
Value of the correlation coefficient Possible interpretation
0 no correlation0 - 0,2 poor correlation
0,2 - 0,4 weak correlation0,4 - 0,6 moderate correlation0,6 - 0,8 strong correlation
0,8 - under 1 very strong correlation1 perfect correlation
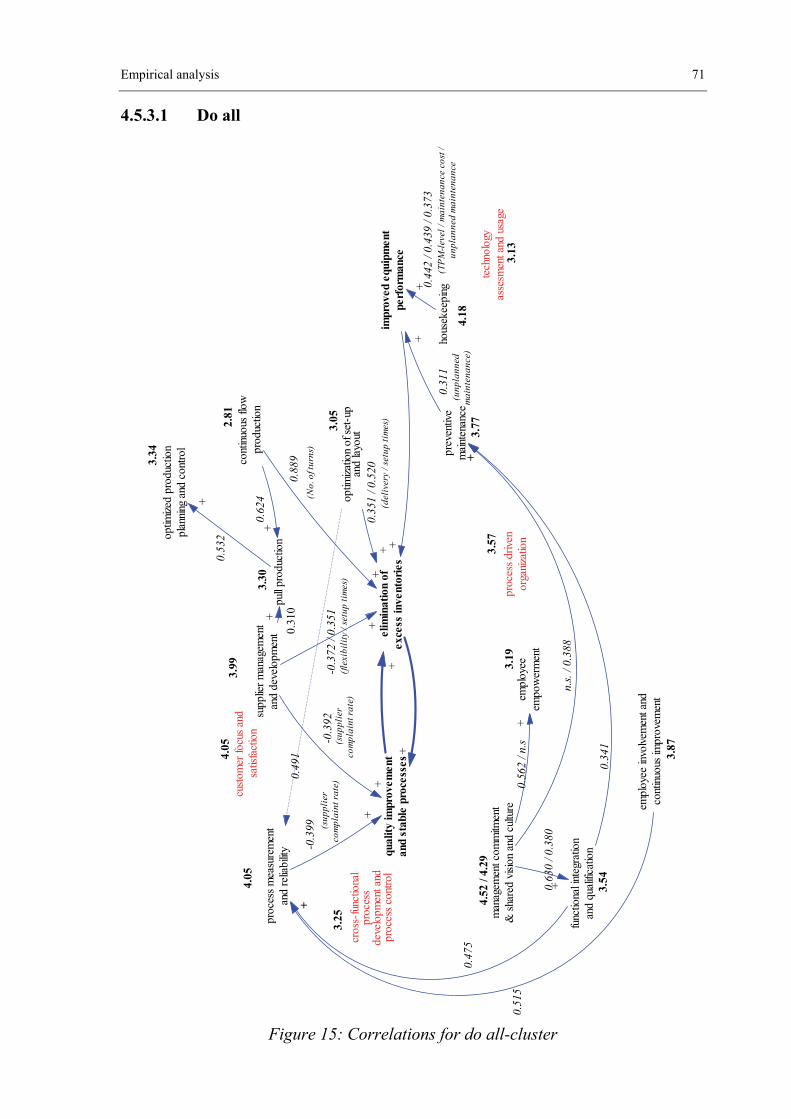
Empirical analysis 71
4.5.3.1 Do all
Figure 15: Correlations for do all-cluster
pull
prod
uctio
n
cont
inuo
us fl
owpr
oduc
tion
optim
izat
ion
of s
et-u
pan
d la
yout
qual
ity
impr
ovem
ent
and
stab
le p
roce
sses
elim
inat
ion
ofex
cess
inve
ntor
ies
proc
ess
mea
sure
men
tan
d re
liabi
lity
empl
oyee
empo
wer
men
t
supp
lier
man
agem
ent
and
deve
lopm
ent
prev
entiv
em
aint
enan
ce
++
proc
ess
driv
enor
gani
zatio
n
func
tiona
l int
egra
tion
and
qual
ifica
tion
+
cust
omer
focu
s an
dsa
tisfa
ctio
n
man
agem
ent c
omm
itmen
t&
sha
red
visi
on a
nd c
ultu
re+
+
tech
nolo
gyas
sesm
ent a
nd u
sage
++
hous
ekee
ping
impr
oved
equ
ipm
ent
perf
orm
ance
++
+
++
+
optim
ized
pro
duct
ion
plan
ning
and
con
trol
cros
s-fu
nctio
nal
proc
ess
deve
lopm
ent a
ndpr
oces
s co
ntro
l
+
+
+
empl
oyee
invo
lvem
ent a
ndco
ntin
uous
impr
ovem
ent
+
+
+
0.47
5
0.51
5
3.87
3.54
4.52
/ 4.
29
3.19
3.57
3.13
4.18
3.772.
81
3.34
3.30
3.99
4.05
4.05
3.25
3.05
0.34
1
n.s.
/ 0.
388
0.56
2 / n
.s
0.63
0 / 0
.380
0.53
2
0.62
4
0.31
0
0.31
1
0.49
10.
889
(No.
of t
urns
)
-0.3
92(s
uppl
ier
com
plai
nt r
ate)
-0.3
99 (sup
plie
rco
mpl
aint
rat
e)
0.44
2 / 0
.439
/ 0.
373
(TP
M-l
evel
/ m
aint
enan
ce c
ost /
unpl
anne
d m
aint
enan
ce
-0.3
72 /
0.35
1(f
lexi
bili
ty /
setu
p ti
mes
)
0.35
1 / 0
.520
(del
iver
y / s
etup
tim
es)
(unp
lann
edm
aint
enan
ce)

72 Empirical analysis
For the do all-cluster there are some correlations in all categories but also four
practices that do not show any of the correlations presumed by literature. Especially
in the EMS category less correlations are observable than presumed.
The strongest correlation can be seen for continuous flow production and
elimination of excess inventories (number of turns) which explains almost 80% of
the variance. Further continuous flow production also has a strong positive
correlation with pull production. Both correlations are intuitive as a smoothly
flowing production enables a higher number of turns and therewith a lower
inventory. Furthermore it fosters the implementation of a pull system as a tact is
established in production. Pull production has a strong positive correlation with
optimized production planning and control and explains 28.30% of the variance.
The latest two correlations can be observed in each cluster (see below). There are
also strong positive correlations between management commitment and functional
integration and qualification respectively employee empowerment.
Surprisingly, the correlations between supplier management and development and
quality improvement and stable processes (supplier complaint rate) respectively
elimination of excess inventories (flexibility) are negative with values of -0.392 and
-0.372. The implementation of supplier management and development does not
seem to lower the level of supplier complaints but instead they increase. As the
implementation level of this lean practice is rather high with 3.99 this cannot be
seen as teething troubles. Maybe the expectations towards suppliers are higher when
they are integrated closer into a plant’s production and therewith more complaints
are reported due to another level of tolerance. This also seems to be the case for
process measurement and reliability where a higher implementation leads to a
higher level of supplier complaints. The production flexibility upside is also lower
with a higher implementation of supplier management and development. This might
be due to the fact that a stronger collaboration with suppliers including on time
delivery is preventing short hand changes in the production schedule as materials
for a change are not available. This dilemma can be solved by having a shorter tact
of delivery, which until now does not seem to be common in pharmaceutical
manufacturing.
In total 22 correlations can be observed in the do all-cluster. Looking at the amount
of direct linkages between the single practices it can be assumed that the order of
the mostly direct influencing lean practices is supplier management and
development (3), continuous flow production (2), optimization of set-up times and

Empirical analysis 73
layout (2), management commitment & shared vision and culture (2), functional
integration and qualification (2), housekeeping (1), pull production (1), process
measurement and reliability (1), employee involvement and continuous
improvement (1), and preventive maintenance(1). Only influenced are optimized
production planning and control and employee empowerment. The following table
contrasts the level of implementation of the single lean practices with their direct
and indirect influence on other lean practices.
Table 32: Lean practices and their influence for do all-cluster
It is obvious that for the do all-cluster those two practices that have the highest level
of implementation also have the highest number of positive direct and indirect
influences on other practices. The plants can benefit from the high implementation
of management commitment and shared vision and culture as they therewith enable
the implementation of other practices and finally influence the goals of the single
lean bundles. Therefore when starting to implement lean with these specific
competitive priorities the first practices to implement should be those two. This is
also consistent with the relations derived from literature. Further, it is intuitive that a
plant which has a management that is committed to lean and promotes lean in the
vision and culture eases the implementation of further lean practices.
Another very potent practice is functional integration and qualification with five
influences in total. Thus far, the level of implementation of this practice is not very
high with rank number nine. To achieve better results in the overall manufacturing
performance more effort should be put in implementing this practice. The same
holds true for continuous flow production and optimization of set-up times and
layout that have influence on four respectively three other practices but show a very
low level of implementation.
Lean practice Level of implementation Direct influences Direct and indirect influences
Management commitment 4.52 (1) 2 7
Shared vision and culture 4.29 (2) 2 6
Housekeeping 4.18 (3) 1 2
Process measurement and reliability 4.05 (4) 1 2
Supplier management and development 3.99 (5) 3 4
Employee involvement and continuous improvement 3.87 (6) 1 3
Preventive maintenance 3.77 (7) 1 3
Functional integration and qualification 3.54 (9) 2 5
Optimized production planning and control 3.34 (10) 0 0
Pull production 3.30 (11) 1 1
Employee empowerment 3.19 (13) 0 0
Optimization of set-up times and layout 3.05 (15) 2 3
Continuous flow production 2.81 (16) 2 4

74 Empirical analysis
4.5.3.2 Flexible deliverers
Figure 16: Correlations for flexible deliverers-cluster
pull
prod
uctio
n
cont
inuo
us fl
owpr
oduc
tion
optim
izat
ion
of s
et-u
ptim
es a
nd la
yout
qual
ity
impr
ovem
ent
and
stab
le p
roce
sses
elim
inat
ion
ofex
cess
inve
ntor
ies
proc
ess
mea
sure
men
tan
d re
liabi
lity
empl
oyee
empo
wer
men
t
supp
lier
man
agem
ent
and
deve
lopm
ent
prev
entiv
em
aint
enan
ce
proc
ess
driv
enor
gani
zatio
n
++
+
func
tiona
l int
egra
tion
and
qual
ifica
tion
+
+
cust
omer
focu
s an
dsa
tisfa
ctio
n
man
agem
ent c
omm
itmen
t&
sha
red
visi
on a
nd c
ultu
re+
+
tech
nolo
gyas
sesm
ent a
nd u
sage
++
hous
ekee
ping
impr
oved
equ
ipm
ent
perf
orm
ance
+
+
++
+
+
+
optim
ized
pro
duct
ion
plan
ning
and
con
trol
cros
s-fu
nctio
nal
proc
ess
deve
lopm
ent a
ndpr
oces
s co
ntro
l
+
+
++
+
empl
oyee
invo
lvem
ent a
ndco
ntin
uous
impr
ovem
ent
+
+
+
3.52
2.93
3.95
3.53
2.85
3.08
3.19
4.08
/ 3.
95
2.91
3.43
3.00
3.67
3.81
3.69
3.12
2.71
0.72
5 / 0
.687
/ 0.
621
(TP
M-l
evel
/ m
aint
enan
ce c
ost /
unpl
anne
d m
aint
enan
ce)
0.51
3
0.56
7 0.61
5
0.35
9 / 0
.305
0.46
9
0.42
6
0.36
3 / 0
.419
n.s.
/ 0.
464
0.30
4 / 0
.295
0.48
70.
686
0.27
0
0.55
4
0.74
6
0.63
2
0.50
7
0.49
0
0.38
0-0
.363
0.61
20.
317
0.66
0
(TP
M-l
evel
/ O
EE
ava
ilab
ilit
y)
(JIT
-lev
el)
(qua
lity
cos
t)
(qua
lity
cos
t)

Empirical analysis 75
For the flexible deliverers-cluster almost all correlations between the lean practices
in the JIT category could be confirmed. Additionally, there are a lot of correlations
between lean practices from the EMS category. On the other hand almost no
correlations are observable in the categories TPM and TQM where in total five
practices are not linked. As the competitive aim of the flexible deliverers is a fast
and punctual delivery with high volume flexibility it seems to be favourable that
there are stronger relations between the JIT practices which promise to reach this
aim.
The flexible deliverers are the only strategic group in which reinforced feedback
loops between the practices can be observed. All feedback loops include the JIT
practice continuous flow production which also shows a number of strong
correlations. One reinforced feedback loop exists between continuous flow
production and improved equipment performance. A higher performance of the
equipment leads to a better flow in production which again supports the TPM goal.
Possibly, due to a constant and balanced utilisation of the equipment the
maintenance costs and the share of unplanned maintenance are lower.
A second reinforced feedback loop exists between continuous flow production,
improved equipment performance, elimination of excess inventories, and quality
improvement and stable processes. Like stated above, a continuous flow in
production helps to reach the goal of TPM. The improved equipment performance
itself has a positive influence on the elimination of excess inventories. With reliably
running machines it is not necessary to produce more stock than needed because of
the lower risk of machine failures. This leads to an improved quality and stable
processes. With an improved quality and processes that are stable it is again easier
to establish and maintain a continuous flow production.
The third reinforced feedback loop can be found for continuous flow production,
pull production, elimination of excess inventories, and quality improvement and
stable processes. To have a continuous flow in production eases the implementation
of pull production which again supports the elimination of excess inventories.
Again, the same elements as in the second reinforced feedback loop follow.
The strongest correlation can be seen for preventive maintenance and continuous
flow production with 0.746. There is also a strong correlation between continuous
flow production and improved equipment performance, namely the TPM-level in
general as well as maintenance cost and unplanned maintenance (see first

76 Empirical analysis
reinforced feedback loop). These strong correlations with TPM-related practices
and performance measures show that stable equipment and machines are a
perquisite for a continuous production flow. Preventive maintenance and therewith
low levels of unplanned maintenance and low maintenance cost help to promote a
continuous product flow. Further, continuous flow production has a strong influence
on optimized production planning and control with 44% of the variance explained.
A continuous production flow makes it easier to establish a stable and reliable
production schedule and therewith meet the production plans. This is one
requirement for a fast and especially punctual delivery. Another strong correlation
can be found between optimization of set-up times and layout and continuous flow
production. An optimized layout and lower set-up times boost flexibility and hence
support the strategic goal of the flexible deliverers. Also quality improvement and
stable processes (quality cost) has a strong influence on continuous flow production
(see second reinforced feedback loop). Other strong influences can be observed
with employee empowerment, it is strongly influenced by employee involvement and
continuous improvement and process driven organization. One negative correlation
can be observed which is between process measurement and reliability and quality
improvement and stable processes (quality cost). An explanation might be that a
more rigid measurement of processes and their stability leads to higher quality
costs.
In total 28 correlations can be observed in the flexible deliverers-cluster. Looking at
the amount of direct linkages between the single practices it can be assumed that the
order of the mostly direct influencing lean practices is functional integration and
qualification (4), shared vision and culture (3), continuous flow production (3),
management commitment (2), preventive maintenance(2), employee involvement
and continuous improvement (2), process driven organization (2), pull production
(2), , optimization of set-up times and layout (2), process measurement and
reliability (1), and employee empowerment (1). Only influenced is optimized
production planning and control. The following table contrasts the level of
implementation of the single lean practices with their direct and indirect influence
on other lean practices.

Empirical analysis 77
Table 33: Lean practices and their influence for flexible deliverers-cluster
It is obvious that for the flexible deliverers-cluster the practices that have the highest
level of implementation also have the highest number of direct and indirect
influences on other practices. Like in the do all-cluster the plants can benefit from
the high implementation of management commitment and shared vision and culture
as they therewith enable the implementation of other practices and finally influence
the goals of the single lean bundles. Therefore when starting to implement lean as a
plant with competitive priorities on a fast and punctual delivery with a high volume
flexibility the first practices to implement should be those two.
Other very potent practices are employee involvement and continuous improvement
and functional integration and qualification with eight influences in total. Thus far
the level of implementation of these practices is not very high with rank number
seven and nine. To achieve better results in the overall manufacturing performance
more effort should be put in implementing these practices. This is especially crucial
for functional integration and qualification as this practice has four direct
influences which is the highest number for this cluster. The same holds true for
process driven organization and optimization of set-up times and layout that have
influence on seven other practices but show a low respectively very low level of
implementation with rank eight and rank 16. Compared to the do all-cluster in total
more direct and indirect influences could be observed. Especially those lean
practices coming from the category EMS have a lot of direct as well as indirect
influences. This shows that in this cluster an effective management system can even
better accelerate a lean implementation than in the do all-cluster.
Lean practice Level of implementation Direct influences Direct and indirect influences
Management commitment 4.08 (1) 2 10
Shared vision and culture 3.95 (2) 3 10
Process measurement and reliability 3.67 (5) 1 6
Preventive maintenance 3.53 (6) 2 6
Employee involvement and continuous improvement 3.52 (7) 2 8
Process driven organisation 3.43 (8) 2 7
Functional integration and qualification 3.19 (9) 4 8
Pull production 3.12 (10) 2 5
Optimized production planning and control 3.08 (11) 0 0
Employee empowerment 2.91 (14) 1 6
Continuous flow production 2.85 (15) 3 5
Optimization of set-up times and layout 2.71 (16) 2 7

78 Empirical analysis
4.5.3.3 Flexible starters
Figure 17: Correlations for flexible starters-cluster
For the flexible starters-cluster not as much correlations are observable as for the
other clusters. There are some correlations between practices in the JIT category
pull
prod
uctio
n
cont
inuo
us fl
owpr
oduc
tion
optim
izat
ion
of s
et-u
ptim
es a
nd la
yout
qual
ity
impr
ovem
ent
and
stab
le p
roce
sses
elim
inat
ion
ofex
cess
inve
ntor
ies
proc
ess
mea
sure
men
tan
d re
liabi
lity
empl
oyee
empo
wer
men
t
supp
lier
man
agem
ent
and
deve
lopm
ent
prev
entiv
em
aint
enan
ce
proc
ess
driv
enor
gani
zatio
n
++
func
tiona
l int
egra
tion
and
qual
ifica
tion
cust
omer
focu
s an
dsa
tisfa
ctio
n
man
agem
ent c
omm
itmen
t&
sha
red
visi
on a
nd c
ultu
re
+
tech
nolo
gyas
sesm
ent a
nd u
sage
+
hous
ekee
ping
impr
oved
equ
ipm
ent
perf
orm
ance
++
+
+
+
+
optim
ized
pro
duct
ion
plan
ning
and
con
trol
cros
s-fu
nctio
nal
proc
ess
deve
lopm
ent a
ndpr
oces
s co
ntro
l
+
+
++
+
+
empl
oyee
invo
lvem
ent a
ndco
ntin
uous
impr
ovem
ent
+
3.29
2.80
3.85
3.44
2.12
3.00
3.20
3.93
/ 3.
78
2.65
3.42
2.76
3.54
3.54
3.45
3.08
2.57
0.49
5
0.54
5
0.65
6
0.37
1 / 0
.529
n.s.
/ -0
.328
0.38
9 / 0
.340
0.51
2
0.59
70.
556
0.41
1
-0.4
19
0.38
3
-0.4
89-0
.372
/ -0
.448
/-0
.409
0.64
2
(sup
plie
rco
mpl
aint
rat
e)
(sup
plie
rco
mpl
aint
rat
e)
(set
up ti
mes
)
(acc
urac
y)(T
QM
-lev
el /
cust
omer
com
plai
nt r
ate
/ qua
lity
cos
t)

Empirical analysis 79
with starting links to TPM and TQM practices. EMS practices are almost not
involved. In total four practices are not linked to others. The flexible starters
generally have a low emphasis on competitive priorities with the highest value for
flexibility. This demand for flexibility is explaining why there are mostly
correlations found in practices related to process optimization.
The strongest correlation can be seen for optimization of set-up times and layout and
continuous flow production. Low set-up times and an optimized layout allow for
fast changes in products and therewith augment flexibility. Nevertheless, this
correlation is with 43% of variance explained much weaker than the strongest
correlation in the two clusters analysed thus far. Another strong correlation can be
found for continuous flow production and optimized production planning and
control with 0.642. The other correlations are only moderate at maximum.
Besides the positive correlations also negative ones can be observed. There is a
moderate negative correlation between pull production and elimination of excess
inventories (production schedule accuracy in the freezing period). It seems that a
higher implementation level of the lean practice pull production is leading to a
lower production schedule accuracy in the freezing period for plants in the flexible
starters-cluster. Theoretically the opposite should be the case. A possible
explanation might be that the pull system is not yet fully implemented (3.08 of 5.00)
and that in this status of implementation the positive aspects could not be observed
yet. There are also negative correlations between customer focus and satisfaction
and quality improvement and stable processes (TQM-level, customer complaint
rate, quality cost) as well as between process measurement and reliability and
quality improvement and stable processes (supplier complaint rate). Apparently, the
focus on customers is hindering a good performance in the TQM-area. The
customer complaint rate is higher which might be due to the reason that more
complaints are regarded as justified to better satisfy the single customer. Further, a
more severe control of customer complaints and requirements leads to a higher
quality cost. The same can be assumed for the correlation between process
measurement and reliability and the supplier complaint rate. A more rigorous
control of one’s own and the suppliers processes leads to a higher supplier
complaint rate. As the plants in this cluster have rather low levels of lean
implementation it can be stated that they are only starting to focus on this topic.
Therefore they might still struggle with the implementation process and problems
occurring from the changes.

80 Empirical analysis
In total 19 correlations can be observed in the flexible starters-cluster. Looking at
the amount of direct linkages between the single practices it can be assumed that the
order of the mostly direct influencing lean practices is shared vision and culture (3),
management commitment (2), pull production (2), optimization of set-up times and
layout (2), continuous flow production (2), process measurement and reliability (1),
customer focus and satisfaction (1), supplier management and development (1),
preventive maintenance (1), process driven organization (1), and employee
empowerment (1). Only influenced are functional integration and qualification and
optimized production planning and control. The following table contrasts the level
of implementation of the single lean practices with their direct and indirect
influence on other lean practices.
Table 34: Lean practices and their influence for flexible starters-cluster
Also for the flexible starters-cluster the practices that have the highest level of
implementation have the highest number of direct and indirect influences on other
practices. Like in the other clusters the plants can benefit from the high
implementation of management commitment and shared vision and culture as they
therewith enable the implementation of other practices and finally influence the
goals of the single lean bundles. Therefore, being at the beginning of implementing
lean as a plant with competitive priorities on flexibility of volume and products as
well as fast changes, the first practices to implement should be the aforementioned.
Almost as influencing, especially regarding the direct influences, is the practice
optimization of set-up times and layout but its implementation level is with 2.57 and
therewith rank 15 rather low. Other potent practices are preventive maintenance and
process driven organization each having five direct and indirect influences from
which only one is direct. Their implementation is with rank 6 and 7 on an average
Lean practice Level of implementation Direct influences Direct and indirect influences
Management commitment 3.93 (1) 2 7
Shared vision and culture 3.78 (3) 3 7
Process measurement and reliability 3.54 (4) 1 2
Customer focus and satisfaction 3.54 (4) 1 2
Supplier management and development 3.45 (5) 1 2
Preventive maintenance 3.44 (6) 1 5
Process driven organisation 3.42 (7) 1 5
Functional integration and qualification 3.20 (9) 0 0
Pull production 3.08 (10) 2 3
Optimized production planning and control 3.00 (11) 0 0
Employee empowerment 2.65 (14) 1 3
Optimization of set-up times and layout 2.57 (15) 2 6
Continuous flow production 2.12 (16) 2 4

Empirical analysis 81
level in comparison to the implementation of other practices in this cluster. A higher
implementation of these practices would positively influence other practices and
therewith the overall implementation level of lean.
Compared to the other two clusters there are less direct and indirect influences
observable. This might also be due to the fact that there is generally a lower number
of correlations as the flexible starters, as the name says, are just starting to
implement lean. Besides two lean practices coming from the category EMS also
practices that are process oriented have a lot of direct as well as indirect influences.
Apparently, in this cluster an effective management system and the ability to react
flexible are core of the lean implementation efforts.
4.5.3.4 Efficient conformers
For the efficient conformers-cluster most correlations between practices could be
confirmed, there is only one practice with no correlation at all. Especially the EMS
practices have a lot of linkages between each other. Also the goals of the single lean
bundles are correlated to a lot of practices with a surprisingly high number of
negative correlations for the TQM bundle.
The strongest correlation can be seen for the practices optimization of set-up times
and layout and continuous flow production with a value of 0.816. A higher
implementation of the first practice helps to establish a continuous flow in
pharmaceutical productions.
Further, continuous flow production has strong correlations with the lean practices
process measurement and reliability as well as process driven organization. Both
lean practices support the implementation of the first named as they enable smooth
and reliable processes.
Also optimization of set-up times and layout has other strong correlations. It
strongly correlates with employee empowerment and process measurement and
reliability and therewith influences their level of implementation. As employee
empowerment mainly focuses on autonomous problem solving an optimised
environment seems to be favourable to promote the employees in doing so. To
create reliable processes and measure them clear set-up times and an optimized
layout are a necessary basis as they help to ensure dependable and reproducible
data.

82 Empirical analysis
Figure 18: Correlations for efficient conformers-cluster
pull
prod
uctio
n
cont
inuo
us fl
owpr
oduc
tion
optim
izat
ion
of s
et-u
ptim
es a
nd la
yout
qual
ity
impr
ovem
ent
and
stab
le p
roce
sses
elim
inat
ion
ofex
cess
inve
ntor
ies
proc
ess
mea
sure
men
tan
d re
liabi
lity
empl
oyee
empo
wer
men
t
supp
lier
man
agem
ent
and
deve
lopm
ent
prev
entiv
em
aint
enan
ce
++
proc
ess
driv
enor
gani
zatio
n
+
+
func
tiona
l int
egra
tion
and
qual
ifica
tion
+
+
cust
omer
focu
s an
dsa
tisfa
ctio
n
man
agem
ent c
omm
itmen
t&
sha
red
visi
on a
nd c
ultu
re+
+
+
tech
nolo
gyas
sesm
ent a
nd u
sage
+
hous
ekee
pingim
prov
ed e
quip
men
tpe
rfor
man
ce+
++
+
++
+
+
+
+
+
+
optim
ized
pro
duct
ion
plan
ning
and
con
trol
cros
s-fu
nctio
nal p
roce
ssde
velo
pmen
t and
pro
cess
cont
rol
+
+
+
++
+
empl
oyee
invo
lvem
ent a
ndco
ntin
uous
impr
ovem
ent
++
+
+
3.33
2.70
3.95
3.75
2.23
2.98
3.20
4.01
/ 3.
99
2.86
3.11
2.63
3.39
3.53
3.55
2.99
2.48
0.41
9
0.61
8
0.48
7
0.59
4
2*0.
816
0.42
8 / 0
.588
/0.
396
0.35
3 / 0
.414
0.40
8
0.39
1
0.43
4
0.56
3 / 0
.435
n.s.
/-0.
481
n.s
./-0.
515
n.s.
/-0.
506 0.
583
/ 0.5
69
n.s.
/ 0.
406 0.
763
0.53
5
0.70
2
0.56
1
0.48
4 0.61
10.
645
0.54
2
0.46
3 / -
0.42
8
0.47
2 / -
0.50
03*
0.62
8
-0.4
61
0.51
5 / -
0.37
5
-0.4
02 /
-0.4
99 /
-0.5
80
0.47
6
(TP
M le
vel /
load
ing
/O
EE
ava
ilab
ilit
y)
(TP
M le
vel /
OE
E a
vail
abil
ity)
(loa
ding
)
(rej
ecte
d ba
tche
s /
supp
lier
com
plai
ntra
te)
(TQ
M le
vel /
sup
plie
r co
mpl
aint
rate
/ qu
alit
y co
st)
(rej
ecte
d ba
tche
s /
supp
lier
com
plai
nt r
ate)(s
uppl
ier
com
plai
nt r
ate)
(TQ
M le
vel /
sup
plie
rco
mpl
aint
rat
e / q
uali
ty c
ost)
(sch
edul
e ac
cura
cy /
prod
ucti
on fl
exib
ilit
y)
1*
0.53
3 JI
T le
vel
0.61
5 D
OH
0.61
8 sc
hedu
le a
ccur
acy
0.69
0 se
tup
tim
es
1* 2* 0.64
8 JI
T le
vel
0.78
8 sc
hedu
le a
ccur
acy
0.72
4 se
tup
tim
es
0.76
8 nu
mbe
r of
tur
ns
3* 0.69
2 JI
T le
vel
0.75
0 sc
hedu
le a
ccur
acy
0.71
0 se
tup
tim
es0.
527
num
ber
of t
urns

Empirical analysis 83
Also for functional integration and qualification high correlations can be observed
with employee empowerment on the one hand and continuous flow production on
the other hand. Both practices are positively influenced and 58% respectively 49%
of their variance is explained.
All other strong correlations can be observed in relation to elimination of excess
inventories, the goal of the JIT bundle. The implementation of a pull system has a
strong positive influence on the inventory days on hand (DOH), the production
schedule accuracy in the freezing period, and set-up times. Further, implementing a
continuous product flow positively influences the overall JIT level, the production
schedule accuracy in the freezing period, set-up times, and the number of turns. In
addition, shorter set-up times and an optimized layout positively correlate with the
JIT level, the production schedule accuracy in the freezing period, and set-up times.
In this cluster, the practices belonging to the JIT bundle clearly show a strong
influence on the goal of this bundle.
Also in this cluster some weak to moderate negative correlations can be found.
They are especially associated with quality improvement and stable processes, the
goal of the TQM bundle. The supplier complaint rate is negatively correlated to all
five lean practices that have an influence on quality improvement and stable
processes. Also TQM level and quality cost are negatively correlated with two lean
practices. As the competitive aims of this cluster are costs and quality it is
surprising to see that two relatively high implemented lean practices negatively
influence the quality cost as well as the overall TQM level.
Another weak correlation can be found between supplier management and
development and production flexibility upside, one of the goals of the JIT bundle.
In total 53 correlations can be observed in the efficient conformers-cluster. Besides
being the highest number of correlations that can be observed in the four clusters,
these correlations involve the goals of the single lean bundles to a greater extent
than in all other clusters. Looking at the amount of direct linkages between the
single practices it can be assumed that the order of the mostly direct influencing
lean practices is shared vision and culture (4), optimization of set-up times and
layout (4), employee involvement and continuous improvement (3), functional
integration and qualification (3), employee empowerment (3), continuous flow
production (3), management commitment (2), supplier management and
development (2), process measurement and reliability (2), process driven

84 Empirical analysis
organization (2), pull production (2), housekeeping (1), preventive maintenance (1),
technology assessment and usage (1), and cross-functional process development
and process control (1). Only influenced is optimized production planning and
control. The following table contrasts the level of implementation of the single lean
practices with their direct and indirect influence on other lean practices.
Table 35: Lean practices and their influence for efficient conformers-cluster
In the efficient conformers-cluster the two practices that have the highest level of
implementation also have the highest number of direct and indirect influences on
other practices. Like in the other clusters the plants in the efficient conformers-
cluster can benefit from the high implementation of management commitment and
shared vision and culture as they therewith enable the implementation of other
practices and finally influence the goals of the single lean bundles. This shows that
also plants with the competitive priorities of low costs and a high quality should
focus on those two management related practices first.
Other very potent practices are employee involvement and continuous improvement,
functional integration and qualification, process driven organization, and
optimization of set-up times and layout with seven influences in total. Until now,
these practices are not on a high implementation level with rank number eight, nine,
ten, and sixteen. As these four lean practices could positively influence so many
others there should be put more effort into their implementation. Also the number of
direct influences is high for all four practices, especially optimization of set-up times
and layout with four direct influences has a high relevance. The same holds true for
Lean practice Level of implementation Direct influences Direct and indirect influences
Management commitment 4.01 (1) 2 8
Shared vision and culture 3.99 (2) 4 10
Housekeeping 3.95 (3) 1 3
Preventive maintenance 3.75 (4) 1 3
Supplier management and development 3.55 (5) 2 2
Process measurement and reliability 3.39 (7) 2 5
Employee involvement and continuous improvement 3.33 (8) 3 7
Functional integration and qualification 3.20 (9) 3 7
Process driven organisation 3.11 (10) 2 7
Pull production 2.99 (11) 2 3
Optimized production planning and control 2.98 (12) 0 0
Employee empowerment 2.86 (13) 3 6
Technology assessment and usage 2.70 (14) 1 3
Cross-functional process development and process control
2.63 (15) 1 2
Optimization of set-up times and layout 2.48 (16) 4 7
Continuous flow production 2.23 (17) 3 4

Empirical analysis 85
continuous flow production and employee empowerment that have direct influence
on three and direct and indirect influences on four respectively six other practices.
Nevertheless they show a very low level of implementation with rank thirteen and
rank seventeen. Plants should include these practices to a bigger extend into their
implementation efforts.
Compared to the other clusters there are more direct and indirect influences
observable which involve almost all lean practices. Like mentioned before also the
goals of the single lean bundles are integrated to a higher extend. Apparently, for
plants aiming for low costs and a high quality the interaction of all lean practices is
vital. Especially management and process related practices play an important role.
4.5.3.5 General view
Despite all the differences there are some correlations that can be observed in each
of the four clusters. They are listed in the following table including the strength of
the correlation. The first variable of a pair is always the one that is influencing the
other one according to literature.
Table 36: Observable correlations in all four clusters
The correlation between pull production and optimized production planning and
control is positive moderate for all four clusters. This means that a higher
implementation of the lean practice pull production fosters a higher implementation
of optimized production planning and control independent from the competitive
priorities aimed at. In the single clusters 23.72% to 28.30% of the variance is
explained meaning that 71.70% up to 76.28% are explained by other influences.
1 2 3 4
Do all Flexible deliverers Flexible starters Efficient conformers
n = 49 n = 70 n = 48 n = 33
Pull production - Optimized production planning and control
0.532 0.513 0.495 0.487
Continuous flow production - Pull production
0.624 0.567 0.545 0.594
Optimization of set-up times and layout - Process measurement and reliability
0.491 0.380 0.411 0.628
-0.399 -0.363 -0.419 -0.461(supplier complaint rate) (quality cost) (supplier complaint rate) (supplier complaint rate)
Management commitment & Shared vision and culture - Functional integration and qualification
0.630 / 0.380 0.363 / 0.419 0.371 / 0.529 0.563 / 0.435
Management commitment & Shared vision and culture - Preventive maintenance
n.s. / 0.388 0.304 / 0.295 0.389 / 0.340 n.s. / 0.406
Correlation
Process measurement and reliability - Quality improvement and stable processes

86 Empirical analysis
For continuous flow production and pull production higher correlation coefficients
are observed that already can be interpreted as positive strong correlation, especially
the first cluster shows with 0.624 a high value. Between 29.70% and 38.94% of the
variance is explained.
For optimization of set-up times and layout and process measurement and reliability
the single clusters show very different levels of positive correlation. With 0.628 the
correlation coefficient in the efficient conformers-cluster is rather high, 0.491for the
do all-cluster is still moderate whereas the values for the flexible deliverers and the
flexible starters with around 0.4 are already weak. This means that in the efficient
conformers-cluster 39.44% of the variance is explained and in the flexible
deliverers-cluster with the lowest value only 14.44% of the variance is explained.
Obviously, the efficient conformers with the aim of high quality and low costs can
benefit more from the positive impact of the implementation of optimization of set-
up times and layout than plants from the other clusters.
For process measurement and reliability and quality improvement and stable
processes, the goal of the lean bundle TQM, only negative weak to moderate
correlations can be observed. In three cases there is a negative correlation with
supplier complaint rate and for the cluster flexible deliverers with the quality cost.
It seems that a high implementation of process measurement and reliability is not
favourable for a low complaint rate towards a plant’s suppliers. There are two
possible explanations; one might be that the standardized and continuous
measurement of processes helps the plants to identify more incorrect deliveries than
the methods used by those plants that do not employ process measurement tools. A
second explanation might be that with process measurement the level of tolerance is
lower and therewith more complaints occur. Also the cost of quality is not lower
with a higher implementation of process measurement and reliability. A reason
might be that statistical process measurement and its tools are rather new to
pharmaceutical manufacturing (FDA, 2004) and therefore extra quality tests are
made which lead to higher costs. In general, it can be seen that in contrast to
literature where process measurement and reliability is positively associated with
the goal of the lean bundle TQM, a negative correlation exists in pharmaceutical
manufacturing which explains 13.18% to 21.25% of the variance.
For management commitment & shared vision and culture and functional
integration and qualification the correlation coefficients also vary but are all
positive. Especially management commitment has varying influence ranging from

Empirical analysis 87
13.18% to 39.69% of variance explained. Shared vision and culture is a little more
stable throughout the clusters and explains between 14.44% to 27.98% of the
variance in functional integration and qualification. In general it can be stated that
an engaged management and a common culture foster the integration and
qualification of employees in a plant independent from the competitive aims.
For management commitment & shared vision and culture and preventive
maintenance the values of the correlation coefficients are rather low with a variance
explained of 8.70% to 16.48%. In some cases the correlation is even not significant
(n.s) for management commitment. Nevertheless, a weak correlation exists between
a committed management and the implementation of preventive maintenance in a
plant for the clusters flexible deliverers and flexible starters. For all clusters a weak
correlation exists between shared vision and culture and preventive maintenance.
Obviously, the implementation of a preventive approach for maintenance is at least
lightly influenced by the commitment and mind-set of management and employees
in a plant.
4.5.3.6 Summary
Within the strategic groups different numbers of correlations in the theoretical map
could be confirmed. In total, the efficient conformers have 53 correlations and
therewith almost twice as much as the flexible deliverers with 28 correlations. Even
less correlations are observable in the do all-cluster with 22 and the flexible
starters-cluster with 19 correlations. Besides the number of correlations also their
strength varies in the single groups. The do all-cluster has one very strong
correlation and two strong correlations, being 14% of the correlations observed. The
flexible deliverers-cluster has nine strong correlations (32%), the flexible starters-
cluster has two strong correlations (11%), and the efficient conformers-cluster has
one very strong correlation and 16 strong correlations (32%). With more and higher
correlations it is easier for plants to positively influence the overall lean
implementation. Therefore, especially plants from the clusters efficient conformers
and flexible deliverers have the possibility to use the positive effects between the
practices. This effect is particularly interesting for practices with an already high
level of implementation.

88 Empirical analysis
Summary empirical analysis 4.6
In this chapter, the four strategic groups identified for pharmaceutical
manufacturing were analysed using different methods. The results of the different
empirical analyses for investigating the interconnection and interaction between
lean practices have been provided. The results show, that lean practices are not
independent from each other and that they therefore should be implemented in
common. Which practices to implement in which order is depending on the strategic
goals a plant focuses on. A final evaluation is made by looking at the
implementation level and the thereof determined importance of the lean practice in
contrast to the influence it has according to the direct and indirect number of
correlations observed.
A plant that wishes to start a lean implementation should focus on those practices
which have a lot of correlations and a high importance within the relevant strategic
group. In a second step, the practices with a high number of correlations and a lower
importance should be implemented. For the different strategic groups the following
sets of lean practices to focus on were identified.
Figure 19: Influence - importance do all-cluster
For plants with the same strategic priorities as the do all-cluster the practices
management commitment, shared vision and culture, functional integration and
0
1
2
3
4
5
6
7
8
9
10
4,5 5,04,03,53,02,52,0
Infl
uenc
e
Importance
Continuous flow production
Optimization of set-up times and layout
Employee empowerment
Pull production
Optimized production planning and control
Functional integration and qualification
Preventive maintenance
Employee involvement and continuous improvement
Supplier management and development
Process measurement and reliability Housekeeping
Shared vision and culture
Management commitment

Empirical analysis 89
qualification, and supplier management and development should be the first focus.
In a second step, the practices continuous flow production, employee involvement
and continuous improvement, preventive maintenance, and optimization of set-up
times and layout should be implemented (Figure 19).
Figure 20: Influence - importance flexible deliverers-cluster
For plants with the same strategic priorities as the flexible deliverers-cluster the
practices management commitment, shared vision and culture, employee
involvement and continuous improvement, and process driven organization should
be the first focus. In a second step, the practices functional integration and
qualification, optimization of set-up times and layout, process measurement and
reliability, preventive maintenance, and employee empowerment should be
implemented (Figure 20).
For plants with the same strategic priorities as the flexible starters-cluster the
practices management commitment, shared vision and culture, process driven
organization, and preventive maintenance should be the first focus. In a second
step, the practices optimization of set-up times and layout, continuous flow
production, and employee empowerment should be implemented (Figure 21).
0
1
2
3
4
5
6
7
8
9
10
3,52,0 5,02,5 4,53,0 4,0
Importance
Infl
uenc
e
Employee involvement and continuous improvement
Process driven organisation
Functional integration and qualification
Optimized production planning and control
Employee empowerment
Continuous flow production
Optimization of set-up times and layout
Pull production
Management commitment
Preventive maintenance
Process measurement and reliability
Shared vision and culture

90 Empirical analysis
Figure 21: Influence - importance flexible starters-cluster
Figure 22: Influence - importance efficient conformers-cluster
For plants with the same strategic priorities as the efficient conformer-cluster the
practices shared vision and culture, management commitment, employee
involvement and continuous improvement, and functional integration and
0
1
2
3
4
5
6
7
8
9
10
3,0 3,5 4,0 4,5 5,02,0 2,5
Importance
Shared vision and culture
Management commitment
Customer focus and satisfaction
Supplier management and development
Process measurement and reliability
Infl
uenc
e
Optimization of set-up times and layout
Employee empowerment
Continuous flow production
Preventive maintenance
Process driven organisation
Optimized production planning and controlFunctional integration and qualification
0
1
2
3
4
5
6
7
8
9
10
4,54,0 5,02,52,0 3,53,0
HousekeepingCross-functional process development and process control
Continuous flow production
Optimization of set-up times and layout
Importance
Infl
uenc
e
Preventive maintenance
Management commitment
Shared vision and culture
Employee empowerment
Optimized production planning and control
Functional integration and qualification
Process measurement and reliability
Supplier management and development
Technology assessment and usage
Process driven organisation
Employee involvement and continuous improvement

Empirical analysis 91
qualification should be the first focus. In a second step, the practices process driven
organization, optimization of set-up times and layout, employee empowerment, and
process measurement and reliability should be implemented (Figure 22).
Overall, it is obvious that independent from the strategic group a focus should be on
the practices management commitment and shared vision and culture. This has also
been stated by Harrison and Storey (1996) that stress the importance of a change of
the company culture. Hines et al. (2008) also point out that a positive organizational
culture is the basis for strong leadership which leads to an effective strategy.
Further, Zayko et al. (1997) find that the first obstacle and main issue when
implementing lean is the lack of management conviction in the benefits it provides.
In the next chapter the overall contributions of this research will be stated.

92 Conclusion
5 Conclusion
This chapter summarises the contributions of the research at hand to theory and
practice. Further, it discusses limitations and directions for future research.
Contributions to theory 5.1
This research contributes to literature on operations management, especially from
the areas production management methods and production strategy. Its focus is on
the relation between lean practices and between lean practices and competitive
priorities in pharmaceutical manufacturing. Literature discusses both relations but
often focuses on some practices only or the subordinated bundles; therefore no
comprehensive theory has been presented yet. The positive impact of the
simultaneous implementation of lean practices is known, but the exact network of
relations remains unclear leading to a lack of knowledge which practices to
implement in which sequence. This is especially the case for the pharmaceutical
industry, as its lean implementation started relatively late.
Based on a comprehensive literature review at the first stage of this research a
general map on the linkages between single lean practices was developed based on
prior research findings. First insights into the influence of single lean practices were
provided. The general map based on literature was adapted to the reality of
pharmaceutical manufacturing and further analysed by using empirical data.
Different strategic types based on competitive priorities were examined concerning
the implementation and interrelation of lean practices. It was found that depending
on the strategic type different levels of lean implementation were observable.
Further, the number of relations between the lean practices varies according to the
strategic group. The most important practices for the single strategic groups were
identified and a sequence of implementation was sketched.
In summary, this research provides a comprehensive view on the relations between
lean practices in the pharmaceutical industry. The importance of a holistic
implementation approach including the production strategy is shown.
Contributions to practice 5.2
This research is derived from problems observed in reality and should therefore

Conclusion 93
propose solutions for these problems. Especially managers should be guided
through the field of lean practices and their successful and holistic implementation.
First of all, this research shows practitioners that lean practices are highly
interconnected and that the sole focus on one single practice cannot lead to success.
Instead, an integrated approach is necessary for lean implementation. Managers in
pharmaceutical manufacturing are provided with a guideline which practices to
focus on when they start a lean implementation at their plant. This guideline is
differentiated depending on the strategic priorities a plant focuses on as different
goals demand for different approaches. The research shows that independent from
the strategic priorities an initial effort should be put into the management related
lean practices. Especially a committed management and a shared vision and culture
are key factors for a successful lean implementation.
Besides, managers get an overview of the lean practices actually used in
pharmaceutical manufacturing and their implementation levels with respect to
different production strategies. Therewith they can compare their own plant to
similar plants.
Limitation and future research 5.3
The limitations of this research allow the outline of directions for future research:
• In the literature analysis only positive influences between lean practices were
identified. Therefore no negative relations that might hinder the
implementation of certain practices could be displayed in the map elaborated
in this research. Case-based research can be an option to analyse obstacles
that occur when implementing or using different lean practices. It can also
help to better understand the decisions of single plants while implementing
lean and to therewith refine the proposed sequence of lean implementation.
• The strategic groups identified for pharmaceutical manufacturing are not
detailed concerning contextual factors like company culture, product type,
country or size. It would be interesting to analyse if and how these factors
influence the lean implementation process or if they provide an opportunity
to further differentiate it.
• Based on other studies, it is supposed that the implementation of lean has a
positive influence on the manufacturing performance. This positive influence
was also shown based on the benchmarking data used in this research but not

94 Conclusion
explicitly included. Future research should empirically demonstrate this
influence.
• The fundament of this research is mainly based on causal linkages. Although
a careful literature analysis was performed and knowledge from interviews
was integrated other authors might find additional linkages to those
presented here. This might lead to different outcomes.

References 95
References
Ahmad, S., Schroeder, R. G., & Sinha, K. K. (2003). The role of infrastructure
practices in the effectiveness of JIT practices: implication for plant competitiveness.
Journal of Engineering Technology Management, 20(3), 161–191.
Angelis, J., Conti, R., Cooper, C., & Gill, C. (2011). Building a high-commitment
lean culture. Journal of Manufacturing Technology Management, 22(5), 569–586.
Avella-Camarero, L., Fernández-Sánchez, E., & Vázquez-Ordás, C. J. (1996).
Clasificación de las Estrategias de Fabricación de las Grandes Empresas
Industriales Españolas. Economía Industrial, 311, 77–92.
Avella-Camarero, L., Fernández-Sánchez, E., & Vázquez-Ordás, C. J. (1999). The
large Spanish industrial company: strategies of the most competitive factories.
Omega, 27(5), 497–514.
Backhaus, K., Erichson, B., Plinke, W., & Wiber, R. (2008). Multivariate
Analysemethoden. Eine anwendungsorientierte Einführung (12th ed.). Berlin,
Heidelberg: Springer.
Benson, R. S., & D. J. MacCabe (2004). From Good Manufacturing Practice to
Good Manufacturing Performance. Pharmaceutical Engineering, 24(4), 26–34.
Bortz, J., & Schuster, C. (2010). Statistik für Human- und Sozialwissenschaftler:
Lehrbuch mit Onlinen-Materialien (7. vollst. überarb. u. aktualisierte Auflage).
Springer-Lehrbuch: Springer.
Boyer, K. K., & Lewis, M. W. (2002). Competitive Priorities: Investigating The
Need For Trade-Offs In Operations Strategy. Production and Operations
Management, 11(1), 9–20.
Bozarth, C., & McDermott, C. (1998). Configurations in manufacturing strategy: a
review and directions for future research. Journal of Operations Management,
16(4), 427–439.
Brosius, F. (2011). SPSS 19. Heidelberg: Verlagsgruppe Hültig Jehle Rehm.
Christiansen, T., Berry, W. L., Bruun, P., & Ward Peter T. (2003). A mapping of
competitive priorities, manufacturing practices, and operational performance in
groups of Danish manufacturing companies. International Journal of Operations &
Production Management, 23(10), 1163–1183.

96 References
Costello, A. B., & Osborne, J. (2005). Best practices in exploratory factor analysis:
four recommendations for getting the most from your analysis. Practical
Assessment Research & Evaluation, 10(7). Available from:
http://pareonline.net/getvn.asp?v=10&n=7
Cua, K. O., McKone, K. E., & Schroeder, R. G. (2001). Relationships between
implementation of TQM, JIT, and TPM and manufacturing performance. Journal of
Operations Management, 19(2), 675–694.
Dangayach, G. S., & Deshmukh, S. G. (2001). Manufacturing strategy: Literature
review and some issues. International Journal of Operations & Production
Management, 21(7), 884–932.
de Menezes, L. M., Wood, S., & Gelade, G. (2010). The integration of human
resource and operation management practices and its link with performance: A
longitudinal latent class study. Journal of Operations Management, 28(6), 455–471.
de Meyer, A. (1992). An empirical investigation of manufacturing strategies in
European industry. In C. A. Voss (Ed.), Manufacturing Strategy, Process and
Content (1st ed., pp.221–238). London: Chapman & Hall.
de Meyer, A., & Ferdows, K. (1990). Influence of Manufacturing Improvement
Programmes on Performance. International Journal of Operations & Production
Management, 10(2), 120–131.
de Treville, S., & Antonakis, J. (2006). Could lean production job design be
intrinsically motivating? Contextual, configurational and levels-of analysis issue.
Journal of Operations Management, 24(2), 99–123.
Dean, J. W., & Snell S. A. (1996). The strategic use of integrated manufacturing:
empirical an examination. Strategic Management Journal, 17(6), 459–481.
Deflorin, P. (2007). Fähigkeiten zur Umsetzung hybrider Produktionsstrategien in
der Schweiz. Dissertation, Universität St.Gallen, St.Gallen, Schweiz.
Donaldson, L. (2001). The Contingency Theory of Organizations. Thousand Oaks,
Calif.: Sage Publications.
Dow, D., Samson, D., & Ford, S. (1999). Exploding the myth: do all quality
management practices contribute to superior quality performance? Production and
Operations Management, 8(1), 1–27.

References 97
Drazin, R., & van de Ven, A. H. (1985). Alternative Forms of Fit in Contingency
Theory. Administrative Science Quarterly, 30(4), 514–539.
Dreyer, B., & Grønhaug, K. (2004). Uncertainty, flexibility, and sustained
competitive advantage: Success factors, competitive advantage and competence
development. Journal of Business Research, 57(5), 484–494.
Ferdows, K., & de Meyer, A. (1990). Lasting improvements in manufacturing
performance: In search of a new theory. Journal of Operations Management, 9(2),
168–184.
Ferdows, K., Miller, J. G., Nakane, J., & Vollmann, T. E. (1986). Evolving global
manufacturing strategies: projections into the 1990s. International Journal of
Operations & Production Management, 6(4), 6–16.
Field, A. P. (2000). Discovering Statistics Using SPSS for Windows. London: Sage.
Flynn, B. B., & Flynn, E. J. (2004). An exploratory study of the nature of
cumulative capabilities. Journal of Operations Management, 22(5), 439–457.
Flynn, B. B., Sakakibara, S., Schroeder, R. G., Bates, K. A., & Flynn, E. J. (1990).
Empirical research methods in operations management. Journal of Operations
Management, 9(2), 250–284.
Flynn, B. B., Sakakibara, S., & Schroeder, R. G. (1995a). Relationship between JIT
and TQM: Practices and Performance. Academy of Management Journal, 38(5),
1325–1360.
Flynn, B. B., Schroeder, R. G., & Flynn, E. J. (1999). World class manufacturing:
an investigation of Hayes and Wheelwright's foundation. Journal of Operations
Management, 17(3), 249–269.
Flynn, B. B., Schroeder, R. G., & Sakakibara, S. (1995b). The impact of quality
management practices on performance and competitive advantage. Decision
Sciences, 26(5), 659–691.
Forrester, J. W. (1961). Industrial Dynamics. Cambridge MA: Productivity Press.
Forrester, J. W. (1969). Urban Dynamics. Cambridge MA: Productivity Press.
Forrester, J. W. (1989). The beginning of System Dynamics. Banquet Talk at the
international Meeting of the System Dynamics Society Stuttgart, Germany, July 13,
1989.

98 References
Friedli, T. (2006). Technologiemanagement: Modelle zur Sicherung der
Wettbewerbsfähigkeit. Berlin, Heidelberg: Springer-Verlag.
Friedli, T., Basu, P. K., Gronauer, T., & Werani, J. (Eds.) (2010). The Pathway to
Operational Excellence in the Pharmaceutical Industry - Overcoming the Internal
Inertia. Aulendorf: ECV Editio Cantor.
Frohlich, M. T., & Dixon, J. R. (2001). A taxonomy of manufacturing strategies
revisited. Journal of Operations Management, 19(5), 541–558.
Fürntratt, E. (1969). Zur Bestimmung der Anzahl interpretierbarer gemeinsamer
Faktoren in der Faktorenanalyse psychologischer Daten. Diagnostica, 15, 62–75.
Garnett, N., Jones, D. T., & Murray, S. (1998). Strategic Application of Lean
Thinking. Proceedings IGLC ‘98 Guaruja, Brazil.
Gassmann, O. (1999). Praxisnähe mit Fallstudienforschung.
Wissenschaftsmanagement, 5(3), 11–16.
Grichnik, K., Winkler, C., & Rothfeder, J. (2008). Make or Break: How
Manufacturers Can Leap from Decline to Revitalization. New York: Mc Graw-Hill
Professional.
Gronauer, T., & Friedli, T. (2010). Driving Forces Impacting Pharmaceutical
Manufacturing and Supply. In T. Friedli, P. K. Basu, T. Gronauer, & J. Werani
(Eds.), The Pathway to Operational Excellence in the Pharmaceutical Industry -
Overcoming the Internal Inertia (pp.42-63). Aulendorf: ECV Editio Cantor.
Gütter, S. (2010). The influence of single lean principles on lean bundles. In:
Exploring interfaces. Brüssel: European Operations Management Association,
2011. - 18th International Annual EurOMA Conference. - Cambridge, UK.
Hair, J. F., Black, B., Babin, B., Anderson, R. E., & Tatham, R. L. (2006).
Multivariate Data Analysis (6th ed.). Upper Saddle River, New Jersey: Prentice
Hall.
Hall, R. W. (1987). Attaining Manufacturing Excellence: Just-in- Time, Total
Quality, Total People Involvement. Homewood, IL: Dow Jones- Irwin.
Harrison, A., & Storey, J. (1996). New wave manufacturing strategies: Operational,
organizational and human dimensions. International Journal of Operations &
Production Management, 16(2), 63–76.

References 99
Hayes, R. H., & Wheelwright, S. C. (1984). Restoring Our Competitive Edge:
Competing Through Manufacturing. New York: Wiley.
Hayes, R. H., Wheelwright, S. C., & Clark, K. B. (1988). New York: Dynamic
Manufacturing.
Herrmann, A., & Seilheimer, C. (2000). Varianz- und Kovarianzanalyse. In A.
Herrmann & C. Homburg (Eds.), Marktforschung (pp.265–294). Wiesbaden:
Gabler.
Hill, W., & Ulrich, P. (1979). Wissenschaftliche Aspekte ausgewählter
betriebswirtschaftlicher Konzeptionen. In H. Raffée & B. Abel (Eds.),
Wissenschaftstheoretische Grundfragen der Wirtschaftswissenschaften (pp.161–
190). München: Vahlen.
Hines, P., Found, P., Griffiths, G., & Harrison, R. (2008). Staying Lean: Thriving
not just surviving: Cardiff University, Cardiff: Lean Enterprise Research Centre.
Hines, P., Holweg, M., & Rich, N. (2004). Learning to evolve: A. review of
contemporary lean thinking. International Journal of Operations & Production
Management, 24(10), 994–1011.
Hofer, A., Hofer, C., Eroglu, C., & Waller, M. A. (2011). An institutional theoretic
perspective on forces driving adoption of lean production globally: China vis-à-vis
the United States. International Journal of Logistics Management, 22(2), 148-178.
IMS Institute for Healthcare Informatics (2012). The Global Use of Medicines:
Outlook Through 2016. Available from:
http://www.imshealth.com/portal/site/imshealth/menuitem.f27050a3118dd27f24e52
4e51ad8c22a/?vgnextoid=736de5fda6370410VgnVCM10000076192ca2RCRD&vg
nextfmt=default [cited 10.12.2013]
Janssen, J., & Laatz, W. (2010). Statistische Datenanalyse mit SPSS (7th ed.).
Berlin/ Heidelberg: Springer.
Jensen, O. (2008). Clusteranalyse. In A. Herrmann, C. Homburg, & M. Klarmann
(Eds.), Handbuch Marktforschung (3rd ed., pp.335–372). Wiesbaden: Gabler.
Kannan, V. R., & Tan, K. C. (2005). Just in Time, Total Quality Management, and
Supply Chain Management: Understanding Their Linkages and Impact on Business
Performance. Omega, 33(2), 153–162.

100 References
Karlsson, C., & Åhlström, P. (1996). Assessing changes towards lean production.
International Journal of Operations & Production Management, 16(2), 24–41.
Kathuria, R. (2000). Competitive priorities and managerial performance: a
taxonomy of small manufacturers. Journal of Operations Management, 18(6), 627–
641.
Kathuria, R., Partovi, F. Y., & Greenhaus, J. H. (2010). Leadership practices,
competitive priorities, and manufacturing group performance. International Journal
of Operations & Production Management, 30(10), 1080–1105.
Kerlinger, F. N. (1978). Foundations of Behavioral Research. New York: McGraw-
Hill.
Ketchen, D. J., & Shook, C. L. (1996). The Application of Cluster Analysis in
Strategic Management Research: An Analysis and Critique. Strategic Management
Journal, 17(6), 441–458.
Ketokivi, M., & Schroeder, R. (2004). Manufacturing practices, strategic fit and
performance A routine-based view. International Journal of Operations &
Production Management, 24(2), 171–191.
Kickuth, M. (2005). Operative Exzellenz in der pharmazeutischen Industrie: ein
Referenzmodell: Dissertation Universität St.Gallen. Bamberg.
Kieser, A. (2002). Organisationstheorien (5th ed.). Stuttgart; Berlin; Köln:
Kohlhammer.
Kim, J. S., & Arnold, P. (1996). Operationalizing manufacturing strategy. An
exploratory study of constructs and linkage. International Journal of Operations &
Production Management, 16(12), 45–73.
Koufteros, X. A., & Vonderembse, M. A. (1998). The impact of organizational
structure on the level of JIT attainment: towards theory development. International
Journal of Production Research, 36(10), 2863–2878.
Koufteros, X. A., Vonderembse, M. A., & Doll, W. J. (1998). Developing measures
of time-based manufacturing. Journal of Operations Management, 16, 21–41.
Krafcik, J. F. (1988). Triumph of the lean production system. Sloan Management
Review, 30(1), 41–52.

References 101
Kreikebaum, H. (1998). Organisationsmanagement internationaler Unternehmen:
Grundlagen und neue Strukturen. Wiesbaden: Gabler.
Kubiczek, H. (1977). Heuristische Bezugsrahmen und heuristisch angelegte
Forschungsdesigns als Elemente einer Konstruktionsstrategie empirischer
Forschung. In R. Koehler (Ed.), Empirische und handlungstheoretische
Forschungskonzeptionen in der Betriebswirtschaftslehre. Bericht über die Tagung
des Verbandes der Hochschullehrer für Betriebswirtschaft e.V. (pp.5–36). Stuttgart.
Lehmann, D. R. (1979). Market Research and Analysis. Homewood, IL: lrwin.
Liker, J. K., & Meier, D. (2006). The Toyota Way Fieldbook. New York: McGraw-
Hill.
Mackelprang, A. W., & Nair, A. (2010). Relationship between just-in-time
manufacturing practices and performance: A meta-analytic investigation. Journal of
Operations Management, 28, 283–302.
Mapes, J., New, C., & Szwejczewski, M. (1997). Performance trade-offs in
manufacturing plants. International Journal of Operations & Production
Management, 17(9/10), 1020–1033.
Martín-Peña, M. L., & Díaz-Garrido, E. (2008). Typologies and taxonomies of
operations strategy: a literature review. Management Research News, 31(3), 200–
218.
Matsui, Y. (2007). An empirical analysis of just-in-time production in Japanese
manufacturing companies. International Journal of Production Economics, 108,
153–164.
McKone, K. E., Schroeder, R. G., & Cua, K. O. (2001). The Impact of Total
Productive Maintenance Practices on Manufacturing Performance. Journal of
Operations Management, 19(1), 39–58.
McKone, K. E., Schroeder, R. G., & Cua, K. O. (1999). Total productive
maintenance: a contextual view. Journal of Operations Management, 17(2), 123–
144.
Meadows, D. H. (2008). Thinking in Systems - a Primer edited by Diana Wright.
London: Earthscan.

102 References
Melton, T. (2005). The benefits of lean manufacturing: What Lean Thinking has to
Offer the Process Industries. Trans IChemE, Part A: Chemical Engineering
Research and Design, 83(A6), 662–673.
Meyer, A. D., Tsui, A. S., & Hinings, C. R. (1993). Configurational Approaches to
Organizational Analysis. Academy of Management Journal, 36(6), 1175–1195.
Miller, J. G., & Roth, A. V. (1994). A Taxonomy of Manufacturing Strategies.
Management Science, 40(3), 285–304.
Nakajima, S. (1988). Introduction to TPM. Cambridge, MA: Productivity Press.
Noble, M. A. (1995). Manufacturing Strategy: Testing the Cumulative Model in a
Multiple Country Context. Decision Sciences, 26(5), 693–721.
Noble, M. A. (1997). Manufacturing competitive priorities and productivity: An
empirical study. International Journal of Operations & Production Management,
17(1/2), 85–99.
Nunnally, J. C. (1978). Psychometric theory (2nd ed.). New York: McGraw-Hill.
Ohno, T. (1988). The Toyota Production System: Beyond Large-Scale Production.
Portland: Productivity Press.
Pettersen, J. (2009). Defining lean production: some conceptual and practical issues.
The TQM Journal, 21(2), 127–142.
Pharmaceutical Executive (2009). Lean Comes to Pharma. Available from:
http://www.pharmexec.com/pharmexec/Strategy/Lean-Comes-to-
Pharma/ArticleStandard/Article/detail/641195 [cited 10.01.2012]
Powell, T. C. (1995). Total Quality Management as competitive advantage: A
Review and Empirical Study. Strategic Management Journal, 16, 15–37.
Rahman, S., Laosirihongthong, T., & Sohal, A. S. (2010). Impact of lean strategy on
operational performance: a study of Thai manufacturing companies. Journal of
Manufacturing Technology Management, 21(7), 839–852.
Roth, A. V., & Miller, J. G. (1992). Success factors in manufacturing. Business
Horizons, 35(4), 73–81.
Sakakibara, S., Flynn, B. B., & Schroeder, R. G. (1993). A framework and
measurement instrument for just-in-time manufacturing. Production and Operations
Management, 2(3), 177–194.

References 103
Sakakibara, S., Flynn, B. B., Schroeder, R. G., & Morris, W. T. (1997). The Impact
of Just-in-Time Manufacturing and Its Infrastructure on Manufacturing
Performance. Management Science, 43(9), 1246–1257.
Scherrer-Rathje, M., Boyle, T. A., & Deflorin, P. (2009). Lean, take two!
Reflections from the second attempt at lean implementation. Business Horizons,
52(1), 79–88.
Schonberger, R. J. (1986). World Class Manufacturing: The Lessons of Simplicity
Applied. New York: Free Press.
Senge, P. M. (1990). The Fifth Discipline - The art and practice of the learning
organization. New York: Doublday / Currency.
Shah, R., & Ward, P. T. (2003). Lean manufacturing: context, practice bundles, and
performance. Journal of Operations Management, 21(2), 129–149.
Shah, R., & Ward, P. T. (2007). Defining and developing measures of lean
production. Journal of Operations Management, 25(4), 785–805.
Shah, R. (2002). A Configurational View of Lean Manufacturing and its Theoretical
Implications. Dissertation, Ohio State University, Columbus.
Sila, I. (2007). Examining the effects of contextual factors on TQM and
performance through the lens of organizational theories: An empirical study.
Journal of Operations Management, 25, 83–109.
Sila, I., & Ebrahimpour, M. (2002). An investigation of the total quality
management survey based research published between 1989 and 2000: A literature
review. International Journal of Quality & Reliability Management, 19(7), 902–
970.
Skinner, W. (1969). Manufacturing--Missing Link in Corporate Strategy. Harvard
Business Review, 47(3), 136–145.
Skinner, W. (1974). The focused factory. Harvard Business Review, 52(3), 113–
121.
Skinner, W. (1978). Manufacturing in the corporate strategy. New York, NY:
Wiley.

104 References
Skinner, W. (1992). Missing the links in manufacturing strategy. In C. A. Voss
(Ed.), Manufacturing Strategy, Process and Content (1st ed., pp.13–26). London:
Chapman & Hall.
Sousa, R., & Voss, C. A. (2002). Quality management re-visited: a reflective review
and agenda for future research. Journal of Operations Management, 20(1), 91–109.
Sousa, R., & Voss, C. A. (2008). Contingency research in operations management
practices. Journal of Operations Management, 26, 697–713.
Sum, C.-C., Kow, L. S.-J., & Chen, C.-S. (2004). A taxonomy of operations
strategies of high performing small and medium enterprises in Singapore.
International Journal of Operations & Production Management, 24(3), 321–345.
Sweeney, M. T., & Szwejczewski, M. (2000). Generic manufacturing strategies
among UK industries. First World Conference on Production and Operations
Management, POMS, Sevilla.
Sweeney, M. T., & Szwejczewski, M. (1996). Manufacturing strategy and
performance: A study of the UK engineering industry. International Journal of
Operations & Production Management, 16(5), 25–40.
Tomczak, T. (1992). Forschungsmethoden in der Marketingwissenschaft. Marketing
ZFP, 2, 77–87.
U.S. Food and Drug Administration (FDA) (2004). Pharmaceutical cGMPs for the
21st Century - A Risk-Based Approach, Final Report - Fall 2004. Available from:
http://www.fda.gov/Drugs/DevelopmentApprovalProcess/Manufacturing/Questions
andAnswersonCurrentGoodManufacturingPracticescGMPforDrugs/UCM071836
[cited 17.10.2012]
Ulrich, H. (1984). Die Betriebswirtschaftslehre als anwendungsorientierte
Sozialwissenschaft. In T. Dyllick & G. Probst (Eds.), Management (1st ed., pp.168–
199). Bern: Haupt.
Ulrich, H. (1991). Die Betriebswirtschaftslehre als anwendungsorientierte
Sozialwissenschaft. In M. N. Geist & R. Köhler (Eds.), Die Führung des Betriebs,
Festschrift für Curt Sandig (pp.1–26). Stuttgart: Poeschel Verlag.
Voss, C. A. (1995). Alternative paradigms for manufacturing strategy. International
Journal of Operations & Production Management, 15(4), 5–16.

References 105
Voss, C. A. (2005). Paradigms of manufacturing strategy re-visited. International
Journal of Operations & Production Management, 25(12), 1223–1227.
Ward, P. T., Bickford, D. J., & Leong, G. K. (1996). Configurations of
Manufacturing Strategy, Business Strategy, Environment and Structure. Journal of
Management, 22(4), 597–626.
Ward, P. T., McCreery, J. K., & Anand, G. (2007). Business strategies and
manufacturing decisions: An empirical examination of linkages. International
Journal of Operations & Production Management, 27(9), 951–973.
Weick, K. E. (1989). Theory Construction as Disciplined Imagination. The
Academy of Management Review, 14(4), 516–531.
Womack, J. P., & Jones, D. T. (1996). Lean Thinking: Banish Waste and Create
Wealth in Your Corporation. New York: Free Press, Simon & Schuster, Inc.
Womack, J. P., Jones, D. T., & Roos, D. (1990). The Machine that Changed the
World. New York: Harper Perennial.
Zayko, M. J., Broughman, D. J., & Hancock, W. M. (1997). Lean manufacturing
yields world-class improvements for small manufacturer. IIE Solution, (April), 36–
40.
Zhao, X., Sum, C.-C., Qi, Y., Zhang, H., & Lee, T.-S. (2006). A taxonomy of
manufacturing strategies in China. Journal of Operations Management, 24(5), 621–
636.
Zu, X., Fredendall, L. D., & Douglas, T. J. (2008). The evolving theory of quality
management: The role of Six Sigma. Journal of Operations Management, 26, 630–
650.

106 Appendix A: Overview lean practices and bundles
Appendix A: Overview lean practices and bundles Author Category Practice
Sakakibara et al.
(1993)
Management of people
and schedules in a JIT
system
Set-up time reduction
Small-group problem solving
Training
Daily schedule adherence
Preventive maintenance
Simplified physical flow Equipment layout
Small-lot sizes
Product design simplicity
Kanban
Pull system support
Supplier management JIT delivery from suppliers
Supplier quality level
Flynn et al.
(1995a)
TQM Customer focus
Product design
Statistical process control
JIT Kanban
Lot size reduction
Setup time reduction
JIT scheduling
Common infrastructure
practices
Information feedback
Management support
Plant environment
Workforce management
Supplier relationship
Flynn et al.
(1995b)
Core quality management
practices
Process flow management
Product design process
Statistical control/ feedback
Quality management
infrastructure practices
Customer relationship
Supplier relationship
Work attitudes
Workforce management
Top management support
Powell
(1995)
TQM Committed leadership
Adoption and communication of TQM

Appendix A: Overview lean practices and bundles 107
Closer customer relationships
Closer supplier relationships
Benchmarking
Increased training
Open organisation
Employee empowerment
Zero-defects mentality
Flexible manufacturing
Process improvement
Measurement
Sakakibara et al.
(1997)
Quality Management Process control
Feedback
Rewards for Quality
Top management quality leadership
Supplier quality involvement
JIT Setup time reduction
Schedule flexibility
Maintenance
Equipment layout
Kanban
JIT supplier relationship
Product Design New product quality
Design characteristics
Interfunctional design efforts
Workforce Management Supervisory leadership
Incentives for group performance
Labor flexibility
Small group problem solving
Recruiting and selection
Supervisors as team leaders
Koufteros et al.
(1998)
TBC Shop-floor employee involvement in problem solving
Reengineering set-ups
Cellular manufacturing
Quality improvement efforts
Preventive maintenance
Dependable suppliers
Pull production

108 Appendix A: Overview lean practices and bundles
Koufteros &
Vonderembse
(1998)
JIT Re-engineering setup
Cellular manufacturing
Preventive maintenance
Pull production
Quality assurance
Dow et al.
(1999)
TQM Workforce commitment
Shared vision
Customer focus
Use of teams
Personnel training
Co-operative supplier relations
Use of benchmarking
Advanced manufacturing systems
Use of just-in-time principles
Flynn et al.
(1999)
WCM practices Employee development
Management technical competence
Design for customer needs
Worker participation
Proprietary equipment
Continuous improvement
Core quality practices Process control
Feedback of information
Core JIT practices Pull system
JIT supplier relations
McKone et al.
(1999)
TPM Housekeeping
Cross-training
Teams
Operator involvement
Disciplined planning
Information tracking
Schedule compliance
TQM Customer involvement
Rewards for quality
Supplier quality management
Top management leadership for quality
JIT JIT delivery by suppliers
JIT link with customers

Appendix A: Overview lean practices and bundles 109
Pull system support
Repetitive nature of master schedule
Setup reduction
EI Centralization of authority
Cua et al.
(2001)
TPM Autonomous & planned maintenance
Technology emphasis
Proprietary equipment development
TQM Cross-functional product design
Process management
Supplier quality management
Customer involvement
JIT Setup time reduction
Pull system production
JIT delivery by suppliers
Equipment layout
Daily schedule adherence
Common Practices Committed leadership
Strategic planning
Cross-functional training
Employee involvement
Information and feedback
Sila &
Ebrahimpour
(2002)
TQM Top management commitment
Social responsibility
Strategic planning
Customer focus and satisfaction
Quality information and performance measurement
Benchmarking
Human resource management
Training
Employee involvement
Employee empowerment
Employee satisfaction
Teamwork
Employee appraisal, rewards, and recognition
Process management
Process control
Product and service design

110 Appendix A: Overview lean practices and bundles
Supplier management
Continuous improvement and innovation
Quality assurance
Zero defects
Quality culture
Communication
Quality systems
Just in time
Flexibility
Ahmad et al.
(2003)
Quality Management Customer focus
Feedback
Process control
Supplier involvement
JIT Daily schedule adherence
Equipment layout
The kanban system
Setup time reduction
JIT delivery by suppliers
JIT link with customers
Product Technology Simplicity in product design
Customer focus in product design
Work Integration System Interaction facilitation
Coordination of decision making
Job rotation
Management presence on the shop floor
HRM Training
Compensation for breadth of skill
Multifunctional employees
Recruiting and selection
Shah & Ward
(2003)
TPM Predictive or preventive maintenance
Maintenance optimization
Safety improvement programs
Planning and scheduling strategies
New process equipment or technologies
TQM Competitive benchmarking
Quality management programs
Total quality management

Appendix A: Overview lean practices and bundles 111
Process capability measurement
Formal continuous improvement program
JIT Lot size reduction
JIT/ continuous flow production
Pull system
Cellular manufacturing
Cycle time reduction
Focused factory production systems
Agile manufacturing strategies
Quick changeover techniques
Bottleneck/ constraint removal
Reengineered production processes
HRM Self-directed work teams
Flexible, cross-functional workforce
Kannan & Tan
(2005)
TQM Product design
Strategic commitment to quality
Supplier capability
JIT Material flow
Commitment to JIT
Supply management
SCM Supply chain integration
Supply chain coordination
Supply chain development
Information sharing
Kickuth
(2005)
TPM Preventive maintenance
Housekeeping
Effective technology usage
TQM Process management
Customer integration
Cross-functional product development
Supplier quality management
JIT Set-up time reduction
Pull system
Planning adherence
Layout optimization
EMS Direction setting
Management commitment and company culture

112 Appendix A: Overview lean practices and bundles
Employee involvement and continuous
i Functional integration and qualification
Shah & Ward
(2007)
Supplier related Supplier feedback
JIT delivery by suppliers
Supplier development
Customer related Customer involvement
Internally related Pull
Continuous flow
Set up time reduction
Total productive/preventive maintenance
Statistical process control
Employee involvement
Sila
(2007)
TQM Leadership
Strategic planning
Customer focus
Information and analysis
Human resource management
Process management
Supplier management
Zu et al.
(2008)
QM Top management support
Customer relationship
Supplier relationship
Workforce management
Quality information
Product/ service design
Process management
Six Sigma Six Sigma role structure
Six Sigma structured improvement procedure
Six Sigma focus on metrics
Mackelprang &
Nair
(2010)
Matsui (2007)
JIT Setup time reduction
Small lot sizes
JIT delivery from suppliers
Daily schedule adherence
Preventive maintenance
Equipment layout
Kanban
JIT link with customers

Appendix A: Overview lean practices and bundles 113
Pull system
Repetitive nature of master schedule
Menezes et al.
(2010)
HRM Empowerment
Learning culture
Team-based work
OM Integrated computer-based technology
Just-in-time production
Supply-chain partnering
Total quality management
Rahman et al.
(2010)
JIT Reduction of inventory
Preventive maintenance
Cycle time reduction
Use of new process technology
Use of quick change-over techniques
Reducing set-up time
Waste minimization Eliminate waste
Use of error proofing techniques (Pokeyoke)
Using pull-based production system (Kanban)
Removing bottlenecks
Flow management Reducing production lot size
Focusing on single supplier
Continuous/ one piece flow
Angelis et al.
(2011)
Lean Set-up reduction
Inventory and waste reduction
Kanban pull signals
Supplier partnerships
Continuous improvement programs
mixed-model production
TQM
Foolproof or design for assembly systems
TPM
SOPs
Hofer et al.
(2011)
Internal-technical Pull
Flow
Setup time reduction
Statistical process control
Total productive maintenance

114 Appendix A: Overview lean practices and bundles
Internal-relational Employee involvement
Supply chain Supplier JIT
Supplier feedback
Supplier development
Customer involvement

Appendix B: OPEX questionnaire (excerpt of questions) 115
Appendix B: OPEX questionnaire (excerpt of questions)
Figure B- 1: General information and competitive priorities

116 Appendix B: OPEX questionnaire (excerpt of questions)

Appendix B: OPEX questionnaire (excerpt of questions) 117

118 Appendix B: OPEX questionnaire (excerpt of questions)

Appendix B: OPEX questionnaire (excerpt of questions) 119

120 Appendix B: OPEX questionnaire (excerpt of questions)
Figure B- 2: Four categories of lean practices

Appendix B: OPEX questionnaire (excerpt of questions) 121
Figure B- 3: Key performance indicators for the goals of lean bundles

122 Appendix C: Details cluster analysis
Appendix C: Details cluster analysis
Figure C- 1: Dendrogram – outlier analysis

Appendix C: Details cluster analysis 123
Figure C- 2: Dendrogram – hierarchical clustering

124 Appendix C: Details cluster analysis
Figure C- 3: Number of clusters based on agglomeration coefficients
.000
100.000
200.000
300.000
400.000
500.000
600.000
700.000
800.000
0 5 10 15 20 25
Err
or s
um
s of
sq
uar
es
Number of Clusters
Scatter plot elbow
.000
50.000
100.000
150.000
200.000
250.000
0 5 10 15 20 25
Gra
dien
t of
err
or s
ums
of s
qu
ares
Number of Clusters
Scatter plot gradient

Curriculum Vitae 125
Curriculum Vitae
Name: Saskia Gütter
Date of birth: December 8th, 1983
Place of birth: Usingen/ Germany
Practical Experience: 2009 – 2012 University of St.Gallen, St.Gallen/ Switzerland
Institute of Technology Management Research Associate
2008 University of St.Gallen, St.Gallen/ Switzerland Institute of Technology Management Internship and Diploma thesis
2007 NETZSCH do Brasil Ind. e Com. Ltda, Pomerode/ Brazil Internship: Value stream mapping
2005 & 2003 Horiba Europe GmbH, Oberursel/ Germany Technical internship
Education 2009 – 2014 University of St.Gallen, St.Gallen/ Switzerland
Institute of Technology Management Doctoral Studies in Business Innovation
2007 Univ. Federal de Santa Catarina, Florianopolis/ Brazil Departamento de Engenharia de Produção e Sistemas Exchange student
2003 – 2009 Technische Universität Ilmenau, Ilmenau/ Germany Mechanical Engineering & Business Administration
(Dipl. Wirtsch. Ing.)
1994 – 2003 Christian-Wirth-Schule, Usingen/ Germany Abitur (German A-Level Equivalent)