sasol limited interim financial results · 1. adjusted ebitda is calculated by adjusting ebit for...
TRANSCRIPT

Copyright ©, 2020, Sasol
SASOL LIMITED INTERIM FINANCIAL RESULTSfor the six months ended 31 December 2019

2Copyright ©, 2020, Sasol
Forward-looking statements and definitions
Sasol may, in this document, make certain statements that are not historical facts and relate to analyses and other information which are based on forecasts of future results and estimates of amounts not yet determinable. These statements may also relate to our future prospects, expectations, developments and business strategies. Examples of such forward-looking statements include, but are not limited to, statements regarding exchange rate fluctuations, volume growth, increases in market share, total shareholder return, executing our growth projects (including LCCP), oil and gas reserves, cost reductions, our Continuous Improvement (CI) initiative, our climate change strategy and business performance outlook. Words such as “believe”, “anticipate”, “expect”, “intend", “seek”, “will”, “plan”, “could”, “may”, “endeavour”, “target”, “forecast” and “project” and similar expressions are intended to identify such forward-looking statements, but are not the exclusive means of identifying such statements. By their very nature, forward-looking statements involve inherent risks and uncertainties, both general and specific, and there are risks that the predictions, forecasts, projections and other forward-looking statements will not be achieved. If one or more of these risks materialise, or should underlying assumptions prove incorrect, our actual results may differ materially from those anticipated. You should understand that a number of important factors could cause actual results to differ materially from the plans, objectives, expectations, estimates and intentions expressed in such forward-looking statements. These factors and others are discussed more fully in our most recent annual report on Form 20-F filed on 28 October 2019 and in other filings with the United States Securities and Exchange Commission. The list of factors discussed therein is not exhaustive; when relying on forward-looking statements to make investment decisions, you should carefully consider both these factors and other uncertainties and events. Forward-looking statements apply only as of the date on which they are made, and we do not undertake any obligation to update or revise any of them, whether as a result of new information, future events or otherwise.
Please note: One billion is defined as one thousand million. bbl – barrel, bscf – billion standard cubic feet, mmscf – million standard cubic feet, oil references Brent crude: mmboe – million barrels oil equivalent.
All references to years refer to the financial year ended 30 June.
Any reference to a calendar year is prefaced by the word “calendar”.
Comprehensive additional information is available on our website: www.sasol.com

3Copyright ©, 2020, Sasol
FY20 INTERIM RESULTS
Business results overviewFleetwood Grobler
Financial resultsPaul Victor
Realism, focus and deliveryFleetwood Grobler

4Copyright ©, 2020, Sasol
◉ BUSINESS RESULTS OVERVIEWFleetwood Grobler

5Copyright ©, 2020, Sasol
Key messages
Focused priorities to restore stability and confidence, positioning Sasol for a sustainable future
FINANCIAL PERFORMANCE AND POSITION
• Challenging global macro environment reduced earnings
• Balance sheet protection remains a top priority; FY20 interim dividend passed
• Cash inflection point to be reached in H2 FY20
LCCP UPDATE
• Project on track within total cost estimate
• Operating units performing well; positive EBITDA contribution in H2 FY20
• LDPE root cause identified and remediation commenced
• Relentless focus towards achieving zero harm
• Satisfactory production performance
• Asset integrity continued to be prioritised
OPERATIONAL PERFORMANCE

6Copyright ©, 2020, Sasol
Re-focus on safety and operational discipline
Operational performance | Driving zero harm in operations to reduce fatalities
Group Recordable Case Rate at 0,271
● Strong LCCP safety performance - RCR of 0,10
Safety culture and performance is showing a positive trend, however
Two tragic fatalities at Mining ● Dedicated safety taskforce established, supported
by Du-Pont Sustainable Solutions● Key focus on enhancing safety leadership
capabilities
1. Excluding illnesses
0
20
40
60
80
100
120
140
0,10
0,15
0,20
0,25
0,30
0,35
FY16 FY17 FY18 FY19 HY20
Rec
orda
ble
fata
lity
and
LWD
Cs
Rec
orda
ble
Cas
e R
ate
Fatalities, LWDCs and RCR
LWDCs Fatalities RCR

7Copyright ©, 2020, Sasol
Operational performance | Production highlights
• Successful phase shutdown at Secunda Synfuels; 4% increase in production (FY20: 7,7 – 7,8mt)
• Mining productivity decreased 7% due to unplanned downtime and geological complexity
• Natref production decreased 8% following a planned shutdown (FY20: > 600m3/h)
• Production increased due to beneficial operation of cracker, LLDPE and EO/EG units• Cracker currently operating above plan after successful catalyst change;
higher than 90% utilisation• LLDPE and EO value chain ramping up per plan
• HDPE plant continues to produce above expectation
• Production increased 2% supported by China ETO ramp-up; ETO production rates > 90% reached
• Production impacted by lower market demand
• ORYX utilisation at 98%; planned extended shutdown during H2 FY20
South African
Operations
North American
Operations
Eurasian Operations
Continued focus on safe and reliable operations, costs and engaged workforce

8Copyright ©, 2020, Sasol
LCCP strengthens our position as a global chemicals company
LCCP update | Delivery of LCCP remains critical
Governance
Capital estimateTotal project
Units under construction
FY20 EBITDA
LDPE status
Lessons learnt being incorporated into ways of working
Culture change underway
~80%Total nameplate1 capacity operational
98,4%Overall construction completed
Q4 FY20ZAG2 units to achieve beneficial operations
H2 CY20LDPE start-up
Root cause identified, equipment replacement underway and insurance in place
US$50m - 100mPositive EBITDA contribution in H2 FY20
(FY21: US$600m – 750m)
US$12,8bnTracking cost estimate guidance
All units operational by end CY20
1. Includes ethylene, polyethylene and EO value chain installed capacity brought online2. Ziegler, Alumina, Guerbet
9Copyright ©, 2020, Sasol
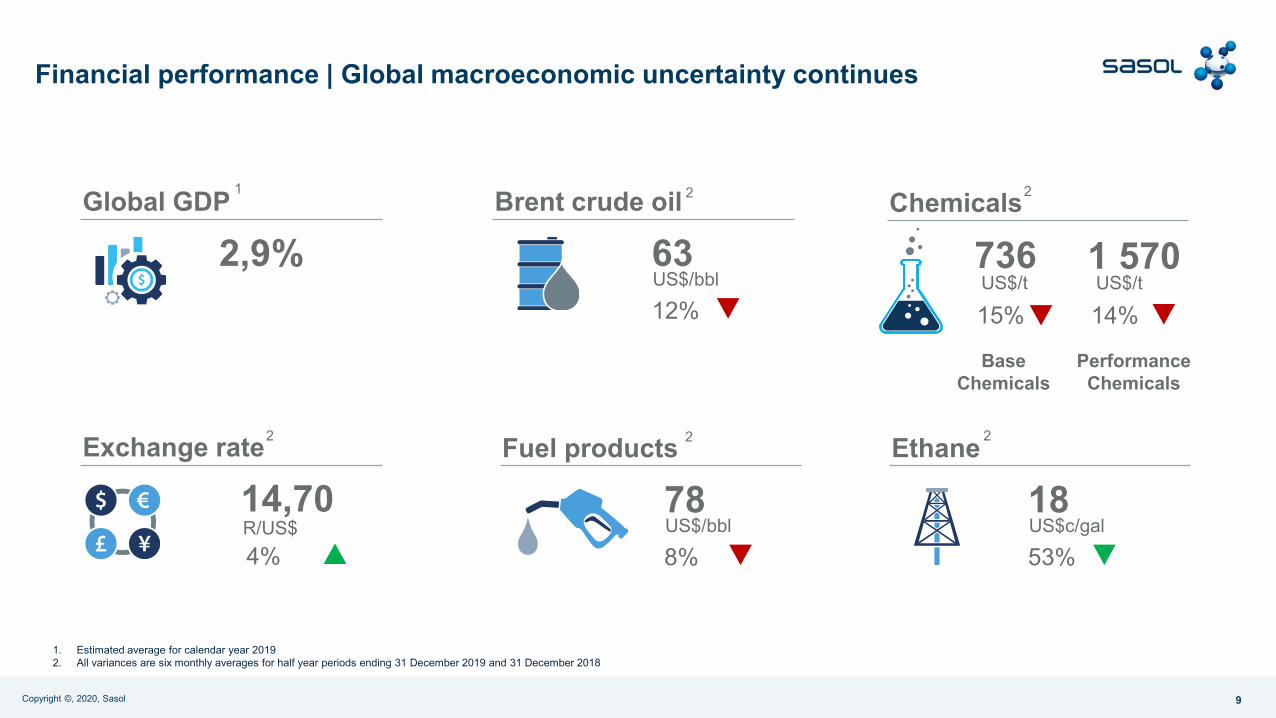
Financial performance | Global macroeconomic uncertainty continues
Fuel products
788% US$/bbl
Exchange rate
14,704% R/US$
Chemicals
73615% US$/t
Ethane
1853% US$c/gal
Global GDP
2,9%Brent crude oil
6312% US$/bbl
1 57014% US$/t
BaseChemicals
PerformanceChemicals
1. Estimated average for calendar year 20192. All variances are six monthly averages for half year periods ending 31 December 2019 and 31 December 2018
1 2
2 2
2
2

10Copyright ©, 2020, Sasol
Continued focus on product margin protection to mitigate the impact of macroeconomic volatility
Financial performance | Position impacted by macroeconomic volatility
FCF inflection pointin H2 FY20
Cash fixed costAdjusted EBITDA(proxy for cash)
Gearing64,5%
Capex
Working capital
< 6% targetR19,6bn
Net debt: EBITDA
R21,4bn
14,6%
30% lower2
as LCCP nearing completion
3% lower2
management focus delivering results2,9 x
27% lower2
macroeconomic volatility; lower prices
interim dividend passed
1. Per the Revolving Credit facility and US dollar Term Loan facility covenant definition which is set at 3,5 x2. All variances are six monthly averages for half year periods ending 31 December 2019 and 31 December 2018
excluding LCCP growth and once-off costs
1

11Copyright ©, 2020, Sasol
◉ FINANCIAL RESULTSPaul Victor

12Copyright ©, 2020, Sasol
Financial key messages
FINANCIAL OUTLOOK
• Focus on managing factors within our control
• Sustenance capital spend prioritised to maintain asset health
• Portfolio optimisation ongoing in line with strategic objectives
BALANCE SHEET PROTECTION
• Balance sheet protection prioritised; investment grade credit rating remains key
• Focused financial risk mitigation continues
• FY20 interim dividend passed; capital allocation principles unchanged
• Macro volatility continues in a slowing global economy
• Group profitability impacted by weaker macroeconomics and LCCP start-up
• Continued focus on cost and capital management to remain competitive
FINANCIAL RESULTS

13Copyright ©, 2020, Sasol
Financial results | Group profitability by segment
HY20 HY19 % ∆
Mining 1 374 2 661 48▼
Exploration and Production International (E&PI) 1 023 764 ) 34▲
Performance Chemicals (PC) 1 294 3 599 64▼
Base Chemicals (BC) (1 488) 3 076 >100▼
Energy 6 743 9 565 30▼
Group Functions 907 1 126 19▼
Earnings before interest and tax (Rm) 9 853 20 791 53▼
Adjusted EBITDA¹ (Rm) 19 595 26 791 27▼
Cash generated by operating activities (Rm) 19 633 24 768 21▼
Capital expenditure (Rbn) 21,4 30,4 30▼
Earnings per share (R) 6,56 23,92 73▼
Core headline earnings per share2 (R) 9,20 21,45 57▼
Adjusted EBITDA (%) by segment
30
48
22
ChemicalsEnergyMining and E&PI
78
8
14
South AfricaEuropeRest of World
Adjusted EBITDA (%) by geography
1. Adjusted EBITDA is calculated by adjusting EBIT for depreciation, amortisation, share-based payments, remeasurement items, movement in rehabilitation provisions due to discount rate changes, unrealised translation gains and losses, and unrealised gains and losses on hedging activities.
2. Core HEPS is calculated by adjusting headline earnings per share with once-off certain items (provision for tax litigation matters for HY19 and LCCP cash fixed cost with limited corresponding gross margin), period close adjustments and depreciation and amortisation of capital projects (exceeding R4 billion) which have reached beneficial operation and are still ramping up, and share-based payments on implementation of B-BBEE transactions.

14Copyright ©, 2020, Sasol
Financial results | Operating profit mainly impacted by macroeconomics
• Operating profit impacted by:
▼ oil price, softer chemical and refining margins▼ negative contribution from LCCP ▼ operational challenges at Mining▲ higher sales volumes ▼ costs: depreciation, growth costs and carbon tax
● normalised2 cash fixed cost increased 5,4% within 6% guidance provided
• Initiatives to reduce costs remain robust
• Impact of Coronavirus outbreak on business is a risk in following 12 to 18 months
9 854
20 790
HY20
Once-off and other
Cost
Sales volumes
Inflation
Product prices
Crude oil
Exchange rate
HY19
Rm
7%
(21%)
(19%)
(6%)
9%
(19%)
(3%)1
1. Includes lower mark-market valuation of group hedges and remeasurement items, offset by unrealised gain on revaluation of SIC loan2. Excludes US growth and business enablement cost
Macro environment
Costs and volumes
15Copyright ©, 2020, Sasol
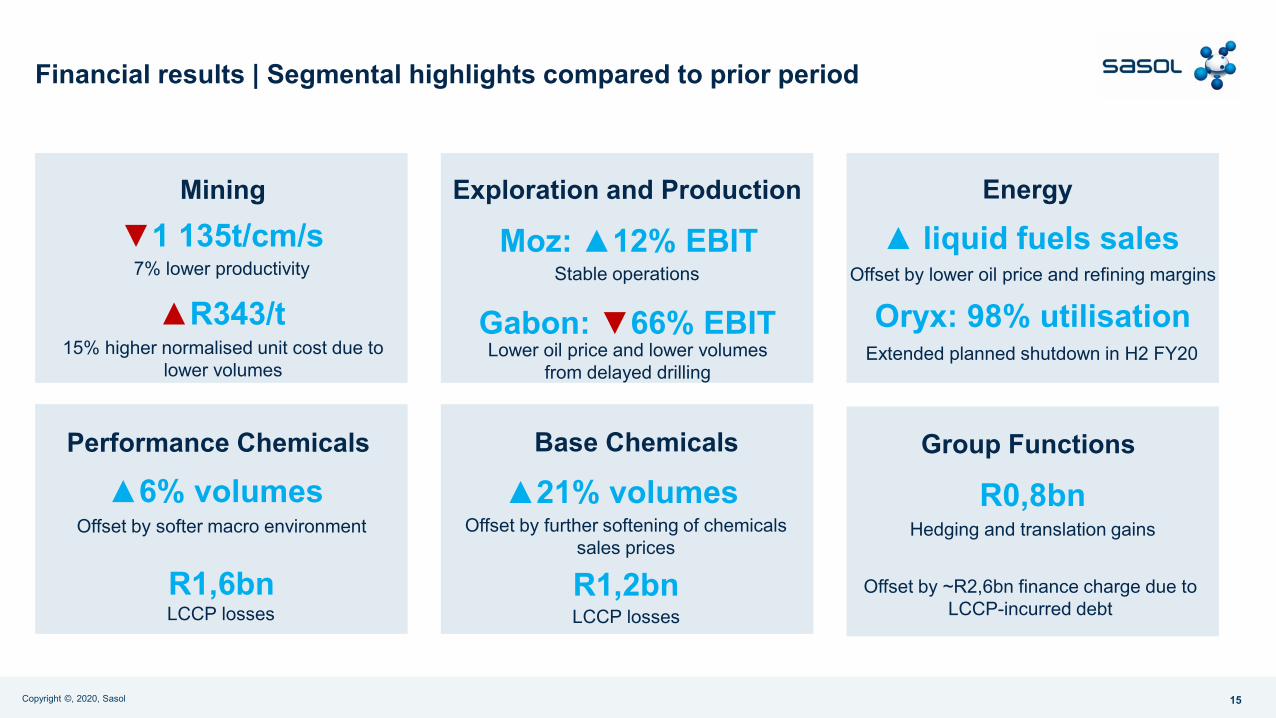
Financial results | Segmental highlights compared to prior period
Group Functions
Exploration and ProductionMining Energy
Base Chemicals
▼1 135t/cm/s 7% lower productivity
Performance Chemicals
▲R343/t15% higher normalised unit cost due to
lower volumes
Moz: ▲12% EBIT Stable operations
Gabon: ▼66% EBIT Lower oil price and lower volumes
from delayed drilling
▲ liquid fuels salesOffset by lower oil price and refining margins
▲6% volumesOffset by softer macro environment
▲21% volumes R0,8bnHedging and translation gainsOffset by further softening of chemicals
sales prices
Offset by ~R2,6bn finance charge due to LCCP-incurred debt
Oryx: 98% utilisationExtended planned shutdown in H2 FY20
R1,6bnLCCP losses
R1,2bnLCCP losses
16Copyright ©, 2020, Sasol
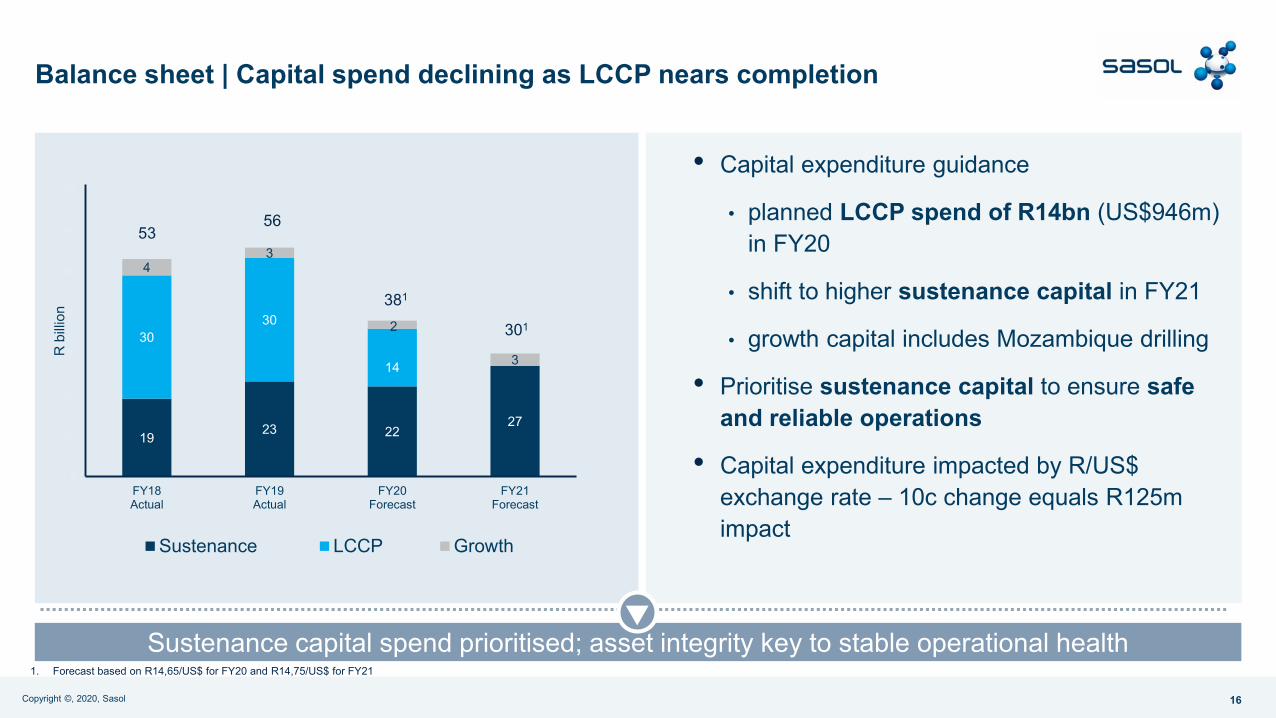
Balance sheet | Capital spend declining as LCCP nears completion
• Capital expenditure guidance
• planned LCCP spend of R14bn (US$946m) in FY20
• shift to higher sustenance capital in FY21
• growth capital includes Mozambique drilling
• Prioritise sustenance capital to ensure safe and reliable operations
• Capital expenditure impacted by R/US$ exchange rate – 10c change equals R125m impact
Sustenance capital spend prioritised; asset integrity key to stable operational health
19 23 2227
3030
14
43
2
3
0
10
20
30
40
50
60
70
FY18Actual
FY19Actual
FY20Forecast
FY21Forecast
R b
illion
Sustenance LCCP Growth
56
381
53
301
1. Forecast based on R14,65/US$ for FY20 and R14,75/US$ for FY21

17Copyright ©, 2020, Sasol
Balance sheet | Proactive management continues
SHORT-TERM FOCUSED ACTIONS MEDIUM- TO LONG-TERM BALANCE SHEET GOALS
• Enhance cash flow profile• Positive contribution from LCCP• Continued focus on management actions • Deliver portfolio optimisation to enhance shareholder
value
• Disciplined capital allocation• Safeguarding asset integrity• Re-phasing discretionary capital• FY20 interim dividend passed; dividend payout
will resume once balance sheet further de-risked
• Increase balance sheet flexibility• Protect investment grade rating• Manage balance sheet within covenant • Fit-for-purpose hedging programme key during
peak gearing
Strong balance sheet metrics
25 – 35% gearing< 1,5x Net debt: EBITDA
Maintaininvestment
grade rating
Target dividend cover> 2,2x
Grow value-based
portfolio

18Copyright ©, 2020, Sasol
Outlook | FY20
1. Per the Revolving Credit facility and US dollar Term Loan facility covenant definition2. Includes the impact of adopting IFRS 16
UPSTREAM
PERFORMANCE CHEMICALS
BASE CHEMICALS
ENERGY
LCCP
GROUP• Bank Net debt: EBITDA1 range 2,6 – 3,0 times; Gearing range 55 – 65%2
• Normalised cash fixed costs within 6% inflation target
• Normalised Mining unit cost of R330 – R350/t • Mozambique gas production 114 – 118bscf
• Liquid fuels sales 57 – 58mmbbls• ORYX GTL average utilisation of 55 – 60%
• Sales volumes 7 – 9% higher than FY19• Sales volumes (excluding LCCP) flat to slightly below FY19• Marketing plans in place for LCCP products
• Sales volumes 15 – 20% higher than FY19• Sales volumes (excluding US polymers products) 1 – 2% higher than FY19• Successful placement of merchant ethylene volumes during LDPE remediation
• ZAG units to achieve beneficial operation by end Q4 FY20; LDPE in H1 FY21• EBITDA of US$50m – 100m

19Copyright ©, 2020, Sasol
◉ REALISM, FOCUS AND DELIVERYFleetwood Grobler

20Copyright ©, 2020, Sasol
Realism, Focus and Delivery
Preserve asset integrity to deliver safe and reliable operations
LCCPBalance
sheetFoundation
businessFutureSasol
Delivery of integrated LCCP and ramp-up EBITDA to transform
the portfolio
Protect investment grade rating;
deleverage the balance sheet
Addressing short-term challenges to restore stability, becoming fit for the future
Build resilience for the future and embed key
culture shifts
21Copyright ©, 2020, Sasol
◉ QUESTIONS AND ANSWERS

22Copyright ©, 2020, Sasol
Abbreviations
AVE average
BC Base Chemicals
B-BBEE broad-based black economic empowerment
EBIT earnings before interest and tax
EBITDA earnings before interest, tax, depreciation and amortisation
EO/EG ethylene oxide/ethylene glycol
ETO ethoxylates
ESG environmental, social, governance
FCF free cash flow
FY financial year
GDP gross domestic product
GHG greenhouse gas emissions
H1 1st half
H2 2nd half
HEPS headline earnings per share
HDPE high density polyethylene
JV joint venture
LCCP Lake Charles Chemicals Project
LDPE low density polyethylene
LLDPE linear low density polyethylene
LWDCs lost work day cases
MEG mono-ethylene glycol
OBU operating business unit
PC PerformanceChemicals
PPA Petroleum Production Agreement
Q quarter
RCR Recordable Case Rate
ROIC return on invested capital
SBU strategic business unit
SIC Sasol Investment Company
SSO Secunda Synfuels Operations
ZAG Ziegler, Alumina and Guerbet