sat suite of assessments administration report - … web pages 16-17/general...statistical report...
TRANSCRIPT
Statistical Report
SAT Suite of Assessments Administration Report Page 1 of 43
SAT Suite of Assessments Administration Report
Maine SAT School Day Administration April 2017
2017

Statistical Report
SAT Suite of Assessments Administration Report Page 2 of 43
Executive Summary This report summarizes the performance of 12,069 11th grade students who took the April 2017 SAT School Day administration. There were two forms administered in Maine (Form A had 12,069 test takers; Form B had 833 test takers). At its core, this report seeks to provide an analysis of the quality of test forms administered in the state of Maine for the forms with at least 1,000 test takers. This report is a summary for master Form A. Subgroup results are only reported for forms for which the subgroup sample size was 200 or more. Psychometric and statistical summaries related to the moments, intercorrelations, reliability and standard error of measurement, item completion rates, form speededness, and classification accuracy and consistency are also included.
Quality of form: All of the test takers included in this sample were 11th graders. About 75% of the sample spoke English or English and another language as their first language. About 51% of the sample was male and 49% female. The average Evidence-Based Reading and Writing (ERW) score was 507 with a standard deviation of 100. The average Math Section score (MSS) was 494 with a standard deviation of 101. The average Total score was 1000 with a standard deviation of 190. The correlation between ERW and MSS for Form A was 0.78. The true score correlation between ERW and MSS was 0.85 for Form A. The scale score reliability of ERW was 0.93 with an average conditional standard error of measurement of 26 for Form A. The scale score reliability of the MSS was 0.90 with an average conditional standard error of measurement of 32 for Form A. The scale score reliability of the Total score was 0.95 with an average conditional standard error of measurement of 41 for Form A. Over 97% of the sample completed at least 75% of the Reading, Writing and Language, Math – No Calculator, and Math – Calculator timed sections of the exam.
One of the items classified as C+ or C- by differential item functioning analysis.
The percentage of test takers who met Level 3 and Level 4 for ERW was about 59%. The percentage of test takers who met Level 3 and 4 for MSS nearly 36%. The probability of correct classification for the total group was between 0.81 for ERW and 0.79 for MSS. The proportion of consistent decisions for the total group was 0.74 for ERW and 0.70 for MSS.
Statistical Report
SAT Suite of Assessments Administration Report Page 3 of 43
Table of Contents SAT Suite of Assessments ................................................................................................................................................. 5
Characteristics of the April 2017 Maine School Day Administration of the SAT ............................................................... 6
Test Forms and Demographic Information ..................................................................................................................... 6 Description of the sample ................................................................................................................................................ 6
Description of the Test Analyses ........................................................................................................................................ 7
Moments and Score Distributions ................................................................................................................................... 7 Intercorrelations ............................................................................................................................................................... 7 Reliability and Standard Error of Measurement .............................................................................................................. 7 Scale Score Reliability Indices ........................................................................................................................................ 7 Item Completion Rates and Form Speededness ............................................................................................................ 8 Differential item functioning ............................................................................................................................................. 8 Standardized differences between groups ..................................................................................................................... 9 Classification Levels ........................................................................................................................................................ 9
Tables................................................................................................................................................................................ 10
Table 1. Score Scales and Number of Items Contributing to Each Score ................................................................... 10 Table 2. Number and Type of Items per Timed Section ............................................................................................... 11 Table 3. Frequency and Percentage of Test Takers in Item Analysis Sample by Grade Level, First Language, and Gender ......................................................................................................................................... 12 Table 4. Frequency and Percentage of Racial/Ethnic Subgroups in Item Analysis Sample ....................................... 13 Table 5.a : Scale Score Moments, Intercorrelations and Reliability for Form A .......................................................... 14 Table 6: Item Level Completion Rates for SAT Form A ............................................................................................... 22 Table 7a. Section Completion Rates by Timed Section for SAT .................................................................................. 23 Table 7b. Section Completion Rates by Gender for SAT ............................................................................................. 24 Table 7c. Section Completion Rates by Race/Ethnicity for SAT .................................................................................. 25 Table 8.a.1: DIF Summary for SAT Form A .................................................................................................................. 26 Table 9a: Scale Score Mean, Standard Deviation, and Standardized Difference between Gender Groups .............. 27 Table 9b: Scale Score Mean, Standard Deviation, and Standardized Difference between Racial/Ethnic Groups for SAT Form A ................................................................................................................................................................... 28 Table 10. Percentage of Test Takers in Each Classification Level for SAT by Subgroup ........................................... 30 Table 11. Classification Accuracy for SAT Form A ....................................................................................................... 31 Table 12. Classification Consistency for SAT Form A .................................................................................................. 32
About the College Board ..................................................................................................................................................... 34
Appendix A: Target Specifications for the SAT Suite of Assessments ............................................................................ 35
Table A1. Target Number of Items per Difficulty Classification by Reading and Writing and Language Test Scores and Subscores ............................................................................................................................................................... 35 Table A2. Target Number of Items per Difficulty Classification by Math Test Score, Cross-Test Scores, and Subscores ...................................................................................................................................................................... 36 Table A3. Target Average Item Difficulty Estimates and Standard Deviations ............................................................ 37 Table A4. Target Average Item Discrimination Bounds................................................................................................ 38 Table A5. Target Reliability Bounds .............................................................................................................................. 39
Appendix B: Test Analysis Formulas ................................................................................................................................ 40
B1. Pearson product moment correlation coefficient .................................................................................................... 40 B2. Disattenuated correlations/True score correlations................................................................................................ 40 B3. Scale-score CSEM and reliability estimates........................................................................................................... 40 B4. Mantel-Haenszel D-DIF Statistic ............................................................................................................................ 41 B5. Standardized mean difference ............................................................................................................................... 41 B6. False positive rate ................................................................................................................................................... 41 B7. False negative rate ................................................................................................................................................. 42 B8. Probability of correct classification ......................................................................................................................... 42

Statistical Report
SAT Suite of Assessments Administration Report Page 4 of 43
B9. Effective Test Length .............................................................................................................................................. 42 B10. Proportion of consistent decisions ........................................................................................................................ 42 B11. Proportion of consistent decisions by chance ...................................................................................................... 43 B12. Kappa statistic ....................................................................................................................................................... 43 B13. Probability of misclassification .............................................................................................................................. 43

Statistical Report
SAT Suite of Assessments Administration Report Page 5 of 43
SAT Suite of Assessments
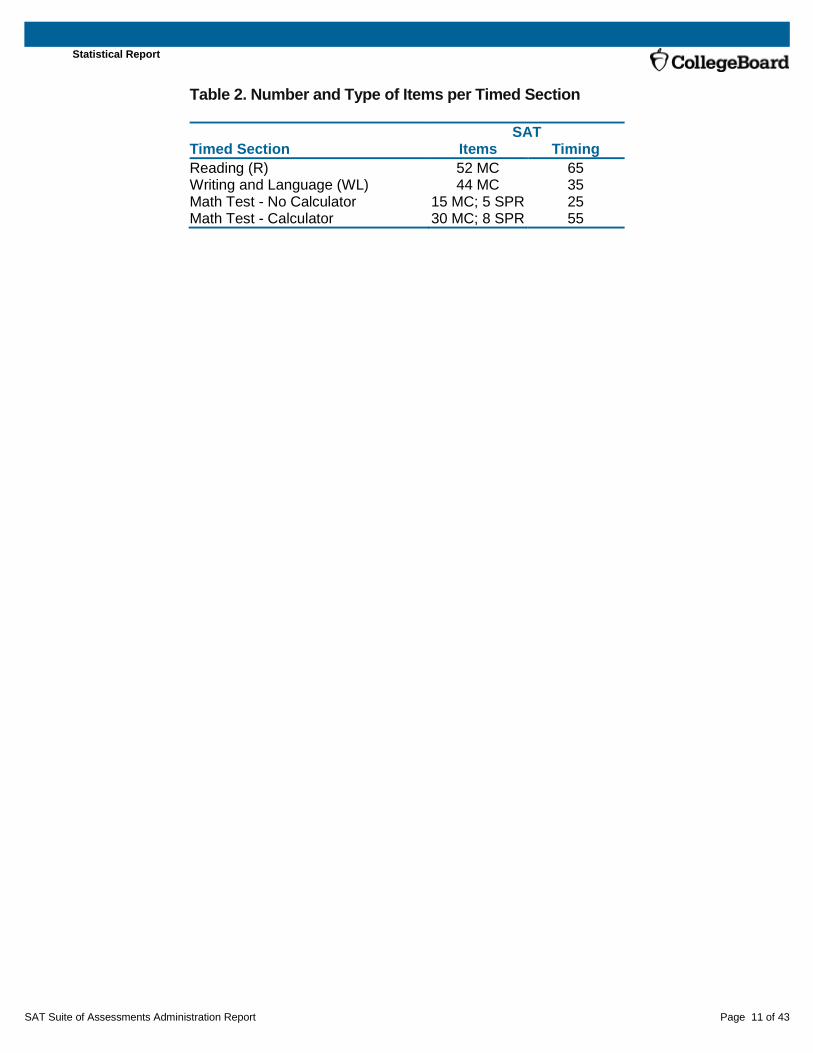
The SAT Suite of Assessments (SAT, PSAT/NMSQT®, PSAT™ 10, and PSAT™ 8/9) is designed to measure student readiness for college and postsecondary education. Each assessment comprises two sections (the Evidence-Based Reading and Writing [ERW] section and the Math [MSS] section), three tests (the Reading Test, the Writing and Language Test, and the Math Test), two cross-tests (Analysis in History/Social Studies and Analysis in Science) and seven subscores (Command of Evidence, Words in Context, Expression of Ideas, Standard English Conventions, Heart of Algebra, Problem Solving and Data Analysis, and Passport to Advanced Math). For the SAT, test takers are given three hours to complete 154 items. Test takers who choose to also take the optional Essay are given an additional 50 minutes. This report contains summary information about the score tiers, specifically, the total, section, test, and cross-test scores, and subscores from the April 2017 school day administration of the SAT in Maine. Raw scores were generated from the number of items the student answered correctly within the score tier. Scale scores were generated by applying the appropriate raw-to-scale score conversions. Table 1 describes the number of items and score scale ranges for the SAT. The Reading Test and Writing and Language Test are administered in separately-timed sections and only contain multiple-choice (MC) items. The Math Test is administered over two separately-timed sections, Math – No Calculator and Math – Calculator. In addition, the Math Test includes two types of items in each timed section, multiple-choice items and student-produced response (SPR) items. See Table 2 for the number and type of items per timed section for the included forms. The content specifications for the SAT provide additional details for each test within the SAT and can be found at https://collegereadiness.collegeboard.org/pdf/test-specifications-redesigned-sat-1.pdf. The content specifications are deeply informed by evidence about essential requirements for college and career readiness and success. In constructing each test form of the SAT, the content specifications are of primary importance. As such, the main SAT form in the Maine April 2017 school day administration meets 100% of the target content specifications. The same form was also administered to a national equating sample. The detailed description of the national equating sample is in Chapter 6 of the SAT Suite of Assessments Technical Manual (College Board, 2016). The target statistical specifications for the SAT Suite are in Appendix A. The target values for item difficulty, item discrimination and score reliability are summarized in Tables A1 to A4 in Appendix A. For evaluation of test form performance, the item difficulty, item discrimination and reliability estimates for the Connecticut main SAT form are based on the performance of the national equating sample. For the national equating sample, 100% of test scores, cross-test scores, and subscores are within one standard deviation of the target average item difficulty estimates. For the national equating sample, all scores exceed the average item discrimination bounds.
Statistical Report
SAT Suite of Assessments Administration Report Page 6 of 43
Characteristics of the April 2017 Maine School Day Administration of the SAT
Test Forms and Demographic Information
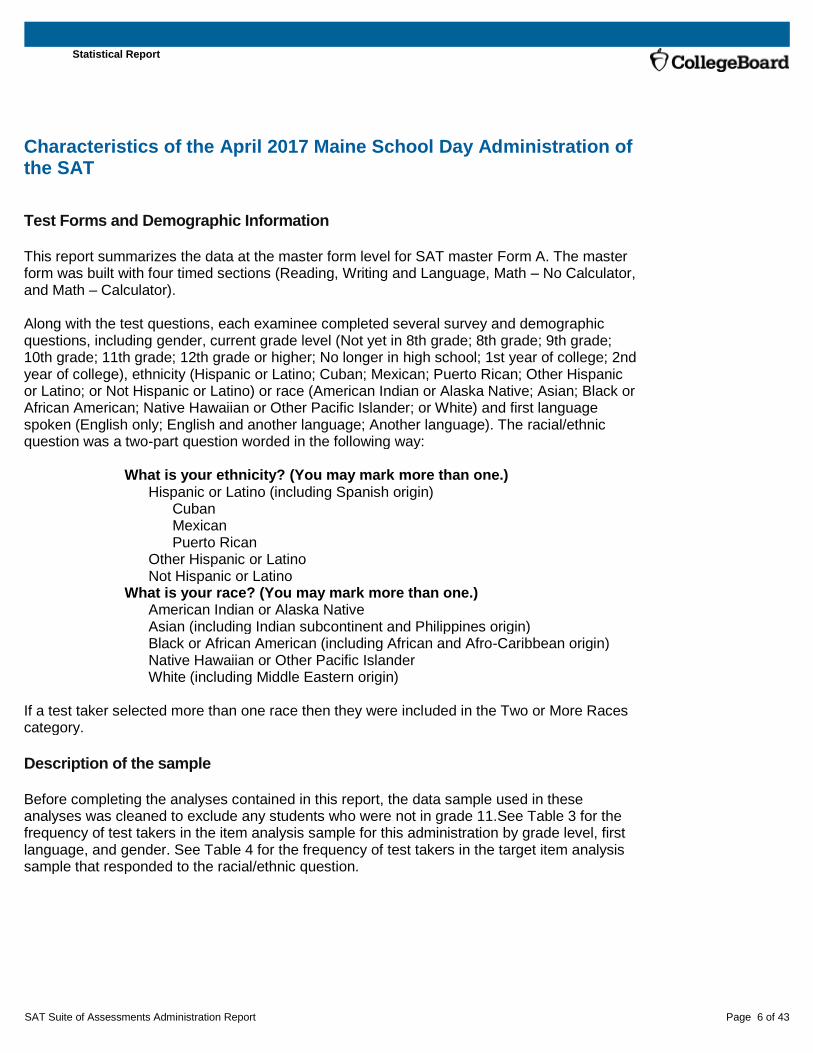
This report summarizes the data at the master form level for SAT master Form A. The master form was built with four timed sections (Reading, Writing and Language, Math – No Calculator, and Math – Calculator). Along with the test questions, each examinee completed several survey and demographic questions, including gender, current grade level (Not yet in 8th grade; 8th grade; 9th grade; 10th grade; 11th grade; 12th grade or higher; No longer in high school; 1st year of college; 2nd year of college), ethnicity (Hispanic or Latino; Cuban; Mexican; Puerto Rican; Other Hispanic or Latino; or Not Hispanic or Latino) or race (American Indian or Alaska Native; Asian; Black or African American; Native Hawaiian or Other Pacific Islander; or White) and first language spoken (English only; English and another language; Another language). The racial/ethnic question was a two-part question worded in the following way:
What is your ethnicity? (You may mark more than one.) Hispanic or Latino (including Spanish origin)
Cuban Mexican Puerto Rican
Other Hispanic or Latino Not Hispanic or Latino
What is your race? (You may mark more than one.) American Indian or Alaska Native Asian (including Indian subcontinent and Philippines origin) Black or African American (including African and Afro-Caribbean origin) Native Hawaiian or Other Pacific Islander White (including Middle Eastern origin)
If a test taker selected more than one race then they were included in the Two or More Races category.
Description of the sample
Before completing the analyses contained in this report, the data sample used in these analyses was cleaned to exclude any students who were not in grade 11.See Table 3 for the frequency of test takers in the item analysis sample for this administration by grade level, first language, and gender. See Table 4 for the frequency of test takers in the target item analysis sample that responded to the racial/ethnic question.

Statistical Report
SAT Suite of Assessments Administration Report Page 7 of 43
Description of the Test Analyses
Moments and Score Distributions
Test taker performance is described using the first four moments for all score tiers. The mean, standard deviation, skewness, and kurtosis provide a description of the distribution of scores.
Intercorrelations
The Pearson product moment correlation coefficient provides an evaluation of the pairwise linear relationship between the total, section, test, cross-test scores, and the subscores. The disattenuated, or true score, correlations are the correlations after correcting for attenuation between the two scores. The formulas for calculating the Pearson correlations and disattenuated, or true score, correlations are in Appendixes B1 and B2.
Reliability and Standard Error of Measurement
Reliability is a measure of consistency in test takers’ observed scores. Test takers’ observed scores may vary for many reasons. This variance can occur, for example, if the test is administered at two different points in time, across different forms of a test, or due to changes in test administration or scoring conditions. There are many different methods to estimate reliability coefficients, such as those based on Generalizability Theory, Classical Test Theory, and Structural Equation Modeling. For the SAT Suite, the compound binomial model is used to calculate reliability for scale scores (See Appendix B3). Reliability estimates range from 0-1, with values near 1 indicating more consistency and values near 0 indicating little to no consistency. Standard error of measurement (SEM) can be considered a measure of inconsistency in test takers’ observed scores. A SEM estimate measures the dispersion of measurement errors over repeated measures of a person on the same instrument. Standard error of measurement estimates are inversely related to reliability estimates. A SEM value is an average across all observed scores while a conditional standard error of measurement (CSEM) is the estimated SEM for a particular (conditioned on) observed score.
Scale Score Reliability Indices
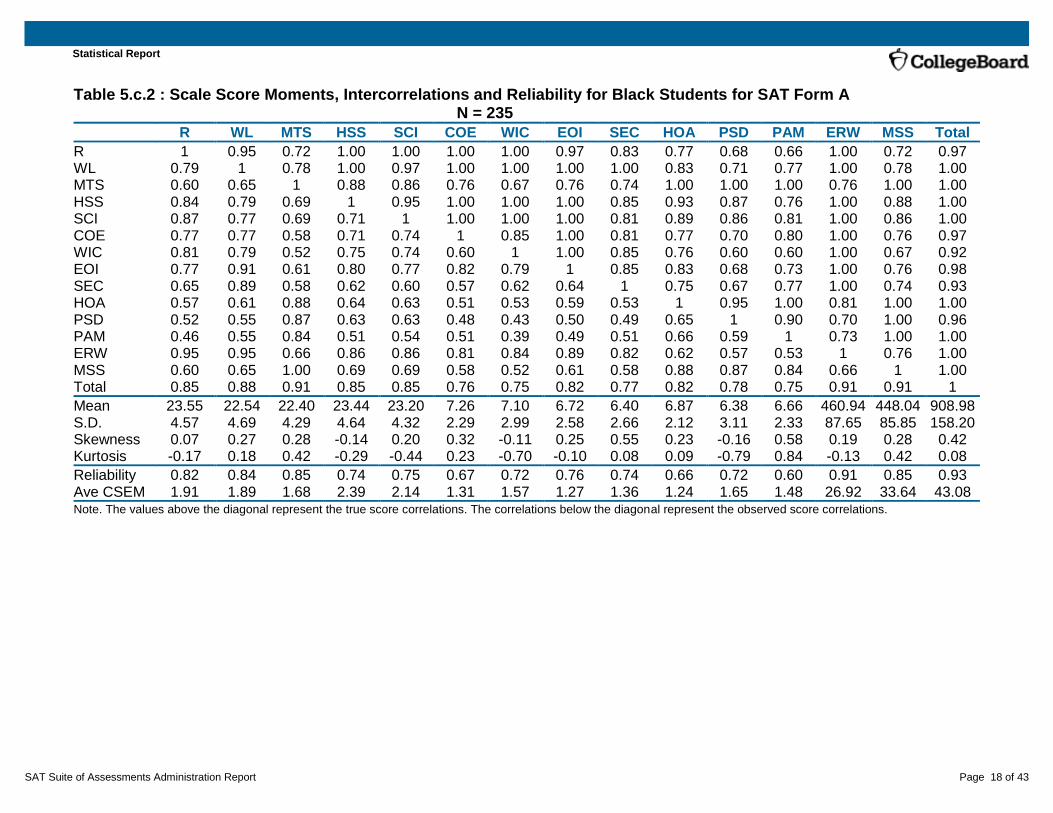
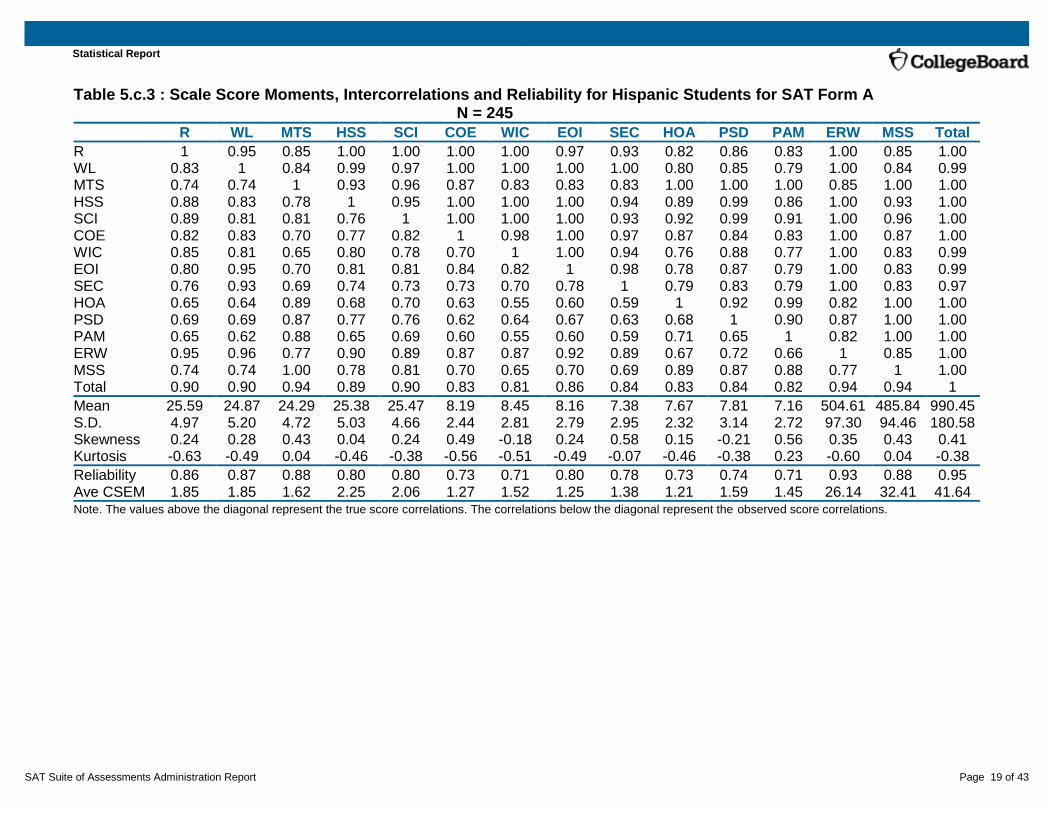
Scale score reliability estimates were derived from averaging the CSEM values obtained from the Maine 2017 school day administration See Section 6.1 of the SAT Suite of Assessments Technical Manual for more details on the scale score reliability estimates. The formulas for calculating the scale score reliability and average CSEM estimates are in Appendix B3 of this document. See Table 5a for scale score observed and true score correlations, moments, reliability, and average CSEM values for the total group for this administration. See Tables 5b1-5c5 for the same information for gender and racial/ethnic subgroups. In the correlation tables, the values above the diagonal represent the true score correlations. The correlations below the diagonal represent the observed score correlations. Subgroup results are only reported for forms for which the subgroup sample size was 200 or more.

Statistical Report
SAT Suite of Assessments Administration Report Page 8 of 43
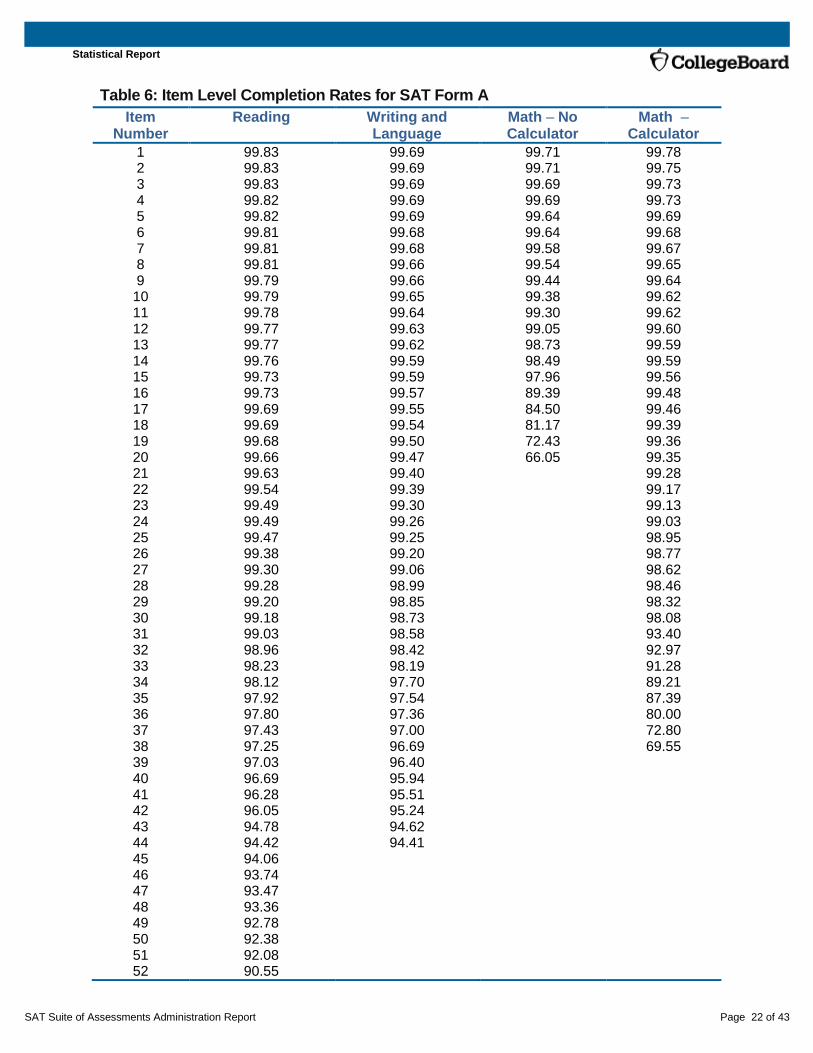
Item Completion Rates and Form Speededness
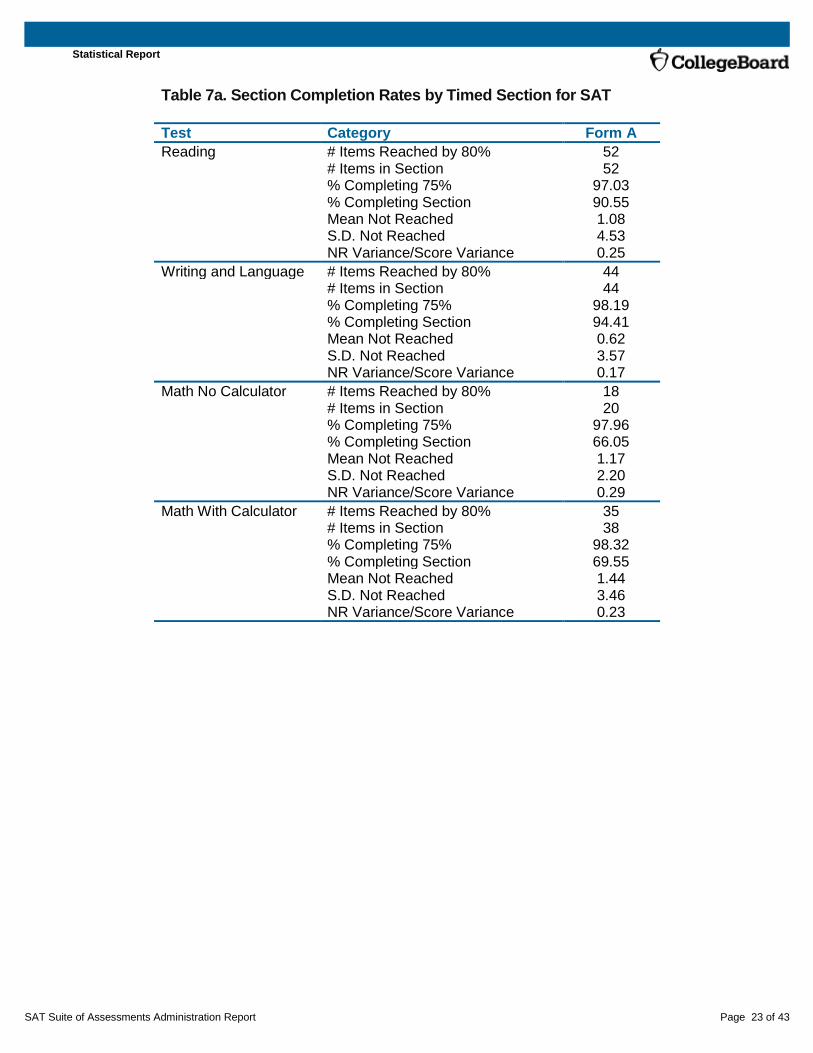
Item completion rates reflect the percentage of test takers reaching an item within each timed section. A reached item is one that has at least one subsequent item within a timed section with a response. Conversely, a not reached item is one that has no subsequent items within a timed section with a response. Test form speededness is evaluated by examining the following:
The number of items reached by at least 80% of the test takers,
The percentage of test takers completing at least 75% of each timed section,
The mean and standard deviation of the number of items not reached, and
The ratio of the variance of the number of not reached items to the variance of the scores.
Seventy-five percent of a timed section is determined by the ceiling of 75% of the section length. For example, if a section has 47 items, the statistic is calculated as the percentage of test takers completing 36 or more items in the section. The degree of speededness of a test is negligible when 80% of the students reach the last item and all students reach at least 75% of the questions (van der Linden, 2011). Additionally, as a rule of thumb, a variance index less than .15 may be taken to indicate an unspeeded test, while an index greater than .25 usually means that the test is clearly speeded. Variance index values between .15 and .25 generally indicate a moderately speeded test (ETS, 2013). However, judgments of appropriateness of timing should be made using all relevant data. See Table 6 and Tables 7a – 7c for the speededness statistics for this administration.
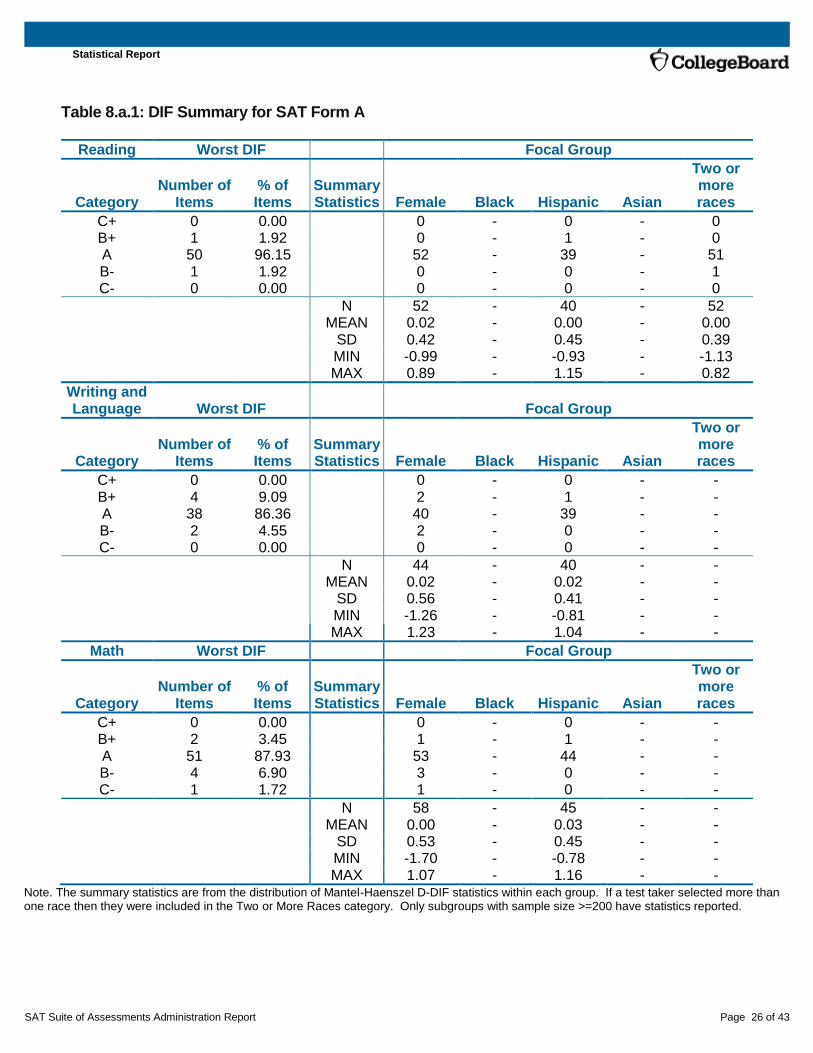
Differential item functioning
Differential item functioning (DIF) is a statistical method that examines the performance of subgroups for possible statistical bias. Based on the formulas from Dorans and Holland (1993), found in Appendix B4, the Mantel-Haenszel D-DIF (MH D-DIF) statistic is calculated. MH D-DIF values that are not statistically different from zero are classified as A items. Items with a p-value that exceeds 1.96 in absolute value and are significantly larger than 1.5 or less than -1.5 are classified as C items. The remaining values are classified as B items. For analysis of DIF for gender, the performance of males is compared to the performance of females, with males serving as the reference group. For analysis of DIF for racial/ethnic group, the performance of White test takers as the reference group is compared to other racial/ethnic groups. Ethnicity is defined as Hispanic or non-Hispanic and race is defined as American Indian or Alaska Native (AIAN); Asian, Black or African American, Two or More Races; and White. All non-Hispanic respondents are identified as one of the previously listed racial categories with Native Hawaiian or Other Pacific Islander classified as Asian. If a test taker selected more than one race then they were included in the Two or More Races category. The final DIF category for the item was determined by the worst DIF category compared across all gender and racial/ethnic DIF categories. DIF analysis for an item is only completed for focal groups with sample sizes of at least 100. In this report, subgroups results are only reported if the sample sizes for the item are 200 or more. See Tables 8a.1 for the summary of DIF values for Form A.

Statistical Report
SAT Suite of Assessments Administration Report Page 9 of 43
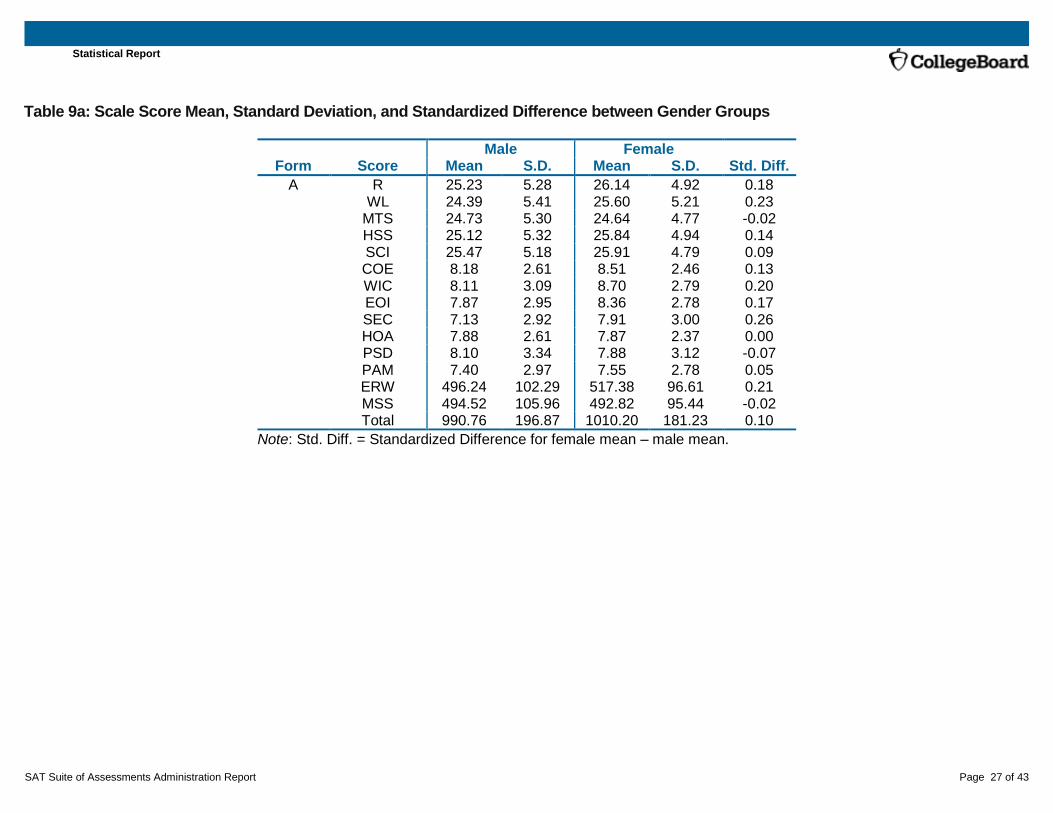
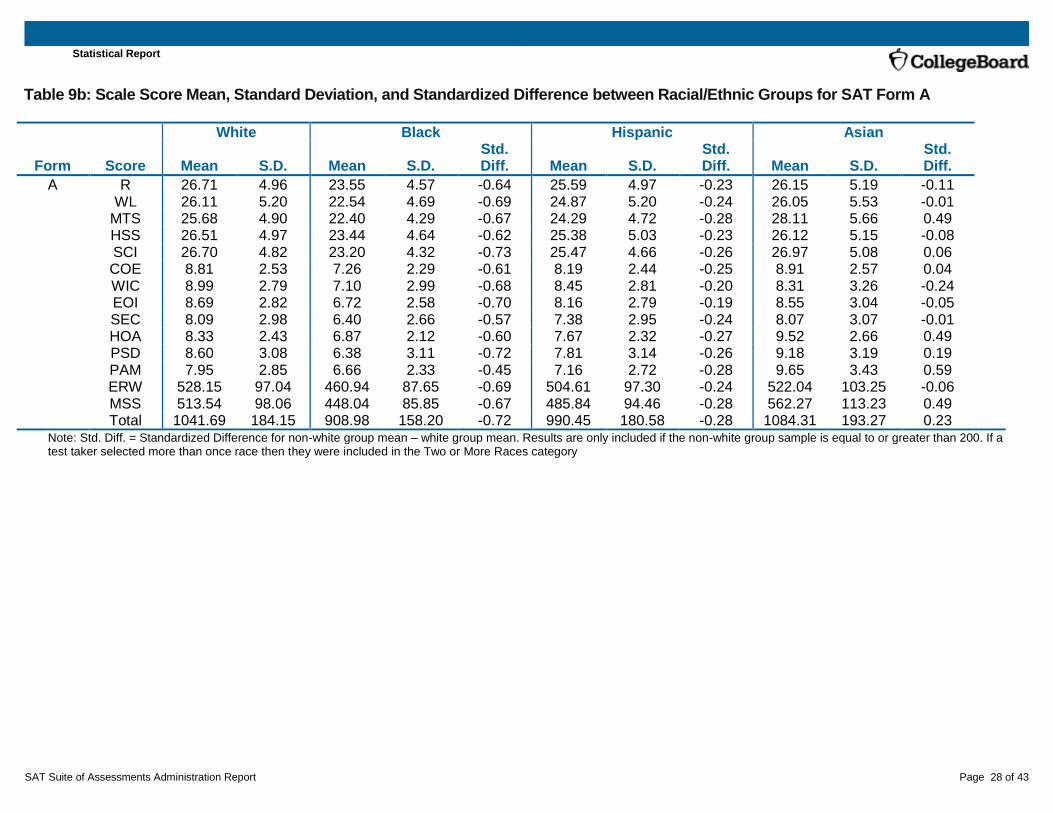
Standardized differences between groups
The test taker performance for each subgroup is described using the mean and standard deviation for all score tiers and the standardized mean differences between the focal and reference groups. See Appendix B5 for the formula for the standardized mean difference. Cohen (1988) suggests standardized mean differences equal to 0.20 are small, 0.50 are medium, and 0.80 are large. See Tables 9a – 9b for scale score subgroup moments and differences.
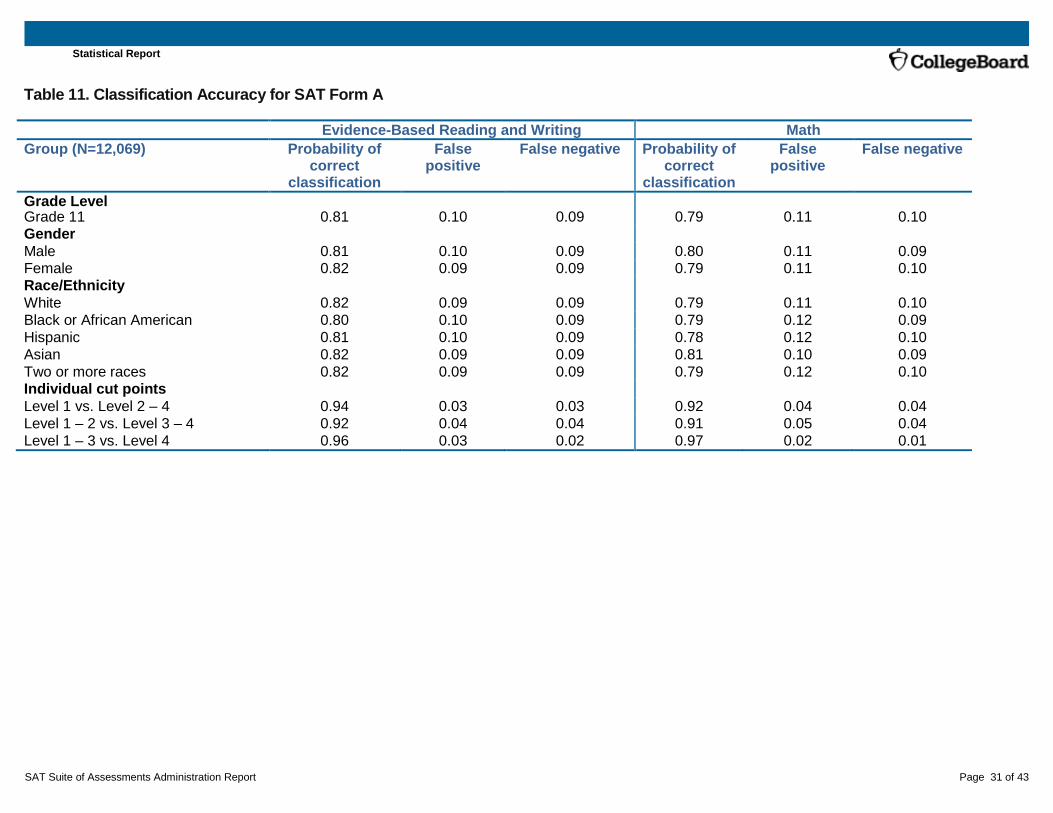
Classification Levels
Classification levels are based on ERW and MSS cut scores that were determined by state leadership based on recommendations from panelists’ during a multi-state standard setting held in June 2016. The cut scores from the standard setting suggest students can be classified into four performance levels with level one being the lowest and level four being the highest. Students with an ERW score of at least 480 are considered proficient. Test takers with a Math Section score of at least 530 are considered proficient.
Upon the establishment of classification levels, one may also examine classification statistics (e.g., classification accuracy and classification consistency). Classification accuracy is the agreement between classifications based on the estimated true scores and observed scores. Classification consistency is the agreement between the classification of expected scores and actual observed scores. The classification accuracy and classification consistency statistics are from the BB-CLASS software (Brennan, 2004). The classification statistics are based on the Livingston & Lewis (1995) method which uses a four-parameter beta-binomial model with effective test length. This method is particularly useful for calculating classification accuracy of composite scores, like ERW. See Appendixes B6 – B13 for the formulas related to classification accuracy and classification consistency. See Table 10 for the percentage of test takers in each performance category for the various subgroups. See Tables 11 and 12 for classification accuracy and classification consistency statistics for the subgroups.

Statistical Report
SAT Suite of Assessments Administration Report Page 10 of 43
Tables
Table 1. Score Scales and Number of Items Contributing to Each Score
SAT Scores Items Scale
Test Scores Reading (R) 52 10-40 Writing and Language (WL) 44 10-40 Math (MTS) 58 10-40
No Calculator 20 Calculator 38
Cross-Test Scores Analysis in History/Social Studies (HSS) 35 10-40 Analysis in Science (SCI) 35 10-40
Subscores Command of Evidence (COE) 18 1-15 Words in Context (WIC) 18 1-15 Expression of Ideas (EOI) 24 1-15 Standard English Conventions (SEC) 20 1-15 Heart of Algebra (HOA) 19 1-15 Problem Solving and Data Analysis (PSD) 17 1-15 Passport to Advanced Mathematics (PAM)
16 1-15
Section Scores Evidence-Based Reading and Writing (ERW)
96 200-800
Math (MSS) 58 200-800 Total 154 400-1600
Statistical Report
SAT Suite of Assessments Administration Report Page 11 of 43
Table 2. Number and Type of Items per Timed Section
SAT Timed Section Items Timing
Reading (R) 52 MC 65 Writing and Language (WL) 44 MC 35 Math Test - No Calculator 15 MC; 5 SPR 25 Math Test - Calculator 30 MC; 8 SPR 55

Statistical Report
SAT Suite of Assessments Administration Report Page 12 of 43
Table 3. Frequency and Percentage of Test
Takers in Item Analysis Sample by Grade
Level, First Language, and Gender
Form A n %
Grade Level 11th graders 12,069 100.0
First Language English 8,503 70.45 English and another language
512 4.24
Another language 305 2.53 No response 2,725 22.58 Missing 24 0.20
Gender Male 6,162 51.06 Female 5,907 48.94

Statistical Report
SAT Suite of Assessments Administration Report Page 13 of 43
Table 4. Frequency and Percentage of Racial/Ethnic
Subgroups in Item Analysis Sample
Form A Subgroup n %
White 7,572 62.74 Black or African American 235 1.95 Hispanic 245 2.03 Asian 211 1.75 Native Hawaiian or other Pacific Islander 4 0.03 American Indian/Alaska Native 132 1.09 Two or more races 307 2.54 Other/Missing 3,363 27.86 Note: If a test taker selected more than one race then they were included in
the Two or more races category.

Statistical Report
SAT Suite of Assessments Administration Report Page 14 of 43
Table 5.a : Scale Score Moments, Intercorrelations and Reliability for Form A
N = 12,069
R WL MTS HSS SCI COE WIC EOI SEC HOA PSD PAM ERW MSS Total
R 1 0.94 0.84 1.00 1.00 1.00 1.00 0.96 0.91 0.82 0.86 0.78 1.00 0.84 0.99 WL 0.83 1 0.84 0.99 0.97 1.00 1.00 1.00 1.00 0.82 0.85 0.79 1.00 0.84 0.98 MTS 0.74 0.75 1 0.93 0.92 0.87 0.81 0.84 0.81 1.00 1.00 1.00 0.85 1.00 1.00 HSS 0.90 0.83 0.79 1 0.97 1.00 1.00 1.00 0.92 0.92 0.96 0.84 1.00 0.93 1.00 SCI 0.91 0.83 0.80 0.80 1 1.00 1.00 1.00 0.91 0.91 0.97 0.84 1.00 0.92 1.00 COE 0.85 0.83 0.72 0.82 0.83 1 0.94 1.00 0.94 0.86 0.88 0.82 1.00 0.87 1.00 WIC 0.83 0.83 0.67 0.79 0.80 0.70 1 1.00 0.94 0.80 0.85 0.75 1.00 0.81 0.97 EOI 0.81 0.95 0.72 0.83 0.82 0.84 0.83 1 0.97 0.83 0.86 0.79 1.00 0.84 0.99
SEC 0.75 0.93 0.68 0.74 0.73 0.72 0.72 0.78 1 0.79 0.81 0.77 1.00 0.81 0.96 HOA 0.67 0.68 0.92 0.73 0.72 0.65 0.60 0.66 0.62 1 0.96 0.97 0.84 1.00 1.00 PSD 0.70 0.70 0.88 0.76 0.77 0.67 0.64 0.68 0.63 0.73 1 0.87 0.87 1.00 1.00 PAM 0.63 0.64 0.88 0.66 0.66 0.62 0.56 0.62 0.59 0.74 0.66 1 0.79 1.00 0.97 ERW 0.95 0.96 0.78 0.90 0.91 0.88 0.87 0.92 0.88 0.71 0.73 0.67 1 0.85 1.00 MSS 0.74 0.75 1.00 0.79 0.80 0.72 0.67 0.72 0.68 0.92 0.88 0.88 0.78 1 1.00 Total 0.90 0.90 0.94 0.90 0.91 0.85 0.81 0.87 0.83 0.86 0.85 0.82 0.94 0.94 1
Mean 25.68 24.98 24.68 25.47 25.69 8.34 8.40 8.11 7.51 7.87 7.99 7.47 506.59 493.69 1000.27 S.D. 5.13 5.34 5.05 5.15 5.00 2.54 2.96 2.88 2.99 2.50 3.24 2.88 100.10 100.95 189.62 Skewness 0.10 0.14 0.28 -0.05 0.06 0.28 -0.28 0.17 0.37 0.14 -0.27 0.33 0.17 0.28 0.24 Kurtosis -0.35 -0.39 -0.02 -0.29 -0.25 -0.37 -0.33 -0.44 -0.37 -0.14 -0.38 -0.16 -0.42 -0.02 -0.27
Reliability 0.87 0.88 0.90 0.81 0.83 0.75 0.74 0.81 0.79 0.77 0.77 0.75 0.93 0.90 0.95 Ave CSEM
1.84 1.83 1.60 2.24 2.05 1.28 1.50 1.24 1.38 1.21 1.57 1.43 25.93 31.96 41.16
Note. The values above the diagonal represent the true score correlations. The correlations below the diagonal represent the observed score correlations.

Statistical Report
SAT Suite of Assessments Administration Report Page 15 of 43
Table 5.b.1 : Scale Score Moments, Intercorrelations and Reliability for Male Students for SAT Form A N = 6,162
R WL MTS HSS SCI COE WIC EOI SEC HOA PSD PAM ERW MSS Total
R 1 0.94 0.85 1.00 1.00 1.00 1.00 0.96 0.91 0.83 0.87 0.78 1.00 0.85 0.99 WL 0.83 1 0.84 0.98 0.97 1.00 1.00 1.00 1.00 0.82 0.85 0.79 1.00 0.84 0.98 MTS 0.76 0.75 1 0.93 0.93 0.87 0.82 0.85 0.81 1.00 1.00 1.00 0.85 1.00 1.00 HSS 0.90 0.84 0.80 1 0.98 1.00 1.00 1.00 0.92 0.92 0.97 0.84 1.00 0.93 1.00 SCI 0.91 0.84 0.81 0.81 1 1.00 1.00 1.00 0.91 0.91 0.97 0.84 1.00 0.93 1.00 COE 0.86 0.84 0.72 0.82 0.84 1 0.94 1.00 0.94 0.86 0.88 0.82 1.00 0.87 1.00 WIC 0.84 0.83 0.68 0.80 0.81 0.71 1 1.00 0.94 0.80 0.86 0.76 1.00 0.82 0.96 EOI 0.81 0.95 0.73 0.83 0.83 0.85 0.84 1 0.97 0.83 0.86 0.79 1.00 0.85 0.98 SEC 0.75 0.93 0.68 0.74 0.74 0.72 0.72 0.77 1 0.80 0.81 0.77 1.00 0.81 0.95 HOA 0.69 0.69 0.93 0.74 0.74 0.66 0.62 0.67 0.62 1 0.96 0.98 0.84 1.00 1.00 PSD 0.72 0.71 0.89 0.78 0.79 0.68 0.66 0.69 0.64 0.76 1 0.87 0.87 1.00 1.00 PAM 0.64 0.65 0.88 0.67 0.67 0.62 0.58 0.63 0.60 0.76 0.67 1 0.80 1.00 0.96 ERW 0.96 0.96 0.79 0.91 0.91 0.89 0.87 0.92 0.88 0.72 0.75 0.67 1 0.85 1.00 MSS 0.76 0.75 1.00 0.80 0.81 0.72 0.68 0.73 0.68 0.93 0.89 0.88 0.79 1 1.00 Total 0.90 0.90 0.95 0.90 0.91 0.85 0.82 0.87 0.82 0.87 0.87 0.82 0.94 0.95 1
Mean 25.23 24.39 24.73 25.12 25.47 8.18 8.11 7.87 7.13 7.88 8.10 7.40 496.24 494.52 990.76 S.D. 5.28 5.41 5.30 5.32 5.18 2.61 3.09 2.95 2.92 2.61 3.34 2.97 102.29 105.96 196.87 Skewness 0.15 0.24 0.30 0.00 0.09 0.32 -0.19 0.25 0.46 0.17 -0.30 0.42 0.26 0.30 0.30 Kurtosis -0.41 -0.34 -0.11 -0.38 -0.34 -0.40 -0.50 -0.47 -0.17 -0.24 -0.43 -0.16 -0.42 -0.11 -0.30
Reliability 0.88 0.88 0.91 0.82 0.84 0.76 0.76 0.82 0.78 0.78 0.79 0.77 0.93 0.91 0.96 Ave CSEM 1.86 1.86 1.60 2.27 2.06 1.28 1.52 1.26 1.37 1.21 1.54 1.44 26.25 32.03 41.42 Note. The values above the diagonal represent the true score correlations. The correlations below the diagonal represent the observed score correlations.

Statistical Report
SAT Suite of Assessments Administration Report Page 16 of 43
Table 5.b.2 : Scale Score Moments, Intercorrelations and Reliability for Female Students for SAT Form A N = 5,907
R WL MTS HSS SCI COE WIC EOI SEC HOA PSD PAM ERW MSS Total
R 1 0.94 0.84 1.00 1.00 1.00 1.00 0.95 0.91 0.82 0.86 0.78 1.00 0.84 0.99 WL 0.82 1 0.85 0.99 0.97 1.00 1.00 1.00 1.00 0.84 0.87 0.79 1.00 0.85 0.99 MTS 0.74 0.75 1 0.93 0.92 0.89 0.82 0.85 0.83 1.00 1.00 1.00 0.86 1.00 1.00 HSS 0.89 0.83 0.79 1 0.97 1.00 1.00 1.00 0.93 0.93 0.97 0.84 1.00 0.93 1.00 SCI 0.90 0.83 0.79 0.79 1 1.00 1.00 1.00 0.92 0.89 0.97 0.83 1.00 0.92 1.00 COE 0.85 0.82 0.71 0.81 0.83 1 0.95 1.00 0.94 0.87 0.90 0.82 1.00 0.89 1.00 WIC 0.82 0.82 0.66 0.78 0.79 0.69 1 1.00 0.95 0.80 0.86 0.74 1.00 0.82 0.97 EOI 0.80 0.94 0.72 0.82 0.81 0.83 0.82 1 0.97 0.84 0.88 0.78 1.00 0.85 0.99 SEC 0.75 0.93 0.70 0.74 0.74 0.72 0.72 0.78 1 0.81 0.85 0.78 1.00 0.83 0.97 HOA 0.66 0.68 0.91 0.72 0.70 0.64 0.59 0.65 0.62 1 0.95 0.97 0.84 1.00 1.00 PSD 0.69 0.71 0.87 0.75 0.76 0.66 0.63 0.68 0.65 0.71 1 0.88 0.88 1.00 1.00 PAM 0.62 0.63 0.87 0.65 0.64 0.60 0.54 0.60 0.59 0.72 0.65 1 0.80 1.00 0.97 ERW 0.95 0.96 0.78 0.90 0.91 0.88 0.86 0.91 0.88 0.70 0.73 0.66 1 0.86 1.00 MSS 0.74 0.75 1.00 0.79 0.79 0.71 0.66 0.72 0.70 0.91 0.87 0.87 0.78 1 1.00 Total 0.90 0.91 0.94 0.90 0.90 0.84 0.81 0.87 0.84 0.85 0.85 0.81 0.94 0.94 1
Mean 26.14 25.60 24.64 25.84 25.91 8.51 8.70 8.36 7.91 7.87 7.88 7.55 517.38 492.82 1010.20 S.D. 4.92 5.21 4.77 4.94 4.79 2.46 2.79 2.78 3.00 2.37 3.12 2.78 96.61 95.44 181.23 Skewness 0.07 0.06 0.24 -0.07 0.04 0.27 -0.33 0.10 0.28 0.09 -0.25 0.22 0.12 0.24 0.20 Kurtosis -0.28 -0.39 0.04 -0.18 -0.15 -0.32 -0.13 -0.37 -0.51 -0.05 -0.32 -0.16 -0.36 0.04 -0.24
Reliability 0.86 0.88 0.89 0.80 0.82 0.73 0.72 0.81 0.79 0.74 0.74 0.74 0.93 0.89 0.95 Ave CSEM 1.82 1.79 1.59 2.20 2.03 1.27 1.47 1.22 1.38 1.20 1.59 1.43 25.54 31.85 40.82 Note. The values above the diagonal represent the true score correlations. The correlations below the diagonal represent the observed score correlations.

Statistical Report
SAT Suite of Assessments Administration Report Page 17 of 43
Table 5.c.1 : Scale Score Moments, Intercorrelations and Reliability for White Students for SAT Form A N = 7,572
R WL MTS HSS SCI COE WIC EOI SEC HOA PSD PAM ERW MSS Total
R 1 0.94 0.84 1.00 1.00 1.00 1.00 0.95 0.90 0.83 0.87 0.79 1.00 0.84 0.99 WL 0.82 1 0.84 0.98 0.97 1.00 1.00 1.00 1.00 0.83 0.85 0.79 1.00 0.84 0.98 MTS 0.75 0.75 1 0.93 0.93 0.88 0.83 0.85 0.80 1.00 1.00 1.00 0.85 1.00 1.00 HSS 0.90 0.83 0.80 1 0.98 1.00 1.00 1.00 0.91 0.93 0.97 0.85 1.00 0.93 1.00 SCI 0.91 0.83 0.80 0.80 1 1.00 1.00 1.00 0.91 0.92 0.98 0.84 1.00 0.93 1.00 COE 0.86 0.83 0.72 0.82 0.84 1 0.95 1.00 0.93 0.87 0.89 0.82 1.00 0.88 1.00 WIC 0.82 0.83 0.67 0.79 0.79 0.70 1 1.00 0.95 0.81 0.86 0.77 1.00 0.83 0.97 EOI 0.80 0.95 0.73 0.83 0.82 0.84 0.83 1 0.96 0.84 0.87 0.79 1.00 0.85 0.99 SEC 0.74 0.92 0.67 0.73 0.73 0.71 0.71 0.77 1 0.79 0.81 0.77 1.00 0.80 0.95 HOA 0.68 0.68 0.92 0.73 0.73 0.66 0.60 0.66 0.61 1 0.97 0.98 0.84 1.00 1.00 PSD 0.70 0.70 0.88 0.76 0.77 0.67 0.64 0.68 0.62 0.74 1 0.87 0.87 1.00 1.00 PAM 0.64 0.64 0.88 0.67 0.67 0.62 0.57 0.62 0.59 0.74 0.66 1 0.80 1.00 0.97 ERW 0.95 0.96 0.78 0.91 0.91 0.88 0.86 0.92 0.88 0.71 0.73 0.67 1 0.85 1.00 MSS 0.75 0.75 1.00 0.80 0.80 0.72 0.67 0.73 0.67 0.92 0.88 0.88 0.78 1 1.00 Total 0.90 0.90 0.94 0.90 0.90 0.85 0.81 0.87 0.82 0.86 0.85 0.82 0.94 0.94 1
Mean 26.71 26.11 25.68 26.51 26.70 8.81 8.99 8.69 8.09 8.33 8.60 7.95 528.15 513.54 1041.69 S.D. 4.96 5.20 4.90 4.97 4.82 2.53 2.79 2.82 2.98 2.43 3.08 2.85 97.04 98.06 184.15 Skewness 0.04 0.05 0.24 -0.10 0.03 0.18 -0.38 0.07 0.25 0.08 -0.35 0.23 0.09 0.24 0.17 Kurtosis -0.46 -0.49 -0.08 -0.31 -0.35 -0.55 -0.08 -0.48 -0.50 -0.12 -0.12 -0.23 -0.56 -0.08 -0.35
Reliability 0.87 0.88 0.90 0.81 0.83 0.75 0.73 0.81 0.78 0.76 0.76 0.75 0.93 0.90 0.95 Ave CSEM 1.80 1.79 1.55 2.15 2.01 1.27 1.46 1.22 1.38 1.18 1.52 1.41 25.36 30.94 40.01 Note. The values above the diagonal represent the true score correlations. The correlations below the diagonal represent the observed score correlations.
Statistical Report
SAT Suite of Assessments Administration Report Page 18 of 43
Table 5.c.2 : Scale Score Moments, Intercorrelations and Reliability for Black Students for SAT Form A N = 235
R WL MTS HSS SCI COE WIC EOI SEC HOA PSD PAM ERW MSS Total
R 1 0.95 0.72 1.00 1.00 1.00 1.00 0.97 0.83 0.77 0.68 0.66 1.00 0.72 0.97 WL 0.79 1 0.78 1.00 0.97 1.00 1.00 1.00 1.00 0.83 0.71 0.77 1.00 0.78 1.00 MTS 0.60 0.65 1 0.88 0.86 0.76 0.67 0.76 0.74 1.00 1.00 1.00 0.76 1.00 1.00 HSS 0.84 0.79 0.69 1 0.95 1.00 1.00 1.00 0.85 0.93 0.87 0.76 1.00 0.88 1.00 SCI 0.87 0.77 0.69 0.71 1 1.00 1.00 1.00 0.81 0.89 0.86 0.81 1.00 0.86 1.00 COE 0.77 0.77 0.58 0.71 0.74 1 0.85 1.00 0.81 0.77 0.70 0.80 1.00 0.76 0.97 WIC 0.81 0.79 0.52 0.75 0.74 0.60 1 1.00 0.85 0.76 0.60 0.60 1.00 0.67 0.92 EOI 0.77 0.91 0.61 0.80 0.77 0.82 0.79 1 0.85 0.83 0.68 0.73 1.00 0.76 0.98 SEC 0.65 0.89 0.58 0.62 0.60 0.57 0.62 0.64 1 0.75 0.67 0.77 1.00 0.74 0.93 HOA 0.57 0.61 0.88 0.64 0.63 0.51 0.53 0.59 0.53 1 0.95 1.00 0.81 1.00 1.00 PSD 0.52 0.55 0.87 0.63 0.63 0.48 0.43 0.50 0.49 0.65 1 0.90 0.70 1.00 0.96 PAM 0.46 0.55 0.84 0.51 0.54 0.51 0.39 0.49 0.51 0.66 0.59 1 0.73 1.00 1.00 ERW 0.95 0.95 0.66 0.86 0.86 0.81 0.84 0.89 0.82 0.62 0.57 0.53 1 0.76 1.00 MSS 0.60 0.65 1.00 0.69 0.69 0.58 0.52 0.61 0.58 0.88 0.87 0.84 0.66 1 1.00 Total 0.85 0.88 0.91 0.85 0.85 0.76 0.75 0.82 0.77 0.82 0.78 0.75 0.91 0.91 1
Mean 23.55 22.54 22.40 23.44 23.20 7.26 7.10 6.72 6.40 6.87 6.38 6.66 460.94 448.04 908.98 S.D. 4.57 4.69 4.29 4.64 4.32 2.29 2.99 2.58 2.66 2.12 3.11 2.33 87.65 85.85 158.20 Skewness 0.07 0.27 0.28 -0.14 0.20 0.32 -0.11 0.25 0.55 0.23 -0.16 0.58 0.19 0.28 0.42 Kurtosis -0.17 0.18 0.42 -0.29 -0.44 0.23 -0.70 -0.10 0.08 0.09 -0.79 0.84 -0.13 0.42 0.08
Reliability 0.82 0.84 0.85 0.74 0.75 0.67 0.72 0.76 0.74 0.66 0.72 0.60 0.91 0.85 0.93 Ave CSEM 1.91 1.89 1.68 2.39 2.14 1.31 1.57 1.27 1.36 1.24 1.65 1.48 26.92 33.64 43.08 Note. The values above the diagonal represent the true score correlations. The correlations below the diagonal represent the observed score correlations.
Statistical Report
SAT Suite of Assessments Administration Report Page 19 of 43
Table 5.c.3 : Scale Score Moments, Intercorrelations and Reliability for Hispanic Students for SAT Form A N = 245
R WL MTS HSS SCI COE WIC EOI SEC HOA PSD PAM ERW MSS Total
R 1 0.95 0.85 1.00 1.00 1.00 1.00 0.97 0.93 0.82 0.86 0.83 1.00 0.85 1.00 WL 0.83 1 0.84 0.99 0.97 1.00 1.00 1.00 1.00 0.80 0.85 0.79 1.00 0.84 0.99 MTS 0.74 0.74 1 0.93 0.96 0.87 0.83 0.83 0.83 1.00 1.00 1.00 0.85 1.00 1.00 HSS 0.88 0.83 0.78 1 0.95 1.00 1.00 1.00 0.94 0.89 0.99 0.86 1.00 0.93 1.00 SCI 0.89 0.81 0.81 0.76 1 1.00 1.00 1.00 0.93 0.92 0.99 0.91 1.00 0.96 1.00 COE 0.82 0.83 0.70 0.77 0.82 1 0.98 1.00 0.97 0.87 0.84 0.83 1.00 0.87 1.00 WIC 0.85 0.81 0.65 0.80 0.78 0.70 1 1.00 0.94 0.76 0.88 0.77 1.00 0.83 0.99 EOI 0.80 0.95 0.70 0.81 0.81 0.84 0.82 1 0.98 0.78 0.87 0.79 1.00 0.83 0.99 SEC 0.76 0.93 0.69 0.74 0.73 0.73 0.70 0.78 1 0.79 0.83 0.79 1.00 0.83 0.97 HOA 0.65 0.64 0.89 0.68 0.70 0.63 0.55 0.60 0.59 1 0.92 0.99 0.82 1.00 1.00 PSD 0.69 0.69 0.87 0.77 0.76 0.62 0.64 0.67 0.63 0.68 1 0.90 0.87 1.00 1.00 PAM 0.65 0.62 0.88 0.65 0.69 0.60 0.55 0.60 0.59 0.71 0.65 1 0.82 1.00 1.00 ERW 0.95 0.96 0.77 0.90 0.89 0.87 0.87 0.92 0.89 0.67 0.72 0.66 1 0.85 1.00 MSS 0.74 0.74 1.00 0.78 0.81 0.70 0.65 0.70 0.69 0.89 0.87 0.88 0.77 1 1.00 Total 0.90 0.90 0.94 0.89 0.90 0.83 0.81 0.86 0.84 0.83 0.84 0.82 0.94 0.94 1
Mean 25.59 24.87 24.29 25.38 25.47 8.19 8.45 8.16 7.38 7.67 7.81 7.16 504.61 485.84 990.45 S.D. 4.97 5.20 4.72 5.03 4.66 2.44 2.81 2.79 2.95 2.32 3.14 2.72 97.30 94.46 180.58 Skewness 0.24 0.28 0.43 0.04 0.24 0.49 -0.18 0.24 0.58 0.15 -0.21 0.56 0.35 0.43 0.41 Kurtosis -0.63 -0.49 0.04 -0.46 -0.38 -0.56 -0.51 -0.49 -0.07 -0.46 -0.38 0.23 -0.60 0.04 -0.38
Reliability 0.86 0.87 0.88 0.80 0.80 0.73 0.71 0.80 0.78 0.73 0.74 0.71 0.93 0.88 0.95 Ave CSEM 1.85 1.85 1.62 2.25 2.06 1.27 1.52 1.25 1.38 1.21 1.59 1.45 26.14 32.41 41.64 Note. The values above the diagonal represent the true score correlations. The correlations below the diagonal represent the observed score correlations.

Statistical Report
SAT Suite of Assessments Administration Report Page 20 of 43
Table 5.c.4 : Scale Score Moments, Intercorrelations and Reliability for Asian Students for SAT Form A N = 211
R WL MTS HSS SCI COE WIC EOI SEC HOA PSD PAM ERW MSS Total
R 1 0.97 0.59 1.00 1.00 1.00 1.00 0.99 0.92 0.62 0.74 0.45 1.00 0.59 0.90 WL 0.85 1 0.66 0.98 0.96 1.00 0.98 1.00 1.00 0.66 0.77 0.56 1.00 0.66 0.94 MTS 0.54 0.60 1 0.69 0.80 0.66 0.53 0.61 0.69 1.00 0.99 1.00 0.63 1.00 0.95 HSS 0.89 0.84 0.60 1 0.95 1.00 0.97 1.00 0.92 0.71 0.87 0.52 1.00 0.69 0.94 SCI 0.89 0.84 0.71 0.78 1 1.00 0.96 0.99 0.90 0.83 0.92 0.67 1.00 0.80 1.00 COE 0.85 0.83 0.56 0.80 0.82 1 0.87 1.00 0.92 0.70 0.76 0.54 1.00 0.66 0.93 WIC 0.85 0.83 0.46 0.78 0.78 0.67 1 1.00 0.90 0.57 0.67 0.39 1.00 0.53 0.84 EOI 0.84 0.95 0.54 0.84 0.82 0.84 0.83 1 0.98 0.62 0.74 0.50 1.00 0.61 0.91 SEC 0.77 0.94 0.60 0.75 0.74 0.72 0.72 0.80 1 0.67 0.75 0.61 1.00 0.69 0.94 HOA 0.53 0.57 0.95 0.58 0.69 0.55 0.46 0.51 0.55 1 0.92 1.00 0.65 1.00 0.97 PSD 0.61 0.64 0.84 0.70 0.74 0.59 0.52 0.60 0.60 0.74 1 0.79 0.76 0.99 0.97 PAM 0.39 0.50 0.92 0.44 0.57 0.44 0.32 0.42 0.51 0.84 0.65 1 0.52 1.00 0.86 ERW 0.96 0.97 0.59 0.90 0.90 0.87 0.87 0.93 0.89 0.57 0.65 0.46 1 0.63 0.93 MSS 0.54 0.60 1.00 0.60 0.71 0.56 0.46 0.54 0.60 0.95 0.84 0.92 0.59 1 0.95 Total 0.83 0.87 0.90 0.83 0.89 0.79 0.73 0.81 0.82 0.86 0.84 0.79 0.88 0.90 1
Mean 26.15 26.05 28.11 26.12 26.97 8.91 8.31 8.55 8.07 9.52 9.18 9.65 522.04 562.27 1084.31 S.D. 5.19 5.53 5.66 5.15 5.08 2.57 3.26 3.04 3.07 2.66 3.19 3.43 103.25 113.23 193.27 Skewness 0.08 0.32 0.05 0.04 0.04 0.20 -0.34 0.15 0.42 -0.01 -0.29 -0.16 0.26 0.05 0.22 Kurtosis -0.37 -0.58 -0.54 -0.53 -0.09 -0.61 -0.45 -0.74 -0.50 0.09 -0.25 -0.72 -0.47 -0.54 -0.32
Reliability 0.87 0.89 0.93 0.82 0.84 0.76 0.79 0.83 0.80 0.82 0.79 0.86 0.94 0.93 0.96 Ave CSEM 1.84 1.81 1.47 2.18 2.04 1.27 1.49 1.24 1.37 1.12 1.48 1.27 25.78 29.34 39.06 Note. The values above the diagonal represent the true score correlations. The correlations below the diagonal represent the observed score correlations.

Statistical Report
SAT Suite of Assessments Administration Report Page 21 of 43
Table 5.c.5 : Scale Score Moments, Intercorrelations and Reliability for Two or more races Students for SAT Form A N = 307
R WL MTS HSS SCI COE WIC EOI SEC HOA PSD PAM ERW MSS Total
R 1 0.93 0.81 1.00 1.00 1.00 1.00 0.96 0.87 0.78 0.84 0.74 1.00 0.81 0.99 WL 0.80 1 0.79 0.99 0.96 1.00 1.00 1.00 1.00 0.75 0.83 0.70 1.00 0.79 0.97 MTS 0.71 0.70 1 0.93 0.89 0.83 0.79 0.82 0.73 1.00 1.00 1.00 0.82 1.00 1.00 HSS 0.89 0.81 0.78 1 0.95 1.00 1.00 1.00 0.91 0.90 0.97 0.84 1.00 0.93 1.00 SCI 0.89 0.79 0.75 0.76 1 1.00 1.00 1.00 0.86 0.85 0.93 0.77 1.00 0.89 1.00 COE 0.85 0.83 0.67 0.81 0.81 1 0.96 1.00 0.93 0.78 0.87 0.76 1.00 0.83 1.00 WIC 0.79 0.82 0.62 0.76 0.76 0.69 1 1.00 0.93 0.74 0.84 0.70 1.00 0.79 0.96 EOI 0.79 0.93 0.69 0.81 0.80 0.83 0.82 1 0.93 0.78 0.87 0.72 1.00 0.82 0.99 SEC 0.70 0.91 0.60 0.70 0.67 0.69 0.68 0.72 1 0.69 0.74 0.66 1.00 0.73 0.92 HOA 0.63 0.60 0.90 0.69 0.66 0.58 0.54 0.60 0.52 1 0.91 0.94 0.77 1.00 0.98 PSD 0.65 0.65 0.85 0.72 0.70 0.62 0.59 0.64 0.54 0.67 1 0.85 0.85 1.00 1.00 PAM 0.59 0.57 0.87 0.65 0.60 0.56 0.51 0.55 0.50 0.71 0.62 1 0.73 1.00 0.94 ERW 0.95 0.95 0.74 0.90 0.88 0.88 0.85 0.90 0.85 0.65 0.68 0.61 1 0.82 1.00 MSS 0.71 0.70 1.00 0.78 0.75 0.67 0.62 0.69 0.60 0.90 0.85 0.87 0.74 1 1.00 Total 0.88 0.88 0.94 0.89 0.88 0.83 0.79 0.85 0.77 0.83 0.82 0.80 0.93 0.94 1
Mean 26.50 25.73 25.29 26.31 26.43 8.65 8.94 8.54 7.75 8.13 8.39 7.66 522.35 505.70 1028.05 S.D. 4.74 4.79 4.71 4.67 4.58 2.42 2.71 2.61 2.80 2.43 2.84 2.90 90.40 94.30 172.22 Skewness 0.10 0.10 0.35 -0.05 0.03 0.25 -0.33 0.17 0.30 0.18 -0.36 0.26 0.16 0.35 0.33 Kurtosis -0.50 -0.28 0.05 -0.16 -0.08 -0.39 0.10 -0.32 -0.29 0.00 0.10 -0.38 -0.50 0.05 -0.16
Reliability 0.85 0.86 0.89 0.78 0.80 0.73 0.71 0.78 0.75 0.76 0.71 0.76 0.92 0.89 0.94 Ave CSEM 1.82 1.79 1.57 2.18 2.03 1.27 1.46 1.22 1.39 1.19 1.54 1.43 25.53 31.46 40.52 Note. The values above the diagonal represent the true score correlations. The correlations below the diagonal represent the observed score correlations.
Statistical Report
SAT Suite of Assessments Administration Report Page 22 of 43
Table 6: Item Level Completion Rates for SAT Form A
Item Number
Reading Writing and Language
Math – No Calculator
Math – Calculator
1 99.83 99.69 99.71 99.78 2 99.83 99.69 99.71 99.75 3 99.83 99.69 99.69 99.73 4 99.82 99.69 99.69 99.73 5 99.82 99.69 99.64 99.69 6 99.81 99.68 99.64 99.68 7 99.81 99.68 99.58 99.67 8 99.81 99.66 99.54 99.65 9 99.79 99.66 99.44 99.64 10 99.79 99.65 99.38 99.62 11 99.78 99.64 99.30 99.62 12 99.77 99.63 99.05 99.60 13 99.77 99.62 98.73 99.59 14 99.76 99.59 98.49 99.59 15 99.73 99.59 97.96 99.56 16 99.73 99.57 89.39 99.48 17 99.69 99.55 84.50 99.46 18 99.69 99.54 81.17 99.39 19 99.68 99.50 72.43 99.36 20 99.66 99.47 66.05 99.35 21 99.63 99.40 99.28 22 99.54 99.39 99.17 23 99.49 99.30 99.13 24 99.49 99.26 99.03 25 99.47 99.25 98.95 26 99.38 99.20 98.77 27 99.30 99.06 98.62 28 99.28 98.99 98.46 29 99.20 98.85 98.32 30 99.18 98.73 98.08 31 99.03 98.58 93.40 32 98.96 98.42 92.97 33 98.23 98.19 91.28 34 98.12 97.70 89.21 35 97.92 97.54 87.39 36 97.80 97.36 80.00 37 97.43 97.00 72.80 38 97.25 96.69 69.55 39 97.03 96.40 40 96.69 95.94 41 96.28 95.51 42 96.05 95.24 43 94.78 94.62 44 94.42 94.41 45 94.06 46 93.74 47 93.47 48 93.36 49 92.78 50 92.38 51 92.08 52 90.55
Statistical Report
SAT Suite of Assessments Administration Report Page 23 of 43
Table 7a. Section Completion Rates by Timed Section for SAT
Test Category Form A
Reading # Items Reached by 80% 52 # Items in Section 52 % Completing 75% 97.03 % Completing Section 90.55 Mean Not Reached 1.08 S.D. Not Reached 4.53 NR Variance/Score Variance 0.25
Writing and Language # Items Reached by 80% 44 # Items in Section 44 % Completing 75% 98.19 % Completing Section 94.41 Mean Not Reached 0.62 S.D. Not Reached 3.57 NR Variance/Score Variance 0.17
Math No Calculator # Items Reached by 80% 18 # Items in Section 20 % Completing 75% 97.96 % Completing Section 66.05 Mean Not Reached 1.17 S.D. Not Reached 2.20 NR Variance/Score Variance 0.29
Math With Calculator # Items Reached by 80% 35 # Items in Section 38 % Completing 75% 98.32 % Completing Section 69.55 Mean Not Reached 1.44 S.D. Not Reached 3.46 NR Variance/Score Variance 0.23

Statistical Report
SAT Suite of Assessments Administration Report Page 24 of 43
Table 7b. Section Completion Rates by Gender for SAT
Test Category Male Female
Reading # Items Reached by 80% 52 52 # Items in Section 52 52 % Completing 75% 96.67 97.39 % Completing Section 91.09 89.99 Mean Not Reached 1.15 1.01 S.D. Not Reached 4.81 4.22 NR Variance/Score Variance 0.27 0.23
Writing and Language # Items Reached by 80% 44 44 # Items in Section 44 44 % Completing 75% 97.92 98.48 % Completing Section 94.14 94.68 Mean Not Reached 0.71 0.54 S.D. Not Reached 3.84 3.26 NR Variance/Score Variance 0.19 0.14
Math No Calculator # Items Reached by 80% 18 18 # Items in Section 20 20 % Completing 75% 98.07 97.85 % Completing Section 67.87 64.16 Mean Not Reached 1.15 1.19 S.D. Not Reached 2.28 2.10 NR Variance/Score Variance 0.29 0.29
Math With Calculator # Items Reached by 80% 35 36 # Items in Section 38 38 % Completing 75% 98.02 98.63 % Completing Section 70.17 68.90 Mean Not Reached 1.54 1.33 S.D. Not Reached 3.74 3.13 NR Variance/Score Variance 0.25 0.21

Statistical Report
SAT Suite of Assessments Administration Report Page 25 of 43
Table 7c. Section Completion Rates by Race/Ethnicity for SAT
Test Category White Black Hispanic Asian Two or More Races
Reading # Items Reached by 80% 52 52 52 52 52 # Items in Section 52 52 52 52 52 % Completing 75% 98.28 91.91 96.73 98.58 96.74 % Completing Section 92.56 80.43 89.39 95.26 91.86 Mean Not Reached 0.68 2.66 1.02 0.43 0.93 S.D. Not Reached 3.17 7.23 3.74 2.44 3.80 NR Variance/Score Variance 0.13 0.89 0.18 0.07 0.20
Writing and Language # Items Reached by 80% 44 44 44 44 44 # Items in Section 44 44 44 44 44 % Completing 75% 99.04 94.04 99.18 99.53 98.05 % Completing Section 96.08 88.09 93.47 98.10 94.46 Mean Not Reached 0.35 1.51 0.47 0.18 0.54 S.D. Not Reached 2.21 5.27 2.11 1.55 2.62 NR Variance/Score Variance 0.07 0.49 0.06 0.03 0.11
Math No Calculator # Items Reached by 80% 18 15 17 19 17 # Items in Section 20 20 20 20 20 % Completing 75% 98.47 96.17 98.78 99.53 98.05 % Completing Section 67.95 51.06 67.76 68.72 63.84 Mean Not Reached 0.99 2.02 1.10 0.85 1.18 S.D. Not Reached 1.86 2.71 1.83 1.66 1.90 NR Variance/Score Variance 0.20 0.74 0.23 0.11 0.23
Math With Calculator # Items Reached by 80% 36 34 35 36 36 # Items in Section 38 38 38 38 38 % Completing 75% 98.86 95.74 98.37 99.05 98.37 % Completing Section 71.98 52.77 67.35 72.04 70.68 Mean Not Reached 1.13 2.44 1.49 1.23 1.18 S.D. Not Reached 2.71 4.14 2.97 3.40 2.55 NR Variance/Score Variance 0.15 0.51 0.19 0.18 0.14
Note: Only subgroups with sample size >=200 have statistics reported.
Statistical Report
SAT Suite of Assessments Administration Report Page 26 of 43
Table 8.a.1: DIF Summary for SAT Form A
Reading Worst DIF Focal Group
Category Number of
Items % of Items
Summary Statistics Female Black Hispanic Asian
Two or more races
C+ 0 0.00 0 - 0 - 0 B+ 1 1.92 0 - 1 - 0 A 50 96.15 52 - 39 - 51 B- 1 1.92 0 - 0 - 1 C- 0 0.00 0 - 0 - 0
N 52 - 40 - 52 MEAN 0.02 - 0.00 - 0.00 SD 0.42 - 0.45 - 0.39 MIN -0.99 - -0.93 - -1.13 MAX 0.89 - 1.15 - 0.82
Writing and Language Worst DIF Focal Group
Category Number of
Items % of Items
Summary Statistics Female Black Hispanic Asian
Two or more races
C+ 0 0.00 0 - 0 - - B+ 4 9.09 2 - 1 - - A 38 86.36 40 - 39 - - B- 2 4.55 2 - 0 - - C- 0 0.00 0 - 0 - -
N 44 - 40 - - MEAN 0.02 - 0.02 - - SD 0.56 - 0.41 - - MIN -1.26 - -0.81 - - MAX 1.23 - 1.04 - -
Math Worst DIF Focal Group
Category Number of
Items % of Items
Summary Statistics Female Black Hispanic Asian
Two or more races
C+ 0 0.00 0 - 0 - - B+ 2 3.45 1 - 1 - - A 51 87.93 53 - 44 - - B- 4 6.90 3 - 0 - - C- 1 1.72 1 - 0 - -
N 58 - 45 - - MEAN 0.00 - 0.03 - - SD 0.53 - 0.45 - - MIN -1.70 - -0.78 - - MAX 1.07 - 1.16 - -
Note. The summary statistics are from the distribution of Mantel-Haenszel D-DIF statistics within each group. If a test taker selected more than one race then they were included in the Two or More Races category. Only subgroups with sample size >=200 have statistics reported.
Statistical Report
SAT Suite of Assessments Administration Report Page 27 of 43
Table 9a: Scale Score Mean, Standard Deviation, and Standardized Difference between Gender Groups
Male Female Form Score Mean S.D. Mean S.D. Std. Diff.
A R 25.23 5.28 26.14 4.92 0.18 WL 24.39 5.41 25.60 5.21 0.23 MTS 24.73 5.30 24.64 4.77 -0.02 HSS 25.12 5.32 25.84 4.94 0.14 SCI 25.47 5.18 25.91 4.79 0.09 COE 8.18 2.61 8.51 2.46 0.13 WIC 8.11 3.09 8.70 2.79 0.20 EOI 7.87 2.95 8.36 2.78 0.17 SEC 7.13 2.92 7.91 3.00 0.26 HOA 7.88 2.61 7.87 2.37 0.00 PSD 8.10 3.34 7.88 3.12 -0.07 PAM 7.40 2.97 7.55 2.78 0.05 ERW 496.24 102.29 517.38 96.61 0.21 MSS 494.52 105.96 492.82 95.44 -0.02 Total 990.76 196.87 1010.20 181.23 0.10
Note: Std. Diff. = Standardized Difference for female mean – male mean.
Statistical Report
SAT Suite of Assessments Administration Report Page 28 of 43
Table 9b: Scale Score Mean, Standard Deviation, and Standardized Difference between Racial/Ethnic Groups for SAT Form A
White Black Hispanic Asian
Form Score Mean S.D. Mean S.D. Std. Diff. Mean S.D.
Std. Diff. Mean S.D.
Std. Diff.
A R 26.71 4.96 23.55 4.57 -0.64 25.59 4.97 -0.23 26.15 5.19 -0.11 WL 26.11 5.20 22.54 4.69 -0.69 24.87 5.20 -0.24 26.05 5.53 -0.01 MTS 25.68 4.90 22.40 4.29 -0.67 24.29 4.72 -0.28 28.11 5.66 0.49 HSS 26.51 4.97 23.44 4.64 -0.62 25.38 5.03 -0.23 26.12 5.15 -0.08 SCI 26.70 4.82 23.20 4.32 -0.73 25.47 4.66 -0.26 26.97 5.08 0.06 COE 8.81 2.53 7.26 2.29 -0.61 8.19 2.44 -0.25 8.91 2.57 0.04 WIC 8.99 2.79 7.10 2.99 -0.68 8.45 2.81 -0.20 8.31 3.26 -0.24 EOI 8.69 2.82 6.72 2.58 -0.70 8.16 2.79 -0.19 8.55 3.04 -0.05 SEC 8.09 2.98 6.40 2.66 -0.57 7.38 2.95 -0.24 8.07 3.07 -0.01 HOA 8.33 2.43 6.87 2.12 -0.60 7.67 2.32 -0.27 9.52 2.66 0.49 PSD 8.60 3.08 6.38 3.11 -0.72 7.81 3.14 -0.26 9.18 3.19 0.19 PAM 7.95 2.85 6.66 2.33 -0.45 7.16 2.72 -0.28 9.65 3.43 0.59 ERW 528.15 97.04 460.94 87.65 -0.69 504.61 97.30 -0.24 522.04 103.25 -0.06 MSS 513.54 98.06 448.04 85.85 -0.67 485.84 94.46 -0.28 562.27 113.23 0.49 Total 1041.69 184.15 908.98 158.20 -0.72 990.45 180.58 -0.28 1084.31 193.27 0.23
Note: Std. Diff. = Standardized Difference for non-white group mean – white group mean. Results are only included if the non-white group sample is equal to or greater than 200. If a test taker selected more than once race then they were included in the Two or More Races category

Statistical Report
SAT Suite of Assessments Administration Report Page 29 of 43
Table 9b: Scale Score Mean, Standard Deviation, and Standardized Difference between Race/Ethnicity Groups for SAT Form A
White Black Hispanic Asian Form Score Mean S.D. Mean S.D. Std. Diff. Mean S.D. Std. Diff. Mean S.D. Std. Diff.
A R 26.71 4.96 23.55 4.57 -0.64 25.59 4.97 -0.23 26.15 5.19 -0.11 WL 26.11 5.20 22.54 4.69 -0.69 24.87 5.20 -0.24 26.05 5.53 -0.01 MTS 25.68 4.90 22.40 4.29 -0.67 24.29 4.72 -0.28 28.11 5.66 0.49 HSS 26.51 4.97 23.44 4.64 -0.62 25.38 5.03 -0.23 26.12 5.15 -0.08 SCI 26.70 4.82 23.20 4.32 -0.73 25.47 4.66 -0.26 26.97 5.08 0.06 COE 8.81 2.53 7.26 2.29 -0.61 8.19 2.44 -0.25 8.91 2.57 0.04 WIC 8.99 2.79 7.10 2.99 -0.68 8.45 2.81 -0.20 8.31 3.26 -0.24 EOI 8.69 2.82 6.72 2.58 -0.70 8.16 2.79 -0.19 8.55 3.04 -0.05 SEC 8.09 2.98 6.40 2.66 -0.57 7.38 2.95 -0.24 8.07 3.07 -0.01 HOA 8.33 2.43 6.87 2.12 -0.60 7.67 2.32 -0.27 9.52 2.66 0.49 PSD 8.60 3.08 6.38 3.11 -0.72 7.81 3.14 -0.26 9.18 3.19 0.19 PAM 7.95 2.85 6.66 2.33 -0.45 7.16 2.72 -0.28 9.65 3.43 0.59 ERW 528.15 97.04 460.94 87.65 -0.69 504.61 97.30 -0.24 522.04 103.25 -0.06 MSS 513.54 98.06 448.04 85.85 -0.67 485.84 94.46 -0.28 562.27 113.23 0.49 Total 1041.69 184.15 908.98 158.20 -0.72 990.45 180.58 -0.28 1084.31 193.27 0.23 Note: Std. Diff. = Standardized Difference for non-white group mean – white group mean. Results are only included if the non-white group sample is equal to or greater than 200. If a test taker selected more than once race then they were included in the Two or More Races category.

Statistical Report
SAT Suite of Assessments Administration Report Page 30 of 43
Table 10. Percentage of Test Takers in Each Classification Level for SAT by Subgroup
Evidence-Based Reading and Writing Math
Level Level 1 Level 2 Level 3 Level 4 Level 1 Level 2 Level 3 Level 4
Score Range N 200-410 420-470 480-620 630-800 200-410 420-520 530-640 650-800
Grade Level Grade 11 12,069
19.98 20.65 45.99 13.39 21.56 42.71 27.53 8.19
Gender
Male 6,162 24.23 21.39 42.24 12.14 22.69 40.9 26.92 9.49
Female 5,907 15.54 19.87 49.89 14.69 20.38 44.61 28.17 6.84 Race/Ethnicity
White 7,572 13.59 17.79 51.23 17.39 14.98 41.9 32.62 10.5
Black or African American 235 32.34 25.53 39.15 2.98 34.04 51.06 13.19 1.70
Hispanic 245 18.78 22.86 44.49 13.88 21.63 46.12 25.71 6.53
Asian 211 17.06 18.48 48.34 16.11 9.48 28.91 37.44 24.17 American Indian/Alaska Native
132
31.06 27.27 36.36 5.30 33.33 48.48 15.91 2.27
Two or more races 307 12.05 20.85 53.09 14.01 16.29 44.63 30.94 8.14
Other/Missing 3,330 33.96 26.49 34.38 5.17 36.1 44.26 16.88 2.76 Note. * = Classification levels are not reported for groups with less than 30 test takers.
Statistical Report
SAT Suite of Assessments Administration Report Page 31 of 43
Table 11. Classification Accuracy for SAT Form A
Evidence-Based Reading and Writing Math
Group (N=12,069) Probability of correct
classification
False positive
False negative Probability of correct
classification
False positive
False negative
Grade Level Grade 11 0.81 0.10 0.09 0.79 0.11 0.10 Gender
Male 0.81 0.10 0.09 0.80 0.11 0.09 Female 0.82 0.09 0.09 0.79 0.11 0.10 Race/Ethnicity
White 0.82 0.09 0.09 0.79 0.11 0.10
Black or African American 0.80 0.10 0.09 0.79 0.12 0.09
Hispanic 0.81 0.10 0.09 0.78 0.12 0.10
Asian 0.82 0.09 0.09 0.81 0.10 0.09
Two or more races 0.82 0.09 0.09 0.79 0.12 0.10 Individual cut points
Level 1 vs. Level 2 – 4 0.94 0.03 0.03 0.92 0.04 0.04
Level 1 – 2 vs. Level 3 – 4 0.92 0.04 0.04 0.91 0.05 0.04
Level 1 – 3 vs. Level 4 0.96 0.03 0.02 0.97 0.02 0.01

Statistical Report
SAT Suite of Assessments Administration Report Page 32 of 43
Table 12. Classification Consistency for SAT Form A
Evidence-Based Reading and Writing Math
Group (N=12,069)
Proportion of consistent
decisions
Chance proportion
of consistent decision
Kappa Statistic
Probability of misclassification
Proportion of
consistent decisions
Chance proportion
of consistent decision
Kappa Statistic
Probability of misclassification
Grade Level Grade 11 0.74 0.31 0.62 0.26 0.70 0.31 0.57 0.30 Gender
Male 0.74 0.30 0.63 0.26 0.71 0.30 0.59 0.29
Female 0.75 0.33 0.63 0.25 0.70 0.32 0.56 0.30 Race/Ethniccity
White 0.76 0.34 0.63 0.24 0.70 0.31 0.57 0.30
Black or African American 0.73 0.32 0.6 0.27 0.71 0.38 0.52 0.29
Hispanic 0.74 0.31 0.62 0.26 0.69 0.32 0.54 0.31
Asian 0.76 0.32 0.64 0.24 0.73 0.29 0.62 0.27
Two or more races 0.74 0.36 0.6 0.26 0.70 0.32 0.55 0.3 Individual cut points Level 1 vs. Level 2 – 4 0.91 0.68 0.72 0.09 0.88 0.65 0.66 0.12
Level 1 – 2 vs. Level 3 - 4 0.89 0.52 0.77 0.11 0.88 0.54 0.74 0.12
Level 1 – 3 vs. Level 4 0.94 0.77 0.75 0.06 0.95 0.85 0.68 0.05 Note. Classification consistency is reported for groups with more than 200 test takers.
Statistical Report
SAT Suite of Assessments Administration Report Page 33 of 43
Bibliography/References
Brennan, R. L. (2004). BB-CLASS: A computer program that uses the beta-binomial model
for classification consistency and accuracy. Available from: https://education.uiowa.edu/centers/center-advanced-studies-measurement-and-assessment/computer-programs#class
Cohen, J. (1988). Statistical power analysis for the behavioral sciences (2nd ed.). Hillsdale,
NJ: Lawrence Erlbaum Associates. College Board, The. (2014). Test specification for the redesigned SAT. New York: NY.
Available from https://collegereadiness.collegeboard.org/pdf/test-specifications-redesigned-sat.pdf.
College Board, The. (2016). SAT Suite of Assessments Technical Manual: Characteristics
of the SAT. New York: NY. Crocker, L. & Algina, J. (1986). Introduction to classical and modern test theory. Belmont,
CA: Wadsworth Group/Thomson Learning. Cronbach, L. J. (1951). Coefficient alpha and the internal structure of tests. Psychometrika, 16, 297-334. Dorans, N.J. & Holland, P. W. (1993). DIF detection and description: Mantel-Haenszel and
standardization. In P. W. Holland and H. Wainer (Eds.). Differential Item functioning (p 35 – 66). Hillsdale, NJ: Lawrence Erlbaum Associates.
ETS (March 2013) Test Analysis Report for College Board SAT Reasoning Test, Fall 2012
Administrations, Statistical Report No. SR-2013-023. Haertel, E. H. (2006). Reliability. In R. L. Brennan (Ed.), Educational Measurement -
Fourth Edition (pp. 65-110). Westport, CT: Praeger. Hanson, B. A. & Brennan, R. L. (1990). An investigation of classification consistency
indexes estimated under alternative strong true score models. Journal of Educational Measurement, 27(4), 345 – 359.
Livingston, S. A., & Lewis, C. (1995). Estimating the consistency and accuracy of
classifications based on test scores. Journal of Educational Measurement, 32(2), 179–197.
Morgan, D. L., Sweeney, K., Reshetar, R., Patel, P., & McCullough, J. (2016). Final report
on the 2016 SAT multi-state standard setting. (Unpublished Technical Report). New York, NY: The College Board.
Schumacker R.E., and Muchinsky P. M. (1996). Disattenuating correlation coefficients.
Rasch Measurement Transactions, 10(1), 479. Retrieved from the web on January 20, 2016 from http://www.rasch.org/rmt/rmt101g.htm
van der Linden, W. J. (2011). Test design and speededness. Journal of Educational
Measurement, 48(1), 44-60.

Statistical Report
SAT Suite of Assessments Administration Report Page 34 of 43
About the College Board
The College Board is a mission-driven, not-for-profit organization that connects students to
college success and opportunity. Founded in 1900, the College Board was created to expand
access to higher education. Today, the membership association is made up of over 6,000 of the
world’s leading educational institutions and is dedicated to promoting excellence and equity in
education. Each year, the College Board helps more than seven million students prepare for a
successful transition to college through programs and services in college readiness and college
success — including the SAT® and the Advanced Placement Program®. The organization also
serves the education community through research and advocacy on behalf of students,
educators, and schools. For further information, visit www.collegeboard.org.
Statistical Report
SAT Suite of Assessments Administration Report Page 35 of 43
Appendix A: Target Specifications for the SAT Suite of Assessments
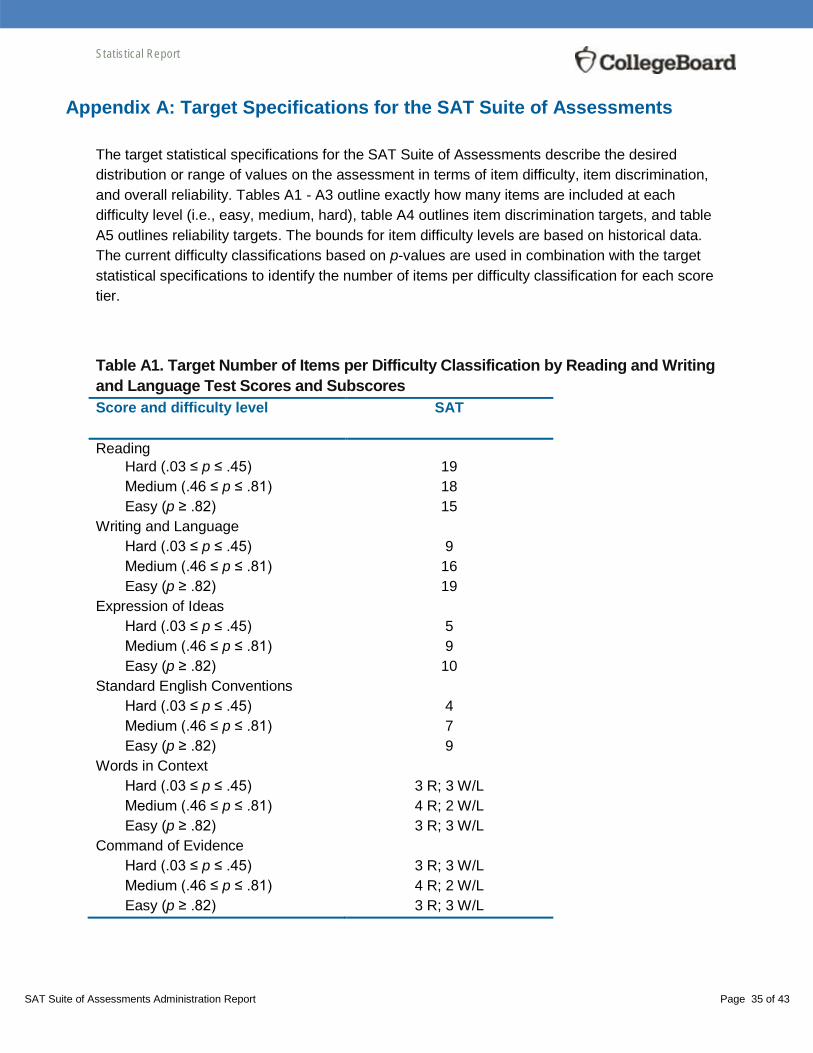
The target statistical specifications for the SAT Suite of Assessments describe the desired
distribution or range of values on the assessment in terms of item difficulty, item discrimination,
and overall reliability. Tables A1 - A3 outline exactly how many items are included at each
difficulty level (i.e., easy, medium, hard), table A4 outlines item discrimination targets, and table
A5 outlines reliability targets. The bounds for item difficulty levels are based on historical data.
The current difficulty classifications based on p-values are used in combination with the target
statistical specifications to identify the number of items per difficulty classification for each score
tier.
Table A1. Target Number of Items per Difficulty Classification by Reading and Writing
and Language Test Scores and Subscores
Score and difficulty level SAT
Reading
Hard (.03 ≤ p ≤ .45) 19
Medium (.46 ≤ p ≤ .81) 18
Easy (p ≥ .82) 15
Writing and Language
Hard (.03 ≤ p ≤ .45) 9
Medium (.46 ≤ p ≤ .81) 16
Easy (p ≥ .82) 19
Expression of Ideas
Hard (.03 ≤ p ≤ .45) 5
Medium (.46 ≤ p ≤ .81) 9
Easy (p ≥ .82) 10
Standard English Conventions
Hard (.03 ≤ p ≤ .45) 4
Medium (.46 ≤ p ≤ .81) 7
Easy (p ≥ .82) 9
Words in Context
Hard (.03 ≤ p ≤ .45) 3 R; 3 W/L
Medium (.46 ≤ p ≤ .81) 4 R; 2 W/L
Easy (p ≥ .82) 3 R; 3 W/L
Command of Evidence
Hard (.03 ≤ p ≤ .45) 3 R; 3 W/L
Medium (.46 ≤ p ≤ .81) 4 R; 2 W/L
Easy (p ≥ .82) 3 R; 3 W/L

Statistical Report
SAT Suite of Assessments Administration Report Page 36 of 43
Table A2. Target Number of Items per Difficulty Classification by Math Test Score, Cross-
Test Scores, and Subscores
Score and difficulty level SAT
MC SPR
Math
Hard (.03 ≤ p ≤ .45) 19 6
Medium (.46 ≤ p ≤ .81) 15 4
Easy (p ≥ .82) 11 1
Any 0 2
Analysis in History/Social Studies
Hard (.03 ≤ p ≤ .45) 8 R; 2 W/L; 2 M 2
Medium (.46 ≤ p ≤ .81) 7 R; 2 W/L; 2 M 1
Easy (p ≥ .82) 6 R; 2 W/L; 1 M 0
Analysis in Science
Hard (.03 ≤ p ≤ .45) 8 R; 2 W/L; 2 M 2
Medium (.46 ≤ p ≤ .81) 7 R; 2 W/L; 2 M 1
Easy (p ≥ .82) 6 R; 2 W/L; 1 M 0
Heart of Algebra
Hard (.03 ≤ p ≤ .45) 5 2
Medium (.46 ≤ p ≤ .81) 6 2
Easy (p ≥ .82) 4 0
Problem Solving and Data Analysis
Hard (.03 ≤ p ≤ .45) 6 1
Medium (.46 ≤ p ≤ .81) 2 1
Easy (p ≥ .82) 5 0
Any 0 2
Passport to Advanced Mathematics
Hard (.03 ≤ p ≤ .45) 7 1
Medium (.46 ≤ p ≤ .81) 6 1
Easy (p ≥ .82) 1 0
Statistical Report
SAT Suite of Assessments Administration Report Page 37 of 43
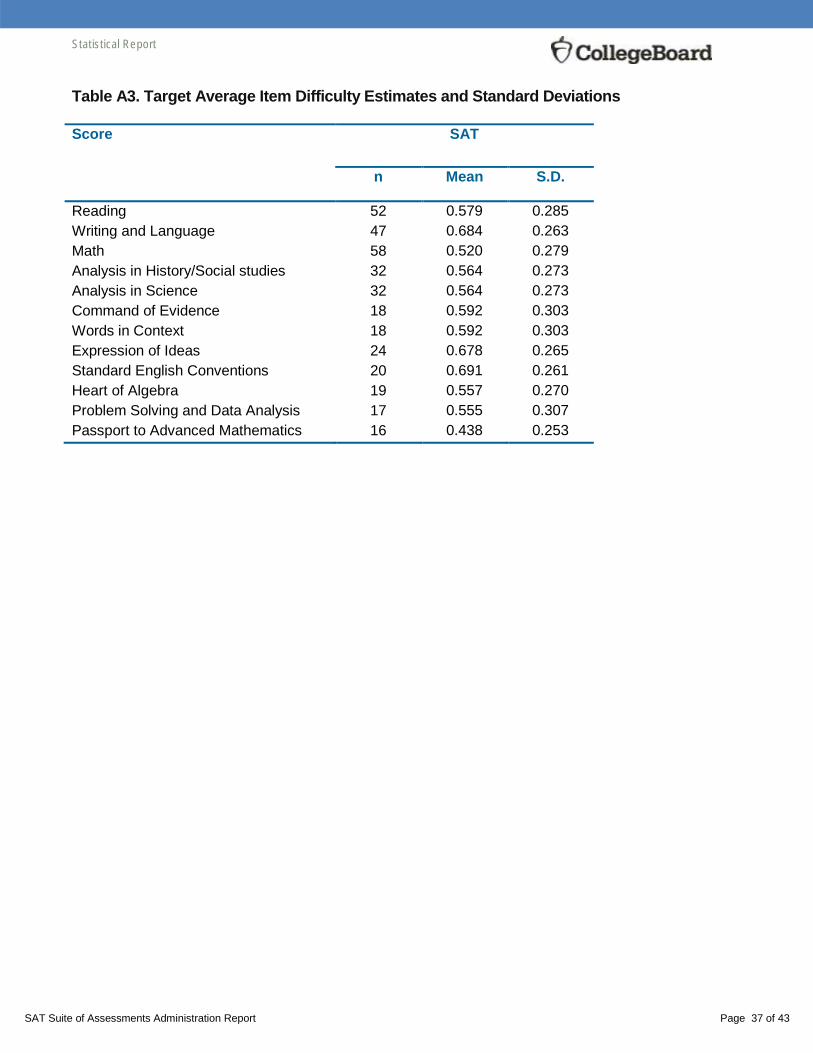
Table A3. Target Average Item Difficulty Estimates and Standard Deviations
Score SAT
n Mean S.D.
Reading 52 0.579 0.285
Writing and Language 47 0.684 0.263
Math 58 0.520 0.279
Analysis in History/Social studies 32 0.564 0.273
Analysis in Science 32 0.564 0.273
Command of Evidence 18 0.592 0.303
Words in Context 18 0.592 0.303
Expression of Ideas 24 0.678 0.265
Standard English Conventions 20 0.691 0.261
Heart of Algebra 19 0.557 0.270
Problem Solving and Data Analysis 17 0.555 0.307
Passport to Advanced Mathematics 16 0.438 0.253

Statistical Report
SAT Suite of Assessments Administration Report Page 38 of 43
Table A4. Target Average Item Discrimination Bounds
Score SAT
Lower Upper
Reading 0.340 0.403
Writing and Language 0.475 0.538
Math 0.410 0.473
Analysis in History/Social studies 0.407 0.470
Analysis in Science 0.407 0.470
Command of Evidence 0.398 0.461
Words in Context 0.398 0.461
Expression of Ideas 0.490 0.551
Standard English Conventions 0.497 0.556
Heart of Algebra 0.444 0.501
Problem Solving and Data Analysis 0.458 0.512
Passport to Advanced Mathematics 0.454 0.509
Statistical Report
SAT Suite of Assessments Administration Report Page 39 of 43
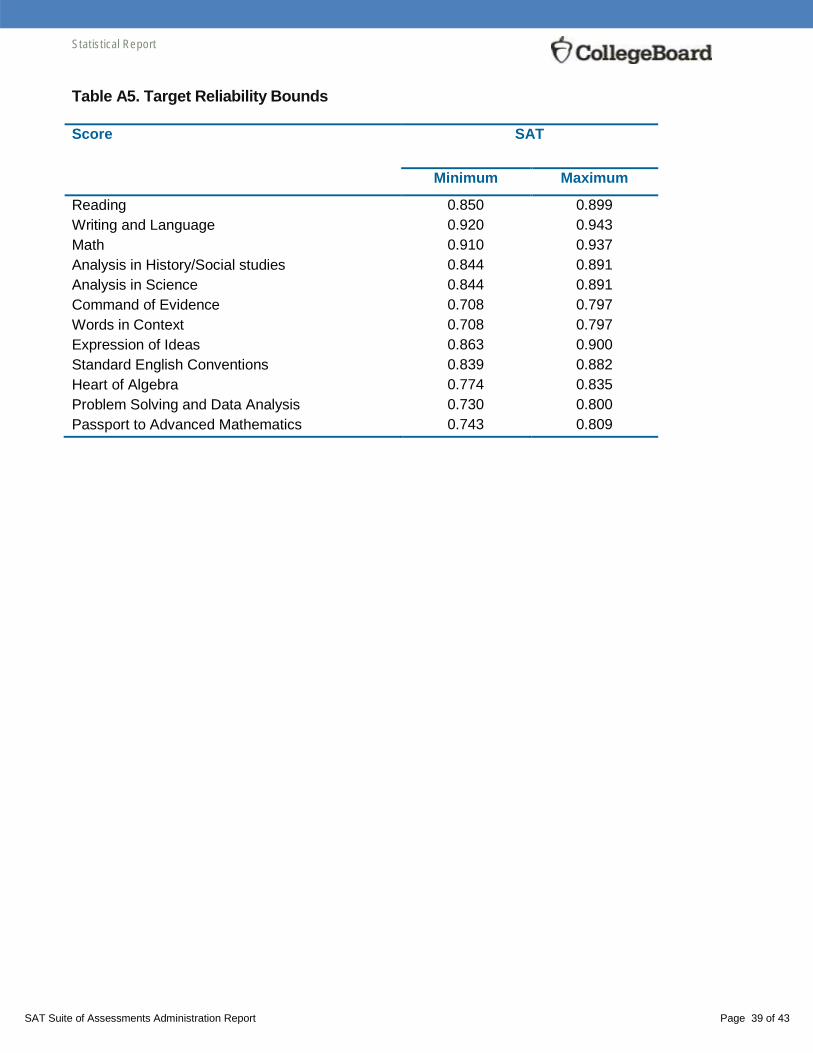
Table A5. Target Reliability Bounds
Score SAT
Minimum Maximum
Reading 0.850 0.899
Writing and Language 0.920 0.943
Math 0.910 0.937
Analysis in History/Social studies 0.844 0.891
Analysis in Science 0.844 0.891
Command of Evidence 0.708 0.797
Words in Context 0.708 0.797
Expression of Ideas 0.863 0.900
Standard English Conventions 0.839 0.882
Heart of Algebra 0.774 0.835
Problem Solving and Data Analysis 0.730 0.800
Passport to Advanced Mathematics 0.743 0.809

Statistical Report
SAT Suite of Assessments Administration Report Page 40 of 43
Appendix B: Test Analysis Formulas
B1. Pearson product moment correlation coefficient
where and represent z-scores of observed scores and , respectively, and N represents the number of test
takers (Crocker & Algina, 1986)
B2. Disattenuated correlations/True score correlations
where is the correlation between observed scores and , and and represent the stratified alpha
reliability of score and respectively (Schumacker & Muchinsky, 1996).
B3. Scale-score CSEM and reliability estimates
The reliabilities for scale scores were estimated from the average CSEM using the following equation:
where is the variance of scale score. The average CSEM was obtained by calculating a weighted average of the
CSEMs for the scales directly established.
For the scores that were mathematically derived including Math Test, ERW, and Total scores, the following equations
were used to compute the average CSEMs (Avg CSEM):
.
Statistical Report
SAT Suite of Assessments Administration Report Page 41 of 43
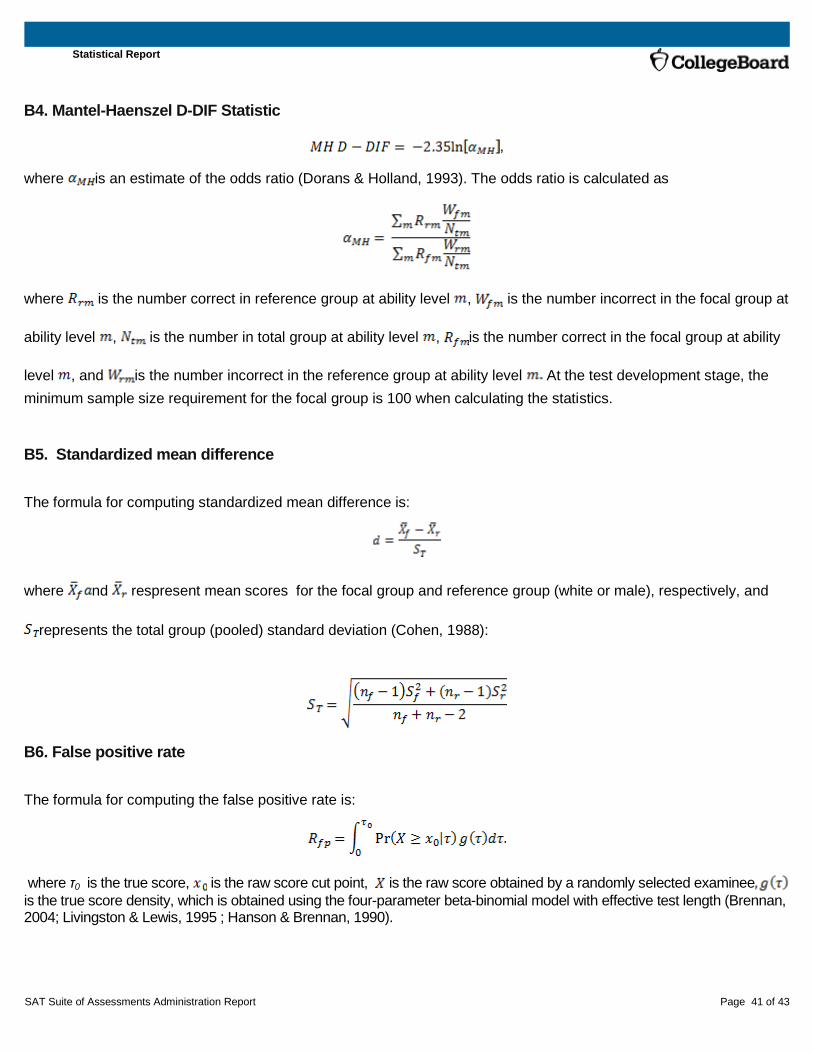
B4. Mantel-Haenszel D-DIF Statistic
,
where is an estimate of the odds ratio (Dorans & Holland, 1993). The odds ratio is calculated as
where is the number correct in reference group at ability level , is the number incorrect in the focal group at
ability level , is the number in total group at ability level , is the number correct in the focal group at ability
level , and is the number incorrect in the reference group at ability level At the test development stage, the
minimum sample size requirement for the focal group is 100 when calculating the statistics.
B5. Standardized mean difference
The formula for computing standardized mean difference is:
where nd respresent mean scores for the focal group and reference group (white or male), respectively, and
represents the total group (pooled) standard deviation (Cohen, 1988):
B6. False positive rate
The formula for computing the false positive rate is:
where τ0 is the true score, is the raw score cut point, is the raw score obtained by a randomly selected examinee
is the true score density, which is obtained using the four-parameter beta-binomial model with effective test length (Brennan, 2004; Livingston & Lewis, 1995 ; Hanson & Brennan, 1990).

Statistical Report
SAT Suite of Assessments Administration Report Page 42 of 43
B7. False negative rate
The formula for computing the false negative rate is:
where τ0 is the true score, is the raw score cut point, is the raw score obtained by a randomly selected examinee
is the true score density, which is obtained using the four-parameter beta-binomial model with effective test length (Brennan, 2004; Livingston & Lewis, 1995 ; Hanson & Brennan, 1990).
B8. Probability of correct classification
The formula for computing the probability of correct classification is:
where Rfp is the false positive rate and Rfn is the false negative rate.
B9. Effective Test Length
The formula for effective test length is:
where is the lowest score for raw score , is the highest score, is the mean, is the variance, and is
the reliability (Brennan, 2004; Livingston & Lewis, 1995).
B10. Proportion of consistent decisions
The formula for computing the proportion of consistent decisions is:
where and are raw score random variables for two independent administrations and is the raw score cut point
(Brennan, 2004; Livingston & Lewis, 1995 ; Hanson & Brennan, 1990).

Statistical Report
SAT Suite of Assessments Administration Report Page 43 of 43
B11. Proportion of consistent decisions by chance
The formula for computing the proportion of consistent decisions by chance is:
where and are raw score random variables for two independent administrations and is the raw score cut point
(Brennan, 2004; Livingston & Lewis, 1995 ; Hanson & Brennan, 1990).
B12. Kappa statistic
The formula for computing the kappa statistic is:
where p is the proportion of consistent decisions and is the proportion of consistent decisions by chance (Brennan, 2004;
Livingston & Lewis, 1995 ; Hanson & Brennan, 1990).
B13. Probability of misclassification
The formula for computing the probability of misclassification is:
where p is the proportion of consistent decisions.