satellite value chain: snapshot 2017 -...
TRANSCRIPT

THE SATELLITE VALUE CHAIN© Euroconsult 2017 - Unauthorized reproduction is a copyright violation
SATELLITE VALUE CHAIN: SNAPSHOT 2017
KEY TRENDS AND INDICATORS ON SUPPLY & DEMAND OF THE WORLD COMMERCIAL SATELLITE INDUSTRY – AN EXTRACT
A Euroconsult Executive Report

THE SATELLITE VALUE CHAIN© Euroconsult 2017 - Unauthorized reproduction is a copyright violation
WHO WE ARE / WHAT WE DO
TRAINING

THE SATELLITE VALUE CHAIN© Euroconsult 2017 - Unauthorized reproduction is a copyright violation
THE BEST OF EUROCONSULT’S RESEARCHINTRODUCTION TO THE SATELLITE VALUE CHAINTHE VALUE CHAIN CONCEPTOVERVIEW OF THE COMMERCIAL SATELLITE VALUE CHAIN IN 2016THE THREE COMMERCIAL SATELLITE VALUE CHAINS IN 2016
SATELLITE MANUFACTURING & LAUNCH SERVICESSATELLITES LAUNCHED OVER THE DECADECOMMERCIAL SATELLITES LAUNCHED OVER THE DECADESATELLITES LAUNCHED IN 2016SATELLITE MANUFACTURINGGEO SATELLITE MANUFACTURINGSMALL SATELLITE MANUFACTURINGLAUNCH SERVICESLAUNCH RATE NEW!GEO LAUNCH SERVICESSTRATEGIC ISSUES
SATELLITE COMMUNICATIONS SATELLITE OPERATORSSATELLITE OPERATORS – SATELLITE CONSTELLATIONSSATELLITE OPERATORS – M2M AND IOT CONSTELLATIONS NEW!VIDEO SERVICESSERVICE PROVIDERS LANDSCAPESTRATEGIC ISSUES
EARTH OBSERVATIONSATELLITE OPERATORSSATELLITE OPERATORS – THE NEW SPACE ENVIRONMENTCOMMERCIAL DATA MARKETFREE- AND LOW-COST SOLUTIONS NEW!VALUE-ADDED SERVICESSTRATEGIC ISSUES
SATELLITE NAVIGATIONGNSS SYSTEMSGNSS DEVICE MARKETGNSS SERVICE MARKETSELECTED GNSS MACROTRENDS NEW!STRATEGIC ISSUES
TABLE OF CONTENTS OF THE FULL REPORT
REPORT CONTENT COMES FROM:
• SATELLITES TO BE BUILT & LAUNCHED BY 2026• SATELLITE COMMUNICATIONS & BROADCASTING MARKETS SURVEY• SATELLITE-BASED EARTH OBSERVATION: MARKET PROSPECTS TO 2026• TRENDS & PROSPECTS FOR EMERGING SPACE PROGRAMS• HIGH THROUGHPUT SATELLITES: VERTICAL MARKET ANALYSIS & FORECASTS• PROSPECTS FOR IN-FLIGHT ENTERTAINMENT & CONNECTIVITY• PROSPECTS FOR MARITIME SATELLITE COMMUNICATIONS• PROSPECTS FOR THE SMALL SATELLITE MARKET

THE SATELLITE VALUE CHAIN© Euroconsult 2017 - Unauthorized reproduction is a copyright violation
The satellite industry is an infrastructure supplier to governmentagencies and commercial companies. It operates upstream of a valuechain that flows downstream to the end-users of satellite capabilities.
The satellite value chain permits the delivery of space-based servicesreliant on satellite technology, and includes a wide diversity ofstakeholders, active at five levels of the chain:
1. Government agencies who fund space technology R&D for theirown uses and for dual-uses: public R&D efforts remain highlyconcentrated in a limited number of countries;
2. The space industry (upstream) that includes a limited number ofplayers who design and manufacture space systems and theirlaunch vehicles;
3. The satellite operators who own the satellite systems andmarket their capacities to the service providers (downstream)who deliver communications, navigation and geographicinformation services to the final users by integrating the satellitesignal into packaged solutions;
4. Ground segment and terminal suppliers, who design anddeliver a large variety of software and equipment for both themanagement of satellite infrastructure, and for the access toservices by the users. Customers stand along the value chain;
5. The final users, whether governmental (civil/military) orcommercial (business or customer), do not ask for the satellitetechnology per se but for solutions tailored to their needs,whether for better communications, navigation or geographicinformation services.
INTRODUCTION TO THE SATELLITE VALUE CHAIN
THE VALUE CHAIN CONCEPT
LAUNCHER MANUFACTURING
SUBSYSTEMS
PRIME
SATELLITEMANUFACTURING
SUBSYSTEMS
PRIME
SATELLITE OPERATORS
LAUNCH SERVICES
MIL
ITA
RY
PUBL
IC C
IVIL
BUSI
NES
S
CON
SUM
ERS
SATELLITE SERVICE PROVIDERS
UPS
TREA
MD
OW
NST
REA
M
GROUND SEGMENT
SPACE AGENCIES
INVESTORS
INSURERS
REGULATORS

THE SATELLITE VALUE CHAIN© Euroconsult 2017 - Unauthorized reproduction is a copyright violation
INTRODUCTION TO THE SATELLITE VALUE CHAIN
OVERVIEW OF THE COMMERCIAL SATELLITE VALUE CHAIN IN 2016
Figures include commercially-active companies with at least 1 satellite in operation or under construction; satellites equal to or greater than 50kg.

THE SATELLITE VALUE CHAIN© Euroconsult 2017 - Unauthorized reproduction is a copyright violation
SATELLITES LAUNCHED BY APPLICATION (2007-2016)
Earth Observation(27%)
Satcom(41%)
Security(7%)
963satellites
Science(6%)
Exploration (3%)
Navigation(11%)
Technology(6%)
# satellites
Commercial
Civil government
Military
SATELLITE MANUFACTURING & LAUNCH SERVICES
SATELLITES LAUNCHED OVER THE DECADE
SATELLITES LAUNCHED BY CLIENT (2007-2016) SATELLITES LAUNCHED BY REGION OF OPERATORS (2007-2016)
Europe(16%)
963 satellites
North America(31%)
Latin America(2%)
Russia &Central Asia
(18%)
Middle East & Africa(5%)
Asia & Oceania(29%)
• A total of 963 satellites have been launched worldwide over the decadeby government agencies and commercial clients, i.e. an average of 96units/year. The rise of small satellites and mega constellations in the next10 years will dramatically increase this number.
• Governments remain the primary client of the space industry, launching80% of the 963 satellites during the decade (i.e., 771 units). However,due to the rise of constellations, commercial satellites are expected toreplace government satellites as the largest market next decade.
• Telecommunication is the largest application, with 375 satelliteslaunched over 2007-2016, while Earth observation programs launched259 satellites. Together these two applications accounted for 68% of thetotal. The remaining six applications together accounted for 329satellites.
• Asia/Oceania and North America launched together 578 satellites (60%of the global total), predominantly for governments. North America ledthe commercial demand, with 129 of 252 total global satellites.
0
20
40
60
80
100
120
2007 2008 2009 2010 2011 2012 2013 2014 2015 2016

THE SATELLITE VALUE CHAIN© Euroconsult 2017 - Unauthorized reproduction is a copyright violation
North America(37%)
Latin America(7%)
Europe(19%)
Middle East & Africa(22%)
Asia & Oceania(15%)
$1.47billion
North America(19%)
Latin America(13%)
Europe(20%)
Russia & Central Asia(5%)
Middle East & Africa(16%)
Asia & Oceania(27%)
$10.9billion
SATELLITE COMMUNICATIONS
SATELLITE OPERATORS
SATELLITE OPERATORS WHOLESALE REVENUE (2007-2016)
MSS WHOLESALE REVENUE BY REGION (2016)
FSS WHOLESALE REVENUE BY REGION (2016)
$ in billion
FSS
MSS
0
2
4
6
8
10
12
14
2007 2008 2009 2010 2011 2012 2013 2014 2015 2016
• The wholesale of satellite capacity is the primary revenue source for bothFSS and MSS operators. After the significant drop in revenues recorded in2015 (more than 5% decrease), total wholesale revenue from satelliteoperators slightly decreased by -0.7% in 2016 and reached $12.4 billion. Thereduction was entirely due to a decline in FSS operators revenue, whichnevertheless accounted for ~88% of total wholesale revenues.
• Following a period of limited growth for the FSS industry in recent years,revenues declined by ~7% in 2015 and 0.8% in 2016, to $10.9 billion. Whilethe strengthening of the U.S. dollar explained a significant part of thedecrease in 2015, it played a marginal role in 2016. The decline was entirelydriven by the fierce price competition throughout the year with theoversupply of regular satellite capacity, exacerbated by the rapid expansionof HTS capacity.
• Total MSS wholesale revenue reached $1.47 billion in 2016, with a 0.8%growth y-o-y. The speed for MSS operators to adapt to the new marketenvironments (new product, new pricing, new distribution, etc.) has helpedMSS operators to control the churn to VSAT and terrestrial competitors.

THE SATELLITE VALUE CHAIN© Euroconsult 2017 - Unauthorized reproduction is a copyright violation
EARTH OBSERVATION
COMMERCIAL DATA MARKET
COMMERCIAL DATA SALES: OPTICAL & RADAR (2007-2016)
COMMERCIAL DATA SALES: END-USERS (2007-2016)
COMMERCIAL DATA PRICES*
• The commercial data market totaled $1.8 billion in 2016; this represents7% growth over 2015 and a five-year CAGR of 5%.
• Defense markets dominate, topping $1.1 billion in 2016. Non-U.S.defense spending continues to grow strongly, reaching $712 million in2016 for a five-year CAGR of 10%.
• The VHR optical data market is valued at $1.2 billion, primarily defense-driven. Very High-Resolution and High- to Moderate-Resolutionaccount for 83% of the total market.
• The remaining 17% corresponds to SAR data. SAR has not experiencedthe same ramp-up in sales as optical data; however, in specificapplication areas, such as maritime domain awareness, it is gainingmore traction. Higher SAR data costs also remain an issue.
• Data pricing is driven by ground resolution and geolocation accuracy:higher resolution and accuracy = more complex and costly systems.
Reve
nues
($ m
illio
n)
SAR
High-medium resolution (>1 m)
Very high resolution(≤1 m)
Reve
nues
($ m
illio
n)
Non-Defense market
Non-U.S. Defense
U.S. Defense
* Newly acquired Level 1 data, data prices from the last 12 months and refers to standard tasking catalogue price only
$/km²
Note: New TSX commercial mode at0.25m resolution is not included here;priced at approximately $500/km²
Highest resolution has different
prices according to SAR-band:
highest prices are X-band, then C-
and L-bands
Pressure on price data for high–moderate resolution
data, less stringent on geolocation accuracy
The lower the resolution of SAR, the more similar in price to optical
Shift toward
higher res. and
accuracy
OpticalSAR
ground resolution (in m)
THE SATELLITE VALUE CHAIN© Euroconsult 2017 - Unauthorized reproduction is a copyright violation
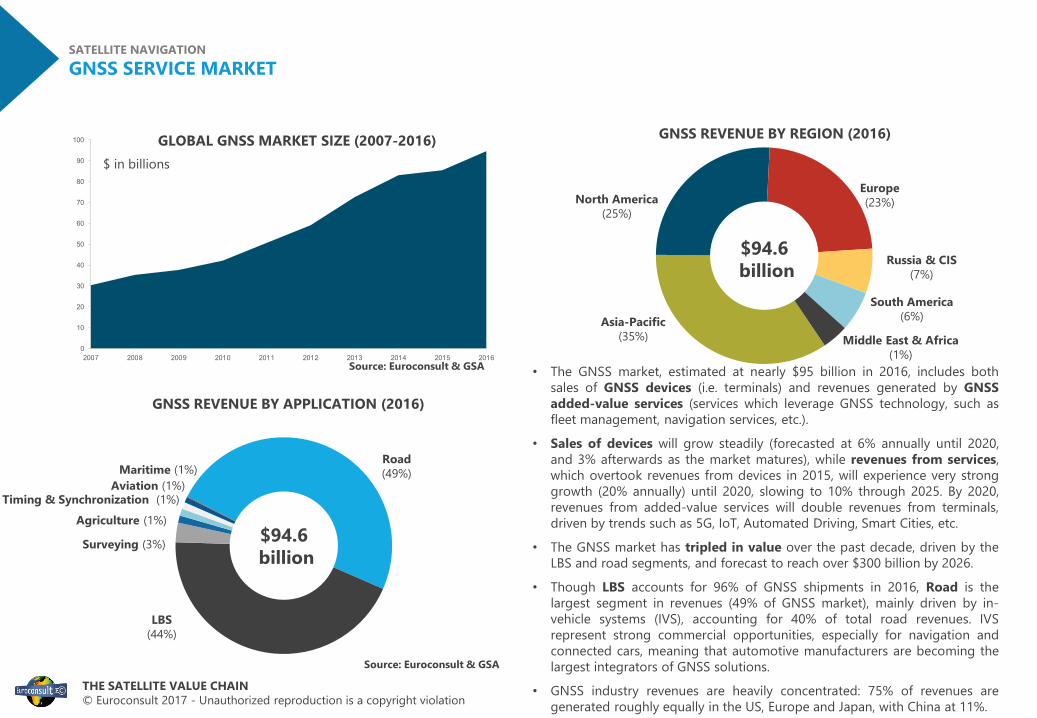
• The GNSS market, estimated at nearly $95 billion in 2016, includes bothsales of GNSS devices (i.e. terminals) and revenues generated by GNSSadded-value services (services which leverage GNSS technology, such asfleet management, navigation services, etc.).
• Sales of devices will grow steadily (forecasted at 6% annually until 2020,and 3% afterwards as the market matures), while revenues from services,which overtook revenues from devices in 2015, will experience very stronggrowth (20% annually) until 2020, slowing to 10% through 2025. By 2020,revenues from added-value services will double revenues from terminals,driven by trends such as 5G, IoT, Automated Driving, Smart Cities, etc.
• The GNSS market has tripled in value over the past decade, driven by theLBS and road segments, and forecast to reach over $300 billion by 2026.
• Though LBS accounts for 96% of GNSS shipments in 2016, Road is thelargest segment in revenues (49% of GNSS market), mainly driven by in-vehicle systems (IVS), accounting for 40% of total road revenues. IVSrepresent strong commercial opportunities, especially for navigation andconnected cars, meaning that automotive manufacturers are becoming thelargest integrators of GNSS solutions.
• GNSS industry revenues are heavily concentrated: 75% of revenues aregenerated roughly equally in the US, Europe and Japan, with China at 11%.
SATELLITE NAVIGATION
GNSS SERVICE MARKET
GLOBAL GNSS MARKET SIZE (2007-2016)
GNSS REVENUE BY APPLICATION (2016)
GNSS REVENUE BY REGION (2016)
Source: Euroconsult & GSA
Road (49%)Maritime (1%)
Aviation (1%)
LBS (44%)
Agriculture (1%)
Surveying (3%) $94.6billion
Source: Euroconsult & GSA
$ in billions
$94.6billion
Asia-Pacific (35%)
North America (25%)
Europe (23%)
Russia & CIS (7%)
South America(6%)
Middle East & Africa(1%)
Timing & Synchronization (1%)
0
10
20
30
40
50
60
70
80
90
100
2007 2008 2009 2010 2011 2012 2013 2014 2015 2016

THE SATELLITE VALUE CHAIN© Euroconsult 2017 - Unauthorized reproduction is a copyright violation
ABOUT EUROCONSULT // CONSULTING & RESEARCH REPORTS
Satellite Communications for Defense & Security
Prospects for In-Flight Entertainment & Connectivity
Government Space Programs: Benchmarks, Profiles & Forecasts
High Throughput Satellites: Vertical Market Analysis & Forecasts
Prospects for the Small Satellite Market
Prospects for L-Band, IoT & M2M Markets
Satellite Communications & Broadcasting Markets Survey
Satellites to be Built & Launched by 2026
Satellite-Based Earth Observation
Satellite Value Chain: Snapshot 2017
CONSULTING 2017 RESEARCH REPORTS
BUSINESS STRATEGY
Independent business case assessments • Pricing valuations • Revenue forecasts & DCF modeling • Feasibility study
DUE DILIGENCE
GOVERNMENT POLICY
PROGRAM MANAGEMENT
Market analysis & forecasts • Competitive analysis & benchmarking • Customer surveys • SWOT assessment
Policy & program evaluation • Impact assessments • Socio-economic & cost benefit analysis • International benchmarking and best practices
Program specifications & procurement • Management and process optimization • Marketing and sales strategy
THE SATELLITE VALUE CHAIN© Euroconsult 2017 - Unauthorized reproduction is a copyright violation
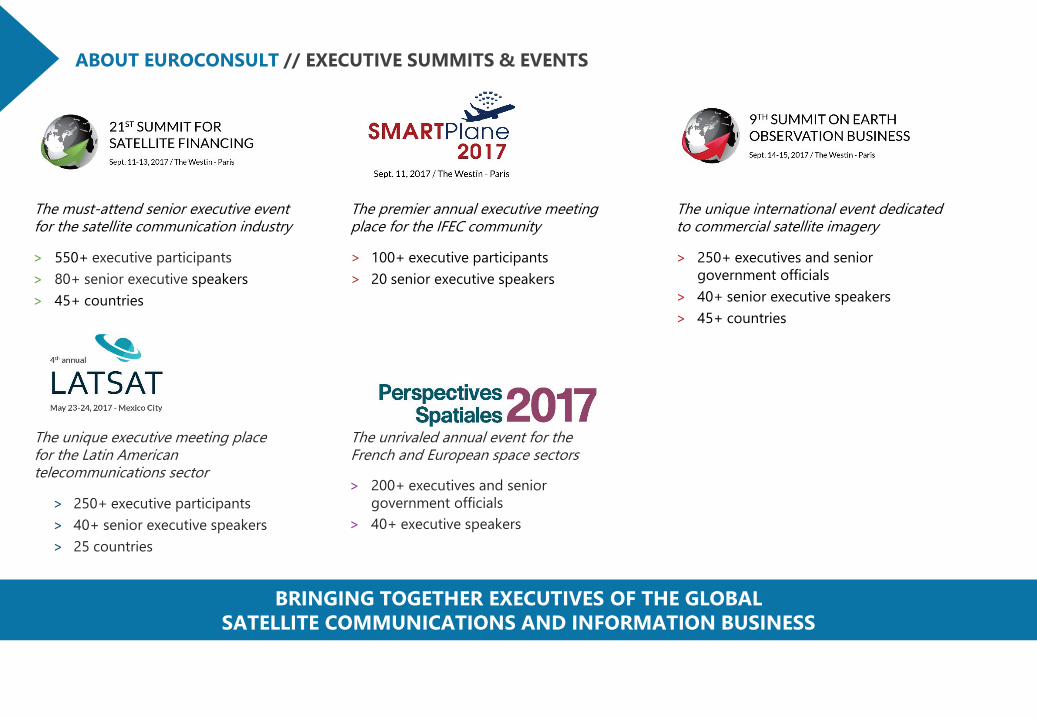
ABOUT EUROCONSULT // EXECUTIVE SUMMITS & EVENTS
The must-attend senior executive event for the satellite communication industry
> 550+ executive participants> 80+ senior executive speakers> 45+ countries
The unique executive meeting place for the Latin American telecommunications sector
> 250+ executive participants> 40+ senior executive speakers> 25 countries
BRINGING TOGETHER EXECUTIVES OF THE GLOBALSATELLITE COMMUNICATIONS AND INFORMATION BUSINESS
The premier annual executive meeting place for the IFEC community
> 100+ executive participants> 20 senior executive speakers
The unique international event dedicated to commercial satellite imagery
> 250+ executives and senior government officials
> 40+ senior executive speakers> 45+ countries
The unrivaled annual event for the French and European space sectors
> 200+ executives and senior government officials
> 40+ executive speakers
THE SATELLITE VALUE CHAIN© Euroconsult 2017 - Unauthorized reproduction is a copyright violation
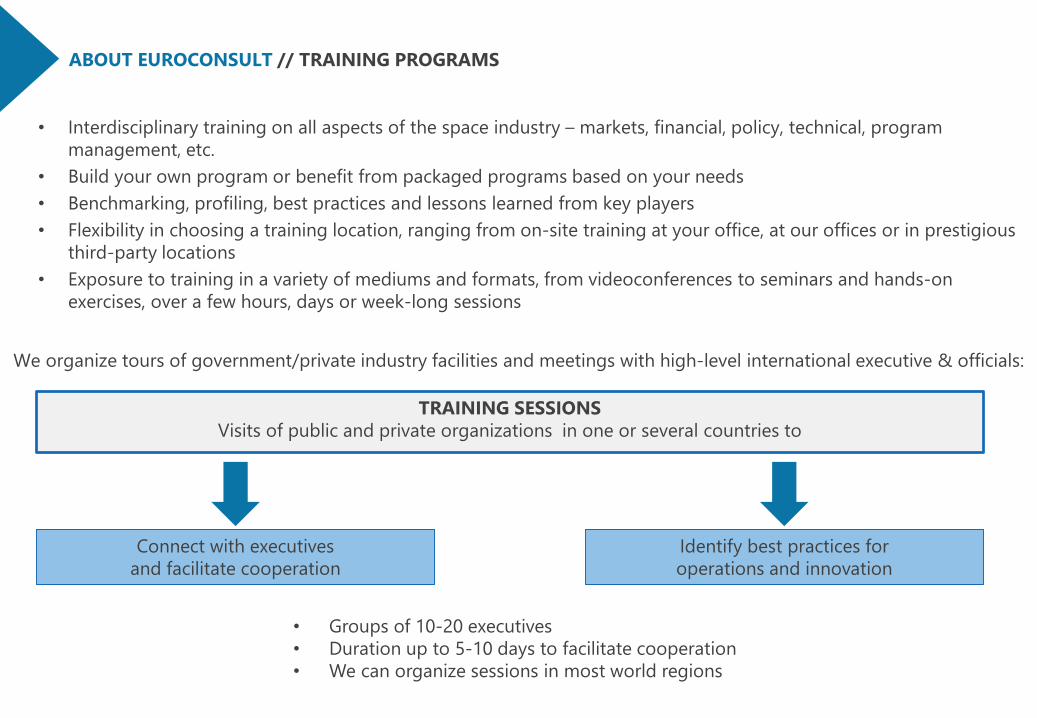
Connect with executives and facilitate cooperation
Identify best practices for operations and innovation
• Groups of 10-20 executives• Duration up to 5-10 days to facilitate cooperation• We can organize sessions in most world regions
TRAINING SESSIONSVisits of public and private organizations in one or several countries to
We organize tours of government/private industry facilities and meetings with high-level international executive & officials:
• Interdisciplinary training on all aspects of the space industry – markets, financial, policy, technical, program management, etc.
• Build your own program or benefit from packaged programs based on your needs• Benchmarking, profiling, best practices and lessons learned from key players• Flexibility in choosing a training location, ranging from on-site training at your office, at our offices or in prestigious
third-party locations• Exposure to training in a variety of mediums and formats, from videoconferences to seminars and hands-on
exercises, over a few hours, days or week-long sessions
ABOUT EUROCONSULT // TRAINING PROGRAMS

THE SATELLITE VALUE CHAIN© Euroconsult 2017 - Unauthorized reproduction is a copyright violation
CONNECT WITH US
www.euroconsult-ec.comHEADQUARTERS | FRANCE86 Boulevard de Sebastopol75003 ParisTel: +33 (1) 49 23 75 30
U.S.A.4601 N. Fairfax Drive, Suite 1200Arlington, VA 22203Tel: +1 (703) 520-6415
CANADA465 Rue McGill, Suite 1103Montreal (QC) H2Y 2H1Tel: +1 (514) 750-9698
JAPAN1-5-212, Iwaicho, HodogayaYokohama, 240-0023Tel: +81 80 2052 1348