saul and lumley - geo2014-0226
TRANSCRIPT
The combined effects of pressure and cementation on 4D seismic data
Matthew Saul1 and David Lumley2
ABSTRACT
Time-lapse seismology has proven to be a useful method formonitoring reservoir fluid flow, identifying unproduced hydrocar-bons and injected fluids, and improving overall reservoir manage-ment decisions. The large magnitudes of observed time-lapseseismic anomalies associated with strong pore pressure increasesare sometimes not explainable by velocity-pressure relationshipsdetermined by fitting elastic theory to core data. This can lead todifficulties in interpreting time-lapse seismic data in terms ofphysically realizable changes in reservoir properties during injec-tion. It is commonly assumed that certain geologic properties re-main constant during fluid production/injection, including rockporosity and grain cementation. We have developed a new non-elastic method based on rock physics diagnostics to describethe pressure sensitivity of rock properties that includes changes
in the grain contact cement, and we applied the method to a 4Dseismic data example from offshore Australia. We found thatwater injection at high pore pressure may mechanically weakenthe poorly consolidated reservoir sands in a nonelastic manner,allowing us to explain observed 4D seismic signals that are largerthan can be predicted by elastic theory fits to the core data. Acomparison of our new model with the observed 4D seismic re-sponse around a large water injector suggested a significantmechanical weakening of the reservoir rock, consistent with a de-crease in the effective grain contact cement from 2.5% at the time/pressure of the preinjection baseline survey, to 0.75% at the time/pressure of the monitor survey. This approach may enable moreaccurate interpretations and future predictions of the 4D signal forsubsequent monitor surveys and improve 4D feasibility and in-terpretation studies in other reservoirs with geomechanicallysimilar rocks.
INTRODUCTION
Understanding how the elastic properties of sedimentary rockvary as a function of effective pressure is required to determinethe feasibility of time-lapse (4D) seismic monitoring (e.g., Lumleyet al., 1997, 2000; Meadows et al., 2002; Avseth et al., 2005; Lum-ley, 2010), and to qualify/quantify the observed 4D seismic anoma-lies (e.g., Lumley, 1995, 2001; Tura and Lumley, 1999; Landrø,2001; Lumley et al., 2003). In unconsolidated sediments, it has beenshown that elastic and nonelastic changes (e.g., grain packing andporosity) occur with variations in the effective pressure (e.g.,Zimmer, 2003; Hatchell and Bourne, 2005; Saul and Lumley,2013). Conversely, in cemented rocks, it is generally assumed thatcertain rock properties remain constant with changes in the effectivepressure, such as porosity and the volume of contact cement (e.g.,Avseth and Skjei, 2011). Given these assumptions, it is generally
accepted that cemented rocks are less sensitive to changes in effec-tive pressure than uncemented sediments, and thus weaker 4D seis-mic anomalies are expected (e.g., Avseth and Skjei, 2011; Saul andLumley, 2013). However, if changes in effective pressure associatedwith production/injection were large enough for the reservoir rockto geomechanically weaken or fail (e.g., fracture or break grain con-tact cement), stronger 4D seismic anomalies could be expected,even greater than if the reservoir sands were assumed to beuncemented.In this paper, we analyze time-lapse seismic data acquired over a
high-pressure water injector in the Enfield oil field, Australia. Ob-served amplitude and time-shift anomalies associated with high-pressure water injection are much greater than those predictedby velocity-pressure relationships determined by fitting elastictheory to core data. For this reason, we develop a nonelastic methodbased on rock physics diagnostics and grain contact-cement
Manuscript received by the Editor 13 May 2014; revised manuscript received 4 November 2014; published online 11 March 2015.1Formerly The University of Western Australia, School of Earth and Environment, Crawley, Australia; presently Chevron Australia, Perth, Australia. E-mail:
[email protected] University of Western Australia, School of Earth and Environment, Crawley, Australia. E-mail: [email protected].© 2015 Society of Exploration Geophysicists. All rights reserved.
WA135
GEOPHYSICS, VOL. 80, NO. 2 (MARCH-APRIL 2015); P. WA135–WA148, 18 FIGS.10.1190/GEO2014-0226.1
Dow
nloa
ded
04/1
9/15
to 1
46.2
3.17
8.14
0. R
edist
ribut
ion
subj
ect t
o SE
G li
cens
e or
cop
yrig
ht; s
ee T
erm
s of U
se a
t http
://lib
rary
.seg.
org/
volume in an attempt to explain the very large time-lapse seismicanomalies. To do this, we extend work by Smith et al. (2008,2010) to better understand the sensitivity of the Enfield reservoirsandstones to changes in effective pressure. We also perform rockphysics diagnostics (Dvorkin and Nur, 1996; Avseth et al., 2000) toinfer the amount of contact cement within the sands. We then showhow these rock physics diagnostics can guide the analysis of pres-sure sensitivity within the reservoir sands, and we discuss theimplications for 4D seismic monitoring of high-pressure waterinjection.
CASE STUDY BACKGROUND
Field overview
We illustrate the effects of pressure and cementation on 4D seismicwith a field data case study from offshore northwestern Australia. TheEnfield oil and gas field is an active water-flood project located ap-proximately 40 km northwest of Exmouth, offshore Western Aus-tralia. The Enfield reservoir is within the Upper Jurassic Tithonianto Lower Cretaceous Berriasian age Macedon Member. The reservoiris composed of generally clean, high-permeability, unconsolidatedto partially consolidated sandstones (Ali et al., 2008; Hamp et al.,2008). Early feasibility work indicated that rock properties werefavorable for time-lapse seismic monitoring, and so a dedicated base-line seismic survey (baseline) was acquired prior to the commence-ment of production in mid 2006 (Ridsdill-Smith et al., 2007; Smithet al., 2008). The field was initially developed through five subseaproduction wells, six water injection wells, and two gas reinjectionwells. Three of the water injection wells are located downdip at theoil-water contact (OWC) to provide pressure support (Ali et al., 2008;
Hamp et al., 2008). Water was initially injected above a fracture pres-sure of approximately 1000–1500 psi (6.9–10.3 MPa) above the ini-tial reservoir pressure (Wulff et al., 2008; Smith et al., 2010). The firstmonitor survey (M1) was acquired seven months after the start ofproduction. Excellent repeatability was achieved with an average nor-malized root mean square (NRMS) of less than 20% (Ridsdill-Smithet al., 2007; Ali et al., 2008).
Summary of initial 4D feasibility study
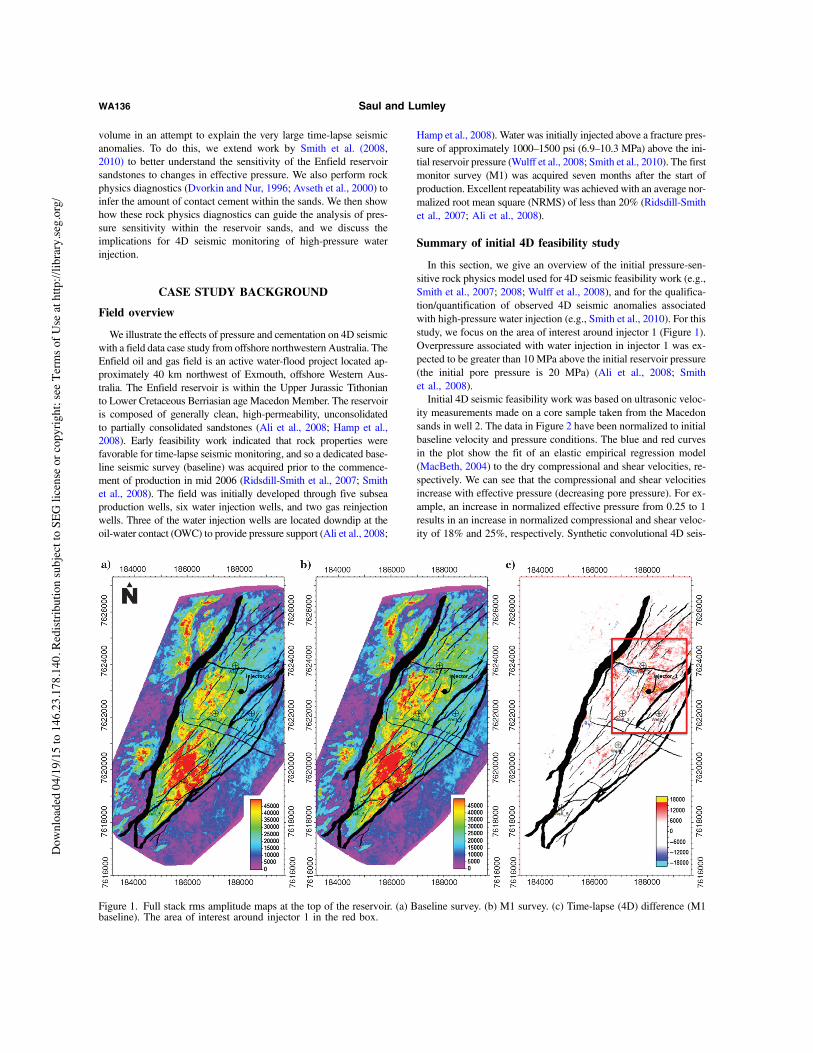
In this section, we give an overview of the initial pressure-sen-sitive rock physics model used for 4D seismic feasibility work (e.g.,Smith et al., 2007; 2008; Wulff et al., 2008), and for the qualifica-tion/quantification of observed 4D seismic anomalies associatedwith high-pressure water injection (e.g., Smith et al., 2010). For thisstudy, we focus on the area of interest around injector 1 (Figure 1).Overpressure associated with water injection in injector 1 was ex-pected to be greater than 10 MPa above the initial reservoir pressure(the initial pore pressure is 20 MPa) (Ali et al., 2008; Smithet al., 2008).Initial 4D seismic feasibility work was based on ultrasonic veloc-
ity measurements made on a core sample taken from the Macedonsands in well 2. The data in Figure 2 have been normalized to initialbaseline velocity and pressure conditions. The blue and red curvesin the plot show the fit of an elastic empirical regression model(MacBeth, 2004) to the dry compressional and shear velocities, re-spectively. We can see that the compressional and shear velocitiesincrease with effective pressure (decreasing pore pressure). For ex-ample, an increase in normalized effective pressure from 0.25 to 1results in an increase in normalized compressional and shear veloc-ity of 18% and 25%, respectively. Synthetic convolutional 4D seis-
Figure 1. Full stack rms amplitude maps at the top of the reservoir. (a) Baseline survey. (b) M1 survey. (c) Time-lapse (4D) difference (M1baseline). The area of interest around injector 1 in the red box.
WA136 Saul and Lumley
Dow
nloa
ded
04/1
9/15
to 1
46.2
3.17
8.14
0. R
edist
ribut
ion
subj
ect t
o SE
G li
cens
e or
cop
yrig
ht; s
ee T
erm
s of U
se a
t http
://lib
rary
.seg.
org/
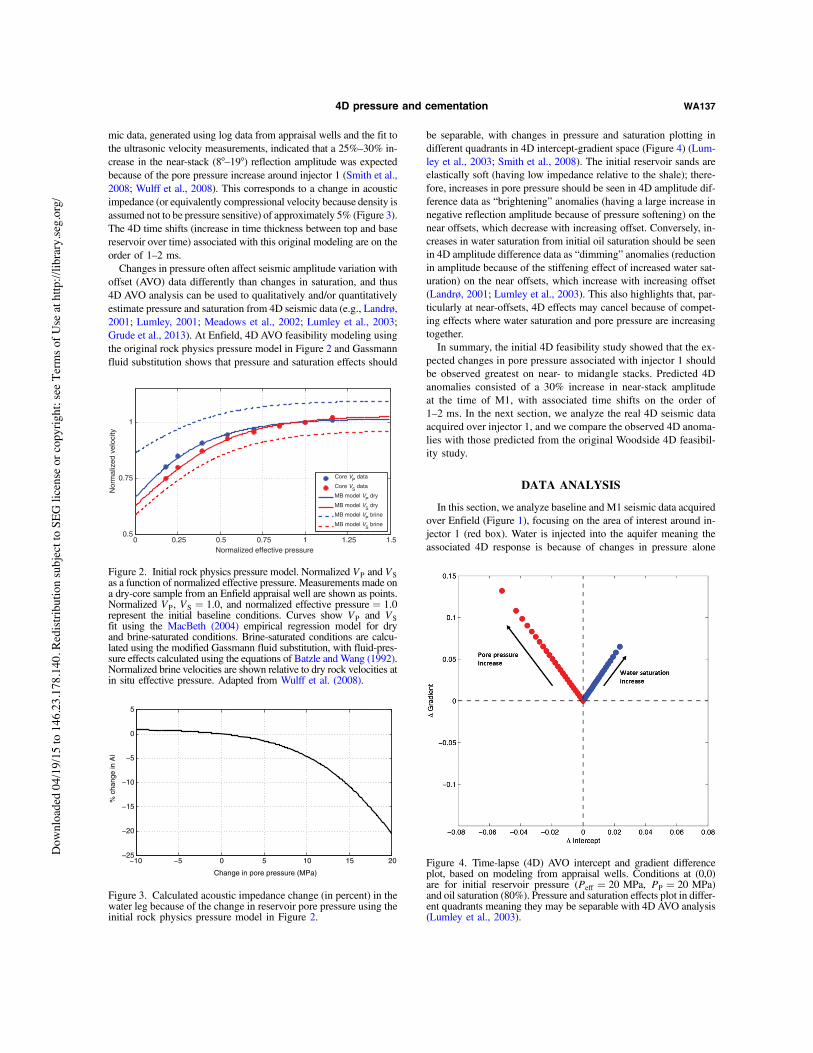
mic data, generated using log data from appraisal wells and the fit tothe ultrasonic velocity measurements, indicated that a 25%–30% in-crease in the near-stack (8°–19°) reflection amplitude was expectedbecause of the pore pressure increase around injector 1 (Smith et al.,2008; Wulff et al., 2008). This corresponds to a change in acousticimpedance (or equivalently compressional velocity because density isassumed not to be pressure sensitive) of approximately 5% (Figure 3).The 4D time shifts (increase in time thickness between top and basereservoir over time) associated with this original modeling are on theorder of 1–2 ms.Changes in pressure often affect seismic amplitude variation with
offset (AVO) data differently than changes in saturation, and thus4D AVO analysis can be used to qualitatively and/or quantitativelyestimate pressure and saturation from 4D seismic data (e.g., Landrø,2001; Lumley, 2001; Meadows et al., 2002; Lumley et al., 2003;Grude et al., 2013). At Enfield, 4D AVO feasibility modeling usingthe original rock physics pressure model in Figure 2 and Gassmannfluid substitution shows that pressure and saturation effects should
be separable, with changes in pressure and saturation plotting indifferent quadrants in 4D intercept-gradient space (Figure 4) (Lum-ley et al., 2003; Smith et al., 2008). The initial reservoir sands areelastically soft (having low impedance relative to the shale); there-fore, increases in pore pressure should be seen in 4D amplitude dif-ference data as “brightening” anomalies (having a large increase innegative reflection amplitude because of pressure softening) on thenear offsets, which decrease with increasing offset. Conversely, in-creases in water saturation from initial oil saturation should be seenin 4D amplitude difference data as “dimming” anomalies (reductionin amplitude because of the stiffening effect of increased water sat-uration) on the near offsets, which increase with increasing offset(Landrø, 2001; Lumley et al., 2003). This also highlights that, par-ticularly at near-offsets, 4D effects may cancel because of compet-ing effects where water saturation and pore pressure are increasingtogether.In summary, the initial 4D feasibility study showed that the ex-
pected changes in pore pressure associated with injector 1 shouldbe observed greatest on near- to midangle stacks. Predicted 4Danomalies consisted of a 30% increase in near-stack amplitudeat the time of M1, with associated time shifts on the order of1–2 ms. In the next section, we analyze the real 4D seismic dataacquired over injector 1, and we compare the observed 4D anoma-lies with those predicted from the original Woodside 4D feasibil-ity study.
DATA ANALYSIS
In this section, we analyze baseline and M1 seismic data acquiredover Enfield (Figure 1), focusing on the area of interest around in-jector 1 (red box). Water is injected into the aquifer meaning theassociated 4D response is because of changes in pressure alone
−10 −5 0 5 10 15 20−25
−20
−15
−10
−5
0
5
Change in pore pressure (MPa)
% c
hang
e in
AI
Figure 3. Calculated acoustic impedance change (in percent) in thewater leg because of the change in reservoir pore pressure using theinitial rock physics pressure model in Figure 2.
0 0.25 0.5 0.75 1 1.25 1.50.5
0.75
1
Normalized effective pressure
Nor
mal
ized
vel
ocity
Core VP data
Core VS data
MB model VP dry
MB model VS dry
MB model VP brine
MB model VS brine
Figure 2. Initial rock physics pressure model. Normalized VP and VSas a function of normalized effective pressure. Measurements made ona dry-core sample from an Enfield appraisal well are shown as points.Normalized VP, VS ¼ 1.0, and normalized effective pressure ¼ 1.0represent the initial baseline conditions. Curves show VP and VSfit using the MacBeth (2004) empirical regression model for dryand brine-saturated conditions. Brine-saturated conditions are calcu-lated using the modified Gassmann fluid substitution, with fluid-pres-sure effects calculated using the equations of Batzle and Wang (1992).Normalized brine velocities are shown relative to dry rock velocities atin situ effective pressure. Adapted from Wulff et al. (2008).
Figure 4. Time-lapse (4D) AVO intercept and gradient differenceplot, based on modeling from appraisal wells. Conditions at (0,0)are for initial reservoir pressure (Peff ¼ 20 MPa, PP ¼ 20 MPa)and oil saturation (80%). Pressure and saturation effects plot in differ-ent quadrants meaning they may be separable with 4D AVO analysis(Lumley et al., 2003).
4D pressure and cementation WA137
Dow
nloa
ded
04/1
9/15
to 1
46.2
3.17
8.14
0. R
edist
ribut
ion
subj
ect t
o SE
G li
cens
e or
cop
yrig
ht; s
ee T
erm
s of U
se a
t http
://lib
rary
.seg.
org/
because the salinity of the injected seawater is similar to the forma-tion water (∼33; 000 ppm). This simplifies the study in the aquiferbecause we do not need to consider the combination of pressure andsaturation effects in the 4D seismic data. At the time of acquisitionof M1, downhole pressure gauges in injector 1 showed the mea-sured pore-pressure increase associated with water injection tobe 1700 psi (11.7 MPa) above the initial reservoir pressure of∼20 MPa (Wulff et al., 2008).
4D amplitudes and time shifts
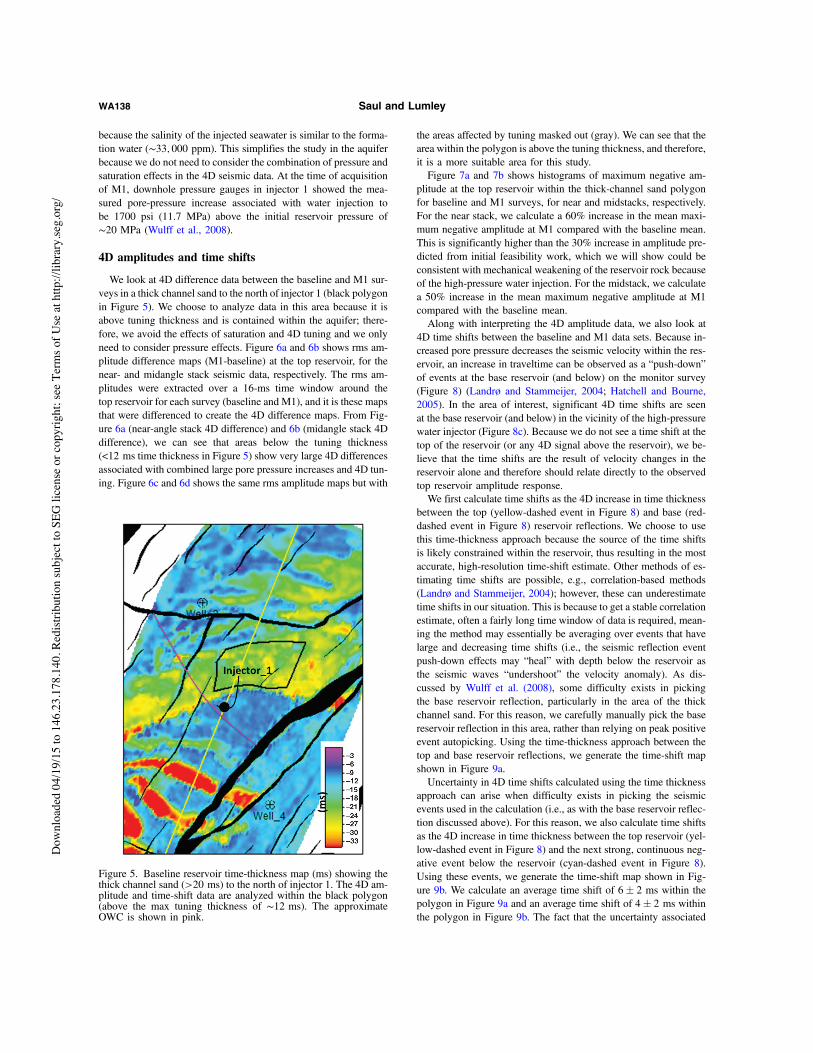
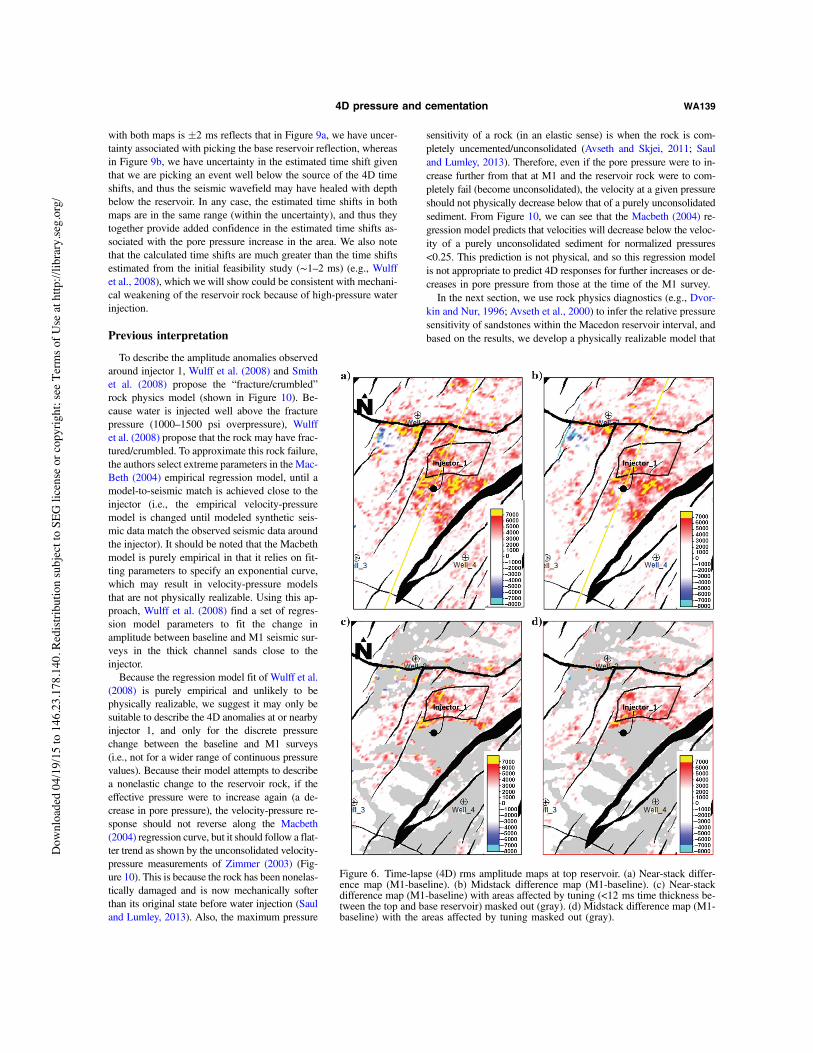
We look at 4D difference data between the baseline and M1 sur-veys in a thick channel sand to the north of injector 1 (black polygonin Figure 5). We choose to analyze data in this area because it isabove tuning thickness and is contained within the aquifer; there-fore, we avoid the effects of saturation and 4D tuning and we onlyneed to consider pressure effects. Figure 6a and 6b shows rms am-plitude difference maps (M1-baseline) at the top reservoir, for thenear- and midangle stack seismic data, respectively. The rms am-plitudes were extracted over a 16-ms time window around thetop reservoir for each survey (baseline and M1), and it is these mapsthat were differenced to create the 4D difference maps. From Fig-ure 6a (near-angle stack 4D difference) and 6b (midangle stack 4Ddifference), we can see that areas below the tuning thickness(<12 ms time thickness in Figure 5) show very large 4D differencesassociated with combined large pore pressure increases and 4D tun-ing. Figure 6c and 6d shows the same rms amplitude maps but with
the areas affected by tuning masked out (gray). We can see that thearea within the polygon is above the tuning thickness, and therefore,it is a more suitable area for this study.Figure 7a and 7b shows histograms of maximum negative am-
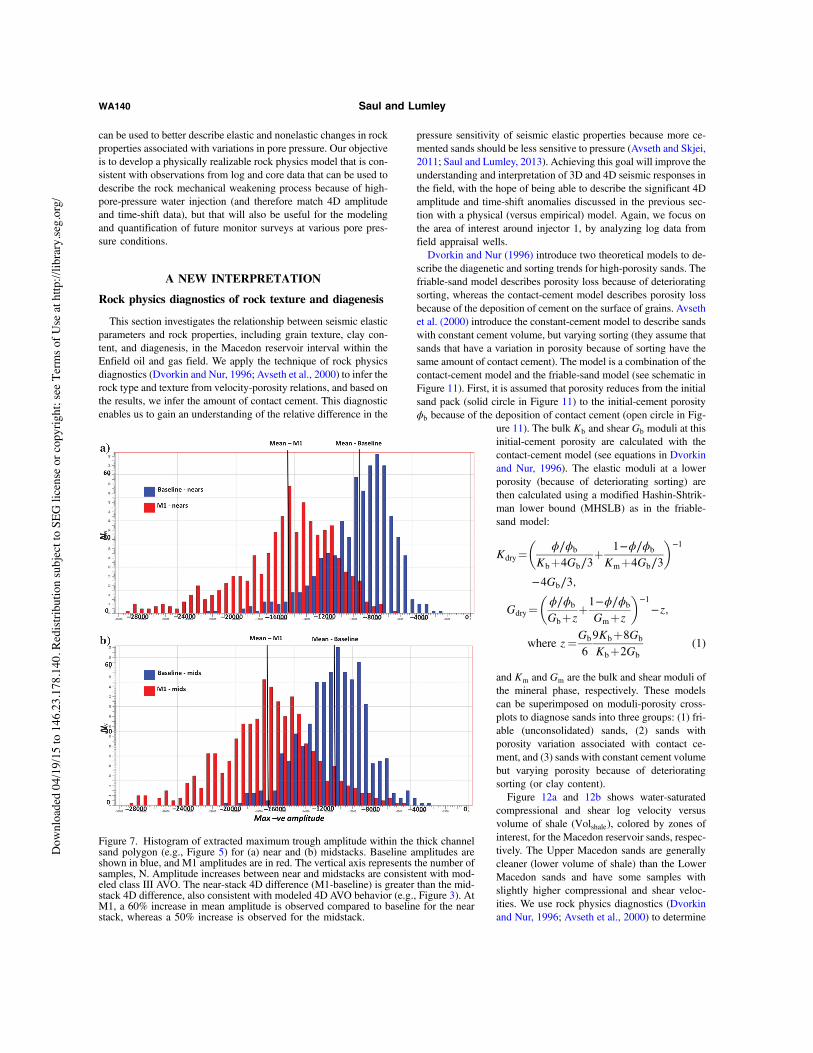
plitude at the top reservoir within the thick-channel sand polygonfor baseline and M1 surveys, for near and midstacks, respectively.For the near stack, we calculate a 60% increase in the mean maxi-mum negative amplitude at M1 compared with the baseline mean.This is significantly higher than the 30% increase in amplitude pre-dicted from initial feasibility work, which we will show could beconsistent with mechanical weakening of the reservoir rock becauseof the high-pressure water injection. For the midstack, we calculatea 50% increase in the mean maximum negative amplitude at M1compared with the baseline mean.Along with interpreting the 4D amplitude data, we also look at
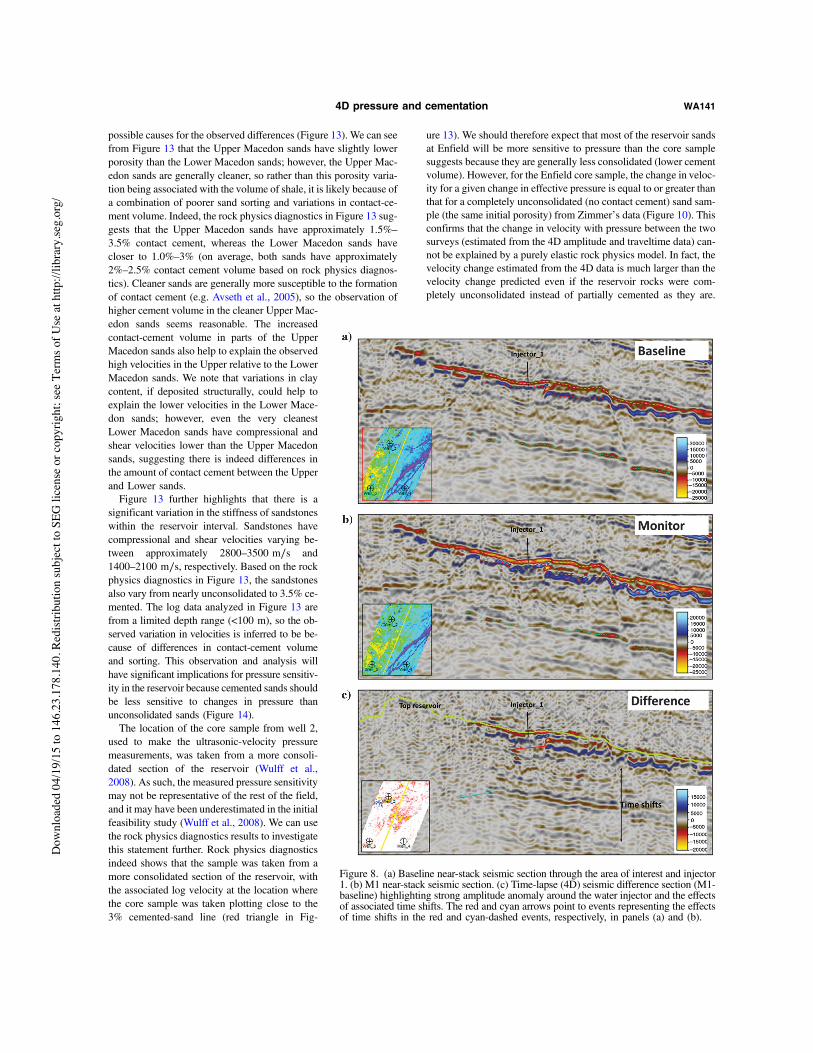
4D time shifts between the baseline and M1 data sets. Because in-creased pore pressure decreases the seismic velocity within the res-ervoir, an increase in traveltime can be observed as a “push-down”of events at the base reservoir (and below) on the monitor survey(Figure 8) (Landrø and Stammeijer, 2004; Hatchell and Bourne,2005). In the area of interest, significant 4D time shifts are seenat the base reservoir (and below) in the vicinity of the high-pressurewater injector (Figure 8c). Because we do not see a time shift at thetop of the reservoir (or any 4D signal above the reservoir), we be-lieve that the time shifts are the result of velocity changes in thereservoir alone and therefore should relate directly to the observedtop reservoir amplitude response.We first calculate time shifts as the 4D increase in time thickness
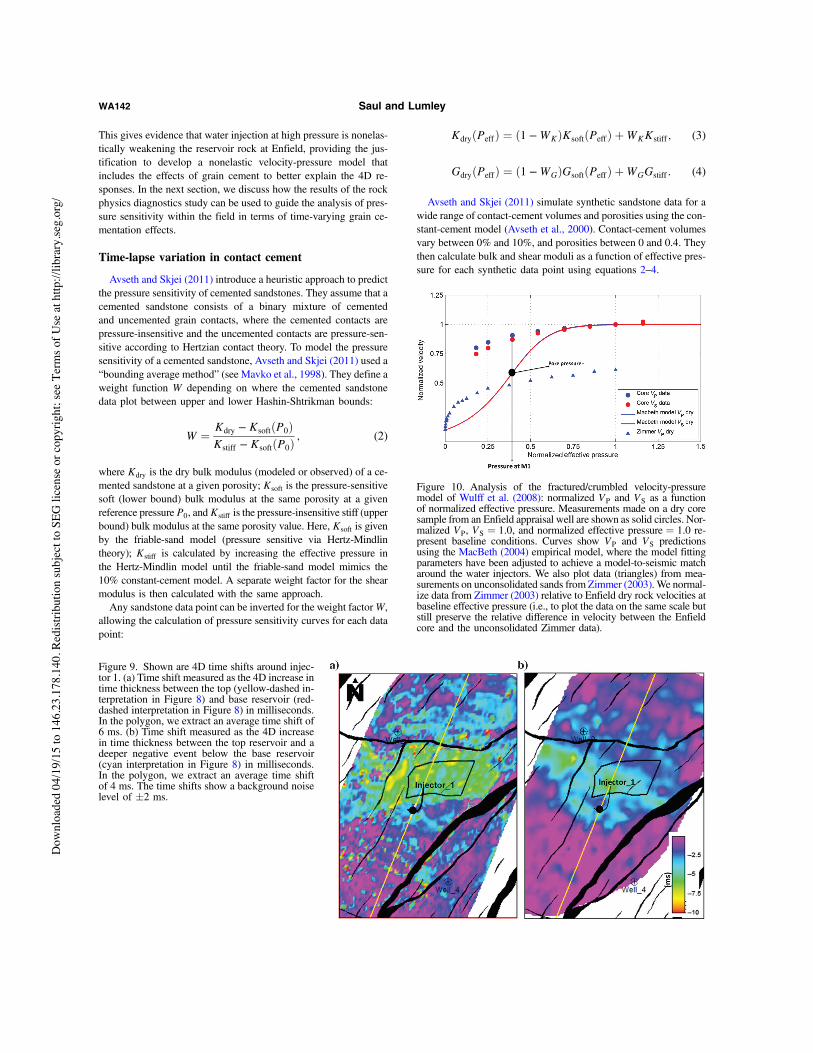
between the top (yellow-dashed event in Figure 8) and base (red-dashed event in Figure 8) reservoir reflections. We choose to usethis time-thickness approach because the source of the time shiftsis likely constrained within the reservoir, thus resulting in the mostaccurate, high-resolution time-shift estimate. Other methods of es-timating time shifts are possible, e.g., correlation-based methods(Landrø and Stammeijer, 2004); however, these can underestimatetime shifts in our situation. This is because to get a stable correlationestimate, often a fairly long time window of data is required, mean-ing the method may essentially be averaging over events that havelarge and decreasing time shifts (i.e., the seismic reflection eventpush-down effects may “heal” with depth below the reservoir asthe seismic waves “undershoot” the velocity anomaly). As dis-cussed by Wulff et al. (2008), some difficulty exists in pickingthe base reservoir reflection, particularly in the area of the thickchannel sand. For this reason, we carefully manually pick the basereservoir reflection in this area, rather than relying on peak positiveevent autopicking. Using the time-thickness approach between thetop and base reservoir reflections, we generate the time-shift mapshown in Figure 9a.Uncertainty in 4D time shifts calculated using the time thickness
approach can arise when difficulty exists in picking the seismicevents used in the calculation (i.e., as with the base reservoir reflec-tion discussed above). For this reason, we also calculate time shiftsas the 4D increase in time thickness between the top reservoir (yel-low-dashed event in Figure 8) and the next strong, continuous neg-ative event below the reservoir (cyan-dashed event in Figure 8).Using these events, we generate the time-shift map shown in Fig-ure 9b. We calculate an average time shift of 6" 2 ms within thepolygon in Figure 9a and an average time shift of 4" 2 ms withinthe polygon in Figure 9b. The fact that the uncertainty associated
Figure 5. Baseline reservoir time-thickness map (ms) showing thethick channel sand (>20 ms) to the north of injector 1. The 4D am-plitude and time-shift data are analyzed within the black polygon(above the max tuning thickness of ∼12 ms). The approximateOWC is shown in pink.
WA138 Saul and Lumley
Dow
nloa
ded
04/1
9/15
to 1
46.2
3.17
8.14
0. R
edist
ribut
ion
subj
ect t
o SE
G li
cens
e or
cop
yrig
ht; s
ee T
erm
s of U
se a
t http
://lib
rary
.seg.
org/
with both maps is "2 ms reflects that in Figure 9a, we have uncer-tainty associated with picking the base reservoir reflection, whereasin Figure 9b, we have uncertainty in the estimated time shift giventhat we are picking an event well below the source of the 4D timeshifts, and thus the seismic wavefield may have healed with depthbelow the reservoir. In any case, the estimated time shifts in bothmaps are in the same range (within the uncertainty), and thus theytogether provide added confidence in the estimated time shifts as-sociated with the pore pressure increase in the area. We also notethat the calculated time shifts are much greater than the time shiftsestimated from the initial feasibility study (∼1–2 ms) (e.g., Wulffet al., 2008), which we will show could be consistent with mechani-cal weakening of the reservoir rock because of high-pressure waterinjection.
Previous interpretation
To describe the amplitude anomalies observedaround injector 1, Wulff et al. (2008) and Smithet al. (2008) propose the “fracture/crumbled”rock physics model (shown in Figure 10). Be-cause water is injected well above the fracturepressure (1000–1500 psi overpressure), Wulffet al. (2008) propose that the rock may have frac-tured/crumbled. To approximate this rock failure,the authors select extreme parameters in the Mac-Beth (2004) empirical regression model, until amodel-to-seismic match is achieved close to theinjector (i.e., the empirical velocity-pressuremodel is changed until modeled synthetic seis-mic data match the observed seismic data aroundthe injector). It should be noted that the Macbethmodel is purely empirical in that it relies on fit-ting parameters to specify an exponential curve,which may result in velocity-pressure modelsthat are not physically realizable. Using this ap-proach, Wulff et al. (2008) find a set of regres-sion model parameters to fit the change inamplitude between baseline and M1 seismic sur-veys in the thick channel sands close to theinjector.Because the regression model fit of Wulff et al.
(2008) is purely empirical and unlikely to bephysically realizable, we suggest it may only besuitable to describe the 4D anomalies at or nearbyinjector 1, and only for the discrete pressurechange between the baseline and M1 surveys(i.e., not for a wider range of continuous pressurevalues). Because their model attempts to describea nonelastic change to the reservoir rock, if theeffective pressure were to increase again (a de-crease in pore pressure), the velocity-pressure re-sponse should not reverse along the Macbeth(2004) regression curve, but it should follow a flat-ter trend as shown by the unconsolidated velocity-pressure measurements of Zimmer (2003) (Fig-ure 10). This is because the rock has been nonelas-tically damaged and is now mechanically softerthan its original state before water injection (Sauland Lumley, 2013). Also, the maximum pressure
sensitivity of a rock (in an elastic sense) is when the rock is com-pletely uncemented/unconsolidated (Avseth and Skjei, 2011; Sauland Lumley, 2013). Therefore, even if the pore pressure were to in-crease further from that at M1 and the reservoir rock were to com-pletely fail (become unconsolidated), the velocity at a given pressureshould not physically decrease below that of a purely unconsolidatedsediment. From Figure 10, we can see that the Macbeth (2004) re-gression model predicts that velocities will decrease below the veloc-ity of a purely unconsolidated sediment for normalized pressures<0.25. This prediction is not physical, and so this regression modelis not appropriate to predict 4D responses for further increases or de-creases in pore pressure from those at the time of the M1 survey.In the next section, we use rock physics diagnostics (e.g., Dvor-
kin and Nur, 1996; Avseth et al., 2000) to infer the relative pressuresensitivity of sandstones within the Macedon reservoir interval, andbased on the results, we develop a physically realizable model that
Figure 6. Time-lapse (4D) rms amplitude maps at top reservoir. (a) Near-stack differ-ence map (M1-baseline). (b) Midstack difference map (M1-baseline). (c) Near-stackdifference map (M1-baseline) with areas affected by tuning (<12 ms time thickness be-tween the top and base reservoir) masked out (gray). (d) Midstack difference map (M1-baseline) with the areas affected by tuning masked out (gray).
4D pressure and cementation WA139
Dow
nloa
ded
04/1
9/15
to 1
46.2
3.17
8.14
0. R
edist
ribut
ion
subj
ect t
o SE
G li
cens
e or
cop
yrig
ht; s
ee T
erm
s of U
se a
t http
://lib
rary
.seg.
org/
can be used to better describe elastic and nonelastic changes in rockproperties associated with variations in pore pressure. Our objectiveis to develop a physically realizable rock physics model that is con-sistent with observations from log and core data that can be used todescribe the rock mechanical weakening process because of high-pore-pressure water injection (and therefore match 4D amplitudeand time-shift data), but that will also be useful for the modelingand quantification of future monitor surveys at various pore pres-sure conditions.
A NEW INTERPRETATION
Rock physics diagnostics of rock texture and diagenesis
This section investigates the relationship between seismic elasticparameters and rock properties, including grain texture, clay con-tent, and diagenesis, in the Macedon reservoir interval within theEnfield oil and gas field. We apply the technique of rock physicsdiagnostics (Dvorkin and Nur, 1996; Avseth et al., 2000) to infer therock type and texture from velocity-porosity relations, and based onthe results, we infer the amount of contact cement. This diagnosticenables us to gain an understanding of the relative difference in the
pressure sensitivity of seismic elastic properties because more ce-mented sands should be less sensitive to pressure (Avseth and Skjei,2011; Saul and Lumley, 2013). Achieving this goal will improve theunderstanding and interpretation of 3D and 4D seismic responses inthe field, with the hope of being able to describe the significant 4Damplitude and time-shift anomalies discussed in the previous sec-tion with a physical (versus empirical) model. Again, we focus onthe area of interest around injector 1, by analyzing log data fromfield appraisal wells.Dvorkin and Nur (1996) introduce two theoretical models to de-
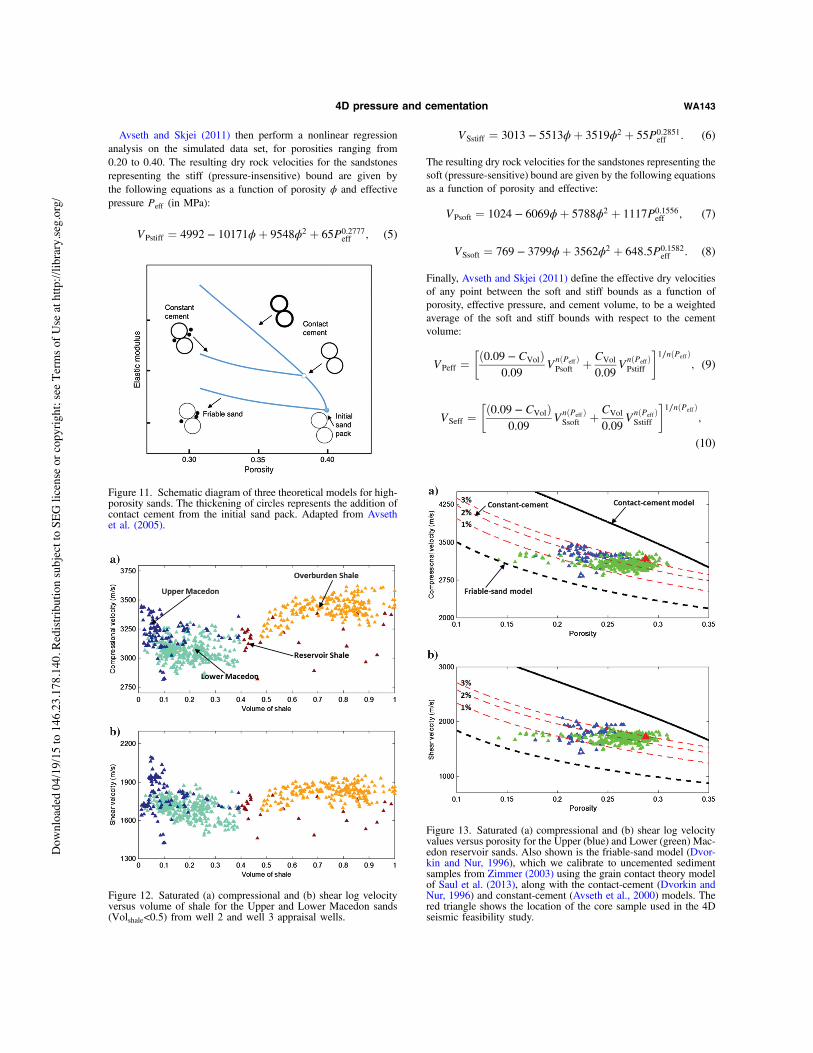
scribe the diagenetic and sorting trends for high-porosity sands. Thefriable-sand model describes porosity loss because of deterioratingsorting, whereas the contact-cement model describes porosity lossbecause of the deposition of cement on the surface of grains. Avsethet al. (2000) introduce the constant-cement model to describe sandswith constant cement volume, but varying sorting (they assume thatsands that have a variation in porosity because of sorting have thesame amount of contact cement). The model is a combination of thecontact-cement model and the friable-sand model (see schematic inFigure 11). First, it is assumed that porosity reduces from the initialsand pack (solid circle in Figure 11) to the initial-cement porosityϕb because of the deposition of contact cement (open circle in Fig-
ure 11). The bulk Kb and shear Gb moduli at thisinitial-cement porosity are calculated with thecontact-cement model (see equations in Dvorkinand Nur, 1996). The elastic moduli at a lowerporosity (because of deteriorating sorting) arethen calculated using a modified Hashin-Shtrik-man lower bound (MHSLB) as in the friable-sand model:
Kdry¼!
ϕ∕ϕb
Kbþ4Gb∕3þ 1−ϕ∕ϕb
Kmþ4Gb∕3
"−1
−4Gb∕3;
Gdry¼!ϕ∕ϕb
Gbþzþ1−ϕ∕ϕb
Gmþz
"−1−z;
where z¼Gb
6
9Kbþ8Gb
Kbþ2Gb
(1)
and Km and Gm are the bulk and shear moduli ofthe mineral phase, respectively. These modelscan be superimposed on moduli-porosity cross-plots to diagnose sands into three groups: (1) fri-able (unconsolidated) sands, (2) sands withporosity variation associated with contact ce-ment, and (3) sands with constant cement volumebut varying porosity because of deterioratingsorting (or clay content).Figure 12a and 12b shows water-saturated
compressional and shear log velocity versusvolume of shale (Volshale), colored by zones ofinterest, for the Macedon reservoir sands, respec-tively. The Upper Macedon sands are generallycleaner (lower volume of shale) than the LowerMacedon sands and have some samples withslightly higher compressional and shear veloc-ities. We use rock physics diagnostics (Dvorkinand Nur, 1996; Avseth et al., 2000) to determine
Figure 7. Histogram of extracted maximum trough amplitude within the thick channelsand polygon (e.g., Figure 5) for (a) near and (b) midstacks. Baseline amplitudes areshown in blue, and M1 amplitudes are in red. The vertical axis represents the number ofsamples, N. Amplitude increases between near and midstacks are consistent with mod-eled class III AVO. The near-stack 4D difference (M1-baseline) is greater than the mid-stack 4D difference, also consistent with modeled 4D AVO behavior (e.g., Figure 3). AtM1, a 60% increase in mean amplitude is observed compared to baseline for the nearstack, whereas a 50% increase is observed for the midstack.
WA140 Saul and Lumley
Dow
nloa
ded
04/1
9/15
to 1
46.2
3.17
8.14
0. R
edist
ribut
ion
subj
ect t
o SE
G li
cens
e or
cop
yrig
ht; s
ee T
erm
s of U
se a
t http
://lib
rary
.seg.
org/
possible causes for the observed differences (Figure 13). We can seefrom Figure 13 that the Upper Macedon sands have slightly lowerporosity than the Lower Macedon sands; however, the Upper Mac-edon sands are generally cleaner, so rather than this porosity varia-tion being associated with the volume of shale, it is likely because ofa combination of poorer sand sorting and variations in contact-ce-ment volume. Indeed, the rock physics diagnostics in Figure 13 sug-gests that the Upper Macedon sands have approximately 1.5%–3.5% contact cement, whereas the Lower Macedon sands havecloser to 1.0%–3% (on average, both sands have approximately2%–2.5% contact cement volume based on rock physics diagnos-tics). Cleaner sands are generally more susceptible to the formationof contact cement (e.g. Avseth et al., 2005), so the observation ofhigher cement volume in the cleaner Upper Mac-edon sands seems reasonable. The increasedcontact-cement volume in parts of the UpperMacedon sands also help to explain the observedhigh velocities in the Upper relative to the LowerMacedon sands. We note that variations in claycontent, if deposited structurally, could help toexplain the lower velocities in the Lower Mace-don sands; however, even the very cleanestLower Macedon sands have compressional andshear velocities lower than the Upper Macedonsands, suggesting there is indeed differences inthe amount of contact cement between the Upperand Lower sands.Figure 13 further highlights that there is a
significant variation in the stiffness of sandstoneswithin the reservoir interval. Sandstones havecompressional and shear velocities varying be-tween approximately 2800–3500 m∕s and1400–2100 m∕s, respectively. Based on the rockphysics diagnostics in Figure 13, the sandstonesalso vary from nearly unconsolidated to 3.5% ce-mented. The log data analyzed in Figure 13 arefrom a limited depth range (<100 m), so the ob-served variation in velocities is inferred to be be-cause of differences in contact-cement volumeand sorting. This observation and analysis willhave significant implications for pressure sensitiv-ity in the reservoir because cemented sands shouldbe less sensitive to changes in pressure thanunconsolidated sands (Figure 14).The location of the core sample from well 2,
used to make the ultrasonic-velocity pressuremeasurements, was taken from a more consoli-dated section of the reservoir (Wulff et al.,2008). As such, the measured pressure sensitivitymay not be representative of the rest of the field,and it may have been underestimated in the initialfeasibility study (Wulff et al., 2008). We can usethe rock physics diagnostics results to investigatethis statement further. Rock physics diagnosticsindeed shows that the sample was taken from amore consolidated section of the reservoir, withthe associated log velocity at the location wherethe core sample was taken plotting close to the3% cemented-sand line (red triangle in Fig-
ure 13). We should therefore expect that most of the reservoir sandsat Enfield will be more sensitive to pressure than the core samplesuggests because they are generally less consolidated (lower cementvolume). However, for the Enfield core sample, the change in veloc-ity for a given change in effective pressure is equal to or greater thanthat for a completely unconsolidated (no contact cement) sand sam-ple (the same initial porosity) from Zimmer’s data (Figure 10). Thisconfirms that the change in velocity with pressure between the twosurveys (estimated from the 4D amplitude and traveltime data) can-not be explained by a purely elastic rock physics model. In fact, thevelocity change estimated from the 4D data is much larger than thevelocity change predicted even if the reservoir rocks were com-pletely unconsolidated instead of partially cemented as they are.
Figure 8. (a) Baseline near-stack seismic section through the area of interest and injector1. (b) M1 near-stack seismic section. (c) Time-lapse (4D) seismic difference section (M1-baseline) highlighting strong amplitude anomaly around the water injector and the effectsof associated time shifts. The red and cyan arrows point to events representing the effectsof time shifts in the red and cyan-dashed events, respectively, in panels (a) and (b).
4D pressure and cementation WA141
Dow
nloa
ded
04/1
9/15
to 1
46.2
3.17
8.14
0. R
edist
ribut
ion
subj
ect t
o SE
G li
cens
e or
cop
yrig
ht; s
ee T
erm
s of U
se a
t http
://lib
rary
.seg.
org/
This gives evidence that water injection at high pressure is nonelas-tically weakening the reservoir rock at Enfield, providing the jus-tification to develop a nonelastic velocity-pressure model thatincludes the effects of grain cement to better explain the 4D re-sponses. In the next section, we discuss how the results of the rockphysics diagnostics study can be used to guide the analysis of pres-sure sensitivity within the field in terms of time-varying grain ce-mentation effects.
Time-lapse variation in contact cement
Avseth and Skjei (2011) introduce a heuristic approach to predictthe pressure sensitivity of cemented sandstones. They assume that acemented sandstone consists of a binary mixture of cementedand uncemented grain contacts, where the cemented contacts arepressure-insensitive and the uncemented contacts are pressure-sen-sitive according to Hertzian contact theory. To model the pressuresensitivity of a cemented sandstone, Avseth and Skjei (2011) used a“bounding average method” (see Mavko et al., 1998). They define aweight function W depending on where the cemented sandstonedata plot between upper and lower Hashin-Shtrikman bounds:
W ¼Kdry − KsoftðP0ÞKstiff − KsoftðP0Þ
; (2)
where Kdry is the dry bulk modulus (modeled or observed) of a ce-mented sandstone at a given porosity; Ksoft is the pressure-sensitivesoft (lower bound) bulk modulus at the same porosity at a givenreference pressureP0, andKstiff is the pressure-insensitive stiff (upperbound) bulk modulus at the same porosity value. Here, Ksoft is givenby the friable-sand model (pressure sensitive via Hertz-Mindlintheory); Kstiff is calculated by increasing the effective pressure inthe Hertz-Mindlin model until the friable-sand model mimics the10% constant-cement model. A separate weight factor for the shearmodulus is then calculated with the same approach.Any sandstone data point can be inverted for the weight factorW,
allowing the calculation of pressure sensitivity curves for each datapoint:
KdryðPeffÞ ¼ ð1 −WKÞKsoftðPeffÞ þWKKstiff ; (3)
GdryðPeffÞ ¼ ð1 −WGÞGsoftðPeffÞ þWGGstiff : (4)
Avseth and Skjei (2011) simulate synthetic sandstone data for awide range of contact-cement volumes and porosities using the con-stant-cement model (Avseth et al., 2000). Contact-cement volumesvary between 0% and 10%, and porosities between 0 and 0.4. Theythen calculate bulk and shear moduli as a function of effective pres-sure for each synthetic data point using equations 2–4.
Figure 9. Shown are 4D time shifts around injec-tor 1. (a) Time shift measured as the 4D increase intime thickness between the top (yellow-dashed in-terpretation in Figure 8) and base reservoir (red-dashed interpretation in Figure 8) in milliseconds.In the polygon, we extract an average time shift of6 ms. (b) Time shift measured as the 4D increasein time thickness between the top reservoir and adeeper negative event below the base reservoir(cyan interpretation in Figure 8) in milliseconds.In the polygon, we extract an average time shiftof 4 ms. The time shifts show a background noiselevel of "2 ms.
Figure 10. Analysis of the fractured/crumbled velocity-pressuremodel of Wulff et al. (2008): normalized VP and VS as a functionof normalized effective pressure. Measurements made on a dry coresample from an Enfield appraisal well are shown as solid circles. Nor-malized VP, VS ¼ 1.0, and normalized effective pressure ¼ 1.0 re-present baseline conditions. Curves show VP and VS predictionsusing the MacBeth (2004) empirical model, where the model fittingparameters have been adjusted to achieve a model-to-seismic matcharound the water injectors. We also plot data (triangles) from mea-surements on unconsolidated sands from Zimmer (2003). We normal-ize data from Zimmer (2003) relative to Enfield dry rock velocities atbaseline effective pressure (i.e., to plot the data on the same scale butstill preserve the relative difference in velocity between the Enfieldcore and the unconsolidated Zimmer data).
WA142 Saul and Lumley
Dow
nloa
ded
04/1
9/15
to 1
46.2
3.17
8.14
0. R
edist
ribut
ion
subj
ect t
o SE
G li
cens
e or
cop
yrig
ht; s
ee T
erm
s of U
se a
t http
://lib
rary
.seg.
org/
Avseth and Skjei (2011) then perform a nonlinear regressionanalysis on the simulated data set, for porosities ranging from0.20 to 0.40. The resulting dry rock velocities for the sandstonesrepresenting the stiff (pressure-insensitive) bound are given bythe following equations as a function of porosity ϕ and effectivepressure Peff (in MPa):
VPstiff ¼ 4992 − 10171ϕþ 9548ϕ2 þ 65P0.2777eff ; (5)
VSstiff ¼ 3013 − 5513ϕþ 3519ϕ2 þ 55P0.2851eff : (6)
The resulting dry rock velocities for the sandstones representing thesoft (pressure-sensitive) bound are given by the following equationsas a function of porosity and effective:
VPsoft ¼ 1024 − 6069ϕþ 5788ϕ2 þ 1117P0.1556eff ; (7)
VSsoft ¼ 769 − 3799ϕþ 3562ϕ2 þ 648:5P0.1582eff : (8)
Finally, Avseth and Skjei (2011) define the effective dry velocitiesof any point between the soft and stiff bounds as a function ofporosity, effective pressure, and cement volume, to be a weightedaverage of the soft and stiff bounds with respect to the cementvolume:
VPeff ¼#ð0.09 − CVolÞ
0.09VnðPeff ÞPsoft þ CVol
0.09VnðPeffÞPstiff
$1∕nðPeff Þ
; (9)
VSeff ¼#ð0.09 − CVolÞ
0.09VnðPeff ÞSsoft þ CVol
0.09VnðPeffÞSstiff
$1∕nðPeff Þ
;
(10)
Figure 13. Saturated (a) compressional and (b) shear log velocityvalues versus porosity for the Upper (blue) and Lower (green) Mac-edon reservoir sands. Also shown is the friable-sand model (Dvor-kin and Nur, 1996), which we calibrate to uncemented sedimentsamples from Zimmer (2003) using the grain contact theory modelof Saul et al. (2013), along with the contact-cement (Dvorkin andNur, 1996) and constant-cement (Avseth et al., 2000) models. Thered triangle shows the location of the core sample used in the 4Dseismic feasibility study.
Figure 11. Schematic diagram of three theoretical models for high-porosity sands. The thickening of circles represents the addition ofcontact cement from the initial sand pack. Adapted from Avsethet al. (2005).
Figure 12. Saturated (a) compressional and (b) shear log velocityversus volume of shale for the Upper and Lower Macedon sands(Volshale<0.5) from well 2 and well 3 appraisal wells.
4D pressure and cementation WA143
Dow
nloa
ded
04/1
9/15
to 1
46.2
3.17
8.14
0. R
edist
ribut
ion
subj
ect t
o SE
G li
cens
e or
cop
yrig
ht; s
ee T
erm
s of U
se a
t http
://lib
rary
.seg.
org/
where CVol is the contact-cement volume, and nðPeffÞ ¼3.5þ 0.1Peff , reflecting that the weighting average will change witheffective pressure. Duffaut et al. (2011) test the above regression for-mulas on real data from the Gullfaks and Stratfjord fields, and finda good match between predicted and observed 4D responses forchanges in effective pressure, as well as for predicted and measuredvolumes of contact cement (from thin section analysis).Avseth and Skjei (2011) and Duffaut et al. (2011) assume that
porosity and cement volume are static properties (i.e., do not varywith pressure), and the model is therefore only used to predict theeffect that variations in pressure have on cemented-sand velocities.We propose to extend this modeling approach, by allowing the ce-ment volume to also be a time-varying dynamic property (i.e., tovary with pressure).We use the results of rock physics diagnostics (Figure 13), along
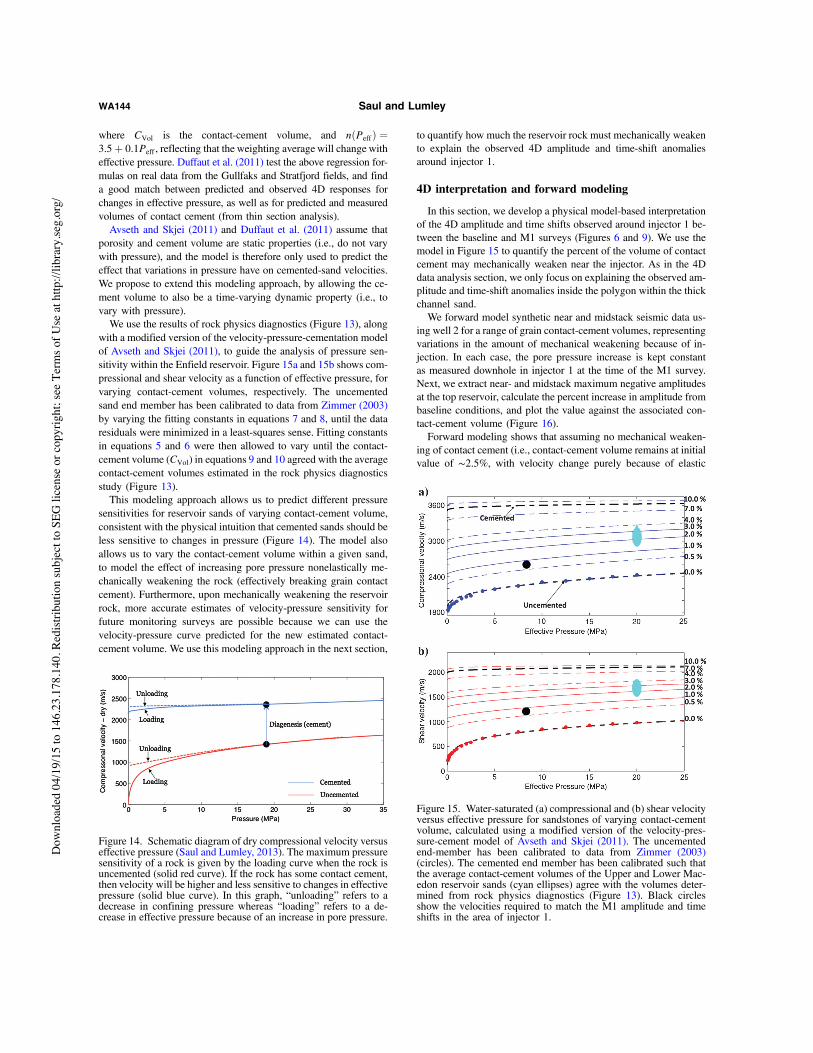
with a modified version of the velocity-pressure-cementation modelof Avseth and Skjei (2011), to guide the analysis of pressure sen-sitivity within the Enfield reservoir. Figure 15a and 15b shows com-pressional and shear velocity as a function of effective pressure, forvarying contact-cement volumes, respectively. The uncementedsand end member has been calibrated to data from Zimmer (2003)by varying the fitting constants in equations 7 and 8, until the dataresiduals were minimized in a least-squares sense. Fitting constantsin equations 5 and 6 were then allowed to vary until the contact-cement volume (CVol) in equations 9 and 10 agreed with the averagecontact-cement volumes estimated in the rock physics diagnosticsstudy (Figure 13).This modeling approach allows us to predict different pressure
sensitivities for reservoir sands of varying contact-cement volume,consistent with the physical intuition that cemented sands should beless sensitive to changes in pressure (Figure 14). The model alsoallows us to vary the contact-cement volume within a given sand,to model the effect of increasing pore pressure nonelastically me-chanically weakening the rock (effectively breaking grain contactcement). Furthermore, upon mechanically weakening the reservoirrock, more accurate estimates of velocity-pressure sensitivity forfuture monitoring surveys are possible because we can use thevelocity-pressure curve predicted for the new estimated contact-cement volume. We use this modeling approach in the next section,
to quantify how much the reservoir rock must mechanically weakento explain the observed 4D amplitude and time-shift anomaliesaround injector 1.
4D interpretation and forward modeling
In this section, we develop a physical model-based interpretationof the 4D amplitude and time shifts observed around injector 1 be-tween the baseline and M1 surveys (Figures 6 and 9). We use themodel in Figure 15 to quantify the percent of the volume of contactcement may mechanically weaken near the injector. As in the 4Ddata analysis section, we only focus on explaining the observed am-plitude and time-shift anomalies inside the polygon within the thickchannel sand.We forward model synthetic near and midstack seismic data us-
ing well 2 for a range of grain contact-cement volumes, representingvariations in the amount of mechanical weakening because of in-jection. In each case, the pore pressure increase is kept constantas measured downhole in injector 1 at the time of the M1 survey.Next, we extract near- and midstack maximum negative amplitudesat the top reservoir, calculate the percent increase in amplitude frombaseline conditions, and plot the value against the associated con-tact-cement volume (Figure 16).Forward modeling shows that assuming no mechanical weaken-
ing of contact cement (i.e., contact-cement volume remains at initialvalue of ∼2.5%, with velocity change purely because of elastic
Figure 15. Water-saturated (a) compressional and (b) shear velocityversus effective pressure for sandstones of varying contact-cementvolume, calculated using a modified version of the velocity-pres-sure-cement model of Avseth and Skjei (2011). The uncementedend-member has been calibrated to data from Zimmer (2003)(circles). The cemented end member has been calibrated such thatthe average contact-cement volumes of the Upper and Lower Mac-edon reservoir sands (cyan ellipses) agree with the volumes deter-mined from rock physics diagnostics (Figure 13). Black circlesshow the velocities required to match the M1 amplitude and timeshifts in the area of injector 1.
Figure 14. Schematic diagram of dry compressional velocity versuseffective pressure (Saul and Lumley, 2013). The maximum pressuresensitivity of a rock is given by the loading curve when the rock isuncemented (solid red curve). If the rock has some contact cement,then velocity will be higher and less sensitive to changes in effectivepressure (solid blue curve). In this graph, “unloading” refers to adecrease in confining pressure whereas “loading” refers to a de-crease in effective pressure because of an increase in pore pressure.
WA144 Saul and Lumley
Dow
nloa
ded
04/1
9/15
to 1
46.2
3.17
8.14
0. R
edist
ribut
ion
subj
ect t
o SE
G li
cens
e or
cop
yrig
ht; s
ee T
erm
s of U
se a
t http
://lib
rary
.seg.
org/
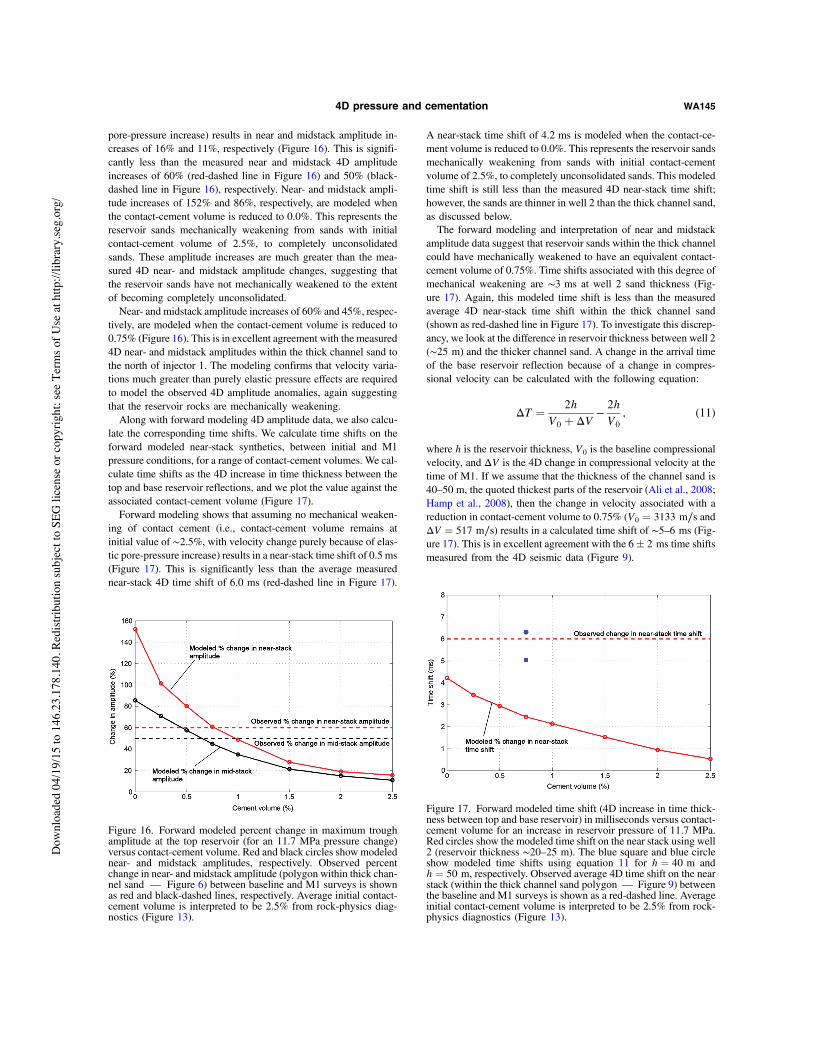
pore-pressure increase) results in near and midstack amplitude in-creases of 16% and 11%, respectively (Figure 16). This is signifi-cantly less than the measured near and midstack 4D amplitudeincreases of 60% (red-dashed line in Figure 16) and 50% (black-dashed line in Figure 16), respectively. Near- and midstack ampli-tude increases of 152% and 86%, respectively, are modeled whenthe contact-cement volume is reduced to 0.0%. This represents thereservoir sands mechanically weakening from sands with initialcontact-cement volume of 2.5%, to completely unconsolidatedsands. These amplitude increases are much greater than the mea-sured 4D near- and midstack amplitude changes, suggesting thatthe reservoir sands have not mechanically weakened to the extentof becoming completely unconsolidated.Near- and midstack amplitude increases of 60% and 45%, respec-
tively, are modeled when the contact-cement volume is reduced to0.75% (Figure 16). This is in excellent agreement with the measured4D near- and midstack amplitudes within the thick channel sand tothe north of injector 1. The modeling confirms that velocity varia-tions much greater than purely elastic pressure effects are requiredto model the observed 4D amplitude anomalies, again suggestingthat the reservoir rocks are mechanically weakening.Along with forward modeling 4D amplitude data, we also calcu-
late the corresponding time shifts. We calculate time shifts on theforward modeled near-stack synthetics, between initial and M1pressure conditions, for a range of contact-cement volumes. We cal-culate time shifts as the 4D increase in time thickness between thetop and base reservoir reflections, and we plot the value against theassociated contact-cement volume (Figure 17).Forward modeling shows that assuming no mechanical weaken-
ing of contact cement (i.e., contact-cement volume remains atinitial value of ∼2.5%, with velocity change purely because of elas-tic pore-pressure increase) results in a near-stack time shift of 0.5 ms(Figure 17). This is significantly less than the average measurednear-stack 4D time shift of 6.0 ms (red-dashed line in Figure 17).
A near-stack time shift of 4.2 ms is modeled when the contact-ce-ment volume is reduced to 0.0%. This represents the reservoir sandsmechanically weakening from sands with initial contact-cementvolume of 2.5%, to completely unconsolidated sands. This modeledtime shift is still less than the measured 4D near-stack time shift;however, the sands are thinner in well 2 than the thick channel sand,as discussed below.The forward modeling and interpretation of near and midstack
amplitude data suggest that reservoir sands within the thick channelcould have mechanically weakened to have an equivalent contact-cement volume of 0.75%. Time shifts associated with this degree ofmechanical weakening are ∼3 ms at well 2 sand thickness (Fig-ure 17). Again, this modeled time shift is less than the measuredaverage 4D near-stack time shift within the thick channel sand(shown as red-dashed line in Figure 17). To investigate this discrep-ancy, we look at the difference in reservoir thickness between well 2(∼25 m) and the thicker channel sand. A change in the arrival timeof the base reservoir reflection because of a change in compres-sional velocity can be calculated with the following equation:
ΔT ¼ 2hV0 þ ΔV
−2hV0
; (11)
where h is the reservoir thickness, V0 is the baseline compressionalvelocity, and ΔV is the 4D change in compressional velocity at thetime of M1. If we assume that the thickness of the channel sand is40–50 m, the quoted thickest parts of the reservoir (Ali et al., 2008;Hamp et al., 2008), then the change in velocity associated with areduction in contact-cement volume to 0.75% (V0 ¼ 3133 m∕s andΔV ¼ 517 m∕s) results in a calculated time shift of ∼5–6 ms (Fig-ure 17). This is in excellent agreement with the 6" 2 ms time shiftsmeasured from the 4D seismic data (Figure 9).
Figure 17. Forward modeled time shift (4D increase in time thick-ness between top and base reservoir) in milliseconds versus contact-cement volume for an increase in reservoir pressure of 11.7 MPa.Red circles show the modeled time shift on the near stack using well2 (reservoir thickness ∼20–25 m). The blue square and blue circleshow modeled time shifts using equation 11 for h ¼ 40 m andh ¼ 50 m, respectively. Observed average 4D time shift on the nearstack (within the thick channel sand polygon — Figure 9) betweenthe baseline and M1 surveys is shown as a red-dashed line. Averageinitial contact-cement volume is interpreted to be 2.5% from rock-physics diagnostics (Figure 13).
Figure 16. Forward modeled percent change in maximum troughamplitude at the top reservoir (for an 11.7 MPa pressure change)versus contact-cement volume. Red and black circles show modelednear- and midstack amplitudes, respectively. Observed percentchange in near- and midstack amplitude (polygon within thick chan-nel sand — Figure 6) between baseline and M1 surveys is shownas red and black-dashed lines, respectively. Average initial contact-cement volume is interpreted to be 2.5% from rock-physics diag-nostics (Figure 13).
4D pressure and cementation WA145
Dow
nloa
ded
04/1
9/15
to 1
46.2
3.17
8.14
0. R
edist
ribut
ion
subj
ect t
o SE
G li
cens
e or
cop
yrig
ht; s
ee T
erm
s of U
se a
t http
://lib
rary
.seg.
org/
DISCUSSION
We hypothesize that high-pressure water injection is likely to me-chanically weaken reservoir rock at Enfield, thus explaining thelarge observed 4D amplitude and time-shift anomalies that cannotbe explained by purely elastic rock physics models alone. We quan-tify this nonelastic weakening using a modified version of the veloc-ity-pressure-cement model of Avseth and Skjei (2011), constrainedby rock physics diagnostics. We have developed a nonelastic physi-cal model to explain the observed injection-induced weakening ofreservoir rock as geomechanical weakening of the grain-cementbonds. We deemed the mechanical weakening of contact cementto be the most feasible cause for the nonelastic changes to the res-ervoir rock because of the poorly consolidated nature of the rocks(less likely to support fractures). We note that the observed 4D re-sponses could also be consistent with other sources of weakening,such as fracturing or geochemical reactions in the rock grains orcement, which are beyond the scope of this paper.Forward modeling with our new velocity-pressure-cementation
rock physics model shows that high-pressure water injection intothe cemented channel sands at Enfield could have weakened thesandstones to a state that they are almost unconsolidated in nature.This has numerous implications for further seismic reservoir char-acterization and monitoring. For example, a key implication of ourhypothesis is that a softening response would be observed on anend-of-field-life monitor survey relative to the baseline, even afterthe pressure within the reservoir had fully restored. Our results alsosuggest that the feasibility and interpretation of future monitor sur-veys should not be based on either the initial state or empirical (e.g.,Macbeth [2004] or other) velocity-pressure models, but on a physi-cal and potentially time-varying velocity-pressure model based onthe interpreted volume of contact-cement at the time of M1. This isbecause the injection-induced weakening of contact cement is anonelastic time-varying process, and thus the associated velocity-pressure response is not reversible.The biggest shortcoming of the contact-cement model (Dvorkin
and Nur, 1996) is that it does not include pressure sensitivity. This isbecause the model assumes that all grain contacts have the sameamount of cement and that grains immediately lose pressure sensi-tivity once cementation begins. However, this study, along withothers (e.g., Avseth et al., 2009; Avseth and Skjei, 2011), has shownthat cemented reservoirs can still have significant pressure sensitiv-ity, probably because cement is not deposited evenly on all grain
contacts. The shortcoming of the contact-cement model means thatthe absolute volume of the contact cement may be overestimatedfrom rock physics diagnostics. We are not so much concerned withthe absolute volume of contact cement, but rather the relative varia-tion within the sands because this tells us about the relative differ-ence in the expected pressure sensitivity.A question raised during this study was that if the reservoir rock
is mechanically weakening because of high pore pressure increases,then why doesn’t the rock fail equally in the laboratory during theultrasonic-velocity pressure measurements? This may be because ofthe fact that the core sample used to make the measurements is froma more consolidated section of the reservoir (as shown in Figure 13),meaning it does not mechanically weaken to the same extent as theweaker reservoir rocks. We do however think that some mechanicalweakening may have occurred to the core sample during the ultra-sonic-velocity pressure measurements, as evidenced by the pressuresensitivity of velocity relative to a completely uncemented sample(Figure 10). Earlier work has shown that cemented sands shouldbe less sensitive to changes in pressure than uncemented sands(Figure 14), so for the pressure sensitivity of the core sample (ce-mented) to be equal to or greater than that of the uncemented sedi-ment means that the core may have mechanically weakened in thelaboratory.Because the reservoir sands at Enfield are unconsolidated to par-
tially consolidated, it is also possible that porosity is increasing (i.e.,pore expansion) during a pore pressure increase in the reservoir(e.g., Zimmer, 2003; Saul and Lumley, 2013). This pressure-induced increase in porosity could also contribute to the velocityreduction in the reservoir rock and thus to the observed 4D ampli-tude and time shifts. We test modeling a porosity increase of 1.5%(realistic variation based on pressure difference and analog datafrom Zimmer) on the elastic properties of the Macedon reservoirsands using the friable-sand model, and we find that the effect isnegligible (<2% reduction in VP and VS).Effective stress is generally defined as confining pressure minus a
fraction n of the pore pressure. For unconsolidated rocks, the Biotparameter n is typically close to 1 (e.g., Siggins and Dewhurst,2003; Hofmann et al., 2005); however, in more consolidated rocks,it has been shown that n varies with porosity (e.g., Hofmann et al.,2005). Because the rocks at Enfield are unconsolidated to partiallyconsolidated in nature, we have assumed n ¼ 1 in this study. How-ever, we do note that this assumption may not always be valid ingeneral. It may also be possible that n could vary in a time-lapse
sense, particularly if the reservoir rock is me-chanically weakening over time as we hypoth-esize here.We discussed in the initial 4D seismic feasibil-
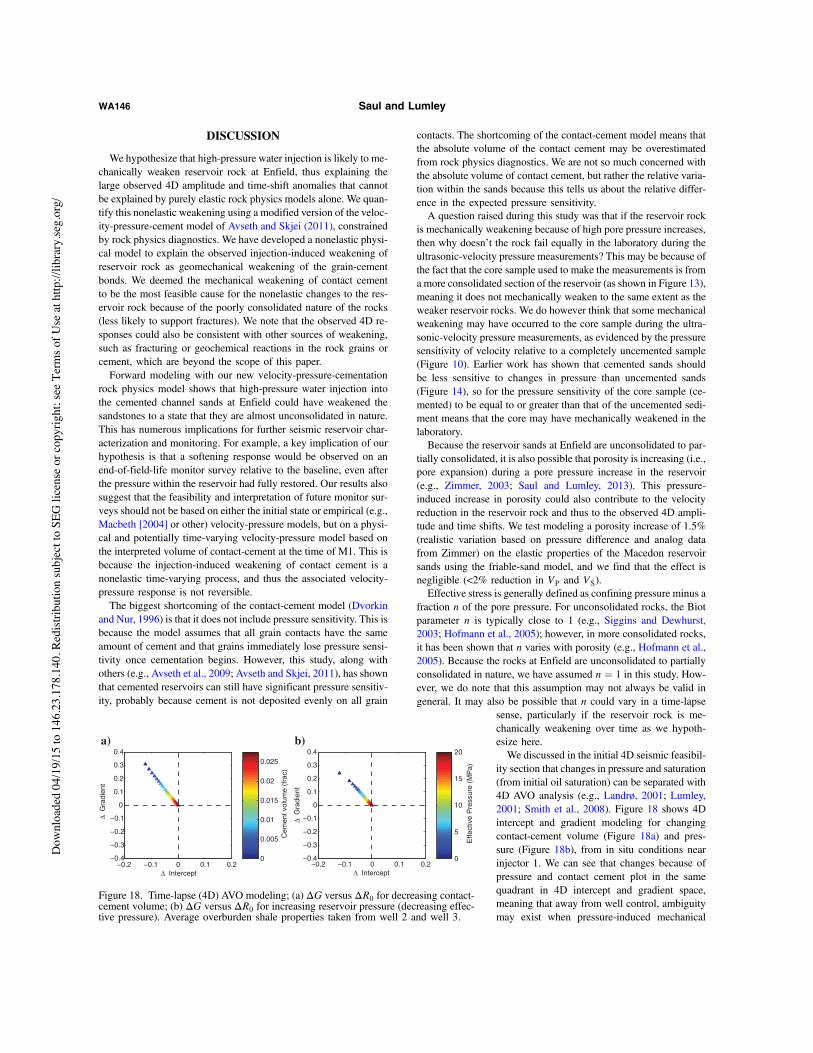
ity section that changes in pressure and saturation(from initial oil saturation) can be separated with4D AVO analysis (e.g., Landrø, 2001; Lumley,2001; Smith et al., 2008). Figure 18 shows 4Dintercept and gradient modeling for changingcontact-cement volume (Figure 18a) and pres-sure (Figure 18b), from in situ conditions nearinjector 1. We can see that changes because ofpressure and contact cement plot in the samequadrant in 4D intercept and gradient space,meaning that away from well control, ambiguitymay exist when pressure-induced mechanical
−0.2 −0.1 0 0.1 0.2−0.4
−0.3
−0.2
−0.1
0
0.1
0.2
0.3
0.4
∆ Intercept
∆ G
radi
ent
b)
−0.2 −0.1 0 0.1 0.2−0.4
−0.3
−0.2
−0.1
0
0.1
0.2
0.3
0.4
∆ Intercept
∆ G
radi
ent
a)
Effe
ctiv
e P
ress
ure
(MP
a)
0
5
10
15
20
Cem
ent v
olum
e (f
rac)
0
0.005
0.01
0.015
0.02
0.025
Figure 18. Time-lapse (4D) AVO modeling; (a) ΔG versus ΔR0 for decreasing contact-cement volume; (b) ΔG versus ΔR0 for increasing reservoir pressure (decreasing effec-tive pressure). Average overburden shale properties taken from well 2 and well 3.
WA146 Saul and Lumley
Dow
nloa
ded
04/1
9/15
to 1
46.2
3.17
8.14
0. R
edist
ribut
ion
subj
ect t
o SE
G li
cens
e or
cop
yrig
ht; s
ee T
erm
s of U
se a
t http
://lib
rary
.seg.
org/
weakening of rocks is present. The ambiguity means that it may bedifficult to quantify inelastic pressure effects using 4D AVO attrib-utes (e.g., Tura and Lumley, 1999; Landrø, 2001; Lumley, 2001;Lumley et al., 2003) because a given anomaly could be describedby an elastic pore pressure effect, a contact-cement effect, or a com-bination of both. It will however still be possible to separate satu-ration and pressure-related effects. Figure 18 also shows that, aswith pore pressure effects, contact-cement effects will be mostobservable at near to mid offsets (angles).As shown in Figure 15, our new nonelastic velocity-pressure-ce-
ment model makes it possible to predict a different velocity-pres-sure sensitivity depending on the contact-cement volume of a givensand, as well as varying amounts of contact cement. In this paper,we model the situation in which contact cement fails the sameamount in the Upper and Lower Macedon sands; however, we couldmodel various situations in which the amount of contact-cementfailure varies between the sands and attempt to improve the matchto the observed top and base reservoir amplitudes and to the timeshifts. We tried this approach near injector 1; however, owing to thedifficulty in picking the base reservoir in this area, our analysis ismuch more confident in matching the top reservoir amplitudes andtime shifts.
CONCLUSIONS
Understanding the effects that injected fluids and pressure haveon rock properties is crucial to determine whether time-lapse seis-mic is feasible at a given site and to correctly interpret/quantify ob-served time-lapse seismic anomalies. We have shown that high-pressure water injection may nonelastically mechanically weakenreservoir rock, thus explaining large observed 4D amplitude andtime-shift anomalies that cannot be explained by elastic rock phys-ics models alone. We quantify this nonelastic effect using a newvelocity-pressure-cement model, constrained by rock physics diag-nostics. Forward modeling with our new rock physics model showsthat high-pressure water injection into the cemented channel sandsat Enfield could weaken the sandstones to a state that they are al-most unconsolidated in nature. This has numerous implications forseismic reservoir characterization and monitoring in unconsolidatedand partial cemented reservoir sands, as well as in other geome-chanically analogous systems.
ACKNOWLEDGMENTS
We thank Woodside Energy Ltd., along with their JV partnersMitsui E&P Australia Pty. Ltd., for supplying the Enfield dataset. We particularly thank A. Gerhardt, M. Smith, and the rest ofthe QI team at Woodside for helpful discussions and for permissionto publish our Enfield data results. We acknowledge the sponsors ofthe UWA Reservoir Management research consortium for theirfunding support. We also thank the reviewers for their insightfulcomments that have improved the quality of this paper. M. S. grate-fully acknowledges additional financial support from an AustralianPostgraduate Award and an ASEG Research Foundation grant.
REFERENCES
Ali, A., L. Taggart, B. Mee, M. Smith, A. Gerhardt, and L. Bourdon, 2008,Integrating 4D seismic data with production related effects at Enfield,
North West Shelf, Australia: Presented at SPE Asia Pacific Oil andGas Conference and Exhibition, 116916.
Avseth, P., J. Dvorkin, G. Mavko, and J. Rykkje, 2000, Rock physics diag-nostic of North Sea sands: Link between microstructure and seismic prop-erties: Geophysical Research Letters, 27, 2761–2764, doi: 10.1029/1999GL008468.
Avseth, P., A. Jorstad, A.-J. Wijngaarden, and G. Mavko, 2009, Rock phys-ics estimation of cement volume, sorting, and net-to-gross in North Seasandstones: The Leading Edge, 28, 98–108, doi: 10.1190/1.3064154.
Avseth, P., T. Mukerji, and G. Mavko, 2005, Quantitative seismic interpre-tation: Applying rock physics to reduce interpretation risk: CambridgeUniversity Press.
Avseth, P., and N. Skjei, 2011, Rock physics modeling of static and dynamicreservoir properties; A heuristic approach for cemented sandstone reser-voirs: The Leading Edge, 30, 90–96, doi: 10.1190/1.3535437.
Batzle, M., and Z. Wang, 1992, Seismic properties of pore fluids: Geophys-ics, 57, 1396–1408, doi: 10.1190/1.1443207.
Duffaut, K., P. Avseth, and M. Landrø, 2011, Stress and fluid sensitivity intwo North Sea oil fields — Comparing rock physics models with seismicobservations: The Leading Edge, 30, 98–102, doi: 10.1190/1.3535438.
Dvorkin, J., and A. Nur, 1996, Elasticity of high-porosity sandstones:Theory for two North Sea data sets: Geophysics, 61, 1363–1370, doi:10.1190/1.1444059.
Grude, S., M. Landrø, and B. Osdal, 2013, Time-lapse pressure-saturationdiscrimination for CO2 storage at the Snhovit field: International Journalof Greenhouse Gas Control, 19, 369–378, doi: 10.1016/j.ijggc.2013.09.014.
Hamp, R., B. Mee, T. Duggan, and I. Bada, 2008, Early reservoir manage-ment insights from the Enfield oil development, offshore Western Aus-tralia: Presented at SPE Asia Pacific Oil and Gas Conference andExhibition, 116915.
Hatchell, P., and S. Bourne, 2005, Rocks under strain: Strain-induced time-lapse time shifts are observed for depleting reservoirs: The Leading Edge,24, 1222–1225, doi: 10.1190/1.2149624.
Hofmann, R., X. Xu, M. Batzle, M. Prasad, A.-K. Furre, and A. Pillitteri,2005, Effective pressure or what is the effect of pressure?: The LeadingEdge, 24, 1256–1260, doi: 10.1190/1.2149644.
Landrø, M., 2001, Discrimination between pressure and fluid saturationchanges from time-lapse seismic data: Geophysics, 66, 836–844, doi:10.1190/1.1444973.
Landrø, M., and J. Stammeijer, 2004, Quantitative estimation of compactionand velocity changes using 4D impedance and traveltime changes: Geo-physics, 69, 949–957, doi: 10.1190/1.1778238.
Lumley, D. E., 1995, 4-D seismic monitoring of an active steamflood: 65thAnnual International Meeting, SEG, Expanded Abstracts, 203–206.
Lumley, D. E., 2001, Time-lapse seismic reservoir monitoring: Geophysics,66, 50–53, doi: 10.1190/1.1444921.
Lumley, D., 2010, 4D seismic monitoring of CO2 sequestration: The Lead-ing Edge, 29, 150–155, doi: 10.1190/1.3304817.
Lumley, D. E., R. A. Behrens, and Z. Wang, 1997, Assessing the technicalrisk of a 4-D seismic project: The Leading Edge, 16, 1287–1292, doi: 10.1190/1.1437784.
Lumley, D. E., S. Cole, M. A. Meadows, A. Tura, B. Hottman, B. Cornish,M. Curtis, and N. Maerefat, 2000, A risk analysis spreadsheet for bothtime-lapse VSP and 4D seismic reservoir monitoring: 70th AnnualInternational Meeting, SEG, Expanded Abstracts, 1647–1650.
Lumley, D., M. Meadows, S. Cole, and D. Adams, 2003, Estimation of res-ervoir pressure and saturations by crossplot inversion of 4D seismic attributes:73rd Annual International Meeting, SEG, Expanded Abstracts, 1513–1516.
MacBeth, C., 2004, A classification for the pressure-sensitivity properties of asandstone rock frame: Geophysics, 69, 497–510, doi: 10.1190/1.1707070.
Mavko, G., T. Mukerji, and J. Dvorkin, 1998, The rock physics handbook:Cambridge University Press.
Meadows, M., D. Adams, R. Wright, A. Tura, S. Cole, and D. Lumley, 2002,Rock physics analysis for time-lapse seismic at Schiehallion field, NorthSea: 72nd Annual International Meeting, SEG, Expanded Abstracts,1743–1746.
Ridsdill-Smith, T., T. Flynn, and S. Darling, 2007, Benefits of two-boat 4Dacquisition: 77th Annual International Meeting, SEG, Expanded Ab-stracts, 2954–2958.
Saul, M., D. Lumley, and J. Shragge, 2013, Modeling the pressure sensitivityof uncemented sediments using a modified grain contact theory: Incorpo-rating grain relaxation and porosity effects: Geophysics, 78, no. 5, D327–D338, doi: 10.1190/geo2012-0459.1.
Saul, M. J., and D. E. Lumley, 2013, A new velocity-pressure-compactionmodel for uncemented sediments: Geophysical Journal International, 193,905–913, doi: 10.1093/gji/ggt005.
Siggins, A. F., and D. N. Dewhurst, 2003, Saturation, pore pressure and ef-fective stress from sandstone acoustic properties: Geophysics ResearchLetters, 30, 1089, doi: 10.1029/2002GL016143.
Smith, M., A. Gerhardt, L. Bourdon, and B. Mee, 2007, Using 4D seismicdata to understand production-related changes in Enfield, NWS, Aus-tralia: Presented at 19th ASEG Conference and Exhibition.
4D pressure and cementation WA147
Dow
nloa
ded
04/1
9/15
to 1
46.2
3.17
8.14
0. R
edist
ribut
ion
subj
ect t
o SE
G li
cens
e or
cop
yrig
ht; s
ee T
erm
s of U
se a
t http
://lib
rary
.seg.
org/

Smith, M., A. Gerhardt, B. Mee, T. Ridsdill-Smith, A. Wulff, andL. Bourdon, 2008, The benefits of early 4D seismic monitoring to under-stand production related effects at Enfield, North West Shelf, Australia:78th Annual International Meeting, SEG, Expanded Abstracts, 3159–3163.
Smith, M., A. Gerhardt, and P. Thomas, 2010, Quantitative 4D interpreta-tion: Relating the seismic to production changes at Enfield, North WestShelf, Australia: ASEG Extended Abstracts, 2010, 1–4, doi: 10.1071/ASEG2010ab048.
Tura, A., and D. E. Lumley, 1999, Estimating pressure and saturationchanges time-lapse AVO data: 69th Annual International Meeting, SEG,Expanded Abstracts, 1655–1658.
Wulff, A., A. Gerhardt, T. Ridsdill-Smith, and M. Smith, 2008, The role ofrock physics for the Enfield 4D seismic monitoring project: ExplorationGeophysics, 39, 108–114., doi: 10.1071/EG08015.
Zimmer, M., 2003, Seismic velocities in unconsolidated sands: Measure-ments of pressure, sorting, and compaction effects: Ph.D. dissertation,Stanford University.
WA148 Saul and Lumley
Dow
nloa
ded
04/1
9/15
to 1
46.2
3.17
8.14
0. R
edist
ribut
ion
subj
ect t
o SE
G li
cens
e or
cop
yrig
ht; s
ee T
erm
s of U
se a
t http
://lib
rary
.seg.
org/