save energy, save dollars · 23.05.2018 · save energy, save dollars ! a bold new vision for ....
TRANSCRIPT
Lower My Utility Bill - A Bold New Vision for Reducing Low Income Energy Burdens Page 1
Save Energy, Save Dollars !
A Bold New Vision for
Reducing Low Income Energy Burdens in
Shelby County, Tennessee
Submitted to
Friends of the Earth
Prepared by
Vermont Energy Investment Corporation
May 23, 2018
Lower My Utility Bill - A Bold New Vision for Reducing Low Income Energy Burdens Page 2
Table of Contents
1 The Challenge: High Energy Burdens and Arrearages ................................................................... 5 2 The Opportunity: A Bold New Vision for the Future ....................................................................... 6
2.1 A “Cookbook” for Achieving the Vision ......................................................................................... 6 2.2 A Win-Win-Win for Shelby County, MLGW, and all Memphians .................................................. 6
3 Program Design and Delivery Approach ........................................................................................... 7 3.1 Overview ....................................................................................................................................... 7 3.2 Population and Service Territory ................................................................................................... 7 3.3 Program Overview ........................................................................................................................ 8 3.4 Direct Install ................................................................................................................................... 8 3.5 Weatherization .............................................................................................................................. 9 3.6 Program Eligibility and Outreach ................................................................................................... 9 3.7 The Neighborhood-based and County-wide Approaches to be Used ........................................ 10 3.8 Direct Installation - Step 1 ........................................................................................................... 11
3.8.1 Direct Install Measures ............................................................................................................ 12 3.8.2 Thermostats ............................................................................................................................ 12
3.9 Weatherization – Step 2 .............................................................................................................. 13 3.9.1 Weatherization Measures to Be Offered ................................................................................. 13 3.9.2 Weatherization Packages and Cost Ranges .......................................................................... 14
3.10 Rental vs Homeowners; Multifamily vs. Single Family ............................................................... 14 3.11 Rebates ....................................................................................................................................... 15
4 Program Implementation Plan .......................................................................................................... 16 4.1 Engage with Key Stakeholders to Ensure Local Support for the Offering .................................. 17 4.2 Annual Implementation Targets .................................................................................................. 17 4.3 Program Metrics & Tracking Tools .............................................................................................. 18 4.4 Direct Install Launch – Year 1 ..................................................................................................... 20 4.5 Weatherization Launch – Year 1 ................................................................................................. 20 4.6 Direct Install and Weatherization - Years 2 – 5 ........................................................................... 21 4.7 Program Staff and Contractors Needed to Administer and Implement the Program .................. 21
5 Program Savings and Utility Bill Reductions ................................................................................. 22 5.1 Program Savings and Utility Bill Reduction – Customer Perspective ......................................... 22 5.2 Program Savings and Utility Bill Reduction – Utility Perspective .............................................. 24 5.3 Program Savings and Utility Bill Reduction - DI and WX Combined .......................................... 25 5.4 Program Savings and Utility Bill Reduction - Direct Install ........................................................ 25 5.5 Program Savings and Utility Bill Reduction - Weatherization ..................................................... 26 5.6 Utility Bill Reduction – Elimination of the Fixed Charge .............................................................. 26
Lower My Utility Bill - A Bold New Vision for Reducing Low Income Energy Burdens Page 3
6 Program Participation and Investment by Year .............................................................................. 27 6.1 Participation and Investment by Year – Total Program .............................................................. 28 6.2 Participation and Investment by Year – Direct Install ................................................................. 29 6.3 Participation and Investment by Year - Weatherization .............................................................. 29
7 The Recommended Capital Formation, Investment, and Rate Redesign Approach to Achieve This Program ............................................................................................................................................. 30
7.1 Options for Raising Capital and Recovering the Program Investment ....................................... 30 7.2 Energy Efficiency Bonds ............................................................................................................. 31 7.3 On-Bill, Tariff-Based Financing ................................................................................................... 32
7.3.1 Tariff-Based Financing as an Alternative to Loan-Based Financing ....................................... 32 7.3.2 On-Bill Financing Consumer Protection Issues ...................................................................... 33
7.4 Examples of Rate Design Approaches ....................................................................................... 35 7.5 Proposed Rate Design Options for MLGW ................................................................................. 36 7.6 The Impact of Eliminating the Fixed Charge for MLGW and Non-Low-Income Customers and 37 7.7 Recommended Approach for Investing in the Program and Recovering Costs ......................... 37
8 Lower My Utility Bill! .......................................................................................................................... 41 Appendix A: Program Budget and Savings Model Assumptions ...................................................... 43
Lower My Utility Bill - A Bold New Vision for Reducing Low Income Energy Burdens Page 4
List of Figures Figure 1: Uncollectible accounts per revenue dollar. .................................................................................... 5 Figure 2: Relative household income in Shelby County by census tract. ..................................................... 7 Figure 3: Map of Shelby County low-income census tracts to be targeted. ............................................... 11 Figure 4: Percent of Shelby County residents with a computer and internet connection. .......................... 13 Figure 5: Program implementation plan. ..................................................................................................... 16 Figure 6: Target program participation by year. .......................................................................................... 17 Figure 8: Cumulative utility bill reduction from the DI and WX programs. .................................................. 24 Figure 9: Breakout of $247 Million program investment over five years. .................................................... 27 Figure 10: Program participation and investment needed to achieve program targets. ............................. 28 Figure 11: Comparison of monthly bill reductions resulting from low-income rate designs. ....................... 35 Figure 12: Investment for the low-income program and rate design recovered from ratepayers. .............. 38 Figure 13: Investment for the low-income program and rate design recovered from WX participants. ...... 39 Figure 14: Bonded low-income program investment recovery. .................................................................. 39 Figure 15: Rate impact of program investment recovery. ........................................................................... 40 Figure 16: Measure mix for the Direct Installation offering. ........................................................................ 44 Figure 17: Measure mix for the Weatherization offering. ............................................................................ 44 Figure 18: Breakout of installed measure costs for the Direct Installation offering. .................................... 45 Figure 19: Breakout of installed measure costs for the Weatherization offering. ....................................... 45 Figure 20: Breakout of total utility bill savings by measure for the DI component. ..................................... 46 Figure 21: Breakout of total utility bill savings by measure for the DI component. ..................................... 46
List of Tables Table 1: Rebates currently offered by MLGW for weatherization measures. ............................................. 15 Table 2: Annual implementation targets – direct install. ............................................................................. 17 Table 3: Annual implementation targets – weatherization. ......................................................................... 18 Table 4: Annual MLGW targets – program administration. ......................................................................... 18 Table 5: Maryland Quick Home Energy Check-Up reporting form. ............................................................ 19 Table 6: Cumulative full-time equivalents (FTE) needed to administer and deliver the program. .............. 21 Table 7: Utility bill reductions and savings from the program. .................................................................... 22 Table 8: Energy and water savings – total program. .................................................................................. 25 Table 9: Energy and water savings – direct install. .................................................................................... 26 Table 10: Program savings – weatherization. ............................................................................................. 26 Table 11: Program participation and investment needed by category and by year.................................... 28 Table 12: Participation and investment by year – direct install. .................................................................. 29 Table 13: Participation and investment by year – weatherization............................................................... 29 Table 14: Recommended MLGW energy efficiency bond. ......................................................................... 31 Table 15: Comparison of on-bill loan-based financing to tariff-based financing. ........................................ 33 Table 16: Examples of rate design approaches for MLGW. ....................................................................... 35 Table 17: Proposed elimination of the fixed charge for low-income customers. ........................................ 36

Lower My Utility Bill - A Bold New Vision for Reducing Low Income Energy Burdens Page 5
1 The Challenge: High Energy Burdens and Arrearages
Energy burden is defined as the percent of income spent on energy bills. While the municipal utility serving Shelby County – Memphis Light, Gas and Water (MLGW) - enjoys some of the lowest utility rates in the U.S.,1 a national study2 completed in 2016 determined that:
• Memphis has the highest household energy burden of all public utilities in the nation; and that
• Memphis has the highest energy burden of the 50 largest cites in the US.
With nearly 50% of households in the county defined as low-income,3 a sizable portion of Shelby County residents are faced with utility bills that are disproportionately high when compared to household income. According to the national study, the median Memphian household spends 6.2% of its income on energy, and the median low-income household4 spends 13.2% of its income on energy. These are the highest energy burdens compared to all of the largest cities in the U.S. In addition, Memphis has the highest 3rd quartile low income energy burden at 25%, meaning that 25% of low-income Memphians spend more than 25% of their household income on utility bills.
Households with high energy burdens can be at risk for making tough choices between food, housing, medical care, transportation, energy, and water. This results in tough challenges – for residents who fear being shut-off by the utility if they fall behind in payment; and for the utility – that suffers arrearages from non-payment. According to the 2016 MLGW Annual Report, arrearages in 2016 alone accounted for:
• More than $6.8 million in revenue adjustments for nonpayment of bills for electricity;
• $1.4 million in revenue adjustments for natural gas; and
• $1 million in revenue adjustments for water.5
These arrearages represent a financial drain on the utility. An analysis completed by the American Public Power Association compares uncollectible accounts per dollar of revenue across public utilities nationwide. As shown in Figure 1, the national median is $0.0016, and the southeast median is $0.0017. For MLGW it is $0.0054 – almost 2 times the uncollectible bill burden for public utilities of a similar size and 3 times the uncollectible bill burden for public utilities in the Southeast. 6
Figure 1: Uncollectible accounts per revenue dollar.
1http://www.mlgw.com/images/content/files/pdf/MLGWAnnualReport2016-Web.pdf 2 Lifting the High Energy Burden in America’s Largest Cities: How Energy Efficiency Can Improve Low-Income and Underserved Communities; Ariel Drehobl and Lauren Ross, April 2016, http://aceee.org/research-report/u1602. 3 Based on recent census data 4 Low income customers are defined as customers with incomes at or below 80% of Area Median Income. 5 http://www.mlgw.com/images/content/files/pdf/MLGWAnnualReport2016-Web.pdf, Page M-3, M-4, and M-5. 6 American Public Power Association, “Financial and Operating Roles of Public Power Utilities,” December 2017.
$- $0.0010 $0.0020 $0.0030 $0.0040 $0.0050 $0.0060
NationalMedian
SoutheastMedian
Large PublicUtilitiesMedian
MLGW
Lower My Utility Bill - A Bold New Vision for Reducing Low Income Energy Burdens Page 6
2 The Opportunity: A Bold New Vision for the Future
The high energy burdens and large amount of arrearages by MLGW customers are strong indicators that although the utility is offering low electric rates on a per kWh basis, the low rates are not translating into affordable utility bills for MLGW customers who are struggling financially. Imagine low-income households in Shelby County experiencing a 15 to 25% reduction in their monthly electric, gas, and water bills.
Contemplate fewer tough choices being made between housing, food, medical, transportation, and energy costs by low-income households.
Envision a future in which low-income customers can afford their electric, gas, and water bills and do not fear shut-off by the utility.
Picture low-income customers living in homes that are cooler in the summer, warmer in the winter, with improved air quality and reduced health and safety issues.
Reflect on an enhanced customer relationship in which low-income households view their utility as a valued source of technical and financial support for reducing basic living costs.
All of this is achievable through the leadership of MLGW and other key stakeholders in Shelby County.
2.1 A “Cookbook” for Achieving the Vision
Presented in this report is a “cookbook” for achieving the vision above through two main “recipes.” The first recipe includes an aggressive new program that would improve energy and water efficiency in 50% of low-income households in Shelby County. All of these households would receive direct installation of energy and water savings measures (referred to as “direct install” or “DI”), with 40% of those households also receiving weatherization improvements (referred to as “weatherization” or “WX”). The second recipe includes eliminating the fixed charge included in monthly utility bills for all low-income customers. By increasing the efficiency of energy and water use and eliminating the fixed charged for low income households, those participating in:
• The direct installation offering are expected to achieve a 15% decrease in their monthly utility bills.
• Both the direct installation and the weatherization offerings are expected to achieve a 25% decrease in their monthly utility bills.
All other low income households will experience a 7% reduction in their monthly utility bills.
2.2 A Win-Win-Win for Shelby County, MLGW, and all Memphians
This exciting new program will address single family homes and multifamily apartment buildings. It will serve both homeowners and renters. It will reduce low-income utility bills by $148 million over the course of five years. As utility bills are reduced, arrearages in bill payment and costs of collection and disconnection are likely to decline. As the direct installation and weatherization workforce is expanded to deliver the program, approximately 330 new jobs will be created.7 The local economy will be stimulated by the purchase of goods and services needed to make the housing improvements. Demand charges paid by MLGW to TVA will decrease as the demand for load is reduced. Overall, the program will be a win-win-win for Shelby County and MLGW.
7 The jobs estimate is based on the assumptions outlined in Section 3 – Program Implementation Plan.

Lower My Utility Bill - A Bold New Vision for Reducing Low Income Energy Burdens Page 7
3 Program Design and Delivery Approach
3.1 Overview
The low-income direct installation, weatherization, and rate redesign program described in this report provides a powerful, compelling pathway for achieving the bold new vision of reducing 50% of Shelby County low-income households’ utility bills by 15 to 25%. A detailed program design, implementation plan, and budget for the proposed program are provided in this report.
In addition, recommendations are made to eliminate the fixed charge for all low income customers and to raise the capital and recover the investment needed to deliver the program by:
• Issuing bonds.
• Instituting a form of on-bill financing referred to as “tariff-based” financing; and
• Redesigning electric rates to increase by 1% per year for four years for non-low income high energy users.
The tariff-based financing offering will leverage past experience by MLGW (and the Tennessee Valley Authority) providing on-bill financing to utility customers in the region. The financing is structured to ensure that low-income customers participating in the financing achieve the anticipated bill savings net of financing costs. This innovative form of financing is described in detail in Section 7.3.
The balance of the program investment not recovered through on-bill financing will be recovered by redesigning electric rates to increase by 1% per year for four years for non-low-income customers who use more electricity than average for their rate class. This innovative approach to recovering the costs of prudent investments in energy efficiency and weatherization is described in detail in Section 7.5.
As a public utility with a deep commitment to meeting its customers’ needs, MLGW is well positioned to lead the way to an energy efficient and lower cost future for those most in need of relief from high energy burdens. This report is offered in the spirit of collaboration and peer-to-peer exchange with MLGW and key influencers and stakeholders in Memphis. It is likely – and expected – that the program design and budget will change as a result of future dialogue and interaction among local utility, housing, weatherization, financing, and economic development leaders. Friends of the Earth welcomes your feedback and engagement!
3.2 Population and Service Territory
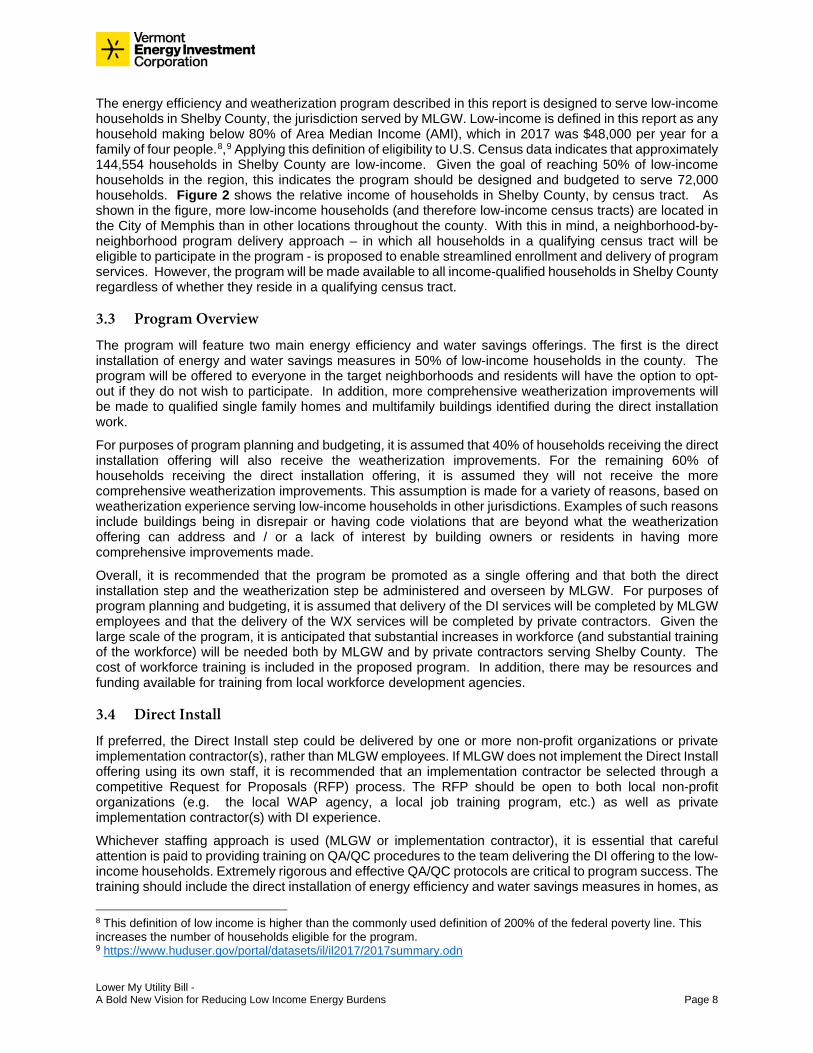
Figure 2: Relative household income in Shelby County by census tract.
Lighter colors depict lower income neighborhoods; darker colors depict higher income neighborhoods. The red line represents the boundary of the City of Memphis.
Lower My Utility Bill - A Bold New Vision for Reducing Low Income Energy Burdens Page 8
The energy efficiency and weatherization program described in this report is designed to serve low-income households in Shelby County, the jurisdiction served by MLGW. Low-income is defined in this report as any household making below 80% of Area Median Income (AMI), which in 2017 was $48,000 per year for a family of four people.8,9 Applying this definition of eligibility to U.S. Census data indicates that approximately 144,554 households in Shelby County are low-income. Given the goal of reaching 50% of low-income households in the region, this indicates the program should be designed and budgeted to serve 72,000 households. Figure 2 shows the relative income of households in Shelby County, by census tract. As shown in the figure, more low-income households (and therefore low-income census tracts) are located in the City of Memphis than in other locations throughout the county. With this in mind, a neighborhood-by-neighborhood program delivery approach – in which all households in a qualifying census tract will be eligible to participate in the program - is proposed to enable streamlined enrollment and delivery of program services. However, the program will be made available to all income-qualified households in Shelby County regardless of whether they reside in a qualifying census tract.
3.3 Program Overview
The program will feature two main energy efficiency and water savings offerings. The first is the direct installation of energy and water savings measures in 50% of low-income households in the county. The program will be offered to everyone in the target neighborhoods and residents will have the option to opt-out if they do not wish to participate. In addition, more comprehensive weatherization improvements will be made to qualified single family homes and multifamily buildings identified during the direct installation work.
For purposes of program planning and budgeting, it is assumed that 40% of households receiving the direct installation offering will also receive the weatherization improvements. For the remaining 60% of households receiving the direct installation offering, it is assumed they will not receive the more comprehensive weatherization improvements. This assumption is made for a variety of reasons, based on weatherization experience serving low-income households in other jurisdictions. Examples of such reasons include buildings being in disrepair or having code violations that are beyond what the weatherization offering can address and / or a lack of interest by building owners or residents in having more comprehensive improvements made.
Overall, it is recommended that the program be promoted as a single offering and that both the direct installation step and the weatherization step be administered and overseen by MLGW. For purposes of program planning and budgeting, it is assumed that delivery of the DI services will be completed by MLGW employees and that the delivery of the WX services will be completed by private contractors. Given the large scale of the program, it is anticipated that substantial increases in workforce (and substantial training of the workforce) will be needed both by MLGW and by private contractors serving Shelby County. The cost of workforce training is included in the proposed program. In addition, there may be resources and funding available for training from local workforce development agencies.
3.4 Direct Install
If preferred, the Direct Install step could be delivered by one or more non-profit organizations or private implementation contractor(s), rather than MLGW employees. If MLGW does not implement the Direct Install offering using its own staff, it is recommended that an implementation contractor be selected through a competitive Request for Proposals (RFP) process. The RFP should be open to both local non-profit organizations (e.g. the local WAP agency, a local job training program, etc.) as well as private implementation contractor(s) with DI experience.
Whichever staffing approach is used (MLGW or implementation contractor), it is essential that careful attention is paid to providing training on QA/QC procedures to the team delivering the DI offering to the low-income households. Extremely rigorous and effective QA/QC protocols are critical to program success. The training should include the direct installation of energy efficiency and water savings measures in homes, as 8 This definition of low income is higher than the commonly used definition of 200% of the federal poverty line. This increases the number of households eligible for the program. 9 https://www.huduser.gov/portal/datasets/il/il2017/2017summary.odn
Lower My Utility Bill - A Bold New Vision for Reducing Low Income Energy Burdens Page 9
well as the ability to identify and assess additional energy and water savings opportunities that could be addressed during the weatherization component of the program.
3.5 Weatherization
Similar to the DI offering, it is recommended that the WX offering be administered by MLGW staff and that the weatherization improvements be completed by qualified building and /or HVAC contractors, not utility staff. This will ensure that the work is done by contractors with specific training and experience in air and duct sealing, insulation installation, window and door replacements, and installation of HVAC equipment. Similar to the DI team, careful attention should be paid to training the WX team and making sure extremely rigorous QA/QC protocols are in place and followed.
3.6 Program Eligibility and Outreach
Qualifying households based on income can be administratively expensive and time-consuming, depending on the methodology used. To simplify the program design and reduce enrollment costs, it is recommended that all households located in neighborhoods in Shelby County that are classified by the US Census Bureau as having median incomes lower than 80% of AMI be eligible for the program. This alleviates the need to (and cost of) confirming income eligibility for each household individually. Under this approach, the DI offering would be made available to all households located in “census tracts” that meet the income eligibility target. In addition, the program would also be made available to income-qualified households in the County that do not happen to be located in one of the targeted census tracts. This approach errs on the side of making the program more inclusive, rather than less. However, participation will be voluntary and households will not be obligated to accept the DI or the WX offerings.
Eligible low-income households would be encouraged to enroll in the program using a number of outreach strategies that raise awareness of and generate interest in and enthusiasm for the program. These would include, for example:
• Direct mail • Neighborhood events • Door-to-door campaigns • Yard signs • Community-based organizations such as churches and schools • Utility bill inserts • TV and radio ads • Social media
In addition, the program should be aggressively promoted by MLGW as well as by respected and high-profile community organizations. It will be important that, as the program administrator, MLGW maintain strong communications with other organizations that also serve low-income households in Shelby County and who are trusted by the target population. Examples include local health, affordable housing, and food assistance programs. By coordinating with such programs, customer engagement and administrative costs for the DI and WX offerings can be optimized. An example of successful collaboration and coordination in other jurisdictions and a model that could be considered in Shelby County is One Touch.10 One Touch is an e-referral program that connects health, energy, and housing programs to improve health outcomes and reduce home energy use, at a reduced administrative cost. Another example is in December 2017, MLGW joined the Mayor and other partners to launch the Green & Health Homes Initiative to coordinate all agencies working to improve the health, housing, and energy outcomes for low-income Memphians.11
10 Piloted in New Hampshire, One Touch program is now used by five other communities: Omaha, NE; Minneapolis, MN; Greensboro, NH; Fitchburg, MA; and Vermont http://www.tohnenvironmental.com/what-we-do/one-touch/ 11 For more on the GHHI initiative: http://www.highgroundnews.com/features/HealthyHomesInitiative.aspx
Lower My Utility Bill - A Bold New Vision for Reducing Low Income Energy Burdens Page 10
3.7 The Neighborhood-based and County-wide Approaches to be Used
It is recommended that the Direct Installation and Weatherization program be carried out in two distinct ways:
1. A neighborhood-by-neighborhood campaign implemented in each of the Shelby County low-income census tracts during which a team of trained DI specialists:
o Focuses on serving a specific neighborhood in a well-publicized, high-profile, and highly organized push;
o Moves through the neighborhood building-by-building serving those who pre-enrolled and recruiting new enrollments while in the area;
o Installs the DI energy and water savings measures appropriate for the building (for both single family homes and apartments);
o Assesses the building for the need for weatherization improvements; and o Identifies any health, safety, code, or repair issues that would need to be addressed before
being eligible for the WX offering. 2. A county-wide campaign in which it is made clear:
o That the program is available to income eligible households located in any neighborhood in Shelby County, for single family and multifamily buildings, and for both building owners and renters; and
o That DI and potentially WX services will be made available at such locations on a pre-scheduled basis with the goal of serving multiple households that are located nearby in an organized, coordinated way. This is important to optimize program delivery costs.
To reduce administrative costs and reach as many households as quickly as possible, program activities should be focused on the neighborhood-by-neighborhood approach first. This should be done while also remaining responsive to interest from individual, income-eligible participants not located in a low-income census tract neighborhood. Depending upon the success of the first two approaches, the program may need to consider a greater emphasis on serving income eligible households not located in the targeted neighborhoods.
The program should prioritize income-qualified census tracts with housing stock that is most likely to need comprehensive energy efficiency improvements. It should identify specific neighborhoods for outreach and proceed with a door-to-door and/or community center organized enrollment campaign, partnering with local community groups to help spread the word and generate enthusiasm. To the extent that the DI work can be carried out in a focused, limited-time event, this will reduce costs and create a buzz that will encourage people to not miss out on their opportunity for the valuable improvements being offered.
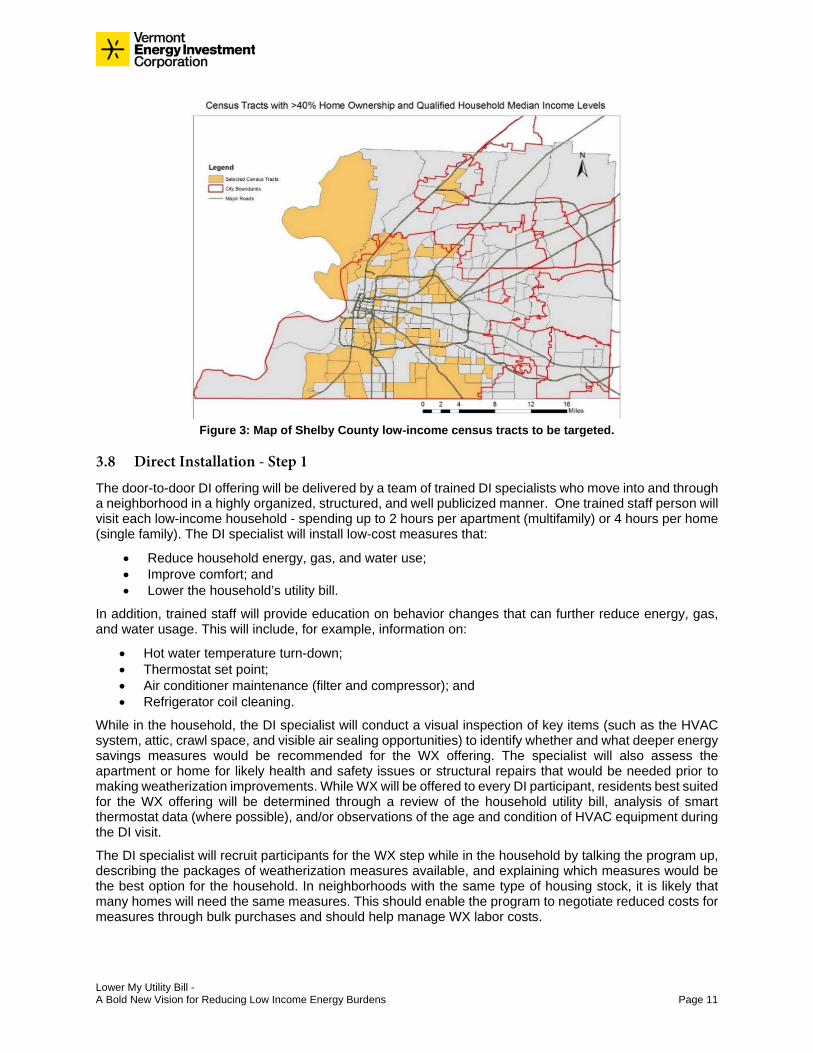
The program should begin by targeting income qualified census tracts with at least 40% homeownership. Figure 3 shows the 59 income qualified census tracts in Shelby County with greater than 40% homeownership (out of 221 census tracts in the county). The number of households represented in these census tracts is approximately 86,000 while the target participation for the five-year program is 72,000.
Lower My Utility Bill - A Bold New Vision for Reducing Low Income Energy Burdens Page 11
Figure 3: Map of Shelby County low-income census tracts to be targeted.
3.8 Direct Installation - Step 1
The door-to-door DI offering will be delivered by a team of trained DI specialists who move into and through a neighborhood in a highly organized, structured, and well publicized manner. One trained staff person will visit each low-income household - spending up to 2 hours per apartment (multifamily) or 4 hours per home (single family). The DI specialist will install low-cost measures that:
• Reduce household energy, gas, and water use; • Improve comfort; and • Lower the household’s utility bill.
In addition, trained staff will provide education on behavior changes that can further reduce energy, gas, and water usage. This will include, for example, information on:
• Hot water temperature turn-down; • Thermostat set point; • Air conditioner maintenance (filter and compressor); and • Refrigerator coil cleaning.
While in the household, the DI specialist will conduct a visual inspection of key items (such as the HVAC system, attic, crawl space, and visible air sealing opportunities) to identify whether and what deeper energy savings measures would be recommended for the WX offering. The specialist will also assess the apartment or home for likely health and safety issues or structural repairs that would be needed prior to making weatherization improvements. While WX will be offered to every DI participant, residents best suited for the WX offering will be determined through a review of the household utility bill, analysis of smart thermostat data (where possible), and/or observations of the age and condition of HVAC equipment during the DI visit.
The DI specialist will recruit participants for the WX step while in the household by talking the program up, describing the packages of weatherization measures available, and explaining which measures would be the best option for the household. In neighborhoods with the same type of housing stock, it is likely that many homes will need the same measures. This should enable the program to negotiate reduced costs for measures through bulk purchases and should help manage WX labor costs.
Lower My Utility Bill - A Bold New Vision for Reducing Low Income Energy Burdens Page 12
3.8.1 Direct Install Measures
The DI measures offered though the program will include the following: • Faucet aerator • Low-flow showerhead • Residential lighting- LED direct install • Duct sealing • Power strips (entertainment center) • Pipe wrap • Tank wrap • Air conditioner maintenance and refrigerant charge • Toilet flapper replacement • Smart thermostat
Not every household will receive all of the measures. The measures installed will depend on individual household conditions. For example, only leaky toilets will receive a new toilet flapper. The average measure cost is estimated to be $270 per household. With labor and program administrative costs included, the average cost per participant is estimated to be $370.12
3.8.2 Thermostats
Smart thermostats are included in the DI offering primarily because of the significant energy savings they can provide. Smart thermostats have the added benefit of allowing MLGW to offer an incentive to low-income residents for enrollment in a demand response program. Smart thermostats can be adjusted by MLGW during peak demand events to reduce the need to purchase electricity at the time when the wholesale cost is high. Smart thermostats have demonstrated a demand saving potential of 2.8 kW per home in other states.13 This could result in 49 MW of demand savings for MLGW from the low-income participants who receive the DI offering and who also have an internet connection.
Smart thermostats do not necessarily need an internet connection to perform many of their energy-saving functions. However, without a Wi-Fi connection they lose the ability to perform demand response and other energy saving functions such as adjusting the temperature while residents are away. Analyzing the building envelope effectiveness and the need for air sealing and insulation also cannot be done without a smart thermostat being connected to the internet.
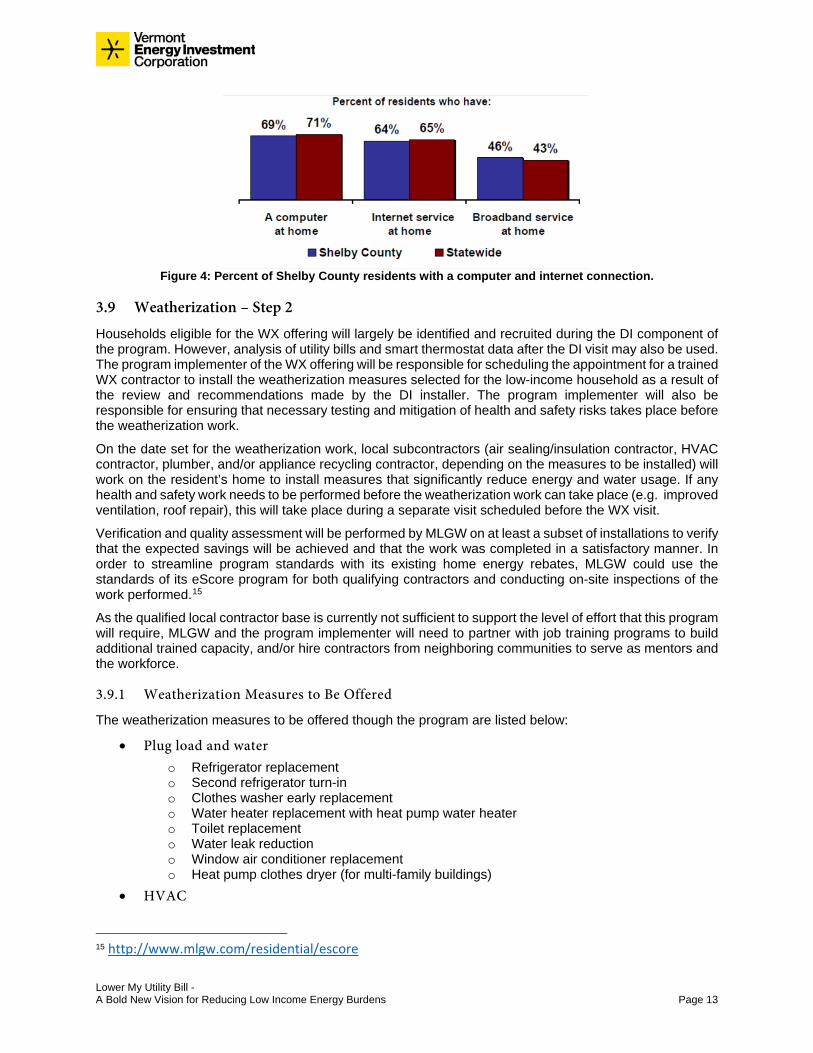
While not every low-income household in Memphis will have an internet connection, it is important to include smart thermostats in the DI offering because of their usefulness to achieving the programs energy and cost savings goals. The percentage of residents in Shelby County who have computers in their residence is provided in Figure 4. Low-income residents are expected to have fewer internet connections.14 Given information in the figure, it is assumed in the program plan and budget that smart thermostats will be installed in 60% of DI households. While it is also assumed about one third of the thermostats will not be connected to the internet due to a lack of Wi-Fi connection, the thermostats will still provide energy savings to the residents and will be cost effective energy efficiency improvements to the households.
12 See Section 5.2 Participation and Investment by Year – Direct Install for detailed description of our DI assumptions. 13 SMECO, Maryland Smart Thermostat Pilot Evaluation, 2017. 14 http://www.connectedtn.org/_documents/ConnectedShelbyCounty-DigitalInclusionReport.pdf
Lower My Utility Bill - A Bold New Vision for Reducing Low Income Energy Burdens Page 13
Figure 4: Percent of Shelby County residents with a computer and internet connection.
3.9 Weatherization – Step 2
Households eligible for the WX offering will largely be identified and recruited during the DI component of the program. However, analysis of utility bills and smart thermostat data after the DI visit may also be used. The program implementer of the WX offering will be responsible for scheduling the appointment for a trained WX contractor to install the weatherization measures selected for the low-income household as a result of the review and recommendations made by the DI installer. The program implementer will also be responsible for ensuring that necessary testing and mitigation of health and safety risks takes place before the weatherization work.
On the date set for the weatherization work, local subcontractors (air sealing/insulation contractor, HVAC contractor, plumber, and/or appliance recycling contractor, depending on the measures to be installed) will work on the resident’s home to install measures that significantly reduce energy and water usage. If any health and safety work needs to be performed before the weatherization work can take place (e.g. improved ventilation, roof repair), this will take place during a separate visit scheduled before the WX visit.
Verification and quality assessment will be performed by MLGW on at least a subset of installations to verify that the expected savings will be achieved and that the work was completed in a satisfactory manner. In order to streamline program standards with its existing home energy rebates, MLGW could use the standards of its eScore program for both qualifying contractors and conducting on-site inspections of the work performed.15
As the qualified local contractor base is currently not sufficient to support the level of effort that this program will require, MLGW and the program implementer will need to partner with job training programs to build additional trained capacity, and/or hire contractors from neighboring communities to serve as mentors and the workforce.
3.9.1 Weatherization Measures to Be Offered
The weatherization measures to be offered though the program are listed below:
• Plug load and water o Refrigerator replacement o Second refrigerator turn-in o Clothes washer early replacement o Water heater replacement with heat pump water heater o Toilet replacement o Water leak reduction o Window air conditioner replacement o Heat pump clothes dryer (for multi-family buildings)
• HVAC
15 http://www.mlgw.com/residential/escore
Lower My Utility Bill - A Bold New Vision for Reducing Low Income Energy Burdens Page 14
o Air source heat pump (ducted), replacing gas and electric furnace o Ductless mini-split
• Air sealing and insulation o Air sealing and attic and floor insulation o Window replacement o Door replacement
3.9.2 Weatherization Packages and Cost Ranges
To simplify decisions for the households, and depending on the building’s health and safety issues identified during the DI visit, the WX measures will be offered in 3 packages. The investment per household will depend on the mix of measures most appropriate for the building. Each of the packages are described below along with the range of investment for providing the package to a household.
1. Plug load and water only. This package of measure can be installed even if there are health and safety issues that do not allow for HVAC upgrades, or air sealing and insulation. Investment: $300 to $1,000
2. HVAC, plug load, and water. Replacing an electric furnace (or outdated air source heat pump)16 with an efficient air source heat pump provides the greatest savings per measure. This package of measures can be installed even if there are health and safety issues that do not allow for air sealing and insulation. Investment: $3,800 to $5,500
3. Air sealing, insulation, and HVAC. Where any and all health and safety issues can be remediated, replacing an electric furnace with an air source heat pump and improving the building air leakage and insulation will provide the most savings for the cost. Investment: ~$7,000
Many of the neighborhoods are likely to have similar housing characteristics and therefore will likely need similar weatherization measures. As such, MLGW may be able to achieve economies of scale working within a specific geographic area during a specific time period. MLGW should attempt to secure price agreements with its qualified contractor base to simplify the process of enrolling and serving participants in the WX component of the program.
While the measures listed above were used for program planning and budgeting purposes, it may be appropriate to adjust the measure list later, once on-the-ground information is obtained during the DI component of the program.
3.10 Rental vs Homeowners; Multifamily vs. Single Family
A significant number of low-income people in Shelby County rent homes and apartments, and they tend to have the most severe housing cost burdens. According to the City of Memphis Division of Housing and Community Development, “over 32,000 renter households are paying more than 50% of their income for rent”.17 Therefore, it is critically important that this program address the utility costs of renters as well as homeowners in order to effectively address low-income energy burdens.
Providing energy and water saving program services to renters will require direct outreach and engagement of landlords. Many of the homes and multifamily buildings that low-income renters live in may be in disrepair and need investments beyond even the water and energy saving measures provided by these programs. Furthermore, there is an issue of split incentives whereby a landlord is reluctant to make investments that result in reduced utility costs for his/her renters as opposed to directly benefiting the owner. There is an existing rental property ordinance that prescribes certain building and energy standards for rental properties
16 Heat pumps represent only 3% of all heating equipment in Memphis (Source: 2013 American Housing Survey - Memphis Metropolitan Statistical Area). 17 http://www.memphistn.gov/portals/0/pdf_forms/con-plan-draft-for-public-review.pdf, page 26.
Lower My Utility Bill - A Bold New Vision for Reducing Low Income Energy Burdens Page 15
in Memphis.18 It is reported that the ordinance may not be fully enforced. Because of these factors, the City and County are urged to buoy such efforts through enforcement of the rental property ordinance and through the use of this program as a cost-effective way for landlords to come into compliance.
Finally, landlords should sign an agreement which stipulates that rents will not be increased due solely to the energy and water savings improvements made by the program. This is a common requirement for low-income weatherization programs. Other programs (e.g. Austin,Texas) have found that their efficiency programs do not typically result in rent increases for low-income residents.19
3.11 Rebates
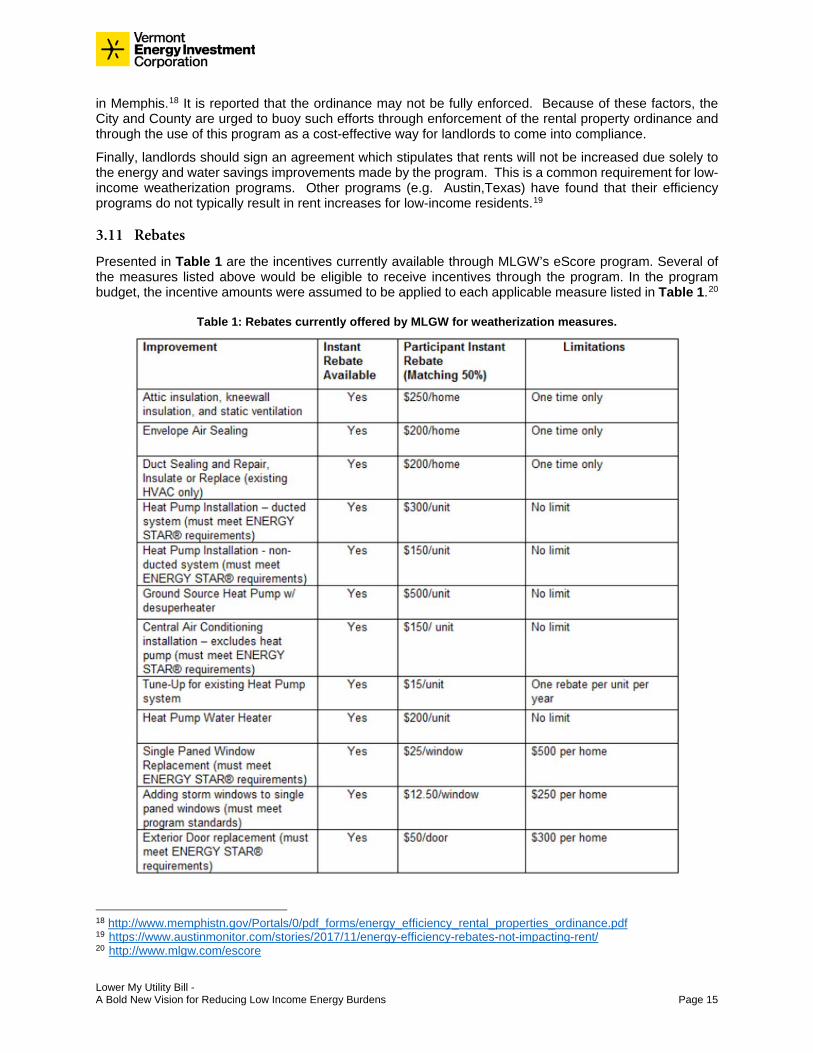
Presented in Table 1 are the incentives currently available through MLGW’s eScore program. Several of the measures listed above would be eligible to receive incentives through the program. In the program budget, the incentive amounts were assumed to be applied to each applicable measure listed in Table 1.20
Table 1: Rebates currently offered by MLGW for weatherization measures.
18 http://www.memphistn.gov/Portals/0/pdf_forms/energy_efficiency_rental_properties_ordinance.pdf 19 https://www.austinmonitor.com/stories/2017/11/energy-efficiency-rebates-not-impacting-rent/ 20 http://www.mlgw.com/escore

Lower My Utility Bill - A Bold New Vision for Reducing Low Income Energy Burdens Page 16
4 Program Implementation Plan
The implementation plan and schedule for delivering the DI and WX offerings to low-income households throughout Shelby County are presented in Figure 5 below. The figure illustrates the entire implementation process from recruitment to the DI campaign to the WX improvements to the on-site inspection and verification of the weatherization measures post-installation. In many cases, recruitment and installation during the DI campaign will happen simultaneously while going door-to-door in each neighborhood. The time frame associated with each step is provided from the contractor’s, building owner’s or renter’s, and program administrator’s perspective. In order to keep the program as streamlined and cost effective as possible, both the DI campaign and the WX component should seek to serve as many households in a target neighborhood as possible.
Figure 5: Program implementation plan.

Lower My Utility Bill - A Bold New Vision for Reducing Low Income Energy Burdens Page 17
4.1 Engage with Key Stakeholders to Ensure Local Support for the Offering
A critical first step in developing and then implementing this aggressive new program is to engage with key representatives from local organizations and programs serving low-income people and the neighborhoods in which they reside. Interviews with local stakeholders indicate a number of efforts currently underway which are aligned with the goals of the new program, and yet which suffer from a lack of coordination and collaboration across the existing organizations and their current offerings. It is important that the new DI and WX offerings be introduced thoughtfully and carefully, in a way that helps improve cross-organization and cross-program coordination and collaboration in the future.
For example, City and County efforts to improve health and housing durability could potentially provide resources for building improvements and repairs needed prior to successful installation of weatherization measures. In addition, MLGW’s existing Share the Pennies program and the federal Weatherization Assistance Program might be able to offset some of the costs of energy efficiency measures. Also, local workforce development efforts sponsored by local philanthropists and others might help train the local workforce to carry out the new program. Overall, local grassroots efforts such as Memphis Has the Power! have the potential to effectively rally the community behind a big, bold vision to significantly improve the lives of low-income people in Shelby County. Ultimately, keeping these important local efforts engaged and pulling in the same direction will improve outcomes for the new program. The risk of not doing so is further division of efforts creating confusion, discontent, and distrust within the communities the program is aiming to serve.
4.2 Annual Implementation Targets
To reach the participation target set by Friends of the Earth of 50% of low-income residents in Shelby County, MLGW will need to enroll about 72,000 residents in the program (Figure 6).
Figure 6: Target program participation by year.
MLGW should launch the program by hiring and/or assigning internal MLGW staff to administer the DI component of the program. Table 2 below shows the projected participation in the DI component each year and the number of DI specialists required to execute the program.
Table 2: Annual implementation targets – direct install.
Direct Install Year 1/ Startup Year 2 Year 3 Year 4 Year 5
020,00040,00060,00080,000
100,000120,000140,000160,000
1 2 3 4 5 Total LIResidents in
Shelby CountyProgram Year
Target Program Participation by YearDI Participants WX Participants
Lower My Utility Bill - A Bold New Vision for Reducing Low Income Energy Burdens Page 18
Participants 7,300 14,500 15,900 17,300 17,300 Direct Install Specialists 14 26 28 32 33 Participants per business day 29 58 64 69 69
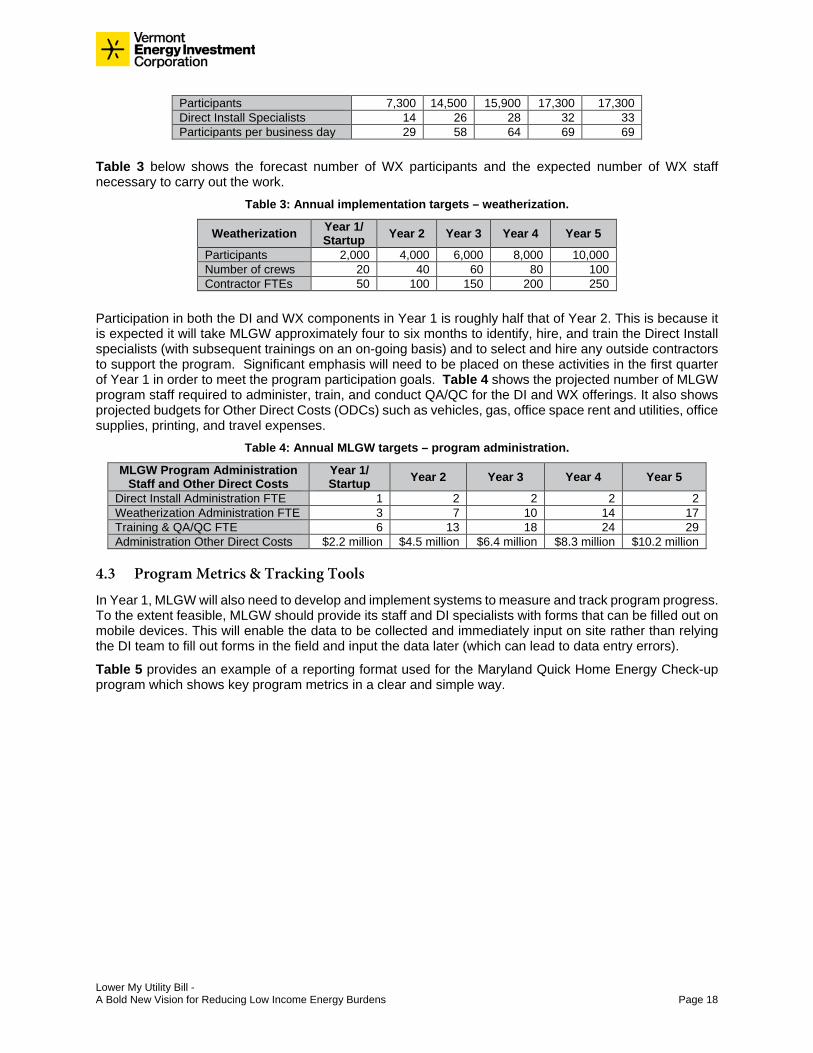
Table 3 below shows the forecast number of WX participants and the expected number of WX staff necessary to carry out the work.
Table 3: Annual implementation targets – weatherization.
Weatherization Year 1/ Startup Year 2 Year 3 Year 4 Year 5
Participants 2,000 4,000 6,000 8,000 10,000 Number of crews 20 40 60 80 100 Contractor FTEs 50 100 150 200 250
Participation in both the DI and WX components in Year 1 is roughly half that of Year 2. This is because it is expected it will take MLGW approximately four to six months to identify, hire, and train the Direct Install specialists (with subsequent trainings on an on-going basis) and to select and hire any outside contractors to support the program. Significant emphasis will need to be placed on these activities in the first quarter of Year 1 in order to meet the program participation goals. Table 4 shows the projected number of MLGW program staff required to administer, train, and conduct QA/QC for the DI and WX offerings. It also shows projected budgets for Other Direct Costs (ODCs) such as vehicles, gas, office space rent and utilities, office supplies, printing, and travel expenses.
Table 4: Annual MLGW targets – program administration.
MLGW Program Administration Staff and Other Direct Costs
Year 1/ Startup Year 2 Year 3 Year 4 Year 5
Direct Install Administration FTE 1 2 2 2 2 Weatherization Administration FTE 3 7 10 14 17 Training & QA/QC FTE 6 13 18 24 29 Administration Other Direct Costs $2.2 million $4.5 million $6.4 million $8.3 million $10.2 million
4.3 Program Metrics & Tracking Tools
In Year 1, MLGW will also need to develop and implement systems to measure and track program progress. To the extent feasible, MLGW should provide its staff and DI specialists with forms that can be filled out on mobile devices. This will enable the data to be collected and immediately input on site rather than relying the DI team to fill out forms in the field and input the data later (which can lead to data entry errors).
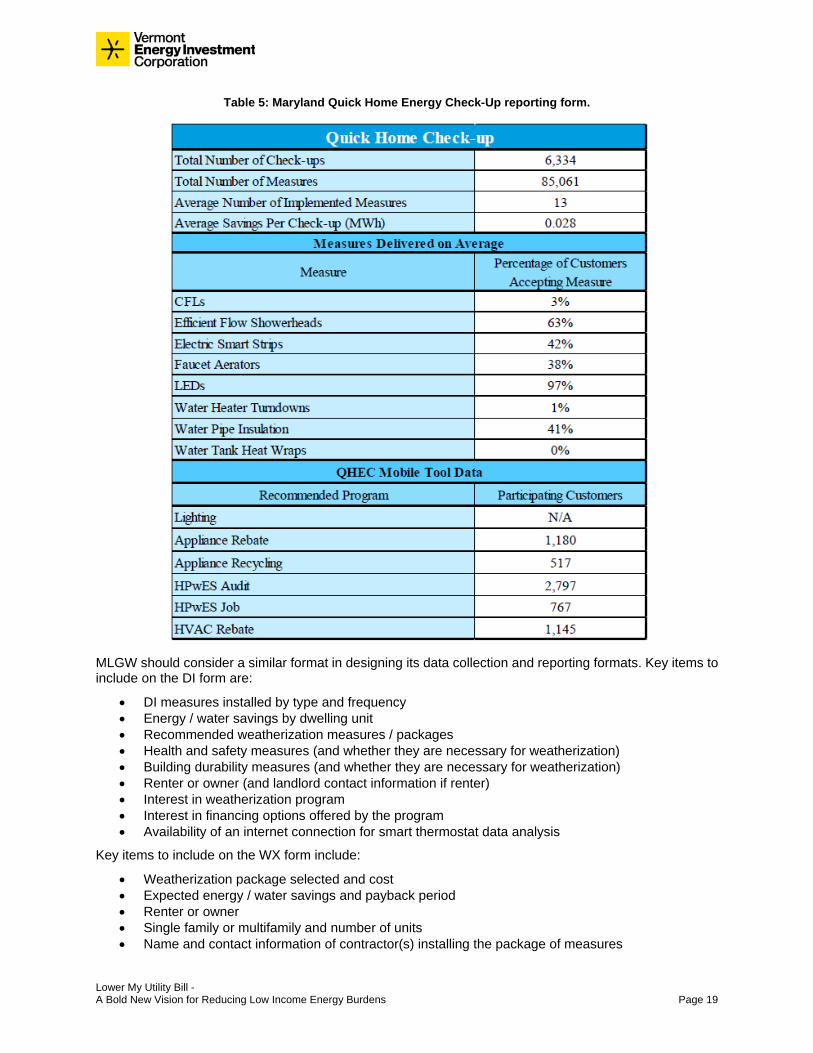
Table 5 provides an example of a reporting format used for the Maryland Quick Home Energy Check-up program which shows key program metrics in a clear and simple way.
Lower My Utility Bill - A Bold New Vision for Reducing Low Income Energy Burdens Page 19
Table 5: Maryland Quick Home Energy Check-Up reporting form.
MLGW should consider a similar format in designing its data collection and reporting formats. Key items to include on the DI form are:
• DI measures installed by type and frequency • Energy / water savings by dwelling unit • Recommended weatherization measures / packages • Health and safety measures (and whether they are necessary for weatherization) • Building durability measures (and whether they are necessary for weatherization) • Renter or owner (and landlord contact information if renter) • Interest in weatherization program • Interest in financing options offered by the program • Availability of an internet connection for smart thermostat data analysis
Key items to include on the WX form include:
• Weatherization package selected and cost • Expected energy / water savings and payback period • Renter or owner • Single family or multifamily and number of units • Name and contact information of contractor(s) installing the package of measures
Lower My Utility Bill - A Bold New Vision for Reducing Low Income Energy Burdens Page 20
• QA/QC results, including any failures to meet program standards and necessary follow-ups • Participant satisfaction with the program
There are likely other valuable pieces of data to collect which may improve the efficiency and effectiveness of program delivery. MLGW should test its program collection tools with internal staff and external contractors to gauge usability and value, use their feedback to refine the data collection tools, and then train all program staff and contractors to use them correctly.
4.4 Direct Install Launch – Year 1
MLGW should work with local stakeholders to select at least 4 to 10 census tracts to target in the first year of the program, and to identify a champion(s) in each neighborhood to help promote and stimulate interest in the offering. The chance of success will be greater if there are local champions for the program in each neighborhood, both during program launch and during household recruitment. Eligible neighborhoods within each census tract should be identified and door-to-door campaigns scheduled to ensure a steady stream of participants. Once MLGW has determined a schedule for the neighborhood-by-neighborhood campaigns, it should conduct outreach to the neighborhoods 2 to 4 weeks in advance of the door-to-door activity. This will ensure that residents know when the event will happen and what to expect, but will not be so far in advance that they forget. If there is a community center or other gathering place (such as a park, church, or school), try to hold a launch event with food and information, and use that event to get as many residents as possible to schedule their DI visit.
DI visits should be scheduled within a 1 to 3 week period (depending on the size of the neighborhood) to keep administrative costs down by reducing travel time from one home to another. Once the DI visits begin, MLGW should have staff in the neighborhood attempt to enroll others in the community by knocking on doors, placing door hangers with program contact information for those that aren’t home, and placing yard signs in front of those homes being served with program contact information. This will enable neighbors to talk to one another about the program and should lead to additional program participation.
For multifamily buildings, MLGW should work with the building owner and/or manager to post information in common areas and/or notices to tenants about the DI program and when it will occur. The owner may or may not want to be involved in the notification of tenants. MLGW should remain open to either option, providing support materials if the landlord would like to have an active role. The building owner or manager should be provided education on the energy and water saving measures so they understand the value and maintenance of the measured being installed. They should be present during the campaign to assist DI program staff with accessing building units for installation. Materials should be installed in both residential units and common areas in order to maximize energy savings.
Once a multifamily building is enrolled, a DI campaign can occur in as little as one day or multiple days, depending on the size of the building and the number of DI staff performing the work. MLGW should also have a trained multifamily building energy auditor (one of the QA/QC and training staff) on site to discuss with the building owner or manager what additional energy and water saving measures would be most cost effective.
4.5 Weatherization Launch – Year 1
As the DI program is launching, MLGW should also be preparing to launch the WX component. Having the qualified contractors enrolled and weatherization packages scoped and priced will enable an easy transition for DI program participants who are interested in deeper efficiency measures.
MLGW may be able to launch the WX component using its Qualified Contractor Network being utilized for the eScore program. However, it is expected that the number of contractors in the network will be insufficient to serve the number of participants necessary to meet the goals of this program over its five year timeframe. Therefore, MLGW will also need to identify additional contractors for its network, including tapping into local workforce development programs to train new contractors. As noted in the Weatherization Program table above, the number of full time employees necessary to carry out the work is expected to increase from the previous year by approximately 50, for each of the five years.
Lower My Utility Bill - A Bold New Vision for Reducing Low Income Energy Burdens Page 21
4.6 Direct Install and Weatherization - Years 2 – 5
Once the DI and WX components have been launched, MLGW will need to perform ongoing QA/QC of the program, contractor recruitment and training, participant recruitment, and stakeholder engagement. The stakeholder advisory committee should continue to meet on at least a quarterly basis for the duration of the program, and MLGW should provide at least quarterly reporting to this group on program progress, as well as any challenges/barriers and actions it is taking to overcome them.
4.7 Program Staff and Contractors Needed to Administer and Implement the Program
New MLGW dedicated program staff will be necessary to oversee the program and contractors, including:
• Project manager • Contractor coordinator • Outreach coordinator • Verification and QA auditors / EM&V staff
Additional work will also be expected for existing MGLW personnel such as:
• Marketing staff • Customer support • Measure characterization / cost-effectiveness calculations specialists • Accounting and rebate fulfillment • Data analytics • Tracking and reporting
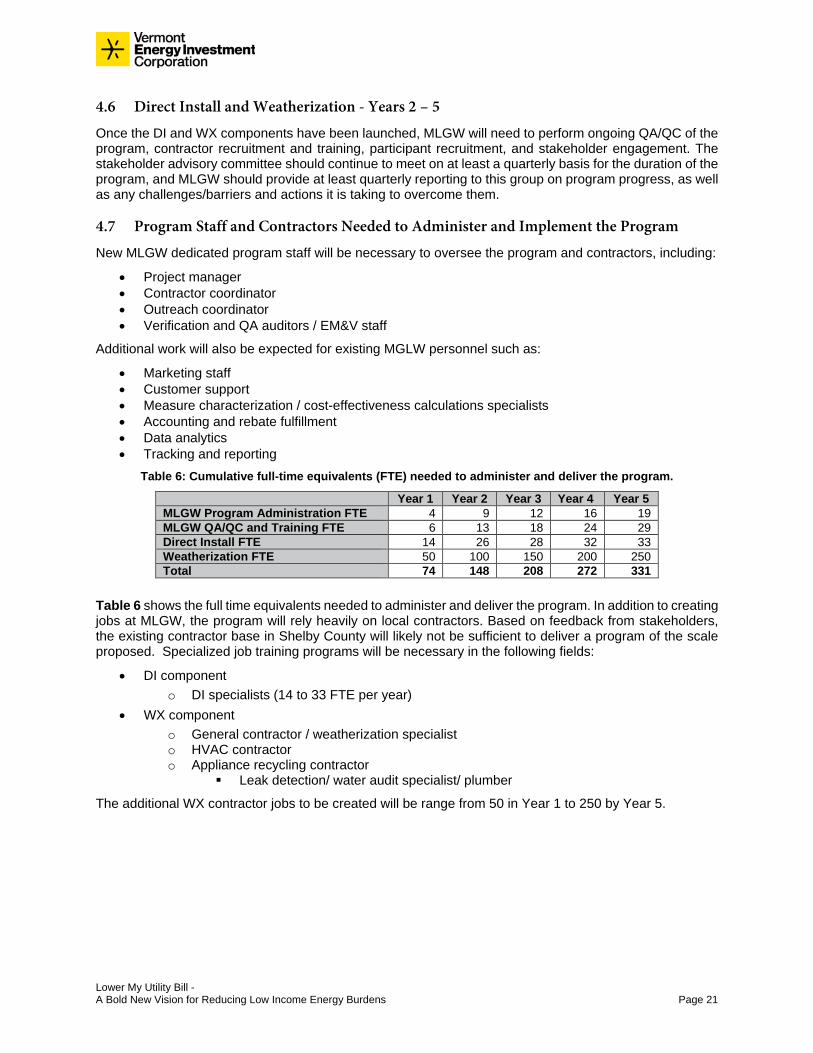
Table 6: Cumulative full-time equivalents (FTE) needed to administer and deliver the program.
Year 1 Year 2 Year 3 Year 4 Year 5 MLGW Program Administration FTE 4 9 12 16 19 MLGW QA/QC and Training FTE 6 13 18 24 29 Direct Install FTE 14 26 28 32 33 Weatherization FTE 50 100 150 200 250 Total 74 148 208 272 331
Table 6 shows the full time equivalents needed to administer and deliver the program. In addition to creating jobs at MLGW, the program will rely heavily on local contractors. Based on feedback from stakeholders, the existing contractor base in Shelby County will likely not be sufficient to deliver a program of the scale proposed. Specialized job training programs will be necessary in the following fields:
• DI component o DI specialists (14 to 33 FTE per year)
• WX component o General contractor / weatherization specialist o HVAC contractor o Appliance recycling contractor
Leak detection/ water audit specialist/ plumber
The additional WX contractor jobs to be created will be range from 50 in Year 1 to 250 by Year 5.
Lower My Utility Bill - A Bold New Vision for Reducing Low Income Energy Burdens Page 22
5 Program Savings and Utility Bill Reductions
Overall, this aggressive new direct installation, weatherization, and rate redesign program will save MLGW’s low-income customers who suffer one of the highest energy burdens in the nation:
• More than $22 million in utility bill savings in Year 1 of the program;
• Increasing to an estimated $148 million in cumulative utility bill savings over the five year program implementation period.
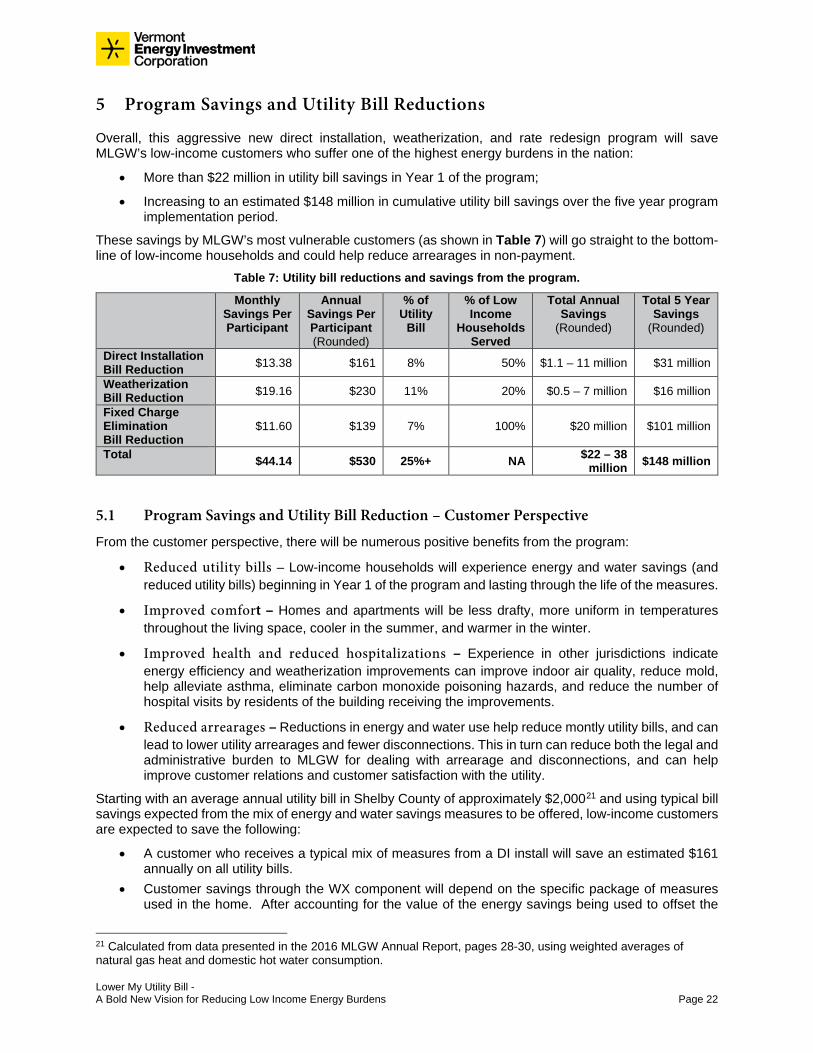
These savings by MLGW’s most vulnerable customers (as shown in Table 7) will go straight to the bottom-line of low-income households and could help reduce arrearages in non-payment.
Table 7: Utility bill reductions and savings from the program.
Monthly Savings Per Participant
Annual Savings Per Participant (Rounded)
% of Utility
Bill
% of Low Income
Households Served
Total Annual Savings
(Rounded)
Total 5 Year Savings
(Rounded)
Direct Installation Bill Reduction $13.38 $161 8% 50% $1.1 – 11 million $31 million
Weatherization Bill Reduction $19.16 $230 11% 20% $0.5 – 7 million $16 million
Fixed Charge Elimination Bill Reduction
$11.60 $139 7% 100% $20 million $101 million
Total $44.14 $530 25%+ NA $22 – 38 million $148 million
5.1 Program Savings and Utility Bill Reduction – Customer Perspective
From the customer perspective, there will be numerous positive benefits from the program:
• Reduced utility bills – Low-income households will experience energy and water savings (and reduced utility bills) beginning in Year 1 of the program and lasting through the life of the measures.
• Improved comfort – Homes and apartments will be less drafty, more uniform in temperatures throughout the living space, cooler in the summer, and warmer in the winter.
• Improved health and reduced hospitalizations – Experience in other jurisdictions indicate energy efficiency and weatherization improvements can improve indoor air quality, reduce mold, help alleviate asthma, eliminate carbon monoxide poisoning hazards, and reduce the number of hospital visits by residents of the building receiving the improvements.
• Reduced arrearages – Reductions in energy and water use help reduce montly utility bills, and can lead to lower utility arrearages and fewer disconnections. This in turn can reduce both the legal and administrative burden to MLGW for dealing with arrearage and disconnections, and can help improve customer relations and customer satisfaction with the utility.
Starting with an average annual utility bill in Shelby County of approximately $2,00021 and using typical bill savings expected from the mix of energy and water savings measures to be offered, low-income customers are expected to save the following:
• A customer who receives a typical mix of measures from a DI install will save an estimated $161 annually on all utility bills.
• Customer savings through the WX component will depend on the specific package of measures used in the home. After accounting for the value of the energy savings being used to offset the
21 Calculated from data presented in the 2016 MLGW Annual Report, pages 28-30, using weighted averages of natural gas heat and domestic hot water consumption.
Lower My Utility Bill - A Bold New Vision for Reducing Low Income Energy Burdens Page 23
cost of on-bill financing, the net savings on a participating household’s utility bill will be approximately:
1. $80 annual savings for those receiving the plug load and water saving measures; or 2. $300 annual savings for those receiving HVAC improvements, as well as the plug load and
water savings measures; or 3. $375 annual savings for those receiving air sealing, insulation, and HVAC improvements.
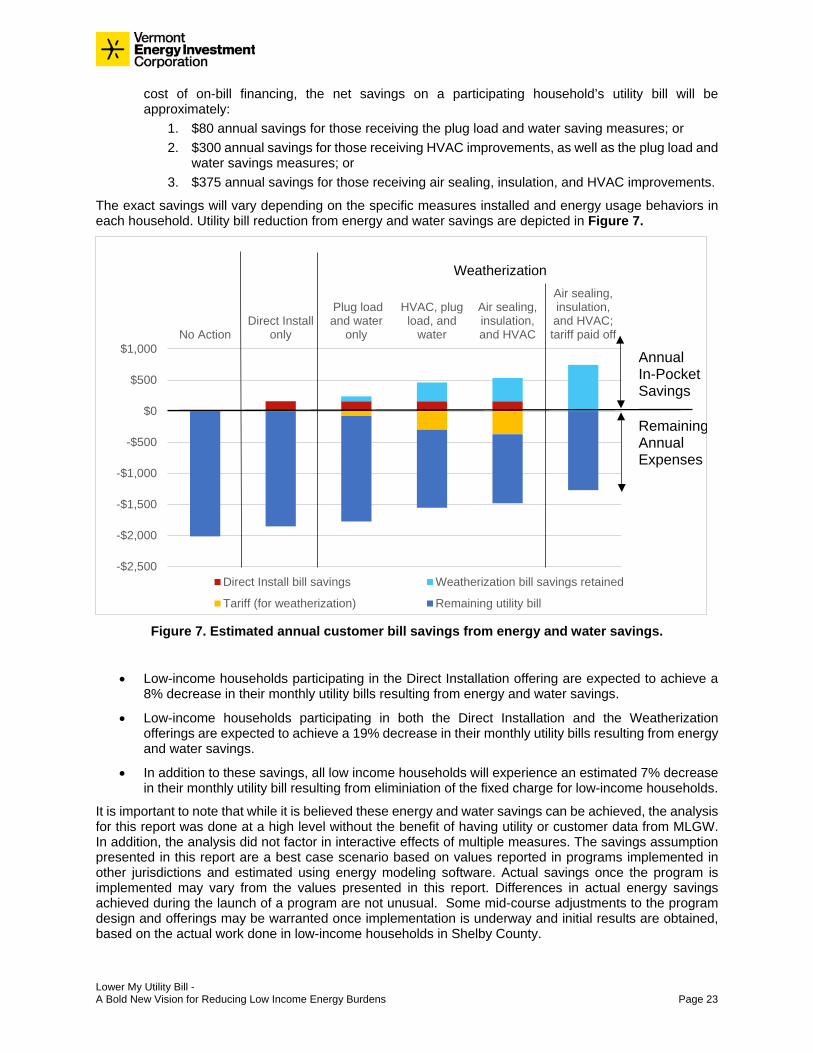
The exact savings will vary depending on the specific measures installed and energy usage behaviors in each household. Utility bill reduction from energy and water savings are depicted in Figure 7.
Figure 7. Estimated annual customer bill savings from energy and water savings.
• Low-income households participating in the Direct Installation offering are expected to achieve a 8% decrease in their monthly utility bills resulting from energy and water savings.
• Low-income households participating in both the Direct Installation and the Weatherization offerings are expected to achieve a 19% decrease in their monthly utility bills resulting from energy and water savings.
• In addition to these savings, all low income households will experience an estimated 7% decrease in their monthly utility bill resulting from eliminiation of the fixed charge for low-income households.
It is important to note that while it is believed these energy and water savings can be achieved, the analysis for this report was done at a high level without the benefit of having utility or customer data from MLGW. In addition, the analysis did not factor in interactive effects of multiple measures. The savings assumption presented in this report are a best case scenario based on values reported in programs implemented in other jurisdictions and estimated using energy modeling software. Actual savings once the program is implemented may vary from the values presented in this report. Differences in actual energy savings achieved during the launch of a program are not unusual. Some mid-course adjustments to the program design and offerings may be warranted once implementation is underway and initial results are obtained, based on the actual work done in low-income households in Shelby County.
-$2,500
-$2,000
-$1,500
-$1,000
-$500
$0
$500
$1,000No Action
Direct Installonly
Plug loadand water
only
HVAC, plugload, and
water
Air sealing,insulation,and HVAC
Air sealing,insulation,and HVAC;tariff paid off
Weatherization
Direct Install bill savings Weatherization bill savings retained
Tariff (for weatherization) Remaining utility bill
Annual In-Pocket Savings
Remaining Annual Expenses
Lower My Utility Bill - A Bold New Vision for Reducing Low Income Energy Burdens Page 24
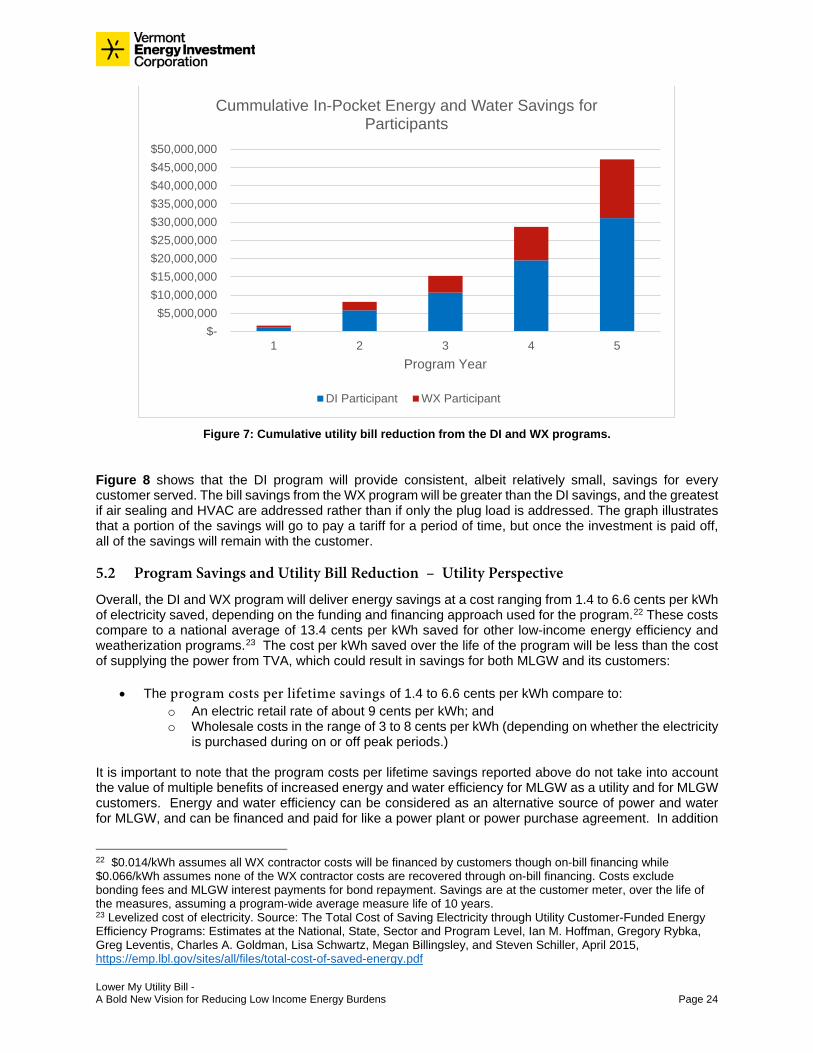
Figure 7: Cumulative utility bill reduction from the DI and WX programs.
Figure 8 shows that the DI program will provide consistent, albeit relatively small, savings for every customer served. The bill savings from the WX program will be greater than the DI savings, and the greatest if air sealing and HVAC are addressed rather than if only the plug load is addressed. The graph illustrates that a portion of the savings will go to pay a tariff for a period of time, but once the investment is paid off, all of the savings will remain with the customer.
5.2 Program Savings and Utility Bill Reduction – Utility Perspective
Overall, the DI and WX program will deliver energy savings at a cost ranging from 1.4 to 6.6 cents per kWh of electricity saved, depending on the funding and financing approach used for the program.22 These costs compare to a national average of 13.4 cents per kWh saved for other low-income energy efficiency and weatherization programs.23 The cost per kWh saved over the life of the program will be less than the cost of supplying the power from TVA, which could result in savings for both MLGW and its customers:
• The program costs per lifetime savings of 1.4 to 6.6 cents per kWh compare to: o An electric retail rate of about 9 cents per kWh; and o Wholesale costs in the range of 3 to 8 cents per kWh (depending on whether the electricity
is purchased during on or off peak periods.) It is important to note that the program costs per lifetime savings reported above do not take into account the value of multiple benefits of increased energy and water efficiency for MLGW as a utility and for MLGW customers. Energy and water efficiency can be considered as an alternative source of power and water for MLGW, and can be financed and paid for like a power plant or power purchase agreement. In addition
22 $0.014/kWh assumes all WX contractor costs will be financed by customers though on-bill financing while $0.066/kWh assumes none of the WX contractor costs are recovered through on-bill financing. Costs exclude bonding fees and MLGW interest payments for bond repayment. Savings are at the customer meter, over the life of the measures, assuming a program-wide average measure life of 10 years. 23 Levelized cost of electricity. Source: The Total Cost of Saving Electricity through Utility Customer-Funded Energy Efficiency Programs: Estimates at the National, State, Sector and Program Level, Ian M. Hoffman, Gregory Rybka, Greg Leventis, Charles A. Goldman, Lisa Schwartz, Megan Billingsley, and Steven Schiller, April 2015, https://emp.lbl.gov/sites/all/files/total-cost-of-saved-energy.pdf
$- $5,000,000
$10,000,000 $15,000,000 $20,000,000 $25,000,000 $30,000,000 $35,000,000 $40,000,000 $45,000,000 $50,000,000
1 2 3 4 5Program Year
Cummulative In-Pocket Energy and Water Savings for Participants
DI Participant WX Participant
Lower My Utility Bill - A Bold New Vision for Reducing Low Income Energy Burdens Page 25
to the financial benefits of purchasing less expensive power, investments in energy and water efficiency have the potential to:
• Better serve the municipal utility’s most impoverished customers while simultaneously reducing their utility bills, increasing comfort in their homes, improving health outcomes, and strengthening their overall economic position.
• Reduce arrearages and related disconnection, reconnection, and collection costs. • Minimize bad debt on the utility’s books. • Reduce time spent working with public assistance agencies intervening on behalf of those being
disconnected. • Improve customer relations and satisfaction. • Create local jobs and help stimulate economic growth.
While it is beyond the scope of this report to place specific monetary values on these benefits for MLGW, a thorough discussion of such benefits is provided in the report, Recognizing the Value of Energy Efficiency’s’ Multiple Benefits published by ACEEE in 2015.24
5.3 Program Savings and Utility Bill Reduction - DI and WX Combined
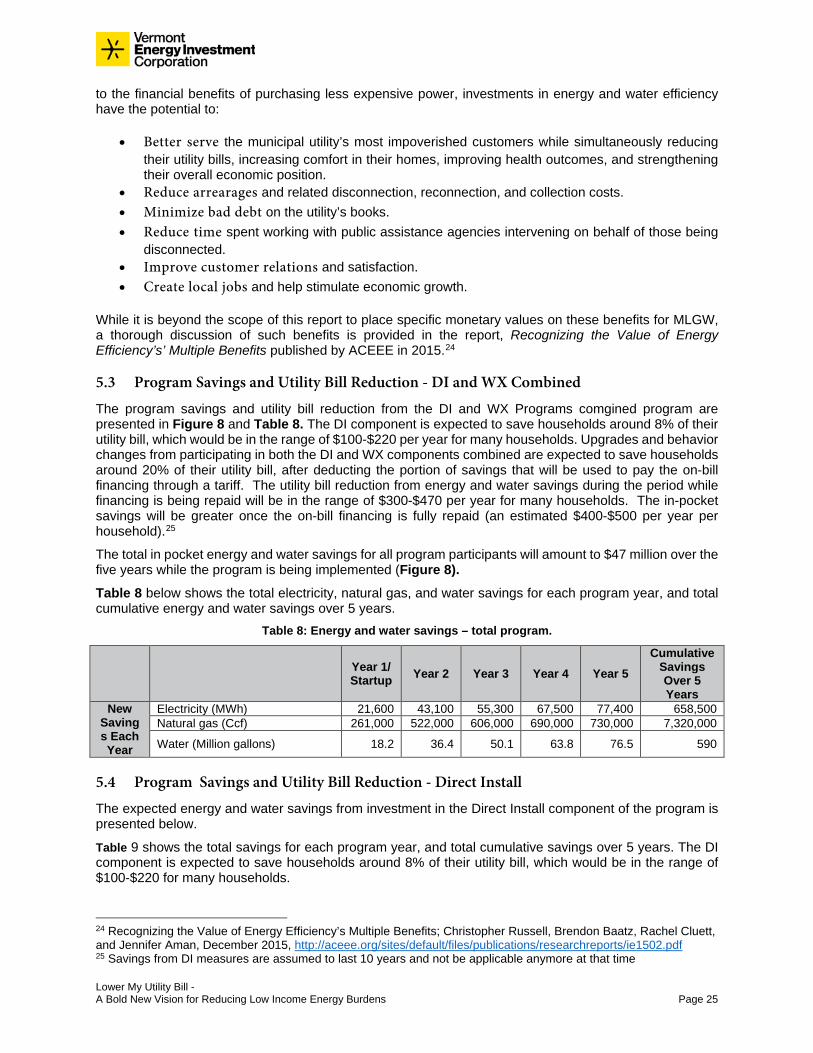
The program savings and utility bill reduction from the DI and WX Programs comgined program are presented in Figure 8 and Table 8. The DI component is expected to save households around 8% of their utility bill, which would be in the range of $100-$220 per year for many households. Upgrades and behavior changes from participating in both the DI and WX components combined are expected to save households around 20% of their utility bill, after deducting the portion of savings that will be used to pay the on-bill financing through a tariff. The utility bill reduction from energy and water savings during the period while financing is being repaid will be in the range of $300-$470 per year for many households. The in-pocket savings will be greater once the on-bill financing is fully repaid (an estimated $400-$500 per year per household).25
The total in pocket energy and water savings for all program participants will amount to $47 million over the five years while the program is being implemented (Figure 8).
Table 8 below shows the total electricity, natural gas, and water savings for each program year, and total cumulative energy and water savings over 5 years.
Table 8: Energy and water savings – total program.
Year 1/ Startup Year 2 Year 3 Year 4 Year 5
Cumulative Savings Over 5 Years
New Savings Each Year
Electricity (MWh) 21,600 43,100 55,300 67,500 77,400 658,500 Natural gas (Ccf) 261,000 522,000 606,000 690,000 730,000 7,320,000
Water (Million gallons) 18.2 36.4 50.1 63.8 76.5 590
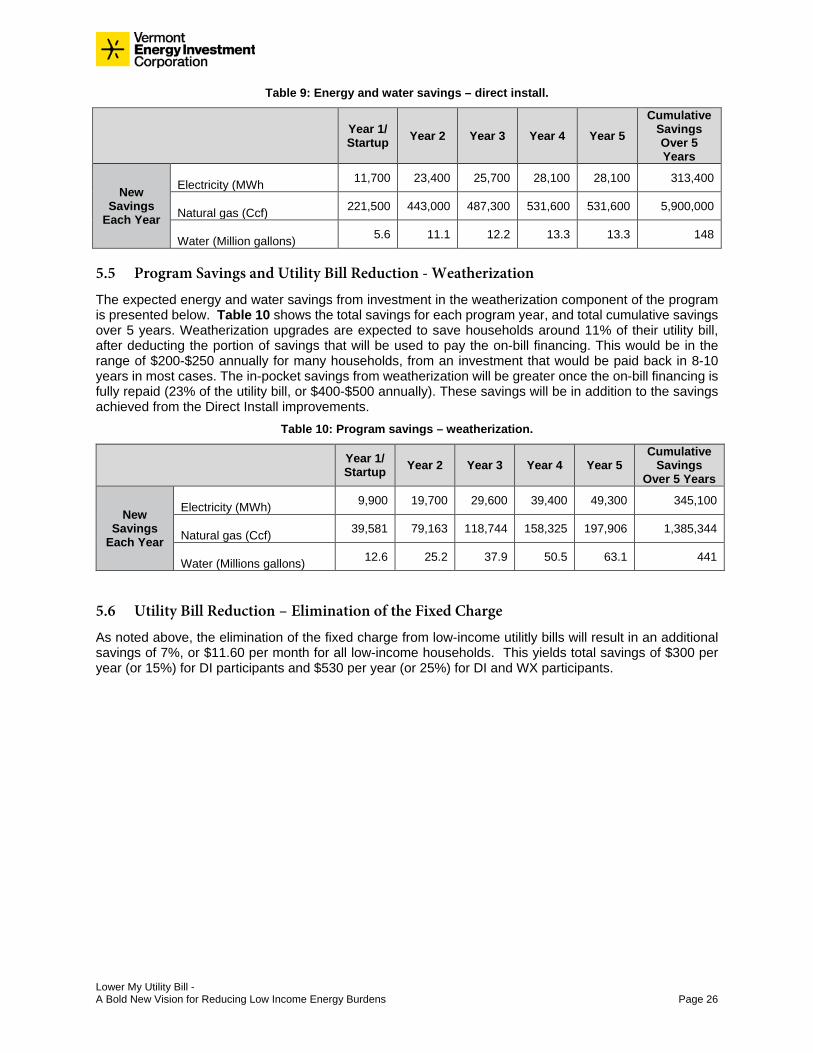
5.4 Program Savings and Utility Bill Reduction - Direct Install
The expected energy and water savings from investment in the Direct Install component of the program is presented below.
Table 9 shows the total savings for each program year, and total cumulative savings over 5 years. The DI component is expected to save households around 8% of their utility bill, which would be in the range of $100-$220 for many households.
24 Recognizing the Value of Energy Efficiency’s Multiple Benefits; Christopher Russell, Brendon Baatz, Rachel Cluett, and Jennifer Aman, December 2015, http://aceee.org/sites/default/files/publications/researchreports/ie1502.pdf 25 Savings from DI measures are assumed to last 10 years and not be applicable anymore at that time
Lower My Utility Bill - A Bold New Vision for Reducing Low Income Energy Burdens Page 26
Table 9: Energy and water savings – direct install.
Year 1/ Startup Year 2 Year 3 Year 4 Year 5
Cumulative Savings Over 5 Years
New Savings
Each Year
Electricity (MWh 11,700 23,400 25,700 28,100 28,100 313,400
Natural gas (Ccf) 221,500 443,000 487,300 531,600 531,600 5,900,000
Water (Million gallons) 5.6 11.1 12.2 13.3 13.3 148
5.5 Program Savings and Utility Bill Reduction - Weatherization
The expected energy and water savings from investment in the weatherization component of the program is presented below. Table 10 shows the total savings for each program year, and total cumulative savings over 5 years. Weatherization upgrades are expected to save households around 11% of their utility bill, after deducting the portion of savings that will be used to pay the on-bill financing. This would be in the range of $200-$250 annually for many households, from an investment that would be paid back in 8-10 years in most cases. The in-pocket savings from weatherization will be greater once the on-bill financing is fully repaid (23% of the utility bill, or $400-$500 annually). These savings will be in addition to the savings achieved from the Direct Install improvements.
Table 10: Program savings – weatherization.
Year 1/ Startup Year 2 Year 3 Year 4 Year 5
Cumulative Savings
Over 5 Years
New Savings
Each Year
Electricity (MWh) 9,900 19,700 29,600 39,400 49,300 345,100
Natural gas (Ccf) 39,581 79,163 118,744 158,325 197,906 1,385,344
Water (Millions gallons) 12.6 25.2 37.9 50.5 63.1 441
5.6 Utility Bill Reduction – Elimination of the Fixed Charge
As noted above, the elimination of the fixed charge from low-income utilitly bills will result in an additional savings of 7%, or $11.60 per month for all low-income households. This yields total savings of $300 per year (or 15%) for DI participants and $530 per year (or 25%) for DI and WX participants.

Lower My Utility Bill - A Bold New Vision for Reducing Low Income Energy Burdens Page 27
6 Program Participation and Investment by Year
The total investment needed to meet the goals of the program will be $247 Million over a five-year period. Presented in Figure 9 is a break-out of the investment needed by key categories, including the:
• Program administration costs incurred by MLGW for: payroll and benefits for the expanded utility workforce needed to administer both the DI and WX program; staff conducting trainings of the local contractor base; and the staff that will perform a thorough QA/QC of the WX work to ensure that the savings will be as expected. It is not uncommon for low-income programs to have 20% (or more) of the program budget dedicated to program administration, trainings, and QA/QC of contractor installations. Given that this will be a brand new program, with new collaborations needing to be created with key market actors and an expanded contractor base to be trained, a significant need for program support is anticipated during the first five years the program would be implemented.
• DI measure and staff costs incurred by MLGW for: the Direct Install measures to be installed at each household as well as the cost of the MLGW DI staff (or implementation contractor) going door-to-door, meeting with residents, and installing the DI measures.
• Rebate and incentives currently offered through MLGW’s existing efficiency programs and used to help stimulate interest and participation in the program. While these incentives are from existing MLGW programs, due to the magnitude of the increase in uptake that the new program would generate, it was assumed that the cost of the incentives will be rolled into the bond.
• Weatherization measure and installation costs to be incurred by contractors hired by MLGW to deliver the weatherization services.
Figure 8: Breakout of $247 Million program investment over five years.26
26 The abbreviation M stands for million in this figure and the remainder of the document. The numbers may not add due to rounding.
MLGW DI and WX Program Administration,
WX Contractor Trainings, Wx QA/QC
$37 M (15%)
MLGW DI Measures and DI Staff$16 M (7%)
MLGW Rebates/ Incentives
$28 M (11%)
Wx Investment $164 M (67%)

Lower My Utility Bill - A Bold New Vision for Reducing Low Income Energy Burdens Page 28
6.1 Participation and Investment by Year – Total Program
The total amount that will need to be invested to pay for the program will range from $17.4 million in Year 1 to just under $80 million in Year 5, for a total of $247 million over five years. This investment will enable the program to reach its target of serving 50% of Shelby County’s low-income households over five years and will decreasing utility bills by 15 to 25% for the households served (including energy and water savings, as well as elimination of the fixed charge). Figure 10 and Table 11 provide a breakout of the budget and participation by year and category of expense for the DI and WX components of the program combined. Section 7 provides further details on how the program investments would be recovered over time.
Figure 9: Program participation and investment needed to achieve program targets.
Table 11: Program participation and investment needed by category and by year.27
Category Year 1/ Startup Year 2 Year 3 Year 4 Year 5 Total
Total Annual Investment
MLGW DI and Wx Program Administration, DI Staff, WX Contractor Trainings, WX QA/QC
$3.2 M $6.3 M $8.8 M $11.5 M $13.4 M $43.6 M
DI Measures $1.1 M $2.2 M $2.4 M $2.7 M $2.7 M $11.1 M Advertising/ Marketing/ PR $60,000 $60,000 $60,000 $60,000 $60,000 $300,000 MLGW Rebates/ Incentives $2.1 M $4.2 M $5.7 M $7.1 M $8.4 M $27.5 M Total MLGW Implementation Budget $6.5 M $12.8 M $17.0 M $21.0 M $25.0 M $82.5 M
Total WX Contractor Budget $11.0 M $21.9 M $32.8 M $43.7 M $54.7 M $164.0 M
Total Investment $17.4 M $34.7 M $49.8 M $65.0 M $79.7 M $246.5 M
Annual Households
Total Single Family Households 6,800 13,000 13,500 15,600 16,500 65,500
Total Multifamily Households 360 1,500 2,400 1,730 900 6,800 Total Households Annually 7,300 14,500 15,900 17,300 17,300 72,300
27 The abbreviation M stands for million in this table and the remainder of the document.
-
2,000
4,000
6,000
8,000
10,000
12,000
14,000
16,000
18,000
20,000
$0
$10,000,000
$20,000,000
$30,000,000
$40,000,000
$50,000,000
$60,000,000
$70,000,000
$80,000,000
$90,000,000
1 2 3 4 5
New
Par
ticip
ants
Ann
ually
Inve
stm
ent
Total Program Participation and Investment by Year
Total Investment Each Year Total New Participants Each Year
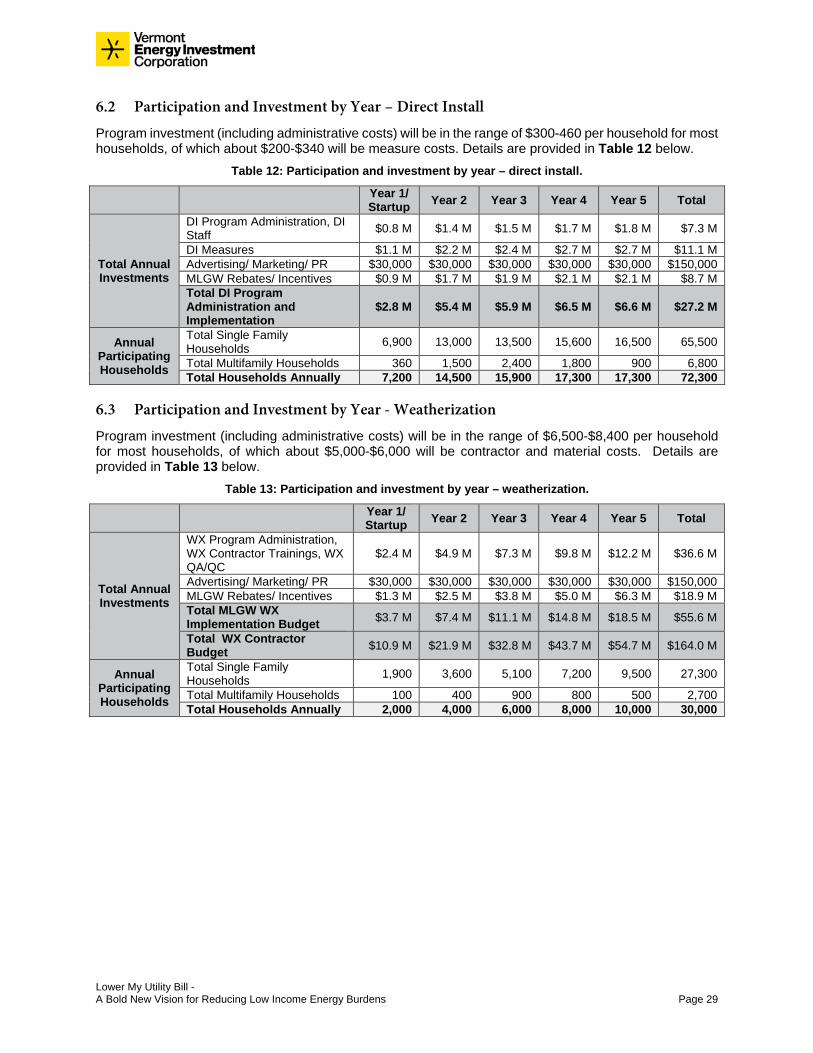
Lower My Utility Bill - A Bold New Vision for Reducing Low Income Energy Burdens Page 29
6.2 Participation and Investment by Year – Direct Install
Program investment (including administrative costs) will be in the range of $300-460 per household for most households, of which about $200-$340 will be measure costs. Details are provided in Table 12 below.
Table 12: Participation and investment by year – direct install.
Year 1/ Startup Year 2 Year 3 Year 4 Year 5 Total
Total Annual Investments
DI Program Administration, DI Staff $0.8 M $1.4 M $1.5 M $1.7 M $1.8 M $7.3 M
DI Measures $1.1 M $2.2 M $2.4 M $2.7 M $2.7 M $11.1 M Advertising/ Marketing/ PR $30,000 $30,000 $30,000 $30,000 $30,000 $150,000 MLGW Rebates/ Incentives $0.9 M $1.7 M $1.9 M $2.1 M $2.1 M $8.7 M Total DI Program Administration and Implementation
$2.8 M $5.4 M $5.9 M $6.5 M $6.6 M $27.2 M
Annual Participating Households
Total Single Family Households 6,900 13,000 13,500 15,600 16,500 65,500
Total Multifamily Households 360 1,500 2,400 1,800 900 6,800 Total Households Annually 7,200 14,500 15,900 17,300 17,300 72,300
6.3 Participation and Investment by Year - Weatherization
Program investment (including administrative costs) will be in the range of $6,500-$8,400 per household for most households, of which about $5,000-$6,000 will be contractor and material costs. Details are provided in Table 13 below.
Table 13: Participation and investment by year – weatherization.
Year 1/ Startup Year 2 Year 3 Year 4 Year 5 Total
Total Annual Investments
WX Program Administration, WX Contractor Trainings, WX QA/QC
$2.4 M $4.9 M $7.3 M $9.8 M $12.2 M $36.6 M
Advertising/ Marketing/ PR $30,000 $30,000 $30,000 $30,000 $30,000 $150,000 MLGW Rebates/ Incentives $1.3 M $2.5 M $3.8 M $5.0 M $6.3 M $18.9 M Total MLGW WX Implementation Budget $3.7 M $7.4 M $11.1 M $14.8 M $18.5 M $55.6 M
Total WX Contractor Budget $10.9 M $21.9 M $32.8 M $43.7 M $54.7 M $164.0 M
Annual Participating Households
Total Single Family Households 1,900 3,600 5,100 7,200 9,500 27,300
Total Multifamily Households 100 400 900 800 500 2,700 Total Households Annually 2,000 4,000 6,000 8,000 10,000 30,000
Lower My Utility Bill - A Bold New Vision for Reducing Low Income Energy Burdens Page 30
7 The Recommended Capital Formation, Investment, and Rate Redesign Approach to Achieve This Program
Energy efficiency and weatherization improvements to the homes and apartments of low-income households in Shelby County can result in significant energy and monetary savings – for both the household and the utility. Investment in such improvements reduces demand for electricity, gas, and water and can be considered to be an alternative to paying for the steadily increasing cost of power from TVA and new distribution infrastructure. Presented below is a recommended approach for obtaining the capital investment needed to develop and implement the program, as well as a proposed approach for recovering the costs of the program not offset by energy and water savings. The proposed approach includes:
• Energy efficiency bonds issued by MLGW; • On bill, tariff-based financing offered to MLGW customers; and a • Rate redesign that eliminates the fixed charge for low income households and increases rates
for non-low income high energy users.
7.1 Options for Raising Capital and Recovering the Program Investment
Capital sources for a new energy efficiency and weatherization program can come from a variety of places. Examples of options for a public utility such as MLGW include the following:
• Issue energy efficiency bonds to raise the capital needed to implement the program. MLGW’s three utility divisions all have strong bond ratings. Debt service coverage ratios across all three divisions are all well above the existing bond covenants and considerably stronger than industry standards. Should MLGW seek to capitalize an energy efficiency and weatherization financing program, there is sufficient debt capacity available to issue energy efficiency bonds to raise the capital needed to implement the program. This would not involve using the federal Qualified Energy Conservation Bonds (QECB) but rather general obligation bonds issued by MLGW specifically for energy efficiency and weatherization work.
• Offer Tariff-Based Financing (TBF) to help recover the cost of providing the program.The advantage of this approach is it can be used on its own or in conjunction with other sources of revenue to pay back the bonds.
• Use a Loan-Loss Reserve (LLR) to leverage private capital. MLGW financial statements for 2016 show an unrestricted net position (minus restricted cash and capital assets) of $185 million. One option is to use some portion of this cash as a credit enhancement to attract private capital for on-bill financing. An industry standard is that a Loan-Loss Reserve should be fraom 5 to 10% of the loan portfolio. In this example, a $25 million LLR has the potential to leverage $250 million in capital for on-bill financing at a nominal interest rate of 2 to 3%.
• Use MLGW resources to fund an Interest Rate Buy-down (IRB) to lower the cost of private capital for MLGW customers. The main advantage of this approach is that it lowers the cost of capital and allows customers to finance larger amounts since they are paying less for interest. Typically, IRBs are paid to the private lender in a single upfront sum equal to the present value of the covered interest rate spread over the loan value and financing period. Because interest charges accrue significantly over time, IRBs tend to be an expensive option for longer term financing, and thus are more commonly applied to short or medium term loans (5 to 7 years maximum).
• Redesign rates to: o Eliminate the fixed charge for all low income households; and
o Increase rates by 1% per year for four years for non-low income high energy users.
It is recommended that both energy efficiency bonds and tariff-based financing be implemented by MLGW to raise the capital and recover the costs for the new low-income energy efficiency and weatherization program proposed for Shelby County. It is also recommended that MLGW rates be redesigned. The rate
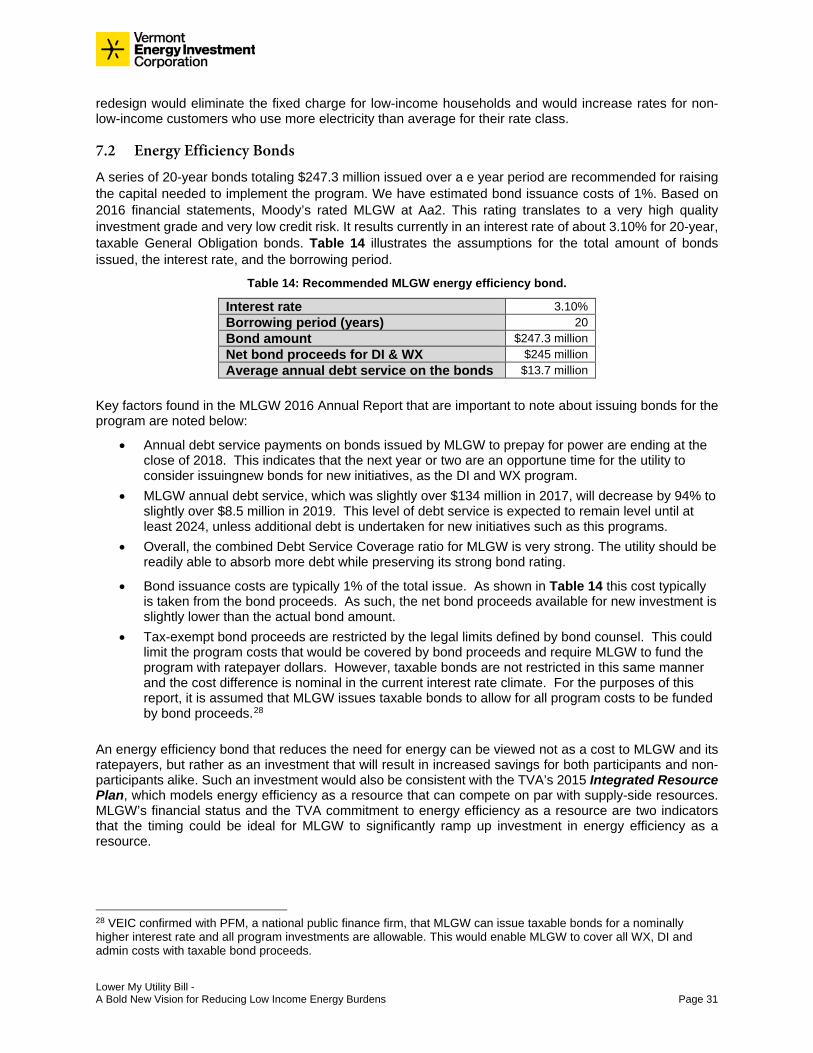
Lower My Utility Bill - A Bold New Vision for Reducing Low Income Energy Burdens Page 31
redesign would eliminate the fixed charge for low-income households and would increase rates for non-low-income customers who use more electricity than average for their rate class.
7.2 Energy Efficiency Bonds
A series of 20-year bonds totaling $247.3 million issued over a e year period are recommended for raising the capital needed to implement the program. We have estimated bond issuance costs of 1%. Based on 2016 financial statements, Moody’s rated MLGW at Aa2. This rating translates to a very high quality investment grade and very low credit risk. It results currently in an interest rate of about 3.10% for 20-year, taxable General Obligation bonds. Table 14 illustrates the assumptions for the total amount of bonds issued, the interest rate, and the borrowing period.
Table 14: Recommended MLGW energy efficiency bond.
Interest rate 3.10% Borrowing period (years) 20 Bond amount $247.3 million Net bond proceeds for DI & WX $245 million Average annual debt service on the bonds $13.7 million
Key factors found in the MLGW 2016 Annual Report that are important to note about issuing bonds for the program are noted below:
• Annual debt service payments on bonds issued by MLGW to prepay for power are ending at the close of 2018. This indicates that the next year or two are an opportune time for the utility to consider issuingnew bonds for new initiatives, as the DI and WX program.
• MLGW annual debt service, which was slightly over $134 million in 2017, will decrease by 94% to slightly over $8.5 million in 2019. This level of debt service is expected to remain level until at least 2024, unless additional debt is undertaken for new initiatives such as this programs.
• Overall, the combined Debt Service Coverage ratio for MLGW is very strong. The utility should be readily able to absorb more debt while preserving its strong bond rating.
• Bond issuance costs are typically 1% of the total issue. As shown in Table 14 this cost typically is taken from the bond proceeds. As such, the net bond proceeds available for new investment is slightly lower than the actual bond amount.
• Tax-exempt bond proceeds are restricted by the legal limits defined by bond counsel. This could limit the program costs that would be covered by bond proceeds and require MLGW to fund the program with ratepayer dollars. However, taxable bonds are not restricted in this same manner and the cost difference is nominal in the current interest rate climate. For the purposes of this report, it is assumed that MLGW issues taxable bonds to allow for all program costs to be funded by bond proceeds.28
An energy efficiency bond that reduces the need for energy can be viewed not as a cost to MLGW and its ratepayers, but rather as an investment that will result in increased savings for both participants and non-participants alike. Such an investment would also be consistent with the TVA’s 2015 Integrated Resource Plan, which models energy efficiency as a resource that can compete on par with supply-side resources. MLGW’s financial status and the TVA commitment to energy efficiency as a resource are two indicators that the timing could be ideal for MLGW to significantly ramp up investment in energy efficiency as a resource.
28 VEIC confirmed with PFM, a national public finance firm, that MLGW can issue taxable bonds for a nominally higher interest rate and all program investments are allowable. This would enable MLGW to cover all WX, DI and admin costs with taxable bond proceeds.
Lower My Utility Bill - A Bold New Vision for Reducing Low Income Energy Burdens Page 32
7.3 On-Bill, Tariff-Based Financing
There are a range of cost recovery (or repayment) mechanisms for energy efficiency and weatherization investments made to utility customer households. A common approach is referred to as on-bill financing (OBF). On-bill financing and repayment is any offering in which the financing used to make energy efficiency or weatherization upgrades is repaid on the customer’s utility bill. This includes both on-bill financing programs in which ratepayer, utility, or public funds are used to capitalize efficiency loans, as well as on-bill repayment programs in which efficiency loans are funded by private capital (e.g., through funds provided by financial institutions). On-bill programs sometimes utilize credit enhancements such as Interest Rate Buy-downs (IRBs), Loan Loss Reserves (LLRs), and guarantees to extend credit to lower-income customers.
Over time, on-bill programs have become a popular way for utilities to help homeowners invest in energy efficiency improvements. Utilities already have a billing relationship with their customers, as well as access to information about their energy usage patterns and payment history. To date, nearly $2 billion has been lent for energy efficiency in 25 states, of which 60% went to residential financing.29 Of total on-bill financing nationally, 90% of the total dollar and project volume are from five programs:
• Tennessee Valley Authority • Manitoba Hydro • Alliant Energy • United Illuminating • National Grid
TVA and its distributors (including MLGW) have offered on-bill financing over the years, beginning as early as 1980.30 Currently, TVA operates a loan-based OBF program for residential customers in which TVA buys back bad loans from the regional bank that capitalizes them. This is in effect a guarantee which enables the bank to offer the loans at below-market rates. Since 1997, TVA has financed over $500 million in residential energy improvements, with a default rate of approximately 3%.31 In partnership with a regional bank, TVA facilitates approximately $40 million in loans each year, primarily through the Energy Right Solutions Heat Pump Program. The regional bank delivers low-cost capital to program participants in exchange for a TVA guarantee that protects the bank from exposure to participant defaults.
7.3.1 Tariff-Based Financing as an Alternative to Loan-Based Financing
Tariff-based on-bill financing is an alternative to loan-based on-bill financing. A few of the key differences include the following:
• In a tariff-based financing (TBF) program, efficiency upgrades are financed not through a loan, but through a utility offer that pays for upgrades using an additional tariff tied to the meter where the upgrades are performed. The additional tariff charged for the energy efficient investment is separate and distinct from the standard electric rate/tariff charged to customers, and includes a cost recovery charge on the bill that is less than the estimated savings.
• The on-bill charge is associated with the meter at the address of the property where upgrades are installed, and the cost recovery charge is treated as equal to other utility charges on the bill.
• TBF is also known as “Inclusive Financing.” This is because TBF is typically on-bill financing made available to not only homeowners and multifamily property owners, but also renters. This distinguishes tariff-based financing from “classic” loan-based on-bill financing which has not typically been made available to renters.
Presented below is a comparison of loan-based and tariff-based financing.
29 https://www4.eere.energy.gov/seeaction/system/files/documents/onbill_financing.pdf 30 Personal communication. David Freeman, Former Chairman, Tennessee Valley Authority. January 5, 2018. 31 Ibid.

Lower My Utility Bill - A Bold New Vision for Reducing Low Income Energy Burdens Page 33
Table 15: Comparison of on-bill loan-based financing to tariff-based financing.32
On-bill Loan-Based Financing On-bill Tariff-Based Financing
Transferability Depends on program design. Full repayment often required at time of sale. Possible to transfer as a lien.
Financing is tied to the meter so recovery obligation remains with the occupant.
Financing term Shorter term makes retrofits less cost-effective
Longer-term makes retrofits more cost-effective
Regulatory approval? Yes (for regulated utilities) Yes (for regulated utilities) Homeowners eligible? Yes Yes Classified as debt? Yes No Renters eligible? No Yes Credit score check? Debt to income ratio? No No
Upfront participant cost? Yes Yes Must estimate savings exceed cost recovery by 20%? No Yes
Participant signs a loan or promissory note for a debt obligation? Yes No
Participant accepts an opt-in utility tariff (not a debt) tied to the premise meter?
No Yes
Is cost recovery through a fixed charge on the utility bill? Yes Yes
Is 100% on-site QA/QC required for payment authorization? Yes Yes
Does payment end if upgrade fails and is not repaired by the utility? No Yes
Does participant accept risk of disconnection for non-payment? Yes Yes
Does tariff stay with the meter (not the participant) until cost recovery is complete?
No Yes
7.3.2 On-Bill Financing Consumer Protection Issues
Special attention must be paid to consumer protections when designing an on-bill financing program to ensure that low-income households are adequately shielded from undue financial risk and utility disconnects. The tariff-based financing model alleviates most of the consumer protection concerns about on-bill financing voiced by consumer advocates. However potential utility service disconnection for non-payment does remain a concern. Ideally, the reduction in low-income utility bills resulting from direct install and weatherization improvements will result in fewer cases of nonpayment and therefore fewer utility disconnects for low-income households.
Consumer advocates typically support a prohibition against disconnection for non-payment of the non-utility portion of a bill (which would include any efficiency and weatherization measure repayments). However, lenders typically consider the prospect of potential disconnection as motivation to avoid nonpayment. Pay As You Save (PAYS) programs currently operating in Kentucky, Arkansas, and North Carolina allow disconnection for nonpayment. PAYS program implementer EEtility asserts that two main factors significantly reduce the risk of disconnection for non-payment:
1) A guaranty that ensures the customer keeps at least 20% of the savings; and 2) Rigorous QA/QC on every energy efficiency and weatherization retrofit performed.
PAYS advocates note that their system leads to a charge-off rate 10 times lower than other types of energy efficiency loan-based financing. They attribute this to strict adherence to delivering 20% bill savings to the
32 Adapted from EEtility, Inc., Little Rock, Arkansas.
Lower My Utility Bill - A Bold New Vision for Reducing Low Income Energy Burdens Page 34
customer and to the rigorous QA/QC to ensure the energy efficiency and weatherization work is delivering those savings.
Developing a specific rate design for low-income customers can result in benefits for all customers. By better enabling low-income customers to pay utility bills in full and on time, arrearages and collection fees can be reduced. This can reduce overall system costs as the utility no longer needs to recover the costs of bad debt and debt collections.
An analysis conducted by the investor-owned utility, National Grid, found that low-income customers enrolled in arrearage management programs paid more than twice the amount of their counterparts not enrolled in the study.33 The National Consumer Law Center confirms through its work monitoring utility trends nationwide that:34
“It is in utilities … financial best interest to have … affordability programs, not only because utilities will collect more money and spend less in the process of debt collection, but also because it takes strain away from other welfare programs and therefore all constituents in general. Solid social safety net programs also make jurisdictions more attractive for business, therefore creating jobs and helping the community in general.”
Rate design is complicated. In its simplest form, rate design balances:
• Fairness;
• Simplicity;
• Understandability;
• Public acceptability; and
• Feasibility of application and interpretation.
In addition, rate design can be used to advance:
• Social equity; and
• Energy efficiency.
Often these values are in conflict. The simplest approach is to offer flat rates – meaning all customers pay the same rate. However, this approach does not fairly allocate the wide variation in costs incurred to the system by each user’s electricity consumption, as consumption varies widely by user. Similarly, while the cost of wholesale power on the bulk system may vary minute-to-minute, the feasibility of passing those costs on to customers directly, and the complication required to implement a rate structure that reflects all those variations, would be confusing and difficult for customers to adequately understand and respond to. Utilities balance a desire to correctly allocate costs, which vary over time and by use, with the desire for fixed charges that provide predictable revenue streams.
Compared to commercial and industrial (C&I) customers whose utility use can vary widely depending on the type of establishment, the time of day, and day of the week, low-income utility use is relatively simpler. Low-income customers may have very low or inflexible electricity consumption because usage is driven by basic, inflexible needs such as home heating, cooling, and lighting. As such, a relatively complicated rate design such as volumetric pricing that changes over time and addresses the changing costs of consumption throughout the day or week, may not be effective for households that consume relatively small amounts of electricity (compared to C&I customers, for example) and do not have much flexibility about when they need electricity.
33 National Grid. Based on a review of 170 random electric accounts (100 low-income customers not enrolled in AMP; 50 customers who enrolled in AMP but failed to complete; and 20 who were in AMP and successfully completed the program). All customers had comparable annual bills ($1,100 ± $60). 34 “Helping Low-Income Utility Customers Manage Overdue Bills through Arrearage Management Programs (AMP).” September 2013. Charlie Harak, National Consumer Law Center®. p.19
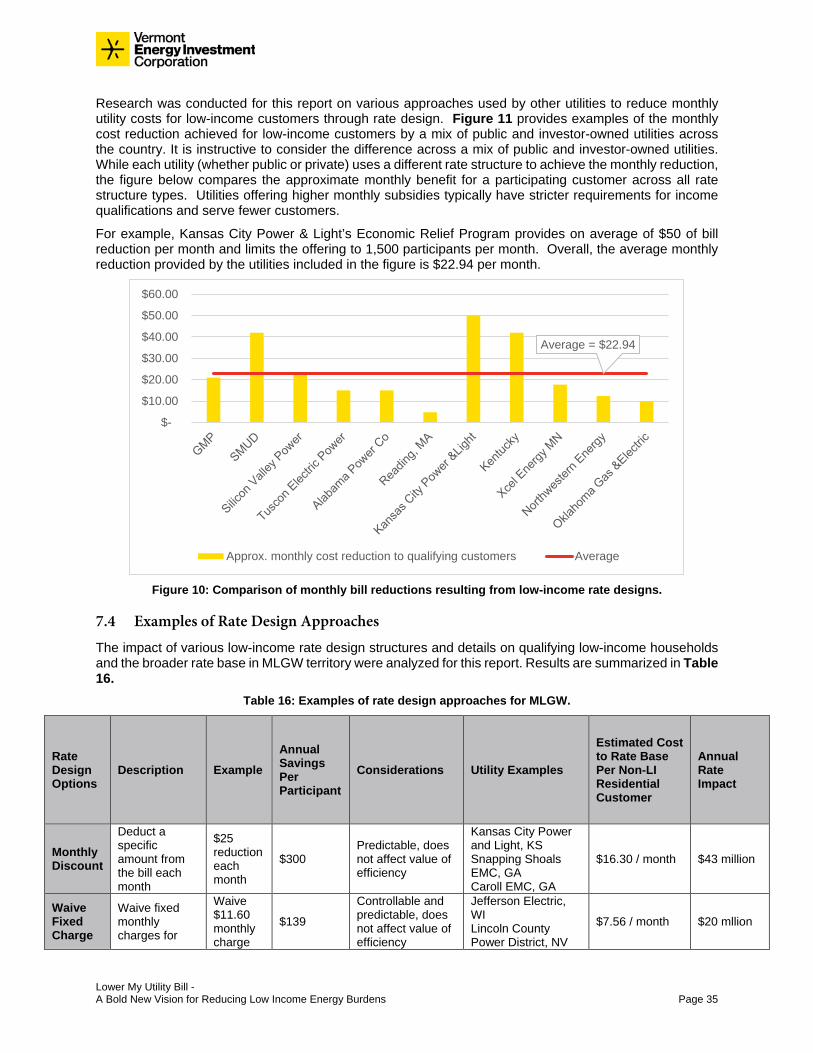
Lower My Utility Bill - A Bold New Vision for Reducing Low Income Energy Burdens Page 35
Research was conducted for this report on various approaches used by other utilities to reduce monthly utility costs for low-income customers through rate design. Figure 11 provides examples of the monthly cost reduction achieved for low-income customers by a mix of public and investor-owned utilities across the country. It is instructive to consider the difference across a mix of public and investor-owned utilities. While each utility (whether public or private) uses a different rate structure to achieve the monthly reduction, the figure below compares the approximate monthly benefit for a participating customer across all rate structure types. Utilities offering higher monthly subsidies typically have stricter requirements for income qualifications and serve fewer customers.
For example, Kansas City Power & Light’s Economic Relief Program provides on average of $50 of bill reduction per month and limits the offering to 1,500 participants per month. Overall, the average monthly reduction provided by the utilities included in the figure is $22.94 per month.
Figure 10: Comparison of monthly bill reductions resulting from low-income rate designs.
7.4 Examples of Rate Design Approaches
The impact of various low-income rate design structures and details on qualifying low-income households and the broader rate base in MLGW territory were analyzed for this report. Results are summarized in Table 16.
Table 16: Examples of rate design approaches for MLGW.
Rate Design Options
Description Example Annual Savings Per Participant
Considerations Utility Examples
Estimated Cost to Rate Base Per Non-LI Residential Customer
Annual Rate Impact
Monthly Discount
Deduct a specific amount from the bill each month
$25 reduction each month
$300 Predictable, does not affect value of efficiency
Kansas City Power and Light, KS Snapping Shoals EMC, GA Caroll EMC, GA
$16.30 / month $43 million
Waive Fixed Charge
Waive fixed monthly charges for
Waive $11.60 monthly charge
$139
Controllable and predictable, does not affect value of efficiency
Jefferson Electric, WI Lincoln County Power District, NV
$7.56 / month $20 mllion
Average = $22.94
$-
$10.00
$20.00
$30.00
$40.00
$50.00
$60.00
Approx. monthly cost reduction to qualifying customers Average
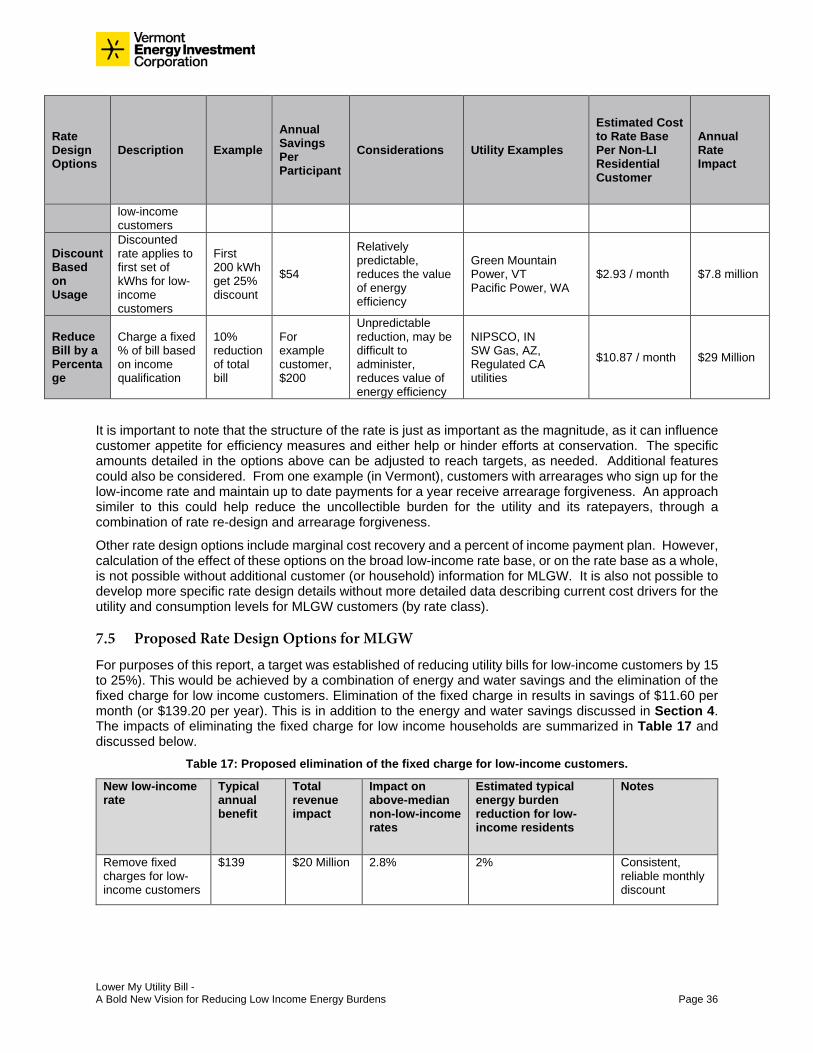
Lower My Utility Bill - A Bold New Vision for Reducing Low Income Energy Burdens Page 36
Rate Design Options
Description Example Annual Savings Per Participant
Considerations Utility Examples
Estimated Cost to Rate Base Per Non-LI Residential Customer
Annual Rate Impact
low-income customers
Discount Based on Usage
Discounted rate applies to first set of kWhs for low-income customers
First 200 kWh get 25% discount
$54
Relatively predictable, reduces the value of energy efficiency
Green Mountain Power, VT Pacific Power, WA
$2.93 / month $7.8 million
Reduce Bill by a Percentage
Charge a fixed % of bill based on income qualification
10% reduction of total bill
For example customer, $200
Unpredictable reduction, may be difficult to administer, reduces value of energy efficiency
NIPSCO, IN SW Gas, AZ, Regulated CA utilities
$10.87 / month $29 Million
It is important to note that the structure of the rate is just as important as the magnitude, as it can influence customer appetite for efficiency measures and either help or hinder efforts at conservation. The specific amounts detailed in the options above can be adjusted to reach targets, as needed. Additional features could also be considered. From one example (in Vermont), customers with arrearages who sign up for the low-income rate and maintain up to date payments for a year receive arrearage forgiveness. An approach similer to this could help reduce the uncollectible burden for the utility and its ratepayers, through a combination of rate re-design and arrearage forgiveness.
Other rate design options include marginal cost recovery and a percent of income payment plan. However, calculation of the effect of these options on the broad low-income rate base, or on the rate base as a whole, is not possible without additional customer (or household) information for MLGW. It is also not possible to develop more specific rate design details without more detailed data describing current cost drivers for the utility and consumption levels for MLGW customers (by rate class).
7.5 Proposed Rate Design Options for MLGW
For purposes of this report, a target was established of reducing utility bills for low-income customers by 15 to 25%). This would be achieved by a combination of energy and water savings and the elimination of the fixed charge for low income customers. Elimination of the fixed charge in results in savings of $11.60 per month (or $139.20 per year). This is in addition to the energy and water savings discussed in Section 4. The impacts of eliminating the fixed charge for low income households are summarized in Table 17 and discussed below.
Table 17: Proposed elimination of the fixed charge for low-income customers.
New low-income rate
Typical annual benefit
Total revenue impact
Impact on above-median non-low-income rates
Estimated typical energy burden reduction for low-income residents
Notes
Remove fixed charges for low-income customers
$139 $20 Million 2.8% 2% Consistent, reliable monthly discount
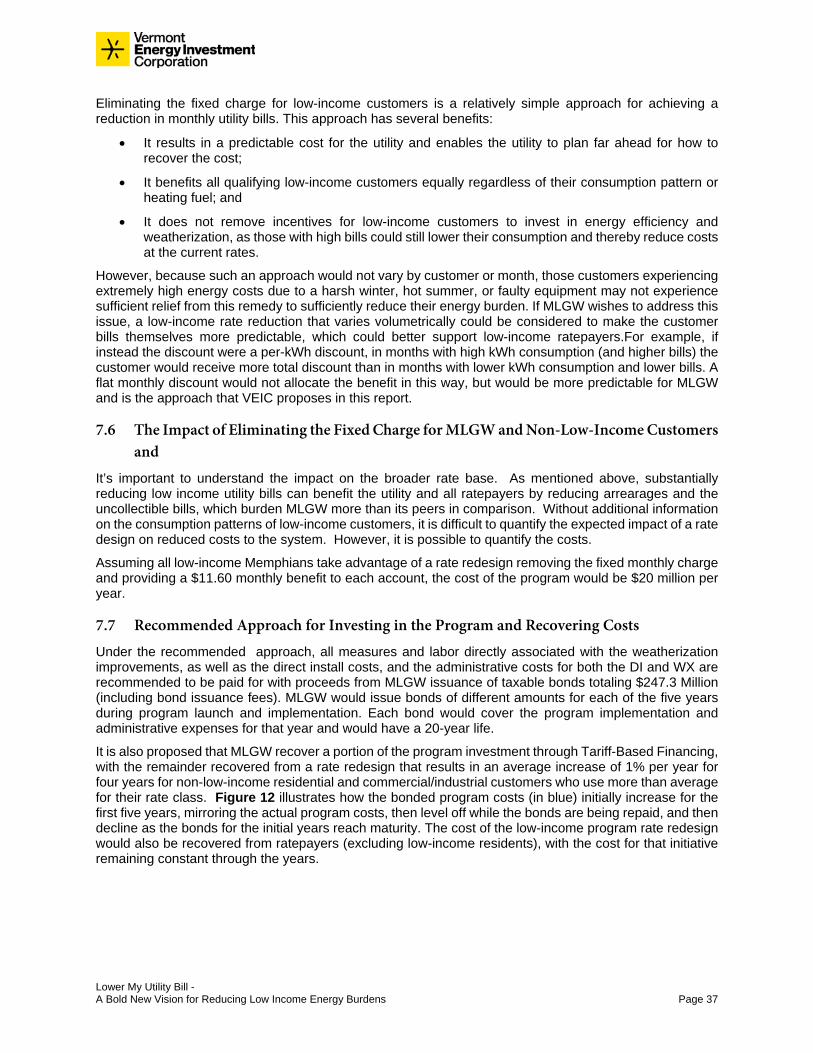
Lower My Utility Bill - A Bold New Vision for Reducing Low Income Energy Burdens Page 37
Eliminating the fixed charge for low-income customers is a relatively simple approach for achieving a reduction in monthly utility bills. This approach has several benefits:
• It results in a predictable cost for the utility and enables the utility to plan far ahead for how to recover the cost;
• It benefits all qualifying low-income customers equally regardless of their consumption pattern or heating fuel; and
• It does not remove incentives for low-income customers to invest in energy efficiency and weatherization, as those with high bills could still lower their consumption and thereby reduce costs at the current rates.
However, because such an approach would not vary by customer or month, those customers experiencing extremely high energy costs due to a harsh winter, hot summer, or faulty equipment may not experience sufficient relief from this remedy to sufficiently reduce their energy burden. If MLGW wishes to address this issue, a low-income rate reduction that varies volumetrically could be considered to make the customer bills themselves more predictable, which could better support low-income ratepayers.For example, if instead the discount were a per-kWh discount, in months with high kWh consumption (and higher bills) the customer would receive more total discount than in months with lower kWh consumption and lower bills. A flat monthly discount would not allocate the benefit in this way, but would be more predictable for MLGW and is the approach that VEIC proposes in this report.
7.6 The Impact of Eliminating the Fixed Charge for MLGW and Non-Low-Income Customers and
It’s important to understand the impact on the broader rate base. As mentioned above, substantially reducing low income utility bills can benefit the utility and all ratepayers by reducing arrearages and the uncollectible bills, which burden MLGW more than its peers in comparison. Without additional information on the consumption patterns of low-income customers, it is difficult to quantify the expected impact of a rate design on reduced costs to the system. However, it is possible to quantify the costs.
Assuming all low-income Memphians take advantage of a rate redesign removing the fixed monthly charge and providing a $11.60 monthly benefit to each account, the cost of the program would be $20 million per year.
7.7 Recommended Approach for Investing in the Program and Recovering Costs
Under the recommended approach, all measures and labor directly associated with the weatherization improvements, as well as the direct install costs, and the administrative costs for both the DI and WX are recommended to be paid for with proceeds from MLGW issuance of taxable bonds totaling $247.3 Million (including bond issuance fees). MLGW would issue bonds of different amounts for each of the five years during program launch and implementation. Each bond would cover the program implementation and administrative expenses for that year and would have a 20-year life.
It is also proposed that MLGW recover a portion of the program investment through Tariff-Based Financing, with the remainder recovered from a rate redesign that results in an average increase of 1% per year for four years for non-low-income residential and commercial/industrial customers who use more than average for their rate class. Figure 12 illustrates how the bonded program costs (in blue) initially increase for the first five years, mirroring the actual program costs, then level off while the bonds are being repaid, and then decline as the bonds for the initial years reach maturity. The cost of the low-income program rate redesign would also be recovered from ratepayers (excluding low-income residents), with the cost for that initiative remaining constant through the years.
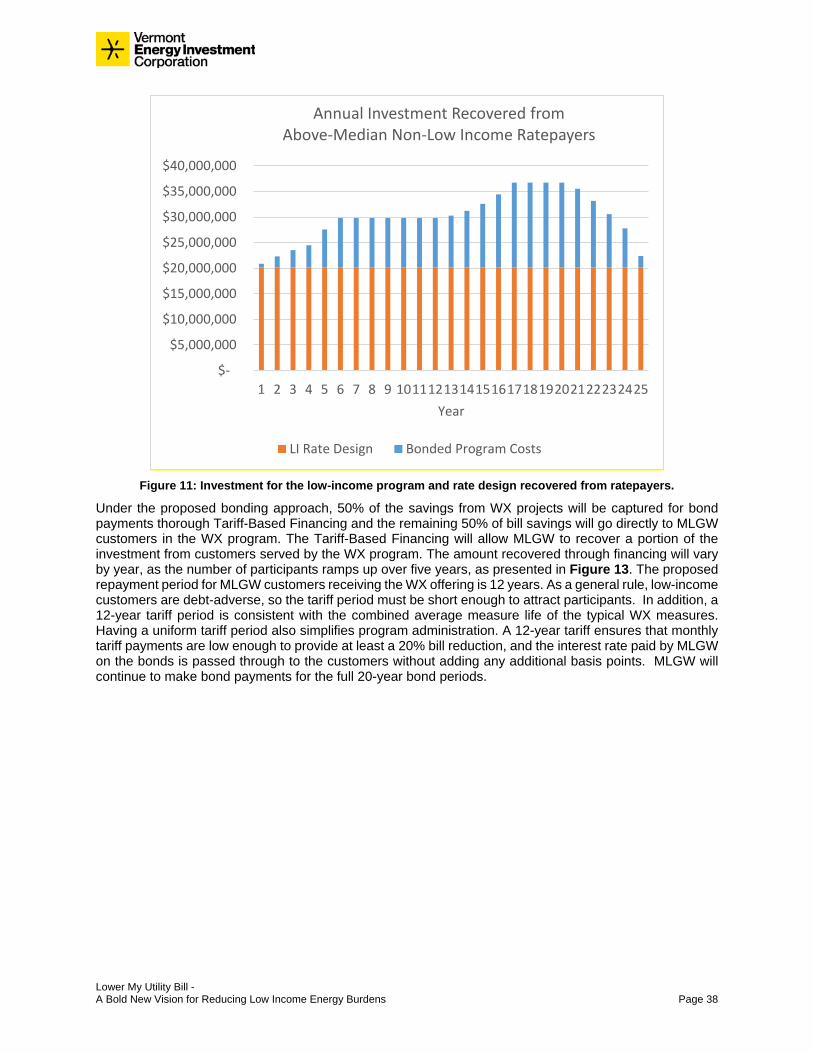
Lower My Utility Bill - A Bold New Vision for Reducing Low Income Energy Burdens Page 38
Figure 11: Investment for the low-income program and rate design recovered from ratepayers.
Under the proposed bonding approach, 50% of the savings from WX projects will be captured for bond payments thorough Tariff-Based Financing and the remaining 50% of bill savings will go directly to MLGW customers in the WX program. The Tariff-Based Financing will allow MLGW to recover a portion of the investment from customers served by the WX program. The amount recovered through financing will vary by year, as the number of participants ramps up over five years, as presented in Figure 13. The proposed repayment period for MLGW customers receiving the WX offering is 12 years. As a general rule, low-income customers are debt-adverse, so the tariff period must be short enough to attract participants. In addition, a 12-year tariff period is consistent with the combined average measure life of the typical WX measures. Having a uniform tariff period also simplifies program administration. A 12-year tariff ensures that monthly tariff payments are low enough to provide at least a 20% bill reduction, and the interest rate paid by MLGW on the bonds is passed through to the customers without adding any additional basis points. MLGW will continue to make bond payments for the full 20-year bond periods.
$-
$5,000,000
$10,000,000
$15,000,000
$20,000,000
$25,000,000
$30,000,000
$35,000,000
$40,000,000
1 2 3 4 5 6 7 8 9 10111213141516171819202122232425Year
Annual Investment Recovered from Above-Median Non-Low Income Ratepayers
LI Rate Design Bonded Program Costs
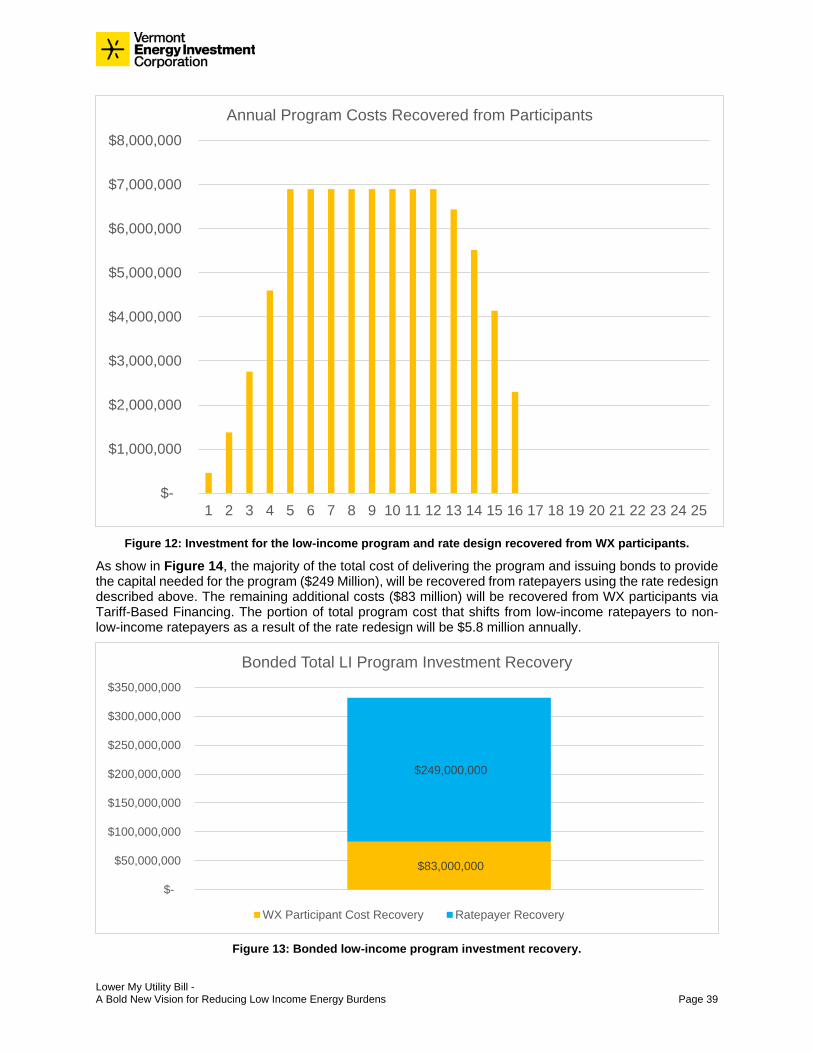
Lower My Utility Bill - A Bold New Vision for Reducing Low Income Energy Burdens Page 39
Figure 12: Investment for the low-income program and rate design recovered from WX participants.
As show in Figure 14, the majority of the total cost of delivering the program and issuing bonds to provide the capital needed for the program ($249 Million), will be recovered from ratepayers using the rate redesign described above. The remaining additional costs ($83 million) will be recovered from WX participants via Tariff-Based Financing. The portion of total program cost that shifts from low-income ratepayers to non-low-income ratepayers as a result of the rate redesign will be $5.8 million annually.
Figure 13: Bonded low-income program investment recovery.
$-
$1,000,000
$2,000,000
$3,000,000
$4,000,000
$5,000,000
$6,000,000
$7,000,000
$8,000,000
1 2 3 4 5 6 7 8 9 10 11 12 13 14 15 16 17 18 19 20 21 22 23 24 25
Annual Program Costs Recovered from Participants
$83,000,000
$249,000,000
$-
$50,000,000
$100,000,000
$150,000,000
$200,000,000
$250,000,000
$300,000,000
$350,000,000
Bonded Total LI Program Investment Recovery
WX Participant Cost Recovery Ratepayer Recovery
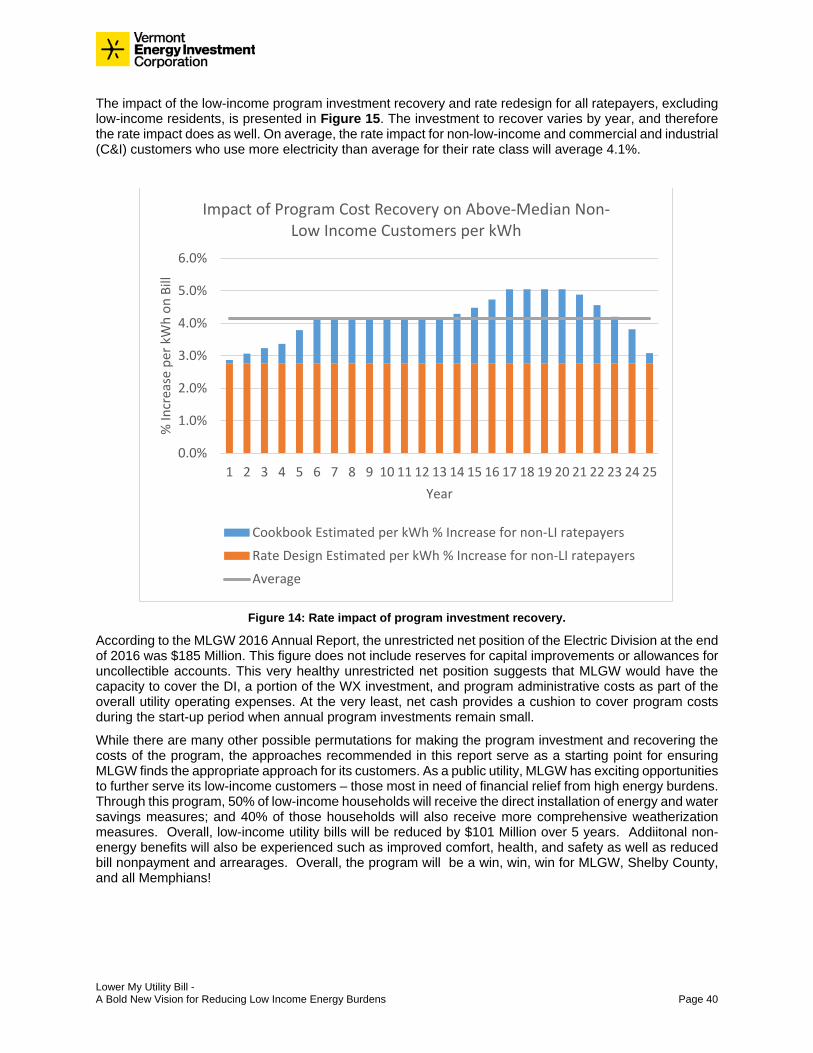
Lower My Utility Bill - A Bold New Vision for Reducing Low Income Energy Burdens Page 40
The impact of the low-income program investment recovery and rate redesign for all ratepayers, excluding low-income residents, is presented in Figure 15. The investment to recover varies by year, and therefore the rate impact does as well. On average, the rate impact for non-low-income and commercial and industrial (C&I) customers who use more electricity than average for their rate class will average 4.1%.
Figure 14: Rate impact of program investment recovery.
According to the MLGW 2016 Annual Report, the unrestricted net position of the Electric Division at the end of 2016 was $185 Million. This figure does not include reserves for capital improvements or allowances for uncollectible accounts. This very healthy unrestricted net position suggests that MLGW would have the capacity to cover the DI, a portion of the WX investment, and program administrative costs as part of the overall utility operating expenses. At the very least, net cash provides a cushion to cover program costs during the start-up period when annual program investments remain small.
While there are many other possible permutations for making the program investment and recovering the costs of the program, the approaches recommended in this report serve as a starting point for ensuring MLGW finds the appropriate approach for its customers. As a public utility, MLGW has exciting opportunities to further serve its low-income customers – those most in need of financial relief from high energy burdens. Through this program, 50% of low-income households will receive the direct installation of energy and water savings measures; and 40% of those households will also receive more comprehensive weatherization measures. Overall, low-income utility bills will be reduced by $101 Million over 5 years. Addiitonal non-energy benefits will also be experienced such as improved comfort, health, and safety as well as reduced bill nonpayment and arrearages. Overall, the program will be a win, win, win for MLGW, Shelby County, and all Memphians!
0.0%
1.0%
2.0%
3.0%
4.0%
5.0%
6.0%
1 2 3 4 5 6 7 8 9 10 11 12 13 14 15 16 17 18 19 20 21 22 23 24 25
% In
crea
se p
er k
Wh
on B
ill
Year
Impact of Program Cost Recovery on Above-Median Non-Low Income Customers per kWh
Cookbook Estimated per kWh % Increase for non-LI ratepayers
Rate Design Estimated per kWh % Increase for non-LI ratepayers
Average
Lower My Utility Bill - A Bold New Vision for Reducing Low Income Energy Burdens Page 41
8 Lower My Utility Bill!
Substantial opportunity exists to reduce low-income energy burdens in Shelby County while creating new jobs and stimulating the local economy. Presented below are the top priorities to keep this moving!
1. The Memphis City Council should direct its municipal utility – Memphis Light, Gas and Water – to design and implement the aggressive new energy efficiency and weatherization program described in this report beginning in 2019, leveraging the lessons learned during the roll-out of Share the Pennies program in 2018.
2. The Memphis Light, Gas and Water Board of Commissioners should direct the MLGW Chief Executive Officer (CEO) to develop for Board review a capital formation, financing, and rate redesign approach for MLGW to raise the capital needed to implement the program and to recover the costs in a manner that ensures low-income households served by the program experience a 15 to 25% reduction in their utility bills.
3. The Memphis Light, Gas and Water Chief Executive Officer should appoint from within the MLGW staff the utility champion for the new program, and direct the Champion to work collaboratively with key stakeholders in 2018 and beyond to ensure the new program leverages and is coordinated with existing housing, energy efficiency, and weatherization services already being provided to low-income households in Shelby County.
4. The Memphis Light, Gas and Water Champion should develop a timeline and schedule outlining the staffing needs, hiring plan, and training process to ensure the utility is ready to announce and begin staffing the new program on January 1, 2019.
5. The Memphis Light, Gas and Water Communications and Marketing Team should develop a high-level outreach campaign, promoting and explaining the new program to build customer interest in and excitement for the new offering before it hits the ground.
6. MLGW Should Implement a Demonstration Project in which a typical low-income home in Shelby County receives the full range of direct install and weatherization improvements in 2018. This would provide the opportunity to review energy and water usage and monthly utility bills and to confirm (or adjust) the savings anticipated for the program compared to those projected in this report. Friends of the Earth is offering to sponsor and fund this demonstration project.
7. MLGW should prepare to issue bonds to raise the capital needed to develop and deliver the program.
As a municipal utility with high grade bond ratings across all three utility divisions and very strong debt coverage ratios, MLGW is in a position to issue bonds sufficient to fund the program. By issuing general obligation bonds, MLGW could borrow at the lowest rates available for first-class government bonds. These low interest rates and longer bond terms would enable the capital needed to provide a program that creates positive cash flow for low-income households most in need of support and assistance.
8. MLGW should explore tariff-based financing. In order to achieve the ambitious goal of reducing utility bills of low-income households in Shelby County – for homeowners and renters.
9. MLGW should explore contracting with a third-party to implement tariff-based financing. TBF can be administered by MLGW or by a third party that specializes in providing this type of financing to customers on behalf of utilities. Since MLGW does not presently offer financing, the amount of process and system changes needed could potentially hinder program launch and implementation. One
Lower My Utility Bill - A Bold New Vision for Reducing Low Income Energy Burdens Page 42
example of a regional model is EEtility - a Little Rock, Arkansas third party implementer of TBF. There may be other third party implementers of TBF with similar capabilities.
10. MLGW should undertake a rate redesign that eliminates the fixed charge for low income households and distributes the cost of this impactful and much needed low-income assistance program across other rate classes.There are many reasons such an approach is prudent and appropriate for the public utility.
Since 1939, MLGW has placed customer experience and value among its top priorities.35 The mission of MLGW is “to improve the quality of life for all Memphis and Shelby County customers through the efficient and safe delivery of electricity, natural gas and water. The vsion of MLGW is “to be the best utility for our customers.”36 A national study completed in 2016 determined that:
• Memphis has the highest household energy burden of all public utilities in the nation: and that
• Memphis has the highest household energy burden of the 50 largest cities in the U.S. (with energy burden defined as the percent of income spent on energy bills.37
According to the study, the median Memphis household spends 6.2% of its income on energy and the median low-income household spends38 spends 13.2% of its income on energy. There are the highest energy burdens compared to all of the largest cities in the U.S. In addition, Memphis has the highest 3rd quartile low-income energy burden at 25.5%, meaning that 25% of low-income Memphians spend more than 25.5% of their household income on utility bills. This is all despite MLGW having perrenially low rates (per kWh) compared to other municipal utilities. In addition, as discussed in Section 6 above, arrearages in 2016 alone accounted for:
• More than $6.8 million in revenue adjustments for nonpayment of bills for electricity;
• $1.4 million in revenue adjustments for natural gas; and
• $1 million in revenue adjustments for water.
These arrearages represent a financial drain on the utility. Reducing low-income household utility bills by 15 to 25% (or greater) in part through a rate redesign:
• Is consistent with the MLGW mission and vision;
• Is a smart business decision for the utility as it will help alleviate a serious financial drain on the utility; and
• Is a just and equitable business practice given the high energy burden of the City’s most vulnerable customers compared to non-low-income ratepayers.
The Memphis City Council should instruct the municipal utility to undertake such a rate redesign effective January 1, 2019, upon the launch of the aggressive new direct install and weatherization program.
35 http://www.mlgw.com/images/content/files/pdf/MLGWAnnualReport2016-Web.pdf 36 http://www.mlgw.com/images/content/files/pdf/StrategicPlanFileCURRENT.pdf 37 Lifting the High Energy Burden in America’s Largest Cities: How Energy Efficiency Can Improve Low-Income and Underserved Communities; Ariel Drehobl and Lauren Ross, April 2016; http://aceee.org/sites/default/files/publications/researchreports/u1602.pdf 38 Low income customers are defined as customers with incomes at or below 80% of Area Median Income.
Lower My Utility Bill - A Bold New Vision for Reducing Low Income Energy Burdens Page 43
Appendix A: Program Budget and Savings Model Assumptions
The following assumptions were used to model the level of investment needed to achieve the program goals, and to estimate energy savings and bill reductions resulting from the program. The results of this analysis represents the modeling of one possible scenario. Many of the assumptions can be adjusted, resulting in different outcomes, but the magnitude of the investments and savings presented here are expected to remain in the same range regardless of minor adjustments to the assumptions.
• The analysis assumed that measure costs will be discounted by 10 to 20% to account for volume purchase.
• The analysis assumed that the penetration of measures will be measure-specific but for ease of modeling remains the same for multifamily and single family buildings.
• The estimated savings were calculated using measure-specific savings estimates from published sources, or calculated using results from modeling HVAC savings using the BEOpt model,39 as well as using utility bill rates reported by MLGW.
• All DI measures were assumed to be provided free of charge to the customer. All weatherization measure cost and installation costs were assumed to be entirely financed by the participant, except for the portion covered by the MLGW incentive.
• The model assumed that participation in the program ranged from 5% of low-income households in Year 1 to 12% in Year 5, for a cumulative total of 50% of low-income households participating in the program.
• The model assumes that the conversion rate from the number of households receiving a DI to the number of households completing weatherization work increases from 28% in Year 1 to 58% in Year 5, as the program becomes more established and word-of-mouth results in more participants in DI participants opting to proceed to the weatherization component of the program.
• The program assumed that incentives currently offered through MLGW can all be applied to all applicable measures installed through the WX program.
• The administrative overhead was assumed to be 5% for the DI program and 20% for the weatherization program, including MLGW staff time to oversee contractors. The weatherization program is expected to have a greater administrative costs because of the effort required to recruit, train, and manage subcontractors, and the need to complete a QA/QC of the contractors work.
• The contractors were assumed to be able to perform the weatherization work with a crew of 2.5 FTEs, working over 2.5 days. The crew size was assumed to include all specialists needed to get the job done: weatherization specialists, HVAC specialists, plumbers, etc.
• A health and safety fund with a cap of $1,000 was assumed to be used in half of the homes to be weatherized, to bring the homes to a point where efficiency measures can be safely and effectively installed. That amount was assumed to be financed by residents, as for the efficiency measures.
The assumptions listed above resulted in a model with the following measure mix (Figure 16 and Figure 17) for the DI and WX components. Individual households would see a different measure mix, but adding up all participants would result in the following mix of measures
39 https://beopt.nrel.gov/
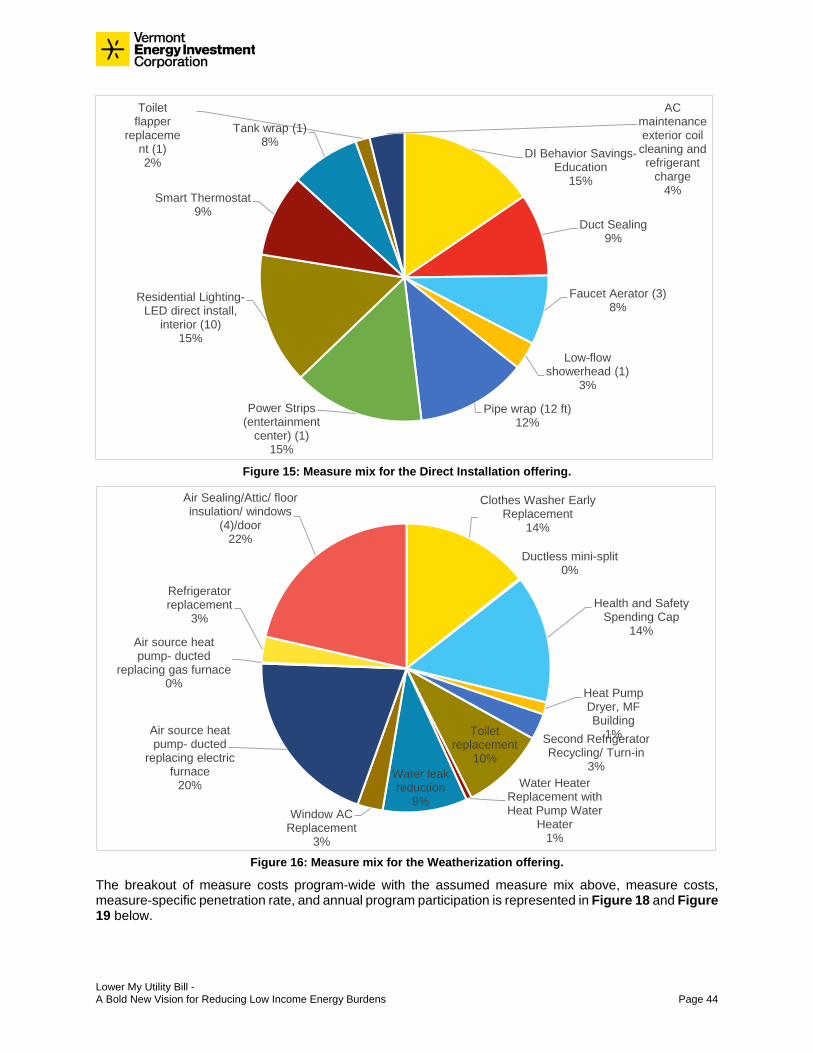
Lower My Utility Bill - A Bold New Vision for Reducing Low Income Energy Burdens Page 44
Figure 15: Measure mix for the Direct Installation offering.
Figure 16: Measure mix for the Weatherization offering.
The breakout of measure costs program-wide with the assumed measure mix above, measure costs, measure-specific penetration rate, and annual program participation is represented in Figure 18 and Figure 19 below.
DI Behavior Savings-Education
15%
Duct Sealing 9%
Faucet Aerator (3)8%
Low-flow showerhead (1)
3%
Pipe wrap (12 ft)12%
Power Strips (entertainment
center) (1)15%
Residential Lighting-LED direct install,
interior (10)15%
Smart Thermostat 9%
Tank wrap (1)8%
Toilet flapper
replacement (1)2%
AC maintenance exterior coil
cleaning and refrigerant
charge4%
Clothes Washer Early Replacement
14%
Ductless mini-split0%
Health and Safety Spending Cap
14%
Heat Pump Dryer, MF Building
1%Second Refrigerator Recycling/ Turn-in
3%
Toilet replacement
10%
Water Heater Replacement with Heat Pump Water
Heater1%
Water leak reduction
9%Window AC
Replacement3%
Air source heat pump- ducted
replacing electric furnace
20%
Air source heat pump- ducted
replacing gas furnace0%
Refrigerator replacement
3%
Air Sealing/Attic/ floor insulation/ windows
(4)/door22%
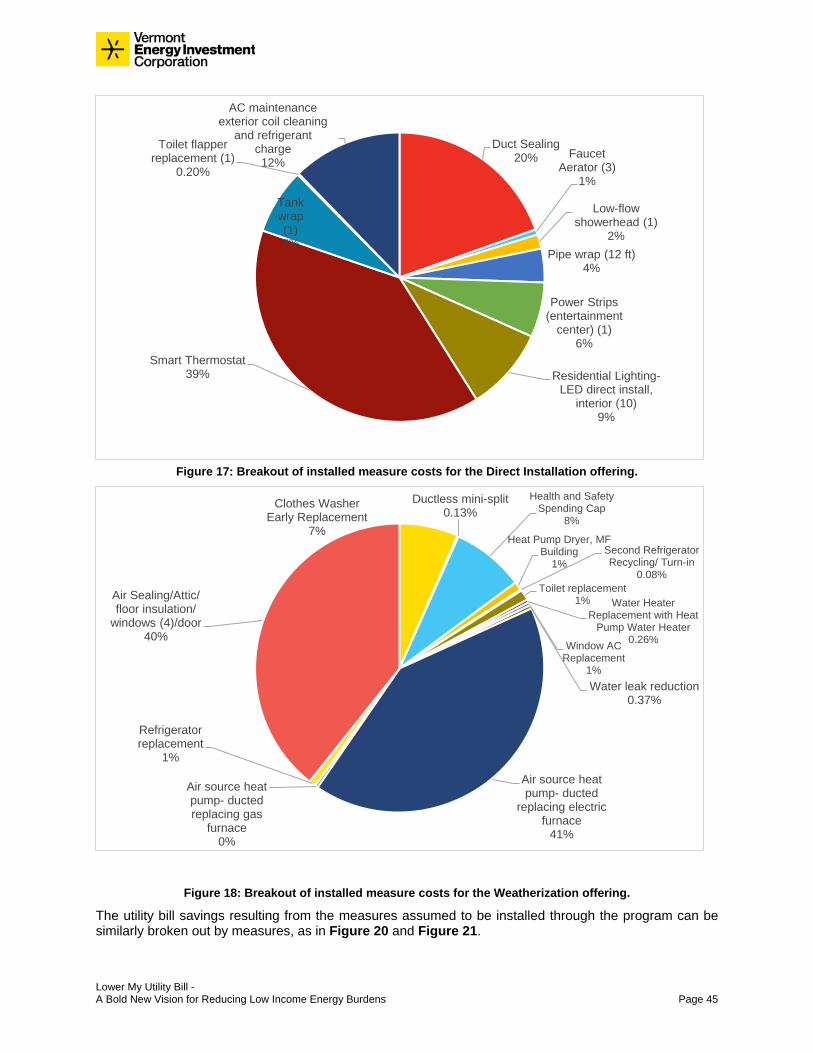
Lower My Utility Bill - A Bold New Vision for Reducing Low Income Energy Burdens Page 45
Figure 17: Breakout of installed measure costs for the Direct Installation offering.
Figure 18: Breakout of installed measure costs for the Weatherization offering.
The utility bill savings resulting from the measures assumed to be installed through the program can be similarly broken out by measures, as in Figure 20 and Figure 21.
Duct Sealing 20% Faucet
Aerator (3)1%
Low-flow showerhead (1)
2%Pipe wrap (12 ft)
4%
Power Strips (entertainment
center) (1)6%
Residential Lighting-LED direct install,
interior (10)9%
Smart Thermostat 39%
Tank wrap (1)7%
Toilet flapper replacement (1)
0.20%
AC maintenance exterior coil cleaning
and refrigerant charge12%
Clothes Washer Early Replacement
7%
Ductless mini-split0.13%
Health and Safety Spending Cap
8%
Heat Pump Dryer, MF Building
1%Second Refrigerator Recycling/ Turn-in
0.08%Toilet replacement
1% Water Heater Replacement with Heat
Pump Water Heater0.26%
Water leak reduction0.37%
Window AC Replacement
1%
Air source heat pump- ducted
replacing electric furnace
41%
Air source heat pump- ducted replacing gas
furnace0%
Refrigerator replacement
1%
Air Sealing/Attic/ floor insulation/
windows (4)/door40%
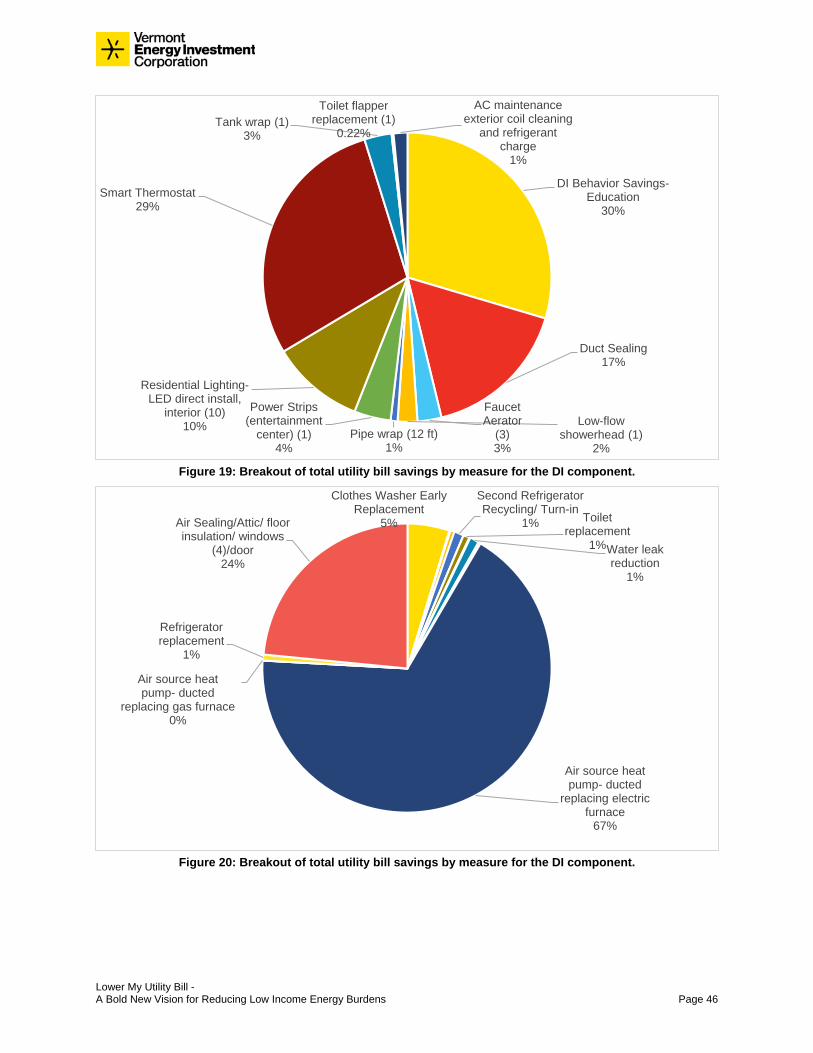
Lower My Utility Bill - A Bold New Vision for Reducing Low Income Energy Burdens Page 46
Figure 19: Breakout of total utility bill savings by measure for the DI component.
Figure 20: Breakout of total utility bill savings by measure for the DI component.
DI Behavior Savings-Education
30%
Duct Sealing 17%
Faucet Aerator
(3)3%
Low-flow showerhead (1)
2%Pipe wrap (12 ft)
1%
Power Strips (entertainment
center) (1)4%
Residential Lighting-LED direct install,
interior (10)10%
Smart Thermostat 29%
Tank wrap (1)3%
Toilet flapper replacement (1)
0.22%
AC maintenance exterior coil cleaning
and refrigerant charge
1%
Clothes Washer Early Replacement
5%
Second Refrigerator Recycling/ Turn-in
1% Toilet replacement
1%Water leak reduction
1%
Air source heat pump- ducted
replacing electric furnace
67%
Air source heat pump- ducted
replacing gas furnace0%
Refrigerator replacement
1%
Air Sealing/Attic/ floor insulation/ windows
(4)/door24%