savills plc (‘savills’ or ‘the group’)/media/files/s/savills-ir-v3/...savills plc, the...
TRANSCRIPT

1
12 March 2020 Savills plc (‘Savills’ or ‘the Group’) PRELIMINARY RESULTS FOR THE FULL YEAR ENDED 31 DECEMBER 2019 Savills plc, the international real estate advisor, today announces another resilient performance with increased revenues and stable profits. Key financial highlights
Group revenue up 10% to £1.93bn (2018: £1.76bn), driven by a strong performance (+16%) in our Less Transactional business lines (57% of 2019 revenue)
Underlying* profit before tax maintained at £143.4m (2018: £143.7m), despite a £3.5m reduction in profit from the implementation of IFRS 16
Statutory profit before tax increased 6% to £115.6m (2018: £109.4m)
Underlying basic earnings per share (‘EPS’) in line at 78.0p (2018: 77.8p)
Statutory basic EPS increased 8% to 60.6p (2018: 56.2p)
Final ordinary and supplementary interim dividends up 3% to total 32.0p per share (2018: 31.2p)
* Underlying profit before tax (‘underlying profit’) is calculated on a consistently reported basis in accordance with Note 4 to this Preliminary Statement.
Key operating highlights
Resilient performance reflects geographic diversity and strength of Less Transactional service lines
Our Transaction Advisory revenue grew by 2%, led by North America, Europe and the Middle East
Further strong growth from our Less Transactional services (+16%) with Property and Facilities Management revenue up 17% and Consultancy revenue up 15%
UK profits increased by 7% to £81.9m, led by Property Management and Consultancy
Savills UK Residential grew revenues by 6%, outperforming the decline in UK market volumes
Continued growth in North America driven by the occupier-focused business with revenue up 11% and underlying profit up 35% to £17.3m
Savills Investment Management reported a record year with revenue up 19%, profits up 65% to £18.1m and AUM up 8% to £17.7bn. £3.1bn new inflows up 29% on 2018 (£2.4bn)
Commenting on the results, Mark Ridley, Group Chief Executive, said: I am very pleased that Savills delivered a good performance in 2019 in some challenging market conditions. This reflects the strength and resilience of our global, diversified business as we continued to grow our Less Transactional service lines and outperform in many of our transactional markets. “We continue to focus on growing our Less Transactional businesses, increasing our share of the global transactional markets and enhancing the resilience of the business. While we continue to monitor the impact of global uncertainties on investor and occupier demand for real estate, we have made a good start to 2020 with the first two months outperforming the same period last year on all measures. As a result of the dynamic situation in respect of COVID-19 it is difficult accurately to predict its impact on our business for 2020 as a whole, although we do expect a greater weighting of activity to the second half of the year.”

2
For further information, contact: Savills 020 7409 8934 Mark Ridley, Group Chief Executive Simon Shaw, Group Chief Financial Officer Tulchan Communications 020 7353 4200 David Allchurch Elizabeth Snow Will Palfreyman
There will be an analyst presentation today at 9.30am at Savills, 15 Finsbury Circus, London, EC2M 7EB. A recording of the presentation will be available from noon at www.ir.savills.com.

3
Chairman’s statement Savills delivered a resilient performance in the face of some challenging market conditions, reflecting our geographic diversity and the breadth of our Less Transactional service lines. Results Against the backdrop of much reduced transaction volumes in both the UK and Hong Kong, the Group’s revenue growth of 10% to £1.93bn (2018: £1.76bn) was driven by a strong performance in our Less Transactional business lines. Underlying profit for the year maintained at £143.4m (2018: £143.7m) as a result of this change in business mix and the first time charge under IFRS 16 which increased Savills property costs by £3.5m. The Group’s statutory profit before tax increased by 6% to £115.6m (2018: £109.4m). Overview Savills delivered revenue growth and a resilient underlying profit in 2019 in the face of challenging market conditions. Growth in our Less Transactional businesses and in North America helped to offset the impact of declines in transaction volumes in Asia Pacific and the UK. Currency movements had a positive impact on the Group, increasing revenue by £20.7m, underlying profit by £1.4m and statutory profit before tax by £1.9m. Our Transaction Advisory revenue grew by 2%, our Consultancy business revenue by 15% and our Property Management revenue by 17%. The UK Commercial Transaction Advisory business delivered a resilient performance outperforming the rest of the market which declined by 17% year-on-year as a result of the political uncertainty until the end of the year. Our UK Residential business continued to perform well in challenging conditions for much of the year which saw the UK market volume of transactions with values greater than £1.0m declining by 2% year-on-year. Against this backdrop and buoyed by the clear General Election result in December, Savills UK Residential business performed well, growing revenue by 6% year-on-year. In Asia Pacific, a sharp decline in investor confidence in Hong Kong and growth costs in Australia negatively affected both the Commercial and Residential transaction businesses, the impact of which was partially mitigated by stronger performances in Japan, Singapore and the Regional Hospitality advisory group. In the US, we delivered significant growth in the Occupier Service business (including tenant representation brokerage); however the profitability of the US operation continues to be affected by the cost of investment in the business, including further development of the support services platform. Savills Investment Management delivered a record year with both new product launches and significant capital deployed increasing its Assets Under Management (‘AUM’) to £17.7bn (2018: £16.4bn). This, together with the benefit of performance fees on certain products, led to a 65% increase in underlying profits. The reduction in transaction volumes in Asia Pacific and growth in our lower margin but stable Property Management business, together with the first time impact of IFRS 16 and the cost of our business development activities in a number of markets, resulted in a reduction to the Group underlying profit margin to 7.4% (2018: 8.2%). The impact of the aforementioned factors on the Group underlying profit margin were offset by lower acquisition-related charges, higher profits on disposal of investments and the absence of the one-off charge in 2018 in relation to the impact of equalising Guaranteed Minimum Pension (‘GMP’) on the UK defined benefit pension plan. The statutory pre-tax profit margin declined slightly to 6.0% (2018: 6.2%). Business development Savills strategy is to be a leading multi-sector property advisor in the key markets in which we operate. Our global strategy is delivered locally by our experts on the ground with flexibility to adapt quickly to changes in circumstances and opportunities. They are supported by our global cross-border investment, residential and occupier services specialists. Over the last few years we have acquired a number of complementary businesses and added teams and individual hires to our strong core business.
4
In the UK, the business focused on the successful integration of acquisitions made in the prior year, including Currell Group (residential brokerage in East London) and the Broadgate Estates third party property management portfolio, into the wider business. During the year, the business acquired KKS, a London based workplace consultancy and design studio which enhances our service offering, particularly to corporate occupiers. Development in Europe & the Middle East focused on integrating and developing the Middle East operation, which was acquired through the acquisition of Cluttons Middle East in 2018. Team recruitment in the Middle East, along with Sweden, Germany and France enhanced our strength in those regions across key business lines. In Asia Pacific, having expanded significantly in 2018, we moderated our hiring in the region, focusing on Australia and Singapore. Savills India opened for business in October 2018 and undertook significant expansion during the year now employing over 300 professionals in six offices (Bangalore, Mumbai, Delhi NCR, Hyderabad, Pune and Chennai). In North America, we continued to expand our occupier-focused business lines through both recruitment and investment in technology and central services such as marketing and research. In March 2019, the business was re-branded to “Savills”. Technology continues to be a focal area across the real estate industry. Over the last twelve months we have witnessed some of the excitement surrounding “Proptech” being replaced by a more pragmatic approach to assessing which new technologies and tools genuinely address industry challenges and help drive efficiencies. It is also worth noting that across the world, countries are at varying stages in this evolution, and one of our key focuses has been to foster internal forums for identifying and sharing promising innovative opportunities across the Savills network. We have continued to invest in our own technology platforms in order both to deliver innovative solutions to our clients through data analysis and insight and to drive internal efficiencies in how we deliver those services. Improving efficiency in our Valuation teams has been a particular area of focus locally across the Group, and we continue to roll out our award winning Knowledge Cubed platform, developed in the United States and deployed to occupier clients across the globe. We have continued to grow workthere.com, Savills innovative response to the changing requirements of occupiers seeking serviced office/co-working space in global cities, which has now launched in nine countries and grew revenue threefold in 2019. Finally, we have continued to invest in our company-wide ERP platform, with a number of our larger markets going live during the year. Board Charles McVeigh, who served on the Board from 2000, and Liz Hewitt, who joined the Board in 2014 retired at the conclusion of the Company’s AGM in May 2019. Following Liz Hewitt’s retirement, Stacey Cartwright succeeded Liz as Chairman of the Audit Committee. I would like to thank both Charlie and Liz for their considerable contributions to Board and its Committees during their terms. In October 2019, the Board announced the appointment of Dana Roffman as an additional independent Non-Executive Director. Dividends An initial interim dividend of 4.95p per share (2018: 4.8p) amounting to £6.7m was paid on 2 October 2019, and a final ordinary dividend of 12.05p (2018: 10.8p) is recommended, making the ordinary dividend 17.0p for the year (2018: 15.6p). In addition, a supplemental interim dividend of 15.0p (2018: 15.6p) is declared, based upon the underlying performance of our Transaction Advisory business. Taken together, the ordinary and supplemental interim dividends comprise an aggregate distribution for the year of 32.0p per share, representing an increase of 2.6% on the 2018 aggregate dividend of 31.2p. The final ordinary dividend of 12.05p per ordinary share will, subject to shareholders’ approval at the AGM on 6 May 2020, be paid alongside the supplemental interim dividend of 15.0p per share on 12 May 2020 to shareholders on the register at 14 April 2020.
5
People I would like to express my thanks to all our staff worldwide for their hard work, commitment and continued focus on client service, which enable the Group to deliver these results. Summary and Outlook Savills delivered a good performance in 2019 in some challenging market conditions. This reflects the strength and resilience of our global, diversified business as we continued to grow our Less Transactional service lines and outperform in many of our transactional markets. In Asia, particularly China, it is clear that COVID-19 is having a significant impact on transactional activity and may have a similar effect elsewhere, depending to an extent on the length and severity of each outbreak. Our focus is on the welfare of our staff and clients and we have instituted protective measures in locations potentially affected by this virus. The situation is dynamic and due to the uncertainty, it is difficult accurately to predict the full impact of this issue on our business for 2020 as a whole. However, given the nature of the real estate market, we would anticipate that any near term slowdown caused by sentiment and specific measures taken to combat COVID-19 would generally result in a temporary delay in activity rather than an absolute loss of business. We remain focused on growing our Less Transactional businesses, increasing our share of the global transactional markets and enhancing the resilience of the business to challenging market conditions. While we continue to monitor the impact of global uncertainties on investor and occupier demand for real estate, we have made a good start to 2020 with the first two months outperforming the same period last year on all measures. As a result of the dynamic situation in respect of COVID-19, we do expect a greater weighting of activity to the second half of the year.
Nicholas Ferguson CBE Chairman
6
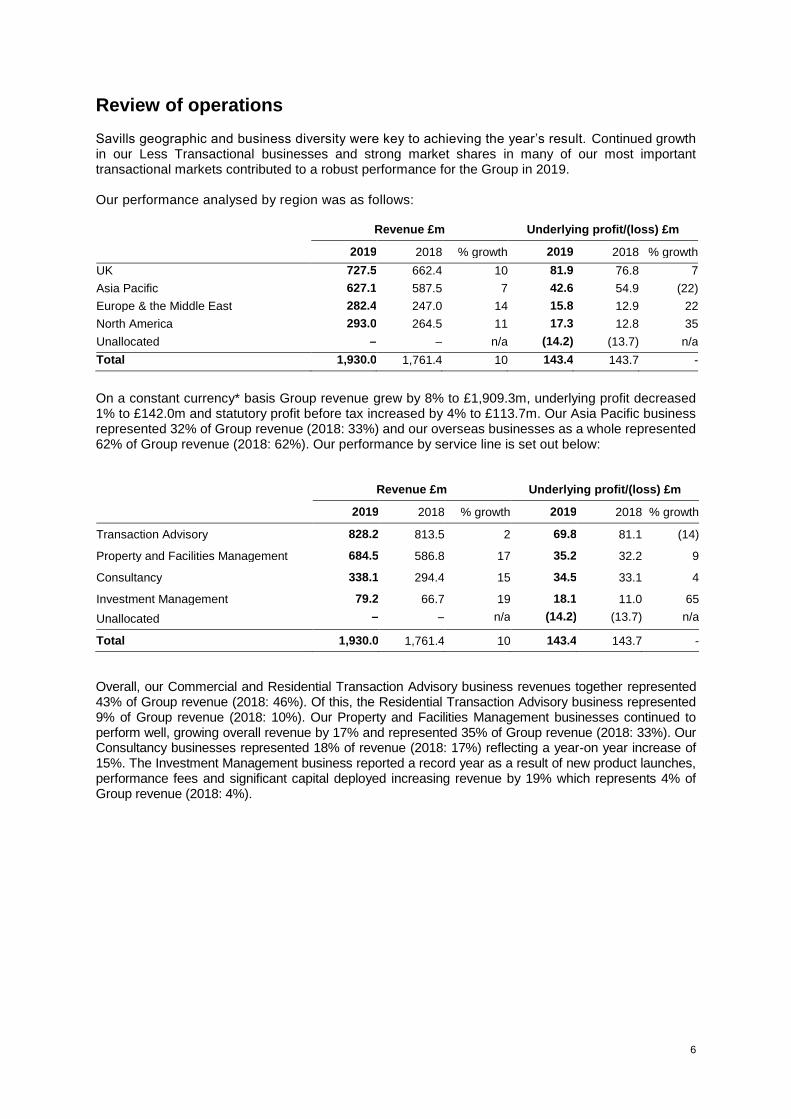
Review of operations Savills geographic and business diversity were key to achieving the year’s result. Continued growth in our Less Transactional businesses and strong market shares in many of our most important transactional markets contributed to a robust performance for the Group in 2019. Our performance analysed by region was as follows:
Revenue £m Underlying profit/(loss) £m
2019 2018 % growth 2019 2018 % growth
UK 727.5 662.4 10 81.9 76.8 7
Asia Pacific 627.1 587.5 7 42.6 54.9 (22)
Europe & the Middle East 282.4 247.0 14 15.8 12.9 22
North America 293.0 264.5 11 17.3 12.8 35
Unallocated – – n/a (14.2) (13.7) n/a
Total 1,930.0 1,761.4 10 143.4 143.7 -
On a constant currency* basis Group revenue grew by 8% to £1,909.3m, underlying profit decreased 1% to £142.0m and statutory profit before tax increased by 4% to £113.7m. Our Asia Pacific business represented 32% of Group revenue (2018: 33%) and our overseas businesses as a whole represented 62% of Group revenue (2018: 62%). Our performance by service line is set out below:
Revenue £m Underlying profit/(loss) £m
2019 2018 % growth 2019 2018 % growth
Transaction Advisory 828.2 813.5 2 69.8 81.1 (14)
Property and Facilities Management 684.5 586.8 17 35.2 32.2 9
Consultancy 338.1 294.4 15 34.5 33.1 4
Investment Management 79.2 66.7 19 18.1 11.0 65
Unallocated – – n/a (14.2) (13.7) n/a
Total 1,930.0 1,761.4 10 143.4 143.7 -
Overall, our Commercial and Residential Transaction Advisory business revenues together represented 43% of Group revenue (2018: 46%). Of this, the Residential Transaction Advisory business represented 9% of Group revenue (2018: 10%). Our Property and Facilities Management businesses continued to perform well, growing overall revenue by 17% and represented 35% of Group revenue (2018: 33%). Our Consultancy businesses represented 18% of revenue (2018: 17%) reflecting a year-on year increase of 15%. The Investment Management business reported a record year as a result of new product launches, performance fees and significant capital deployed increasing revenue by 19% which represents 4% of Group revenue (2018: 4%).

7
Transaction Advisory
Overall, our Transaction Advisory revenues grew 2% (stable in constant currency) to £828.2m (2018: £813.5m). Globally, our Commercial Capital Transaction business revenue declined by 8% and our Leasing and Occupier focused transactional revenues grew by 10%. Our Global Residential business revenue decreased by 1%.
Underlying profits decreased 14% to £69.8m (2018: £81.1m), with a reduced underlying profit margin of 8.4% (2018: 10.0%), as a result of the relative mix of activity across the globe and the lag effect of business development costs.
Asia Pacific Commercial
Revenue of the Asia Pacific Commercial Transaction business decreased by 13% to £138.6m (2018: £160.1m), a 15% decrease in constant currency. This was a result of a significant decrease in investment activity in Hong Kong where market volumes declined by 42% following the introduction of US/Sino trade tariffs and ongoing political uncertainty. The effect of this was partially offset by substantial improvements in Japan and our APAC Hospitality Group. Elsewhere, revenue growth in Mainland China was 9%, whilst decreases were seen in Australia (down 11%), and South Korea (down 26%).
The challenging market conditions in Hong Kong and the effect of business development costs in Australia are reflected in a 42% decrease in underlying profit to £12.4m (2018: £21.2m). This represented a 44% decrease in constant currency.
UK Commercial
Revenue from UK commercial transactions decreased 4% to £94.2m (2018: £98.4m) as the continuing lack of clarity around the UK’s exit from the EU and political uncertainty in advance of the General Election affected sentiment in the commercial property investment markets, where volumes declined 17% year-on-year.
All segments of the UK commercial property market saw year-on-year falls in investment activity, with the most notable decline being in the central London office market which was down 34%. Investment in offices nationally declined by 26% and retail by 10%, while industrial investment activity saw the second largest year-on-year fall of 14%.
Recognising that the UK property market represents good value relative to other major international locations, investor sentiment improved substantially following the clear General Election result and drove a strong finish to the year, in which our business significantly outperformed the market restricting the overall annual decline in revenue to 4%.
Transaction volumes in most UK leasing markets also declined in 2019, following a strong year of take-up in 2018. Occupier take-up in the national logistics market was 34.2m sq ft. Although this was 9% lower than 2018, it was still the fourth strongest year of the last decade. In the office markets, take-up in central London fell by 15% year-on-year and in the top six cities outside London by 10%. Savills outperformed the market with a decline of 4% in leasing revenues.
The retail sector continued to face challenges for both landlords and tenants in 2019. However, 2019 saw the largest number of initial openings of new sites by international brands in the UK and a stronger year for new shop openings on retail warehouse parks.
Overall reduced market activity led to a 22% decrease in underlying profit to £12.3m (2018: £15.7m), with underlying profit margin falling to 13.1% (2018: 16.0%).
8
North America
In March the North American business rebranded to “Savills” and continued to grow through the year. Our North American business, which primarily serves corporate occupiers, increased revenues by 11% to £293.0m (2018: £264.5m) reflecting improved performances across the network. In constant currency this equated to a year-on-year increase of 6%.
North American underlying profit increased by 35% to £17.3m (2018: £12.8m), a 29% increase in constant currency, with the underlying profit margin improving to 5.9% (2018: 4.8%). After the continued costs of investment in the business including significant investment in management and our central office platform, this represented an improvement towards desired levels of profitability. As expected, the capital markets team in New York significantly reduced operating losses during the period.
Europe & the Middle East
In Europe & the Middle East, Commercial Transaction fee income grew by 13% (14% in constant currency) to £127.5m (2018: £113.1m). Strong results from investment teams in France, Benelux and Ireland offset revenue reductions in Germany, Italy and Portugal. Office Leasing performed well across the region growing 28% year-on-year driven primarily by strong performances in France and Germany. As a result of certain restructuring and recruitment costs in Sweden, France and Germany, the Europe & Middle East transactional business reported underlying profit of £5.4m (2018: £5.5m) and an underlying profit margin of 4.2% (2018: 4.9%). UK Residential
Our UK Residential business outperformed a weak UK market, where the volume of transactions valued above £1m declined by approximately 2% in 2019, with revenue increasing 6% to £139.1m (2018: £131.5m). Significant growth in our Core London business (average transaction value £1.1m), which doubled its market share in most locations, drove this performance through much of the year. In addition, we experienced a notable increase in transactions, much of it being the release of pent up buyer demand in the Prime and Super Prime London markets following the clear General Election result.
Properties exchanged rose 14% overall in Prime Central London and Savills overall transaction volumes exchanged were up 31% in London and 7% in the regional markets. This reflected the increasing importance of Core London to our business which is also demonstrated by the 21% reduction in the average value of London residential property sold by Savills to £2.1m (2018: £2.7m). The average transaction value outside London decreased marginally to £1.13m (2018: £1.14m).
In the New Homes business, revenue increased by 4%, which represented a robust performance in the prevailing market conditions with the number of reservations increasing by 16%. Average transaction values declined 1% whilst the number of exchanges decreased by 10%.
Overall, the UK Residential Transaction Advisory business showed resilience in challenging markets, recording a 1% increase in underlying profits to £17.8m (2018: £17.6m). The shift in mix in favour of the Core London market reduced the underlying profit margin to 12.8% (2018: 13.4%).
Asia Pacific Residential
Overall, Asia Pacific Residential revenues decreased 22% to £35.8m (2018: £45.9m) which represented a 23% decrease in constant currency. A significant decline was seen in Hong Kong as investor confidence was impacted by economic and political uncertainty, as a result revenue declined by 37% year-on-year. Elsewhere in the region, Mainland China revenues were stable during the period with a slight decline in Shanghai largely offset by an increase in Beijing. The business in Singapore also experienced a decline in revenue and profits as a result of the government cooling measures implemented in 2018. Revenue in Australia declined substantially due to weak market conditions and as a result the business was restructured to mitigate the effect on profits.
The net effect of all these factors resulted in a 45% decrease in underlying profit to £4.6m (2018: £8.3m).
9
Property and Facilities Management Our Property and Facilities Management businesses continued to perform well, growing revenue by 17% (15% in constant currency) to £684.5m (2018: £586.8m). Savills total area under management increased by 14% to 2.30bn sq. ft. (2018: 2.02bn sq. ft.). Underlying profit increased by 9% to £35.2m (2018: £32.2m), 8% in constant currency. Asia Pacific
The Asia Pacific region grew revenue by 14% (11% in constant currency) to £372.5m (2018: £327.0m). The Property and Facilities Management business is a significant strength in the region, representing 59% of Savills Asia Pacific revenue (2018: 56%) and complementing our Transaction Advisory businesses. The total square footage under management in the region was up 13% to approximately 1.71bn sq. ft. (2018: approximately 1.51bn sq. ft.). The effect of a strong performance in Greater China (incl. Hong Kong) included the revenue benefit in the initial periods of some significant facilities management contracts in Hong Kong/Macau with little short term effect on profits. Elsewhere, increased pass through costs in Singapore and significant expansion of our business in Vietnam was offset by the Australian business which saw a reduction in revenue alongside restructuring and recruitment costs in the period. The underlying profit of the Asia Pacific Property Management business remained constant at £19.2m (2018: £19.2m).
UK
Our UK Property Management teams, comprising Commercial, Residential and Lettings, grew revenue by 21% to £231.1m (2018: £190.9m). This includes the full year effect of the 2018 acquisitions of the Broadgate Estates’ third party property management portfolio and the Currell Group.
The business was awarded a number of significant contracts during the year including some lower margin Facilities Management programmes in the managed estate. The effect of these wins and investment in the platform resulted in a flat underlying profit margin of 6.8% (2018: 6.8%) and underlying profit growth of 22% to £15.8m (2018: £13.0m).
Europe & the Middle East
In Europe & the Middle East, revenue grew by 17% (19% in constant currency) to £80.9m (2018: £68.9m), including the full year effect of the 2018 acquisition of Cluttons Middle East. Some significant mandate wins in the Middle East drove the overall growth in revenue, but initial on-boarding and investment in the Spanish platform suppressed the margin during the period. By year end the total area under management had increased by 15% to 151.3m sq. ft. (2018: 131.9m sq. ft.). Collectively, the region achieved a small increase in underlying profits to £0.2m (2018: £0.0m).
Consultancy
Global Consultancy revenue increased by 15% to £338.1m (2018: £294.4m) and underlying profit grew by 4% to £34.5m (2018: £33.1m). Currency movements had a negligible impact on results in the Consultancy business.
UK
UK Consultancy revenue increased by 6% to £229.9m (2018: £215.9m), with strong performances in the Housing, Building Consultancy and Private Rented Sector (PRS) service lines. This growth was partially offset by a decline in Development and Rural, where a slow down in development advisory activity impacted revenue and underlying profits. Overall, underlying profit from the UK Consultancy business increased by 5% to £27.0m (2018: £25.8m), with underlying profit margin declining marginally to 11.7% (2018: 11.9%).

10
Asia Pacific Revenue in the Asia Pacific Consultancy business increased by 54% to £69.6m (2018: £45.1m), with minimal currency impact following a strong revenue performance in China alongside steady growth in the majority of the region. Profit growth was limited by the costs of recent team recruitment in China, Singapore and Australia with underlying profit increasing 7% to £4.6m (2018: £4.3m), 6% on constant currency basis.
Europe & the Middle East
Our Europe & Middle East Consultancy business, which principally comprises valuation and underwriting advisory services, increased revenue by 16% (17% in constant currency) to £38.6m (2018: £33.4m) including the full year effect of the 2018 acquisition of Cluttons Middle East. Our Consultancy practices grew across the majority of the region, but restructuring and recruitment costs suppressed the margin to 7.5% (2018: 9.0%) particularly in the Netherlands, Spain and Portugal. As a consequence, underlying profit fell slightly to £2.9m (2018: £3.0m).
Investment Management Revenue from Investment Management increased by 19% to £79.2m (2018: £66.7m). Net base management fees represented approximately 66% (2018: 64%) of Investment Management revenues and grew by 22% during the period. In an environment of fewer transactions (£3.1bn in 2019 vs £3.8bn in 2018), transaction-related fees declined by 1%, however the business benefitted from performance fees on certain products and 85% of funds (by AUM) exceeding their benchmark returns on a five year rolling basis. This track record supported a record year for new capital inflows of £3.1bn (2018: £2.4bn) despite more challenging market conditions. Assets under management increased by 8% to £17.7bn (2018: £16.54bn). Underlying profits for Investment Management increased by 65% to £18.1m (2018: £11.0m).
11
Financial review Underlying profit margin
Underlying profit margin decreased to 7.4% (2018: 8.2%), reflecting business mix and the cost of business development in a number of regions. In terms of revenue, the reduction in activity in some higher margin capital transaction markets was mitigated by growth in the lower margin leasing activity and, in particular, by growth in the Property Management business globally.
Taxation
The tax charge for the year decreased slightly to £32.0m (2018: £32.2m), reflecting an effective tax rate on statutory profit before tax of 27.7% (2018: 29.4%). In both years, the Group’s effective reported tax rate is higher than the UK effective rate of tax of 19% (2018: 19%), reflecting the effect of higher foreign rates of tax and permanently disallowed charges, including non-deductible acquisition costs. The underlying effective tax rate reduced slightly to 25.1% (2018: 25.7%).
Restructuring and acquisition-related costs
During the year the Group recognised a total of £25.2m in restructuring and acquisition-related costs (2018: £29.1m). These comprised an aggregate restructuring charge of £11.5m (2018: £8.4m). These related principally to costs incurred in rebranding the North American business to Savills in line with the original integration plan, and the final reorganisation within the ex SEB German Investment Management business in line with the transfer of the remaining open ended fund assets (primarily liquid assets) to the fund custodian. The reduction in acquisition-related costs in 2019 to £13.7m (2018: £20.7m) reflected a reduction in corporate acquisition activity year-on-year. These costs related to future consideration payments, associated with past acquisitions, which are subject to a future service condition. The largest components of this charge relate to the acquisitions of Aguirre Newman in 2017 and Currell Group in 2018. These charges have been excluded from the calculation of underlying profit in line with Group policy.
Earnings per share
Basic earnings per share increased 8% to 60.6p (2018: 56.2p), reflecting an 8% increase in statutory profit after tax. Adjusted on a consistent basis for exceptional pension charges, restructuring, acquisition-related costs, impairment charges, profits and losses on disposals, certain share-based payment adjustments and amortisation of acquired intangible assets (excluding software), underlying basic earnings per share increased marginally to 78.0p (2018: 77.8p). Fully diluted earnings per share increased by 8% to 58.8p (2018: 54.6p). The underlying fully diluted earnings per share increased slightly to 75.7p (2018: 75.6p). The first-time implementation of IFRS 16 (Leases) reduced earnings per share by 2.6p year-on year.
Cash resources, borrowings and liquidity
Gross cash and cash equivalents at year end decreased 6% to £209.9m (2018: £223.9m). This decrease primarily reflected the £10.3m of losses in the year on translation of cash balances held in non-sterling currencies (2018: £9.8m of translation gains). Gross borrowings at year end increased to £181.4m (2018: £150.0m). These principally comprise £150.0m (2018: £150.0m) of 7, 10 and 12 year fixed rate notes which were issued in June 2018, along with £32.5m (2018: £nil) drawn under the Group’s Revolving Credit Facility (‘RCF’). In June 2019 the Group amended and extended its existing £360m RCF to include a £90m accordion facility and extend the expiry date from December 2020 to June 2024. At the year end, net cash was £28.5m (2018: £73.9m).
12
Cash is typically retained in a number of subsidiaries in order to meet the requirements of commercial contracts or capital adequacy. In addition, cash in certain territories is retained to meet future growth requirements. The Group’s net inflow of cash is typically greater in the second half of the year. This is as a result of seasonality in trading and the major cash outflows associated with dividends, profit related remuneration payments and related payroll taxes in the first half. The Group cash inflow for the year from operating activities was £95.4m (2018: £104.3m). With a large proportion of the Group’s revenue being transactional in nature, the Board’s strategy is to maintain low levels of gearing, but retain sufficient credit facilities to enable it to meet cash requirements during the year and finance the majority of business development opportunities as they arise.
Capital and shareholders’ interests
During the year 0.1m shares (2018: 0.2m) were issued to participants under the Performance Share Plan and 0.1m (2018: 0.8m) new shares were issued to participants on exercise of options under the Group’s SAYE Schemes. The total number of ordinary shares in issue at 31 December 2019 was 143.1m (2018: 142.9m).
Savills Pension Scheme
The funding level of the defined benefit Savills Pension Scheme in the UK, which is closed to future service-based accrual, fell during the year primarily as a result of a decrease in the yield on AA-rated corporate bonds, increasing the value of the liabilities, offset by the impact of contributions made by the Group. The plan was in a liability position of £9.4m at the year-end (2018: £2.8m surplus). During the prior year the Group incurred an additional exceptional charge of £3.1m in respect of the equalisation of the Guaranteed Minimum Pension (‘GMP’) on the UK defined benefit pension plan.
Net assets
Net assets as at 31 December 2019 were £503.2m (2018: £505.0m). This movement reflects the Group’s trading performance which has been more than offset by the effects of foreign currency translation of foreign subsidiaries along with the actuarial loss on the UK defined benefit pension plan.
Foreign currency
The Group operates internationally and is exposed to foreign exchange risks. As both revenue and costs in each location are generally denominated in the same currency, transaction related risks are relatively low and generally associated with intra group activities. Consequently, the overriding foreign currency risk relates to the translation of overseas profits and losses into sterling on consolidation. The Group does not actively seek to hedge risks arising from foreign currency translations due to their non-cash nature. The net impact of foreign exchange rate movements represented a £20.7m increase in revenue (2018: £20.7m decrease) and an increase of £1.4m in underlying profit (2018: £1.3m decrease).
13
Savills plc Consolidated income statement
for the year ended 31 December 2019
2019 2018
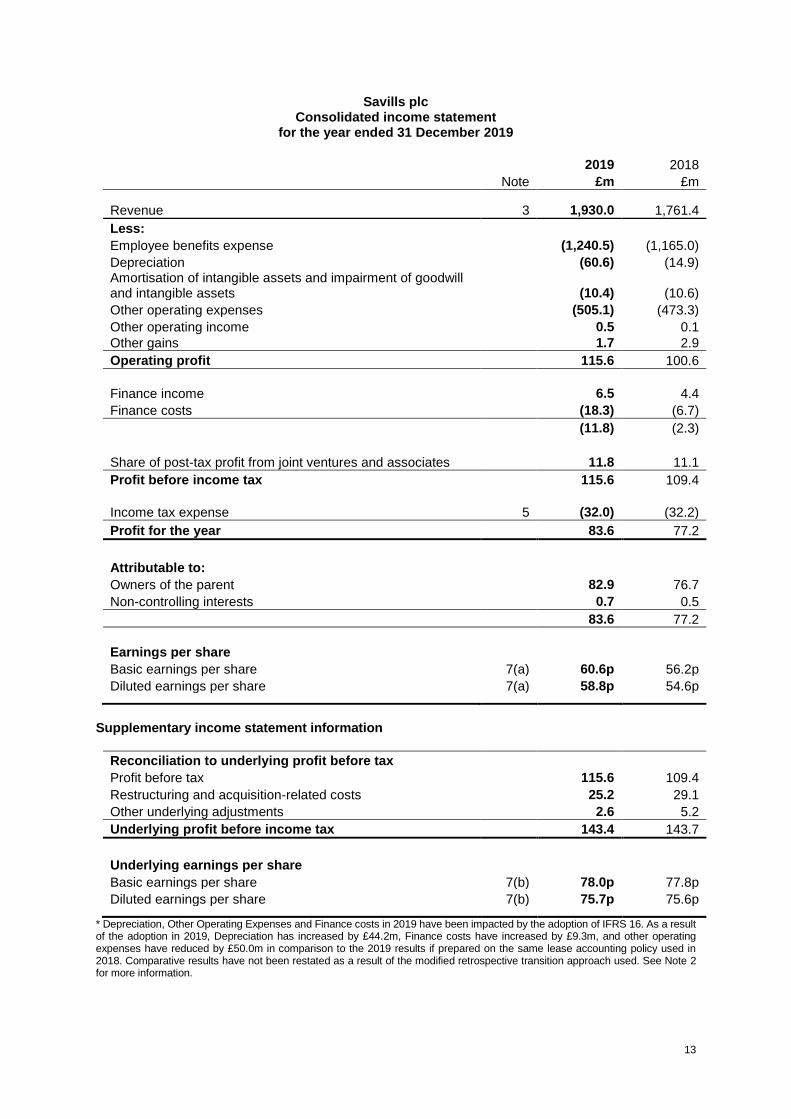
Note £m £m Revenue 3 1,930.0 1,761.4
Less: Employee benefits expense (1,240.5) (1,165.0)
Depreciation (60.6) (14.9) Amortisation of intangible assets and impairment of goodwill and intangible assets (10.4) (10.6)
Other operating expenses (505.1) (473.3)
Other operating income 0.5 0.1
Other gains 1.7 2.9
Operating profit 115.6 100.6
Finance income 6.5 4.4
Finance costs (18.3) (6.7)
(11.8) (2.3)
Share of post-tax profit from joint ventures and associates 11.8 11.1
Profit before income tax 115.6 109.4
Income tax expense 5 (32.0) (32.2)
Profit for the year 83.6 77.2
Attributable to: Owners of the parent 82.9 76.7
Non-controlling interests 0.7 0.5
83.6 77.2
Earnings per share Basic earnings per share 7(a) 60.6p 56.2p
Diluted earnings per share 7(a) 58.8p 54.6p
Supplementary income statement information
Reconciliation to underlying profit before tax
Profit before tax 115.6 109.4
Restructuring and acquisition-related costs 25.2 29.1
Other underlying adjustments 2.6 5.2
Underlying profit before income tax 143.4 143.7
Underlying earnings per share Basic earnings per share 7(b) 78.0p 77.8p
Diluted earnings per share 7(b) 75.7p 75.6p
* Depreciation, Other Operating Expenses and Finance costs in 2019 have been impacted by the adoption of IFRS 16. As a result of the adoption in 2019, Depreciation has increased by £44.2m, Finance costs have increased by £9.3m, and other operating expenses have reduced by £50.0m in comparison to the 2019 results if prepared on the same lease accounting policy used in 2018. Comparative results have not been restated as a result of the modified retrospective transition approach used. See Note 2 for more information.
14
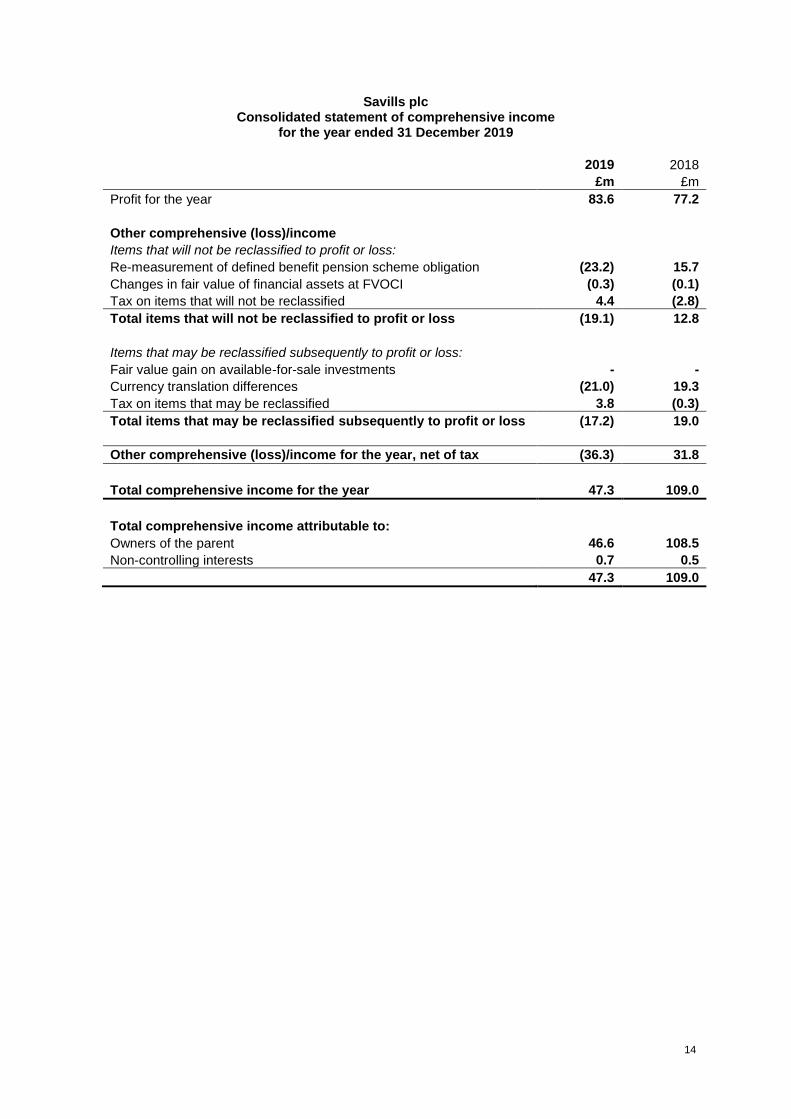
Savills plc Consolidated statement of comprehensive income
for the year ended 31 December 2019
2019 2018
£m £m
Profit for the year 83.6 77.2
Other comprehensive (loss)/income Items that will not be reclassified to profit or loss: Re-measurement of defined benefit pension scheme obligation (23.2) 15.7
Changes in fair value of financial assets at FVOCI (0.3) (0.1)
Tax on items that will not be reclassified 4.4 (2.8)
Total items that will not be reclassified to profit or loss (19.1) 12.8
Items that may be reclassified subsequently to profit or loss: Fair value gain on available-for-sale investments - -
Currency translation differences (21.0) 19.3
Tax on items that may be reclassified 3.8 (0.3)
Total items that may be reclassified subsequently to profit or loss (17.2) 19.0
Other comprehensive (loss)/income for the year, net of tax (36.3) 31.8
Total comprehensive income for the year 47.3 109.0
Total comprehensive income attributable to: Owners of the parent 46.6 108.5
Non-controlling interests 0.7 0.5
47.3 109.0

15
Savills plc Consolidated statement of financial position
at 31 December 2019
2019 2018 Note £m £m
Assets: Non-current assets Property, plant and equipment 68.9 71.5 Right of use assets 226.2 - Goodwill 9 374.2 383.8 Intangible assets 44.5 48.7 Investments in joint ventures and associates 51.4 48.3 Deferred income tax assets 32.7 29.7 Financial assets at fair value through other comprehensive income 32.6 31.2 Retirement benefit surplus - 2.8 Contract assets 1.6 1.3 Other receivables 27.3 19.1
859.4 636.4
Assets: Current assets Contract assets 7.5 7.8 Trade and other receivables 568.9 528.3 Current income tax receivable 3.6 2.7 Derivative financial instruments 0.2 0.1 Cash and cash equivalents 209.9 223.9
790.1 762.8
Liabilities: Current liabilities Borrowings 10 33.4 0.4 Lease liability 45.3 - Derivative financial instruments 0.1 0.1 Contract liabilities 10.8 11.1 Trade and other payables 589.9 629.1 Current income tax liabilities 17.2 11.0 Employee benefit obligations 16.2 15.8 Provisions for other liabilities and charges 10.7 8.4
723.6 675.9
Net current assets/(liabilities) 66.5 86.9 Total assets less current liabilities 925.9 723.3 Liabilities: Non-current liabilities Borrowings 10 148.0 149.6 Lease liability 221.8 - Trade and other payables 17.7 38.2 Retirement and employee benefit obligations 20.5 11.7 Provisions for other liabilities and charges 12.6 12.8 Deferred income tax liabilities 2.1 6.0
422.7 218.3
Net assets 503.2 505.0
Equity Share capital 3.6 3.6 Share premium 97.2 96.6 Other reserves 95.5 117.6 Retained earnings 306.2 286.5
Equity attributable to owners of the parent 502.5 504.3 Non-controlling interests 0.7 0.7
Total equity 503.2 505.0

16
Savills plc Consolidated statement of changes in equity
for the year ended 31 December 2019
Attributable to owners of the parent
Share capital
Share premium
Other reserves
Retained earnings Total
Non-controlling
interests Total
equity £m £m £m £m £m £m £m
Balance at 1 January 2019 3.6 96.6 117.6 286.5 504.3 0.7 505.0
Change in accounting policy (IFRS 16 adoption)
- - - (9.3) (9.3) - (9.3)
Balance at 1 January 2019 (restated) 3.6 96.6 117.6 277.2 495.0 0.7 495.7
Profit for the year - - - 82.9 82.9 0.7 83.6 Other comprehensive income/(loss): Re-measurement of defined benefit pension scheme obligation / retirement benefit surplus
- - - (23.2) (23.2) - (23.2)
Changes in fair value of financial assets at FVOCI
- - (0.3) - (0.3) - (0.3)
Tax on items directly taken to reserves - - - 8.2 8.2 - 8.2
Currency translation differences - - (21.0) - (21.0) - (21.0)
Total comprehensive income for the year - - (21.3) 67.9 46.6 0.7 47.3
Employee share option scheme: - Value of services provided - - - 17.8 17.8 - 17.8
Purchase of treasury shares - - - (14.1) (14.1) - (14.1)
Shares issued - 0.6 - - 0.6 - 0.6 Dividends - - - (42.8) (42.8) (0.5) (43.3)
Disposal of financial assets at FVOCI - - (0.8) 0.8 - - -
Transactions with non-controlling interests - - - (0.6) (0.6) (0.2) (0.8)
Balance at 31 December 2019 3.6 97.2 95.5 306.2 502.5 0.7 503.2

17
Attributable to owners of the parent
Share capital
Share premium
Other reserves
Retained earnings Total
Non-controlling
interests Total
equity £m £m £m £m £m £m £m
Balance at 1 January 2018 3.5 91.1 98.4 247.2 440.2 1.5 441.7
Profit for the year - - - 76.7 76.7 0.5 77.2 Other comprehensive income/(loss): Re-measurement of defined benefit pension scheme obligation / retirement benefit surplus
- - - 15.7 15.7 - 15.7
Changes in fair value of financial assets at FVOCI
- - (0.1) - (0.1) - (0.1)
Tax on items directly taken to reserves - - 0.1 (3.2) (3.1) - (3.1)
Currency translation differences - - 19.3 - 19.3 - 19.3
Total comprehensive income for the year - - 19.3 89.2 108.5 0.5 109.0
Employee share option scheme: - Value of services provided - - - 18.2 18.2 - 18.2
Purchase of treasury shares - - - (25.1) (25.1) - (25.1)
Shares issued 0.1 5.5 - - 5.6 - 5.6 Dividends - - - (41.4) (41.4) (0.2) (41.6)
Disposal of financial assets at FVOCI - - (0.5) 0.6 0.1 - 0.1
Transfer between reserves - - 0.4 (0.4) - - -
Transactions with non-controlling interests (Note 10)
- - - (1.8) (1.8) (1.2) (3.0)
Movement related to business combinations (Note 9)
- - - - - 0.1 0.1
Balance at 31 December 2018 3.6 96.6 117.6 286.5 504.3 0.7 505.0
18
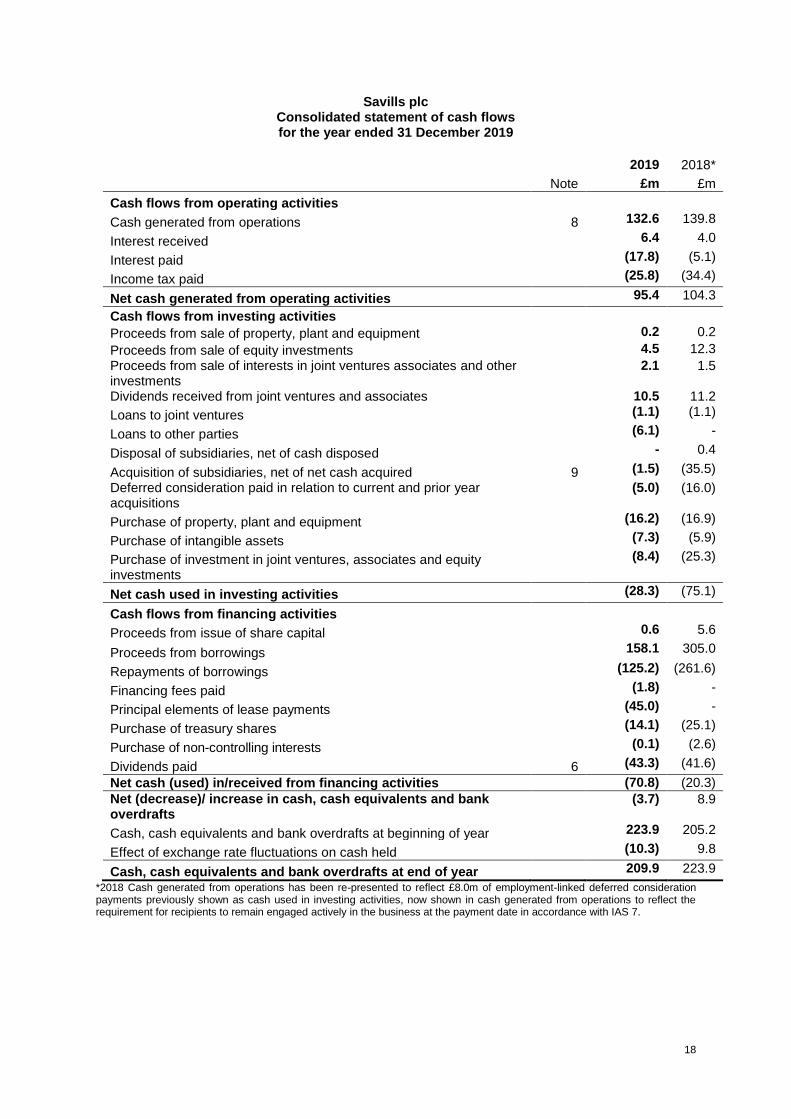
Savills plc Consolidated statement of cash flows for the year ended 31 December 2019
2019 2018*
Note £m £m
Cash flows from operating activities
Cash generated from operations 8 132.6 139.8
Interest received 6.4 4.0
Interest paid (17.8) (5.1)
Income tax paid (25.8) (34.4)
Net cash generated from operating activities 95.4 104.3
Cash flows from investing activities
Proceeds from sale of property, plant and equipment 0.2 0.2
Proceeds from sale of equity investments 4.5 12.3
Proceeds from sale of interests in joint ventures associates and other investments
2.1 1.5
Dividends received from joint ventures and associates 10.5 11.2
Loans to joint ventures (1.1) (1.1)
Loans to other parties (6.1) -
Disposal of subsidiaries, net of cash disposed - 0.4
Acquisition of subsidiaries, net of net cash acquired 9 (1.5) (35.5)
Deferred consideration paid in relation to current and prior year acquisitions
(5.0) (16.0)
Purchase of property, plant and equipment (16.2) (16.9)
Purchase of intangible assets (7.3) (5.9)
Purchase of investment in joint ventures, associates and equity investments
(8.4) (25.3)
Net cash used in investing activities (28.3) (75.1)
Cash flows from financing activities
Proceeds from issue of share capital 0.6 5.6
Proceeds from borrowings 158.1 305.0
Repayments of borrowings (125.2) (261.6)
Financing fees paid (1.8) -
Principal elements of lease payments (45.0) -
Purchase of treasury shares (14.1) (25.1)
Purchase of non-controlling interests (0.1) (2.6)
Dividends paid 6 (43.3) (41.6)
Net cash (used) in/received from financing activities (70.8) (20.3)
Net (decrease)/ increase in cash, cash equivalents and bank overdrafts
(3.7) 8.9
Cash, cash equivalents and bank overdrafts at beginning of year 223.9 205.2
Effect of exchange rate fluctuations on cash held (10.3) 9.8
Cash, cash equivalents and bank overdrafts at end of year 209.9 223.9
*2018 Cash generated from operations has been re-presented to reflect £8.0m of employment-linked deferred consideration payments previously shown as cash used in investing activities, now shown in cash generated from operations to reflect the requirement for recipients to remain engaged actively in the business at the payment date in accordance with IAS 7.
19
NOTES 1. Basis of preparation The results for the year ended 31 December 2019 have been extracted from the audited financial statements. The financial statements have been prepared in accordance with International Financial Reporting Standards (IFRSs) and IFRIC interpretations as adopted by the European Union and with those parts of the Companies Act 2006 applicable to companies reporting under IFRS. The financial statements have been prepared on a going concern basis. The financial information in this statement does not constitute statutory accounts within the meaning of s434 of the Companies Act 2006. The statutory accounts for the year ended 31 December 2019, on which the auditors have given an unqualified audit report, have not yet been filed with the Registrar of Companies. The preparation of financial statements in conformity with IFRS requires the use of estimates and assumptions that affect the reported amounts of assets and liabilities at the date of the financial statements and the reported amounts of revenues and expenses during the reporting period. Although these estimates are based on management's best knowledge of the amount, event or actions, actual results ultimately may differ from those estimates. 2. Adoption of standards, amendments and interpretations to standards Standards, amendments and interpretations endorsed by the EU and mandatorily effective for the first time for the financial year beginning 1 January 2019 are as follows:
IFRS 16, ‘Leases’, replaces IAS 17 that relates to the classification, measurement and recognition of leases with the objective of ensuring that lessees and lessors provide relevant information that represents those transactions. The standard is effective for the group from 1 January 2019. The Group applies the simplified transition approach and will not restate comparative amounts for the year prior to first adoption. Right-of-use assets have been measured on transition either as if the new rules had always been applied or at the amount of the lease liability on adoption (adjusted for any prepaid or accrued lease expenses and onerous lease provisions where applicable).
The Group’s activities as a lessor are not material and hence there is no significant impact on the financial statements with respect to sub-leasing activities.
On adoption of IFRS 16, the group recognised lease liabilities in relation to leases which had previously been classified as ‘operating leases’ under the principles of IAS 17 Leases. These liabilities were measured at the present value of the remaining lease payments, discounted using the lessee’s incremental borrowing rate as of 1 January 2019. The weighted average lessee’s incremental borrowing rate applied to the lease liabilities on 1 January 2019 was 3.36%. For leases previously classified as finance leases, the group recognised the carrying amount of the lease asset and lease liability immediately before transition as the carrying amount of the right of use asset and the lease liability at the date of initial application. The measurement principles of IFRS 16 are only applied after that date. Practical expedients applied In applying IFRS 16 for the first time, the Group has used the following practical expedients permitted by the standard:
applying a single discount rate to a portfolio of leases with reasonably similar characteristics for example leases of similar assets, in the same geographic area with consistent length of lease term
relying on previous assessments on whether leases are onerous as an alternative to performing an impairment review
accounting for operating leases with a remaining lease term of less than 12 months as at 1 January 2019 as short-term leases
20
excluding initial direct costs for the measurement of the right-of-use asset at the date of initial application, and
using hindsight in determining the lease term where the contract contains options to extend or terminate the lease.
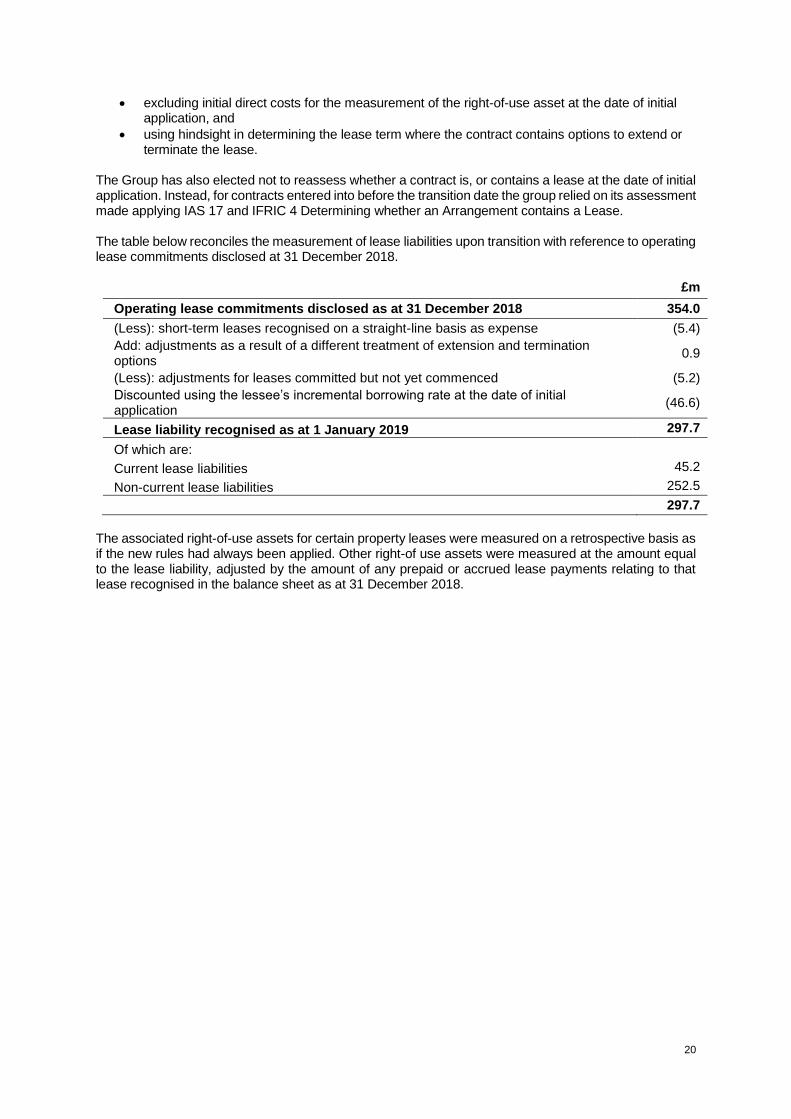
The Group has also elected not to reassess whether a contract is, or contains a lease at the date of initial application. Instead, for contracts entered into before the transition date the group relied on its assessment made applying IAS 17 and IFRIC 4 Determining whether an Arrangement contains a Lease. The table below reconciles the measurement of lease liabilities upon transition with reference to operating lease commitments disclosed at 31 December 2018.
£m
Operating lease commitments disclosed as at 31 December 2018 354.0
(Less): short-term leases recognised on a straight-line basis as expense (5.4)
Add: adjustments as a result of a different treatment of extension and termination options
0.9
(Less): adjustments for leases committed but not yet commenced (5.2)
Discounted using the lessee’s incremental borrowing rate at the date of initial application
(46.6)
Lease liability recognised as at 1 January 2019 297.7
Of which are:
Current lease liabilities 45.2
Non-current lease liabilities 252.5
297.7
The associated right-of-use assets for certain property leases were measured on a retrospective basis as if the new rules had always been applied. Other right-of use assets were measured at the amount equal to the lease liability, adjusted by the amount of any prepaid or accrued lease payments relating to that lease recognised in the balance sheet as at 31 December 2018.
21
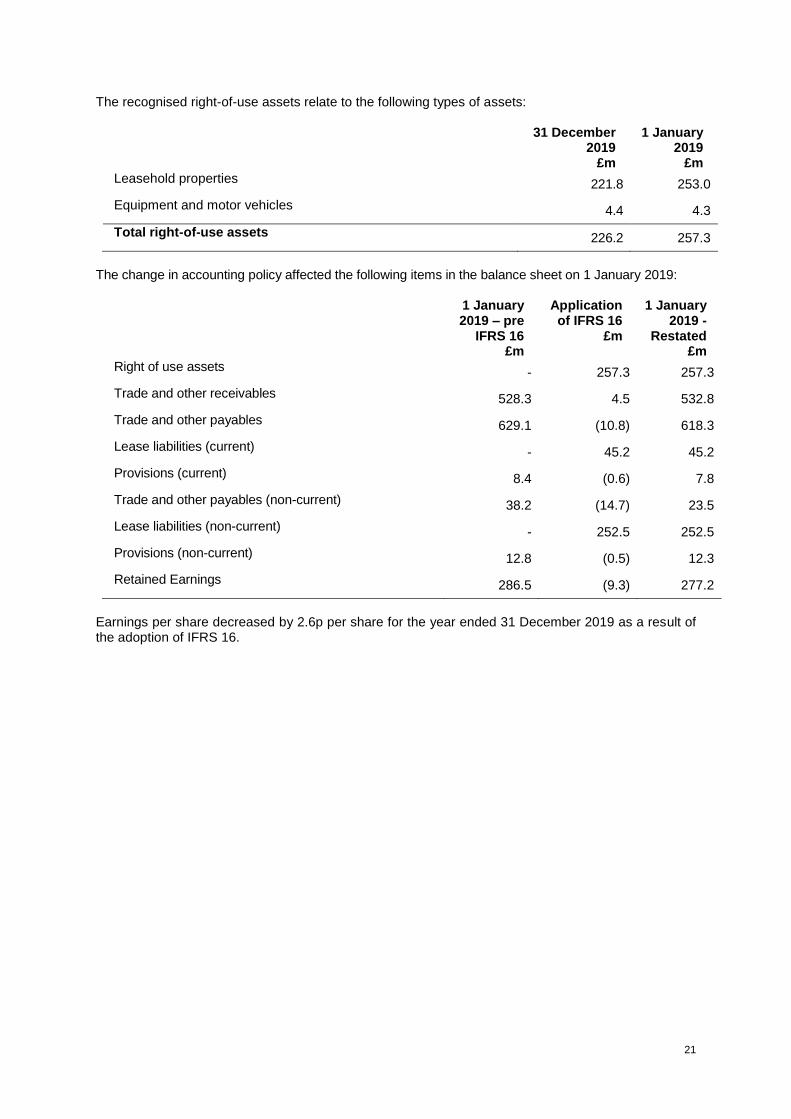
The recognised right-of-use assets relate to the following types of assets:
31 December 2019
£m
1 January 2019
£m
Leasehold properties 221.8 253.0
Equipment and motor vehicles 4.4 4.3
Total right-of-use assets 226.2 257.3
The change in accounting policy affected the following items in the balance sheet on 1 January 2019:
1 January 2019 – pre
IFRS 16 £m
Application of IFRS 16
£m
1 January 2019 -
Restated £m
Right of use assets - 257.3 257.3
Trade and other receivables 528.3 4.5 532.8
Trade and other payables 629.1 (10.8) 618.3
Lease liabilities (current) - 45.2 45.2
Provisions (current) 8.4 (0.6) 7.8
Trade and other payables (non-current) 38.2 (14.7) 23.5
Lease liabilities (non-current) - 252.5 252.5
Provisions (non-current) 12.8 (0.5) 12.3
Retained Earnings 286.5 (9.3) 277.2
Earnings per share decreased by 2.6p per share for the year ended 31 December 2019 as a result of the adoption of IFRS 16.

22
3. Segment analysis
Transaction Advisory Consultancy
Property and Facilities
Management Investment
Management Other Total Year ended to 31 December 2019 £m £m £m £m £m £m
Revenue United Kingdom - commercial 94.2 180.3 190.1 33.2 - 497.8
- residential 139.1 49.6 41.0 - - 229.7
Total United Kingdom 233.3 229.9 231.1 33.2 - 727.5
Europe & the Middle East 127.5 38.6 80.9 35.4 - 282.4
Asia Pacific
- commercial 138.6 69.6 372.5 10.6 - 591.3
- residential 35.8 - - - - 35.8
Total Asia Pacific 174.4 69.6 372.5 10.6 - 627.1
North America 293.0 - - - - 293.0
Revenue 828.2 338.1 684.5 79.2 - 1,930.0
Underlying profit/(loss) before tax
United Kingdom
- commercial 12.3 19.4 12.1 9.0 (14.2) 38.6
- residential 17.8 7.6 3.7 - - 29.1
Total United Kingdom 30.1 27.0 15.8 9.0 (14.2) 67.7
Europe & the Middle East 5.4 2.9 0.2 7.3 - 15.8
Asia Pacific
- commercial 12.4 4.6 19.2 1.8 - 38.0
- residential 4.6 - - - - 4.6
Total Asia Pacific 17.0 4.6 19.2 1.8 - 42.6
North America 17.3 - - - - 17.3
Underlying profit/(loss) before tax 69.8 34.5 35.2 18.1 (14.2) 143.4

23
Transaction Advisory Consultancy
Property and
Facilities Management
Investment Management Other Total
Year ended to 31 December 2018 £m £m £m £m £m £m
Revenue United Kingdom - commercial 98.4 171.5 157.1 25.7 - 452.7
- residential 131.5 44.4 33.8 - - 209.7
Total United Kingdom 229.9 215.9 190.9 25.7 - 662.4
Europe & the Middle East 113.1 33.4 68.9 31.6 - 247.0
Asia Pacific
- commercial 160.1 45.1 327.0 9.4 - 541.6
- residential 45.9 - - - - 45.9
Total Asia Pacific 206.0 45.1 327.0 9.4 - 587.5
North America 264.5 - - - - 264.5
Revenue 813.5 294.4 586.8 66.7 - 1,761.4
Underlying profit/(loss) before tax
United Kingdom
- commercial 15.7 19.0 10.2 4.7 (13.7) 35.9
- residential 17.6 6.8 2.8 - - 27.2
Total United Kingdom 33.3 25.8 13.0 4.7 (13.7) 63.1
Europe & the Middle East 5.5 3.0 - 4.4 - 12.9
Asia Pacific
- commercial 21.2 4.3 19.2 1.9 - 46.6
- residential 8.3 - - - - 8.3
Total Asia Pacific 29.5 4.3 19.2 1.9 - 54.9
North America 12.8 - - - - 12.8
Underlying profit/(loss) before tax
81.1 33.1 32.2 11.0 (13.7) 143.7
Operating segments reflect internal management reporting to the Group's chief operating decision maker, defined as the Group Executive Board (GEB). The GEB assesses the performance of operating segments based on a measure of underlying profit before tax which adjusts statutory profit before tax by profit/(loss) on disposals, share-based payment adjustment, significant restructuring costs, acquisition-related costs, amortisation of acquired intangible assets (excluding software) and impairments. The Other segment includes costs and other expenses at holding company and subsidiary levels, which are not directly attributable to the operating activities of the Group's business segments. A reconciliation of underlying profit before tax to statutory profit before tax is provided in Note 4.
24
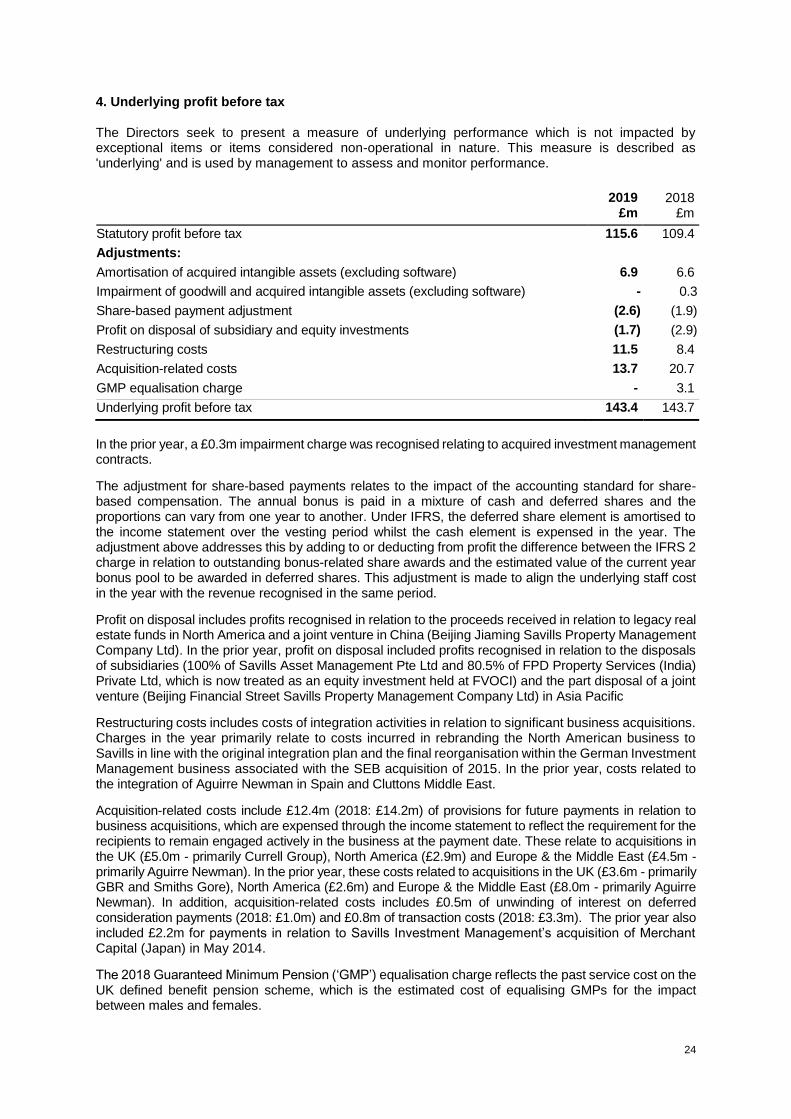
4. Underlying profit before tax The Directors seek to present a measure of underlying performance which is not impacted by exceptional items or items considered non-operational in nature. This measure is described as 'underlying' and is used by management to assess and monitor performance.
2019
£m 2018
£m
Statutory profit before tax 115.6 109.4
Adjustments:
Amortisation of acquired intangible assets (excluding software) 6.9 6.6
Impairment of goodwill and acquired intangible assets (excluding software) - 0.3
Share-based payment adjustment (2.6) (1.9)
Profit on disposal of subsidiary and equity investments (1.7) (2.9)
Restructuring costs 11.5 8.4
Acquisition-related costs 13.7 20.7
GMP equalisation charge - 3.1
Underlying profit before tax 143.4 143.7
In the prior year, a £0.3m impairment charge was recognised relating to acquired investment management contracts.
The adjustment for share-based payments relates to the impact of the accounting standard for share-based compensation. The annual bonus is paid in a mixture of cash and deferred shares and the proportions can vary from one year to another. Under IFRS, the deferred share element is amortised to the income statement over the vesting period whilst the cash element is expensed in the year. The adjustment above addresses this by adding to or deducting from profit the difference between the IFRS 2 charge in relation to outstanding bonus-related share awards and the estimated value of the current year bonus pool to be awarded in deferred shares. This adjustment is made to align the underlying staff cost in the year with the revenue recognised in the same period.
Profit on disposal includes profits recognised in relation to the proceeds received in relation to legacy real estate funds in North America and a joint venture in China (Beijing Jiaming Savills Property Management Company Ltd). In the prior year, profit on disposal included profits recognised in relation to the disposals of subsidiaries (100% of Savills Asset Management Pte Ltd and 80.5% of FPD Property Services (India) Private Ltd, which is now treated as an equity investment held at FVOCI) and the part disposal of a joint venture (Beijing Financial Street Savills Property Management Company Ltd) in Asia Pacific
Restructuring costs includes costs of integration activities in relation to significant business acquisitions. Charges in the year primarily relate to costs incurred in rebranding the North American business to Savills in line with the original integration plan and the final reorganisation within the German Investment Management business associated with the SEB acquisition of 2015. In the prior year, costs related to the integration of Aguirre Newman in Spain and Cluttons Middle East.
Acquisition-related costs include £12.4m (2018: £14.2m) of provisions for future payments in relation to business acquisitions, which are expensed through the income statement to reflect the requirement for the recipients to remain engaged actively in the business at the payment date. These relate to acquisitions in the UK (£5.0m - primarily Currell Group), North America (£2.9m) and Europe & the Middle East (£4.5m - primarily Aguirre Newman). In the prior year, these costs related to acquisitions in the UK (£3.6m - primarily GBR and Smiths Gore), North America (£2.6m) and Europe & the Middle East (£8.0m - primarily Aguirre Newman). In addition, acquisition-related costs includes £0.5m of unwinding of interest on deferred consideration payments (2018: £1.0m) and £0.8m of transaction costs (2018: £3.3m). The prior year also included £2.2m for payments in relation to Savills Investment Management’s acquisition of Merchant Capital (Japan) in May 2014.
The 2018 Guaranteed Minimum Pension (‘GMP’) equalisation charge reflects the past service cost on the UK defined benefit pension scheme, which is the estimated cost of equalising GMPs for the impact between males and females.
25
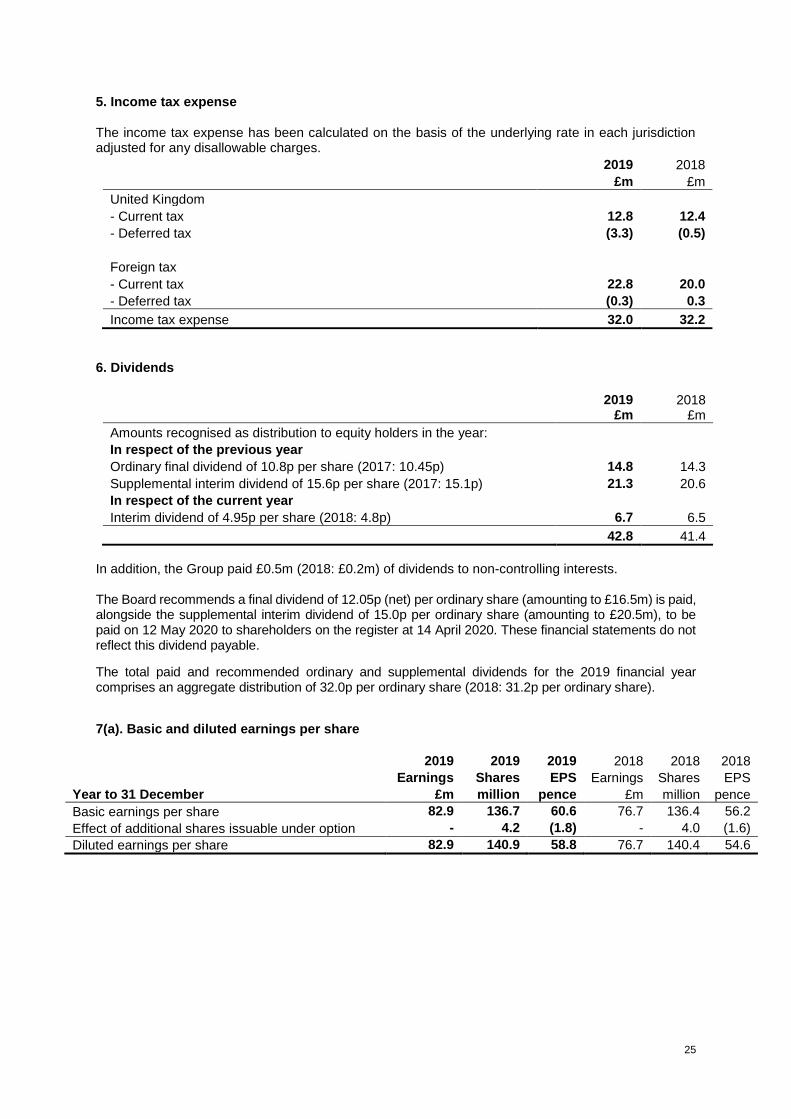
5. Income tax expense The income tax expense has been calculated on the basis of the underlying rate in each jurisdiction adjusted for any disallowable charges.
2019 2018
£m £m
United Kingdom - Current tax 12.8 12.4
- Deferred tax (3.3) (0.5)
Foreign tax - Current tax 22.8 20.0
- Deferred tax (0.3) 0.3
Income tax expense 32.0 32.2
6. Dividends
2019 2018 £m £m
Amounts recognised as distribution to equity holders in the year: In respect of the previous year
Ordinary final dividend of 10.8p per share (2017: 10.45p) 14.8 14.3
Supplemental interim dividend of 15.6p per share (2017: 15.1p) 21.3 20.6
In respect of the current year
Interim dividend of 4.95p per share (2018: 4.8p) 6.7 6.5
42.8 41.4
In addition, the Group paid £0.5m (2018: £0.2m) of dividends to non-controlling interests. The Board recommends a final dividend of 12.05p (net) per ordinary share (amounting to £16.5m) is paid, alongside the supplemental interim dividend of 15.0p per ordinary share (amounting to £20.5m), to be paid on 12 May 2020 to shareholders on the register at 14 April 2020. These financial statements do not reflect this dividend payable.
The total paid and recommended ordinary and supplemental dividends for the 2019 financial year comprises an aggregate distribution of 32.0p per ordinary share (2018: 31.2p per ordinary share).
7(a). Basic and diluted earnings per share
2019 2019 2019 2018 2018 2018
Earnings Shares EPS Earnings Shares EPS
Year to 31 December £m million pence £m million pence
Basic earnings per share 82.9 136.7 60.6 76.7 136.4 56.2
Effect of additional shares issuable under option - 4.2 (1.8) - 4.0 (1.6)
Diluted earnings per share 82.9 140.9 58.8 76.7 140.4 54.6
26
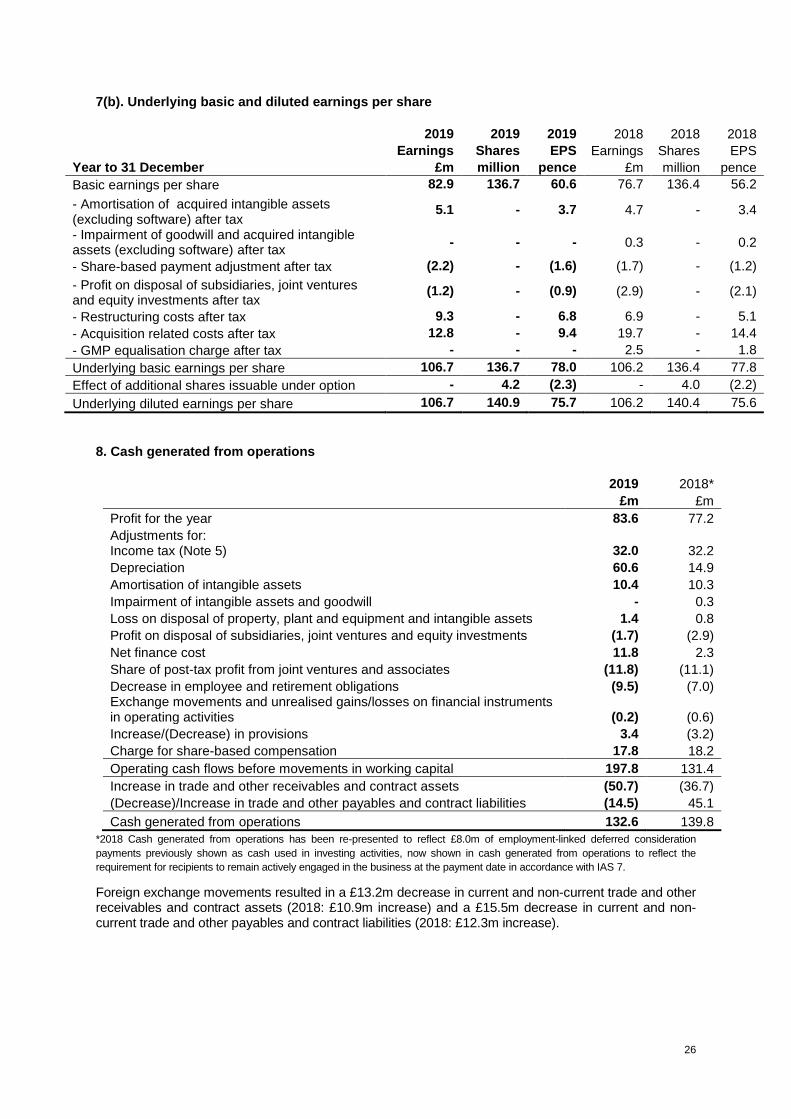
7(b). Underlying basic and diluted earnings per share
2019 2019 2019 2018 2018 2018
Earnings Shares EPS Earnings Shares EPS
Year to 31 December £m million pence £m million pence
Basic earnings per share 82.9 136.7 60.6 76.7 136.4 56.2
- Amortisation of acquired intangible assets (excluding software) after tax
5.1 - 3.7 4.7 - 3.4
- Impairment of goodwill and acquired intangible assets (excluding software) after tax
- - - 0.3 - 0.2
- Share-based payment adjustment after tax (2.2) - (1.6) (1.7) - (1.2)
- Profit on disposal of subsidiaries, joint ventures and equity investments after tax
(1.2) - (0.9) (2.9) - (2.1)
- Restructuring costs after tax 9.3 - 6.8 6.9 - 5.1
- Acquisition related costs after tax 12.8 - 9.4 19.7 - 14.4
- GMP equalisation charge after tax - - - 2.5 - 1.8
Underlying basic earnings per share 106.7 136.7 78.0 106.2 136.4 77.8
Effect of additional shares issuable under option - 4.2 (2.3) - 4.0 (2.2)
Underlying diluted earnings per share 106.7 140.9 75.7 106.2 140.4 75.6
8. Cash generated from operations
2019 2018*
£m £m
Profit for the year 83.6 77.2
Adjustments for: Income tax (Note 5) 32.0 32.2
Depreciation 60.6 14.9
Amortisation of intangible assets 10.4 10.3
Impairment of intangible assets and goodwill - 0.3
Loss on disposal of property, plant and equipment and intangible assets 1.4 0.8
Profit on disposal of subsidiaries, joint ventures and equity investments (1.7) (2.9)
Net finance cost 11.8 2.3
Share of post-tax profit from joint ventures and associates (11.8) (11.1)
Decrease in employee and retirement obligations (9.5) (7.0) Exchange movements and unrealised gains/losses on financial instruments in operating activities (0.2) (0.6)
Increase/(Decrease) in provisions 3.4 (3.2)
Charge for share-based compensation 17.8 18.2
Operating cash flows before movements in working capital 197.8 131.4
Increase in trade and other receivables and contract assets (50.7) (36.7)
(Decrease)/Increase in trade and other payables and contract liabilities (14.5) 45.1
Cash generated from operations 132.6 139.8
*2018 Cash generated from operations has been re-presented to reflect £8.0m of employment-linked deferred consideration
payments previously shown as cash used in investing activities, now shown in cash generated from operations to reflect the
requirement for recipients to remain actively engaged in the business at the payment date in accordance with IAS 7.
Foreign exchange movements resulted in a £13.2m decrease in current and non-current trade and other receivables and contract assets (2018: £10.9m increase) and a £15.5m decrease in current and non-current trade and other payables and contract liabilities (2018: £12.3m increase).

27
9. Acquisition of subsidiaries On 3 June 2019, the Group acquired the trade and assets of KKS Strategy LLP, a London-based workplace consultancy and design studio. Total acquisition consideration is provisionally determined at £1.5m, all of which was settled on completion. A further £1.6m is payable over instalments in June 2020, 2021 and 2022 and is deemed to be linked to continued active engagement within the business. As required by IFRS 3 (revised), these payments will be expensed to the income statement over the relevant period of engagement. The fair value exercise is in progress and goodwill of £1.5m has been provisionally determined being equal to the cash consideration paid upon completion. No other assets were identified as part of the fair value exercise undertaken. 2018 Acquisitions In the year ended 31 December 2018 the Group acquired Cluttons Middle East and the Currell Group along with the third party property management portfolio of Broadgate Estates Limited. There were no updates to the provisional fair values in respect of these acquisitions as reported in the Group’s 2018 Annual Report. 10. Borrowings Movements in borrowings are analysed as follows:
£m
Opening amount as at 1 January 2019 150.0
Additional borrowings 158.1
Repayments of borrowings (including overdraft movement) (125.2)
Non-cash movement (1.5)
Closing amount as at 31 December 2019 181.4
2019 2018
£m £m
Current
Bank overdrafts 0.1 -
Unsecured bank loans 33.3 0.4
33.4 0.4
Non-current
Loan notes 150.0 150.0
Transaction costs (RCF arrangement fees and issuance of loan notes) (2.0) (0.5)
Finance leases - 0.1
148.0 149.6
181.4 150.0
In June 2019 the Group amended and extended its existing £360m multi-currency revolving credit facility (‘RCF’) to include a £90m accordion facility and extend the expiry date from December 2020 to June 2024. As at 31 December 2019 £32.5m (2018: £nil) of the RCF was drawn. In June 2018, the Group raised £150.0m of long term debt through the issuance of 7, 10 and 12 year fixed rate private note placements into the US institutional market. The remaining unsecured bank loans due within one year or on demand reflects a £0.8m working capital loan in Thailand, which is payable on demand, denominated in Thailand baht and has an effective interest rate of 4.55%.
28
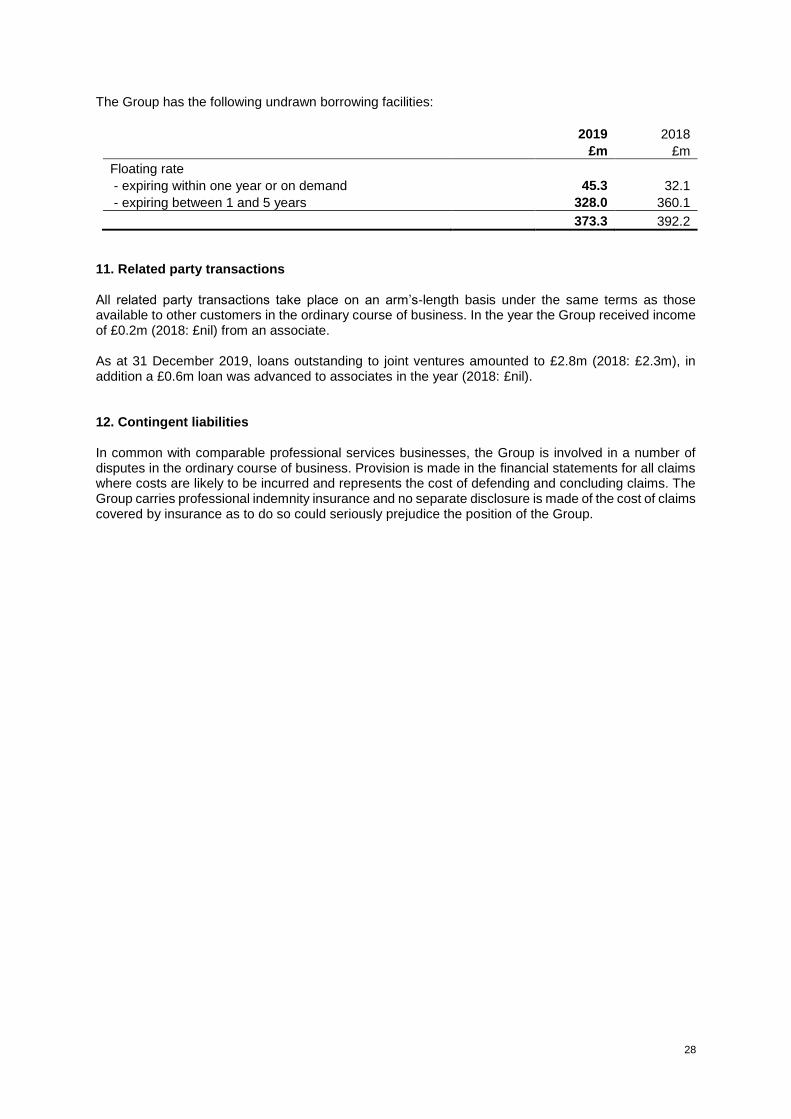
The Group has the following undrawn borrowing facilities:
2019 2018
£m £m
Floating rate
- expiring within one year or on demand 45.3 32.1
- expiring between 1 and 5 years 328.0 360.1
373.3 392.2
11. Related party transactions All related party transactions take place on an arm’s-length basis under the same terms as those available to other customers in the ordinary course of business. In the year the Group received income of £0.2m (2018: £nil) from an associate. As at 31 December 2019, loans outstanding to joint ventures amounted to £2.8m (2018: £2.3m), in addition a £0.6m loan was advanced to associates in the year (2018: £nil). 12. Contingent liabilities In common with comparable professional services businesses, the Group is involved in a number of disputes in the ordinary course of business. Provision is made in the financial statements for all claims where costs are likely to be incurred and represents the cost of defending and concluding claims. The Group carries professional indemnity insurance and no separate disclosure is made of the cost of claims covered by insurance as to do so could seriously prejudice the position of the Group.

29
Directors' responsibility statement The Savills Report and Accounts for year end 31 December 2019 contains a responsibility statement in the following form: Each of the Directors confirm that, to the best of their knowledge:
the Group financial statements, which have been prepared in accordance with IFRSs as adopted by the European Union, give a true and fair view of the assets, liabilities, financial position and profit of the Group; and
the Directors’ Report includes a fair review of the development and performance of the business and the position of the Group, together with a description of the principal risks and uncertainties that is faces.
In the case of each Director in office at the date the Directors’ Report is approved:
so far as the Director is aware, there is no relevant audit information of which the Group’s auditors are unaware; and
they have taken all the steps that they ought to have taken as a Director in order to make themselves aware of any relevant audit information and to establish that the Group’s auditors are aware of that information.
On behalf of the Board Mark Ridley Group Chief Executive Chris Lee Group Legal Director and Company Secretary 12 March 2020 Forward-looking statements The financial information contained in this announcement has not been audited. Certain statements made in this announcement are forward-looking statements and are therefore subject to risks, assumptions and uncertainties that could cause actual results to differ materially from those expressed or implied because they relate to future events. These forward-looking statements include, but are not limited to, statements relating to the Company’s expectations. Copies of the Annual Report and Accounts for the year ended 31 December 2019 will be circulated to shareholders on 30 March 2020 and will also be available from the investor relations section of the Company website at www.ir.savills.com or from: Savills plc, 33 Margaret Street, London, W1G 0JD Telephone: 020 7499 8644 END