savills studley report new york city office sector q2 2017€¦ · · 2017-07-31given the ample...
TRANSCRIPT

"The time line on completing a lease in much of Manhattan continues to lengthen. Given the ample availability of quality space options many tenants have to consider, they are in no rush to commit to a lease. The irony is that firms are starting their space searches much earlier than they have in prior cycles."
John Johnson, Senior Managing Director
Savills Studley Report New York City office sector Q2 2017
Savills Studley Research New York City
SUMMARYMarket HighlightsAVAILABILITY FALLS IN MIDTOWN SOUTH
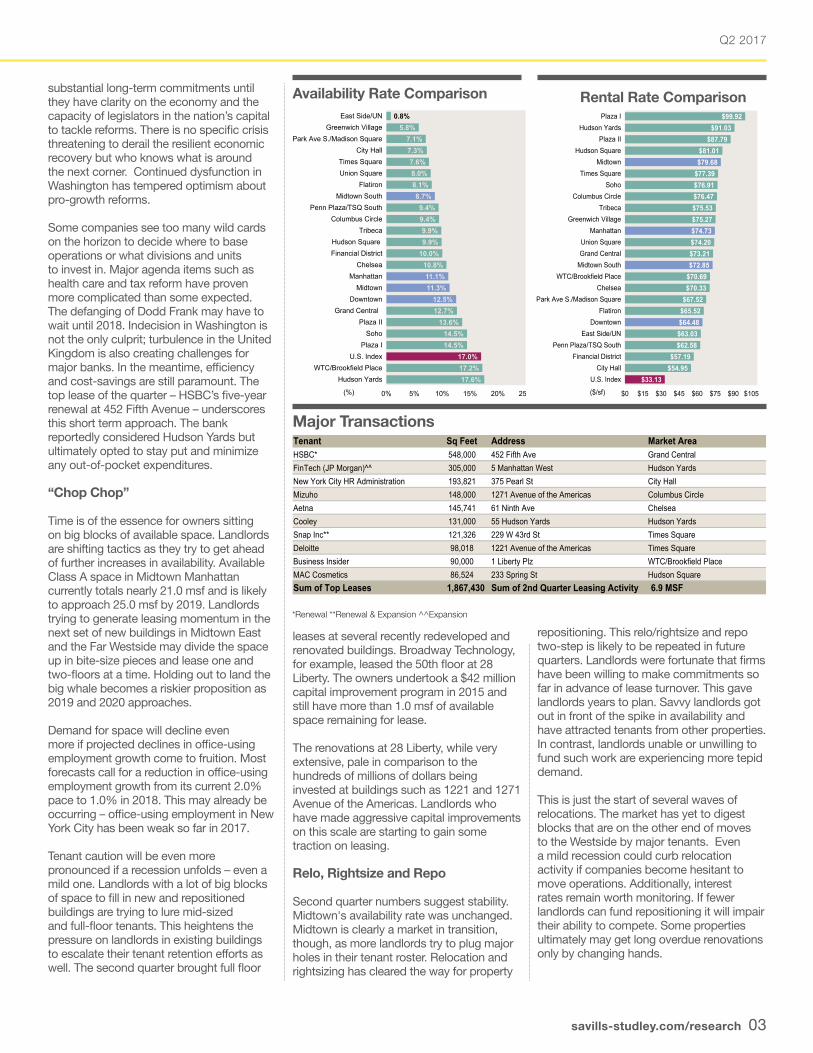
Midtown South's overall availability rate dropped by 100 basis points to 8.7% as several larger leases were signed. In contrast, Downtown’s Class A sector continued to push higher, jumping by 70 basis points to 17.3% - its highest mark in two years. Midtown's Class A rate inched up by 10 basis points to 12.4%.
RENT FALLS
Overall asking rent dipped by 0.7% to $74.73 -- due primarily to the lease-up of prime space in Midtown South, which posted a 3.1% decline to $72.85. Asking
rent was unchanged in Midtown, and fell by 0.7% to $64.48 Downtown.
LEASING ACTIVITY RETREATS
Leasing activity took a big step back in the second quarter, falling from 8.3 msf to 6.9 msf and well below the long-term quarterly average of 7.6 msf.
The movement to the Far Westside continued as JPMorgan Chase and Cooley both inked significant leases. Banks dominated leasing with transactions by HSBC (548,000 sf at 452 Fifth Ave) and Mizuho (148,000 sf at 1271 Ave of the Americas). Aetna also announced a 145,741 sf lease at 61 Ninth Avenue.
02
Savills Studley Report | New York City
Waiting Game
A single quarter does not a trend make – hopes that the first-quarter burst of leasing would persist were short-lived – deal volume fell from 8.3 msf to 6.9 msf in the second quarter. The decline was expected. Demand has been running about 15.0% below the market’s long-term pace since year-end 2014. Hudson Yards once again captured several significant transactions, and tenants remained active in Midtown South, but other than these bright spots, leasing lacked luster.
It will take another quarter, at least, to see which way the market turns. That may in fact be what tenants are doing as well. Firms are starting their search very early – sometimes two to three years before their lease expires, but most feel little urgency to commit to a deal.
Scant Value-Plays Available
It is getting increasingly difficult to negotiate and complete a lease in a single quarter as a bit of a waiting game is unfolding. The time line is being drawn out in part because tenants are resetting their rent expectations as they conduct their space search, they also are experiencing a bit of sticker shock. Rent at the top of the market has declined, some space priced in the $150/sf range has come down below $140/sf. There are very few value-plays remaining, though. During the two previous cycles there was a fair amount of space priced under $40/sf, this is no longer the case. Other than heavily incentivized space in New Jersey, there is little quality sub-$50/sf space. Even Brooklyn and Queens are not that inexpensive.
Base rent is not budging much, but concessions continue to expand. Tenants are negotiating very generous improvement allowances and rent abatements. A few of the largest companies are securing expansion and contraction options and some of the firms who leased space at the top of the last cycle are discussing rent relief. Landlords are stretching to keep tenants in place. Early renewals and blend and extend transactions are becoming more prevalent. Other landlords, rather than waiting to test how serious their tenant is about leaving, are agreeing to restructure leases.
Tenants Shortening Time Horizon
Uncertainty is also weighing on many tenants. Some firms are reluctant to make
Source: Bureau of Labor Statistics
2008
2009
2010
2011
2012
2013
2014
2015
2016
2017
-9.0%
-7.0%
-5.0%
-3.0%
-1.0%
1.0%
3.0%
5.0%
0.00
0.20
0.40
0.60
0.80
1.00
1.20
1.40
1.60Millions
NYC Off. Emp. NYC (% Annual Change) U.S.(% Annual Change)
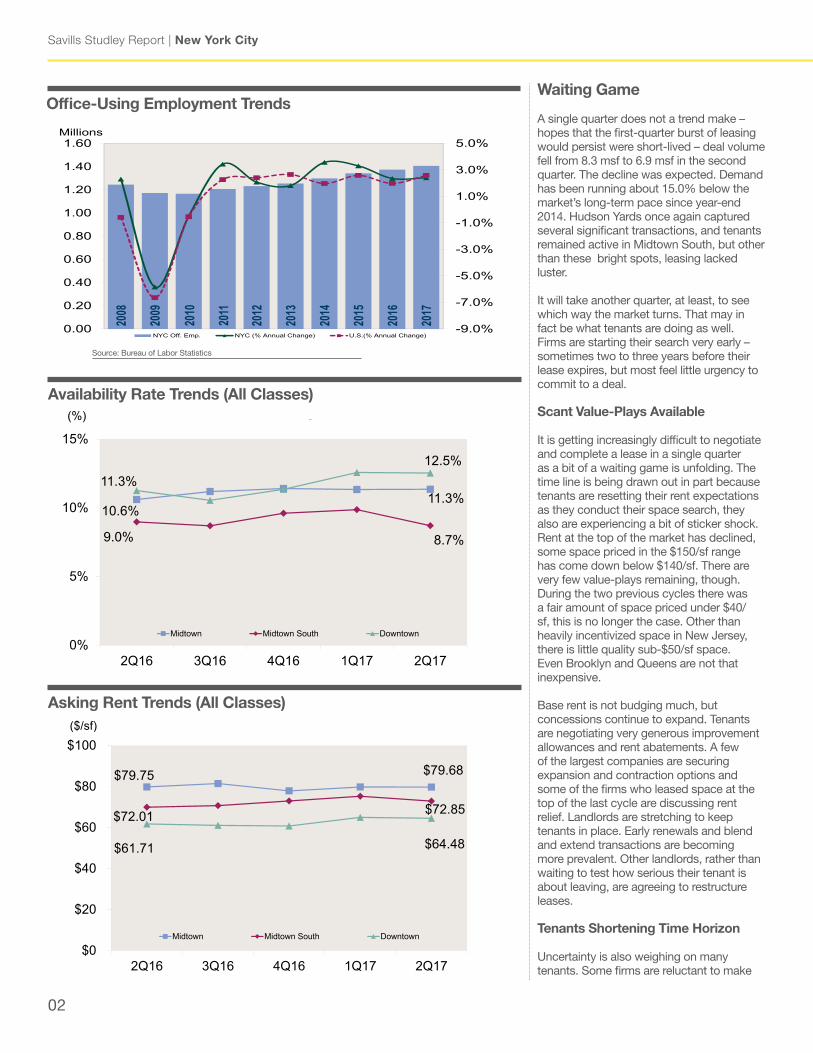
Office-Using Employment Trends
$79.68$79.75
$72.85$72.01
$64.48$61.71
$0
$20
$40
$60
$80
$100
2Q171Q174Q163Q162Q16
Overall Rental Rate Trends
Midtown Midtown South Downtown
($/sf)
Asking Rent Trends (All Classes)
11.3%10.6%
8.7%9.0%
12.5%11.3%
0%
5%
10%
15%
2Q171Q174Q163Q162Q16
(%) Overall Availability Rate Trends
Midtown Midtown South Downtown
Availability Rate Trends (All Classes)
savills-studley.com/research 03
Q2 2017
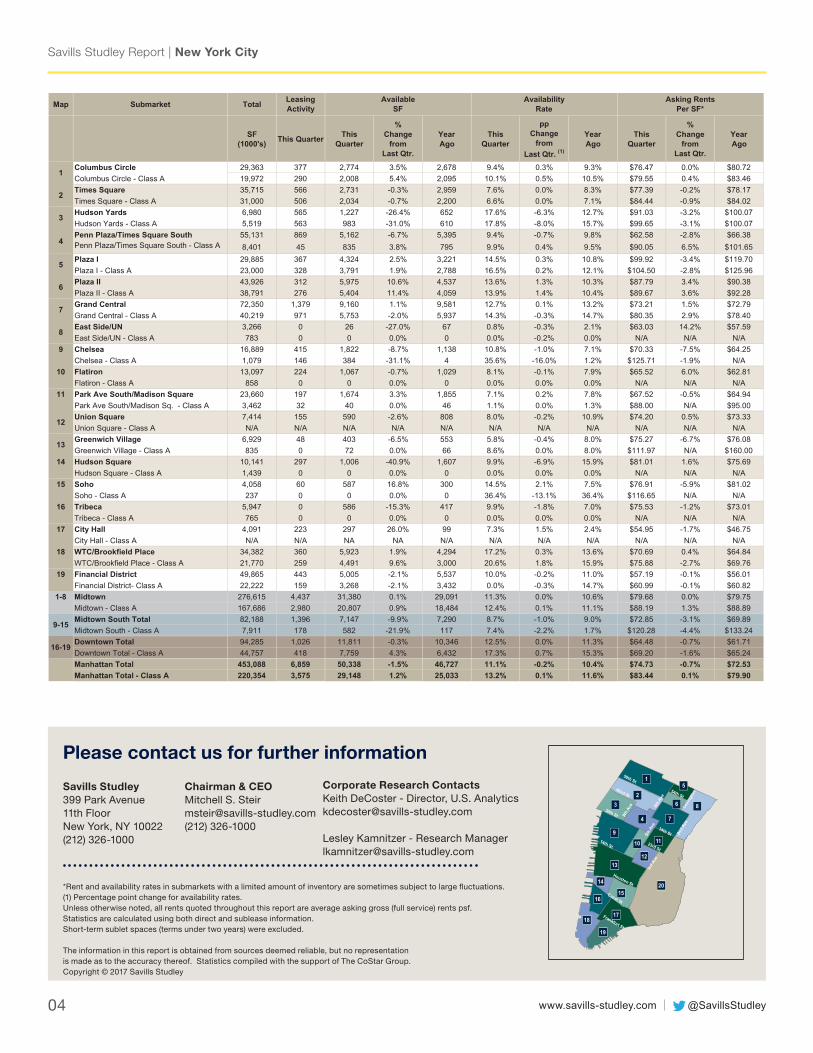
Tenant Sq Feet Address Market AreaHSBC* 548,000 452 Fifth Ave Grand CentralFinTech (JP Morgan)^^ 305,000 5 Manhattan West Hudson YardsNew York City HR Administration 193,821 375 Pearl St City HallMizuho 148,000 1271 Avenue of the Americas Columbus CircleAetna 145,741 61 Ninth Ave ChelseaCooley 131,000 55 Hudson Yards Hudson YardsSnap Inc** 121,326 229 W 43rd St Times SquareDeloitte 98,018 1221 Avenue of the Americas Times SquareBusiness Insider 90,000 1 Liberty Plz WTC/Brookfield PlaceMAC Cosmetics 86,524 233 Spring St Hudson SquareSum of Top Leases 1,867,430 Sum of 2nd Quarter Leasing Activity 6.9 MSF
substantial long-term commitments until they have clarity on the economy and the capacity of legislators in the nation’s capital to tackle reforms. There is no specific crisis threatening to derail the resilient economic recovery but who knows what is around the next corner. Continued dysfunction in Washington has tempered optimism about pro-growth reforms.
Some companies see too many wild cards on the horizon to decide where to base operations or what divisions and units to invest in. Major agenda items such as health care and tax reform have proven more complicated than some expected. The defanging of Dodd Frank may have to wait until 2018. Indecision in Washington is not the only culprit; turbulence in the United Kingdom is also creating challenges for major banks. In the meantime, efficiency and cost-savings are still paramount. The top lease of the quarter – HSBC’s five-year renewal at 452 Fifth Avenue – underscores this short term approach. The bank reportedly considered Hudson Yards but ultimately opted to stay put and minimize any out-of-pocket expenditures.
“Chop Chop”
Time is of the essence for owners sitting on big blocks of available space. Landlords are shifting tactics as they try to get ahead of further increases in availability. Available Class A space in Midtown Manhattan currently totals nearly 21.0 msf and is likely to approach 25.0 msf by 2019. Landlords trying to generate leasing momentum in the next set of new buildings in Midtown East and the Far Westside may divide the space up in bite-size pieces and lease one and two-floors at a time. Holding out to land the big whale becomes a riskier proposition as 2019 and 2020 approaches.
Demand for space will decline even more if projected declines in office-using employment growth come to fruition. Most forecasts call for a reduction in office-using employment growth from its current 2.0% pace to 1.0% in 2018. This may already be occurring – office-using employment in New York City has been weak so far in 2017.
Tenant caution will be even more pronounced if a recession unfolds – even a mild one. Landlords with a lot of big blocks of space to fill in new and repositioned buildings are trying to lure mid-sized and full-floor tenants. This heightens the pressure on landlords in existing buildings to escalate their tenant retention efforts as well. The second quarter brought full floor
leases at several recently redeveloped and renovated buildings. Broadway Technology, for example, leased the 50th floor at 28 Liberty. The owners undertook a $42 million capital improvement program in 2015 and still have more than 1.0 msf of available space remaining for lease.
The renovations at 28 Liberty, while very extensive, pale in comparison to the hundreds of millions of dollars being invested at buildings such as 1221 and 1271 Avenue of the Americas. Landlords who have made aggressive capital improvements on this scale are starting to gain some traction on leasing.
Relo, Rightsize and Repo
Second quarter numbers suggest stability. Midtown's availability rate was unchanged. Midtown is clearly a market in transition, though, as more landlords try to plug major holes in their tenant roster. Relocation and rightsizing has cleared the way for property
repositioning. This relo/rightsize and repo two-step is likely to be repeated in future quarters. Landlords were fortunate that firms have been willing to make commitments so far in advance of lease turnover. This gave landlords years to plan. Savvy landlords got out in front of the spike in availability and have attracted tenants from other properties. In contrast, landlords unable or unwilling to fund such work are experiencing more tepid demand.
This is just the start of several waves of relocations. The market has yet to digest blocks that are on the other end of moves to the Westside by major tenants. Even a mild recession could curb relocation activity if companies become hesitant to move operations. Additionally, interest rates remain worth monitoring. If fewer landlords can fund repositioning it will impair their ability to compete. Some properties ultimately may get long overdue renovations only by changing hands.
Availability Rate Comparison Rental Rate Comparison
Major Transactions
*Renewal **Renewal & Expansion ^^Expansion
$99.92$91.03
$87.79$81.01$79.68
$77.39$76.91$76.47$75.53$75.27$74.73$74.20$73.21$72.85
$70.69$70.33
$67.52$65.52$64.48$63.03$62.58
$57.19$54.95
$33.13
$0 $15 $30 $45 $60 $75 $90 $105
Plaza IHudson Yards
Plaza IIHudson Square
MidtownTimes Square
SohoColumbus Circle
TribecaGreenwich Village
ManhattanUnion SquareGrand Central
Midtown SouthWTC/Brookfield Place
ChelseaPark Ave S./Madison Square
FlatironDowntown
East Side/UNPenn Plaza/TSQ South
Financial DistrictCity Hall
U.S. Index
($/sf)
0.8%5.8%
7.1%7.3%7.6%8.0%8.1%8.7%9.4%9.4%9.9%9.9%
10.0%10.8%11.1%11.3%
12.5%12.7%
13.6%14.5%14.5%
17.0%17.2%17.6%
0% 5% 10% 15% 20% 25%
East Side/UNGreenwich Village
Park Ave S./Madison SquareCity Hall
Times SquareUnion Square
FlatironMidtown South
Penn Plaza/TSQ SouthColumbus Circle
TribecaHudson SquareFinancial District
ChelseaManhattan
MidtownDowntown
Grand CentralPlaza II
SohoPlaza I
U.S. IndexWTC/Brookfield Place
Hudson Yards
(%)
Savills Studley Report | New York City
04
Map Submarket Total
SF(1000's) This Quarter This
Quarter
%Change
fromLast Qtr.
YearAgo
ThisQuarter
ppChange
fromLast Qtr. (1)
YearAgo
ThisQuarter
%Change
fromLast Qtr.
YearAgo
Columbus Circle 29,363 377 2,774 3.5% 2,678 9.4% 0.3% 9.3% $76.47 0.0% $80.72Columbus Circle - Class A 19,972 290 2,008 5.4% 2,095 10.1% 0.5% 10.5% $79.55 0.4% $83.46Times Square 35,715 566 2,731 -0.3% 2,959 7.6% 0.0% 8.3% $77.39 -0.2% $78.17Times Square - Class A 31,000 506 2,034 -0.7% 2,200 6.6% 0.0% 7.1% $84.44 -0.9% $84.02Hudson Yards 6,980 565 1,227 -26.4% 652 17.6% -6.3% 12.7% $91.03 -3.2% $100.07Hudson Yards - Class A 5,519 563 983 -31.0% 610 17.8% -8.0% 15.7% $99.65 -3.1% $100.07Penn Plaza/Times Square South 55,131 869 5,162 -6.7% 5,395 9.4% -0.7% 9.8% $62.58 -2.8% $66.38Penn Plaza/Times Square South - Class A 8,401 45 835 3.8% 795 9.9% 0.4% 9.5% $90.05 6.5% $101.65Plaza I 29,885 367 4,324 2.5% 3,221 14.5% 0.3% 10.8% $99.92 -3.4% $119.70Plaza I - Class A 23,000 328 3,791 1.9% 2,788 16.5% 0.2% 12.1% $104.50 -2.8% $125.96Plaza II 43,926 312 5,975 10.6% 4,537 13.6% 1.3% 10.3% $87.79 3.4% $90.38Plaza II - Class A 38,791 276 5,404 11.4% 4,059 13.9% 1.4% 10.4% $89.67 3.6% $92.28Grand Central 72,350 1,379 9,160 1.1% 9,581 12.7% 0.1% 13.2% $73.21 1.5% $72.79Grand Central - Class A 40,219 971 5,753 -2.0% 5,937 14.3% -0.3% 14.7% $80.35 2.9% $78.40East Side/UN 3,266 0 26 -27.0% 67 0.8% -0.3% 2.1% $63.03 14.2% $57.59East Side/UN - Class A 783 0 0 0.0% 0 0.0% -0.2% 0.0% N/A N/A N/A
9 Chelsea 16,889 415 1,822 -8.7% 1,138 10.8% -1.0% 7.1% $70.33 -7.5% $64.25Chelsea - Class A 1,079 146 384 -31.1% 4 35.6% -16.0% 1.2% $125.71 -1.9% N/A
10 Flatiron 13,097 224 1,067 -0.7% 1,029 8.1% -0.1% 7.9% $65.52 6.0% $62.81Flatiron - Class A 858 0 0 0.0% 0 0.0% 0.0% 0.0% N/A N/A N/A
11 Park Ave South/Madison Square 23,660 197 1,674 3.3% 1,855 7.1% 0.2% 7.8% $67.52 -0.5% $64.94Park Ave South/Madison Sq. - Class A 3,462 32 40 0.0% 46 1.1% 0.0% 1.3% $88.00 N/A $95.00Union Square 7,414 155 590 -2.6% 808 8.0% -0.2% 10.9% $74.20 0.5% $73.33Union Square - Class A N/A N/A N/A N/A N/A N/A N/A N/A N/A N/A N/AGreenwich Village 6,929 48 403 -6.5% 553 5.8% -0.4% 8.0% $75.27 -6.7% $76.08Greenwich Village - Class A 835 0 72 0.0% 66 8.6% 0.0% 8.0% $111.97 N/A $160.00
14 Hudson Square 10,141 297 1,006 -40.9% 1,607 9.9% -6.9% 15.9% $81.01 1.6% $75.69Hudson Square - Class A 1,439 0 0 0.0% 0 0.0% 0.0% 0.0% N/A N/A N/A
15 Soho 4,058 60 587 16.8% 300 14.5% 2.1% 7.5% $76.91 -5.9% $81.02Soho - Class A 237 0 0 0.0% 0 36.4% -13.1% 36.4% $116.65 N/A N/A
16 Tribeca 5,947 0 586 -15.3% 417 9.9% -1.8% 7.0% $75.53 -1.2% $73.01Tribeca - Class A 765 0 0 0.0% 0 0.0% 0.0% 0.0% N/A N/A N/A
17 City Hall 4,091 223 297 26.0% 99 7.3% 1.5% 2.4% $54.95 -1.7% $46.75City Hall - Class A N/A N/A NA NA N/A N/A N/A N/A N/A N/A N/A
18 WTC/Brookfield Place 34,382 360 5,923 1.9% 4,294 17.2% 0.3% 13.6% $70.69 0.4% $64.84WTC/Brookfield Place - Class A 21,770 259 4,491 9.6% 3,000 20.6% 1.8% 15.9% $75.88 -2.7% $69.76
19 Financial District 49,865 443 5,005 -2.1% 5,537 10.0% -0.2% 11.0% $57.19 -0.1% $56.01Financial District- Class A 22,222 159 3,268 -2.1% 3,432 0.0% -0.3% 14.7% $60.99 -0.1% $60.82
1-8 Midtown 276,615 4,437 31,380 0.1% 29,091 11.3% 0.0% 10.6% $79.68 0.0% $79.75Midtown - Class A 167,686 2,980 20,807 0.9% 18,484 12.4% 0.1% 11.1% $88.19 1.3% $88.89Midtown South Total 82,188 1,396 7,147 -9.9% 7,290 8.7% -1.0% 9.0% $72.85 -3.1% $69.89Midtown South - Class A 7,911 178 582 -21.9% 117 7.4% -2.2% 1.7% $120.28 -4.4% $133.24Downtown Total 94,285 1,026 11,811 -0.3% 10,346 12.5% 0.0% 11.3% $64.48 -0.7% $61.71Downtown Total - Class A 44,757 418 7,759 4.3% 6,432 17.3% 0.7% 15.3% $69.20 -1.6% $65.24Manhattan Total 453,088 6,859 50,338 -1.5% 46,727 11.1% -0.2% 10.4% $74.73 -0.7% $72.53Manhattan Total - Class A 220,354 3,575 29,148 1.2% 25,033 13.2% 0.1% 11.6% $83.44 0.1% $79.90
16-19
6
12
13
2
3
4
5
9-15
7
8
LeasingActivity
AvailableSF
AvailabilityRate
Asking RentsPer SF*
1
@SavillsStudleywww.savills-studley.com
Please contact us for further information
*Rent and availability rates in submarkets with a limited amount of inventory are sometimes subject to large fluctuations.(1) Percentage point change for availability rates. Unless otherwise noted, all rents quoted throughout this report are average asking gross (full service) rents psf. Statistics are calculated using both direct and sublease information. Short-term sublet spaces (terms under two years) were excluded.
The information in this report is obtained from sources deemed reliable, but no representation is made as to the accuracy thereof. Statistics compiled with the support of The CoStar Group. Copyright © 2017 Savills Studley
Savills Studley399 Park Avenue11th FloorNew York, NY 10022(212) 326-1000
Chairman & CEOMitchell S. Steir [email protected](212) 326-1000
3
17
19
18
9
10
2
1213
1516
14
1
4
20
11
7
5
6 8
50th St
42nd St54th St
30th St
14th St
Houston St
34th St
23rd St
Canal St
Frankfort St
Lexi
ngto
n
2nd
Ave
6th
Ave
3rd
Ave
5th
Ave
9th
Ave
Corporate Research ContactsKeith DeCoster - Director, U.S. [email protected]
Lesley Kamnitzer - Research [email protected]