saving, borrowing and paying in finland spring 2011
TRANSCRIPT

Saving, borrowing and paying in Finland
Spring 2011

© Federation of Finnish Financial Services 2
Survey
> Coverage- 2,407 (aged 15 to 74)
> Sample is large enough to be reliable> Representative random sample, Finland in miniature
> Time of interviews: February 2011, exactly one year after previous survey
> Interviewed by: IRO Research Oy
1st June 2011

Current financial situation
Cannot say
Income is exceeded by expenses, using savings to cover expenses
Income is exceeded by expenses, must borrow to cover expenses
Income equals expenses
Income exceeds expenses
0 10 20 30 40 50 60
1
1
6
35
56
% of respondents (n= 2,407 in 2011)
Which of the following statements describes your financial situation?
© Federation of Finnish Financial Services

Savings and investment
2011
2010
2009
2008
2007
2006
2005
2004
2003
0 10 20 30 40 50 60 70
56
56
58
55
52
52
51
46
37
% of respondents
Do you hold savings or investments at the moment? ”YES”
© Federation of Finnish Financial Services

Savings and investment vehicles
Endowment policies
Voluntary personal pension policies
Listed shares
Mutual fund units
Current acount
Savings or investment account
0 5 10 15 20 25 30 35 40
6
12
17
19
29
34
6
9
13
17
26
34
6
9
13
17
26
31
6
9
12
17
22
25
2007 2008 2009 2010 2011
Which of the following vehicles do you hold?
% of respondents (n= 2,407 in 2011)
© Federation of Finnish Financial Services

Saving and investment criteria
How much was your choice of savings or investment vehicle impacted by the following factors?
2011
2009
2007
2011
2010
2011
2009
2007
2011
2009
2010
2008
0% 10% 20% 30% 40% 50% 60% 70% 80% 90% 100%
2428292828
2126
2530
434444
5151
62606062
727272
7674
38393740
38
5050
4848
4345
433938
2932
3031
212322
2021
36323129
31
2722
2320
1210
118
8
87
85
54
434
21233
22
32
21223
2122
21211
Somewhat Not at all Cannot say Series5
Security
Free of risk
Return
Ethical aspects, responsibilityEcological aspects
Provision for retirement
% of respondents (2.407 in 2011)
© Federation of Finnish Financial Services

Credit situation
1999 2001 2003 2004 2005 2006 2007 2008 2009 2010 20110
10
20
30
40
50
60
48 4651 52 50 51 51 51 50 49 50
24 23 2528 29 29 31 30 30 28 3028 30
33 34 34 33 32 3228
30 30
12 11 116 6 7 6 6 5 5 5
Loan Home loan Consumer credit Student loan
% of respondents (n=2,407 in 2011)
Do you hold a loan or credit at the moment?
© Federation of Finnish Financial Services
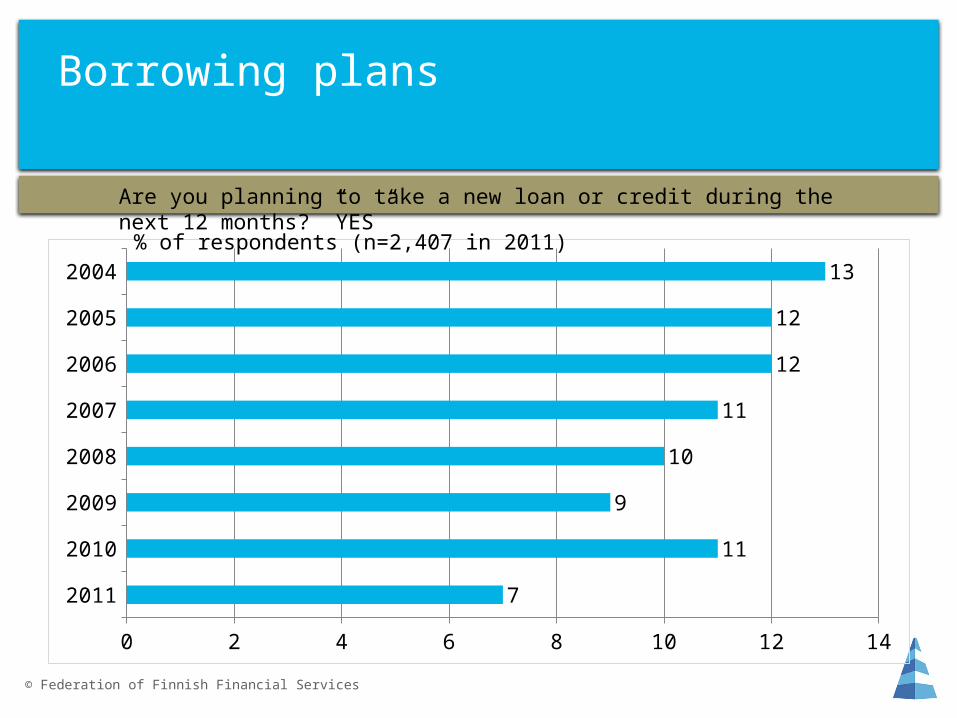
Borrowing plans
2011
2010
2009
2008
2007
2006
2005
2004
0 2 4 6 8 10 12 14
7
11
9
10
11
12
12
13
Are you planning to take a new loan or credit during the next 12 months? ”YES”
% of respondents (n=2,407 in 2011)
© Federation of Finnish Financial Services

Housing loan repayment period, 2011
35 years
30 years
25 years
21-24 years
20 years
16-19 years
15 years
11-14 years
10 years
6-9 years
1-5 years
0 5 10 15 20 25 30
1
2
23
3
27
4
10
3
12
3
8 Average repayment period in:
2010: 17 years
2009: 19 years
2008: 19 years
2007: 18 years
1998: 11 years
What was the original repayment period of your housing loan?
% of housing loans taken during the last two years (n=220 in 2011)
© Federation of Finnish Financial Services

Average home loans
1999 2000 2002 2003 2004 2005 2006 2007 2008 2009 2010 20110
10,000
20,000
30,000
40,000
50,000
60,000
70,000
80,000
90,000
20,300
30,20035,800
42,00044,900
49,800
58,300
65,30071,500
76,50081,800 82,000
Respondents who currently have a home loan (n=714 in 2011)€
How big is your home loan at the moment?
© Federation of Finnish Financial Services

How much of home purchase is financed with loan, broken down by loan size
2007
2008
2009
2010
2011
Less than €40,000
€40,001-60,000
€60,001-100,000
€100,001-150,000
More than €150,000
0 20 40 60 80 100
71
72
76
74
71
51
77
71
76
82
% of respondents who had raised the loan within 2 years (n=220 in 2011)
"Roughly how many percent of your home purchase was financed with loan?"
© Federation of Finnish Financial Services

Ratio of debt service costs to disposable income
2004 2005 2006 2007 2008 2009 2010 20110
5
10
15
20
25
30
35
2523 22 22 22 22 22 22
2527 28 28 28 28 29 28
Loan Housing loan
Approximately, how many percent of your monthly net income is used for installments and interest on loans?
%, covers those who have loan of any kind (n=1193 in 2011) or housing loan (n=714 in 2011)
© Federation of Finnish Financial Services

Changes in repayment plans
Cannot say
Repaid later
Repaid sooner
Repaid according to plan
0 10 20 30 40 50 60 70 80 90
7
9
9
75
7
9
9
74
7
7
10
76
5
9
10
77
5
10
11
74
2007 2008 2009 2010 2011
% of respondents (n=1,193 in 2011)
"Have you repaid the loans according to the original plan or have you made changes to the original repayment plan?"
© Federation of Finnish Financial Services

Risk factors in personal finances
Value of home falls
Temporary layoff
Loss of personal household income (eg illness, disability for work, divorce, death of a
family..)
Some risks seen as threat
0 10 20 30 40 50 60
9
13
12
21
30
49
51
8
11
15
22
29
51
49
2010 2011
Which of the following risk factors do you see as a threat to your financial situation?
% of respondents (n=2407 in 2011)
© Federation of Finnish Financial Services

Risks affecting home loans
Global situation, recession
Financial problems in household
Loss of income
Loss in value of home/Changes in property prices
Health factors, illness, death
Interest rate rises
Work-related factors
0 10 20 30 40 50 60
7
8
2
7
17
57
20
5
6
6
8
14
40
43
2010 2011
What risks do you think may affect your housing loan?
% of those who see risks that may affect their housing loans (n=94 in 2011)
© Federation of Finnish Financial Services

Loans covered by loans insurance
2001 2003 2004 2005 2006 2007 2008 2009 2010 20110
5
10
15
20
25
30
35
40
2022
26 26 27 28 28 28 2724
3436 37 37 37 37 36
32
Loan Housing Loan
Are any of your loans covered by payment protection insurance which secures repayment of the loan?
% of respondents who have a loan (n=1193 in 2011) or housing loan (n=714 in 2011)
© Federation of Finnish Financial Services

Interest rate cap
Yes
0 5 10 15 20 25
22
22
21
2009 2010 2011
% of holders of home loan or consumer credit from bank (n=913 in 2011)
Do you have an interest rate cap on your loan to ensure interest payments stay within agreed limit? Are you going to have your interest rate capped to protect against rate rises above agreed?
© Federation of Finnish Financial Services

Preparing for interest rate rises
over €80.000
€40.001-€80.000
€20.001-€40.000
€10.001-€20.000
Less than €10.000
Loan Size:
2011
2010
2009
2008
2007
0 10 20 30 40 50 60 70 80 90
83
75
77
51
55
75
77
68
72
71
Are you prepared for possible interest rate rises which would raise the cost of servicing your housing loan?
% of respondents who have a housing loan (n=714 in 2011)
© Federation of Finnish Financial Services

Use of internet
2011
2010
2009
2008
2007
2005
2004
2003
0 10 20 30 40 50 60 70 80 90 100
90
88
86
84
82
76
71
64
10
12
14
16
18
24
29
36
Yes No
Do you use internet?
% of respondents (n=2407 in 2011)
%
© Federation of Finnish Financial Services

Typical ways of paying bills
At Branch
Payment service with service envelope
ATM
Direct debit
Internet (via PC)
0 10 20 30 40 50 60 70 80 90 100
2
3
3
8
81
3
4
6
9
74
5
6
13
9
64
16
13
39
14
23
29
20
40
16
10
39
30
16
9
4
1994 1999 2001 2005 2010 2011
© Federation of Finnish Financial Services
of respondents (2407 in 2011)
What is the most typical way you pay your bills?

Receiving bills electronically
2011
2010
2009
2008
0% 10% 20% 30% 40% 50% 60% 70% 80% 90% 100%
29
26
22
15
70
73
78
84
1
1
1
1
Yes No Cannot say
% of those who pay bills on the web
Do you receive e-bills to your online banking site?
© Federation of Finnish Financial Services

Approach to electronic billing
2011
2010
2009
2008
0% 10% 20% 30% 40% 50% 60% 70% 80% 90% 100%
16
22
17
22
71
66
71
67
13
12
12
11
Yes No Cannot say
Would you like to get e-bills to your online banking site?
Of those who pay bills online but do not receive e-bills (1456 in 2011)
© Federation of Finnish Financial Services

Awareness of electronic billing
2011
2010
2009
0% 10% 20% 30% 40% 50% 60% 70% 80% 90% 100%
31
30
31
21
23
20
10
11
9
13
16
23
25
21
17
Am receiving e-bills Yes, am well aware Yes, am awareHave heard about it Am not aware
Do you know what an electronic bill is?
Of respondents (2407 in 2011)
© Federation of Finnish Financial Services

Paying for daily shopping
Other
Credit card
Visa Electron card
Debit card
Cash
0 10 20 30 40 50 60
1
6
11
53
28
1
5
9
52
32
1
8
10
45
35
2
5
8
49
37
1
2
7
45
43
2006 2007 2008 2009 2010 2011
How do you pay your daily shopping normally?
of respondents (2407 in 2011)
© Federation of Finnish Financial Services