saving mothers giving life: maternal mortality: … · centers for disease control and prevention....
TRANSCRIPT

Saving Mothers, Giving Life
Maternal Mortality
Phase 1 Monitoring and Evaluation Report
Suggested Citation Centers for Disease Control and Prevention. Saving Mothers, Giving Life: Maternal Mortality.
Phase 1 Monitoring and Evaluation Report. Atlanta, GA: Centers for Disease Control and Prevention, US Dept of Health and Human Services; 2014.

Photographs by Riccardo Gangale, 2013
Saving Mothers, Giving Life: Maternal Mortality
Phase 1 Monitoring and Evaluation Report
2014
ii Maternal Mortality
Acknowledgements
This report was prepared by staff of the Centers for Disease Control and Prevention (CDC) of the US Government, located both at CDC headquarters and in the Uganda and Zambia CDC country offices.
Thousands of individuals participated in activities to monitor and evaluate Phase 1 of the Saving Mothers, Giving Life (SMGL) initiative, including staff affiliated with country SMGL teams and implementing organizations; district and national-level Ministry of Health officials; Village Health Teams and community health workers; headquarters representatives of all US Government agencies involved; the Government of Norway; and private-sector SMGL partners. Because those involved in this momentous effort are too numerous to name individually, the organizations they represent are acknowledged below.
Uganda
Government of Uganda
Ministry of Health of Uganda
District Medical/Health Officers
Uganda Village Heath Teams
CDC Country Office
US Agency for International Development (USAID) Mission in Uganda
Baylor Children’s Foundation
Uganda Infectious Diseases Institute (Makerere University, Uganda)
Marie Stopes Uganda (MSU)
STRIDES for Family Health
Health Care Improvement Project (HCI)
Uganda Health Marketing Group (UHMG)
Uganda Episcopal Conference (UEC)
Health Initiatives for the Private Sector (HIPS)
Strengthening Decentralization for Sustainability (SDS)
Uganda Blood Transfusion Services (UBTS)
Makerere University School of Public Health
Securing Uganda’s Right to Essential Medicines (SURE)
Zambia
Government of Zambia
Zambia Ministry of Community Development, Mother and Child Health (MCDMCH)
Zambia Central Statistics Office
District and Provincial Medical/Health Officers
Community Health Workers and Safe Motherhood Action Groups (SMAGs)
CDC Country Office
US Agency for International Development (USAID) Mission in Zambia
Center for Infectious Disease Research in Zambia (CIDRZ)
Zambia Center for Applied Health Research and Development (ZCAHRD) (Boston University)
Maternal and Child Health Integrated Program (MCHIP)
Zambia Integrated Systems Strengthening Program (ZISSP)
Communication Support for Health (CSH)
University of Zambia (UNZA), Department of Population Studies
Global Partners American College of Obstetricians and Gynecologists
Every Mother Counts
Merck for Mothers
Government of Norway
Project CURE
US Government Agencies:
Centers for Disease Control and Prevention (CDC)
US Agency for International Development (USAID)
Peace Corps
US Department of Defense (DOD)
Office of the US Global AIDS Coordinator (OGAC)

iiiMaternal Mortality
Contents
Summary of Findings .....................................................................................................................................................................................................................................................................1
Uganda ..................................................................................................................................................................................................................................................................................................................................................1
Zambia ...................................................................................................................................................................................................................................................................................................................................................2
Introduction ............................................................................................................................................................................................................................................................................................................3
SMGL Monitoring and Evaluation ...........................................................................................................................................................................................................................................5
Assessing SMGL’s Effect on Maternal Mortality ..........................................................................................................................................................................................8
Data Sources and Methods .....................................................................................................................................................................................................................................................................9
Maternal Mortality in Uganda ......................................................................................................................................................................................................................11
District-wide Maternal Mortality .............................................................................................................................................................................................................................................11
Facility-Based Maternal Mortality ...........................................................................................................................................................................................................................................16
Maternal Mortality in Zambia ..................................................................................................................................................................................................................... 18
Facility-Based Maternal Mortality ........................................................................................................................................................................................................................................18
Conclusions ...........................................................................................................................................................................................................................................................................................................20
References ................................................................................................................................................................................................................................................................................................................22
Appendices ............................................................................................................................................................................................................................................................................................................23
Appendix A: Significance Level of Observed Changes in Maternal Mortality Ratios .......................................24
Appendix B: Methods Used to Calculate District-wide Maternal Mortality in Uganda ...............................26
Appendix C: Baseline Census and Maternal Mortality Estimates for Zambia ....................................................................28
iv Maternal Mortality
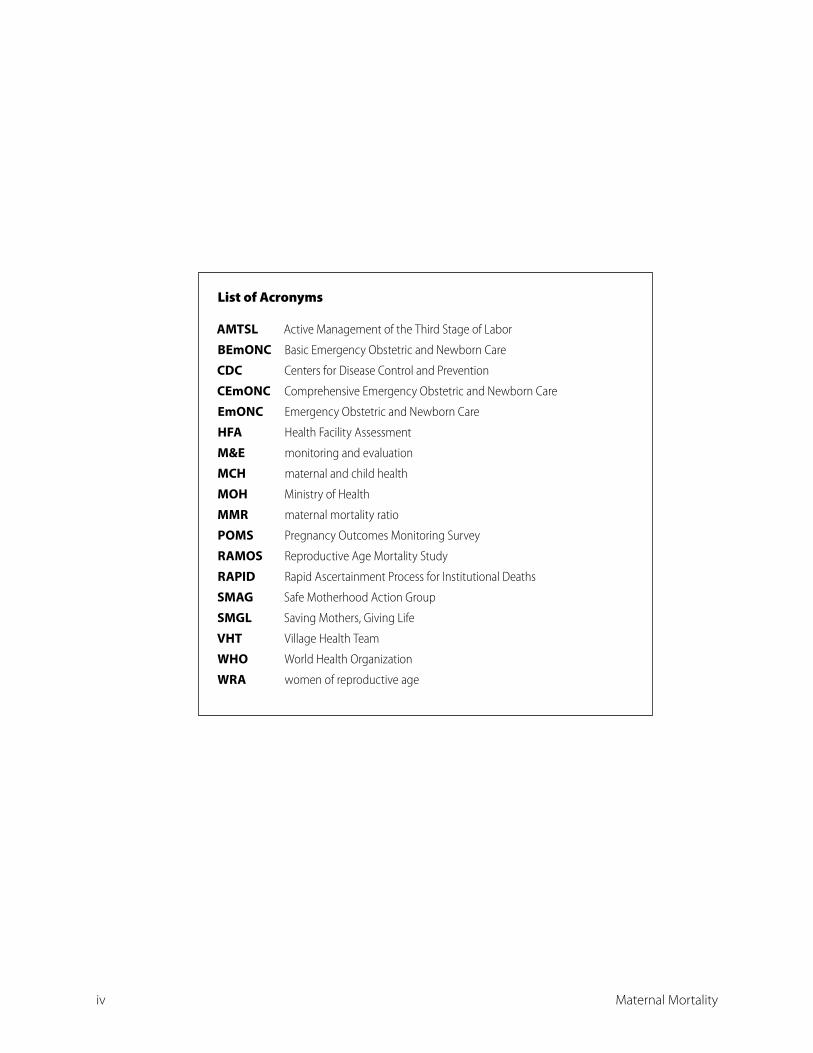
List of AcronymsList of Acronyms
AMTSL Active Management of the Third Stage of Labor
BEmONC Basic Emergency Obstetric and Newborn Care
CDC Centers for Disease Control and Prevention
CEmONC Comprehensive Emergency Obstetric and Newborn Care
EmONC Emergency Obstetric and Newborn Care
HFA Health Facility Assessment
M&E monitoring and evaluation
MCH maternal and child health
MOH Ministry of Health
MMR maternal mortality ratio
POMS Pregnancy Outcomes Monitoring Survey
RAMOS Reproductive Age Mortality Study
RAPID Rapid Ascertainment Process for Institutional Deaths
SMAG Safe Motherhood Action Group
SMGL Saving Mothers, Giving Life
VHT Village Health Team
WHO World Health Organization
WRA women of reproductive age
1Maternal Mortality
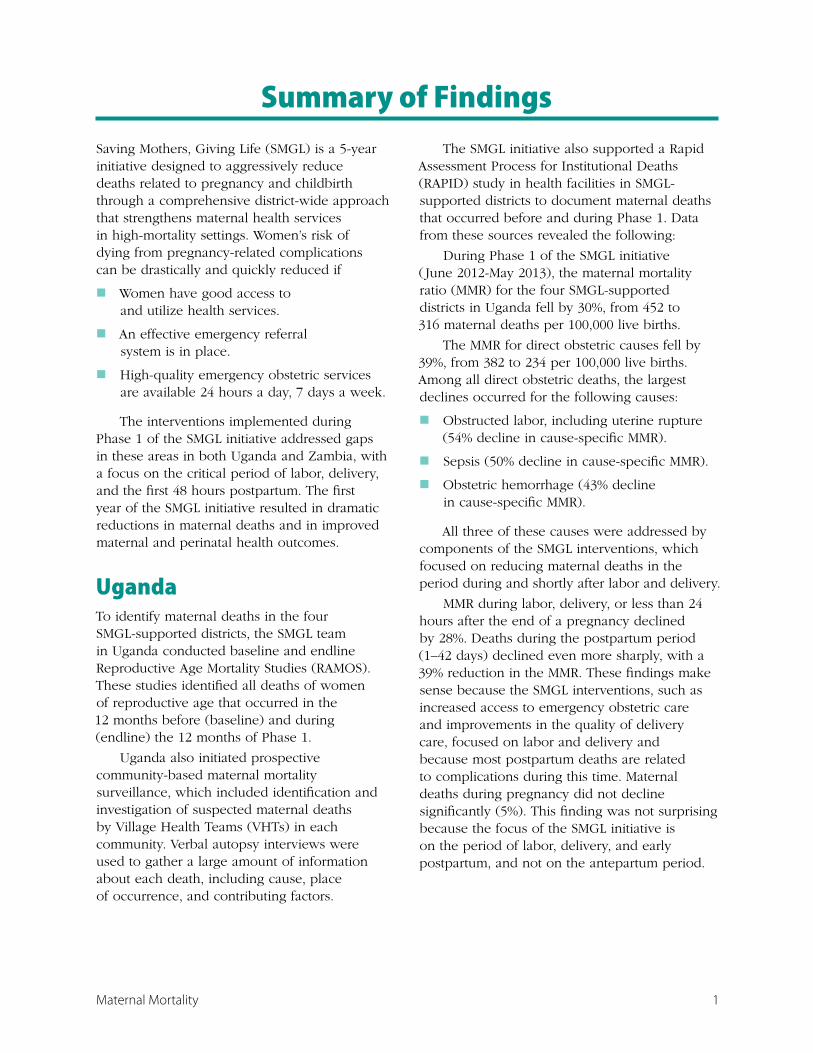
Summary of FindingsSaving Mothers, Giving Life (SMGL) is a 5-year initiative designed to aggressively reduce deaths related to pregnancy and childbirth through a comprehensive district-wide approach that strengthens maternal health services in high-mortality settings. Women’s risk of dying from pregnancy-related complications can be drastically and quickly reduced if
� Women have good access to and utilize health services.
� An effective emergency referral system is in place.
� High-quality emergency obstetric services are available 24 hours a day, 7 days a week.
The interventions implemented during Phase 1 of the SMGL initiative addressed gaps in these areas in both Uganda and Zambia, with a focus on the critical period of labor, delivery, and the first 48 hours postpartum. The first year of the SMGL initiative resulted in dramatic reductions in maternal deaths and in improved maternal and perinatal health outcomes.
UgandaTo identify maternal deaths in the four SMGL-supported districts, the SMGL team in Uganda conducted baseline and endline Reproductive Age Mortality Studies (RAMOS). These studies identified all deaths of women of reproductive age that occurred in the 12 months before (baseline) and during (endline) the 12 months of Phase 1.
Uganda also initiated prospective community-based maternal mortality surveillance, which included identification and investigation of suspected maternal deaths by Village Health Teams (VHTs) in each community. Verbal autopsy interviews were used to gather a large amount of information about each death, including cause, place of occurrence, and contributing factors.
The SMGL initiative also supported a Rapid Assessment Process for Institutional Deaths (RAPID) study in health facilities in SMGL-supported districts to document maternal deaths that occurred before and during Phase 1. Data from these sources revealed the following:
During Phase 1 of the SMGL initiative ( June 2012-May 2013), the maternal mortality ratio (MMR) for the four SMGL-supported districts in Uganda fell by 30%, from 452 to 316 maternal deaths per 100,000 live births.
The MMR for direct obstetric causes fell by 39%, from 382 to 234 per 100,000 live births. Among all direct obstetric deaths, the largest declines occurred for the following causes:
� Obstructed labor, including uterine rupture (54% decline in cause-specific MMR).
� Sepsis (50% decline in cause-specific MMR).
� Obstetric hemorrhage (43% decline in cause-specific MMR).
All three of these causes were addressed by components of the SMGL interventions, which focused on reducing maternal deaths in the period during and shortly after labor and delivery.
MMR during labor, delivery, or less than 24 hours after the end of a pregnancy declined by 28%. Deaths during the postpartum period (1–42 days) declined even more sharply, with a 39% reduction in the MMR. These findings make sense because the SMGL interventions, such as increased access to emergency obstetric care and improvements in the quality of delivery care, focused on labor and delivery and because most postpartum deaths are related to complications during this time. Maternal deaths during pregnancy did not decline significantly (5%). This finding was not surprising because the focus of the SMGL initiative is on the period of labor, delivery, and early postpartum, and not on the antepartum period.

2 Maternal Mortality
The MMR for women who delivered in health facilities declined by 35%, from 534 to 345 maternal deaths per 100,000 live births.
Although maternal mortality from all direct obstetric causes declined substantially, the largest declines were likely due to improvements in access to and utilization of timely, good-quality obstetric care, including life-saving surgical interventions and availability of medications, such as antibiotics and uterotonics.
ZambiaTo document change in maternal mortality during Phase 1 of the SMGL initiative, the Zambia SMGL team reviewed medical records in health facilities in SMGL-supported districts. These records were supplemented by information about facility deaths from a census conducted shortly before Phase 1 began (baseline data) and from pregnancy tracking conducted by community key informants. Data from these sources revealed the following:
� The MMR for facilities in SMGL-supported districts declined by 35%, from 310 to 202 maternal deaths per 100,000 live births in health facilities.
� Information was lacking on the number of nonfacility maternal deaths during the endline period, which prevented the calculation of mortality levels or changes for the districts as a whole. However, the high rate of deliveries in health facilities (84%) and the high percentage of maternal deaths that took place in facilities at baseline (70%), coupled with a substantial reduction in MMR in facilities, strongly suggest a decline in the district-wide level of maternal mortality.
� Maternal mortality in health facilities from major direct obstetric causes declined. Among all direct causes of maternal death, the largest declines occurred for the following causes:
◊ Obstructed labor, including uterine rupture(78% decline in cause-specific MMR).
◊ Obstetric hemorrhage (34% declinein cause-specific MMR).
These causes were addressed by SMGL interventions. These trends suggest that there were improvements in the access to and utilization of timely, good quality obstetric care.

3Maternal Mortality
Introduction Saving Mothers, Giving Life (SMGL) is a 5-year initiative designed to aggressively reduce deaths related to pregnancy and childbirth through a comprehensive approach that strengthens maternal health services in high-mortality settings. SMGL’s evidence-based interventions are focused primarily on the critical period of labor, delivery, and the 48 hours postpartum, when most maternal deaths and about half of newborn deaths occur. SMGL works to improve the existing health network within each district to ensure that women can receive quality facility-based care within 2 hours of the onset of labor or obstetric emergencies.
Coordinated and funded by a public-private partnership,1 SMGL strives to improve access to, demand for, and the quality of basic and comprehensive Emergency Obstetric and Newborn Care (EmONC).2 It also seeks to strengthen links to other essential services for women and children, including family planning and HIV prevention, care, and treatment.
SMGL began in June 2012 in eight pilot districts, four each in Uganda and Zambia (see Figure 1 for demographic and population data). Phase 1 (the pilot phase) activities took place from June 2012 through May 2013 and were preceded by a planning and start-up period of about 8 months.
1. Current partners are the American College of Obstetricians and Gynecologists, Every Mother Counts, Merck for Mothers, the Government of Norway, Project CURE, and the US Government [Centers for Disease Control and Prevention (CDC), US Agency for International Development (USAID), Peace Corps, US Department of Defense, and US Office of the Global AIDS Coordinator (OGAC)]. The governments of Uganda and Zambia were central to the partnership and all activities.
2. EmONC facilities are those that have recently performed specific life-saving obstetric interventions called “signal functions” that are recommended by the World Health Organization. Basic care interventions include administration of parenteral antibiotics, uterotonics, or anticonvulsants; manual removal of placenta; removal of retained products; assisted vaginal delivery; and basic neonatal resuscitation. Comprehensive care interventions include two additional services: ability to perform obstetric surgery (e.g., Cesarean section) and blood transfusion.
The SMGL Model
SMGL’s essential components and concepts include the following:
A comprehensive approach. Maternal deaths cannot be prevented by any one intervention alone. Reducing maternal mortality requires a solution that addresses multiple health system issues at multiple levels. SMGL uses evidence-based interventions that are designed to address three dangerous delays that pregnant women face in childbirth: delays in deciding to seek care for an obstetric emergency, delays in reaching a health facility in time, and delays in receiving quality care at health facilities.
An adequate number of high-quality delivery facilities, including EmONC, that are accessible within 2 hours of the onset of labor or obstetric emergencies.
An integrated communication-transportation system that functions 24 hours a day/7 days a week to encourage and enable pregnant women to use delivery care facilities. This system should include community outreach and interventions that increase awareness of these facilities.
An adequate number of skilled birth attendants who can provide quality care for normal delivery and who are able to identify and refer obstetric emergencies.
A functional supply chain system to ensure that facilities have the equipment, supplies, commodities, and drugs they need to deliver high-quality obstetric care.
A system that accurately records every birth and maternal and neonatal death.

4
Uganda
Population of the country (2014 Uganda Bureau of Statistics projection)
36,615,600
Total fertility rate (2011 DHS) 6.2
SMGL-Supported Districts in Uganda
Total population of the 4 SMGL-supported districts (2011 Uganda Bureau of Statistics projection)
1,750,000
Estimated number of births in the 4 SMGL-supported districts during Phase 1 (2012 – 2013 endline data and DHS age-specific fertility rates)
78,261
Combined area of the 4 SMGL-supported districts 13,079 sq km
Population density of the 4 SMGL-supported districts 26.2 WRA per sq km
SMGL = Saving Mothers, Giving Life; DHS = Demographic and Health Survey; WRA = women of reproductive age. Note: The total fertility rate indicates the average number of births a woman would have in her lifetime at current age-specific fertility rates.
Figure 1. Demographic and Population Data for Uganda, Zambia, and Their SMGL-Supported Districts
Zambia
Population of the country (2010 national census) 13,092,666
Total fertility rate (2007 DHS) 6.2
SMGL-Supported Districts in Zambia
Total population of the 4 SMGL-supported districts (Projected from 2010 national census data for 2011)
925,198
Estimated number of births in the 4 SMGL-supported districts during Phase 1 (crude birth rate combined with census projection)
37,267
Combined area of the 4 SMGL-supported districts 49,412 sq km
Population density of the 4 SMGL-supported districts 3.9 WRA per sq km
Uganda
Zambia
Maternal Mortality

5Maternal Mortality
Participating US Government agencies, along with partner governments and multiple partner organizations, built on existing district maternal and child health services. SMGL-supported staff conducted routine monitoring during the first year of the project, including baseline and endline assessments3 before and after Phase 1.
Results from monitoring and evaluation indicate that SMGL interventions are effective, because of a combination of the following factors:
� Greater supply of services, including increased availability of and improved access to obstetric services.
� Increased demand for obstetric and HIV services, due to voucher programs and intensified activities to increase community awareness, as well as to women’s growing recognition of the importance of facility delivery and skilled attendance at birth.
� Improved quality of care at facilities that hired more staff, trained and mentored more staff in EmONC, stocked necessary equipment and supplies, and had reliable supplies of medicines.
The first year of SMGL was designed to provide “proof of concept” in the eight pilot districts to determine (1) if the SMGL interventions could improve health outcomes for women and their infants and (2) how these interventions could be scaled up as SMGL expands. The declines in mortality achieved in both countries are extraordinary given the short timeframe of Phase 1 (12 months).
This report, which focuses on Maternal and Perinatal Health Outcomes in Health Facilities, is one of five SMGL documents prepared by the Centers for Disease Control and Prevention (CDC) and by the Uganda and Zambia CDC country offices. The other documents are an Executive Summary and reports on the following topics: Monitoring and Evaluation Overview, Maternal and Perinatal Outcomes in Health Facilities, and Emergency Obstetric and Newborn Care Access and Availability.
CDC, in collaboration with the US Agency for International Development and the US Office of the Global AIDS Coordinator, led the monitoring and evaluation efforts for the SMGL initiative. These activities were conducted in close collaboration with the governments of Uganda and Zambia and partner organizations.
SMGL Monitoring and Evaluation Extensive monitoring and evaluation (M&E) of SMGL during Phase 1 was essential to assess potential changes in the key indicators closely related to maternal and neonatal mortality. SMGL M&E efforts drew upon the experience of existing global initiatives designed to standardize data-collection methods for monitoring interventions, making decisions, and developing health policies related to maternal and neonatal outcomes and care.
The SMGL M&E Framework included a range of indicators designed to measure program achievements in Phase 1. These indicators can be grouped into four broad categories:
� Impact — such as changes in the number of maternal and newborn deaths.
� Outcomes — such as percentage of deliveries in health facilities and rates for Cesarean sections (C-sections).
� Outputs — such as the number of EmONC signal functions performed, HIV tests conducted, and PMTCT (prevention of mother-to-child HIV transmission) services provided.
� Processes — such as hiring and training personnel, upgrading facilities, and stockpiling life-saving medicines.
Several M&E methods were used to assess the various aspects of SMGL during Phase 1. The most important of these processes were
� Health Facility Assessments (HFAs): HFAs were conducted before and after Phase 1 at all facilities that provide delivery services in
3. SMGL baseline assessments generally covered the period before SMGL interventions started in June 2012. Endline assessments covered the first year of SMGL implementation, but varied by data source. Details are provided when data methods are presented.

6 Maternal Mortality
SMGL-supported districts in both Uganda and Zambia. In Uganda, HFAs were conducted in 16 hospitals or Level IV health centers (high-level advanced care facilities), 72 Level III health centers (middle-level facilities), and 19 Level II health centers (lower-level primary care facilities), for a total of 107 facilities. In Zambia, HFAs were conducted in 6 hospitals, 91 health centers (middle-level facilities), and 16 health posts (lower-level facilities), for a total of 113 facilities.
The HFAs gathered baseline and endline data on maternity care infrastructure; EmONC availability and use; human resources; and drugs, equipment, and supplies. (See the Emergency Obstetric and Newborn Care Access and Availability report for more detail.)
� Routine Health Information Systems:Existing Health Management Information Systems (HMIS), which collect monthly statistics from health facilities, were used to monitor access to and quality, efficiency, and use of maternal and child health (MCH) services. For example, one health information system supported by the President’s Emergency Plan for AIDS Relief (PEPFAR) monitors MCH and HIV-related indicators. (See the Emergency Obstetric and Newborn Care Access and Availability report for more detail.)
� Facility-Based Pregnancy Outcome Monitoring: To track key facility indicators, Uganda and Zambia intensified existing efforts to document maternal and neonatal outcomes accurately and completely. These outcomes included maternal complications, the use of life-saving interventions such as C-sections, and more thorough identification and investigation of maternal deaths.
In Zambia, reductions in maternal mortality were monitored through routine identification and investigation of deaths that occurred in facilities before and during SMGL Phase 1. (See the Maternal and Perinatal Outcomes in Health Facilities report for more detail.)
� Community-Based Maternal Mortality Identification: In Uganda, SMGL built on the existing data-collection infrastructure of the Village Health Teams (VHTs) to collect information on maternal deaths in the four SMGL-supported districts. To obtain baseline information, one member of the VHT visited each household in his or her village. If any households reported deaths of women of reproductive age (WRA) during the baseline period, health personnel at the parish level followed up. If the deceased woman had been pregnant at the time of her death or in the 3 months preceding it, a verbal autopsy interview was conducted in the household, followed by death certification and classification of cause of death.
After the SMGL initiative began in June 2012, monitoring switched to a prospective approach. VHTs reported on any death of WRA in the village, and the same procedure was followed. In October 2013, the SMGL partners conducted a second retrospective data collection to identify all deaths of WRA during Phase 1.
Zambia did not have a community-based system to collect health data in place before the SMGL initiative began. It set up a new system of community key informants, who tracked each pregnant woman until the end of the 42-day postpartum period. However, logistical challenges limited the coverage and completeness of the data gathered.
In addition, although a March 2012 census of the four SMGL-supported districts identified maternal deaths during the baseline period, an endline census did not occur. As a result, Zambia only monitored maternal deaths that occurred in health facilities. (See later sections of this report, Maternal Mortality, for more detail.)

7Maternal Mortality
Selected Key Findings from SMGL Phase 1
� Maternal mortality fell sharply (by 30%) in Uganda’s four SMGL-supported districts. (The equivalent population-based maternal mortality ratios could not be calculated for SMGL-supported districts in Zambia.) Maternal mortality also declined by 35% in health facilities that implemented SMGL interventions in both Uganda and Zambia. These improvements are likely due to women’s increased access to emergency obstetric care and the effective care they receive once they arrive at health facilities. (See later sections of this report, Maternal Mortality, for more detail.)
� The percentage of all births in SMGL-supported districts that occurred at health facilities increased from 46% to 74% in Uganda (a 62% increase) and from 63% to 84% in Zambia (a 35% increase). (See the Maternal and Perinatal Outcomes in Health Facilities report for more detail.)
� The percentage of all facilities performing specific life-saving interventions called “signal functions” increased. By the end of Phase 1, both
countries had an adequate number of facilities (relative to each district’s population) to provide Basic and Comprehensive EmONC. In particular, middle-level health clinics in both countries made substantial gains in their ability to perform more life-saving interventions. The percentage of middle-level facilities that were providing four or more of the recommended seven signal functions increased from 31% to 57% in Uganda and from 27% to 44% in Zambia. (See the Emergency Obstetric and Newborn Care Access and Availability report for more detail.)
� SMGL-supported districts showed improvement in treatment for HIV-positive mothers and prophylaxis for their infants. In Uganda, 28% more HIV-positive women received treatment and 27% more infants received prophylaxis. Increases in Zambia were 18% and 29%, respectively. (See the Emergency Obstetric and Newborn Care Access and Availability report for more detail.)

8 Maternal Mortality
Assessing SMGL’s Effect on Maternal Mortality This report focuses on the impact of SMGL interventions on maternal mortality and its causes in Uganda and Zambia.
For the purposes of monitoring the effect of SMGL interventions, the baseline and endline
periods are defined as 12-month periods that extended before and after the official SMGL launch. The baseline period included outcomes during June 2011–May 2012. The endline period included outcomes during June 2012–May 2013.
Figure 2. Data Collection for Maternal Mortality in Health Facilities and Communities in SMGL-Supported Districts in Uganda and Zambia
Significance TestingTo determine whether changes between the baseline and endline periods were significant, SMGL evaluation staff calculated a z-statistic for the observed change, which is used to determine the significance levels of the change. These significance levels are presented in Appendix A.
The data presented in this report are not subject to sampling error because they are
complete counts, not samples. However, the data may be affected by random variation. That is, the number of events that actually occurred can be considered as one possible result among many possible results that could have arisen under the same circumstances. Thus, when a change is labeled as significant, it means that the difference is unlikely to be due to random variability.
UG
AN
DA
ZAM
BIA
Jan Feb Mar April May June Jul Aug Sep Oct Jul Aug Sep OctNov Dec Jan Feb Mar April May June
Baseline Census and Verbal Autopsies
Final Facility Report on Maternal and
Perinatal Outcomes
Baseline and Onset of Prospective
Facility Monitoring
Community Key Informants Prospective Monitoring
Village Health Team Prospective Monitoring
2012 2013
SMGLPhase 1Begins
SMGLPhase 1
Ends
Baseline and Onsetof Prospective POMSin CEmONC Facilities
RAPID
POMS Aggregate inBEmONC and OtherDelivering Facilities
RAPIDEndline RAMOS
BaselineRAMOS
Note: Baseline period is June 2011–May 2012. Endline period is June 2012–May 2013. SMGL = Saving Mothers, Giving Life; POMS = Pregnancy Outcomes Monitoring Survey; CEmONC = Comprehensive Emergency Obstetric and Neonatal Care; BEmONC = Basic Emergency Obstetric and Neonatal Care; RAPID = Rapid Ascertainment Process for Institutional Deaths; RAMOS = Reproductive Age Mortality Study.

9Maternal Mortality
Data Sources and MethodsThe goal of the SMGL initiative is to reduce maternal mortality in the SMGL-supported districts in Uganda and Zambia by 50%. Assessing progress toward this goal during the initiative’s first year required measuring maternal mortality among relatively small populations in a short period of time. Each country faced the immediate challenge of how to produce a baseline measurement of maternal mortality in the period immediately before the initiative began and a comparable measurement about 1 year later.
Each country used its existing data systems and infrastructure to devise its own independent data-collection approach. Although the definitions of indicators were standard, the differences in the primary data used to calculate maternal mortality measurements are substantial, and direct comparison is not advisable.
A summary of data sources and methods is provided here. Greater detail is provided in Appendices B and C.
Uganda District-wide Maternal Mortality MeasurementsUganda conducted its last national census in 2002 and therefore lacks recent, accurate population numbers. However, it has a government-supported system of Village Health Teams (VHTs), and this system was strengthened in the four SMGL-supported districts.
VHTs typically include 5–6 community volunteers who provide maternal, newborn, and child services. They create a bridge between community care and the health facilities serving their villages.
Under the SMGL initiative, about 4,000 VHTs, one per village, were trained to provide several preventive MCH services and to notify the subcounty health coordinator of deaths of Women of Reproductive Age (WRA, ages 15 to 49) that occurred in their communities. At the end of Phase 1 of the SMGL initiative, 98% of villages in the Kabarole district, 100% of villages
in the Kamwenge district, 99% of villages in the Kyenjojo district, and 97% of villages in the Kibaale district had functional VHTs that were conducting WRA death surveillance activities, with 98% overall coverage.
To establish the baseline maternal mortality ratio through the baseline Reproductive Age Mortality Study (RAMOS), the VHTs were trained to update their registers and list the names of WRA who had died during June 2011–May 2012, the baseline period. Health and development workers at the parish and subcounty level then visited the homes of all women who had died and used a one-page screening tool to identify any women who were pregnant at the time of their death or in the 3 months before their death.
Verbal autopsy teams then investigated each death that had occurred during or within 3 months of a pregnancy. The teams, one for each health subdistrict, visited the identified homes and interviewed family members about the causes and circumstances of the deaths. This was followed by death certification and classification of the cause of death by trained physicians.
After the SMGL initiative started, verbal autopsy interviews were conducted prospectively for deaths that occurred during Phase 1. This approach yielded counts of maternal deaths that were then combined with estimates of the numbers of births and the number of WRA to calculate maternal mortality ratios (MMRs) and rates. (See Appendix B for greater detail).
VHTs also conducted an endline RAMOS in October 2013 including a district-wide count of all living WRA in all villages in the four SMGL-supported districts. The VHTs produced a new retrospective listing of all deaths of WRA during Phase 1 ( June 2012 – May 2013) to ensure that all deaths had been identified. These deaths were compared with the deaths prospectively identified by the VHTs. The endline RAMOS identified additional deaths, which were then screened to determine whether the women had died during pregnancy or within 3 months of completing the pregnancy, in which case verbal autopsy interviews were conducted.
10 Maternal Mortality
To obtain an estimate of the number of births in the four SMGL-supported districts during Phase 1 (necessary for the MMR denominator), the district wide count of living WRA was categorized into 5-year age groups. These counts were then multiplied by rural, age-specific fertility rates from the 2011 Uganda Demographic and Health Survey to obtain district specific birth estimates.
Facility-Based Maternal Mortality MeasurementsMaternal mortality in health facilities was assessed separately from district-wide mortality in Uganda. To improve case detection, all community maternal deaths identified during the RAMOS (baseline and endline) were cross-checked with deaths of WRA identified in health facilities (see the Maternal and Perinatal Outcomes in Health Facilities report for more detail on the Pregnancy Outcomes Monitoring Survey, or POMS). In Comprehensive EmONC (CEmONC) facilities, maternal deaths were identified by the Rapid Ascertainment Process for Institutional Deaths (RAPID) method.5 This approach minimizes the underreporting of maternal deaths that occur outside obstetric wards, which can be missed in routine reporting.
Maternal deaths from both sources were matched by age, residence, date of death, place of death, and cause of death, when available. When a facility maternal death was reported in a RAMOS but not identified through facility reviews, it was added to the count of facility maternal deaths. This method improved the case detection of facility maternal deaths and contributed to changes in the notification and reporting of maternal deaths in health facilities.
ZambiaZambia did not have a community-based system for collecting health data in place before the SMGL initiative began. To establish a baseline MMR, the Zambia Central Statistics Office conducted a census of households in the four SMGL-supported districts in March 2012. This census also identified deaths of WRA that occurred during October 2010 – February 2012. All identified deaths of WRA were followed up with verbal autopsy interviews, which were used to classify causes of death in the baseline period. See Appendix C for results of the baseline census and a description of the methods used.
To monitor the results of SMGL Phase 1, Zambia set up a new community-based system of community key informants to track pregnancies and their outcomes. In this prospective system, community key informants set up records for each pregnant woman to track the location of her delivery, the status of the infant, and the status of the mother until the end of the 42-day postpartum period.
Logistic challenges limited the completeness of the data gathered, and only about one-third of the expected number of pregnancies were identified. The system identified too few deaths to produce a stable population-based measure of MMR in the SMGL-supported districts. Thus, for Zambia, the only findings on maternal mortality in this report are based on facility-based deaths.
5. The RAPID method identifies unreported maternal deaths in health facilities by reviewing all facility records relating to deaths among WRA and then identifying those that are pregnancy-related (Immpact, 2007).
11Maternal Mortality
Maternal Mortality in Uganda
District-wide Maternal Mortality
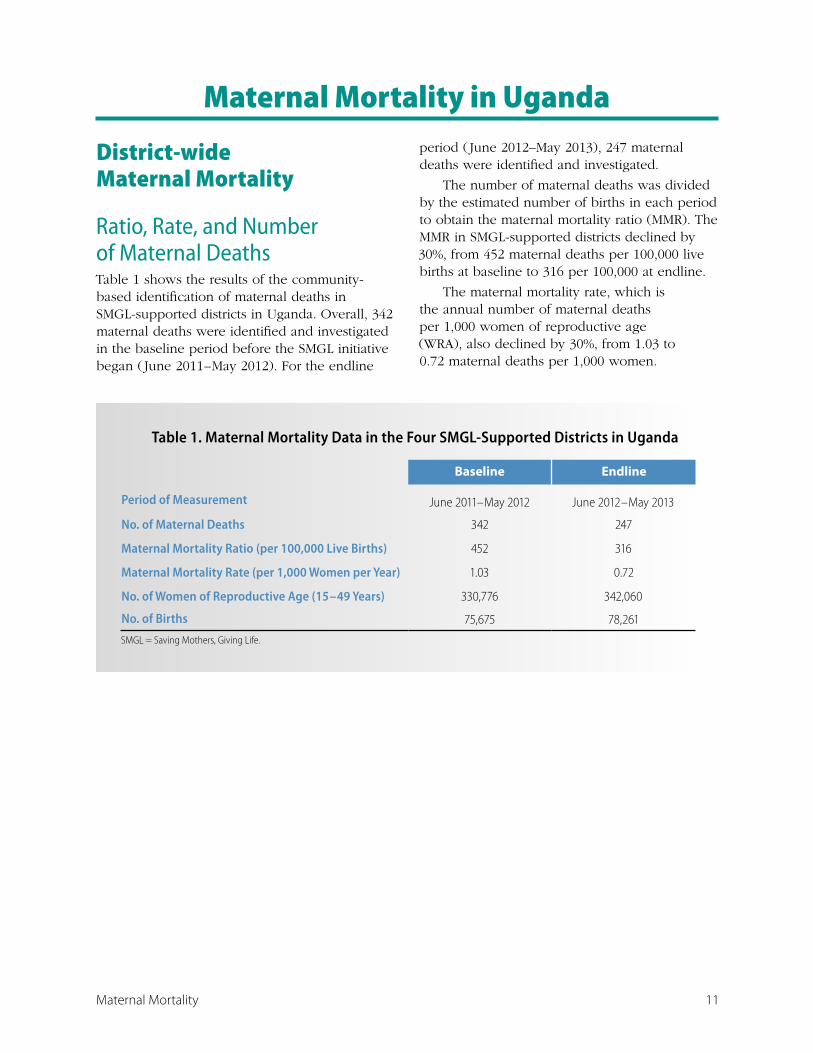
Ratio, Rate, and Number of Maternal DeathsTable 1 shows the results of the community-based identification of maternal deaths in SMGL-supported districts in Uganda. Overall, 342 maternal deaths were identified and investigated in the baseline period before the SMGL initiative began ( June 2011 – May 2012). For the endline
period ( June 2012–May 2013), 247 maternal deaths were identified and investigated.
The number of maternal deaths was divided by the estimated number of births in each period to obtain the maternal mortality ratio (MMR). The MMR in SMGL-supported districts declined by 30%, from 452 maternal deaths per 100,000 live births at baseline to 316 per 100,000 at endline.
The maternal mortality rate, which is the annual number of maternal deaths per 1,000 women of reproductive age (WRA), also declined by 30%, from 1.03 to 0.72 maternal deaths per 1,000 women.
Table 1. Maternal Mortality Data in the Four SMGL-Supported Districts in Uganda
Baseline Endline
Period of Measurement June 2011 – May 2012 June 2012 – May 2013
No. of Maternal Deaths 342 247
Maternal Mortality Ratio (per 100,000 Live Births) 452 316
Maternal Mortality Rate (per 1,000 Women per Year) 1.03 0.72
No. of Women of Reproductive Age (15 – 49 Years) 330,776 342,060
No. of Births 75,675 78,261
SMGL = Saving Mothers, Giving Life.
12 Maternal Mortality
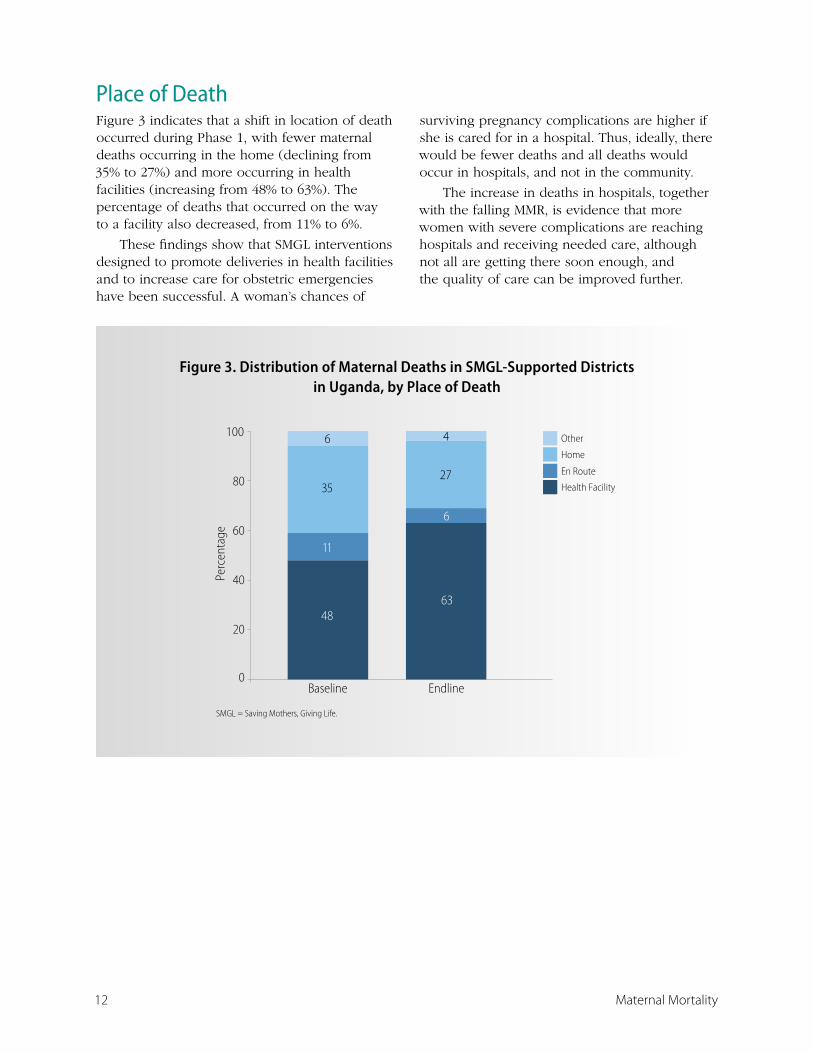
Place of DeathFigure 3 indicates that a shift in location of death occurred during Phase 1, with fewer maternal deaths occurring in the home (declining from 35% to 27%) and more occurring in health facilities (increasing from 48% to 63%). The percentage of deaths that occurred on the way to a facility also decreased, from 11% to 6%.
These findings show that SMGL interventions designed to promote deliveries in health facilities and to increase care for obstetric emergencies have been successful. A woman’s chances of
surviving pregnancy complications are higher if she is cared for in a hospital. Thus, ideally, there would be fewer deaths and all deaths would occur in hospitals, and not in the community.
The increase in deaths in hospitals, together with the falling MMR, is evidence that more women with severe complications are reaching hospitals and receiving needed care, although not all are getting there soon enough, and the quality of care can be improved further.
Figure 3. Distribution of Maternal Deaths in SMGL-Supported Districts in Uganda, by Place of Death Figure 3. Distribution of Maternal Deaths in SMGL-Supported Districts
in Uganda, by Place of Death
0
20
40
60
80
100
Baseline Endline
Perc
enta
ge
Other
Home
En Route
Health Facility3527
6 4
4863
11
6
SMGL = Saving Mothers, Giving Life.

13Maternal Mortality
Timing of Maternal Deaths Information collected by the verbal autopsies allows maternal deaths to be classified according to when they occurred. The MMR can thus be divided into subcategories based on the timing of death: during pregnancy; labor, delivery and less than 24 hours postpartum; and 1 – 42 days postpartum.
Figure 4 compares the MMR according to the timing of death between the baseline and endline periods. The focus of the SMGL initiative is on the 24 hours around labor and delivery, so it is not surprising that the maternal deaths during labor and delivery and postpartum showed large reductions:
� during labor, delivery and less than 24 hours postpartum MMR fell by 28% from 168 to 121 per 100,000 live births.
� during 1 – 42 days postpartum MMR fell by 40% from 222 to 134 per 100,000 live births.
The highest number of maternal deaths, at both baseline and endline, occurred 1 – 42 days after delivery. The MMR for deaths in this period had the sharpest decline. These deaths are often caused by complications suffered during labor and delivery, so it is not surprising that SMGL interventions had such an impact. The insignificant reduction in the MMR for maternal deaths during pregnancy (3%) is also not surprising given the focus of the SMGL initiative.
Figure 4. Maternal Mortality Ratiosa in SMGL-Supported Districts in Uganda, by Timing of Death Relative to Pregnancy, Before and After SMGL
Figure 4. Maternal Mortality Ratiosa in SMGL-Supported Districts in Uganda, by Timing of Death Relative to Pregnancy, Before and After SMGL
Baseline
Endline
MMR = maternal mortality ratio; SMGL = Saving Mothers, Giving Life. a Per 100,000 live births.
452
62
168
222
316
60
121 134
050
100
150200
250300
350400450500
MMR for All Maternal Deaths
MMR for Deaths in Pregnancy
MMR for Deaths in Labor, Delivery,
and <24 Hrs Postpartum
MMR for Deaths 1-42 Days
Postpartum
Mat
erna
l Dea
ths
per 1
00,0
00 L
ive
Birth
s

14 Maternal Mortality
Causes of Maternal DeathsSpecially trained doctors in the SMGL-supported districts reviewed and certified each maternal death that had a completed verbal autopsy. Underlying cause of death certification and coding were used to classify the causes of maternal deaths.
Figure 5 shows changes in cause-specific MMRs between baseline and endline. Direct obstetric mortality delined by 39% from 382 to 234 per 100,000 live births. An insignificant increase was reported in the MMR for indirect obstetric mortality, from 70 to 82 per 100,000 live births. These findings are consistent with the SMGL initiative’s focus on direct obstetric mortality during the period of labor and delivery.
All direct obstetric causes of maternal mortality declined during Phase 1. However, the largest reductions were for obstructed labor (including uterine rupture), sepsis, and hemorrhage. All of these causes are directly addressed by components of the SMGL
interventions. Reductions for the other causes of death were smaller and did not reach statistical significance. (See Table A, Appendix A).
Obstetric hemorrhage was the leading cause of maternal death at both baseline and endline in Uganda. However, deaths due to hemorrhage declined rapidly (43%) during Phase I of the SMGL initiative, suggesting that the increased access to and utilization of EmONC and the routine use of Active Management of the Third Stage of Labor (AMTSL) were effective.
Obstructed labor — including rupture of the uterus, a frequently fatal complication — was the second most common contributor to MMR, and the risk of dying from this cause showed the largest decline (54%). Mortality due to postpartum sepsis also declined significantly (48%), likely in part because of better management of obstructed labor.
Figure 5. Maternal Mortality Ratiosa in SMGL-Supported Districts in Uganda, by Cause of Death
Figure 5. Maternal Mortality Ratiosa in SMGL-Supported Districts in Uganda, by Cause of Death
Baseline
Endline
MMR = maternal mortality ratio; SMGL = Saving Mothers, Giving Life. a Per 100,000 live births.
Mat
erna
l Dea
ths
per 1
00,0
00 L
ive
Birth
s
382
70
128
7158 42 33 49
234
82 7333 45 36
17 31
0
50
100
150
200
250
300
350
400
450
MMR for Direct
Maternal Deaths
MMR for Indirect
Maternal Deaths
Hemorrhage Obstructed Labor
and Uterine Rupture
Preeclampsia and
Eclampsia
Unsafe Abortion
Postpartum Sepsis
Other Direct
Obstetric Causes
Cause of Death

15Maternal Mortality
Delays in Getting CareImmediate, skilled medical care can save the lives of women who develop obstetric complications. Delays in accessing life-saving obstetric care can result in death.
The verbal autopsy questionnaire was designed to collect data on how women make decisions about seeking care and the quality of care they receive during childbirth and obstetric emergencies. The “three delays model” is a widely used framework that can help identify important delays associated with three factors — seeking care, reaching care, and receiving timely care at a facility (Thaddeus and Maine, 1994). This framework can be used as a planning tool for the actions required at every level to prevent delays.
Data collected through verbal autopsies were used to look for patterns of decision making at individual and household levels and for factors that contribute to delayed access to adequate care. Data were also used to determine if delays occurred in the care provided to women after arrival at a facility.
The framework of the “three delays model” guided the design of the following SMGL interventions:
� Use VHTs to increase awareness of pregnancy complications and the need to seek obstetric care when complications arise.
� Create links between different levels of the health care system, including the community, and all levels of health facilities, from lower-level to higher-level facilities.
� Subsidize transportation vouchers for pregnant women to go to health facilities for labor and delivery.
� Create an effective district health system that provides high-quality EmONC by investing in infrastructure, equipment, supplies, and staff.
Figure 6 shows the change in the MMR between baseline and endline by whether a delay in obstetric care was reported in the verbal autopsy. The baseline RAMOS showed that a large proportion of the baseline MMR was associated with delayed decision making at home (27% of maternal deaths followed a delay in seeking care), reduced access to quality EmONC because of lack of transportation or other barriers (9% followed a delay in accessing care), and delayed obstetric care once a woman arrived at a health facility (21% followed a delay in receiving timely care).
Figure 6. Maternal Deathsa in SMGL-Supported Districts in Uganda, by Type of Delay Before Death
Figure 6. Maternal Deathsa in SMGL-Supported Districts in Uganda, by Type of Delay Before Death
SMGL = Saving Mothers, Giving Life. a Per 100,000 live births.
No DelayDelay in Receiving Timely CareDelay in Accessing CareDelay in Seeking Care
12266
41
16
95
54
194
180
0
50
100
150
200
250
300
350
400
450
500
Baseline Endline
Mat
erna
l Dea
ths p
er 1
00,0
00 L
ive
Birt
hs

16 Maternal Mortality
During Phase 1 of the SMGL initiative, substantial reductions were reported in the number of maternal deaths per 100,000 live births for all three of the major delays that can cause maternal death:
� The delay associated with recognizing a problem and seeking care decreased by 46%.
� The delay associated with accessing care declined by 61%.
� The delay in receiving care after reaching a facility declined by 43%.
Facility-Based Maternal MortalityThe facility-based MMR for Uganda declined by 35%, from 534 to 345 maternal deaths per 100,000 live births in health facilities. This decline took place at the same time that the number of facility deliveries increased
substantially (by 69%). The percentage of all births in the SMGL-supported districts that took place in facilities increased from 46% to 74%.
The methods used to identify maternal deaths in facilities in SMGL-supported districts for both Uganda and Zambia are described in more detail in the Maternal and Perinatal Outcomes in Health Facilities report. The denominator for facility-based MMR is the number of live births in the facility. Table 2 summarizes information for facilities in the four SMGL-supported districts in Uganda.
Table 2 also presents similar information for maternal deaths and live births that occurred in EmONC facilities. These facilities are referral centers and would be expected to receive women with more severe obstetric complications and to have higher MMRs than those reported for all facilities. The MMR for EmONC facilities declined by 24%, from 829 to 634 maternal deaths per 100,000 live births.
Table 2. Maternal Mortality Ratios (MMRs) in Health Facilities in SMGL-Supported Districts in Uganda, by Facility Type, at Baseline and Endline
All Facilities EmONC Facilities
Baseline Endline % Change Baseline Endline % Change
Facility MMR 534 345 -35% 829 634 -24%
Maternal Deaths 179 195 +9% 170 173 +2%
Facility Live Births 33,492 56,571 +69% 20,516 27,299 +33%
SMGL = Saving Mothers, Giving Life; EmONC = Emergency Obstetric and Newborn Care.
Baseline period is June 2011-May 2012. Endline period is June 2012-May 2013.

17Maternal Mortality
The facility-based data include information on cause of death for the direct obstetric complications that are responsible for most maternal deaths. Between the baseline and endline periods, the cause-specific MMR changed for deaths due to the following direct obstetric causes, all addressed by SMGL interventions (Figure 7):
� Deaths due to obstructed labor declined by 58%, from 72 to 30 per 100,000 live births.
� Deaths due to obstructed labor declined by 58%, from 72 to 30 per 100,000 live births.
� Deaths due to obstetric hemorrhage declined by 29% from 131 to 94 per 100,000.
These findings suggest that more women with complications received timely emergency obstetric care, and that the quality of care in these facilities improved. This is corroborated by improvements in met need for EmONC and reductions in facility-based case fatality rates. (See the Maternal and Perinatal Outcomes in Health Facilities report).
Although facility-based MMR data can be used to improve health planning and quality of care, this information should not be viewed as representative of MMRs for the districts as a whole. Facility-based MMRs may be higher or lower than those reported in the general population depending on the mix of patients (with more or fewer severe complications), the timeliness of medical care, the quality of the care, and the proportion of deliveries at facilities. Facility-based MMRs are also subject to selection bias because they include only women who sought obstetric care, accessed these services, and died after admission. These women may differ from those who die at home in terms of their causes of death; their social, economic, cultural, or behavioral characteristics; or their ability to access health services. In addition, facility-based maternal deaths only capture deaths of women while they are in the hospital, usually during short periods related to birth (a few days). They miss women who die at home after discharge within the first 42 days after childbirth, or during pregnancy.
Figure 7. Maternal Mortality Ratiosa for Direct Obstetric Causes in Health Facilities in SMGL-Supported Districts in Uganda, Before and After SMGL
32
35
32
46
30
94
30
63
75
45
72
131
0 20 40 60 80 100 120 140
Other direct causes
Complications of unsafe abortion
Maternal Mortality Ratio in Facilities
Postpartum sepsis
Preeclampsia and eclampsia
Obstructed labor and uterine rupture
Obstetric hemorrhage
SMGL = Saving Mothers, Giving Life.a Per 100,000 live births in facilities.
Baseline
Endline
Figure 7. Maternal Mortality Ratiosa for Direct Obstetric Causes in Health Facilities in SMGL-Supported Districts in Uganda, Before and After SMGL
18 Maternal Mortality
Maternal Mortality in Zambia
Facility-Based Maternal Mortality To monitor the results of SMGL Phase 1, Zambia set up a new community-based system of community key informants to track pregnancies through to completion. However, logistical problems with the system resulted in a far smaller number of completed forms for pregnancies that ended during the endline period ( June 2012 – May 2013) than the expected number of births in the four SMGL-supported districts.
Because the resulting endline data on district-wide mortality (all maternal deaths regardless of location) appear to be incomplete, this report presents only data on maternal deaths that occurred in health facilities.
The facility-based data serve as an indicator of change in maternal mortality for the four SMGL-supported districts in Zambia.
An endline census similar to the one used for the baseline period is planned for Phase 2 of SMGL in Zambia. This census should yield more complete data on changes during the first 2 years of the SMGL initiative.
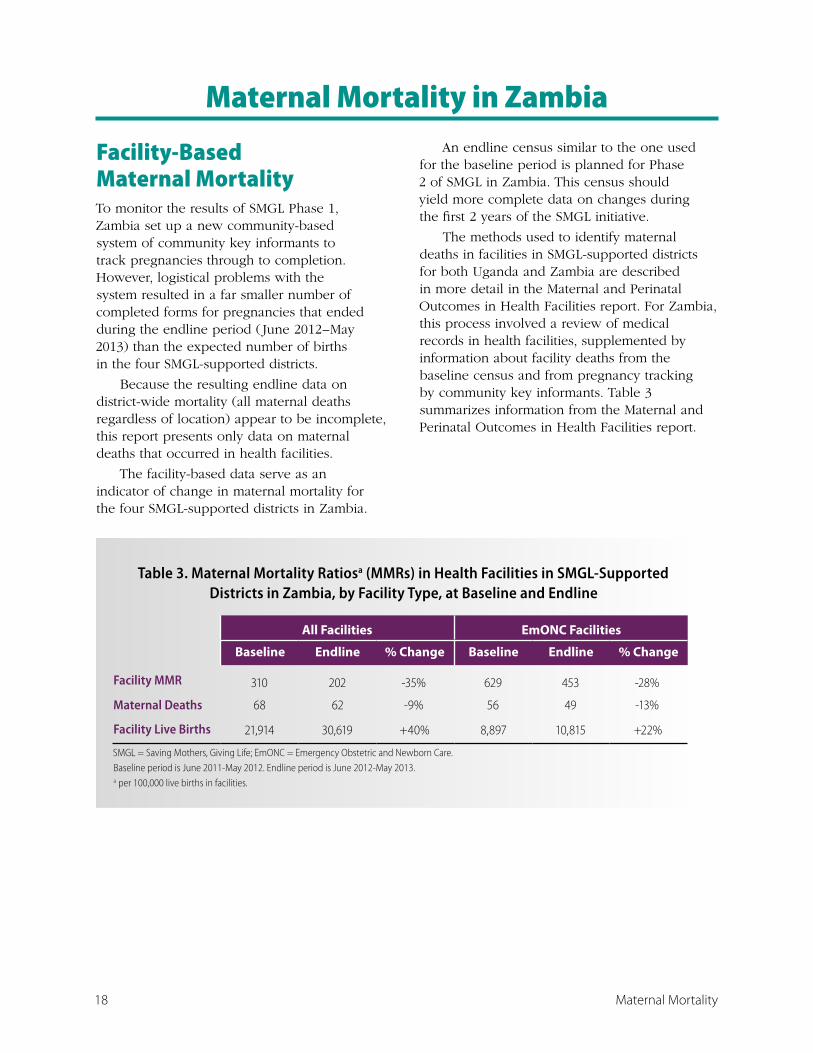
The methods used to identify maternal deaths in facilities in SMGL-supported districts for both Uganda and Zambia are described in more detail in the Maternal and Perinatal Outcomes in Health Facilities report. For Zambia, this process involved a review of medical records in health facilities, supplemented by information about facility deaths from the baseline census and from pregnancy tracking by community key informants. Table 3 summarizes information from the Maternal and Perinatal Outcomes in Health Facilities report.
Table 3. Maternal Mortality Ratiosa (MMRs) in Health Facilities in SMGL-Supported Districts in Zambia, by Facility Type, at Baseline and Endline
All Facilities EmONC Facilities
Baseline Endline % Change Baseline Endline % Change
Facility MMR 310 202 -35% 629 453 -28%
Maternal Deaths 68 62 -9% 56 49 -13%
Facility Live Births 21,914 30,619 +40% 8,897 10,815 +22%
SMGL = Saving Mothers, Giving Life; EmONC = Emergency Obstetric and Newborn Care.
Baseline period is June 2011-May 2012. Endline period is June 2012-May 2013. a per 100,000 live births in facilities.
19Maternal Mortality
The overall facility-based MMR for Zambia declined by 35%, from 310 to 202 maternal deaths per 100,000 live births. This decline took place at the same time that the number of live births taking place in these facilities increased by 40%.
Although information is lacking on the number of non-facility maternal deaths in the endline period, available data show that 84% of births occurred in health facilities, increasing from 63% at baseline.
At baseline, 70% of deaths occurred in facilities, and this percentage is likely to have increased at endline. Thus, the facility-based results suggest a decline in the overall level of maternal mortality across all four districts.
Table 3 also presents similar information for maternal deaths and live births that occurred in EmONC facilities. These facilities are referral centers and would be expected to receive women with more severe obstetric complications and to have higher MMRs than those for all facility deliveries in general. The MMR for EmONC facilities declined by 28%, from 629 to 453 maternal deaths per 100,000 live births.
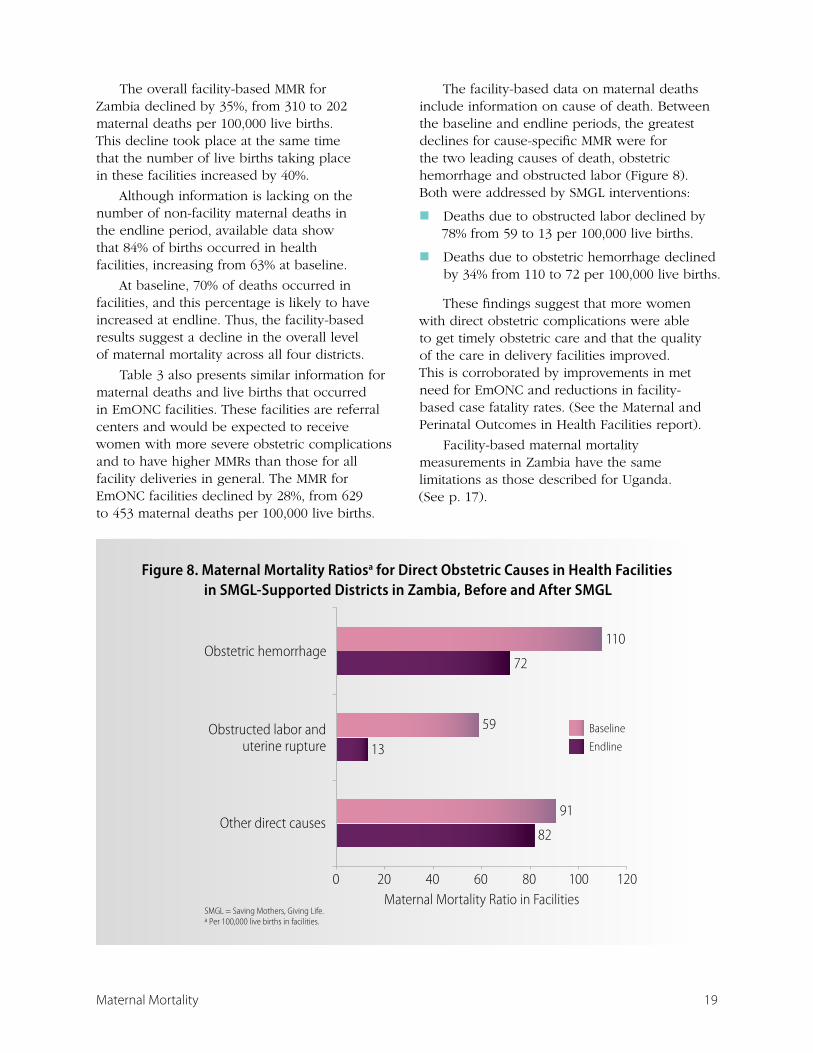
The facility-based data on maternal deaths include information on cause of death. Between the baseline and endline periods, the greatest declines for cause-specific MMR were for the two leading causes of death, obstetric hemorrhage and obstructed labor (Figure 8). Both were addressed by SMGL interventions:
� Deaths due to obstructed labor declined by 78% from 59 to 13 per 100,000 live births.
� Deaths due to obstetric hemorrhage declined by 34% from 110 to 72 per 100,000 live births.
These findings suggest that more women with direct obstetric complications were able to get timely obstetric care and that the quality of the care in delivery facilities improved. This is corroborated by improvements in met need for EmONC and reductions in facility-based case fatality rates. (See the Maternal and Perinatal Outcomes in Health Facilities report).
Facility-based maternal mortality measurements in Zambia have the same limitations as those described for Uganda. (See p. 17).
Figure 8. Maternal Mortality Ratiosa for Direct Obstetric Causes in Health Facilities in SMGL-Supported Districts in Zambia, Before and After SMGL
82
13
72
91
59
110
0 20 40 60 80 100 120
Other direct causes
Obstructed labor anduterine rupture
Obstetric hemorrhage
Maternal Mortality Ratio in FacilitiesSMGL = Saving Mothers, Giving Life.a Per 100,000 live births in facilities.
Baseline
Endline
Figure 8. Maternal Mortality Ratiosa for Direct Obstetric Causes in Health Facilities in SMGL-Supported Districts in Zambia, Before and After SMGL

20 Maternal Mortality
Conclusions SMGL eliminated many preventable maternal deaths in the eight pilot districts in Uganda and Zambia by strengthening health systems at the district level, increasing demand for health services, and making quality services accessible to all pregnant women. The magnitude of the decrease in maternal mortality in one year is unprecedented in Africa. It proves that an accelerated agenda to save mothers’ and newborns’ lives is possible and raises hopes toward reaching the maternal and child-related MDGs.
The SMGL initiative builds on existing maternal and newborn health strategies in Uganda and Zambia. It focuses on the reduction of the “three delays” — delay in seeking appropriate services; delay in reaching services; and delay in receiving timely, quality care at the facility — through targeted interventions at the district level:
� Opening and supporting health facilities that are capable of providing life-saving treatment to women with obstetric complications.
� Increasing awareness of and demand for maternal and newborn health services through outreach activities at the community level.
� Increasing access to quality maternal health services by improving communication and transportation systems.
� Improving the quality of maternal and newborn health services, including emergency care for pregnancy-related complications.
The Initiative’s emphasis is on promoting evidence-based approaches for saving lives during the most vulnerable period for mother and baby — labor, delivery, and the first 48 hours post-partum. It seeks to further integrate maternal and newborn
health services with HIV services (e.g., HIV counseling and testing and PMTCT services), and post-partum family planning.
The multifaceted approaches employed by SMGL were very effective. In Uganda, district-wide maternal mortality declined by 30% after the SMGL interventions were implemented. This decline was accomplished through significant reductions in maternal mortality specific to each of the “Three Delays”.
The decline in the overall MMR in Uganda was achieved primarily by reducing deaths from obstetric hemorrhage and obstructed labor, including uterine rupture. These causes accounted for 44% of the MMR at baseline and 33% at endline.
� Most deaths due to hemorrhage occur immediately after delivery. The 43% decline in the MMR due to obstetric hemorrhage may have been due in part to the reduction in all three types of delays and to the widespread use of AMTSL in facilities. (Use of AMTSL doubled during Phase 1 in CEmONC facilities. See Obstetric Care Services Access and Availability report).
� Maternal mortality due to obstructed labor, including uterine rupture, declined by 54%, primarily because of the increased availability of C-section in CEmONC facilities.
� Prevention of deaths due to obstructed labor and uterine rupture by reducing the delay in women seeking and accessing care, together with successful case management of obstructed labor and improved infection control at delivery, may also have contributed to the reductions in deaths from hemorrhage and postpartum sepsis.

21Maternal Mortality
The maternal mortality in health facilities in both Uganda and Zambia declined by 35%, i.e., from 534 to 345 maternal deaths per 100,000 live births in Uganda and from 310 to 202 maternal deaths per 100,000 live births in Zambia. Most of the decline was the result of a reduced risk of dying from direct obstetric complications. This finding is consistent with the reduction in the case fatality rate for major obstetric complications, which was achieved through SMGL interventions that specifically focused on the labor, delivery, and early postpartum period, when major obstetric complications are most likely to occur and are the most lethal.
The SMGL model demonstrates that maternal mortality is not an intractable problem, but rather one that can be effectively addressed when concerted evidence-based efforts are employed toward its reduction. The SMGL initiative’s strong emphasis on monitoring and evaluation allowed, for the first time in Uganda and Zambia, the direct examination of maternal death levels and the detection of large declines in the first year. It provided valuable insights about what worked, what did not, and the remaining gaps.

22 Maternal Mortality
References Immpact. Rapid ascertainment process for institutional deaths (RAPID). Module 4, Tool 2. In: Immpact Toolkit: A Guide and Tools for Maternal Mortality Program Assessment. Aberdeen, Scotland: University of Aberdeen; 2007.
Thaddeus S, Maine D. Too far to walk: maternal mortality in context. Soc Sci Med. 1994;38(8):1091-110.
Uganda Bureau of Statistics and ICF International Inc. Uganda Demographic and Health Survey 2011. Preliminary Report. Kampala, Uganda: Uganda Bureau of Statistics and Calverton, MD: ICF International Inc.; 2012.
World Health Organization. International Classification of Diseases (ICD), 10th Revision. Geneva, Switzerland: World Health Organization; 2010.
World Health Organization, United Nations Population Fund, UNICEF, Averting Maternal Death and Disability Program. Monitoring Emergency Obstetric Care: A Handbook. Geneva, Switzerland: World Health Organization; 2009. http://www.who.int/reproductivehealth/publications/monitoring/9789241547734/en/index.html. Accessed May 6, 2014.

Appendices

24 Maternal Mortality
Appendix A: Significance Level of Observed Changes in Maternal Mortality Ratios
The mortality data presented in this report for the SMGL-supported districts in Uganda and Zambia are not subject to sampling error, but may be affected by random variation. That is, the number of deaths that actually occurred can be considered as one possible result among many possible results that could have arisen under the same circumstances.
When the number of deaths is small, random variation tends to be relatively large. Rates and ratios that are based on a small number of deaths should be interpreted with caution. The random variation for the data presented here is quantified by assuming that variation in the number of deaths over time follows a Poisson distribution.
For example, if a maternal mortality ratio (MMR) is based on “D” deaths, then the standard error (SE) of that MMR can be calculated as the MMR divided by the square root of the number of deaths: [SE(MMR) = MMR/D1/2]. Thus, if an MMR of 400 maternal deaths per 100,000 live births is based on 100 deaths (and 25,000 births), then the standard error of this MMR would be 400/sqrt(100) = 40. The 95% confidence interval would then be between 400 – 2 × 40 and 400 + 2 × 40. In other words, 95% of the time, the MMR would be expected to fall somewhere between 320 and 480 if no change occurred in the underlying circumstances of the observed population.
It is important to determine whether a significant change in the underlying circumstances of the population occurred between the baseline and endline periods of the initiative. In order to conclude that a significant change has occurred, the observed change needs to be larger than could be accounted for by random variability.
A z-statistic was used to calculate the Pvalue of the difference between the baseline and endline MMRs. Table A presents the MMRs
and standard errors for different causes of death during the baseline and endline periods of the SMGL initiative in Uganda and Zambia. It also presents the differences between the baseline and endline MMRs, the standard errors of the differences, the z-statistics, and the significance level of the observed change for the MMRs discussed in this report.
In Uganda, the observed change in the district-wide MMR from 452 to 316 maternal deaths per 100,000 live births was highly significant, as were the changes in MMR due to obstetric hemorrhage and obstructed labor and uterine rupture (P < .01). The change in MMR due to postpartum sepsis was also significant (P < .05).
The observed change in the facility-based MMR from 534 to 345 per 100,000 facility births was highly significant (P < .01). The changes in MMR in facilities due to obstructed labor and uterine rupture and postpartum sepsis were also significant (P < .05).
In Zambia, the observed change in the facility-based MMR from 310 to 202 per 100,000 facility births was significant (P < .05), as was the change due to obstructed labor and uterine rupture (P < .01).
The z-statistic was calculated as the difference between the baseline and endline values divided by the standard error of the difference:
z = MMR1 – MMR
2 /[SE(MMR
1)2 + SE(MMR
2)2]1/2
The standard error of the difference is calculated as the square root of the sum of the squares of the standard errors of the baseline and endline MMRs.

25Maternal Mortality
Table A. Changes in Maternal Mortality Ratios (MMRs) in SMGL-Supported Districts in Uganda and Zambia
Baseline Endline Endline (E) – Baseline (B) Z-Statistic
MMR SE(MMR) MMR SE(MMR)MMR(E) – MMR(B)
SE[MMR(E) – MMR(B)]
Sig
UGANDA
District-wide
All Maternal Deaths 452 24.4 316 20.1 -136 31.6 4.31 **
Deaths by Cause
Obstetric Hemorrhage 128 13.0 73 9.7 -55 16.2 3.40 **
Obstructed Labor and Uterine Rupture
71 9.7 33 6.5 -38 11.6 3.26 **
Preeclampsia and Eclampsia
58 8.7 45 7.6 -13 11.6 1.12
Postpartum Sepsis 33 6.6 17 4.7 -16 8.1 1.98 *
Complications of Abortion
42 7.4 36 6.8 -6 10.1 0.60
Other Direct Causes 49 8.1 31 6.3 -18 10.2 1.76
Indirect Causes 70 9.6 82 10.2 12 14.0 0.85
Facility-Based
All Maternal Deaths 534 39.9 345 24.7 -190 47.0 4.04 **
Deaths by Cause
Obstetric Hemorrhage 131 19.7 94 12.9 -37 23.6 1.57
Obstructed Labor and Uterine Rupture
72 14.7 30 7.3 -42 16.4 2.56 *
Preeclampsia and Eclampsia
45 11.6 46 9.0 1 14.7 0.07
Postpartum Sepsis 75 15.0 32 7.5 -43 16.8 2.56 *
Complications of Abortion
63 13.7 35 7.9 -28 15.8 1.77
Other Direct Causes 30 9.5 32 7.5 2 12.1 0.17
Indirect Causes 119 18.8 76 11.6 -43 22.1 1.95
ZAMBIA
Facility-Based
All Maternal Deaths 310 37.6 202 25.7 -108 45.6 2.37 *
Deaths by Cause
Obstetric Hemorrhage 110 22.5 72 15.3 -38 27.2 1.40
Obstructed Labor and Uterine Rupture
59 16.4 13 6.5 -46 17.6 2.61 **
Other Direct Causes 91 20.3 82 16.4 -9 26.1 0.34
Indirect Causes 50 15.1 36 10.8 -14 18.6 0.75
SMGL = Saving Mothers, Giving Life; SE = standard error; Sig = significance level.
Asterisks indicate significance levels calculated with a z-statistic as follows: ** = P <.01, * = P <.05.

26 Maternal Mortality
Appendix B: Methods Used to Calculate District-wide Maternal Mortality in Uganda
The SMGL initiative in Uganda built on the existing data-collection infrastructure of Village Health Teams (VHTs) in the four SMGL-supported districts. The SMGL initiative trained one volunteer on each team to keep monthly records of any deaths of women of reproductive age (WRA). This information was reported to the parish level and then passed along to the subcounty, subdistrict, and then to the district health office.
Over 5 months, 4,076 volunteers were trained on how to recognize the danger signs of pregnancy, the importance of antenatal care, and the need to get women to facilities for deliveries. In addition to being a core component of maternal mortality surveillance, the VHTs became an integral part of the link between the SMGL initiative and the villages throughout the four SMGL-supported districts.
To obtain baseline information on maternal deaths, one member of the VHT visited each household in his or her village to find out whether any women had died during the baseline period ( June 2011–May 2012). The resulting list contained details on 1,364 WRA (aged 15-49) who had died during this period. Health and development workers at the parish and subcounty level then visited the homes of all 1,364 women with a one-page screening tool to identify any women who were pregnant at the time of their death or in the 3 months before their death.
The SMGL initiative then trained verbal autopsy interviewers to collect more information about these deaths. Ten two-person verbal autopsy teams, one for each health subdistrict, visited the identified homes and interviewed family members about the circumstances of the deaths.
Once the SMGL interventions began in June 2012, the monitoring switched from a retrospective to a prospective approach. When a WRA died in a village, the VHT reported information about the death, and a verbal autopsy team was assigned to collect follow-up information. This surveillance by VHTs was managed by two SMGL partners, the Baylor Children’s Foundation Uganda and the Uganda Infectious Disease Institute.
During the shift from retrospective to prospective surveillance, concerns were raised that VHTs and others in the data-collection process were focusing increasingly on identifying pregnancy-associated deaths and neglecting surveillance of all deaths of WRA. Concerns were also raised about the population estimates that were being used for the SMGL-supported districts. These estimates were based on 2007 projections, which were based on Uganda’s 2002 census and calculated before important declines in fertility were reported in the 2011 Uganda Demographic and Health Survey (2011 UDHS).1
Given the concerns about undercounting of deaths of WRA, possible omission of maternal deaths, and lack of current population and birth estimates, the SMGL-supported staff decided to count all living WRA in the four SMGL-supported districts, as well as recount all WRA who had died. This count was conducted in 3,594 villages in October 2013 and resulted in a new retrospective list of all deaths of WRA during the intervention period (since June 2012).
This list was then compared with the list of deaths identified prospectively by the VHTs. Deaths not previously identified were screened
1. Uganda Bureau of Statistics and ICF International Inc. Uganda Demographic and Health Survey 2011. Preliminary Report. Kampala, Uganda: Uganda Bureau of Statistics and Calverton, MD: ICF International Inc.; 2012.

27Maternal Mortality
to determine if the woman had died during pregnancy or within 3 months of the completion of pregnancy, and verbal autopsies were conducted for all pregnancy-associated deaths.
For the endline period, 1,502 deaths of WRA were identified and investigated. This slightly higher count (compared with 1,364 at baseline) suggests that some undercounting occurred at baseline as the numbers should be similar. This possible undercount of WRA deaths at baseline is also suggested by estimates of the proportion of maternal deaths to females aged 15 – 49 years, as well as by the mortality rate of WRA.
Births that occurred during baseline and endline were estimated by categorizing the numbers of living women into 5-year age groups and multiplying by age-specific fertility rates (ASFR) from the 2011 UDHS. Since the SMGL-supported districts are predominantly rural,
the rural ASFRs from the UDHS were used to estimate births in the population. Table B compares the maternal mortality ratios (MMRs) at baseline and endline for the SMGL-supported districts to the nationwide estimate from the 2011 UDHS. The national value from the 2011 UDHS of 438 is close to the baseline value of 452 for the four SMGL-supported districts.
Table B also compares other indicators that are related to the MMR. The endline value of the proportion of maternal deaths to females aged 15 – 49 years is similar to the data collected by the 2011 UDHS, while the baseline value is considerably higher. The 2011 UDHS estimated higher all-cause mortality for WRA and a higher general fertility rate than were found in the SMGL-supported districts.
Table B. Comparison of Estimates from the 2011 Uganda Demographic and Health Survey (2011 UDHS) and Data Collected at
Baseline and Endline in the SMGL-Supported Districts
Data Source
Proportion of All Deaths to
Females Aged 15 – 49 Years (WRA) that
were Maternal Deaths
WRA Mortality Rate
(Deaths per 1,000 Women, Aged 15 – 49
Years)
Maternal Mortality Rate
(Deaths per 1,000 Women Aged 15 – 49
Years)
General Fertility Rate
(Annual Births per Woman for Women Aged 15 – 49 Years)
Maternal Mortality Ratio
(Deaths per 100,000
Live Births)
2011 UDHSa0.181 5.12 .93 .212 438
SMGL Baseline .262 3.93 1.03 .193 452
SMGL Endline .174 4.12 0.72 .193 316
SMGL = Saving Mothers, Giving Life.a National estimates from mid-2004 to mid-2011.

28 Maternal Mortality
Appendix C: Baseline Census and Maternal Mortality Estimates for Zambia
In Zambia, census methodology was used to conduct a baseline study to document the level of maternal mortality before introducing the SMGL interventions. However, a similar endline study has not been conducted, and comparative endline data are not available. This appendix summarizes findings from Zambia’s baseline census of the four
SMGL-supported districts in March 2012 and follow-up verbal autopsy interviews.
The baseline estimate of the maternal mortality ratio (MMR) is 505 maternal deaths per 100,000 live births during March 2011 – February 2012 (Table C.1). See the “Methods Used to Calculate Baseline Maternal Mortality Estimates” section for more information.
Table C.1. Estimates of Key Indicators in SMGL-Supported Districts in Zambia at Baseline, March 2011–February 2012
Indicators Baseline
Maternal Mortality Ratio (per 100,000 Live Births) 505
No. of Maternal Deaths 195a
Maternal Mortality Rate (per 1,000 Women per Year) 1.01
Mortality Rate for WRAb (per 1,000 Women per Year) 7.56
No. of WRA 193,515
No. of Deaths of WRA 1,463
No. of Births 38,509
SMGL = Saving Mothers, Giving Life.a Estimated as 13.3% of the total number of deaths to women of reproductive age, which is the cause-specific mortality fraction obtained from the verbal autopsies.b Women of reproductive age, defined as aged 15 – 49 years.

29Maternal Mortality
Place of Death Verbal autopsy interviews provided more detail on maternal deaths at baseline. These interviews found that 22.0% of maternal deaths took place in the home, 50.5% took place in hospitals, and 19.8% took place in other health facilities (Table C.2). Thus at baseline, an estimated 70.3% of births took place in facilities.
Table C.2. Distribution of Maternal Deaths in SMGL-Supported Districts
in Zambia, by Place of Death
Maternal Deaths (N = 91) by Place of Death
Home 22.0%
Hospital 50.5%
Other Institutions
19.8%
Other Unknown 7.7%
TOTAL 100.0%
SMGL = Saving Mothers, Giving Life.
Causes of Maternal DeathsVerbal autopsies conducted in the baseline period revealed that 70% of maternal deaths in the SMGL-supported districts in Zambia were due to direct causes (Table C.3). Among these, the most significant was obstetric hemorrhage, which caused more than one-quarter (27.5%) of maternal deaths during the baseline period. Postpartum sepsis (infection) was the second most frequent cause (9.9%), followed by pregnancy-induced hypertension (8.8%). Obstructed labor was the cause of 6.6% of maternal deaths and 5.5% were related to unsafe abortion.
Table C.3. Distribution of Maternal Deaths in SMGL-Supported Districts in Zambia,
by Cause of Death
Maternal Deaths (N = 91) by Cause of Death
Obstetric Hemorrhage 27.5%
Postpartum Sepsis 9.9%
Pregancy-Induced Hypertension
8.8%
Obstructed Labor 6.6%
Unsafe Abortion 5.5%
Other Obstetric Causes 2.2%
Other Obstetric Unspecified 9.9%
Indirect Causes 29.7%
TOTAL 100.0%
SMGL = Saving Mothers, Giving Life.
Timing of Maternal Deaths Verbal autopsies indicated that the largest percentage of maternal deaths in the baseline period occurred 1–42 days after pregnancy ended (42.9%). Another 29.7% occurred either during labor (undelivered) or within 24 hours after the pregnancy ended. About one of four maternal deaths (27.4%) occurred during pregnancy, before the onset of labor.
Table C.4. Distribution of Maternal Deaths in SMGL-Supported Districts in Zambia,
by Timing Relative to Pregnancy
Maternal Deaths (N = 91) by Timing of Death
During Pregnancy 27.4%
During Labor Undelivered 8.8%
<24 Hours After Pregnancy Ended 20.9%
1 – 7 Days After Pregnancy Ended 23.1%
8 – 42 Days After Pregnancy Ended 19.8%
TOTAL 100.0%
SMGL = Saving Mothers, Giving Life.

30 Maternal Mortality
Methods Used to Calculate Baseline Maternal Mortality EstimatesA census of the four SMGL-supported districts was conducted in March 2012. In addition to providing population data by age and sex, it identified deaths that had occurred since October 2010. Households in which women of reproductive age (WRA, defined as aged 15–49 years) had died were followed up with verbal autopsy interviews to determine cause of death.
For the census, 149,966 residential households were interviewed, and 180,384 WRA were identified. Among these households, 11,490 deaths were reported, and 879 of these deaths were deaths of WRA that occurred during the 12-month period preceding the census (March 2011–February 2012). The result is an unadjusted all-cause mortality rate for WRA of 4.87 deaths per 1,000 women aged 15–49 years. This rate is considerably lower than estimates from other sources.
Adult mortality estimates that are based on retrospective reports of deaths are acknowledged to be subject to systematic reporting errors. A procedure called the General Growth Balance Method can be used to detect and correct for this type of systematic misreporting. This method is described in Measuring Maternal Mortality from a Census: Guidelines for Potential Users.1
When this method was applied to the data collected by the census of the SMGL-supported districts for all residents and all deaths, it estimated that the number of WRA should be adjusted up by a factor of 1.071, which yielded a count of 193,515 WRA instead of 180,384. It also estimated that the number of deaths of WRA in the 12-month baseline period should be adjusted up by a factor of 1.665, which yielded a count
of 1,463 deaths instead of 879. The result is an adjusted all-cause mortality rate for WRA of 7.56 deaths per 1,000 women aged 15–49 years.
Seventy interviewers were trained to administer the verbal autopsy questionnaire in May 2012. During June–December 2012, they completed interviews for 1,101 deaths, but only 682 were for deaths of WRA that occurred during October 2010–February 2012. On the basis of the verbal autopsy interviews, 91 of the 682 deaths (13.3%) were classified as maternal deaths, from either direct or indirect causes. Combining the estimated 13.3% of deaths of WRA classified as maternal with the all-cause WRA mortality estimate of 7.56 deaths per 1,000 yields an estimated maternal mortality rate of 1.01 maternal deaths per 1,000 WRA.
The maternal mortality rate and the general fertility rate (GFR) can be used to calculate the MMR for the SMGL-supported districts in Zambia as follows:
MMRatio = 100 x MMrate/GFR
The SMGL census yielded an estimated GFR of .141 annual births per woman during March 2011–February 2012, which corresponds to a total fertility rate (TFR) of 4.5. The estimated GFR for rural Zambia in the 2010 census was .199 (corresponding to a TFR of 7.0).
Since the SMGL-supported districts are predominantly rural, the rural estimate of .199 from the 2010 census was used, yielding an MMR of 505 maternal deaths per 100,000 live births.2 This GFR also gives an adjusted number of 38,509 births for the reference period, instead of the 25,488 counted in the SMGL census.
Table C.5 shows the different estimates for maternal mortality in Zambia from different sources. For example, the proportion of maternal deaths to females (PMDF) of .133 identified
1. Hill K, Stanton C, Gupta N. Measuring Maternal Mortality from a Census: Guidelines for Potential Users. MEASURE Evaluation Manual Series, No. 4. Chapel Hill, NC: Carolina Population Center, University of North Carolina at Chapel Hill; 2001.
2. If the GFR of .141 had been used, the implied MMR would have been 716 per 100,000. Assuming that the ratio of WRA to population is .22, the GFR of .141 corresponds to a crude birth rate (CBR) of .031 births per person while GFR of .199 corresponds to CBR of .044, which is much closer to external estimates of the CBR.

31Maternal Mortality
from the verbal autopsies used as part of the SMGL census is higher than the PMDF estimated from other sources, which are all based on a few simple questions in a census or survey. The adjusted WRA mortality rate of 7.56 is lower than the reproductive age mortality rate from
other sources, indicating that the adjustment of the number of all-cause deaths by 1.67 is a moderate adjustment when compared with other sources. The assumed GFR of .199 is generally consistent with values from other sources.
Table C.5. Recent National Estimates of Proportion of Maternal Deaths to Females (PMDF), Maternal Mortality Rate, and Maternal Mortality Ratio in Zambia
Data Source
Proportion of All Deaths to
Females Aged 15 – 49 Years (WRA) that
were Maternal Deaths
WRA Mortality Rate (Deaths
per 1,000 Women Aged 15 – 49 Years)
Maternal Mortality Rate
(Deaths per 1,000 Women Aged 15 – 49
Years)
General Fertility Rate
(Annual Births per Woman for Women Aged 15 – 49 Years)
Maternal Mortality
Ratio (Deaths per
100,000 Live Births)
2010 Census National .093 9.26 .86 .178 483
2010 Census Urban Areas .067 9.70 .65 .151 428
2010 Census Rural Areas .118 8.72 1.03 .199 517
DHS (2000–2007) .089 13.21 1.17 .198 591
UN Report 2010a .091 10.02 .91 .207 440
DHS = Demographic and Health Survey; UN = United Nations; WRA = Women of Reproductive Age. a Trends in Maternal Mortality 1990 to 2010: WHO, UNICEF, UNFPA and The World Bank Estimate, World Health Organization, Geneva. 2012.

Notes:


For more information please contact:Centers for Disease Control and Prevention
Division of Reproductive Health, Mailstop F-741600 Clifton Road NE, Atlanta, GA 30329-4027
Telephone: 1-800-CDC-INFO (232-4636) / TTY: 1-888-232-6348E-mail: [email protected]
Web: www.cdc.gov
Photographs by Riccardo Gangale, 2013