savings plummet – we’re in denial - exceptional bearletter... · savings plummet – we’re in...
TRANSCRIPT

March 19, 2011
Savings plummet – we’re in Denial
So how’s the average American doing these days? With all that’s going on in the world
including serial revolutions in the Arab world and natural disasters in Japan, our focus
has been diverted away from home. From the way Americans have been shopping
lately you would think the economy were booming, with record retail sales for February
after a banner holiday season.
Yet we know very well the economy is not booming, gas prices are up, real estate
continues sliding and unemployment remains far too high for recovery. The latest
Michigan Consumer Sentiment index for March plunged to 68 – far below consensus,
and only four points above its post-Lehman low. Rather than a blip, it confirms the
results from the Gallop poll last week showing consumer sentiment had turned down
sharply.
So are consumers going shopping to forget their troubles, or are they maxing out their
credit cards in preparation to declare bankruptcy? A 5% increase in consumer credit,
the first since the credit crunch, would tend to substantiate the latter.
However looking a little closer at the data it appears that Americans have begun
dissaving. After the crisis, the savings rate shot up, but recently things have gone the
other way. For one, there was a $55bn drop in consumer savings since February.

Indicative that consumers are back to spending, counting on the recovery to bail them
out. Why deprive yourself? Recovery is just around the corner…Of course consumers
have gotten carried away banking on a mirage.
From our own experience we recently sent out a letter to former Exceptional Bear
subscribers explaining in very simple terms that every Bear Market must dip twice, since
the simplest correction consists of an a-b-c, which includes two dips, in waves a and c,
with an intervening Bear Market Rally in wave b. Without the final c, the correction is not
over, and neither is this Bear Market. This is simple and straight forward, something an
eighth-grader should be able to grasp, yet not a single “light” appeared to go on in any
of these who read it. Many of them were around for our record-breaking performance in
2008, before Fed manipulation.
After March 2009, the Fed’s distortions made it more difficult to forecast with Elliott – of
course markets are not supposed to be manipulated, and while the they simply thought I
had “lost my touch”. One former subscriber even became vehemently angry, having put
his full faith in Bernanke as the economy’s savior, accused me of malicious slander and
sour grapes. Like those on a shopping spree, it would appear that most are in denial,
hoping and praying this “fairy tale recovery” will play out, as the entire “group think herd”
supports the notion. Once they wake up it to the reality it will be too late. That’s what
makes a Market Crash, the point when the masses wake up to reality all at once,
For the Market Crash is to do its job, it could not happen any other way. It must catch
the vast majority of investors fully invested by surprise, after all exits have been barred,
so as to destroy massive amounts of wealth, and thereby undo the excesses of the
past, especially this entire “stimulus” foolishness, so that recovery can begin in earnest.
Joseph Stiglitz, the 2001 Nobel Laureate in Economics, notes in Barron’s this week that
we were supposed to learn from Japan’s lost decades, instead we have replicated
them.

Supercycle Transitions
As I showed you recently, when there’s a degree of trend change the 5th of the (I)st and
the 5th of the (III)rd and are the only impulse waves that actually unfold in the higher,
Supercycle degree. While in Bear Markets, it’s only the final corrective wave, usually C
of (II) & (IV) that actually unfolds at Supercycle degree.
While log and semi-log charts distort the magnitude of price appreciation, the final
segment of Supercycle Wave (III) in the S&P from the point after the Supercycle
Transition to the 2000 Market top was ~1100%, eleven times as long, measured on the
perpendicular, as everything that came before it. [(1550-128)/128 = ~11] The
proportions become rationalized when you realize that at the end of 1974 the S&P was
still at ~59, and ten years later at year-end 1984 it was at ~128, while the market tops in
2000 and 2007 were at ~ S&P 1550.
Figure 1

You can match the Dow chart above in semi-log scale with the S&P below in arithmetic
scale at S&P 300, to gauge the distortions inherent in log & semi-log calibrated charts.
The chart below shows the progressive steps down in the previous 4th waves, the next
of these is at 300, wave (iv) of the Diag II in figure 1 and below just barely visible to the
far left in figure 2.
Figure 2
The Structure of Supercycle Wave (IV)
Supercycle Wave (II), which included the Great Depression, was a complex, sharp
structure, as we learned only recently thanks to the work of Smithers & Co. on
valuations, began in 1909. R.N. Elliott and Robert Prechter have always counted

Supercycle Wave (II) as a simple A-B-C correction from 1929 to 1932, of course they
erroneously labeled it Supercycle Wave (IV), and the 1929 top was mislabeled
Supercycle Wave (III). Frankly this explains why Prechter’s forecasts were 20 years
early and nearly 10,000 S&P points short of the March 2000 Supercycle Wave (III)
market top, and why he’s been counting at Grand Supercycle degree since the 1987
crash.
Figure 3
Complex is the opposite of simple, the A wave was a 5-wave Diag II, and the B wave
made a new high, then by alternation, one of Elliott’s guidelines, Supercycle Wave (IV)
for the S&P 500 should be simple & sideways. Simple means A-B-C, while sideways
means no new high. As you see in figure 2, although the S&P has kissed the 2000 high
of ~1550 twice, it has failed to go much higher. What’s more, every Supercycle degree

Bear Market contains at least one Crash, all that’s left of Supercycle Wave (IV) is the C
wave. With two huge Diag II’s to indicate the beginning of a long move down, followed
by the Supercycle Transition that kicks everything up a degree of trend, back up to
Supercycle, what follows will likely be ten times the magnitude as anything since 2000,
making the Crash ahead the “Mother of all Crashes”. Another of Elliott’s guidelines
indicates that Diag IIs are always retraced, once the upside completes; the lowest is
shown in figure 3 in ~ 1950, just before the start of the long wave 3 at ~ Dow 175, or
~S&P 19.
From another perspective, let’s take a look at the Diag IIs. The longest bull market in
history started out with two Diag IIs as you saw in figure 1. Notice once again we have
two back to back Diag IIs in the current structure, while the 1929 crash in figure 4 shows
a total absence of Diag IIs. Therefore this Crash must far exceed the 1929 Crash since
it will occur after the Supercycle Transition, and two very large Diag IIs.
Figure 4

Charts
As you see above the Daily S&P is on the way up to wave ii, however there’s still a pull
from the upper most Diag II which wants to be retraced, a little manipulation is all it
would take. We can count on all-out manipulation, so S&P 1425 is all but assured in b of
the transition back down.

In the hourly magnification below you see there’s one more candle required to complete
wave (iv) of the Diag > followed by an a-b transition required after each Diag >, before
the upside gets back under way.
In the VIX, a-b jumped the gun so to speak, as the Diag > confirmed it was a false start.
It must now drop back to the area of 15.50 to fill in the gap before the upside continues.
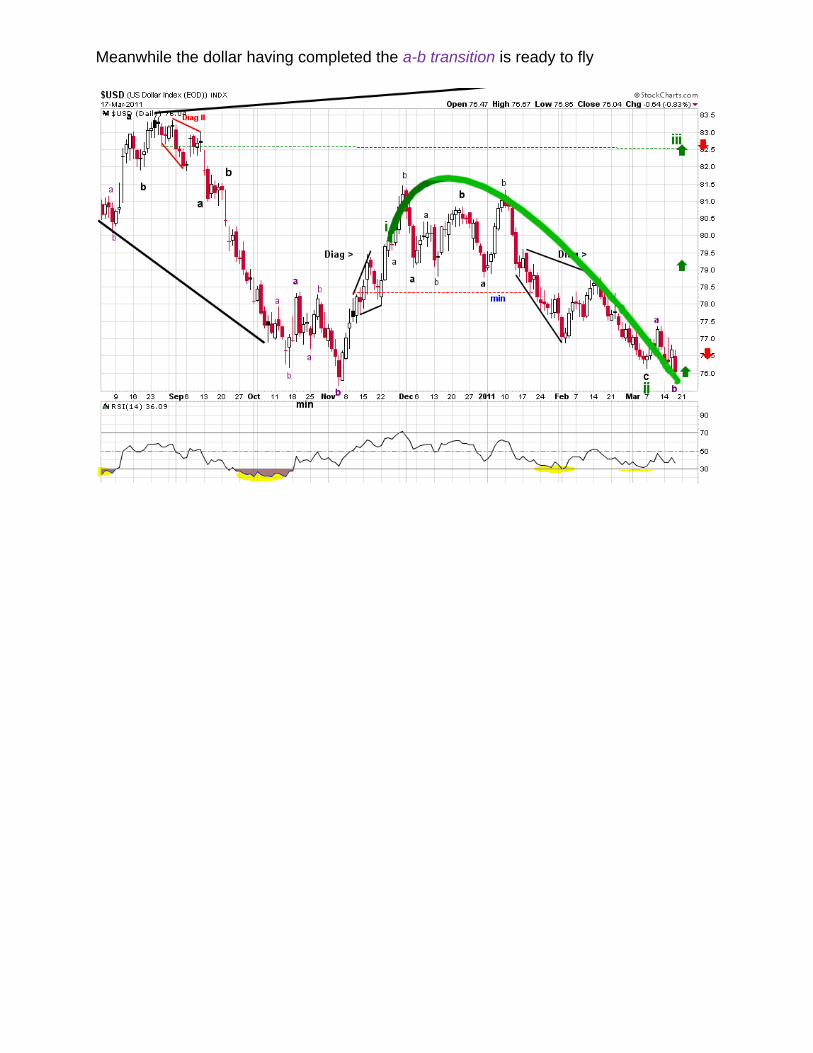
Meanwhile the dollar having completed the a-b transition is ready to fly

TMF above is our long-term holding, we are only waiting for it to drop back to the red
dashed line to sell the inverse bonds and go back into the long bonds, which we expect
will surge when the market begins collapsing. Notice here too a Supercycle Transition
is taking place, meaning the c wave to complete 2 will be of the same degree as bonds
in November – December 2008 when they spiked up and peaked to new highs. We
expect a double top in bonds, this one slightly exceeding the previous.

Finally here is where we are in the hourly inverse bonds below, likely tracing a Diag > to
indicate a terminal move to the upside. A failure indicates the downside was overdone
and the upside therefore should be swift and rewarding. As these climb, long bonds
drop back, as interest rates creep back up concurrent with upside correction in stocks.
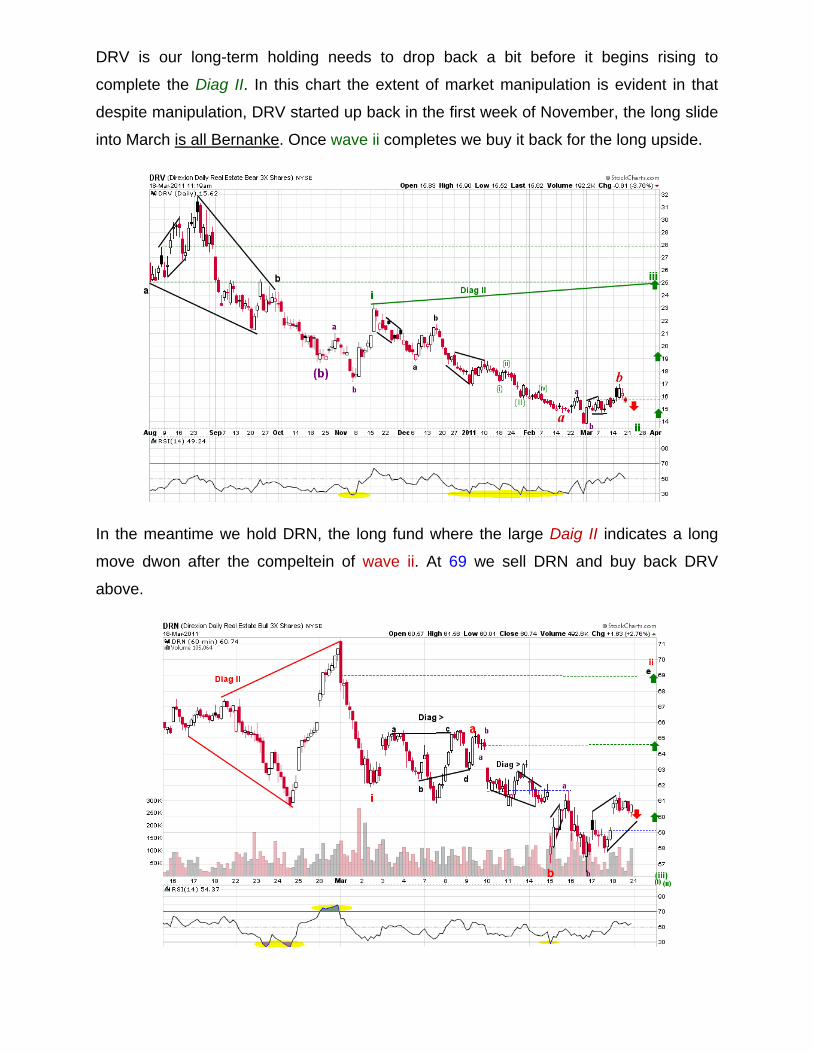
DRV is our long-term holding needs to drop back a bit before it begins rising to
complete the Diag II. In this chart the extent of market manipulation is evident in that
despite manipulation, DRV started up back in the first week of November, the long slide
into March is all Bernanke. Once wave ii completes we buy it back for the long upside.
In the meantime we hold DRN, the long fund where the large Daig II indicates a long
move dwon after the compeltein of wave ii. At 69 we sell DRN and buy back DRV
above.

Similar to the DRV above, EDZ the inverse emerginig market fund began to pop in
November 2010, only to be nailed back down, once wave ii completes, we go back into
the inverse fund below… after accounting for the high of 1425 in the SPX of course.
As EDZ drops, EDC rises and we expect to sell all near 38, as shown below, and go
back into EDZ above.

FAZ is our long-term inverse holding, which we are out of temproarily as we wait for it to
drop back. As you see instead of wave i of a Daig II as in the others above, FAZ has an
a-b and only bottomed in late February. Meanwhile our curreny holding is FAS, the long
fund below, which we plan to sell just above 34, and go back into FAZ.

Friday’s allocation remains unchanged for Monday’s opening.
Best regards,
Eduardo Mirahyes