savious m. mkhize
TRANSCRIPT

Impacts and Solutions on Vehicle to Grid (V2G) Infrastructure
Savious M. Mkhize
211521040
A thesis submitted tothe University of KwaZulu-Natal,
College of Agriculture, Engineering and Science,in partial fulfillment of the requirements for the degree of
Master of Science
Supervisor: Professor D G Dorrell
School of Engineering
University of KwaZulu-Natal
June 2019
Copyright © 2019 Savious M. Mkhize
All Rights Reserved


I, Savious M. Mkhize , declare that:
(i) The research reported in this thesis, except where otherwise indicated, is my original re-search.
(ii) This thesis has not been submitted for any degree or examination at any other university.
(iii) This thesis does not contain other persons’ data, pictures, graphs or other information, unlessspecifically acknowledged as being sourced from other persons.
(iv) This thesis does not contain other persons’ writing, unless specifically acknowledged asbeing sourced from other researchers. Where other written sources have been quoted, then:
a) their words have been re-written but the general information attributed to them has beenreferenced:
b) where their exact words have been used, their writing has been placed inside quotationmarks, and referenced.
(v) This thesis does not contain text, graphics or tables copied and pasted from the Internet,unless specifically acknowledged, and the source being detailed in the dissertation/thesisand in the References sections.
Candidate: Savious M. Mkhize
Signature:
As the candidate’s supervisor I agree to the submission of this thesis for examination.
Supervisor: Professor D G Dorrell
Signature:13/02/2020


ABSTRACT
Impacts and Solutions on Vehicle to Grid (V2G) Infrastructure
Savious M. MkhizeSchool of Engineering
Master of Science
To deal with the problem of global warming and dependency on oil, the need for emmission-free transport has brought electric vehicles to life. The main aim of this thesis is to investigate,analyze and propose solutions to the impact of electric vehicles (EVs) on the smart grid. Beforeinvestigating the impacts of electric vehicles to smart grid, it is important to have a better under-standing of EVs, power grids and vehicle to grid (V2G) infrastructure. The fundamentals of V2Gtechnology are provided in the thesis to understand V2G infrastructure. A power demand studyfor domestic customers is carried out which asseses the best period for charging electric vehiclesat home. Several domestic customer distribution feeders are studied and common observationsare drawn. The number of EVs that can be connected to the distribution transformer per phase iscalculated and discussed. This calculation considers three home charging levels and types of dis-tribution transformers used by the South African utility company ESKOM together with commonobservations from demand studies. The electric vehicle is modelled and simulated using MAT-LAB. The aim of this work is to understand EV power requirements, energy requirements and EVcharging times. The electric vehicle is simulated travelling at different road gradients and travellingat different speeds for each road slope. The study results in terms of the impacts of V2G infras-tructure are provided and discussed systematically. It is observed that the main impacts include:overloading, under-voltage, imbalance and network instability. Possible solutions to the impactsare provided and discussed. The solutions include overnight charging, constructive charging, bal-anced charging, distributed controlled charging and centralized controlled charging. After carefulanalysis, it is observed that the charging impacts are further minimized when these solutions arecombined together. Overall results, discussion and conclusion are provided. The challenges facedin this study are outlined and recommendations for future studies are given. In this thesis, it isfound that EVs can be safely integrated into a power grid with intelligent charge control throughV2G. V2G provides significant benefits to all stakeholders. V2G has many additional applicationsin the smart grid and microgrids.
Keywords: Electric vehicles, wireless charging


PUBLICATIONS ARISING
Impacts and Solutions on Vehicle to Grid (V2G) Infrastructure
Savious M. MkhizeSchool of Engineering
Master of Science
1. S. M. Mkhize and D. G. Dorrell, "Practical Limitations of Vehicle to Grid (V2G) Infras-tructure," Proceedings of the 20th International Conference on Industrial Technology (ICIT2019), Melbourne, pages 1-6, 2019.


ACKNOWLEDGMENTS
I wish to extend my gratitude to my supervisor, Dr. David Dorrell for his unending support and
positive criticism throughout the period of the study. His guidance and suggestions throughout the
study period is especially acknowledged.
My thanks are extended to all my family members, colleagues, friends for their supports in
many ways.
To all of you, May God shower his blessings upon you, shows you mercy and grant you his
favor always.


Contents
Table of Contents xi
List of Figures xv
List of Tables xix
Nomenclature xxi
1 Introduction 1
1.1 Preface . . . . . . . . . . . . . . . . . . . . . . . . . . . . . . . . . . . . . . . . 1
1.2 EV Adoption in South Africa . . . . . . . . . . . . . . . . . . . . . . . . . . . . . 3
1.3 Objectives of the Thesis . . . . . . . . . . . . . . . . . . . . . . . . . . . . . . . . 4
1.4 Outline of the Thesis . . . . . . . . . . . . . . . . . . . . . . . . . . . . . . . . . 4
2 Literature Review 7
2.1 Electric Vehicles (EVs) . . . . . . . . . . . . . . . . . . . . . . . . . . . . . . . . 8
2.1.1 Types of Electric Vehicles . . . . . . . . . . . . . . . . . . . . . . . . . . 8
2.1.2 EV Charging Issues with the Grid . . . . . . . . . . . . . . . . . . . . . . 9
xi

CONTENTS
2.2 Vehicle-to-Grid (V2G) Technology . . . . . . . . . . . . . . . . . . . . . . . . . . 10
2.2.1 Optimal V2G by Incremental Charge Rate Adjustment . . . . . . . . . . . 11
2.2.2 Optimal V2G Scheduling . . . . . . . . . . . . . . . . . . . . . . . . . . . 11
2.2.3 V2G Optimization Constraints . . . . . . . . . . . . . . . . . . . . . . . . 12
2.2.4 V2G with Renewable Energy . . . . . . . . . . . . . . . . . . . . . . . . 12
2.3 Unpacking EV-Grid System . . . . . . . . . . . . . . . . . . . . . . . . . . . . . 13
2.3.1 Grid - LV Network . . . . . . . . . . . . . . . . . . . . . . . . . . . . . . 13
2.3.2 EV Service Equipment (EVSE) . . . . . . . . . . . . . . . . . . . . . . . 16
2.3.3 EV Chargers . . . . . . . . . . . . . . . . . . . . . . . . . . . . . . . . . 16
2.3.4 Battery Pack for EVs . . . . . . . . . . . . . . . . . . . . . . . . . . . . . 17
2.3.5 Power Converters for EVs . . . . . . . . . . . . . . . . . . . . . . . . . . 20
2.3.6 Electric Motors for EVs . . . . . . . . . . . . . . . . . . . . . . . . . . . 22
2.3.7 Some Existing EVs and their ratings . . . . . . . . . . . . . . . . . . . . . 23
2.3.8 Road (Standard) . . . . . . . . . . . . . . . . . . . . . . . . . . . . . . . 24
2.4 EV Basic Charging Options and Discharging Levels . . . . . . . . . . . . . . . . . 26
2.4.1 Charging Options for EVs . . . . . . . . . . . . . . . . . . . . . . . . . . 26
2.4.2 Discharging Levels for EVs . . . . . . . . . . . . . . . . . . . . . . . . . 27
2.5 Integrating EV for home charging . . . . . . . . . . . . . . . . . . . . . . . . . . 28
3 Power Grid Study 31
3.1 Demand Study . . . . . . . . . . . . . . . . . . . . . . . . . . . . . . . . . . . . 31
3.2 Observations from Demand Study/Grid Study . . . . . . . . . . . . . . . . . . . . 36
xii
3.3 Design for Overnight Charging . . . . . . . . . . . . . . . . . . . . . . . . . . . . 36
4 Modelling and Simulating EV System 41
4.1 Modelling the Electric Vehicle . . . . . . . . . . . . . . . . . . . . . . . . . . . . 41
4.2 Modelling the Gear Ratio . . . . . . . . . . . . . . . . . . . . . . . . . . . . . . . 43
4.3 Power Flow Diagram . . . . . . . . . . . . . . . . . . . . . . . . . . . . . . . . . 44
4.4 Assumptions and Parameters . . . . . . . . . . . . . . . . . . . . . . . . . . . . . 44
4.5 EV Simulation Diagram . . . . . . . . . . . . . . . . . . . . . . . . . . . . . . . 48
5 Simulation Results and Analysis 51
5.1 Grid to EV (Charging) Analysis . . . . . . . . . . . . . . . . . . . . . . . . . . . 52
5.1.1 Daily Limits of Overnight Charged EVs . . . . . . . . . . . . . . . . . . . 52
5.1.2 EV to Grid (Discharging) Analysis . . . . . . . . . . . . . . . . . . . . . . 56
5.1.3 V2G Capabilities per Battery Pack . . . . . . . . . . . . . . . . . . . . . . 57
6 Impacts and Solutions on V2G Infrastructure 63
6.1 Impacts of V2G Infrastructure . . . . . . . . . . . . . . . . . . . . . . . . . . . . 63
6.1.1 Overloading . . . . . . . . . . . . . . . . . . . . . . . . . . . . . . . . . . 63
6.1.2 Voltage Drop . . . . . . . . . . . . . . . . . . . . . . . . . . . . . . . . . 64
6.1.3 Phase Unbalance . . . . . . . . . . . . . . . . . . . . . . . . . . . . . . . 64
6.1.4 Network Instability . . . . . . . . . . . . . . . . . . . . . . . . . . . . . . 64
6.2 Solutions on V2G Infrastructure . . . . . . . . . . . . . . . . . . . . . . . . . . . 65
6.2.1 Uncontrolled Charging . . . . . . . . . . . . . . . . . . . . . . . . . . . . 65
xiii

CONTENTS
6.2.2 Distributed Controlled Charging . . . . . . . . . . . . . . . . . . . . . . . 66
6.2.3 Centralized Controlled Charging . . . . . . . . . . . . . . . . . . . . . . . 67
7 Discussion and Conclusions 71
7.1 Discussion . . . . . . . . . . . . . . . . . . . . . . . . . . . . . . . . . . . . . . . 71
7.2 Conclusions . . . . . . . . . . . . . . . . . . . . . . . . . . . . . . . . . . . . . . 73
Bibliography 77
A Smart Grid Analysis 83
B Grid-EV (G2V) Simulation Results 87
C EV-Grid (V2G) Simulation Results 93
D Battery Pack Dimensions 97
E Potential Revenue for Home Charging 99
F Procedures for Load/Network Studies 103
G MATLAB Script for MATLAB Model 107
xiv
List of Figures
2.1 Configuration of the proposed framework. SOC: state-of-charge; G2V: grid-to-vehicle; V2G: vehicle-to-grid; ISO: independent system operator; EV: electric ve-hicle [1] . . . . . . . . . . . . . . . . . . . . . . . . . . . . . . . . . . . . . . . . 10
2.2 Generic Point Model and Generic Bus Model . . . . . . . . . . . . . . . . . . . . 13
2.3 EV-Grid System/Components . . . . . . . . . . . . . . . . . . . . . . . . . . . . . 14
2.4 The LV Grid Network . . . . . . . . . . . . . . . . . . . . . . . . . . . . . . . . . 14
2.5 Comparison between various energy states in terms of power and energy density [2] 19
2.6 Road Gradient standard and calculation . . . . . . . . . . . . . . . . . . . . . . . 25
2.7 Charging and discharging EV battery packs to and from the smart grid . . . . . . . 26
2.8 Procedure for installing EVSE for home charging [3] . . . . . . . . . . . . . . . . 29
3.1 Statistical data for EDENDALE Substation NBEC . . . . . . . . . . . . . . . . . 33
3.2 Scaled Daily Load during winter . . . . . . . . . . . . . . . . . . . . . . . . . . . 34
3.3 Scaled Daily Load during summer . . . . . . . . . . . . . . . . . . . . . . . . . . 35
3.4 32:80 EVs per phase against transformer kVA during winter off-peak period . . . . 38
4.1 Modelling the Electric Vehicle . . . . . . . . . . . . . . . . . . . . . . . . . . . . 42
xv

LIST OF FIGURES
4.2 The gear ratio of the electric vehicle . . . . . . . . . . . . . . . . . . . . . . . . . 44
4.3 The power flow diagram of an electric vehicle . . . . . . . . . . . . . . . . . . . . 45
4.4 Average daily travel pattern of electricity customers [4] . . . . . . . . . . . . . . . 47
4.5 MATLAB EV Model . . . . . . . . . . . . . . . . . . . . . . . . . . . . . . . . . 49
4.6 MATLAB Battery Pack Model . . . . . . . . . . . . . . . . . . . . . . . . . . . . 50
5.1 Daily range limit against Home/AC charging level for an average road gradient of0 % . . . . . . . . . . . . . . . . . . . . . . . . . . . . . . . . . . . . . . . . . . 54
5.2 Daily Energy Limit against Home/AC charging level for an average road gradientof 0 % . . . . . . . . . . . . . . . . . . . . . . . . . . . . . . . . . . . . . . . . . 55
5.3 Daily Cost Limit against Home/AC charging level for an average road gradient of0 % . . . . . . . . . . . . . . . . . . . . . . . . . . . . . . . . . . . . . . . . . . 56
5.4 Using EV power pack for powering the house (Duration in Hours) – V2G-Hours/PPagainst road gradient . . . . . . . . . . . . . . . . . . . . . . . . . . . . . . . . . 59
5.5 Using EV energy pack for powering the house (Duration in Hours) – V2G-Hours/EPagainst road gradient . . . . . . . . . . . . . . . . . . . . . . . . . . . . . . . . . 59
5.6 Mass in kg per (smart) power pack – mass (kg) against road gradient . . . . . . . . 60
5.7 Mass in kg per (smart) energy pack– mass (kg)/EP against road gradient . . . . . . 61
A.1 Stats Data for ESTON Substation NB13 (p.u.) . . . . . . . . . . . . . . . . . . . . 84
A.2 Scaled Daily Load during winter (p.u.) . . . . . . . . . . . . . . . . . . . . . . . . 84
A.3 Scaled Daily Load during summer (p.u.) . . . . . . . . . . . . . . . . . . . . . . . 85
B.1 Torque experienced by Electric Motor(s) – T(m) against road gradient . . . . . . . 87
B.2 Power delivered by electric motor(s) – P(kW) against road gradient . . . . . . . . . 88
xvi

B.3 Energy Consumed per kilometer travelled – kWh/km against road gradient . . . . . 88
B.4 Travelling Cost per kilometer (ZAR/km) – R/km against road gradient . . . . . . . 89
B.5 Battery Recharge Time from a 20A BRK per kilometer travelled (AC Level 2A) . . 89
B.6 Battery Recharge Time from a 60A BRK per kilometer travelled (AC Level 2B) . . 90
B.7 Battery Recharge Time from a 60A BRK per kilometer travelled (AC Level 2C) . . 90
B.8 Battery Recharge Time from a 50kVA TRF per kilometer travelled . . . . . . . . . 91
B.9 EBattery Recharge Time from a 100kVA TRF per kilometer travelled . . . . . . . 91
C.1 Battery cells connected in series to satisfy voltage requirement per battery pack–CellsSeriesV/PC against road gradient . . . . . . . . . . . . . . . . . . . . . . . . 94
C.2 TBattery cells connected in parallel to satisfy power requirement per battery pack– CellsParallelP/PC against road gradient . . . . . . . . . . . . . . . . . . . . . . 94
C.3 Power Converters required to satisfy power requirement per EV – NumberOf-PCsP/EV against road gradient . . . . . . . . . . . . . . . . . . . . . . . . . . . . 95
C.4 Battery cells connected in parallel to satisfy energy requirement per battery pack –CellsParallelE/PC against road gradient . . . . . . . . . . . . . . . . . . . . . . . 95
C.5 Power Converter required to satisfy energy requirement per EV – NumberOf-PCsE/EV against road gradient . . . . . . . . . . . . . . . . . . . . . . . . . . . . 96
D.1 Number of Battery cells along the width of battery pack to satisfy power require-ment per battery pack – BPWidthDimP/PC against road gradient . . . . . . . . . . 97
D.2 Number of Battery cells along the length of battery pack to satisfy power require-ment per battery pack – BPLengthDimP/PC against road gradient . . . . . . . . . 98
D.3 Number of battery cells along the width of battery pack to satisfy energy require-ment per battery pack – BPWidthDimE/PC against road gradient . . . . . . . . . . 98
D.4 Number of battery cells along the length of battery pack to satisfy energy require-ment per battery pack – BPLengthDimE/PC against road gradient . . . . . . . . . 98
xvii

LIST OF FIGURES
E.1 Number of Cars Sold in Norway per year and Projected/Predicted Future Growth . 101
E.2 Norway’s Potential Energy that could be sold to EVs for Home charging AC Level2A, 2B, and 2C . . . . . . . . . . . . . . . . . . . . . . . . . . . . . . . . . . . . 101
E.3 Norway’s Potential Revenue that could be collected from EVs for Home chargingAC Level 2A, 2B, and 2C . . . . . . . . . . . . . . . . . . . . . . . . . . . . . . . 102
F.1 Procedure for customer application study . . . . . . . . . . . . . . . . . . . . . . 104
F.2 Procedure for solving under voltage for EVs . . . . . . . . . . . . . . . . . . . . . 105
F.3 Typical Algorithm for solving under voltage (for ABC OH LV) . . . . . . . . . . . 106
xviii
List of Tables
2.1 Charger Settings for the Grid . . . . . . . . . . . . . . . . . . . . . . . . . . . . . 15
2.2 Charging Power Levels Based in Part on SAE Standard J17723 [3] . . . . . . . . . 17
2.3 SAE J1772 Standard for EV Chargers [5] . . . . . . . . . . . . . . . . . . . . . . 18
2.4 Lithium-Ion Battery Technology [6] . . . . . . . . . . . . . . . . . . . . . . . . . 20
2.5 NCA Li-ion Battery Cell Properties [7][8] . . . . . . . . . . . . . . . . . . . . . . 21
2.6 Existing electric vehicles in the market . . . . . . . . . . . . . . . . . . . . . . . . 24
3.1 Daily Load (Domestic) Characteristic . . . . . . . . . . . . . . . . . . . . . . . . 37
3.2 Number of EVs/ Phase during Winter Off-Peak Period . . . . . . . . . . . . . . . 39
4.1 Assumption and parameters for simulations . . . . . . . . . . . . . . . . . . . . . 46
5.1 EV and Grid Simulation Results for EVs with mass 1000 kg to 2000 kg . . . . . . 53
5.2 Daily limits Simulation Results for EVs with mass 1000 kg to 2000 kg . . . . . . . 54
5.3 Power Pack and Energy Pack Simulation Results . . . . . . . . . . . . . . . . . . 58
5.4 V2G Duration (Hours) for Power Pack and Energy Pack . . . . . . . . . . . . . . 59
E.1 Potential Revenue for night charging . . . . . . . . . . . . . . . . . . . . . . . . . 100
xix


Nomenclature
Abbreviations
V2G Vehicle to GridG2V Grid to VehicleEVSE Electric Vehicle Service EquipmentEV Electric VehiclePC Power ConverterBC Battery CellBP Battery PackICEV Internal Combustion Engine VehicleHEV Hybrid Electric VehicleBEV Battery Electric VehicleFC Fuel CellUC Ultra-CapacitorPHEV Plug-in Hybrid Electric VehicleEM Electric MotorTRF TransformerBRK BreakerAC Alternating CurrentDC Direct CurrentIM Induction MotorEM Electric MotorADMD After Diversity Maximum DemandZAR South African Currencypu Per Unitpf Power FactorNB Network Breaker
xxi

Nomenclature
Technical Terminology
AC Level 2A EV on-board single phase charger drawing up to 3.68 kW of power from thegrid
AC Level 2B EV on-board single phase charger drawing up to 6.90 kW of power from thegrid
AC Level 2C EV on-board single phase charger drawing up to 11.04 kW of power from thegrid
DC Level 1 Off-board three phase charger delivering up to 34.92 kW of power to an EVDC Level 2 Off-board three phase charger delivering up to 69.28 kW of power to an EVPower Converter An inverter that converts a DC voltage into the required three phase AC volt-
age. In this work a 1 pu power converter is taken as 5 kWBattery Pack Set of battery cells connected together and feeding one power converterPower Pack Battery pack with number of parallel battery cells required by power con-
verter to deliver it full powerEnergy pack Battery pack with extra battery cells in parallel than in power pack, extra cells
are added to meet energy requirement of an EV, which is a range of 100 kmfor this paper
Mostoff Fuses in LV feeder mainly protecting distribution transformer
xxii

Technical Quantifications
CellsParallelP/PC Battery cells in parallel per power packCellsParallelE/PC Battery cells in parallel per energy packCellsSeriesV/PC Battery cells in series to meet voltage requirement per power converter/
smart packNumberOfPCsP/EV Number of power packs required by an EV to deliver required powerNumberOfPCsE/EV Number of energy packs required by an EV to deliver required power
and energyBPWidthDimP/PC Number of battery cells along the width of a power pack (for a single
stack)BPLengthDimP/PC Number of battery cells along the length of a power pack (for a single
stack)BPWidthDimE/PC Number of battery cells along the width of energy pack (for a single
stack)BPLengthDimE/PC Number of battery cells along the length of energy pack (for a single
stack)BPWidthDimP/PC Width Dimension of a battery pack to satisfy power requirement for a
1 pu power converterBPWidthDimE/PC Width Dimension of a battery pack to satisfy energy requirement for a
1 pu power converterBPLengthDimP/PC Length Dimension of a battery pack to satisfy power requirement for a
1 pu power converterBPLengthDimE/PC Length Dimension of a battery pack to satisfy energy requirement for a
1 pu power converter1kWADMD5kWPP 5 kW power pack supplying power to a load with ADMD of 1 kW1kWADMD5kWEP 5 kW energy pack supplying power to a load with ADMD of 1 kWV2G-Hours/PP Hours it takes for a power pack to source all of it energy to loadV2G-Hours/EP Hours it takes for an energy pack to source all of it energy to loadMass(kg)5kWPP Mass of a 5 kW power pack in kgMass(kg)5kWEP Mass of a 5 kW energy pack in kg35RN Single phase LV feeder with overall diameter of 35 mm2
70RN Single phase LV feeder with overall diameter of 70 mm2
4AD Single phase service cable with overall diameter of size 4 mm2
10AD Single phase service cable with overall diameter of size 10 mm2
xxiii


Chapter 1
Introduction
1.1 Preface
Electric Vehicles (EVs) are electric type vehicles designed to limit the use of Internal Combustion
Engine Vehicles (ICEV). They are designed to limit dependency to oil as energy source. For EVs,
the energy is stored in batteries, Fuel Cells (FCs), and or Ultra-Capacitors (UCs) instead of fuel
tank. The major components of an electric vehicle system are the motor, controller, power supply,
charger and drive train. There is a wide range of electric vehicles, including lower-end electric
vehicles (i.e. Nissan Leaf) and higher-end electric vehicles (i.e. Tesla Model S). The advantages
of electric vehicles includes efficiency, quite, cleaner, peak load shaving, reduce grid infrastructure
requirements, provides mobile distributed generation or electric power, etc. EVs also has a variety
of disadvantages including limited range, long charging time; require new infrastructure, adverse
battery effects, and more. Charging EVs from the smart grid causes lot of issues to the smart grid
including overloading, under-voltage, imbalance, etc. Many of the issues with EV charging can be
1

1 Introduction
addressed through control called Vehicle-to-Grid (V2G) technology [9][10][1]. V2G allows EVs
to charge and provide energy and services to the grid, through an aggregator, for compensation.
Benefits of Electric Vehicles
• Energy Independent Security
Not dependent on any one fuel, so price spikes are extremely rare
Reduced environmental impacts
– Higher energy conversion efficiency of the power grid to battery than an internal com-
bustion engine
– Easier to filter pollutants from large central plants than many smaller engines
– Can run on clean renewable fuel (i.e., hydro, wind, solar, and nuclear)
• Improved driving experience
– Instant torque makes EVs more responsive and provides amazing acceleration
– No engine noise gives a much quieter drive
– No engine vibration makes for a very smooth drive
The world will run out of oil in future. Internal combustion engine (ICE) vehicles produces
carbon dioxide and carbon monoxide, which causes global warming and pollution to the environ-
ment. In ICE vehicles, most of fuel energy is converted to heat, noise and vibration, causing the
vehicle to be inefficient. EVs are designed to overcome challenges associated with ICE vehicles
by shifting from oil to electricity as main energy source, using efficient power electronic drivers
and efficient electric motors such as induction motors.
2

The advantage of moving to electricity as main energy source is that the current smart grid is also
moving from using coal, oil (diesel generators), fission (uranium fission), etc. to cleaner, safer, en-
vironmentally friendly and abundant energy sources such as hydro, wind, solar, fusion (deuterium
and trillium fusion), etc., the world will not run out of these energy sources. EVs are used for
various purposes including transportation and can be used for excess energy storage from a smart
grid. EVs are more efficient, quite, and cheaper to maintain compared to ICE vehicles [11][12].
They also provide auxiliary services to smart grid that might also benefit the owner of the EV.
1.2 EV Adoption in South Africa
Data from analytics group Lightstone shows that over 400 electric vehicles have been sold in South
Africa since the introduction of EVs in the country. EV penetration in South Africa is sitting at 0.3
% compared to Norway, which is currently the world leader with 6.8 % EV penetration. Nissan
and BMW were the first manufacturers to introduce electric vehicles in South Africa with the Leaf
in 2013 and the i3 in 2015 respectively [13][14].
The Joule from Optimal Energy was South Africa’s own locally produced electric vehicle but it
never formally entered the local market. The Joule project started in 2005 and ended in 2012.
Currently, charging facilities are available in each province in South Africa, with Gauteng as the
front-runner with over 90 stations [15].
Despite current challenges facing utility company in South Africa (ESKOM), including load shed-
ding, electric vehicles are still motivated together with renewable energy sources. Another serious
issue facing ESKOM is electricity theft (non-technical losses); in future, the company might need
to consider upgrading its current power grid to smart grid and advancing its payment system to de-
tect energy theft and adopting demand based pricing especially to EV owners to discourage them
3

1 Introduction
from charging during peak hours and therefore shifting the load to overnight.
1.3 Objectives of the Thesis
The need for sustainable and affordable transportation in South Africa together with variety of
benefits of using electric vehicles over internal combustion vehicles is the main motivation for this
research. South Africa lacks infrastructure to fully support EVs. This thesis provides a step forward
towards maximizing EV penetration in South Africa. This is achieved by studying and addressing
the possible impacts of electric vehicles to the current power grid. Studies and simulations are
carried out in this thesis to find a better understanding of the EV-Grid system, which is useful in
addressing challenges facing V2G infrastructure in South Africa.
1.4 Outline of the Thesis
This thesis presents an overview and progressive arrangement of chapters. One Publication also
supports this thesis. The thesis is organized as follows.
Chapter 1 introduces the subject matter and objectives of this thesis. The major problems caused
by charging electric vehicles, the reasons why electric vehicles are needed and the current EV
adoption status in South Africa are outlined.
In Chapter 2, a literature review on electric vehicles and South African power grid is carried out.
The fundamentals of V2G technology are provided to grasp the idea of V2G infrastructure. A
short overview of V2G with renewable energy is provided and well known EV charging issues
are outlined. EV-Grid system is explained and some of EV charging and discharging options are
4

discussed. A typical procedure for installing EV Service Equipment (EVSE) for home charging is
outlined.
Chapter 3 focuses on the power demand for domestic customers and finding the best period for
charging electric vehicles at home. In this chapter, several distribution feeders feeding domes-
tic customers are studied and common observations are drawn. Considering three home charging
levels and types of distribution transformers used by South African utility company (ESKOM) to-
gether with common observations from demand studies, the number of EVs that can be connected
to the distribution transformer per phase is calculated and discussed.
In Chapter 4 the electric vehicle is modelled and simulated using MATLAB. The aim of this chap-
ter is to understand EV power requirements, energy requirements and EV charging times. The
electric vehicle is simulated travelling at different road gradients and travelling at different speeds
for each road slope.
In Chapter 5, simulation results are provided, discussed and analyzed. Here the information found
in previous chapters is combined to find EV limits and boundaries for home overnight charging.
The information found in this chapter is also important to people considering buying electric vehi-
cle before adequate availability of V2G infrastructure is available in South Africa.
In Chapter 6, the study results on the impacts of V2G infrastructure are outlined and discussed.
Here it is observed that the main impacts includes: overloading, under-voltage, unbalance and
network instability. Possible solutions to the impacts are provided and discussed. The solutions in-
clude: overnight charging, constructive charging, balanced charging, distributed controlled charg-
ing and centralized controlled charging. After careful analysis, it is found that the charging impacts
are further minimized when these solutions are combined together.
In Chapter 7, the overall results are discussed and conclusions are drawn. The challenges faced this
study are outlined and recommendations for future studies are given. It is found that EVs can be
safely integrated into the power grid with intelligent charge control through V2G. V2G provides
5

1 Introduction
significant benefits to all stakeholders. V2G has many additional applications in the smart grids
and microgrids.
6

Chapter 2
Literature Review
Introduction
Many researchers from different countries are contributing in developing and stabilizing EV tech-
nologies. The most challenging issue that will unlock the future of EVs is the Li-ion battery price
(which is projected to fall below $100/kWh by 2026 [16]) and improved battery performance.
Leading countries includes China, USA and Germany. In these countries, EVs are already being
used mainly for transportation. Other existing research in the field of EVs includes developing
high speed/performance electric motors for EVs, and high-energy capacity battery systems and
more. Different EV topologies and configurations are being researched, tested and compared to
find better EV systems.
7

2 Literature Review
2.1 Electric Vehicles (EVs)
EVs use batteries as it main energy source and an electric motor as it main propulsion engine.
Super- and ulta-capacitors are also now being used for high power regenerative braking. EVs
were developed to solve the challenges of global warming, expensive fuel prices, city polution and
grid distributed storage systems [17], etc. There is a wide range of electric vehicles, including
lower-end electric vehicles (i.e., Nissan Leaf) and higher-end electric vehicles (i.e., Tesla Model
S).
2.1.1 Types of Electric Vehicles
They are three common types of electric vehicles, battery electric vehicles (BEVs), plug-in hybrid
electric vehicles (PHEVs) and fuel cell electric vehicles (FCEVs). These types of vehicles are
explained in this section.
Battery Electric Vehicles (BEVs)
BEVs use the battery as the main power source. However, some BEVs use extra storage to support
the batteries, such as the ultra-capacitors and flywheels. The BEV contains an electric motor,
batteries and power electronics. Several battery technologies can be used to provide different
performances to the electric vehicles. The controller is the heart of an electric vehicle, and it is the
key for the realization of a high-performance electric vehicle with an optimal balance of maximum
speed, acceleration performance, and traveling range per charge.
8

Plug-in Hybrid Electric Vehicles (PHEVs)
A hybrid electric vehicle uses two or more energy supplies/sources to propel the vehicle, such as an
ICE and a battery-supplied electric motor (EM). The concept of a PHEV emerged when a model
similar to the hybrid electric vehicle (HEV - where the batteries are charged from the ICE and
regenerative braking) was developed, and additional electrical energy is obtained from charging
from the electric network [18].
Fuel Cell Vehicles (FCVs)
A fuel cell unit is used to generate power, either to supply the electric motor or to store energy
in the battery. FCVs are unlikely to be competitive in a near future, when compared to BEV and
PHEV, because fuel cell units are currently very expensive. In this thesis, the term EV refers to
both BEV and PHEV vehicles; the FCV is not considered.
2.1.2 EV Charging Issues with the Grid
• Bulk Power Grid
– Additional energy requirements (i.e., more fuel burned)
– Higher load levels may require running lower efficiency plants for longer or building
new power plants
• Distribution System
– EV Charging can double a household load
9
2 Literature Review
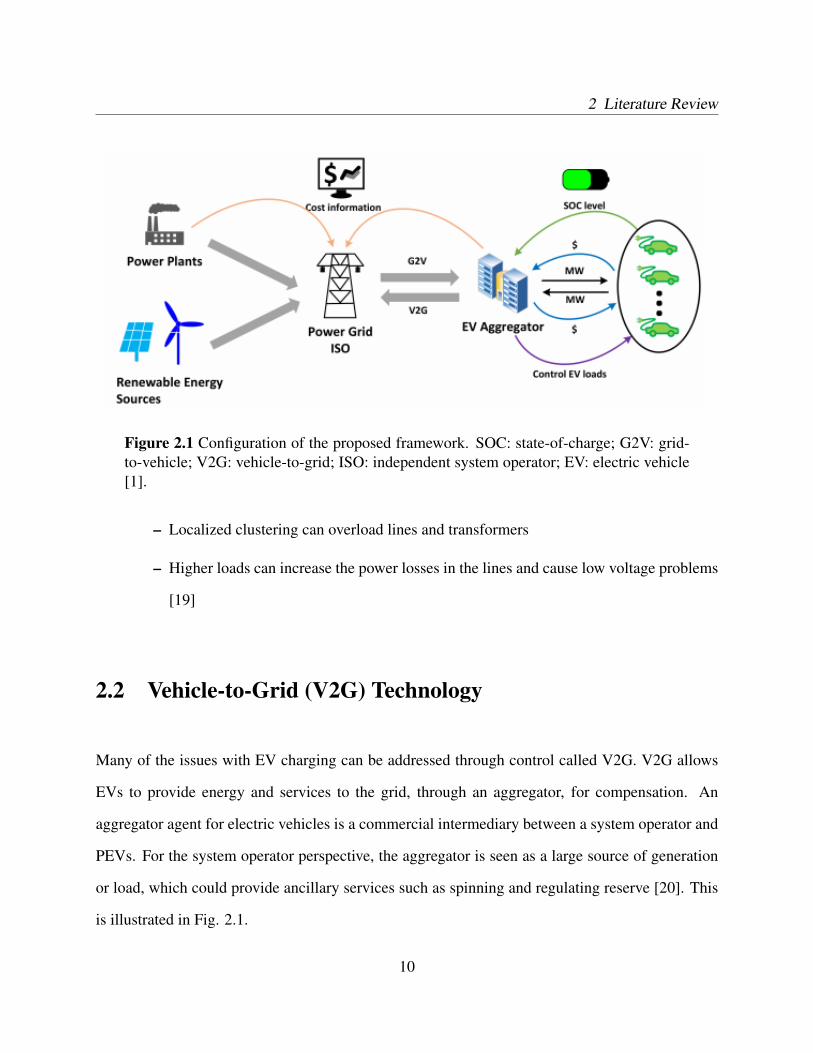
Figure 2.1 Configuration of the proposed framework. SOC: state-of-charge; G2V: grid-to-vehicle; V2G: vehicle-to-grid; ISO: independent system operator; EV: electric vehicle[1].
– Localized clustering can overload lines and transformers
– Higher loads can increase the power losses in the lines and cause low voltage problems
[19]
2.2 Vehicle-to-Grid (V2G) Technology
Many of the issues with EV charging can be addressed through control called V2G. V2G allows
EVs to provide energy and services to the grid, through an aggregator, for compensation. An
aggregator agent for electric vehicles is a commercial intermediary between a system operator and
PEVs. For the system operator perspective, the aggregator is seen as a large source of generation
or load, which could provide ancillary services such as spinning and regulating reserve [20]. This
is illustrated in Fig. 2.1.
10

2.2.1 Optimal V2G by Incremental Charge Rate Adjustment
This involves adjusting the charge rate of EVs around a fixed scheduled rate. This is called the
preferred operating point (POP) [20]. This adjustment:
• Can perform regulation down and reserves by increasing above the POP.
• Can perform regulation up and reserves by decreasing from the POP.
• Does not discharge power from the EV battery into the grid.
2.2.2 Optimal V2G Scheduling
• Performed from an aggregator perspective
– Aggregator can be a utility of a third party
• Maximizes the profits through a combined optimization of multiple V2G services [21][22]
– Assumes revenues come from:
* A percentage of the V2G services provided
* Markup on the wholesale price of energy
• Considers Selling V2G
– Regulation down
– Regulation up
– Responsive reserves [17]
11

2 Literature Review
2.2.3 V2G Optimization Constraints
• Charger limits
– Set either by the maximum charge rate of the internal charger or the maximum charge
rate of the charging station
• Battery capacity limit
– Cannot charge beyond 90 % SOC limit for longer battery life
• EV availability
– Forecasted transport profiles with associated probabilities
– Uses expected values of available EVs
– EVs can leave unexpectedly and their V2G contributions must be compensated by other
EVs
• Ancillary Service Constraints
– Regulation up and responsive reserve capacity cannot be greater than preferred operat-
ing point (POP) [23]
2.2.4 V2G with Renewable Energy
Fig. 2.2 showing two models that can be used to model and optimize the V2G optimization prob-
lem [24][25]. For the purpose of this study, these models will not be included in this thesis.
12

Figure 2.2 Generic Point Model and Generic Bus Model.
Some types of renewable energy, such as wind and solar, have variable uncontrolled outputs.
V2G can smooth the outputs and potentially store excess energy until needed [26]. Renewable
energy sources will work or perform very well with electric vehicles and power banks [27].
2.3 Unpacking EV-Grid System
Fig. 2.3 shows main components of an EV and how they are connected to the grid via EV service
equipment (EVSE) devices. The following subsections further explains the overview below to give
better understanding of EV-Grid system before proceeding to grid and EV analysis.
2.3.1 Grid - LV Network
In this section, the basics of an LV Grid network is provided. This is illustrated in Fig. 2.4. This
figure shows the LV network from the distribution transformer to the distribution board inside the
13

2 Literature Review
Figure 2.3 EV-Grid System/Components.
Figure 2.4 The LV Grid Network.
customer house. Here, ratings of conductors, fuses and breakers used by ESKOM [28][29][30][31]
are indicated and power delivered at every point is calculated and shown in the figure. It should be
noted that the maximum power per phase that can be delivered to each house is limited by service
cable at 11.5 kW for a 10 mm2 airdac. Table 2.1 shows some practical settings of a charger to
avoid overloading and damage to utility equipment.
The settings (2A, 2B, 2C) in Table 2.1will be used throughout this thesis during grid and EV
analysis. Charging currents are set to 80 % of grid rated current to allow few light essential appli-
ances to connect during charging, this includes lights, fridge, etc.
14
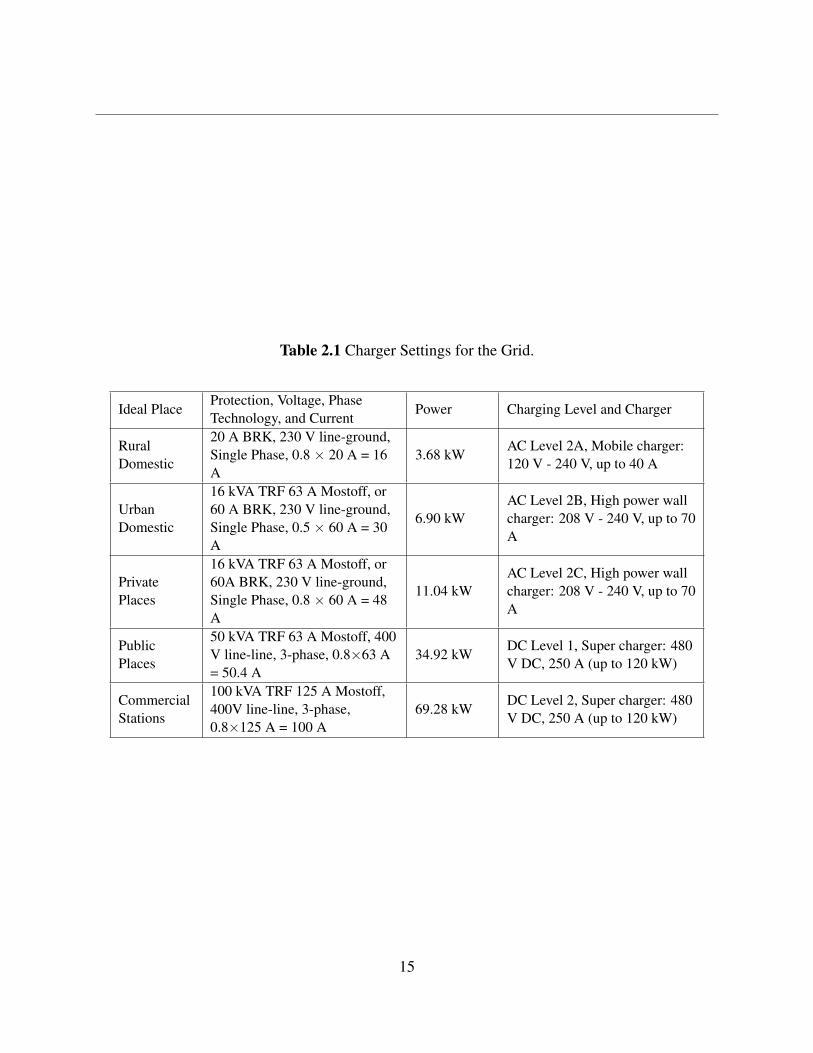
Table 2.1 Charger Settings for the Grid.
Ideal PlaceProtection, Voltage, PhaseTechnology, and Current
Power Charging Level and Charger
RuralDomestic
20 A BRK, 230 V line-ground,Single Phase, 0.8 × 20 A = 16A
3.68 kWAC Level 2A, Mobile charger:120 V - 240 V, up to 40 A
UrbanDomestic
16 kVA TRF 63 A Mostoff, or60 A BRK, 230 V line-ground,Single Phase, 0.5 × 60 A = 30A
6.90 kWAC Level 2B, High power wallcharger: 208 V - 240 V, up to 70A
PrivatePlaces
16 kVA TRF 63 A Mostoff, or60A BRK, 230 V line-ground,Single Phase, 0.8 × 60 A = 48A
11.04 kWAC Level 2C, High power wallcharger: 208 V - 240 V, up to 70A
PublicPlaces
50 kVA TRF 63 A Mostoff, 400V line-line, 3-phase, 0.8×63 A= 50.4 A
34.92 kWDC Level 1, Super charger: 480V DC, 250 A (up to 120 kW)
CommercialStations
100 kVA TRF 125 A Mostoff,400V line-line, 3-phase,0.8×125 A = 100 A
69.28 kWDC Level 2, Super charger: 480V DC, 250 A (up to 120 kW)
15

2 Literature Review
2.3.2 EV Service Equipment (EVSE)
Electric Vehicle Supply Equipment (EVSE) provides for the safe transfer of energy between the
electric utility power and the EV. EVSE includes EV charge cords, charge stands (residential or
public), attachment plugs, vehicle connectors, and protection. Adoption of EVSE is critical to the
success of electric vehicles in South Africa. Level 1 and Level 2 EVSE convert the utility AC
power into DC power through the EV’s on-board charger.
• EV manufacturers provide the Level 1 EVSE consisting of a power supply cable with a
standard 3-prong plug (NEMA 5-15P/20P, limited to 20 A) and a charge current interrupting
device (CCID) located in the cable within 12 in. of the plug.
• Level 2 EVSE typically operate with a peak current of 32 A AC with a branch circuit breaker
rated at 40 A.
The vehicle charger communicates with the EVSE to identify the circuit rating (voltage and cur-
rent) and adjust the charge to the battery accordingly. Level 3 provides electricity through an
off-board charger, delivering DC power directly to the vehicle. The different charging levels are
given in Table 2.2.
2.3.3 EV Chargers
In this section, Table 2.3 is taken from the SAE standard for EVs. In the table some parameters are
not yet finalized, they might change in the future but are used in this thesis as a guide.
16

Table 2.2 Charging Power Levels Based in Part on SAE Standard J17723 [3].
Power LevelTypes
ChargerLocation
Typical UseEnergy Sup-ply Interface
ExpectedPower Level
ChargingTime
VehicleTechnology
Level 1 (Op-portunity)120 Vac(US) 230Vac (EU)
On-board1-phase
Charging athome oroffice
Convenienceoutlet(NEMA5-15R/20R
1.4 kW (12A); 1.9 kW(20 A)
4-11 h;11-36 h
PHEVs(5-15 kWh);EVs (16-50kWh)
Level 2(Primary)240 Vac(US) 400Vac (EU)
On-board1- or3-phase
Charging atprivate orpublicoutlets
DedicatedEVSE
4 kW (17A); 8 kW(32 A); 19.2kW (80 A)
1-4 h; 2-6h; 2-3 h
PHEVs(5-15 kWh);EVs (16-30kWh); EVs(3-50 kWh)
Level 3(Fast)(208-600Vdc)
Off-board3-phase
Commercial,analogous toa fillingstation
DedicatedEVSE
50 kW; 100kW
0.4-1 h;0.2-0.5 h
EVs (20-50kWh)
2.3.4 Battery Pack for EVs
In this section, different types of energy sources are compared and the best battery type is selected.
This uses lithium technology. Different types of lithium batteries are tabulated and associated with
their applications.
Energy Sources for EVs
Fig. 2.5 shows carbon free energy storing elements; fuel cells, batteries and supercapacitors used
by Electric Vehicles (EVs).
It can be seen that fuel cells have the largest energy density but low power density, which
implies that they have slow dynamic properties. From Fig. 2.5, it can be seen that supercapacitors
17

2 Literature Review
Table 2.3 SAE J1772 Standard for EV Chargers [5].
SAE Charging Configurations and Ratings Terminology
AC Level 1 PEV included on-board charger *DC Level 1 *DC Level EVSE includes anoff-board charge
120 V, 1.4 kW @ 12 A 200 - 450 V up to 36 kW (80 A)
120 V 1.9 kW @ 16 A Est. charge time (20 kW off-boardcharger):
Est. charge time: PHEV: 22 min (SOC - 0 to 80 %);PEV: 7 h (SOC - 0 % to full); BEV: 1.2 h (SOC - 20 to 100 %)BEV: 17 h (SOC - 20 % to full)
AC Level 2(SAEJ1772)
PEV includes on-board charger (seebelow for different types) *DC Level 2 EVSE includes an off-board charger
240 V up to 19.2 kW (80 A) 200 - 450 V up to 90 kW (200 A)Est. Charge time (3.3 kW on-boardcharger):
Estimated charge time (45 kWoff-board charger):
PEV: 3 h (SOC - 0 % to full) PHEV: 10 min (SOC - 0 to 80 %)BEV: 7 h (SOC - 20 % to full) BEV: 20 min (SOC - 20 to 80 %)Est. charge time for 7 kW on-boardcharger:PEV: 1.5 h (SOC - 0 % to full)BEV: 3.5 h (SOC - 20 % to full)Est. charge time for 20 kW on-boardcharger:PEV: 22 min (SOC - 0 % to full)BEV: 1.2 h (SOC - 20 % to full)
AC Level 3(TBD)
Less than 20 kW single phase and 3phase
*DC Level 3(TBD) EVSE includes an off-board charger
200 - 600 V DC (proposed), up to 240kW (400 A)Est. charge time (45 kW off-boardcharger:BEV (only): less than 10 min (SOC - 0to 80 %)
*Not finalizedVoltages are nominal configuration voltages, not coupler ratingsIdeal Charge times assume 90 % efficient chargers, 150 W to 12 V loads and no balancing of TractionBattery PackIdeal Charge times assume 90 % efficient chargers, 150W to 12V loads and no balancing of TractionBattery PackNotes:1) BEV (25 kWh usable pack size) charging always starts at 20 % SOC, faster than a 1C rate (totalcapacity charged in one hour) will also stop at 80 % SOC instead 100 %2) PEHV can start from 0 % SOC since hybrid mode is available.Developed by the SAE Hybrid Committee ver. 031611
18

Figure 2.5 Comparison between various energy states in terms of power and energy den-sity [2].
have large power density but low energy density meaning they are perfect sources/banks during
acceleration and deceleration periods. Batteries tend to provide average performance between
fuel cells and supercapacitors. When two or three sources are integrated or hybridized together,
excellent performance is obtained. Fuel cells are very expensive so their future in EV applications
is very narrow. From Fig. 2.5, it can be seen that lithium type batteries seem to be providing better
performance (energy and power).
Lithium Technology for EVs
Table 2.4 gives the different types of lithium batteries and their applications. Lithium technology
is a very good energy storage solution and used extensively in the EV industry and they lead other
battery technologies [23]. From Table 2.4 it can be noted that NCA and LTO lithium types are used
in EVs although LTO chemistry is still being developed and improved for future use. Currently
NCA lithium types are used in most lithium battery EVs. Table 2.5 shows the properties of NCA
19

2 Literature Review
lithium battery types.
From Table 2.5 the battery cell parameters, such as cell mass, rated voltage, rated capacity and
rated energy, will be utilized during the simulation stage.
Table 2.4 Lithium-Ion Battery Technology [6].
Li-Ion Battery Chemistries Chemical Formula ApplicationLithium Cobalt LCO Li-CoO2 Cellphones, laptops, and camerasLithium Nickel Manganese Cobalt Oxide NMC Li-NiMnCoO2 Power tools, medical, hobbyistLithium Iron Phosphate LFP Li-FePO4 Power tools, medical, hobbyistLithium Manganese Oxide LMO Li-Mn2O4 Power tools, medical, hobbyistLithium Nickel Cobalt Aluminum Oxide NCA Li-NiCoAlO2 Electric vehicles and grid storageLithium Titanate LTO Li4Ti5O12 Electric vehicles and grid storage
2.3.5 Power Converters for EVs
The power converter converts a DC voltage ( which could be low in a small vehicle, such as 24 V
in a scooter, to a DC bus of several hundred volts for a high performance EV) into a balanced 3-
phase voltage set (if a 3-phase motor is used) which has variable frequency and voltage magnitude,
and vice-versa for bidirectional converters. Usually, more than one power converter is used in
an electric vehicle. Typical ratings of power converters are typically from about 5 kW for a very
partial hybrid vehicle or small electric scooter into several hundred kW for a high performance
EV. The converters are voltage source inverters that use pulse wave modulation to control the
conversion. These are bidirectional. Wide voltage and frequency ranges are required because of
the wide speed range required. A DC-to DC converter may also be required to control the DC bus
voltage and battery charging. This should be bidirectional too.
In this work the concept of multiple power converters is used where the base power converter
is 5 kW. So an EV taken as having 10 power converters will mean the vehible is rated at 50 kW
20

Table 2.5 NCA Li-ion Battery Cell Properties [7][8].
Li-Ion Battery Chemistries ChemicalFormula Application
Lithium Nickel CobaltAluminum Oxide NCA Li-NiCoAlO2 Electric vehicles and grid storage
Cell name Cell shapeCellDimension(mm)
Cell Volume (cm3)
21700 Cylindrical Height=70,Width=21 0.024245
Energy Density(Wh/cm3)
SpecificEnergy(Wh/kg)
Cell Mass (g) Cell Capacity(Ah)
Charge Power(W)/DischargePower (W)
Charge/DischargeRate (A)
877.5 300 65 - 75 3 - 4.8 2.8; 7; 17; 25 I = 0.2 C; 0.5 C;1 C; 1.5 C
Cell Voltage (V) 3 3.3 3.6 3.9 4.2Cell Capacity(Ah) 0.217 0.73 2.9 5 5.07
Cell ChargingCycles (N ×103) * * * 2.4 - 4 0.3 - 0.5
Cell Life Time (Years) - Forsingle daily charged cells * * 6.56 - 11 0.82 - 1.37
Cell Energy (Wh) 0.651 2.41 10.44 19.5 21.275Rated Voltage(V)
Rated Temp(◦C)
Rated Cycles(N ×103)
Rated Life(Years)
Rated Capacity(Ah)
Rated Energy(Wh)
3.6 T = -20; 0;40; 60 2.4 6.56 4.27 17.1
21

2 Literature Review
and the main power converter will be a 3-phase PWM inverter, using devices such as IGBTs.
2.3.6 Electric Motors for EVs
Most EV manufacturers prefer 3-phase brushless permanent magnet AC motors (BPMs) or pos-
sibly induction motors (IMs) as the main motor(s) for propelling the car [32]. The traditional
commutator DC machine is a very old technology and not considered for automotive applications
because it large, heavy and not efficient. The commutator and brushes need maintenance. Automo-
tive drive motors run into a high transient region during high acceleration and braking. This region
is only sustainable for short periods and their thermal operation is key. For instance, the machine
may only be rated at 100 Nm continuous but will operate up to 300 Nm during hard braking. The
machines are often liquid cooled.
BPM machines use rare earth magnets (usually sintered Neodymium Iron Boron) which are high
energy magnets. These are expensive but the machines can be very efficient - the highest of any
automotive drive motor. They have no brushgear and the rotor has magnets so there is no rotor
current. They can operate into several tens of rpm. For instance, the 3rd generation Toyota Prius
has an 8 pole BPM machine which runs up to 14500 rpm. They are expensive and the magnet
material mostly comes from China and the supply chain can be difficult. However, they are the
main preference in motor choice.
The IM is widely found in many industrial applications due to its advantages over other types of
motors. However, the demands for an automotive application is somewhat different. Below are
some advantages [33].
• The IM has no brushes so it needs less maintenance.
• The cost of IM is less than cost of an BPM motor of the same nominal power.22

• The IM is robust and can work in abnormal ambient conditions for short periods.
• The IM can be manufactured for nominal voltage up to 25 kV (though not needed for EVs).
• The IM can be manufactured for high power - their speed is limited by the inverter supply
voltage but they can run at reduced voltage at high speed - the BPM can be field weakened
to reduce the voltage but not to the same extent as the IM.
A review of EV drive motors is given in [34].
2.3.7 Some Existing EVs and their ratings
Table 2.6 shows a list of some EVs already in the market. This information is very useful to endure
that simulations are within the boundaries of existing EV systems.
The average modern BEV has a battery capacity of 31 kWh and level 2 charging infrastructure
capable of delivering 7 kW at 86 % efficiency. The range is increasing with new BEVs, allowing
more batteries to be committed to V2G service provision.
23

2 Literature Review
Table 2.6 Existing electric vehicles in the market.
Make ModelBatteryCapacity(kWh)
Range (km)
GridConnectionPower (kWRated)
EV chargingLevel
BMW i3 19 130 7.4 AC Level 2BChevrolet Spark 19 132 3.3 AC Level 2AFiat 500e 24 140 6.6 AC Level 2BFord Focus 23 122 6.6 AC Level 2BHonda Fit 20 132 6.6 AC Level 2BKia Soul 27 150 6.6 AC Level 2BMercedes B-Class 28 140 10 AC Level 2CMitsubishi iM IEV 16 100 3.3 AC Level 2ANissan Leaf 24 135 6.6 AC Level 2BTesla S-70 66 v386 10 AC Level 2CTesla S-85 78 435 10 AC Level 2CVolkswagen eGolf 24 134 7.2 AC Level 2B
2.3.8 Road (Standard)
Before simulating an EV using MATLAB, it is very important that the road standard be reviewed
to find the maximum road gradient/slope. In the standard, road gradients are given in percentage
and Fig. 2.6 illustrates the relationship between road gradient in percent and in degrees.
24

Figure 2.6 Road Gradient standard and calculation.
With reference to Fig. 2.6, the road slope or gradient = y/100 = y% = tan(θ) do that
θ = arctan(y%) = arctan(y/100) (2.1)
From the SA roads standard, gradients should preferably not exceed 14 % and in no circumstances
exceed 20 % [35]. From this information, the electric vehicle will be studied travelling along four
different roads with the following gradients:
1. 0 % = 0.0 ◦
2. 7 % = 4.0 ◦
3. 14 % = 7.97 ◦
4. 21 % = 11.86 ◦
25

2 Literature Review
Figure 2.7 Charging and discharging EV battery packs to and from the smart grid.
2.4 EV Basic Charging Options and Discharging Levels
Fig. 2.7 shows three common charging options including off-peak charging, optimistic charging
and dedicated charging. There are also three EV discharging levels including LV grid, MV grid
and HV grid.
2.4.1 Charging Options for EVs
As can be seen from Fig. 2.7 there are three basic charging options that can be adopted for charging
EVs.
26

• Off-peak charging: This is the simplest and cheapest method when applied properly. It
does not require any upgrade of the smart grid. This method is sometimes called overnight
charging because most networks have lower overnight loading.
• Optimistic charging: This method can be used to improve the flexibility of EV charging and
therefore improving customer satisfaction. Here more smart devices are required to control
charging process.
• Dedicated charging: This method requires a dedicated transformer/capacity for charging
EVs only. It provides maximum flexibility and reliability although it might be expensive and
difficult for domestic customers.
2.4.2 Discharging Levels for EVs
Apart from charging from the grid, EVs may possibly be used for peak shaving in future by pro-
viding electrical energy back to the grid. There are three main levels of discharging battery-stored
energy back to the grid:
• LV Grid Discharging: This level is useful during peak times to relief over-loading distribu-
tion transformers. Here an EV is used as a house backup during contingencies and provides
a short time alternative to grid electricity.
• MV Grid Discharging: Here a fleet of EVs is used instead of a single EV to discharge their
energy back to MV grid system during peak hours. This can save power transformers from
overloading and hence improving their lifespan.
• HV Grid Discharging: This level is not likely to be adopted in future but can improve end
27

2 Literature Review
voltages during peak hours mainly at a sub-transmission level. This method can help avoid
tap-changer lockout due to low voltages in distribution substations.
2.5 Integrating EV for home charging
In this section, EV considerations for home charging are discussed. Fig. 2.8 helps demonstrate
the concept. Here, the customer buys an EV together with EVSE V2G device. Then the next
step is for the EV owner to contact the utility to notify them that they want to install the EVSE
for home charging. The utility then visits the EV owner house to mainly check the conditions of
the source distribution transformer and how much power can the EV draw from the transformer
without damaging utility equipment (transformer, fuses and Arial Bundle Conductors - ABC) [36].
However, this might not be a one day process since the utility may want to install a data logger
(i.e., temperature logger) to download a 24-hour data to check how much the transformer is loaded
during the day. From that information, and other projections, the utility can tell whether the EV
can be charged from the transformer or not and under what conditions, if any. If charging is not
possible, a schedule can be drawn up in order to implement network upgrades, such as installing a
new transformer or upgrading the LV feeders, fuses and circuit breakers.
28

Figure 2.8 Procedure for installing EVSE for home charging [3].
29

2 Literature Review
30

Chapter 3
Power Grid Study
3.1 Demand Study
In this section, the grid is analyzed to understand its behaviour during the year and during the day.
This information is very useful in finding the best charging time and period for different types
of feeders. For the purpose of this study, only feeders feeding domestic customers are analyzed.
To obtain accurate results from the analysis it is important that multiple distribution transformers
feeding domestic customers are analyzed and the average of the results is taken at the end. Here,
instead of analyzing the distribution transformers one by one, the feeders of most importance to
the domestic customers (>90 %) were selected, scaled and analyzed. The reason for this approach
is to save time, increase accuracy (since the feeder is feeding lot of distribution transformers) and
the availability of the statistical data (from substation meters which supply the MV90 database).
The following steps were followed during analysis and repeated in all collected networks to find a
common point of the study:
31

3 Power Grid Study
1. Find domestic feeder: To find a domestic feeder, Spaceman software can be used although
this may take a little longer, or feeders can be requested from Geo-Load Forecast (GLF)
engineers/technicians since they know their networks much better. In this work, the EDEN-
DALE Substation NBEC and ESTON Substation NB13 are included to demonstrate the
analysis and common point results. ESTON NB13 can be found in appendix A.
2. Download one-year feeder statistics: Statistical data is requested from MV90 or by using
ADS software to download the statistics from the MV90 database into an excel spreadsheet.
3. Scale feeder apparent power: In this analysis, the main aim is to observe the trend for how
the domestic feeder load varies over the year and during the day. So the apparent power of
the network is scaled to unity by diving all apparent power data by the maximum normal
apparent power. For domestic networks, the maximum normal apparent power occurs in
mid-winter which is 6.25 MVA for EDENDALE NBEC and 2.1 MVA for ESTON NB13.
After doing this, the yearly graph in Fig. 3.1 is plotted together with power factor.
Fig. 3.1 shows how the load changes from 01 January 2017 to 31 December 2017. Analyzing
2016 and 2015, it was observed that the pattern is almost identical.
4. Pick one day in the middle of winter: Before picking a day, a month in the middle of winter
is picked which is July, and then a day in the middle of July is picked. For the purpose of
this study, the best day to pick is a working day (not holiday or weekend). For this network,
18 July 2017 was chosen and plotted with power factor as shown in Fig. 3.2.
From the above plot, it can also be seen how the load was varying during the day in winter.
The network is least loaded from 22:30 to 04:30 (below 40 % of peak load for 6 hours). It
should also be noted that in winter the morning peak is around 8:00 am with evening peak at
18:00 pm.
5. Pick one day in the middle of summer: Before picking a day, a month in the middle of
32
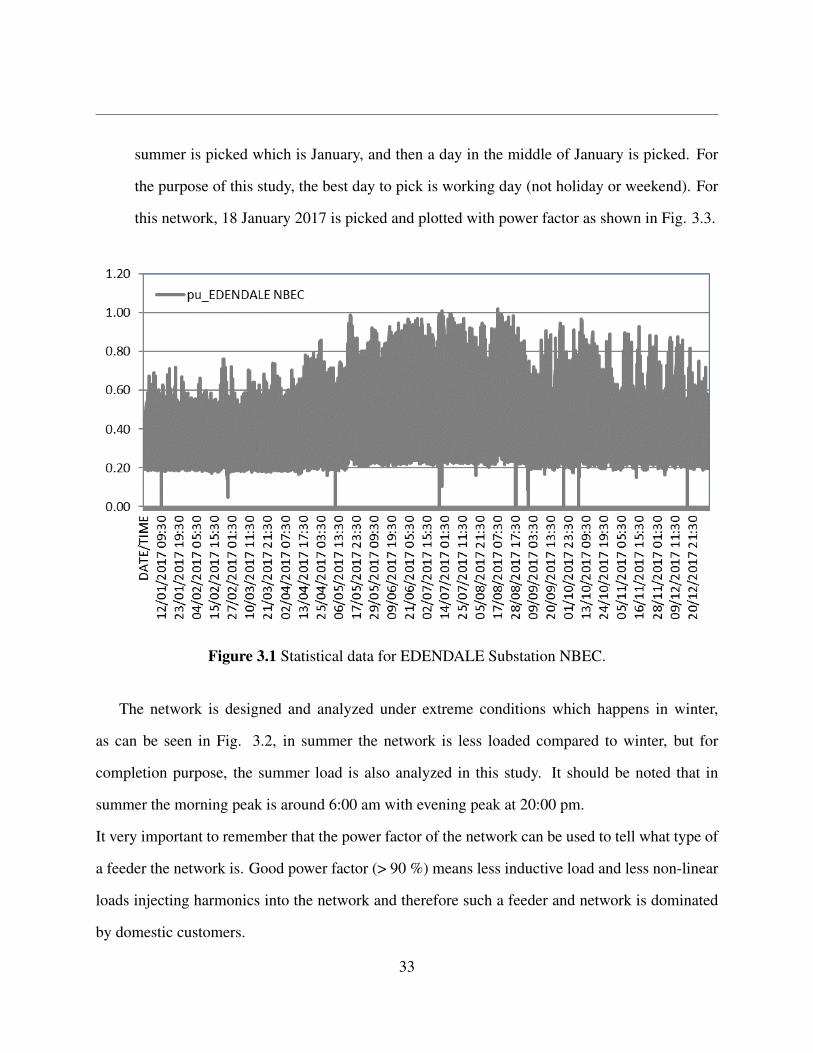
summer is picked which is January, and then a day in the middle of January is picked. For
the purpose of this study, the best day to pick is working day (not holiday or weekend). For
this network, 18 January 2017 is picked and plotted with power factor as shown in Fig. 3.3.
Figure 3.1 Statistical data for EDENDALE Substation NBEC.
The network is designed and analyzed under extreme conditions which happens in winter,
as can be seen in Fig. 3.2, in summer the network is less loaded compared to winter, but for
completion purpose, the summer load is also analyzed in this study. It should be noted that in
summer the morning peak is around 6:00 am with evening peak at 20:00 pm.
It very important to remember that the power factor of the network can be used to tell what type of
a feeder the network is. Good power factor (> 90 %) means less inductive load and less non-linear
loads injecting harmonics into the network and therefore such a feeder and network is dominated
by domestic customers.
33

3 Power Grid Study
Figure 3.2 Scaled Daily Load during winter.
34

Figure 3.3 Scaled Daily Load during summer.
35

3 Power Grid Study
3.2 Observations from Demand Study/Grid Study
Table 3.1 summaries the results found from grid/demand study. Here under yearly load character-
istic; sunrise, sunset and electricity demand is summarized. Sunrise and sunset information can be
very useful when designing and dealing with solar assisted EV-Grid systems like solar roof EVs,
solar roof houses, and or grid-tied, off-grid and hybrid solar systems. Under the daily load charac-
teristics, electricity demand is summarized as a function of time of the day in hours.
From the grid daily load characteristics results, it can be observed that the network feeding domes-
tic load has more excess capacity from around 22h30 to 04h30 which is a duration of 6 hours. This
means EVs charging overnight are limited to a charging period of 6 hours. From grid statistical
data, it is observed that during overnight the grid is loaded below 40 % of its peak, which happens
at around 18h00 during winter and around 20h00 during summer.
3.3 Design for Overnight Charging
Using the information, we have obtained so far from the demand/grid study together with a couple
of electricity delivery standards, the number of EVs that can be connected to each distribution
transformer per phase during overnight period can be determined for all three charging levels, AC
level 2A, AC level 2B and AC level 2C. During electrification design, transformers are loaded up
to 80 % of their rated capacity for overhead networks (up to 50 % for underground networks),
so here it is assumed that every distribution transformer peak is at 80 % of it rated capacity in
mid-winter at 18:00 pm (highest peak of the year). From this information it not difficult to see
that the distribution transformer during mid-winter overnight is expected to be loaded below 40 %
of its highest peak of the year (80 %), therefore below 40 % × 80 % = 32 % of it rated capacity.
36

Tabl
e3.
1D
aily
Loa
d(D
omes
tic)C
hara
cter
istic
Yea
rly
Loa
dC
hara
cter
istic
sSe
ason
Sum
mer
Aut
umn
Spri
ngW
inte
rSu
mm
erM
onth
Jan
Feb
Mar
Apr
May
Jun
July
Aug
Sep
Oct
Nov
Dec
Sunr
ise
05h0
006
h00
07h0
006
h00
05h0
0Su
nset
19h0
018
h00
17h0
018
h00
19h0
0D
eman
dM
inim
umR
isin
gPe
akFa
lling
Min
imum
Dai
lyL
oad
Cha
ract
eris
tics
Sess
ion
Nig
htM
orni
ngD
ayA
fter
noon
Nig
htH
our
01
23
45
67
89
1011
1213
1415
1617
1819
2021
2223
Dem
and
Nig
htM
inR
isin
gM
orni
ngpe
akFa
lling
Day
min
Ris
ing
Eve
ning
peak
Falli
ng
37

3 Power Grid Study
Figure 3.4 32:80 EVs per phase against transformer kVA during winter off-peak period.
Therefore, during overnight the majority of distribution transformers are expected to be loaded
below 32 % of their rated capacity. At night, (off-peak) more load (EVs) can be connected to
distribution transformers to increase overnight load from 32 % to 80 % of their rated capacity
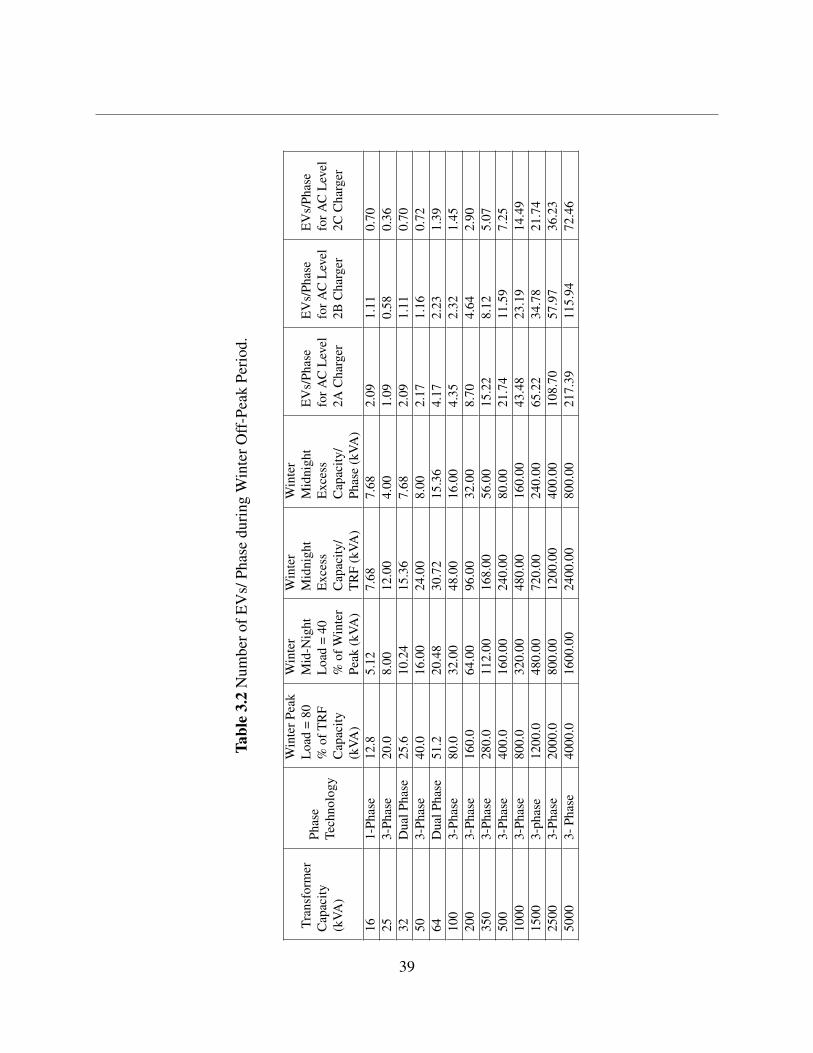
(design limit). Table 3.2 shows the calculated number of EVs that can be connected to each phase
of the distribution transformer using the above information.
Plotting the results in Table 3.2 from a transformer size of 16 kVA to 200 kVA, the plot in Fig.
3.4 is obtained. The figure shows results for pole mounted distribution transformers only. From
350 kVA to 5000 kVA distribution transformers, the results can be read direct from Table 3.2
Design Analysis
Here most distribution transformers are assumed to have at least 48 % (80 % - 32 %) of normal
excess capacity during the overnight charging period. It should be noted that this design should
38
Tabl
e3.
2N
umbe
rofE
Vs/
Phas
edu
ring
Win
terO
ff-P
eak
Peri
od.
Tran
sfor
mer
Cap
acity
(kVA
)
Phas
eTe
chno
logy
Win
terP
eak
Loa
d=
80%
ofT
RF
Cap
acity
(kVA
)
Win
ter
Mid
-Nig
htL
oad
=40
%of
Win
ter
Peak
(kVA
)
Win
ter
Mid
nigh
tE
xces
sC
apac
ity/
TR
F(k
VA)
Win
ter
Mid
nigh
tE
xces
sC
apac
ity/
Phas
e(k
VA)
EV
s/Ph
ase
forA
CL
evel
2AC
harg
er
EV
s/Ph
ase
forA
CL
evel
2BC
harg
er
EV
s/Ph
ase
forA
CL
evel
2CC
harg
er
161-
Phas
e12
.85.
127.
687.
682.
091.
110.
7025
3-Ph
ase
20.0
8.00
12.0
04.
001.
090.
580.
3632
Dua
lPha
se25
.610
.24
15.3
67.
682.
091.
110.
7050
3-Ph
ase
40.0
16.0
024
.00
8.00
2.17
1.16
0.72
64D
ualP
hase
51.2
20.4
830
.72
15.3
64.
172.
231.
3910
03-
Phas
e80
.032
.00
48.0
016
.00
4.35
2.32
1.45
200
3-Ph
ase
160.
064
.00
96.0
032
.00
8.70
4.64
2.90
350
3-Ph
ase
280.
011
2.00
168.
0056
.00
15.2
28.
125.
0750
03-
Phas
e40
0.0
160.
0024
0.00
80.0
021
.74
11.5
97.
2510
003-
Phas
e80
0.0
320.
0048
0.00
160.
0043
.48
23.1
914
.49
1500
3-ph
ase
1200
.048
0.00
720.
0024
0.00
65.2
234
.78
21.7
425
003-
Phas
e20
00.0
800.
0012
00.0
040
0.00
108.
7057
.97
36.2
350
003-
Phas
e40
00.0
1600
.00
2400
.00
800.
0021
7.39
115.
9472
.46
39

3 Power Grid Study
never lead to damage of distribution transformer due to overloading during overnight charging
period of 22:30 pm to 04:30 am if the actual load of the distribution transformer is not more than
102 % (150 % - 48 %) of its capacity/size. This is because distribution transformers are designed
to withstand an ultimate load of up to 150 % of their rated capacity. Therefore, this is not a
sensitive design since the actual load of the distribution transformer during overnight charging
period can increase from 32 % to 102 % of its rated capacity without damaging the transformer.
Concluding, if this method for overnight charging is applied correctly and leads to damage of
a distribution transformer due to overloading, that will mean that distribution transformer was
already overloading by at least 2 % (making 102 %) of its rated capacity during overnight charging
period, which rarely happens.
40

Chapter 4
Modelling and Simulating EV System
Introduction
The physical model of the vehicle system is developed based on the applied load during motion.
The characteristics of the vehicle and the parameter coefficients that concern the vehicle varies, de-
pending on the vehicle design and the movement situation. Forces that occur during the movement
of the vehicle, including the motor torque and speed, are evaluated. The motor speed and torque
are not directly linked to the linear movement of the vehicle but instead through the gears with a
gear ratio of 1/G and a radius r of the vehicle drive wheel.
4.1 Modelling the Electric Vehicle
Generally, the modelling of an EV involves the balancing of the forces acting on a running vehicle.
The forces are categorized into road load and tractive forces. The road load consists of the gravi-
41

4 Modelling and Simulating EV System
Figure 4.1 Modelling the Electric Vehicle.
tational force, hill-climbing force, rolling resistance of the tires and the aerodynamic drag force as
shown in Fig. 4.1.
In Fig. 4.1, the momentum is conserved and it rate of change with time is equivalent to the sum
of all forces acting on the electric vehicle. The momentum is defined as:
P = mv (4.1)
so thatdPdt
= m× dvdt
= F −µrrmg =12
ρACdv2 −mgsin(φ) (4.2)
Re-arranging terms we get
F = µrrmg+12
ρACdv2 +mgsin(φ)+mdvdt
(4.3)
where m is the mass of the electric vehicle; g is the gravity acceleration; v is the driving velocity
of the vehicle; µrr is the rolling resistance coefficient; ρ is the air density; A is the frontal area
of the vehicle; Cd is the drag coefficient; and φ is the hill climbing angle. The rolling resistance
is produced by the flattening of the tyre at the contact surface of the roadway. The main factors
affecting the rolling resistance coefficient µrr are the type of tyre and the tyre pressure. It is42

generally obtained by measurement in a field test. The typical range is 0.005 to 0.015 depending
on the type of tyre [37]. The rolling resistance can be minimized by keeping the tyres inflated
properly.
In eqn. (4.3), the first term corresponds to the rolling resistance force; the second term cor-
responds to the aerodynamic drag force; the third term corresponds to the hill climbing force;
and the forth term corresponds to the acceleration force. This resultant force F, will produce a
counteractive torque to the driving motor, i.e., the tractive force.
4.2 Modelling the Gear Ratio
For vibration study, the connection between the driving motor and the tyre should be modelled
in detail. In this work, a simplified model is used. With this simplified model, the relationship
between the tractive force and the torque produced by the motor can be obtained from
TL = rGF (4.4)
where r is the tyre radius (m) of the electric vehicle, G = r1r2 is the gearing ratio, and TL (Nm) is the
torque produced by the driving motor. Fig. 4.2 shows a diagram representation of the gear ratio.
Here a set of primary and secondary gears are working together to transfer power from primary
gear (with radius r1) to secondary gear (with radius r2).
43

4 Modelling and Simulating EV System
Figure 4.2 The gear ratio of the electric vehicle.
4.3 Power Flow Diagram
To analyze how the wheels of the electric vehicle are linked to the electric motor inside the EV,
a single line diagram is used as shown in Fig. 4.3. This diagram is useful in developing the EV
model that is used to analyze and understand the behaviour of EVs under various conditions.
4.4 Assumptions and Parameters
In this section, a list of assumptions to be used for simulations are provided. Here assumptions in-
cluding the road, EV, electric motor, power converter, battery pack, charger, EV supply and service
equipment (EVSE), grid, and travel pattern are provided below. Table 4.1 shows the assumptions
to be used in the simulation model. Here parameters that have been outlined in previous sections
are not included in this table, such as the Li-ion battery cell rated values.
44

Figu
re4.
3T
hepo
wer
flow
diag
ram
ofan
elec
tric
vehi
cle.
45

4 Modelling and Simulating EV System
Table 4.1 Assumption and parameters for simulations.
Road ParametersParameter ValueAir density d = 1.25 kg m−3
gravity g = 9.81 ms−2
Road gradient
0 % = 0.0◦
7 % = 4.0◦
14 % = 7.97◦
21 % = 11.86◦
EV ParametersParameter ValueDrive Train Efficiency TC = 0.92, SC = 0.97Tire Radius r = 0.26 mGear Ratio G = 0.5Vehicle mass + Passengers M = 2000 kgFrontal Area A = 1.2 m2
Drag coefficient cd = 0.75Rolling coefficient Ur = 0.009Minimum Range 100 km
Electric Motor ParametersEfficiency EM_Eff = 0.95
Power ConvertersEfficiency PC_Eff = 0.93Rated Power for 1 pu Converter 5 kWInput Voltage for 1 pu Converter 30 V
Battery PackEfficiency BP_Eff = 0.98Cell Type 21700 NCACell Rated Voltage 3.6 VBattery Pack Output Voltage 30 V
ChargerEfficiency Ch_Eff = 0.90
EVSEEfficiency EVSE_Eff = 1.00
Smart GridTransformers peak in winter 80 % of their capacityTariff 1.50 ZAR/kWhMostoff Sizes 63 A/125 AHouse CB Ratings 20 A/60 A
46

Figure 4.4 Average daily travel pattern of electricity customers [4].
Travel Patterns for EV Customers
Here it is assumed that the potential or majority of EV customers are employed who leave their
houses early in the morning and come back late afternoon. Fig. 4.4 shows the Vista Travel Survey
conducted in 2009 by the Victoria Department of Transport. In this survey, 13000 records of 24-
hour vehicle travel profiles were recorded, daily distances travelled by working class people versus
the percentage of total number of records are shown.
This survey shows that most people are working close to where they live to minimize travelling
expenses and the graph decreases almost linear as the travel distance increases. From this survey
results it is good to assume that people are travelling 100 km every day although the majority of
them are travelling between 10 km to 50 km. Fig. 4.4 shows that the majority of people return
home from 16h00 to 19h00.
47

4 Modelling and Simulating EV System
4.5 EV Simulation Diagram
Using previous models and assumptions, the simulation diagram is constructed; this show in Fig.
4.5. The EV simulation diagram is used to simulate the vehicle under various conditions, i.e.,
travelling along the roads of different slopes. The aim for this is to investigate and analyse the
behaviour and requirements of the EV at different road gradients and at different speeds. The
equation inside the MATLAB function f (u) is
= u(7)u(8)u(9)+0.5u(4)u(5)u(6)u(1)2 +u(8)u(9)sin(u(3))+u(8)u(2) (4.5)
The MATLAB model in Fig. 4.6 for EV battery pack belongs to the subsystem in Fig. 4.5.
This model is very useful in determining power and energy requirements from the battery pack.
In addition to the battery power and battery energy results, more parameters are modelled by
the above model including number of required battery cells in series and parallel, battery pack
dimensions and battery pack weight.
48

Figu
re4.
5M
AT
LA
BE
VM
odel
.
49

4 Modelling and Simulating EV System
Figure4.6
MA
TL
AB
Battery
PackM
odel.
50

Chapter 5
Simulation Results and Analysis
Introduction
Using the MATLAB models developed, the EV system is simulated at various conditions (i.e.,
various road gradients and various EV speeds for each road gradient). This can easily be seen from
Table 5.1. In this model, there are three controlled parameters, which are EV mass, road gradient
and EV speed. Then the rest are outputs from the model. To maximize accuracy of results, a
MATLAB script was developed to read inputs from excel, simulate the model and read model
outputs back to excel. This helps eliminates human reading error, improve reliability of results and
greatly improves simulation time for all of these outputs for every single set of input parameters.
51

5 Simulation Results and Analysis
5.1 Grid to EV (Charging) Analysis
Table 5.1 summarizes the electric vehicle simulation results. This simulation is for electric vehicles
with total mass from 1000 kg to 2000 kg, which is the range of most EVs.
Using the simulation results in Table 5.1 and the fact that for overnight charging, there are
6 hours available for all overnight home charging levels 2A, 2B and 2C, the results in Table 5.2
(daily limits and boundaries) in the next section are calculated and tabulated. These results are
more accurate for a journey with a total average road gradient of 0 %. For graphical representation
of the results, refer to appendix A (for G2V simulation results) and appendix B (for V2G simulation
results).
5.1.1 Daily Limits of Overnight Charged EVs
In this section, the daily G2V limits are analyzed for overnight home charged EVs. These limits
are set by the 6 hour availability for uncontrolled overnight charging. Table 5.2 summarizes these
limits including maximum daily range (km), maximum daily energy (kWh) and maximum money
spending (ZAR) assuming an EV tariff of ZAR1.5/kWh.
Using the fact that there are six hours available for overnight charged EVs for all charging
levels, the daily travelling range limit can be calculated for a 2000kg EV having a road journey
with a total average road gradient of 0 %. Using the simulation results above of recharge time (RT)
in mins per km travelled, the daily range limit can be calculated and plotted as shown in Fig. 5.1.
In Fig. 5.1 it should be noted that the daily travelling range limit depends to the travelling
speed of an EV and the overnight charging level. It should also be noted that the lower the trav-
52
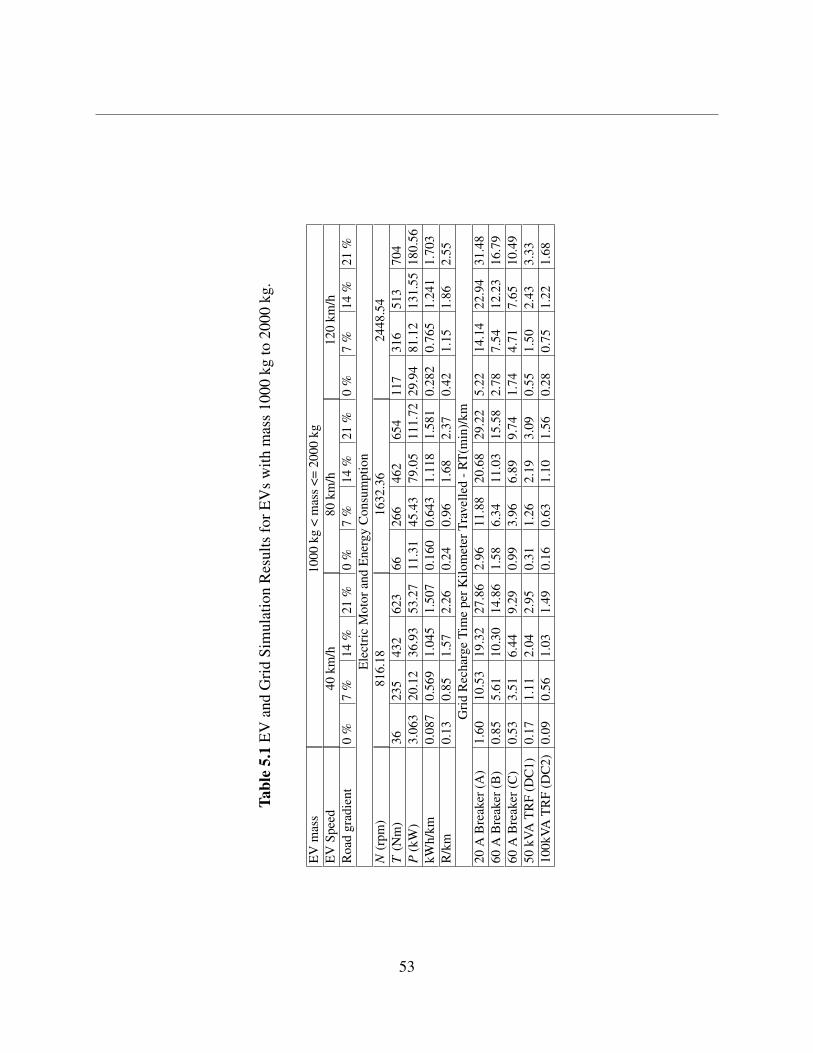
Tabl
e5.
1E
Van
dG
rid
Sim
ulat
ion
Res
ults
forE
Vs
with
mas
s10
00kg
to20
00kg
.
EV
mas
s10
00kg
<m
ass
<=20
00kg
EV
Spee
d40
km/h
80km
/h12
0km
/hR
oad
grad
ient
0%
7%
14%
21%
0%
7%
14%
21%
0%
7%
14%
21%
Ele
ctri
cM
otor
and
Ene
rgy
Con
sum
ptio
nN
(rpm
)81
6.18
1632
.36
2448
.54
T(N
m)
3623
543
262
366
266
462
654
117
316
513
704
P(k
W)
3.06
320
.12
36.9
353
.27
11.3
145
.43
79.0
511
1.72
29.9
481
.12
131.
5518
0.56
kWh/
km0.
087
0.56
91.
045
1.50
70.
160
0.64
31.
118
1.58
10.
282
0.76
51.
241
1.70
3R
/km
0.13
0.85
1.57
2.26
0.24
0.96
1.68
2.37
0.42
1.15
1.86
2.55
Gri
dR
echa
rge
Tim
epe
rKilo
met
erTr
avel
led
-RT
(min
)/km
20A
Bre
aker
(A)
1.60
10.5
319
.32
27.8
62.
9611
.88
20.6
829
.22
5.22
14.1
422
.94
31.4
860
AB
reak
er(B
)0.
855.
6110
.30
14.8
61.
586.
3411
.03
15.5
82.
787.
5412
.23
16.7
960
AB
reak
er(C
)0.
533.
516.
449.
290.
993.
966.
899.
741.
744.
717.
6510
.49
50kV
AT
RF
(DC
1)0.
171.
112.
042.
950.
311.
262.
193.
090.
551.
502.
433.
3310
0kVA
TR
F(D
C2)
0.09
0.56
1.03
1.49
0.16
0.63
1.10
1.56
0.28
0.75
1.22
1.68
53

5 Simulation Results and Analysis
Table 5.2 Daily limits Simulation Results for EVs with mass 1000 kg to 2000 kg.
1000 kg < mass <= 2000 kg
Range(Km) Limits forHome/AC Charging Levels
RT(min)/km for a 0 % Road slope Range Limit a Day (km)
40 km/h 80 km/h 120 km/h 40 km/h 80 km/h 120 km/hAC Level 2A 1.60 2.96 5.22 224.677 121.657 68.959AC Level 2B 0.85 1.58 2.78 421.269 228.108 129.298AC Level 2C 0.53 0.99 1.74 679.245 363.636 206.897
kWh Limits for Home/ACCharging Levels
kWh/km for a 0 % Road slope Energy Limit a Day (kWh)
40 km/h 80 km/h 120 km/h 40 km/h 80 km/h 120 km/hAC Level 2A 0.087 0.160 0.282 19.475 19.475 19.475AC Level 2B 0.087 0.160 0.282 36.515 36.515 36.515AC Level 2C 0.087 0.160 0.282 58.876 58.210 58.429
Rand Limits for Home/ACCharging Levels
R/km for a 0 % Road slope Cost Limit a Day (Rands)
40 km/h 80 km/h 120 km/h 40 km/h 80 km/h 120 km/hAC Level 2A 0.13 0.24 0.424 29.21 29.21 29.21AC Level 2B 0.13 0.24 0.42 54.77 54.77 54.77AC Level 2C 0.13 0.24 0.42 88.31 87.31 87.64
Figure 5.1 Daily range limit against Home/AC charging level for an average road gradientof 0 %.
54

Figure 5.2 Daily Energy Limit against Home/AC charging level for an average road gra-dient of 0 %.
elling speed, the longer the daily range limit (km). Using a higher-level charger extends the daily
travelling range limit. Here a balanced choice from Fig. 5.1 could be AC Level 2B and a travelling
speed of 80 km/h, yielding daily range limit of 228.1 km for overnight home charged EVs.
Since there are six hours available for overnight charged EVs for all charging levels, it can be
noted that level 2A (3.68 kW) draws just over 19.475 kWh of energy from the grid for the duration
of six hours. Level 2B (6.90 kW) draws just over 36.515 kWh of energy from the grid for the
duration of six hours. Finally level 2C (11.04 kW) draws just over 58.826 kWh of energy from the
grid for the duration of six hours. From this information, Fig. 5.2 can be plotted.
Fig. 5.2 shows the maximum overnight energy that the grid can provide for the duration of six
hours for AC Level 2A, AC Level 2B and AC Level 2C chargers. This means that if an EV has
energy capacity greater than 60 kWh then the EV cannot be charged overnight from empty to full
in one day using any of the above charging levels. Using the above results and the assumption that
the tariff is 1.50 ZAR/kwh, the daily travelling cost limit is plotted (in ZAR) is plotted in Fig. 5.3.
55

5 Simulation Results and Analysis
Figure 5.3 Daily Cost Limit against Home/AC charging level for an average road gradientof 0 %.
In Fig. 5.3, it can be seen that for AC Level 2A charger the owner of the EV can spend a
maximum of ZAR 29.21 on overnight charging per day. With AC Level 2B charger can spend a
maximum of ZAR 54.77 on overnight charging per day. In addition, with AC Level 2C charger
can spend a maximum of ZAR 88 on overnight charging per day. This assumes the same tariff for
all charging levels 2A, 2B and 2C, which might not be the case in future.
5.1.2 EV to Grid (Discharging) Analysis
In this section, it is assumed that the EV battery system consists of several battery packs, with every
battery pack connected to a single 1 pu “power converter” such that the number of battery packs
in an EV is equivalent to the number of power converters. Table 5.3 contains various information
about every battery pack in an EV including cells connected in series for power converter input
voltage requirement, cells connected in parallel for EV power and energy requirements, number
of 1 pu power converters (which will be connected in series and parallel to define the real power
converter) required by an EV and battery pack dimensions. All this information is put together to
find the V2G capabilities of each EV battery pack when used as power wall or household battery
bank.
56

In Table 5.3, the number of battery cells in series and parallel (for power and energy pack)
required per converter were recorded during every simulation. In addition, the dimensions of each
battery pack and number of battery packs were recorded for every simulation. The information
about battery cells and battery packs required by an EV for every road gradient and every travelling
speed recorded above plays an important role when talking about vehicle to grid (V2G) capabilities.
5.1.3 V2G Capabilities per Battery Pack
Assume one 5 kW battery pack is removed from an EV and used as a power wall or battery bank
for household appliances, and assume that the battery pack is connected to a 1 kW load. Then
Table 5.4 shows the results for the duration it will take each battery pack to run out of its rated
energy. Here, the EV power pack and energy pack are analyzed. The weight of each battery pack
is also calculated and shown in the table for portability analysis.
In this section, each battery pack (single unit) is analyzed to find out it capability of being used
as a source of electricity at least at home to power essential appliances like lights, fridge, stove,
etc. Table 5.4 tabulates the results and these are plotted in the following sections to visualize the
results.
Battery Pack to Load (Hours)
Fig. 5.4 shows the duration in hours each EV power pack (PP) can last when delivering a power of
1 kW to the load (assuming constant power load).
It should be remembered that one power pack (PP) used in this study is rated at 5 kW. From the
57

5 Simulation Results and Analysis
Table5.3
PowerPack
andE
nergyPack
Simulation
Results.
EV
mass
1000kg
<m
ass<=
2000kg
EV
Speed40
km/h
80km
/h120
km/h
Road
gradient0
%7
%14
%21
%0
%7
%14
%21
%0
%7
%14
%21
%B
atteryC
ellsC
onnectionand
PowerC
ontrollersC
ellsParallelP/PC28.0
28.028.0
28.028.0
28.028.0
28.028.0
28.028.0
28.0C
ellsParallelE/PC
94.394.3
94.394.3
47.247.2
47.247.2
31.431.4
31.431.4
CellsSeriesV
/PC8.3
8.38.3
8.38.3
8.38.3
8.38.3
8.38.3
8.3N
umberO
fPCsP/E
V0.6
4.27.8
11.22.4
9.616.6
23.56.3
17.127.7
38.0N
umberO
fPCsE
/EV
2.214.3
26.237.8
4.016.1
28.139.6
7.119.2
31.142.7
Battery
Cells
Arrangem
entB
PWidthD
imP/PC
9.79.7
9.79.7
9.79.7
9.79.7
9.79.7
9.79.7
BPL
engthDim
P/PC24.1
24.124.1
24.124.1
24.124.1
24.124.1
24.124.1
24.1B
PWidthD
imE
/PC17.7
17.717.7
17.712.5
12.512.5
12.510.2
10.210.2
10.2B
PLengthD
imE
/PC44.3
44.344.3
44.331.3
31.331.3
31.325.6
25.625.6
25.6
58

Table 5.4 V2G Duration (Hours) for Power Pack and Energy Pack.
Load (kW) Vehicle to Grid Duration (Hours) Per Battery Pack1kWADMD5kWPP 3.99 3.99 3.99 3.99 3.99 3.99 3.99 3.99 3.99 3.99 3.99 3.991kWADMD5kWEP 13.44 13.44 13.44 13.44 6.72 6.72 6.72 6.72 4.48 4.48 4.48 4.48Mass(kg)5kWPP 17.49 17.49 17.49 17.49 17.49 17.49 17.49 17.49 17.49 17.49 17.49 17.49Mass(kg)5kWEP 58.95 58.95 58.95 58.95 29.48 29.48 29.48 29.48 19.65 19.65 19.65 19.65
Figure 5.4 Using EV power pack for powering the house (Duration in Hours) – V2G-Hours/PP against road gradient.
above graph, it can be seen that one power pack of 5 kW is capable of delivering 1 kW of power for
the duration of 4 hours (3.99 hours). Fig. 5.5 shows the duration (in hours) at which each energy
pack (EP) can deliver 1 kW of power to the load (assuming constant power load).
From Fig. fig:5.5, it should be noted that the duration now depends to the travelling speed of
an EV. The simulations assume constant speed so at high speeds the vehicle requires many power
Figure 5.5 Using EV energy pack for powering the house (Duration in Hours) – V2G-Hours/EP against road gradient.
59
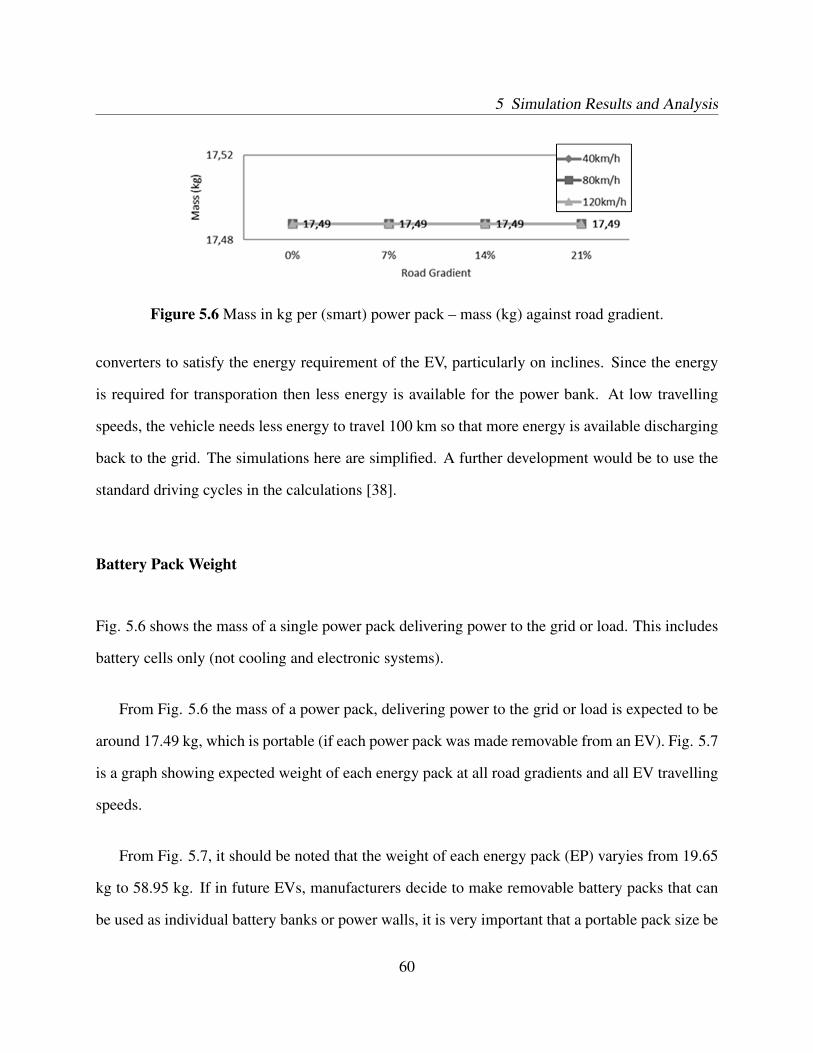
5 Simulation Results and Analysis
Figure 5.6 Mass in kg per (smart) power pack – mass (kg) against road gradient.
converters to satisfy the energy requirement of the EV, particularly on inclines. Since the energy
is required for transporation then less energy is available for the power bank. At low travelling
speeds, the vehicle needs less energy to travel 100 km so that more energy is available discharging
back to the grid. The simulations here are simplified. A further development would be to use the
standard driving cycles in the calculations [38].
Battery Pack Weight
Fig. 5.6 shows the mass of a single power pack delivering power to the grid or load. This includes
battery cells only (not cooling and electronic systems).
From Fig. 5.6 the mass of a power pack, delivering power to the grid or load is expected to be
around 17.49 kg, which is portable (if each power pack was made removable from an EV). Fig. 5.7
is a graph showing expected weight of each energy pack at all road gradients and all EV travelling
speeds.
From Fig. 5.7, it should be noted that the weight of each energy pack (EP) varyies from 19.65
kg to 58.95 kg. If in future EVs, manufacturers decide to make removable battery packs that can
be used as individual battery banks or power walls, it is very important that a portable pack size be
60

Figure 5.7 Mass in kg per (smart) energy pack– mass (kg)/EP against road gradient.
chosen to make it easy to handle. Removable battery packs can solve the issue of long charging
times because at charging stations, the EV can exchange empty packs with charged ones.
61

5 Simulation Results and Analysis
62

Chapter 6
Impacts and Solutions on V2G
Infrastructure
6.1 Impacts of V2G Infrastructure
The following impacts can affect network performance, reliability and quality of electricity sig-
nificantly if not managed properly. Temperature loggers can be useful to detect overloaded trans-
formers while vecto-graph can be used to monitor voltage drop and unbalance in the network.
6.1.1 Overloading
Normally distribution transformers are designed to be operated up to 100 % of their capacity. To
increase reliability and lifetime of the transformer, they are loaded up to 80 % of their capacity.
Distribution transformers can be loaded up to 150 % of their capacity especially during contingency63

6 Impacts and Solutions on V2G Infrastructure
situations.
6.1.2 Voltage Drop
Electricity standards requires that the voltage along all parts of the network be kept within +/-
10 % of the nominal voltage. Actually -10 % is the worst-case scenario, this scenario is avoided
by limiting the minimum voltage to 93 %. When the network operates close to this limit, the
electricity company must fix the problem as fast as possible.
6.1.3 Phase Unbalance
Phase unbalance causes significant current to flow through neutral conductor to earth via earth
resistance increasing neutral voltage to unacceptable limits resulting to phase to neutral voltage
drop.
6.1.4 Network Instability
This problem is observed when EV are discharging the power back to the grid. This impact affects
the quality of electricity delivered to customers.
64

6.2 Solutions on V2G Infrastructure
The previous section outlined the impacts of electric vehicles on the grid. The day to day demand
pattern showed that the distribution transformers are more loaded around 20h00 pm. In this section,
possible solutions to the impacts are provided and discussed.
6.2.1 Uncontrolled Charging
In this approach, EV charging is not controlled either locally or centrally; it is the simplest charging
system. Here the electric vehicle is connected to the network or charge point and charging starts
immediately.
Overnight Charging
Previous investigations and analysis has shown that transformers operate under high load stress
after work hours. When people arrives to their houses, they start using electricity and those with
electric vehicles suddenly start charging to keep their EVs ready for the next day. In addition, the
morning peak, but evening peak is worst. Early observations proved that the LV network start to
relax/ cool down after 22h30 pm until 04h30 am next day. This 6-hour time of flexibility can be
used to charge electric vehicles. By doing this the load due to electric vehicles charging has been
shifted to overnight avoiding transformer over-loading and voltage drop.
65

6 Impacts and Solutions on V2G Infrastructure
Constructive Charging
Constructive charging is when a load is connected to the least loaded phase which can help balance
the network and therefore boosting the network voltage up. This can be done using automatic
phase selector charger. It should be noted that constructive charging does not solve the problem of
transformer overloading, but load shifting does.
Balanced Charging
There are two main issues that cause voltage drop to customer houses. The first one is high current
flowing through the phase conductor due to heavy load and the second one is the current flowing
through neutral conductor due to unbalance loading. Therefore, to minimize significant drop in
voltage at least two phases must be balanced.
6.2.2 Distributed Controlled Charging
This approach does not need any utility operator; it simplifies the system. Here the electric vehicle
is connected to the network/ charge point and the charger itself takes the decision. Although this
approach may result to lower charging costs due to the fact that there is no middle man (aggregator),
it might not be reliable enough to ensure safety to utility equipments and quality of supply to all
customers in the network, especial voltage sensitive customers.
66

Distributed Local Charging
This is the simplest approach that can be used, here no communication required between the EV
and the charge point. It simplifies the charge point complexity since no communication is required.
This uses a simple principle, Low voltage means high load, and high voltage means low load. If
low voltage is detected then the device will not charge the EV, else it will start charging instantly
if the device measures high voltage. This approach should be applied when charging downstream
the network since upstream voltages are usually always within the standard, unlike downstream
where voltages are the lowest.
Distributed Central Charging
In this approach, the charge point request and verify the vehicle information including voltage,
temperature, etc. The charge point then measures the voltage and the current of the transformer.
Using this vehicle, transformer and network information, it then decides if the network has neces-
sary capacity to charge the vehicle or not. If the network is able to charge the vehicle, it then starts
the charging process, else it rejects the vehicle with a relevant message. This approach can more
effective if applied in a modernized network with real time network information.
6.2.3 Centralized Controlled Charging
This approach involves the utility operator; it is a bit complicated system. Here the electric vehicle
is connected to the network or charge point and the utility operator or aggregator takes the decision.
These charging schemes are more reliable then distributed schemes except that the charging cost
might be higher due the presence of a middle man called aggregator. The distribution network in
67

6 Impacts and Solutions on V2G Infrastructure
its current state in South Africa is not capable of supporting these charging schemes. The network
needs to be modernized using smart metering devices at all strategic positions on the network to
avoid phase imbalance, over currents, over voltages (upstream) and under voltages (downstream).
New database centers for information storing and processing might need to be built to support
these charging schemes.
Centralized exclusive Charging
Here the vehicle is connected to the network or charge point. The charge point collects network
and vehicle information such as voltage, temperature, etc. Then the charge point sends all this
information to the utility operator where the final decision is taken and response is given back to
the charge point. The charge point gives feedback to the vehicle as to whether it can charge or not,
if it can charge, under what constraints must it charge and then start charging if the vehicle owner
agrees to the constraints if there are any.
Centralized inclusive Charging
In this approach, charging one EV stops the charging of another EV. This allows large number
of EVs into the network at the same time but increases battery recharging time. Using this ap-
proach helps to make sure that the maximum loading of distribution transformer does not exceed
maximum limit.
68

Centralized Price-Based Charging
Here electric vehicle owners are not limited to charging overnight but they charge their EVs on
a varying electricity price/tariff. During peak hours the electricity price increases rapidly to dis-
courage EV owners from charging during this time. Only those who are willing to pay more will
charge from the network. This approach enables utility companies to generate more profit during
peak hours. It will also ensure continuous service to its customers.
69

6 Impacts and Solutions on V2G Infrastructure
70

Chapter 7
Discussion and Conclusions
7.1 Discussion
The focus for this work was to address challenges associated with vehicle to grid (V2G) and grid to
vehicle (G2V) technologies. A number of challenges including insufficient information regarding
EV technology faced this study. This might be because this technology is still being developed by
various companies including TESLA, Chevrolet, Mercedes, BMW, etc., so they still lot of com-
petition in this industry leading to less technical information available to public. To get better
understanding, an EV had to be modelled, simulated and analyzed. The other challenge is that this
technology is not mature yet leading to lot of changes/new solutions being implemented by EV
designers/manufactures. Despite all challenges, this study continued, using all available resources
and solving all arising challenges.
Uncontrolled charging is found to cause overloading, voltage drop and phase unbalance, with EV
discharging causing network instability. These impacts can be minimized using overnight charg-
71

7 Discussion and Conclusions
ing, constructive charging, balanced charging, distributed controlled charging, and centralized con-
trolled charging methods.
For single-phase distribution transformers, there are two possible impacts that can be caused by
charging EV, which is overloading and voltage drop. Overnight charging can be used to solve the
problem of transformer overloading and voltage drop by keeping the length of LV feeder as short
as possible such that the end voltage to EV service equipment (EVSE) is within the standard (i.e.
within 10 % of 230 V).
For three phase distribution transformers with single-phase supply to the house, the problem of
phase imbalance has to be addressed to avoid/ limit under voltage due to excessive current flowing
through neutral conduct to ground. This impact can be limited by using constructive charging if
the load is not balanced. Therefore, for better charging at night, it is a good idea that overnight
charging is used together with constructive charging. For three phase transformers with three-
phase supply to houses, the problem of phase imbalance is solved by adopting balanced charging
(i.e., using a three-phase EV charger).
Other solutions including distributed controlled charging and centralized controlled charging need
to be considered and implemented especially as the number of EVs increases overtime. These
solutions are reliable than uncontrolled solutions but expensive. Controlled charging methods will
also improve customer satisfaction, flexibility since EV customers will no longer be limited to
overnight charging, and hence no daily limits (i.e., daily travelling range limit) will apply to EV
owners. For best control of EV charging, it is recommended that more solutions are used together,
i.e. uncontrolled solutions together with distributed and centralized controlled charging. Off-
board charging stations (i.e. DC Level 1 and DC Level 2) need to be constructed to support home
charging, solve the problem of street charging, and maximize charging flexibility and satisfaction.
Renewable energy sources including solar and wind farms shall be used especially in EV fleets to
support conventional grid. In South Africa, the sun’s irradiance is stronger, so PV farms seems to
72

be promising renewable energy source.
7.2 Conclusions
The basics of V2G and G2V technology has been provided to familiarize the reader with the con-
cept of V2G technology. An overview of the EV-Grid system is given and explained component
by component. Due to circuit breaker and mostoff fuse ratings used by ESKOM, an EV on-board
charger connected to the grid via EV service/supply equipment (EVSE) is limited to three possible
charging levels, AC Level 2A, AC Level 2B, and AC Level 2C.
The impacts of V2G technology are listed, including overloading, voltage drop, phase unbalance
(for dual and three phase transformers), and network instability. The solutions to the impacts are
proposed including overnight charging, constructive charging, balanced charging, distributed con-
trolled charging, and centralized controlled charging methods.
The smart grid has been studied to understand how domestic load varies over the year and during
the day. From the yearly load profile, it is observed that the feeder/network feeding domestic load
is more loaded in winter (i.e. June to August) implying the majority of distribution transformers
are more loaded during winter period. From mid-winter (July) daily load profile, it is observed
that the majority of domestic distribution transformers are least loaded (below 32 % of their rated
capacity) from 22:30 pm to 04:30 am which is the duration of six hours. Using the information
observed from grid/demand study, the number of EVs that can be connected to each transformer
per phase are calculated, tabulated (for 16 kVA to 5000 kVA distribution transformers), and plotted
(for 16 kVA to 200 kVA distribution transformers).
An EV model has been developed from conservation of momentum, gear ratio model, and power
73

7 Discussion and Conclusions
flow diagram. This model is useful for analysing the behaviour of an EV at different conditions
(i.e., at different road gradients and at different travelling speeds). Before applying the model to
MATLAB, all model parameters had to be assigned practical values. All assumed parameter values
are tabulated and discussed.
A MATLAB model was developed for an EV-Grid system (for G2V analysis) and Power-Energy
pack system (for V2G analysis). The model is simulated using developed MATLAB script to avoid
human reading error, improve reliability of results, and speed up simulation time for every set of
input parameters. The script reads inputs from excel, assign them to the MATLAB model, run
the model, wait for the simulation to complete and read model outputs, writes them back to excel
spreadsheet where further processing of model results is done. See MATLAB script in appendix
G.
From the grid study results (the available charging period is six hours for overnight home charged
EVs) and EV-Grid model simulation results (battery pack recharge time per kilometre travelled
(min/km)), the limits/ boundaries (daily travelling range limit, daily energy limit, and daily travel-
ling cost limit) are calculated, tabulated and plotted for analysis. These results are for an EV with
a journey average road slope of 0 %.
From the results, it is seen that the daily travelling range limit depends to the level of overnight
charger and EV travelling speed. The higher the level of overnight charger (i.e. AC Level 2C), and
or the slower the travelling speed of an EV, the greater the daily travelling range limit. For medium
speed (80 km/h) and medium overnight charger (AC Level 2B), the daily travelling range limit is
228.108 kilometres (which is considered as the average daily travelling limit for overnight home
charged EVs of mass from 1000 kg to 2000 kg).
Using kilowatt-hour per kilometre travelled (kwh/km) results from EV-Grid simulation results to-
gether with daily travelling range limit results, the daily energy (kWh) limit is calculated, tabulated
and plotted for analysis. The average daily energy limit is 36.515 kWh. From daily energy (kWh)
74
limit and the EV tariff assumption of 1.50 (ZAR/kwh), the daily cost (ZAR) limit is calculated,
tabulated, and plotted for analysis. The average daily cost limit is 54.77 ZAR.
EVs whose owners are using one EV for daily travelling purpose (i.e., going to work every day) and
whom do not have other charging options (i.e., optimistic and dedicated charging) except overnight
home charging cannot exceed daily limits.
The EV-Grid (V2G) system capabilities are analysed to see if EV battery packs are capable of
being used as distributed generators (DGs), grid alternative for home electricity (especially during
contingencies and load shedding) and power/energy banks (for future EVs with removable battery
packs). Each power pack rated at 5 kW is found to be capable of delivering 1 kW of power to
the load for the duration of 4 hours and weighs 17.5 kg. For energy packs, the discharge duration
and pack mass are dependent to the speed at which the vehicle is travelling. Each energy pack can
deliver 1 kW of power for the duration of 4.5 hours (4 hour 30 minutes) to 13.4 hours, and weighs
19.7 kg to 59 kg. The discharge duration and mass of energy packs increases with decreasing
travelling speed of an EV.
Future EVs are likely to have removable portable battery packs as one technique to solve the prob-
lem of long charging times (instead, in charging stations, an EV can just exchange empty battery
packs with full packs without waiting any time). Removable battery packs in EVs will greatly im-
prove their flexibility and will solve lot of problems. Indeed this option is being used for scooters
in Taiwan.
Under discussion section, findings in this paper are discussed and recommendations are given. This
includes for best control of EV charging, it is best to use multiple solutions together (i.e. uncon-
trolled charging together with distributed and centralized controlled charging methods), controlled
charging methods are expensive than uncontrolled charging solutions but they provide better con-
trol, reliability and customer satisfaction. To improve flexibility and charging time, off-board
charging stations (DC Level 1 and DC Level 2) needs to be considered.
75

7 Discussion and Conclusions
Finally, EVs can be safely integrated into the power grid with intelligent charge control through
V2G. V2G provides significant benefits to all stakeholders. V2G has many additional applications
in the smart grid and microgrids [39]. This thesis provided a step forward to current impacts. There
is more research still to do before fully integrating EVs to the grid in South Africa.
76

Bibliography
[1] Kyungsung An, Kyung-Bin Song, and Kyeon Hur. Incorporating charging/discharging strat-
egy of electric vehicles into security-constrained optimal power flow to support high renew-
able penetration. Energies, 10:5(729), 2017.
[2] S. Goriparti, E. Miele, F. De Angelisa, E. Di Fabrizioc, R. Proietti Zaccariaa, and
C. Capigliaa. Review on recent progress of nanostructured anode materials for li-ion bat-
teries. Journal of Power Sources, 257:421–443, 2014.
[3] Energy Star. Energy Star Market and Industry Scooping Report, 2013. https://www.
energystar.gov/sites/default/files/asset/document/Electric_Vehicle_Scoping_Report.pdf [Ac-
cessed: April 2019].
[4] Julian de Hoog. The impact of electric vehicles on the grid. Presentation, Economy and
Infrastructure Committee, State Parliament of Victoria, Australia, 2017.
[5] SAE J1772. Charging infrastructure and chargers, 2011. http://ecee.colorado.edu/
~ecen5017/lectures/CU/L40_slides.pdf [Accessed: April 2019].
[6] Claus Daniel. Lithium ion batteries and their manufacturing challenges. US Department of
Energy, United States, 2014.
77
BIBLIOGRAPHY
[7] Len Thomas. Will 20700 and 21700 battery be more popular than 18650?, 2017. http:
//www.xtar.cc/news_detail/newsId=135.html [Accessed: April 2019].
[8] Chris Lee. Tesla Elon Musk: 18650 battery is an accident, the future is 21700, 2017. https:
//www.linkedin.com/pulse/tesla-musk-18650-battery-accident-future-21700-chris-lee [Ac-
cessed: April 2019].
[9] W. Kempton and S. Letendre. Electric vehicles as a new power source for electric utilities. J
Transp Res Part D, 2:25–150, 1997.
[10] M. Ehsani, M. Falahi, and S. Lotfifard. Vehicle to grid services: potential and applications.
Energies, 5:23–97, 2012.
[11] M. A. Hannan, F. A. Azidin, and A. Mohamed. Hybrid electric vehicles and their challenges:
A review. Renewable and Sustainable Energy Reviews, 29:135–150, 2014.
[12] Mintel Reports. Hybrid and Electric Cars - US November 2012. Technical report, Mintel
International Group Ltd, 2012.
[13] Maletlabo Handel. Electric Vehicle Adoption in the South African Context, 2018. http:
//sustainabilityweek.co.za/assets/files/Day%203%20-%20UNIDO%20-%20Transport.pdf
[Accessed: April 2019].
[14] Staff Writer. Here’s how many electric cars have been sold in
South Africa, 2018. https://businesstech.co.za/news/motoring/219585/
heres-how-many-electric-cars-have-been-sold-in-south-africa/ [Accessed: April 2019].
[15] Auto SA and Electric. Charging Stations in South Africa, 2018. https://www.google.
com/maps/d/viewer?mid=1QXzU3cB5GCKNawPyu4SzK7B1S8k&hl=en_US&ll=-20.
453251536184183%2C32.52460274193379&z=5 [Accessed: April 2019].
78
[16] EAI. Cost of Li-ion Batteries, Cost Trends 2018-2030, $/kWh with Break Ups, 2018. http:
//www.eai.in/blog/2018/12/cost-of-batteries.html [Accessed: April 2019].
[17] M. D. Galus, M. G. Vaya, T. Karuse, and G. Andersson. The role of electric vehicles in smart
grids. Wiley Interdiscip Rev. Energy Environ, 2:39–117, 2014.
[18] M. F. Shaaban, M. Y. Atwa, and E.F. El-Saadany. PEVs modeling and impacts mitigation in
distribution networks. IEEE Trans on Power Systems, 28:1122–1131, 2013.
[19] R. C. Green, L. Wang, and M. Alam. The impact of plug-in hybrid electric vehicles on
distribution networks: a review and outlook. Renew Sustain Energy Rev, 15:544–553, 2011.
[20] L. J. A. Pecas, F. J. Soares, and P. M. R. Almeida. Integration of electric vehicles in the
electric power system. Proc IEEE, 99:168–183, 2011.
[21] M. A. Ortega-Vazquez, F. Bouffard, and V. Silva. Electric vehicle aggregator/system oper-
ator coordination for charging scheduling and services procurement. IEEE Trans on Power
Systems, 28:1806–1815, 2013.
[22] Hugo Morais, Zita Vale Tiago Sousa, and Pedro Faria. Evaluation of the electric vehicle
impact in the power demand curve in a smart grid environment. Springer, Portugal, 2014.
[23] Jim Harrison. A look at the latest battery technology from TESLA, 2018. https://www.
maximintegrated.com/en/design/blog/tesla-battery-technology.html [Accessed: April 2019].
[24] W. Su. Smart grid operations integrated with plug-in electric vehicles And renewable energy
resources. Phd dissertation, 2013.
[25] F. Mwasilu, J. J. Justo, E.-K. Kim, T. D. Do, and J.-W. Jung. Electric vehicles and smart grid
interaction: A review on vehicle to grid and renewable energy sources integration. Renewable
and Sustainable Energy Reviews, 34:501–516, 2014.79

BIBLIOGRAPHY
[26] International Electrotechnical Commission (IEC). Grid integration of Large capacity renew-
able energy sources and use of large-capacity electrical Energy storage. White paper 3;,
Berlin, 2012.
[27] M. Vasirani, R. Kota, R. L. G. Cavalcante, S. Ossowski, and Jennings N. R. An agent-based
approach to virtual power plants of wind power generators and electric vehicles. IEEE Trans
on Smart Grid, 4:1314–1322, 2013.
[28] C. Carter-Brown, K. Dedekind, and P. Moyo. Distribution voltage regulation and apportion-
ment limits. Report, Eskom, South Africa, 2013.
[29] M. Essop, C. Smith, and P. Moyo. Mv contingency plan standard. Report, Eskom, South
Africa, 2016.
[30] B. Pietersen, K. Dedekind, and M. Songo. Methodology for network development plans.
Report, Eskom, South Africa, 2017.
[31] T. Kleynhans, D. Gutschow, and J. van der Merwe. Planning standard for distribution network
reliability to ensure distribution code compliance. Report, Eskom, South Africa, 2015.
[32] Zeina Bitar and Samih Al Jabi. Studying the performances of induction motor used in electric
car. Energy Procedia, 50:342–351, 2012.
[33] Qi Huang, Jian Li, and Yong Chen. Control of electric vehicle. In Seref Soylu, editor, Urban
Transport and Hybrid Vehicles, pages 162–192. Intechopen.com, 2010.
[34] I. Boldea, L Tutelea, L. Parsa, and D. G. Dorrell. Automotive electric propulsion systems with
reduced or no permanent magnets: an overview. IEEE Transactions of Industrial Electronics,
61:10:5696–5711, 2014.
80

[35] D.E.L. Local road design standards, 1996. www.kzntransport.gov.za/reading_room/reports/
carns/CARNS%20Chapter%208.pdf [Accessed: April 2019].
[36] M. Chow, W. Su, H. Rahimi-Eichi, and W. Zeng. A survey on the electrification of transporta-
tion in a smart grid environment. IEEE Transactions on Industrial Informatics, 8:103–173,
2012.
[37] F. A. Salem. Modelling and control solutions for electric vehicles. European Scientific Jour-
nal, 9:221–240, 2013.
[38] Romain Nicolas. The different driving cycles, 2013. http://www.car-engineer.com/
the-different-driving-cycles/ [Accessed: April 2019].
[39] V. C. Gungor, D. Sahin, T. Kocak, S. Ergut, C. Buccella, C. Cecati, and G.P. Hancke. A
survey on smart grid potential applications and communication requirements. IEEE Trans on
Industrial Informatics, 9:28–42, 2013.
81

BIBLIOGRAPHY
82

Appendix A
Smart Grid Analysis
83
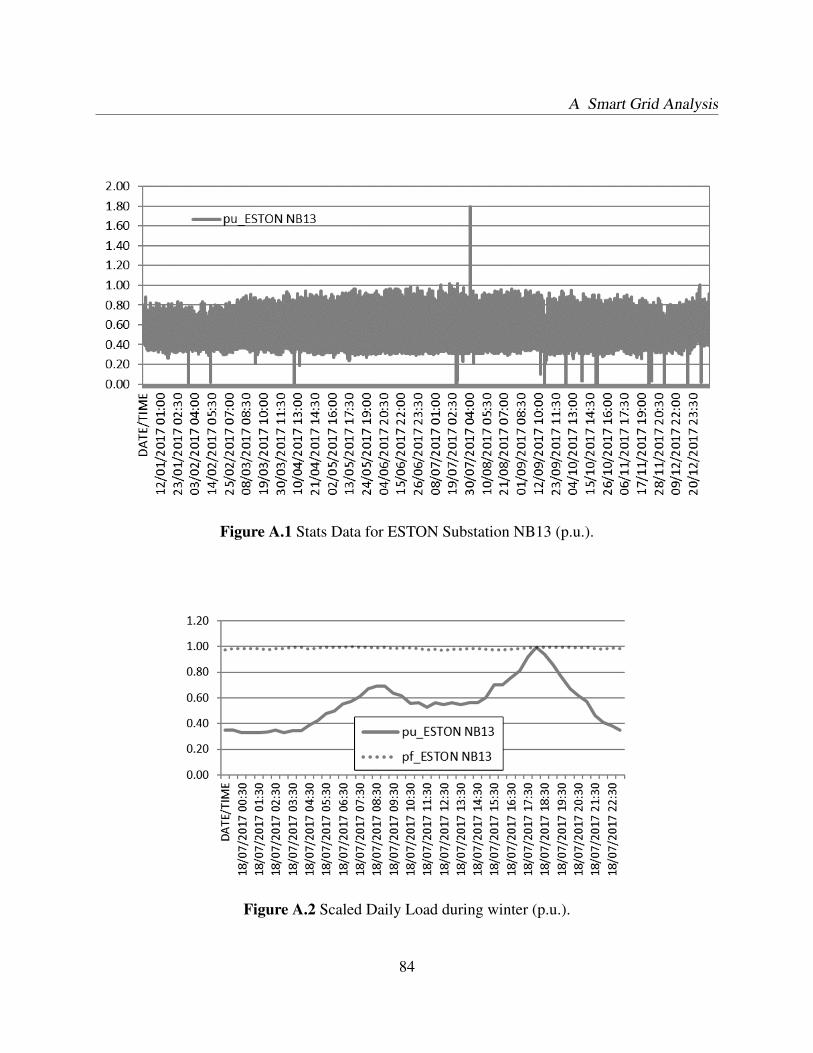
A Smart Grid Analysis
Figure A.1 Stats Data for ESTON Substation NB13 (p.u.).
Figure A.2 Scaled Daily Load during winter (p.u.).
84

Figure A.3 Scaled Daily Load during summer (p.u.).
85

A Smart Grid Analysis
86

Appendix B
Grid-EV (G2V) Simulation Results
Figure B.1 Torque experienced by Electric Motor(s) – T(m) against road gradient.
87
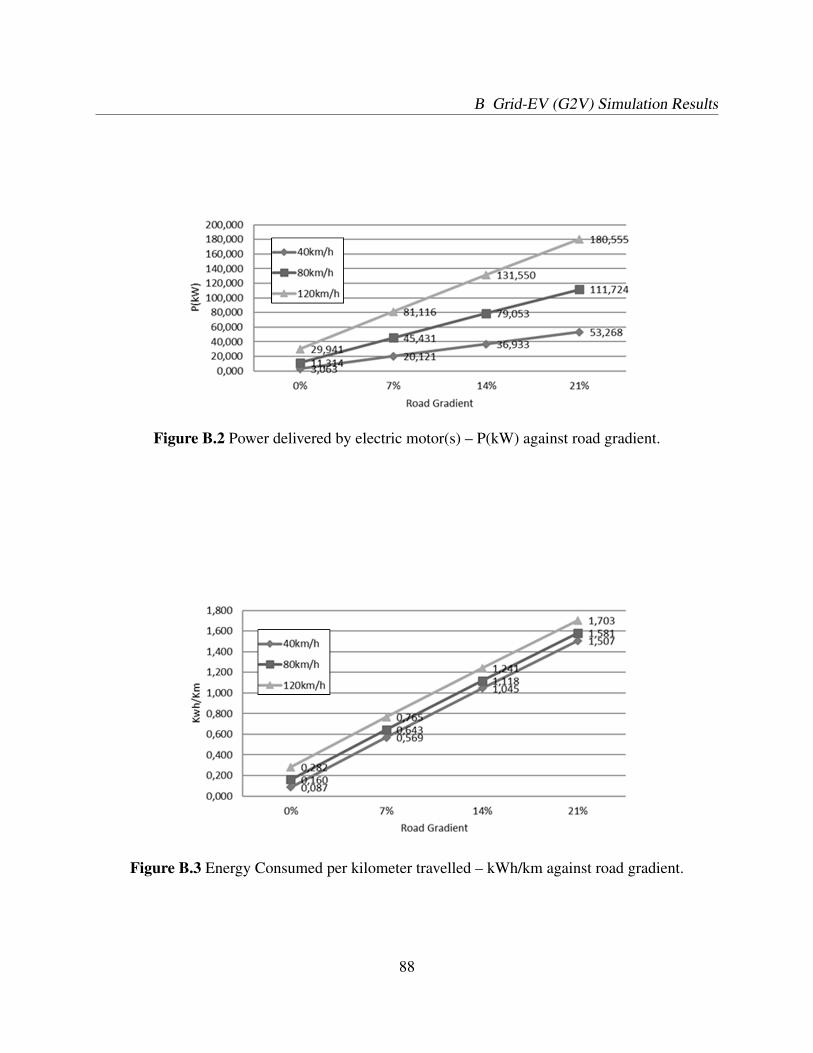
B Grid-EV (G2V) Simulation Results
Figure B.2 Power delivered by electric motor(s) – P(kW) against road gradient.
Figure B.3 Energy Consumed per kilometer travelled – kWh/km against road gradient.
88

Figure B.4 Travelling Cost per kilometer (ZAR/km) – R/km against road gradient.
Figure B.5 Battery Recharge Time from a 20A BRK per kilometer travelled (AC Level2A).
89

B Grid-EV (G2V) Simulation Results
Figure B.6 Battery Recharge Time from a 60A BRK per kilometer travelled (AC Level2B).
Figure B.7 Battery Recharge Time from a 60A BRK per kilometer travelled (AC Level2C).
90

Figure B.8 Battery Recharge Time from a 50kVA TRF per kilometer travelled.
Figure B.9 Battery Recharge Time from a 100kVA TRF per kilometer travelled.
91

B Grid-EV (G2V) Simulation Results
92

Appendix C
EV-Grid (V2G) Simulation Results
93
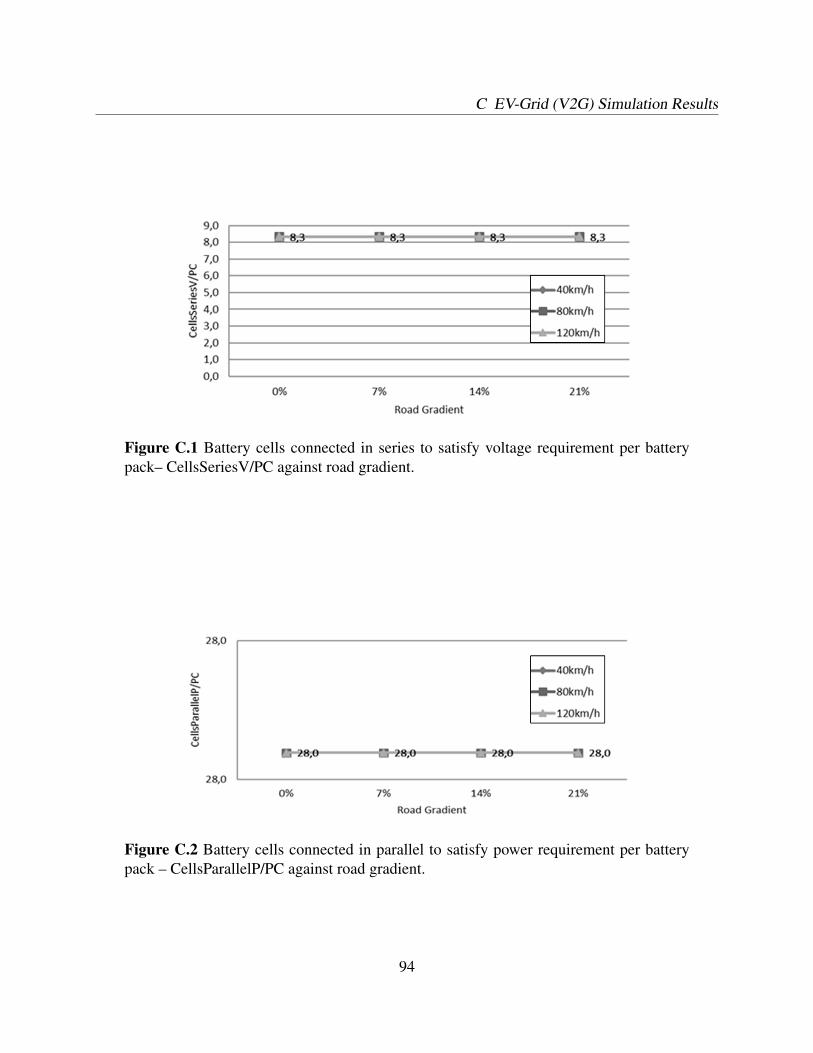
C EV-Grid (V2G) Simulation Results
Figure C.1 Battery cells connected in series to satisfy voltage requirement per batterypack– CellsSeriesV/PC against road gradient.
Figure C.2 Battery cells connected in parallel to satisfy power requirement per batterypack – CellsParallelP/PC against road gradient.
94

Figure C.3 Power Converters required to satisfy power requirement per EV – NumberOf-PCsP/EV against road gradient.
Figure C.4 Battery cells connected in parallel to satisfy energy requirement per batterypack – CellsParallelE/PC against road gradient.
95
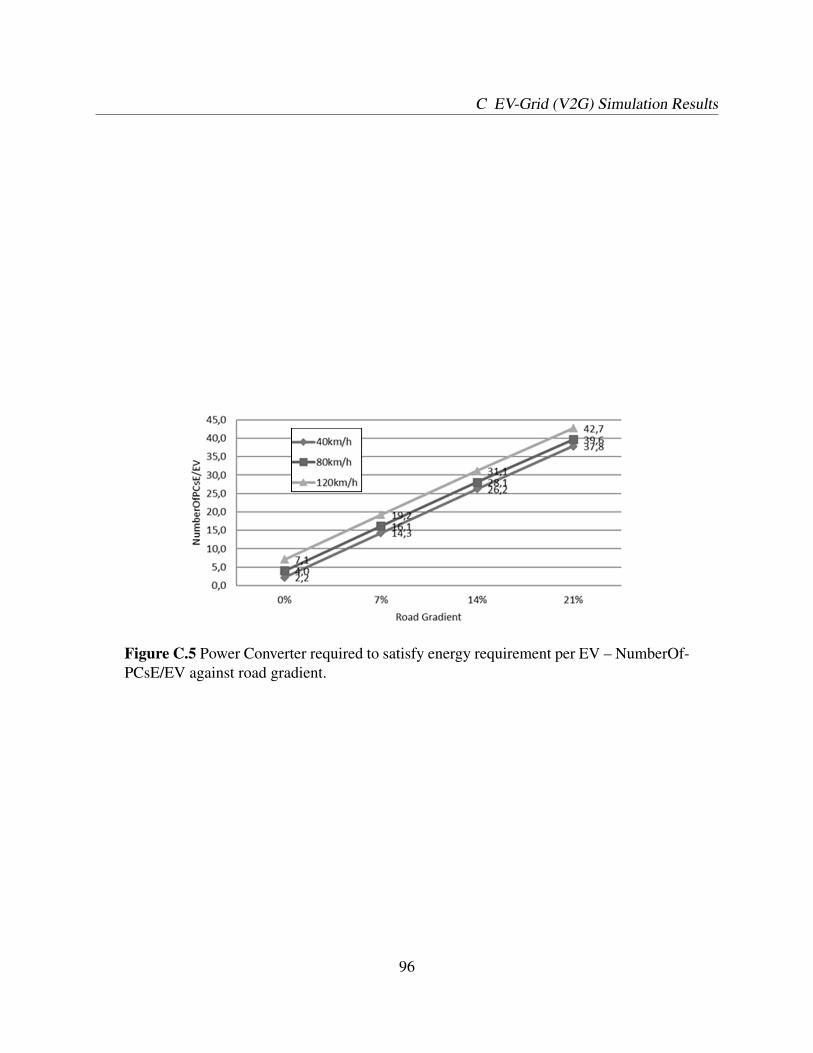
C EV-Grid (V2G) Simulation Results
Figure C.5 Power Converter required to satisfy energy requirement per EV – NumberOf-PCsE/EV against road gradient.
96

Appendix D
Battery Pack Dimensions
Figure D.1 Number of Battery cells along the width of battery pack to satisfy powerrequirement per battery pack – BPWidthDimP/PC against road gradient.
97

D Battery Pack Dimensions
Figure D.2 Number of Battery cells along the length of battery pack to satisfy powerrequirement per battery pack – BPLengthDimP/PC against road gradient.
Figure D.3 Number of battery cells along the width of battery pack to satisfy energyrequirement per battery pack – BPWidthDimE/PC against road gradient.
Figure D.4 Number of battery cells along the length of battery pack to satisfy energyrequirement per battery pack – BPLengthDimE/PC against road gradient.
98
Appendix E
Potential Revenue for Home Charging
99
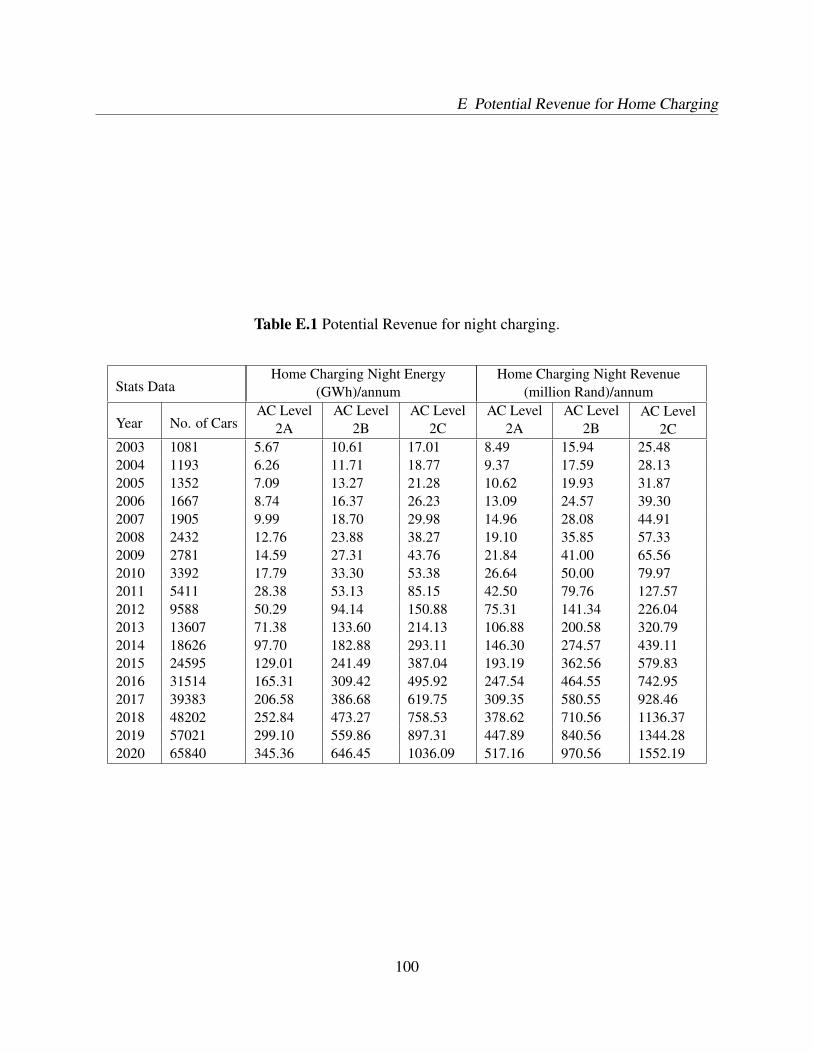
E Potential Revenue for Home Charging
Table E.1 Potential Revenue for night charging.
Stats DataHome Charging Night Energy
(GWh)/annumHome Charging Night Revenue
(million Rand)/annum
Year No. of CarsAC Level
2AAC Level
2BAC Level
2CAC Level
2AAC Level
2BAC Level
2C2003 1081 5.67 10.61 17.01 8.49 15.94 25.482004 1193 6.26 11.71 18.77 9.37 17.59 28.132005 1352 7.09 13.27 21.28 10.62 19.93 31.872006 1667 8.74 16.37 26.23 13.09 24.57 39.302007 1905 9.99 18.70 29.98 14.96 28.08 44.912008 2432 12.76 23.88 38.27 19.10 35.85 57.332009 2781 14.59 27.31 43.76 21.84 41.00 65.562010 3392 17.79 33.30 53.38 26.64 50.00 79.972011 5411 28.38 53.13 85.15 42.50 79.76 127.572012 9588 50.29 94.14 150.88 75.31 141.34 226.042013 13607 71.38 133.60 214.13 106.88 200.58 320.792014 18626 97.70 182.88 293.11 146.30 274.57 439.112015 24595 129.01 241.49 387.04 193.19 362.56 579.832016 31514 165.31 309.42 495.92 247.54 464.55 742.952017 39383 206.58 386.68 619.75 309.35 580.55 928.462018 48202 252.84 473.27 758.53 378.62 710.56 1136.372019 57021 299.10 559.86 897.31 447.89 840.56 1344.282020 65840 345.36 646.45 1036.09 517.16 970.56 1552.19
100

Figure E.1 Number of Cars Sold in Norway per year and Projected/Predicted FutureGrowth.
Figure E.2 Norway’s Potential Energy that could be sold to EVs for Home charging ACLevel 2A, 2B, and 2C.
101

E Potential Revenue for Home Charging
Figure E.3 Norway’s Potential Revenue that could be collected from EVs for Homecharging AC Level 2A, 2B, and 2C.
102

Appendix F
Procedures for Load/Network Studies
103

F Procedures for Load/Network Studies
Figure F.1 Procedure for customer application study.
104

Figure F.2 Procedure for solving under voltage for EVs.
105

F Procedures for Load/Network Studies
Figure F.3 Typical Algorithm for solving under voltage (for ABC OH LV).
106

Appendix G
MATLAB Script for MATLAB Model
%——Clearing Command window screen and all workspace variables———clcclear all%————————————————————————-
% —————————–Excel File———————————-Workbook=’EV Analysis.xlsx’;Worksheet=’EVSimResults’;Range=strcat(xlRange(14,1),’:’,xlRange(15,2)); % returns ’N1:O2’%Column=number2letter(1); % returns ’A’%————————————————————————-
%—————————Simulink Model——————————–Model=’EV-COMPLETEMODEL-v2017b’;%————————————————————————-
%————-Creating Row time values for input data———————tin=0:2:1*5*60;tin=transpose(tin);%————————————————————————-
try
107

G MATLAB Script for MATLAB Model
for i=0:1:2
icMergedCells=4;istartCol=2;iCol=istartCol+i*icMergedCells;
istartRow=5;iRow=istartRow;
iCell=xlRange(iCol,iRow);
%-Reading 2-D Array data from Excel,and converting it into 2-D timeseries-EMSpeedIn=xlsread(Workbook,Worksheet,iCell);EMSpeedIn=repmat(EMSpeedIn,length(tin));EMSpeedIn=[tin EMSpeedIn(:,1)];
for j=0:1:3
jcMergedCells=1;jCol=iCol+j*jcMergedCells;
jstartRow=3;jRow=jstartRow;
jCell=xlRange(jCol,jRow);
RoadGradIn=xlsread(Workbook,Worksheet,jCell);RoadGradIn=repmat(RoadGradIn,length(tin));RoadGradIn=[tin RoadGradIn(:,1)];
[num,txt]=xlsread(Workbook,Worksheet,’B1’);[D,S]=regexp(txt,’\d+’,’match’,’split’);EVMassIn=repmat(str2double(D12),length(tin));EVMassIn=[tin EVMassIn(:,1)];%————————————————————————-
% ———-Runing Simulink with input data from Excel———————
108

opt=simset(’solver’,’ode4’,’SrcWorkspace’,’Current’);[tout,xout,yout]=sim(Model,[0 10],opt);% ————————————————————————-
%——–Writing 2-D Array Simulation Results to Excel Spreadsheet———EVSpeedOut=EVOut(:,1);EVSpeedOut=cellstr(sprintf(’%.0f%s’,EVSpeedOut(1:1),’km/h’));xlswrite(Workbook,EVSpeedOut, Worksheet,xlRange(iCol,2));
EMTorqueOut=EMOut(:,1);EMPowerOut=EMOut(:,2);xlswrite(Workbook,EMTorqueOut(2:2);EMPowerOut(2:2), Worksheet,xlRange(jCol,6));
BUnitEnergyOut=EnergyOut(:,1);TUnitCostOut=EnergyOut(:,2);xlswrite(Workbook,BUnitEnergyOut(3:3);TUnitCostOut(3:3), Worksheet,xlRange(jCol,8));
RT20ABrkOut=HomeOut(:,1);RT60ABrkOut=HomeOut(:,2);v xlswrite(Workbook,RT20ABrkOut(3:3);RT60ABrkOut(3:3), Worksheet,xlRange(jCol,11));
RT50KvaTrfOut=PublicOut(:,1);RT100KvaTrfOut=PublicOut(:,2);xlswrite(Workbook,RT50KvaTrfOut(3:3);RT100KvaTrfOut(3:3), Worksheet,xlRange(jCol,13));
BCSeriesVOut=BCSeriesParallelOut(:,1);BCParallelPOut=BCSeriesParallelOut(:,2);BCParallelEOut=BCSeriesParallelOut(:,3);xlswrite(Workbook,BCParallelPOut(3:3);BCParallelEOut(3:3);BCSeriesVOut(3:3), Worksheet,xlRange(jCol,16));
PCPOut=PCPEOut(:,1);PCEOut=PCPEOut(:,2);xlswrite(Workbook,PCPOut(3:3);PCEOut(3:3), Worksheet,xlRange(jCol,19));
BPWidthDimPOut=BCDimOut(:,1);BPLengthDimPOut=BCDimOut(:,2);BPWidthDimEOut=BCDimOut(:,3);BPLengthDimEOut=BCDimOut(:,4);xlswrite(Workbook,BPWidthDimPOut(3:3);BPLengthDimPOut(3:3);BPWidthDimEOut(3:3);BPLengthDimEOut(3:3),Worksheet,xlRange(jCol,22));
109

G MATLAB Script for MATLAB Model
endend
catch
myTextMessage=’Please close EV Analysis Workbook and try again!’;fig = figure;tx = uicontrol(’style’,’text’,’position’,[ 3 40 540 320 ]);set(tx,’string’,myTextMessage);
end%————————————————————————-
110