sb100 joint agency report results
TRANSCRIPT

SB 100 Joint Agency Report Results
Liz Gill, PhDCalifornia Energy Commission
1

InputsSuch as:
• Existing System
• Demand Forecasts/ Scenarios
• Resource Costs
• Reliability Metrics
• Policy Goals
• Resource Potential
• Land Use Screens
PortfolioDevelopment
(Capacity Expansion Modeling)
Scope of 2021 SB 100 Analysis
Reliability TestingOperability/
Full Dispatch
Resource Adequacy
Local Reliability
Production Cost
Modeling
Probabilistic Production
Cost Modeling
Power Flow Modeling
Portfolio ImpactsRates
GHG Emissions
Land Use
Air Pollution Workforce Social Costs
Inputs, impacts, and tools listed are for illustrative purposes
SB 100 Results are Directional

4
Technology Eligibility Basis Scenarios
Solar PV RPS Core and Study
Solar Thermal (existing only) RPS Core and Study
Onshore Wind RPS Core and Study
Offshore Wind RPS Core and Study
Geothermal RPS Core and Study
Bioenergy RPS Core and Study
Fuel Cells (green H2) RPS Core and Study
Small Hydro (existing) RPS Core and Study
Large Hydro (existing) Zero-Carbon Core and Study
Nuclear (existing) Zero-Carbon Core and Study
Zero-Carbon Firm Dispatchable Resource Zero-Carbon Study Only
Zero-Carbon Firm Baseload Resource Zero-Carbon Study Only
Zero-Carbon Resources Included in Modeling

Core Assumptions: Demand Scenarios
5Mahone, Amber, Zachary Subin, Jenya Kahn-Lang, Douglas Allen, Vivian Li, Gerrit De Moor, Nancy Ryan, Snuller Price. 2018. Deep Decarbonization in a High Renewables Future: Updated Results from the California PATHWAYS Model. California Energy Commission. Publication Number: CEC-500-2018-012
IEPR Reference High Electrification
High Biofuels High Hydrogen
PATHWAYS provides RESOLVE:• Annual loads by
category (GWh/yr)• Some load shape
information for load modifiers

6
Customer solar shown here is a demand-side assumption. No additional customer solar was selected.-50,000
0
50,000
100,000
150,000
200,000
2027 2030 2035 2040 2045 2027 2030 2035 2040 2045
60% RPS SB 100 Core
Sele
cted
Cum
ulat
ive
Cap
acity
(MW
)
Gas Capacity Not Retained
Shed DR
Long Duration Storage
Battery Storage
Customer Solar
Utility-Scale Solar
Offshore Wind
New OOS Wind
Wind
Biomass
Geothermal
Hydrogen Fuel Cell
Gas
SB 100 Requires Significant Resource Build
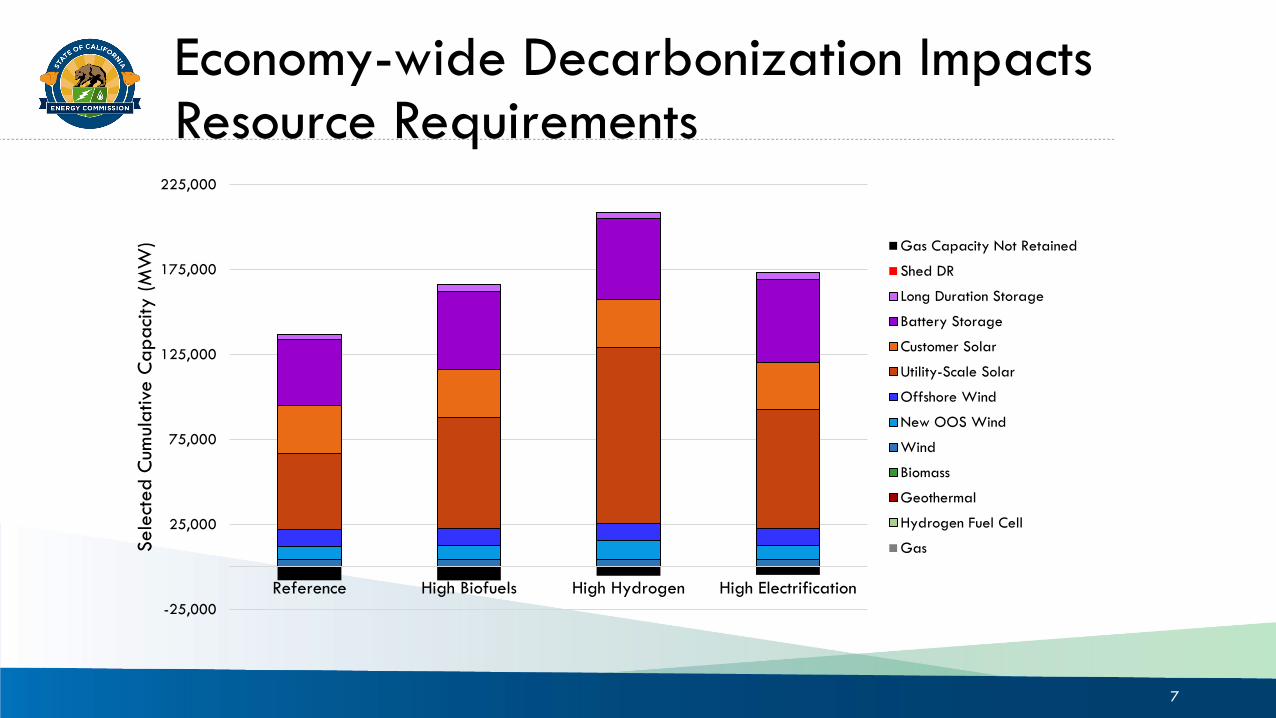
As of 2019, there is 80 GW of in-state capacity in California.
7
-25,000
25,000
75,000
125,000
175,000
225,000
Reference High Biofuels High Hydrogen High Electrification
Sele
cted
Cum
ulat
ive
Cap
acity
(MW
) Gas Capacity Not Retained
Shed DR
Long Duration Storage
Battery Storage
Customer Solar
Utility-Scale Solar
Offshore Wind
New OOS Wind
Wind
Biomass
Geothermal
Hydrogen Fuel Cell
Gas
Economy-wide Decarbonization Impacts Resource Requirements

8
-50,000
0
50,000
100,000
150,000
200,000
250,000
All Resources No New OOSWind
No OSW No New OOSWind or OSW
Core
Sele
cted
Cum
ulat
ive
Cap
acity
(MW
) Gas Capacity Not Retained
Shed DR
Long Duration Storage
Battery Storage
Customer Solar
Utility-Scale Solar
Offshore Wind
New OOS Wind
Wind
Biomass
Geothermal
Hydrogen Fuel Cell
Gas
Resource Technology Pursued Impacts Resource Requirements

9
-50,000
0
50,000
100,000
150,000
200,000
SB 100 Core ZCDispatchable
ZC Baseload ZCDispatchable +
Baseload
Sele
cted
Cum
ulat
ive
Cap
acity
(MW
)
Gas Capacity Not RetainedShed DRLong Duration StorageBattery StorageCustomer SolarUtility-Scale SolarOffshore WindNew OOS WindWindBiomassGeothermalGeneric Zero-Carbon BaseloadHydrogen Fuel CellGeneric Zero-Carbon Dispatchable
Resource Technology Pursued Impacts Resource Requirements

10
Study scenario includes T&D and storage losses in zero-carbon target.-50,000
0
50,000
100,000
150,000
200,000
2027203020352040204520272030203520402045
SB 100 Core Study
Sele
cted
Cum
ulat
ive
Cap
acity
(MW
) Gas Capacity Not Retained
Shed DR
Long Duration Storage
Battery Storage
Customer Solar
Utility-Scale Solar
Offshore Wind
New OOS Wind
Wind
Biomass
Geothermal
Hydrogen Fuel Cell
Gas
Going Beyond SB 100 Impacts Resource Requirements

11
-50,000
0
50,000
100,000
150,000
200,000
250,000
2027 2030 2035 2040 2045 2027 2030 2035 2040 2045
SB 100 Core No Combustion
Cum
ulat
ive
Sele
cted
Cap
acity
(MW
) Gas Capacity Not Retained
Shed DR
Long Duration Storage
Battery Storage
Customer Solar
Utility-Scale Solar
Offshore Wind
New OOS Wind
Wind
Biomass
Geothermal
Hydrogen Fuel Cell
Gas
Going Beyond SB 100 Impacts Resource Requirements
12
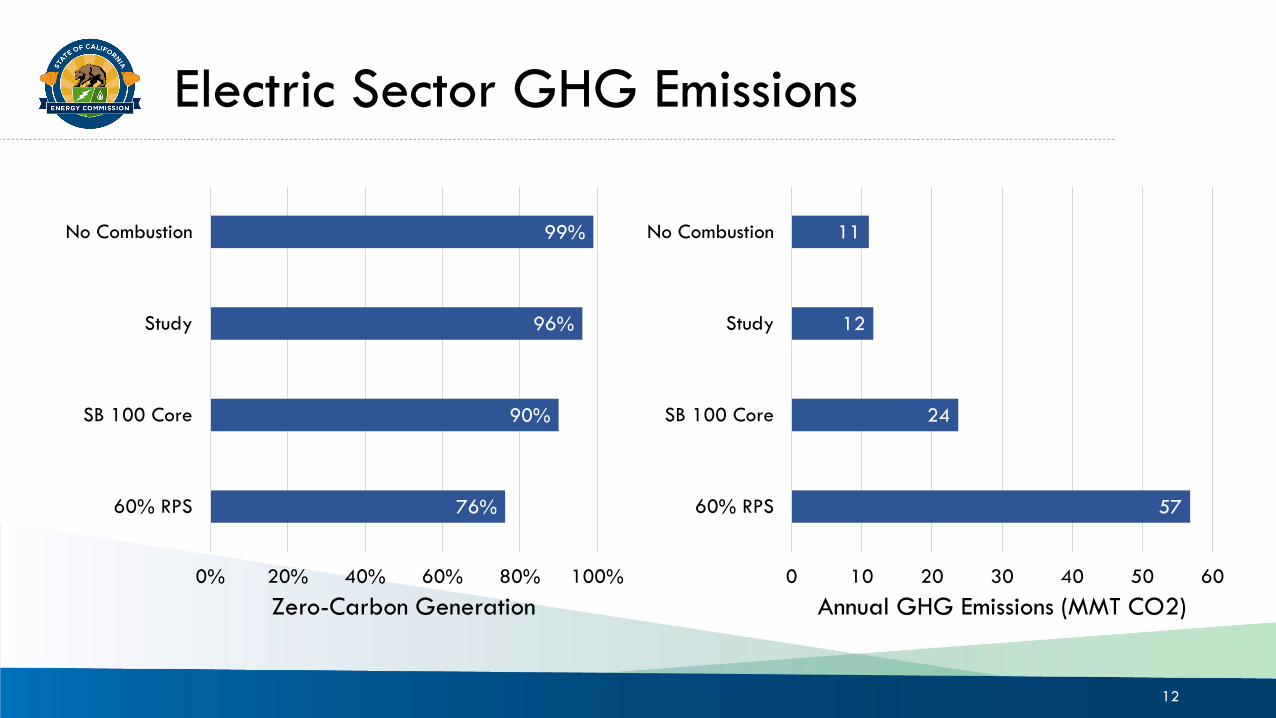
Electric Sector GHG Emissions
57
24
12
11
0 10 20 30 40 50 60
60% RPS
SB 100 Core
Study
No Combustion
Annual GHG Emissions (MMT CO2)
76%
90%
96%
99%
0% 20% 40% 60% 80% 100%
60% RPS
SB 100 Core
Study
No Combustion
Zero-Carbon Generation
13
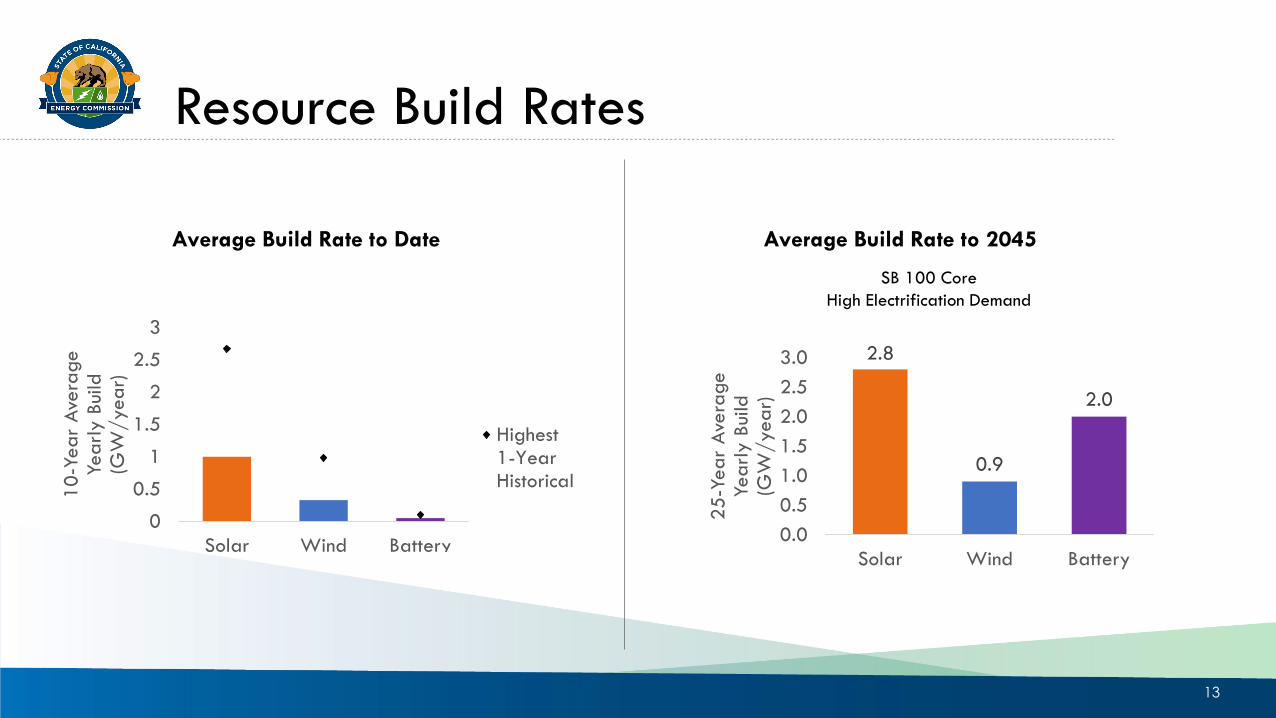
SB 100 Core High Electrification Demand
Average Build Rate to 2045Average Build Rate to Date
2.8
0.9
2.0
0.00.51.01.52.02.53.0
Solar Wind Battery
25-Y
ear
Aver
age
Year
ly B
uild
(G
W/y
ear)
0
0.5
1
1.5
2
2.5
3
Solar Wind Battery
10-Y
ear
Aver
age
Year
ly B
uild
(G
W/y
ear)
Highest1-YearHistorical
Resource Build Rates


InputsSuch as:
• Existing System
• Demand Forecasts/ Scenarios
• Resource Costs
• Reliability Metrics
• Policy Goals
• Resource Potential
• Land Use Screens
PortfolioDevelopment
(Capacity Expansion Modeling)
Scope of 2021 SB 100 Analysis
Reliability TestingOperability/
Full Dispatch
Resource Adequacy
Local Reliability
Production Cost
Modeling
Probabilistic Production
Cost Modeling
Power Flow Modeling
Portfolio ImpactsRates
GHG Emissions
Land Use
Air Pollution Workforce Social Costs
Inputs, impacts, and tools listed are for illustrative purposes
Further Analysis and Related Work
Follow-on work goals: Further quantitative assessment of reliability and portfolio impacts
17
The 2021 SB 100 Joint Agency Report and Summary Document can be found at:
https://www.energy.ca.gov/sb100
Thank you!