sba’s final impact study of entrepreneurial resources
TRANSCRIPT

US Small Business Administration Office of Entrepreneurial Development
Impact Study of Entrepreneurial Development Resources
Face-to-Face Counseling
November 9 2011
Final Report
Order Number SBAHQ09C004B
Prepared by
1220 19th Street NW Suite 502 Washington DC 20036 202-223-8877 The statements findings conclusions and recommendations found in this study are those of the authors and do not necessarily reflect the views of the Office of Entrepreneurial Development the United States Small Business Administration or the United States Government
Office of Entrepreneurial Development
[This page is intentionally left blank for two-sided printing]
Impact Study of Entrepreneurial Development ii Resources ndash 2010-2011
Office of Entrepreneurial Development
TABLE OF CONTENTS
TABLE OF CONTENTS iii TABLE OF FIGURES v TABLE OF TABLES vii FOREWORD 1 I INTRODUCTION 3 II EXECUTIVE SUMMARY 5 III METHODOLOGY 13 IV TOTAL ED RESOURCES 2008 - 2009 - 2010 21 V SBDC 2010 VS TOTAL ED RESOURCES 41 VI SCORE 2010 VS TOTAL ED RESOURCES 53 VII WBC 2010 VS TOTAL ED RESOURCES 65 VIII FOLLOW-UP STUDY RESULTS 2008 amp 2009 CLIENTS 77 IX SUMMARY OF QUANTITATIVE FINDINGS 91 XI RECOMMEDATIONS FOR FURTHER RESEARCH 97 XII APPENDICES 99
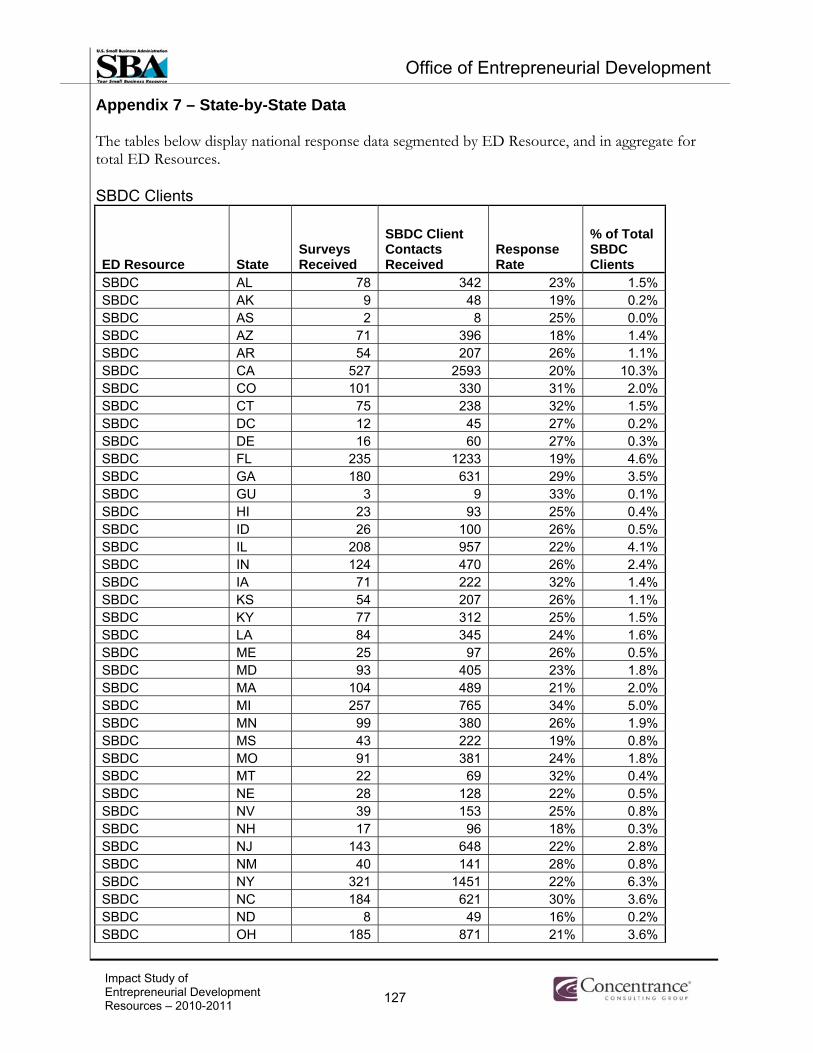
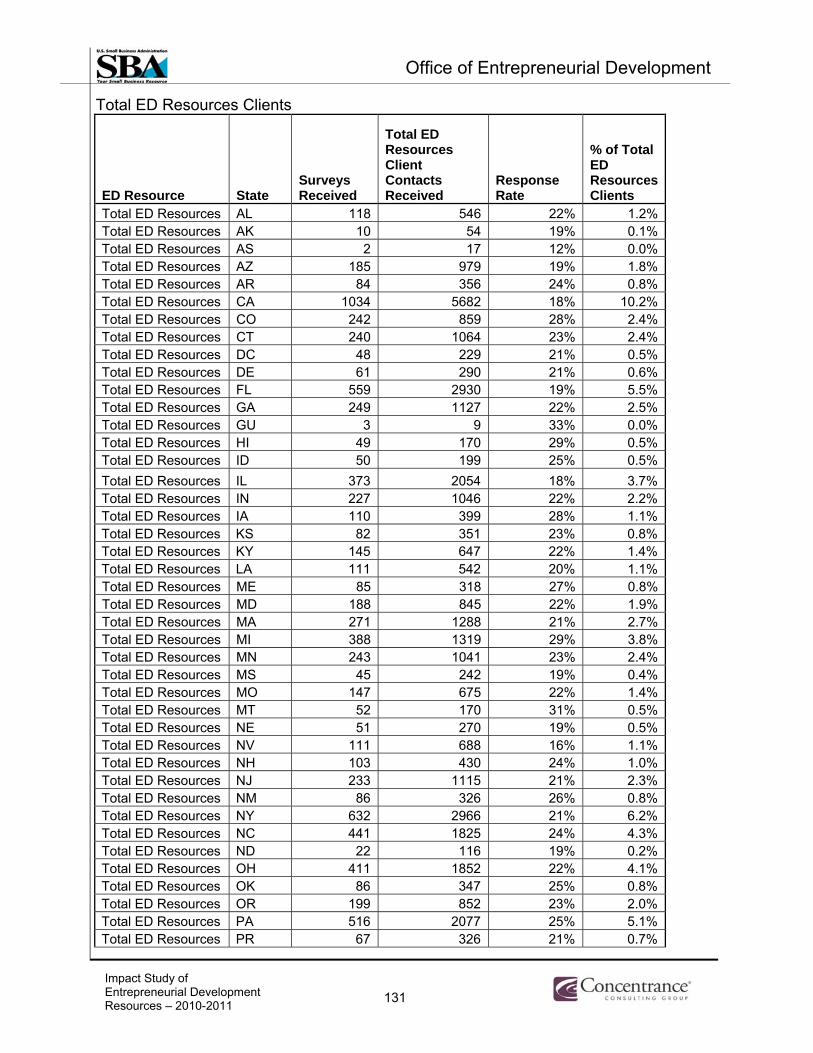
Appendix 1 ndash Survey Response Values by Research Topic 101 Appendix 2 ndash Quantified Survey Results ndash Initial Survey 2010 Clients 107 Appendix 3 ndash Quantified Survey Results ndash Follow-up Survey 2010 Clients 113 Appendix 4 ndash Initial Study Survey Instrument 117 Appendix 5 ndash Follow-up Survey 123 Appendix 6 ndash Regression Computations 125 Appendix 7 ndash State-by-State Data 127
Impact Study of Entrepreneurial Development Resources ndash 2010-2011
iii
Office of Entrepreneurial Development
[This page is intentionally left blank for two-sided printing]
Impact Study of Entrepreneurial Development iv Resources ndash 2010-2011
Office of Entrepreneurial Development
TABLE OF FIGURES Methodology
Figure 31 ndash Distribution of Respondents by Segment (2010 clients) 16 Total ED Resources 2008-2009-2010
Figure 41 ndash Total ED Resources ndash Client Segments Served 22 Figure 42 ndash Total ED Resources ndash Revenue and Employment (Average ED client Revenues and Number of Employees) 23 Figure 42A ndash Total ED Resources ndash Revenues by Hours of Counseling 24 Figure 43 ndash Total ED Resources ndash Demographic Characteristics 25 Figure 44 ndash Total ED Resources ndash Age of Business Owner 26 Figure 45 ndash Total ED Resources ndash Primary Business Type 27 Figure 46 ndash Total ED Resources ndash What led to your decision to seek business counseling from ED Resources 28 Figure 47 ndash Total ED Resources ndash How useful was the information you received 29 Figure 47A ndash How useful was the information you received Total ED Resources by Hours of Counseling vs Total ED Resources Aggregate Hours 30 Figure 48 ndash Total ED Resources ndash Did you decide to go into business as a result of the assistance you received 31 Figure 49 ndash Total ED Resources ndash Assistance in Plan Development 33 Figure 410 ndash Total ED Resources ndash Perceived Impact of Assistance 34 Figure 410A ndash Total ED Resources ndash Perceived Impact of Assistance (Hours of Counseling Received vs Aggregate Hours) 35 Figure 411 ndash Revenues (000s) for Firms in Selected Demographic Categories 36 Figure 412 ndashTotal Employees for Firms in Selected Demographic Categories 37 Research Findings - SBDC
Impact Study of Entrepreneurial Development v Resources ndash 2010-2011
Figure 51 ndash SBDC ndash Distribution of Clients by Segment (2010 Clients) 42 Figure 52 ndash SBDC ndash Demographic Characteristics (2010 Clients) 43 Figure 53 ndash SBDC ndash Age of Business Owner (2010 Clients) 44 Figure 54 ndash SBDC ndash Type of Business (2010 Clients) 45 Figure 55 ndash SBDC ndashUsefulness of SBDC (2010 Clients) 46 Figure 55A ndash Usefulness of SBDC SBDC by Hours of Counseling vs Total ED Resources Aggregate Hours (2010 Clients) 47 Figure 56 ndash SBDC ndash Changed Management PracticesStrategies as a Result of SBDC ED Resource Assistance (2010 Clients) 48 Figure 57 ndash SBDC ndash Assistance in Plan Development (2010 Clients) 49 Figure 58 ndash SBDC ndash Perceived Impact of Assistance (2010 Clients) 50 Figure 58A ndash SBDC ndash Perceived Impact of Assistance SBDC Hours of Counseling Received for In-Business and Start-ups vs Total ED Resources Aggregate Hours for In-Business and Start-ups (2010 Clients) 51
Office of Entrepreneurial Development
Research Findings - SCORE
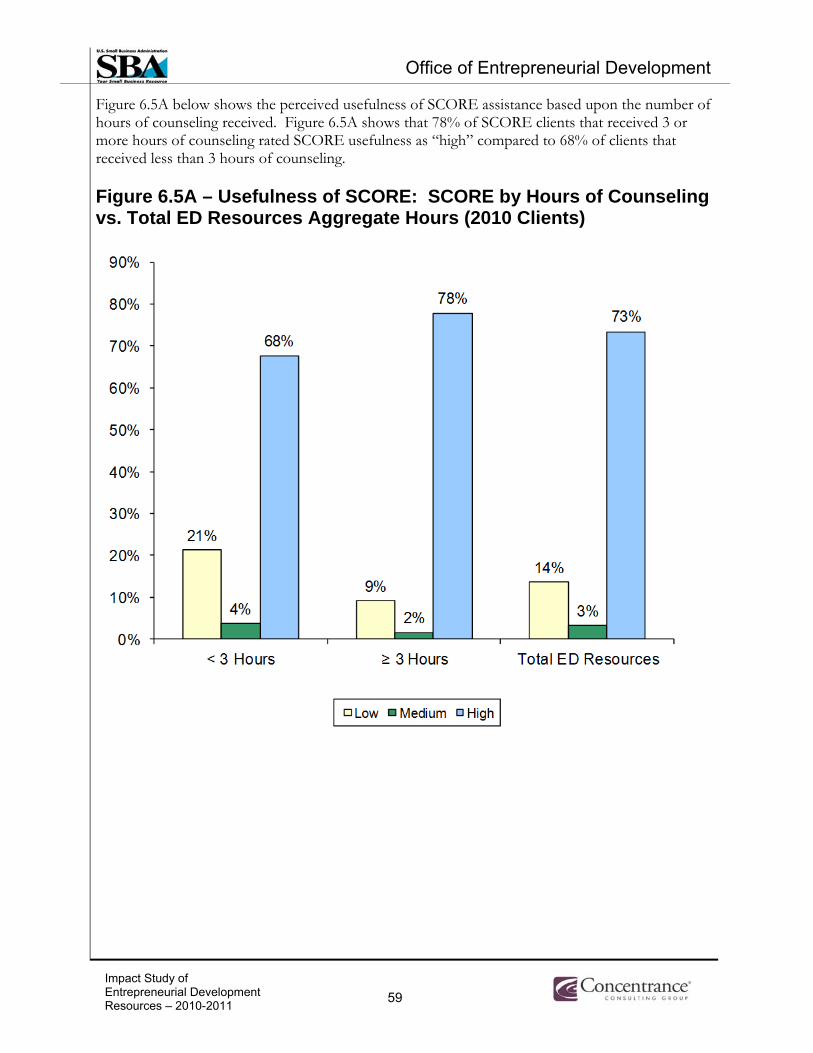
Figure 61 ndash SCORE ndash Distribution of Clients by Segment (2010 Clients) 54 Figure 62 ndash SCORE ndash Demographic Characteristics (2010 Clients) 55 Figure 63 ndash SCORE ndash Age of Business Owner (2010 Clients) 56 Figure 64 ndash SCORE ndash Type of Business (2010 Clients) 57 Figure 65 ndash SCORE ndashUsefulness of SCORE (2010 Clients) 58 Figure 65A ndash Usefulness of SCORE SCORE by Hours of Counseling vs Total ED Resources Aggregate Hours (2010 Clients) 59 Figure 66 ndash SCORE ndash Changed Management PracticesStrategies as a Result of SCORE ED Resource Assistance (2010 Clients) 60 Figure 67 ndash SCORE ndash Assistance in Plan Development (2010 Clients) 61 Figure 68 ndash SCORE ndash Perceived Impact of Assistance (2010 Clients) 62 Figure 68A ndash SCORE ndash Perceived Impact of Assistance SCORE Hours of Counseling Received for In-Business and Start-ups vs Total ED Resources Aggregate Hours for In-Business and Start-ups (2010 Clients) 63
Research Findings - WBC
Impact Study of Entrepreneurial Development Resources ndash 2010-2011
vi
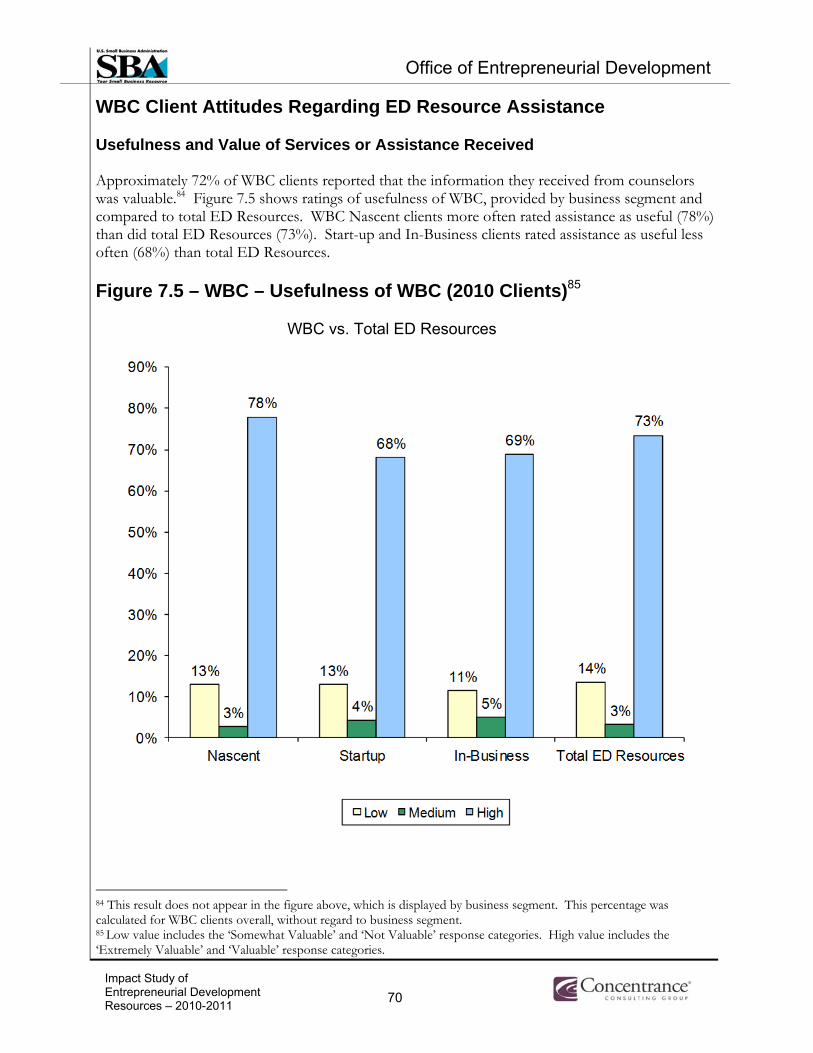
Figure 71 ndash WBC ndash Distribution of Respondents by Segment (2010 Clients) 66 Figure 72 ndash WBC ndash Demographic Characteristics (2010 Clients) 67 Figure 73 ndash WBC ndash Age of Business Owner (2009 Clients) 68 Figure 74 ndash WBC ndash Type of Business (2010 Clients) 69 Figure 75 ndash WBC ndash Usefulness of WBC (2010 Clients) 70 Figure 75A ndash Usefulness of WBC WBC by Hours of Counseling vs Total ED Resources Aggregate Hours (2010 Clients) 71 Figure 76 ndash WBC ndash Changed Management PracticesStrategies as a Result of WBC ED Resource Assistance (2010 Clients) 72 Figure 77 ndash WBC ndash Assistance in Plan Development (2010 Clients) 73 Figure 78 ndash WBC ndash Perceived Impact of Assistance (2010 Clients) 74 Figure 78A ndash WBC ndash Perceived Impact of Assistance WBC Hours of Counseling Received for In-Business and Start-ups vs Total ED Resources Aggregate Hours for In-Business and Start-ups (2010 Clients) 75
Office of Entrepreneurial Development
Follow-up Results
Figure 81 ndash Transitions and Survival of 2008 and 2009 Clients to 2011 In-Business 78 Figure 82 ndash ED Resource Clients have Higher Survival Rates than PSED Firms 79 Figure 83 - ED Resource Client Survival by Hours of Counseling 80 Figure 84 - Mean Revenues and Employment 2008 Clients Over Time 81 Figure 85 - Mean Revenues and Employment 2009 Clients Over Time 82 Figure 85A Mean SBDC Revenues and Employment 2009 Clients Over Time 83 Figure 85C Mean WBC Revenues and Employment 2009 Clients Over Time 85 Figure 86 Distribution of ED Resource Clientsrsquo Percentage Change in Revenues 86 Figure 87A ndash Firm Survival Rates for ED Resource Clients After One Year (Total ED Resources vs PSED) 87 Figure 87B ndash Firm Survival Rates for ED Resource Clients After Two Years (Total ED Resources vs PSED) 87 Figure 88 ED Resource Client Revenue Growth Compared to Selected Benchmarks - Percent Change from Previous Year 88
TABLE OF TABLES
Table 31 ndash Sampling Frame 15 Table 32 ndash Follow-up Impact Study Clients 18 Table 41 ndash Total ED Resources-Revenues and Employment (2010) 22 Table 42 ndash ED Resources Impact on Managerial Practices 32 Table 51 ndash SBDC Client Revenues and Employment (2010) 42 Table 61 ndash SCORE Client Revenues and Employment (2010) 54 Table 71 ndash WBC Client Revenues and Employment (2010) 66
Impact Study of Entrepreneurial Development vii Resources ndash 2010-2011
Office of Entrepreneurial Development
[This page is intentionally left blank for two-sided printing]
Impact Study of Entrepreneurial Development viii Resources ndash 2010-2011
Office of Entrepreneurial Development
FOREWORD
Concentrance would like to thank the US Small Business Administrationrsquos (SBA) Office of Entrepreneurship Education and SBArsquos Office of Entrepreneurial Development Program Offices Small Business Development Centers SCORE and Womenrsquos Businesses Centers for their assistance in conducting this research Both headquarter offices and local ED Resources spent considerable effort to ensure that clients from each center were represented in the data collection The rich dataset that now exists is in no small measure due to these efforts
The following individuals contributed to the development of this report
Jane Dwight- Managing Partner Concentrance Consulting Group Matthew C Herman- Project Director Concentrance Consulting Group Benjamin Joiner- Business Analyst Concentrance Consulting Group Dr George Solomon- Senior Policy Advisor SBA Office Of Entrepreneurship Education Dr Vanessa Perry- Associate Professor George Washington University
Impact Study of Entrepreneurial Development 1Resources ndash 2010-2011
Office of Entrepreneurial Development
[This page is intentionally left blank for two-sided printing]
Impact Study of Entrepreneurial Development 2Resources ndash 2010-2011
Office of Entrepreneurial Development
I INTRODUCTION
The US Small Business Administrationrsquos (SBA) Office of Entrepreneurial Development (ED) designed a multi-year time series study to assess the impact of the face-to-face counseling programs it offers to small businesses This study has examined clients who received face-to-face counseling services starting in 2003 The SBA initiated this study as part of the Office of Management and Budgetrsquos (OMB) Program Assessment Rating Tool (PART) SBA contracted with Concentrance Consulting Group to assist in administering the study to analyze the findings and to write this report This report is the eighth report1 in the study and presents the findings from three separate study groups each year This yearrsquos study group includes 2010 clientsrsquo initial attitudinal assessment of their counseling experience and a follow-up with 2009 and 2008 clients to assess the financial impact of the received assistance2
Study Year 2009 Study Year 2010 Study Year 2011
2008 Clients Initial survey First follow-up Second follow-up
2009 Clients Initial survey First follow-up
2010 Clients Initial survey
Study Year 2009 Study Year 2010 Study Year 2011
This study measures attitudinal assessments perceptions of changes in managementmarketing practices and business growth for firms that utilized SBArsquos ED Resource Partnersrsquo face-to-face counseling during the late summer or early fall of 2008 2009 or 2010 The ED Resource Partners include Small Business Development Centers (SBDC) SCORE and Women Business Centers (WBC)
This report includes Executive Summary Methodology
o Research Questions o Sampling data collection response rate and survey administration o Data analysis and analysis of non-response o Follow-up o Limitations
Findings Initial economic impact study o Impact of total ED Resources (2008 - 2009 - 2010) o Regression analysis o Impact of SBDC resources 2010 o Impact of SCORE resources 2010 o Impact of WBC resources 2010 o Quantitative analysis overview o Qualitative analysis of collected client comments
Findings Follow-up study of 2008 and 2009 ED Resource clients Recommendations for further research
1 Each ED Resource final report can be found at httpwwwsbagovaboutsbasbaprogramsedindexhtml 2 For information on 2003 2004 2005 2006 and 2007 clients please see previous reports
Impact Study of Entrepreneurial Development 3Resources ndash 2010-2011
Office of Entrepreneurial Development
The appendix includes the distribution of responses for each survey question sample survey instruments additional regression results and distribution of responses for each ED Resource by state
[This page is intentionally left blank for two-sided printing]
Impact Study of Entrepreneurial Development 4Resources ndash 2010-2011
Office of Entrepreneurial Development
II EXECUTIVE SUMMARY
The US Small Business Administrationrsquos (SBA) Office of Entrepreneurial Development designed a study to assess the impact of its Entrepreneurial Development (ED) Resource Partnersrsquo face-to-face counseling assistance on small business clients and contracted Concentrance Consulting Group to conduct the study Thus far the study has examined ED Resource Partner clients that received face-to-face counseling assistance in 2003 and clients from each subsequent year up to and including the present study of 2010 clients This latest report presents the findings of the initial attitudinal impact study of 2010 ED Resource Partner clients and a follow-up study showing the financial impact on 2009 and 2008 clients Within the report all references to ED Resource Partner clients pertain to ED Resource Partnerrsquos face-to-face counseling clients who received assistance from a designated ED Resource Partner ED Resource Partner Clients Studied Concentrance studied the outcomes of three ED Resource Partners Small Business Development Centers (SBDC) SCORE and Women Business Centers (WBC)
Within each ED Resource Partner we studied three small business client segments including Nascent - Those individuals who have taken one or more positive steps to start a business Start-up - Those individuals who have been in business one year or less and In-Business ndash Those individuals who have been in business more than one year and are
classified as small by the SBA For the 2010 clients who responded to the initial impact study we analyzed demographic characteristics perceived usefulness of assistance and initial impact on businesses We also assessed the survival rates and financial growth of 2009 and 2008 clients Quantitative Findings (Initial Impact Study 2010 Clients)
Concentrance collected coded and analyzed data for 10146 ED Resource clients for an overall response rate of 23 This yearrsquos survey comprised the largest sample and achieved the greatest number of respondents since the inception of the study The table below provides the number of respondents and response rates for each ED Resource
Resource Center
Stratified Sample Size
Usable Sample
Size3
Surveys Received via Web
Surveys Received via Phone
Total Surveys
Received
Response Rate 2010
Clients SBDC 21514 20329 4183 930 5113 25 SCORE 22002 21521 3513 931 4444 21 WBC 3229 3021 450 139 589 20 Total 46745 44871 8146 2000 10146 23
Resource Center
Stratified Sample Size
3 The usable sample size includes the stratified sample minus surveys noted as undeliverable by web or phone due to incorrect contact information The accuracy and completeness of the contact information for clients provided by ED Resource offices was much improved for 2010 clients compared to previous years
Impact Study of Entrepreneurial Development 5Resources ndash 2010-2011
Office of Entreprreneurial DDevelopm ment
The figurre below illusstrates the buusiness segmeent composittion of each ED Resourcce
Distribbution of Responddents by SSegment t (2010 Cllients)4
nn = 10146
NNascent 1143 1306 1880
SStart-up 929 920 1111
B In-
Business 3003 2175 2993
Total 5113 4444 5889
CClient Year Stratified d Sample Si ize
Usea able Sample e Size
Follo ow-up p
Surveys s Received in n 2008
Response Rate
2008 854 854 2nnd 200 23
2009 8493 84993 sst 1 11968 23
The 20088 clients weree resurveyed in 2011 to deetermine finaancial impactt after two yeears in terms of financial ggrowth and ffirm survivall rates Theirr response raate was 23 equal to the previous yeaarrsquos study Thhe 2009 cliennts were also resurveyed aat this time too determine financial imppact and firmm survival rrates after onne year The response ratee for this grooup was also 23 the higghest responnse rate sincee the inceptioon of the studdy for a first follow-up grroup
4 Respondeents (86) who reeported being in business butt who did not pprovide a valid sstart date for thhat business weere not assigned too a business segmment Therefoore percentagess of clients in eaach business se egment may nott equal 100
Impact S tudy of Entrepren neurial Develop pment Resource es ndash 2010-2011 1
6
Office of Entreprreneurial DDevelopm ment
FY2011 0 SBDC SCCORE and WBC clientt s all reporte ed lower rev venues than those serve ed in the previous yee ar SBDC continues too serve the c clients with h the highest t average revenuu es ($774000 0) followedd by SCOREE ($502000) ) and WBC C ($171300)
Average eemployment llevels for SBBDC SCOREE and WBC cclients all felll from 2009 levels
Impact S tudy of Entreprenn eurial Developp ment Resourcee s ndash 2010-2011 1
7
RRev 2008 $6340000 $818400 $229500
RRev 2009 $8553000 $728400 $311200
RRev 2010 $7740000 $502000 $171300
Emmpl 2008 7 7 5
Emmpl 2009 7 6 4
Emmpl 2010 5 3 3
f
t
ED D Resource es served a ddiverse clien nt base in 20 010 similar tto past yearrs regarding g de emographic and busine ess characte eristics
Office of Entreprreneurial DDevelopm ment
The tootal ED Resoource client bbase consisteed of Femalle (36) Malle (36) firmms with MMale and Femmale owners (17) White (68) BlackAfrican AAmerican (111) Veteraan (9) Servvice-disabledd Veteran (2) HispanicLatino (7)) Asian (4)) Ameriican IndianNNative Alaskkan (2) andd Native HawwaiianPacifific Islander (11)5
The percentage of firms ownedd by White aand Veteran clients has ddecreased fromm the prrevious year66 Male and FFemale ownerrs is a new caategory for thhe 2011 studdy whichh partially expplains the deccrease in bothh the Femalee and Male ddemographicss
For 20010 the greatest percentaage of busineess owners (228) were beetween the agges of 45-54 Those bbetween the aages of 35-444 made up 222 of clientss Twenty peercent consissted of clients between thhe ages of 55--64 down thhree percentaage points froom last yeear7 Clients 225-34 were 113 of the tootal ED Resoource client bbase8
The mmost often citted primary bbusiness induustries for 20009 clients re emained the ssame as in ppast years seervice (14) and retail (11) The prrevalence of the service aand retail iindustry categories have rremained levvel over the ppast year howwever manuffacturing connsulting andd health care have all decrreased by appproximately oone percenntage point aand ldquootherrdquo hhas increasedd by three perrcentage poinnts
Firms owned by mmen reported revenues onn average more than twicce as high as those owned by w omen Reveenues for botth groups felll over the paast year The highesst average revvenues by racceethnicity were reporteed by HispannicLatinos followwed by Whitee and Asian fifirms Averagge revenues for every racceethnicity experiienced decreaases especiallly Native HaawaiianPaciific Islanders Veterans experiienced increaases in averagge revenues wwhile Servicee-disabled V eterans reporrted lower revenues thaan the previoous year
FY Y2010 client s gave lowe er ratings (73 3) than th he previous y yearrsquos respo ondents (75 5) to the u usefulness o of the assistaance they re eceived Th he effect of c counseling as sistance on the clientrsquos ability to d develop a bu usiness plan (35) mar rketing pla an (30) ha as remained d relatively c consistent ac cross past st tudies
5 These 20110 demographicc distributions wwere comparedd to the nationaal averages fromm the 2007 Survvey of Businesss Owners froom the US Cennsus Bureau (SBBO) The totall ED Resource s demographic distribution waas compared too the national averages from thee SBO The d isstribution was ccomparable acrross characterisstics except for the following SSBO figures White business ow wners were 83 of the small bbusiness popul lation Female b business ownerrs were 29 MMalebusiness owwners were 51 and BlackAffrican Americann business ownners were at 7 6 Just over 16 of survey respondents diid not answer thhe race questio ons whereas 455 answered laast year Thereffore the drop inn in the numberr of Whites mayy be due to nonn-responses andd not reflective of the actual p opulation 7 Eleven peercent of surveyy respondents ddid not respondd to the age queestion for this yyearrsquos study Laast year only twwo percent didd not respond This may explaain some of thee variation betwween this yearrsquos study and the 22010 study 8 The total ED Resources age distributio n was compareed to the nationnal averages fromm the SBO The distribution was comparablee except that 655+ was reportedd at 125 (commpared to 5 ffor total ED Reesources)
Impact S tudy of Entrepren neurial Develop pment Resource es ndash 2010-2011 1
8
Office of Entreprreneurial DDevelopm ment
Usefulness ratings also include the financiall impact of aassistance on hiring new sstaff (11) retaining cuurrent staff (115) increasing profit mmargin (22) and increasiing sales ((25) The rratings for alll categories hhave gone doown from thee previous yeear
Laa rger firms rr eported higg her levels oo f perceived d usefulness of ED Reso ource as sistance thaa n did smalll er firms F irms that re eceived less than 3 hour rs of as sistance repp orted lowerr levels of pee rceived use efulness tha an firms with h 3 or m ore hours off counselingg
Total ED Resourc ce clients that t received 3 o or more hour rs of counsel ling reported d 76 o of the time th hat counselin ng was useful l versus 69 for clients t that received d less than 3 3 hours of co ounseling
There were no diff ferences in q quality of cou unseling expe erience basedd on businesss segme ent ED Reso ource or geog graphic locatti ion
There were no sign nificant effec cts of clientrsquos s age gender veteran stat tus or ethnic city on per rceived usefu ulness How wever Americ can IndianA Alaskan Nativ ve and White e clients s reported sig gnificantly hi igher perceiv ved usefulnes ss No other significant differe ences based o on race were e found
All though clie nt reported perceptionss of each EDD Resourcee were largelly similar th ere were somm e key diffee rences
For SC CORE client ts 55 repor rted the perc ceived reputa ation of SCO ORE led to th heir decisio on to seek EDD Resource assistance co ompared to 4 44 for SBD DC clients an nd 40 f for WBC clie ents
Appro oximately 39 of WBC S Start-ups and d 42 of WB BC In-Busine ess clients report ted that assist tance they re eceived result ted in increas sed sales com mpared to 25 5 and 33 3 respectiv vely for SCOR RE clients an nd 33 and 37 for SBD DC clients respec ctively
For W WBC clients 3 38 of Start t-ups reporte d that they d decided to go o into busines ss as a resul lt of assistan ce compared d to 33 for SBDC and 3 30 for SCO ORE This tr rend w l l
as a so apparent for Nascent clients
Fi irms in the I In-Business s segment a and larger fir rms were le ss likely to r report that th heir decision n to start a b business wa s the result of ED Reso ource assista ance
Twentty-five percennt of Nascennt clients andd 32 of Starrt-up clients reported thaat their ddecision to sttart a businesss was the ressult of ED RResource assistance
Impact S tudy of Entrepren neurial Develop pment Resource es ndash 2010-2011 1
9
Office of Entreprreneurial DDevelopmment
Consistent with thhe previous yeearrsquos results larger firms firms in the In-Businesss segmeent and SCORRE clients wwere significanntly less likelly to report thhat their decisioons to start bbusinesses weere the resultt of the ED RResource asssistance they received
Fii ndings fromm an analys is of follow--up surveys of 2008 and d 2009 client ts suggest buu sinesses thh at received ED Resourr ce assistan nce have a hi igher surviv val rate thh an other smm all business ses in the PP SED II Th he survival r rate after tw wo years ww as 93 for ED Resourr ce clients cc ompared to o 80 for fir rms in the P PSED II
Appro oximately 57 of 2008 N Nascent client ts had transit tioned to the e In-Business s segme ent after two years while 29 of 200 09 Nascent cl lients had go one into busin ness after o one year On nly six percen nt of 2008 of f In-Business s clients and three percen nt of 2009 c clients went o out of busine ess by 2010
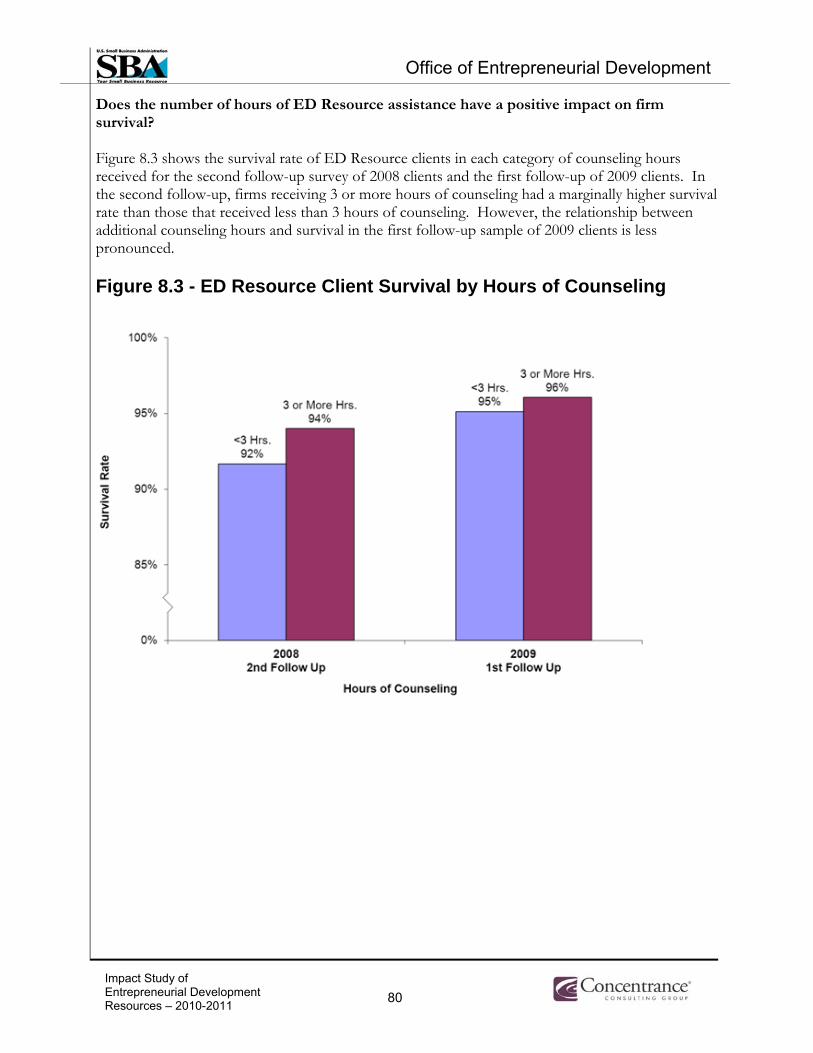
In the e second follo ow-up of 200 08 clients fir rms receiving g 3 or more h hours of couns eling had hig gher survival rates than th hose who rec ceived less th han 3 hours oof couns eling
A com mparison of tthe difference e in growth r rates for SBA A ED Resour rce clients wi ith GDP the Private C Company In ndex (PCI) an nd the Stand dard and Poo orrsquos SmallCap p 600 Index from 2009 t to 2010 show ws that SBA E ED Resource e clients outp paced the oth her bench hmarks with a a difference o of 134 perce entage points s over five p percentage po oints more than the nex xt highest find ding9 Altho ough all three e benchmarks s indicated positiv ve growth du uring this tim me SBA ED R Resource clie entsrsquo progres ssed more rap pidly
9 T ee uu rr EE aa rrhttpwwwwbeagovnationalxlsgdpchhgxls the Privaate Company Inndex (PCI) - puublished by Enttrex this index measures reevenue performmance in the secctor of private ccompanies rangging from $3 mmillion to $60 mmillion in annuall revenues (hhttpwwwpriivatecompanyinndexcom) and the S amp P SmaallCap 600 Indeex - represents approximately 3 of the US maarket and incluudes 600 lsquosmall caprsquo companiess with market ccapitalizations bbetween $300 mmillion and $2 bbillion
he thre benchmarks sed for compa ison of SBA D Resources re GDP - Sou ce
Impact S tudy of Entrepren neurial Develop pment Resource es ndash 2010-2011 1
10
Office of Entrepreneurial Development
Qualitative Findings
A few clients from each ED Resource provided ad hoc commentaries in emails with their survey instrument
Comments were both positive and negative for each ED Resource
Recommendation for Further Research
An additional study could examine the effects of different types of financing (eg SBA Guarantee Loan vs SBA Disaster Loan) on perceived improvements survival and business growth
Methodology
The initial impact study of 2010 clients was quantitative in nature based upon responses to web surveys Statistical analyses utilized frequency distributions average comparisons cross tabulations and regression models This yearrsquos study computed revenue and employment data using means rather than medians which were the bases of previous yearsrsquo studies Given wide fluctuation and disparity in revenue and employment among small businesses using mean comparisons is a more informative measure
The survey of clients resulted in a respondent sample of 10146 clients ED Resources provided a random sample list of 46745 clients served during the late summer or early fall of 2010 Concentrance sent web surveys to ED Resource face-to-face counseling clients via email We sent reminder emails each week for four weeks after the initial emailing Phone surveys were attempted for clients who did not respond to web surveys According to statistical tests there was no evidence of bias due to non-response
Concentrance used regression analyses to test for the impact of client demographics on client perceptions of ED Resource assistance outcomes Each regression model examined the impact of selected demographic characteristics (age gender race ethnicity and veteran status) and firm characteristics (size business segment ED Resource geographic location and hours of assistance) on a particular resource impact These impacts included perceived usefulness of ED Resource assistance perceived impact on the decision to start a business and perceived impact on sales
The respondent sample for the second follow-up survey of 2008 clients was 200 The respondent sample for the first follow-up of 2009 clients was 1968 A matched sample was used to perform pair-wise statistical tests that compared changes in growth and business segment to other benchmarks Revenue and employment growth for ED Resource clients were examined by comparing SBA data to that of the Panel Study of Entrepreneurial Dynamics II10 (PSED II) the Private Company Index and the SampP SmallCap 600 Index
10 The Panel Study of Entrepreneurial Dynamics II is a nationwide multi-million dollar survey of nascent entrepreneurs funded by the Kauffman Foundation The primary purpose of the study is to identify adults active in business creation obtain detailed information about the start-up effort and perform follow-up interviews to determine outcomes We rely on the PSED I and PSED II as benchmarks however results must also be interpreted with caution due to potential response bias and definitional differences in the ways that firms are classified
Impact Study of Entrepreneurial Development 11Resources ndash 2010-2011
Office of Entrepreneurial Development
Limitations to consider when interpreting these results include
Measures of ED Resource impacts are attitudinal and are self-reported by the client
Many respondents did not report revenue data
Estimates of firm survival and growth over time should be interpreted with caution Due to attrition firms that have gone out of business may be under represented
Impact Study of Entrepreneurial Development 12Resources ndash 2010-2011
Office of Entrepreneurial Development
III METHODOLOGY
This report contains findings from the initial impact study of face-to-face ED Resource counseling clients from 2010 and a follow-up study of the 2008 and 2009 clients that participated in initial impact studies in previous years11 The methodology for the initial impact study for 2010 clients is presented first followed by the methodology for the 2008 and 2009 client follow-up study The initial impact study reports clientsrsquo attitudinal assessments of their counseling experience and the follow-up study reports the long-term financial impact of assistance on client firms
Research Questions The following questions are the focus of this study and are addressed in the findings section of this report The last two questions numbers six and seven are addressed in the follow-up study which comprises time series analysis of multi-year data
1 What is the demographic financial and business profile of firms who utilize ED Resources
2 Is there a relationship between the servicesassistance provided by ED Resources (SBDC SCORE and WBC) and the clientrsquos perception of the usefulness and value of the servicesassistance received
3 Is there a relationship between the servicesassistance provided by ED Resources and the clientrsquos decision to start a business
4 Is there a relationship between the servicesassistance provided by ED Resources (SBDC SCORE and WBC) and the clientrsquos decision to implement andor change management andor marketing practices in their business
5 Are the servicesassistance provided by ED Resources (SBDC SCORE and WBC) having an impact on the clientrsquos financial position in terms of job creation job retention and sales
Follow-up study of 2008 and 2009 ED Resource clients
6 Based on a comparison of the total ED Resources with the Panel Study of Entrepreneurial Dynamics II (PSED II)12 what is the impact of ED Resource assistance on firm survival
What was the rate of transition of Nascent and Start-up firms to the In-Business segment
11 All references to ED Resource clients pertain to ED Resource Partnersrsquo face-to-face counseling clients who received assistance from a designated ED Resource Partner (SBDCSCOREWBC) 12 The Panel Study of Entrepreneurial Dynamics II is a nationwide multi-million dollar survey of nascent entrepreneurs funded by the Kauffman Foundation The primary purpose of the study is to identify adults active in business creation obtain detailed information about the start-up effort and perform follow-up interviews to determine outcomes We rely on the PSED I and PSED II as benchmarks however results must also be interpreted with caution due to potential response bias and definitional differences in the ways that firms are classified
Impact Study of Entrepreneurial Development 13Resources ndash 2010-2011
Office of Entrepreneurial Development
7 What is the financial impact of servicesassistance provided by ED Resources as a whole in terms of job creation job retention and sales
How does the difference in growth rate of ED Resource clients from 2009 to 2010 compare with selected growth benchmarks such as the gross domestic product (GDP)13 and Standard amp Poorrsquos SmallCap 600 Index14 and the Entrex Private Company Index (PCI)15
Sampling and Data Collection
This study examines the effects of SBA ED Resource assistance on client firms by respective ED Resource and by clients in the following various stages of business formation Nascent - Individuals who have taken one or more steps to start a business Start-up - Individuals who have been in business one year or less In-Business ndash Individuals who have been in business more than one year and are classified as
small by the SBA
The initial impact study of 2010 clients was quantitative in nature based upon responses to web and telephone surveys The responses provided a statistically significant sample for each ED Resource To determine if the sample size for this study was sufficient Concentrance tested the sample size on the basis of reported sales revenues The initial sample of 2010 clients is sufficiently large enough for accuracy within plus or minus $98861 in reported annual sales revenues at a 99 confidence level16
Table 31 on the following page depicts the distribution of surveys across ED Resource and the response rates by ED Resource The overall response rate was 23 which is comparable to the response rates found in other surveys of entrepreneurs For example Aldrich and Baker (2000) found that nearly a third of surveys of entrepreneurs had response rates below 2517 In another example the National Federation of Independent Business (NFIB) had a response rate of 20 in its Small Business Economic Trends survey conducted in June of 201018
13 Source httpwwwbeagovnationalxlsgdpchgxls 14 The S amp P SmallCap 600 Index - represents approximately 3 of the US market and includes 600 lsquosmall caprsquo companies with market capitalizations between $300 million and $2 billion The SampP SmallCap 600 Index is a commonly used benchmark for growth 15 The Private Company Index (PCI) - published by Entrex this index measures revenue performance in the sector of private companies ranging from $3 million to $60 million in annual revenues (httpwwwprivatecompanyindexcom) 16 This assumes a normal distribution of annual revenues with a standard deviation of $2324497 17 Aldrich Howard E and Ted Baker (2000) ldquoBlinded by the Cites Has there been any progress in entrepreneurship researchrdquo in Entrepreneurship 2000 ed Donald L Sexton and Raymond L Smilor Chicago Upstart Publishing p 377-400 18 William K Dunkelberg and Holly Wade ldquoNFIB Small Business Economic Trendsrdquo NFIBcom July 2010 lthttpwwwnfibcomPortals0PDFsbetsbet201007pdfgt
Impact Study of Entrepreneurial Development 14Resources ndash 2010-2011
Office of Entrepreneurial Development
Table 31 ndash Sampling Frame
Resource Center
Stratified Sample Size
Usable Sample Size 19
Surveys Received via Web
Surveys Received via Phone
Total Surveys
Received
Response Rate 2010
Clients SBDC 21514 20329 4183 930 5113 25 SCORE 22002 21521 3513 931 4444 21 WBC 3229 3021 450 139 589 20 Total 46745 44871 8146 2000 10146 23
Survey Administration Following a successful pilot test of web-based survey administration for the 2008-2009 impact study of ED Resources Concentrance adopted web-based survey administration as the primary technique for this study This delivery mechanism has provided greater efficiency with regard to increasing the number of completed surveys for ED Resource clients ED Resources drew a random sample of clients served during the late summer or early fall of 2010 based on a random sample table provided to each ED Resource See Appendix 4 for the survey instrument Via email Concentrance sent selected clients SBA cover letters and an invitation to take a web-based OMB approved survey We sent reminder emails each week for four weeks after the initial emailing We logged-in all received surveys entered the survey data into a database for analysis and developed an electronic database list of non-respondents for a telephone follow-up survey All surveys were assigned a computer-coded with client codes to facilitate unique identification of each client for follow-up surveys while ensuring privacy
19 The usable sample size includes the stratified sample minus surveys noted as undeliverable by web or phone due to incorrect contact information The accuracy and completeness of the contact information for clients provided by ED Resource offices was much improved for 2010 clients as compared to previous years
Impact Study of Entrepreneurial Development 15Resources ndash 2010-2011
Resource Center
Stratified Sample Size
Usable Sample Size 19
Office of Entreprreneurial DDevelopm ment
Figure 311 shows the distribution oof survey resspondents byy respective EED Resourcee and businesss segment The In-Bussiness segmeent was the laargest segmennt served forr all resourcees The Startt-up segment iis smaller thaan the other segments in part becausee of the narroow definitionn of Start-upss (firms thaat have been in business ffor one year or less)
)20Figure 31 ndash Disstributionn of Resppondents by Segmment (2010 clients)
nn = 10146
Naascent 1143 1306 1800
Staart-up 929 920 111
In-Business
3003 2175 2933
Total 5113 4444 5899
20 Responddents (86) who rreported being in business buut who did not pprovide a valid start date for thhat business wwere not assigneed to a businesss segment Theerefore percenttages of clients iin each businesss segment mayy not equal 100
Impact S tudy of Entrepren neurial Develop pment Resource es ndash 2010-2011 1
16
Office of Entrepreneurial Development
Data Analysis
Analyses included the following methods basic descriptive statistics frequency distributions cross tabulations and regression Concentrance used basic descriptive statistics for continuous variables such as annual sales revenues We used frequency distributions for Likert scales and respondents answered on a scale of 1 to 5 Cross-tabulations were used to compare responses across ED Resources business segments and hours of counseling received Finally Concentrance used multiple regression analyses to test for differences in key outcomes such as perceived usefulness or financial impact of ED Resource assistance based on demographic or firm characteristics We selected these analyses to meet the objectives of each research question and to facilitate interpretation of findings For this yearrsquos study revenue and employment calculations were completed using mean data instead of median data which was utilized for previous yearsrsquo studies
Analysis of Non-Response
SBArsquos research plan for this study included a methodology for estimating potential non-response bias Non-response bias can occur in survey research if respondents differ substantially from those that do not respond The best way to protect against this bias is to improve the response rate An effective method for achieving high response rates is the use of follow-ups and reminders In this study non-response bias was minimized by sending four reminder emails containing a link to the survey and minimized further by telephone follow-ups to non-respondents
We assessed the extent and direction of potential non-response bias by comparing the characteristics of clients who responded to the internet survey with those who did not Of the 10146 total clients surveyed 8146 were surveyed over the web The remaining clients (2000) were surveyed over the phone Clients surveyed over the phone were more likely to report revenue and employment figures Additionally these results hold when other respondent characteristics are controlled for (ED Resource Business Segment and Hours of Counseling Received)21
The next step was to conduct a comparative analysis of the responses between these groups to determine if the difference in response rates would have an impact on our analyses Results of regression analyses revealed no significant differences between these groups in terms total number of employees There was a significant difference in revenue found between phone and web respondents However only a very small portion of the total variance in revenue (02) is explained by this difference 22
21 These findings were based on results of four logistic regression analyses to determine whether web versus phone respondents differed significantly in terms of missing revenues and missing employment data The models were significant at the plt0001 level and the variable indication phone response was always significant at the plt0001 level 22 These findings were based on results of a regression analysis to determine whether web versus phone respondents differed significantly in terms of number of employees where a positive number of total employees are reported A scheffe test reveals no significant difference between phone and web at the 010 level The t-test associated with the regression analysis reveals a non-significant result (t=-161 p=01075) A second regression was performed to determine whether web versus phone respondents differed significantly in terms of reported sales revenues greater than or equal to 1000 A scheffe test for this difference revealed a significant difference between phone and web at the 005 level The t-test associated with the regression analysis reveals a significant result also (t=256 p=00106) The R-square value associated with this model is 0002
Impact Study of Entrepreneurial Development 17Resources ndash 2010-2011
Office of Entrepreneurial Development
Additionally the difference in phone and web respondents was tested against perceived service usefulness Although a significant difference in the service variate was found only a small portion of the variance of each of the service measures can be explained by the difference between phone and web respondents Similar results were found with the perceived value of the information the respondents received 23 Because the evidence of response bias is minimal the phone and web respondents were pooled in subsequent analyses Follow-up Study 2008 and 2009 ndash Sampling Data Collection and Analysis of Non-Response A follow-up study was conducted of both 2008 and 2009 clients in order to evaluate the financial impact on these groups one year and two years after they were counseled by ED Resources There were 854 clients from 2008 that were contacted for a second follow-up in the beginning of 2011 Two-hundred clients responded to this second follow-up which represents a 23 response rate Each of these respondents had valid client codes that could be matched on a one-to-one basis with the initial impact survey respondents Thus for a sample of 200 clients there were detailed data which could be tracked for three years There were 8493 respondents to the initial impact survey of 2009 clients Of those contacted 1968 responded to the survey and provided detailed data that could be tracked for two years Table 32 shows the number of surveys received by total ED Resources and the total response rates
Table 32 ndash Follow-up Impact Study Clients
Client Year Stratified
Sample Size Useable
Sample Size Follow-
up Surveys Received
in 2008 Response
Rate
2008 854 854 2nd 200 23
2009 8493 8493 1st 1968 23
These matched samples were used to perform pair-wise statistical tests that compared changes in growth by business segment and by ED Resource Although there were a small number of observations available for this analysis these findings provide a more precise estimate of changes in revenues and employment over time than aggregate non-matched comparisons
23 These findings were based on results of two multivariate regression analyses and a series of simple linear regression analyses to determine whether web versus phone respondents differed significantly in terms of the reported perceived service usefulness and value of information received The Wilkesrsquo Lambda value is significant for both multivariate analyses indicating there is some linear combination of the perceived usefulness measures and perceived value of received information that is explained by the difference in phone vs web respondents The R-square values of the six individual measures of service and information predicted by the difference in phone vs web respondents was explored These values are range from 00084 to 00238
Impact Study of Entrepreneurial Development 18Resources ndash 2010-2011
Office of Entrepreneurial Development
Limitations
There are several limitations that should be considered when interpreting the results presented in this report These limitations are inherent in the research design and methodology
Measures included in this initial survey are primarily attitudinal and all items are self-reported Thus there are few objective measures that can be used to assess actual client performance or make comparisons with other data sources
Many respondents did not report revenue data which is critical to measuring growth from year-to-year For example out of Start-up and In-Business firms approximately 39 reported zero revenues or did not report revenues
Estimates of firm survival and growth over time should be interpreted with caution Due to attrition firms which have gone out of business may be under-represented
Impact Study of Entrepreneurial Development 19Resources ndash 2010-2011
Office of Entrepreneurial Development
[This page is intentionally left blank for two-sided printing]
Impact Study of Entrepreneurial Development 20Resources ndash 2010-2011
Office of Entrepreneurial Development
IV TOTAL ED RESOURCES 2008 - 2009 - 2010
The following section presents comparison results of face-to-face counseling clients from 2008 2009 and 201024 First the general demographic and financial characteristics of the total ED Resource clients are presented This is followed by additional findings on the impact of the total ED Resources on Nascent Start-up and In-Business firms organized by research question as follows
Is there a relationship between servicesassistance provided by ED Resources (SBDC SCORE and WBC) and the clientrsquos perception of the usefulness and value of servicesassistance received
Is there a relationship between the servicesassistance provided by ED Resources (SBDC SCORE and WBC) and the clientrsquos decision to start a business
Is there a relationship between the servicesassistance provided by ED Resources (SBDC SCORE and WBC) and the clientrsquos decision to implement andor change management andor marketing practices in their business
Are the servicesassistance provided by ED Resources (SBDC SCORE and WBC) having an impact on the clientrsquos financial position in terms of job creation job retention and sales
Please note that comparisons between the 2008 2009 and 2010 initial study clients should be interpreted with caution Concentrance collected cross-sectional data from a different set of firms each year and these firms were operating under different economic conditions To better understand changes over time the follow-up study included in this report tracks the same firms over a three year period
24 All references to ED Resource clients pertain to ED Resource Partnersrsquo face-to-face counseling clients who received assistance from a designated ED Resource Partner (SBDCSCOREWBC)
Impact Study of Entrepreneurial Development 21Resources ndash 2010-2011
Office of Entrepreneurial Development
Demographic Characteristics of ED Resource ClientsThis section describes the general demographic and financial characteristics of total ED Resource clients that were served in 2010 These results are based on an analysis of 10146 completed surveys As shown in Figure 41 the In-Business segment (54) was the largest business segment served by ED Resources in 2010 The size of the In-Business segment remained consistent with the previous year The Start-up segment increased for the third year in a row though the change is in part due to the revised definition of Start-up businesses
Figure 41 ndash Total ED Resources ndash Client Segments Served25
2008 n = 6770 2009 n = 8493 2010 n = 10146
The average annual revenue for ED Resourcesrsquo clients was $637200
Table 41 ndash Total ED Resources-Revenues and Employment26 (2010)
Total ED Resources
Average Revenue $637200
Average Employees 4
25 Respondents (86 for 2010) who reported being in business but who did not provide a valid start date for that business were not assigned to a business segment Therefore the total of client segments served for each year may not equal 100 26 Firms that reported revenues were required to do so within the range of $1000 to $25000000
Impact Study of Entrepreneurial Development 22Resources ndash 2010-2011
Total ED Resources
Rev 2008 $634000 $818400 $229500
Rev 2009 $855300 $728400 $311200
Rev 2010 $774000 $502000 $171300
Empl 2008 7 7 5
Empl 2009 7 6 4
Empl 2010 5 3 3
Office of Entrepreneurial Development
ED Resources continued to differ in terms of the size of firms they served as shown in Figure 42 Again this year SBDC continues to serve the highest revenue clients ($774000 average) followed by SCORE ($502000 average) and WBC ($171300 average) All three of ED Resourcesrsquo clients reported lower average annual revenues than those assisted in 2009 Average employment reported by SBDC SCORE and WBC clients was also lower than clients served in 2009 in all cases especially SCORE In terms of revenues WBC serves a distinct client base from both SBDC and SCORE however SBDC and SCORE do not serve distinct client bases in terms of revenue27
Figure 42 ndash Total ED Resources ndash Revenue and Employment (Average ED client Revenues and Number of Employees)
27 We used a Scheffe test to examine the pair-wise differences to control for the familywise error rate We found significant revenue differences (95 confidence) between WBC and SBDC as well as between WBC and SCORE groups No other significant differences were found
Impact Study of Entrepreneurial Development 23Resources ndash 2010-2011
Office of Entrepreneurial Development
Figure 42A examines the average revenues by the hours of counseling received28 to understand the relationship between client revenues and resource utilization The data shows that clients from SBDC SCORE and WBC that received a greater number of hours of counseling tended to be larger in size For example average revenues for SCORE clients who received less than 3 hours of counseling were $336400 while average revenues for clients who received 3 or more hours of counseling were $618300 This trend is also apparent with SBDC clients where the difference between clients that received 5 or more hours of counseling and those that received from 3 to less than 5 hours of counseling is $148700 The overall average revenues regardless of hours of counseling indicated by the black cross bars in the figure below were $774000 for SBDC 502000 for SCORE and 171300 for WBC
Figure 42A ndash Total ED Resources ndash Revenues by Hours of 29 Counseling
Aggregate Hours Mean Revenue
($502000)
($774000)
($171300)
($637200)
28 For each ED Resource the number of respondents is comparable for each category of hours of counseling received SBDC lt 3 hrs = 1668 ge 3 amp lt 5 hrs = 1668 ge 5 hrs = 1777SCORE lt 3 hrs = 2219 ge 3 hours= 2225WBC lt 3 hrs = 297 ge 3 hours= 292 29 SBDC reports hours of counseling in three categories (lt 3 ge3 to lt5 ge 5) whereas SCORE and WBC report two categories (lt 3 ge 3) SCORE and WBC also provide 5 or more hours of counseling to their clients and these hours are captured in the 3 or more hours of counseling category When comparing ED Resources by hours of counseling those clients receiving 3 or more hours of counseling from SBDC reported average revenues of $843500
Impact Study of Entrepreneurial Development 24Resources ndash 2010-2011
Office of Entrepreneurial Development
Figure 43 presents the demographic characteristics of ED Resource clients in terms of gender race ethnicity and veteran status30 A new category was added to the survey for this year For the first time clients were able to select ldquoMale and Female Ownersrdquo as an answer to the gender of the owner(s) question (See Appendix 4 for a complete survey instrument) Predictably both Male and Female categories dropped sharply from last yearrsquos numbers The proportions of the majority of the race and ethnicity categories have not changed from the previous year with the exception of a reduction in the number of Whites31 Figure 43 ndash Total ED Resources ndash Demographic Characteristics32
2008 n = 6770 2009 n = 8493 2010 n = 10146
30 The Veteran and Service-disabled Veteran categories are shown in the figure above Additional results for total ED Resource clients included Reservist (03) and National Guard Member (04) 31 Just over 16 of survey respondents did not answer the race questions whereas 45 answered last year Therefore the drop in in the number of Whites may be due to non-responses and not reflective of the actual population 32 Totals may not equal 100 due to non-respondents and respondents who selected multiple ethnicities The 2010 total ED Resources demographic distribution was compared to the national averages from the 2007 Survey of Business Owners from the Census Bureau (SBO) The distribution was comparable across characteristics except for the following SBO figures White business owners were 83 of the small business population Female business owners were 29 and Male business owners were 51
Impact Study of Entrepreneurial Development 25Resources ndash 2010-2011
Office of Entrepreneurial Development
Figure 44 shows the distribution of ED Resource clients by age of business owner The largest groups of ED Resource clients belonged to the 45 to 54 and 35 to 44 age categories 28 and 22 respectively This outcome is consistent with the previous years depicted in the figure Both the 18-24 and 25-34 age categories increased slightly from the previous year Differences in findings from the previous year may be due to an increased number of clients that did not respond to the corresponding survey question for age33
Figure 44 ndash Total ED Resources ndash Age of Business Owner34
2008 n = 6770 2009 n = 8493 2010 n = 10146
33 Survey questions can be found in the survey instrument in Appendix 4 q18 requests the clientsrsquo age Eleven percent did not respond to the age question for this yearrsquos study Last year only two percent did not respond 34 The 2010 total ED Resources age distribution was compared to the national averages from the SBO The distribution was comparable except that SBO reported 65+ at 125 (compared to 5 for ED Resources)
Impact Study of Entrepreneurial Development 26Resources ndash 2010-2011
Office of Entrepreneurial Development
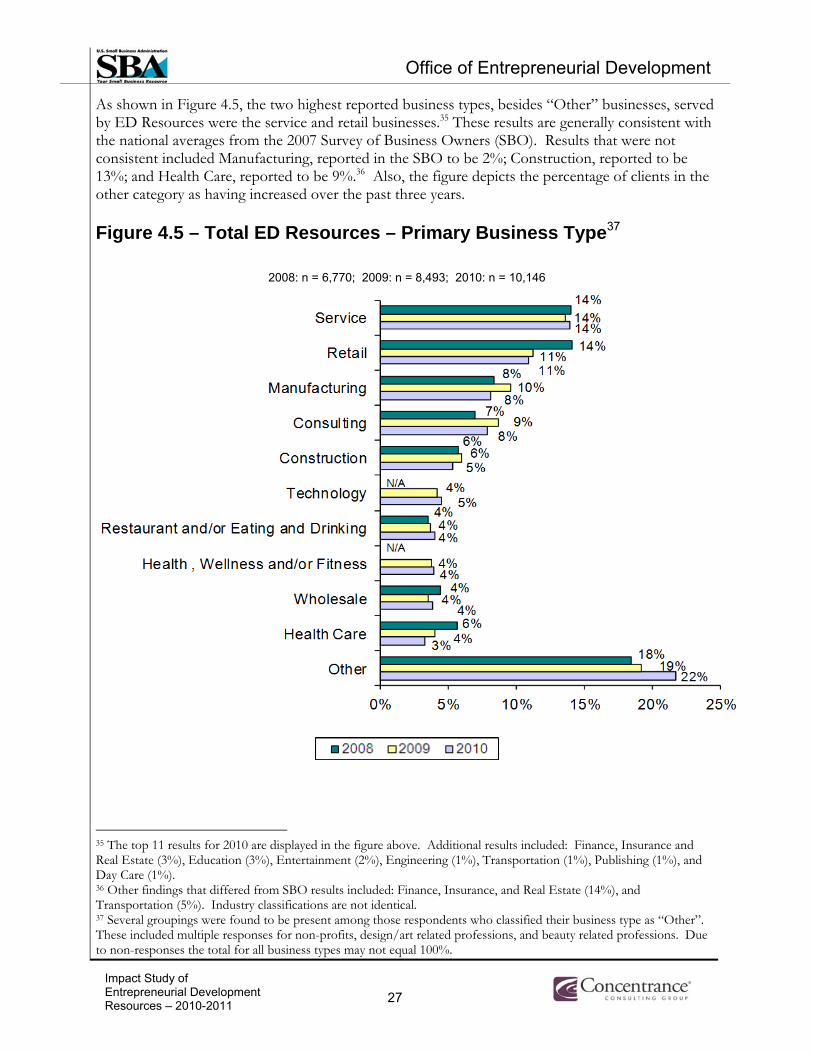
As shown in Figure 45 the two highest reported business types besides ldquoOtherrdquo businesses served by ED Resources were the service and retail businesses35 These results are generally consistent with the national averages from the 2007 Survey of Business Owners (SBO) Results that were not consistent included Manufacturing reported in the SBO to be 2 Construction reported to be 13 and Health Care reported to be 936 Also the figure depicts the percentage of clients in the other category as having increased over the past three years
Figure 45 ndash Total ED Resources ndash Primary Business Type37
2008 n = 6770 2009 n = 8493 2010 n = 10146
35 The top 11 results for 2010 are displayed in the figure above Additional results included Finance Insurance and Real Estate (3) Education (3) Entertainment (2) Engineering (1) Transportation (1) Publishing (1) and Day Care (1) 36 Other findings that differed from SBO results included Finance Insurance and Real Estate (14) and Transportation (5) Industry classifications are not identical 37 Several groupings were found to be present among those respondents who classified their business type as ldquoOtherrdquo These included multiple responses for non-profits designart related professions and beauty related professions Due to non-responses the total for all business types may not equal 100
Impact Study of Entrepreneurial Development 27Resources ndash 2010-2011
Office of Entrepreneurial Development
Figure 46 depicts the reasons clients reported seeking business counseling from ED Resources Reputation and lowfree cost of service were the most common reasons for clients to seek assistance from ED Resources SBDC clients reported lowfree cost of service as the most common reason (50) but rated reputation of the ED Resource and referral as equally strong reasons (44) In contrast to the total ED Resources SCORE clients reported that reputation (55) was a stronger reason for seeking assistance than was lowfree cost of service (52) and WBC clients reported that referrals (44) were more often a reason for their seeking assistance as opposed to reputation (40)
Figure 46 ndash Total ED Resources ndash What led to your decision to seek business counseling from ED Resources38
n = 10146
38 The totals do not equal 100 due to respondents selecting multiple factors This figure compares results by individual ED Resource therefore corresponding figures are not repeated in the individual ED Resource sections of this report
Impact Study of Entrepreneurial Development 28Resources ndash 2010-2011
Office of Entrepreneurial Development
Resource Impacts
Usefulness and Value of Services or Assistance Received
As shown in Figure 47 below 73 of 2010 ED Resource clients reported that the information they received from their counselor was valuable
Figure 47 ndash Total ED Resources ndash How useful was the information you received39
2008 n = 6770 2009 n = 8493 2010 n = 10146
39 Low value includes the lsquoSomewhat Valuablersquo and lsquoNot Valuablersquo response categories High value includes the lsquoExtremely Valuablersquo and lsquoValuablersquo response categories Percentages will not total 100 due to non-response
Impact Study of Entrepreneurial Development 29Resources ndash 2010-2011
Office of Entrepreneurial Development
Figure 47A shows the perceived usefulness of ED Resources relative to the number of hours of counseling received recorded in two categories less than 3 hours and 3 or more hours For comparison the overall level of perceived usefulness is also provided in the figure but this segment does not distinguish usefulness by hours of counseling received
As illustrated below ED Resource clients who had three or more hours of counseling rated usefulness of ED Resources as ldquohighrdquo more often than those who had less than three hours of counseling40 Seventy-six percent of clients who received 3 or more hours of counseling rated the usefulness of total ED Resources as ldquohighrdquo versus 69 of those that received less than 3 hours of counseling
Figure 47A ndash How useful was the information you received Total ED Resources by Hours of Counseling vs Total ED Resources Aggregate Hours
40 This finding is supported by the regression analysis beginning on page 39
Impact Study of Entrepreneurial Development 30Resources ndash 2010-2011
Office of Entrepreneurial Development
Decision to Start a Business
Figure 48 depicts the perceived assistance of ED Resources with the clientrsquos decision to start a business These results are presented by individual ED Resource and total ED Resources Results for Nascent and Start-up firms are reported in each category41 Across SBDC SCORE and WBC the relationship between Nascent and Start-up clients remained consistent Start-up clients more often indicated that they decided to go into business as a result of the assistance they received from their respective ED Resource center than Nascent clients
Figure 48 ndash Total ED Resources ndash Did you decide to go into business as a result of the assistance you received42
n = 4589
41 The corresponding survey question for this figure asked ldquoIf you were not in business at the time you were assisted by the counselor did you decide to go into business as a result of that assistancerdquo Therefore In-Business clients were not observed because these clients were in business at the time they received counseling 42 This figure compares results by individual ED Resource therefore corresponding figures are not repeated in the individual ED Resource sections of this report
Impact Study of Entrepreneurial Development 31Resources ndash 2010-2011
Office of Entrepreneurial Development
Clientsrsquo Decision to Change Management Practices
As a result of ED Resource assistance for 2010 clients 57 of Start-up and 62 of In-Business firms changed their current management practices or strategies The percentage of Start-up firms reporting that they changed their management practices or strategies has decreased slightly over the past three years The frequency of In-Business firms reporting changes in management practices or strategies remained consistent from 2009
Table 42 ndash ED Resources Impact on Managerial Practices
Impact Study of Entrepreneurial Development 32Resources ndash 2010-2011
Changed Current Management PracticesStrategies
2008 Clients 2009 Clients 2010 Clients
Changed Current Management PracticesStrategies
2008 Clients 2009 Clients 2010 Clients
Start-up 60 59 57
In-Business 61 62 62
Office of Entrepreneurial Development
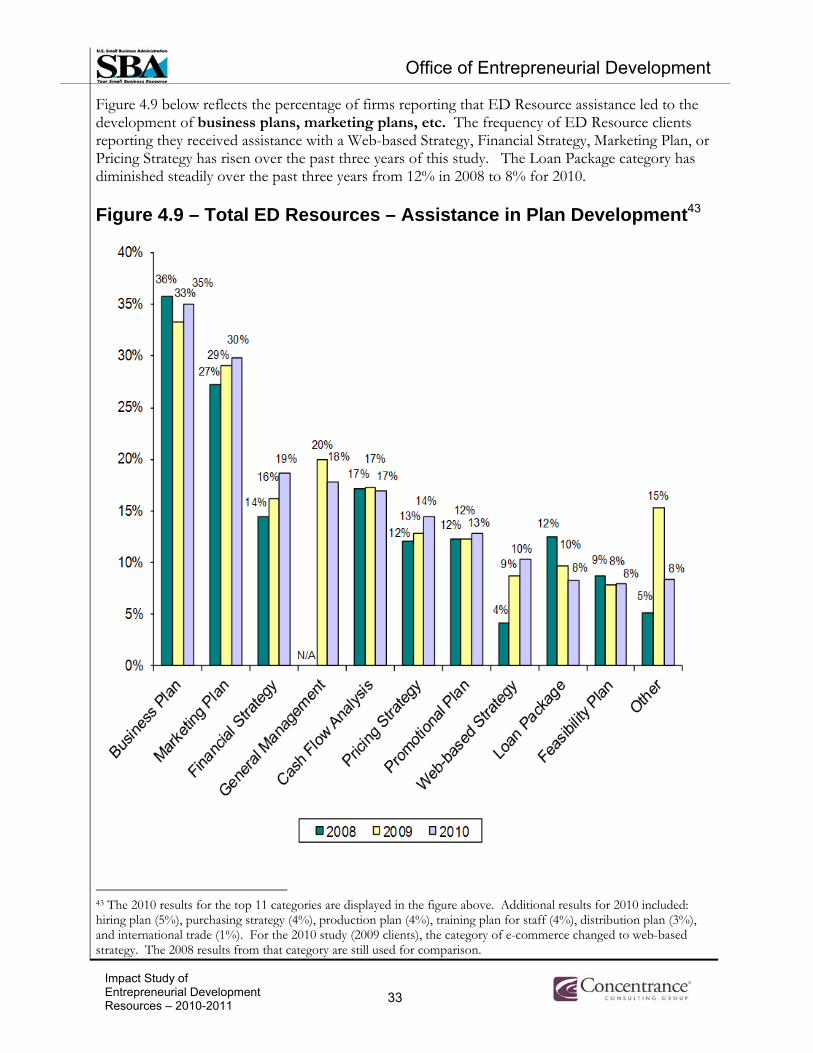
Figure 49 below reflects the percentage of firms reporting that ED Resource assistance led to the development of business plans marketing plans etc The frequency of ED Resource clients reporting they received assistance with a Web-based Strategy Financial Strategy Marketing Plan or Pricing Strategy has risen over the past three years of this study The Loan Package category has diminished steadily over the past three years from 12 in 2008 to 8 for 2010
Figure 49 ndash Total ED Resources ndash Assistance in Plan Development43
43 The 2010 results for the top 11 categories are displayed in the figure above Additional results for 2010 included hiring plan (5) purchasing strategy (4) production plan (4) training plan for staff (4) distribution plan (3) and international trade (1) For the 2010 study (2009 clients) the category of e-commerce changed to web-based strategy The 2008 results from that category are still used for comparison
Impact Study of Entrepreneurial Development 33Resources ndash 2010-2011
Office of Entrepreneurial Development
Sales Job Creation and Job Retention
Figure 410 presents findings on the attitudes toward the financial impact of ED Resource assistance irrespective of clientsrsquo reasons for seeking assistance The frequency of ED Resource clients that indicated they were able to increase profit margin retain current staff hire new staff or increase sales as a result of ED Resource assistance was lower for each category when compared to the previous year The number of 2010 ED Resource clients indicating impactful assistance in each category decreased from the previous year The retaining current staff and increased sales categories each experienced a four percentage point decrease
Figure 410 ndash Total ED Resources ndash Perceived Impact of Assistance44
2008 n = 6770 2009 n = 8493 2010 n = 10146
44 See Appendix 2 for a more detailed response to q4 In addition to the reported findings in the figure above data was also collected for 2010 clientsrsquo perceived impact of assistance regarding the acquisition of a bank loan (16) a SBA guarantee loan (18) and a SBA Disaster loan (18)
Impact Study of Entrepreneurial Development 34Resources ndash 2010-2011
Office of Entrepreneurial Development
Figure 410A shows the perceived financial impact of ED Resources relative to the number of hours of counseling received recorded in two categories less than 3 hours and 3 or more hours of counseling received For comparison the overall level of perceived financial impact is also provided which does not distinguish by hours of counseling
It is notable that across all four categories ED Resource clients with 3 or more hours of counseling reported a greater positive financial impact than total ED Resource clients
For example clients that received 3 or more hours of counseling increased their sales 30 of the time whereas clients that received less than 3 hours of counseling increased their sales 19 of the time
Figure 410A ndash Total ED Resources ndash Perceived Impact of Assistance (Hours of Counseling Received vs Aggregate Hours)
Total ED Resources (ge 3 Hours)
Total ED Resources (Aggregate Hours)
Total ED Resources (lt 3 Hours)
Impact Study of Entrepreneurial Development 35Resources ndash 2010-2011
Office of Entrepreneurial Development
Cross-Sectional Demographic Analysis
This section compares revenues and employment for ED Resource clients by gender race ethnicity and veteran status Figure 411 compares average revenues for firms in each demographic category rounded to the nearest $1000 For example this figure shows that in 2010 firms owned by Females ($385000) were on average smaller than firms owned by Males ($778000) and firms owned by Males and Females ($767000)
Veteran-owned firms had an average of $1035000 in revenue the highest revenues by Veterans in the past three years Over the past year reported revenues for Service-disabled Veterans fell to an average of $727000 Regarding race and ethnicity average revenues fell across all demographic categories
Figure 411 ndash Revenues (000s) for Firms in Selected Demographic Categories45
45 Firms that reported revenues were required to do so within the range of $1000 to $25000000 Due to small sample sizes corresponding figures are not repeated in the individual ED Resource sections of this report
Impact Study of Entrepreneurial Development 36Resources ndash 2010-2011
Office of Entrepreneurial Development
Figure 412 compares employment by demographic category Firms owned by Female clients tended to have fewer employees than firms owned by Male clients however firms with both male and female owners a new category for this year had the highest average employment levels in the gender segment This new category also partially explains the drop in average number of employees for both male firms and for female firms HispanicLatino White and American IndianAlaskan Native firms had more employees than other race and ethnicity demographic categories In each category of firms the average number of employees has gone down from 200946
Figure 412 ndashTotal Employees for Firms in Selected Demographic Categories
46 Due to the small sample size of Service-disabled veterans (42) who reported having employees 2009 results should be treated with caution Due to small sample sizes corresponding figures are not repeated in the individual ED Resource sections of this report
Impact Study of Entrepreneurial Development 37Resources ndash 2010-2011
Office of Entrepreneurial Development
Regression Analysis of the Effects of Gender Race Ethnicity and Veteran Status on Key ED Resource Impacts
The following section presents findings from an analysis of the effects of firm and client characteristics on ED Resource impacts We report results from a series of multiple regression analyses These were conducted to test whether respondents differed significantly in perceived usefulness quality of counseling experience and financial impacts of ED Resource assistance based on selected firm (revenues business segment ED Resource contact hours) and demographic (age gender race ethnicity veteran status) characteristics
These analyses address the following research questions
1 Are there differences in perceived usefulness based on firm size business segment ED Resource geographic location hours of counseling age of owner(s) gender race ethnicity or veteran status
2 Are there differences in perceived assistance with the decision to start a business based on firm size business segment ED Resource geographic location hours of counseling age of owner(s) gender race ethnicity or veteran status
3 Are there differences in the financial impact of ED resource assistance based on firm size business segment ED Resource geographic location hours of counseling age of owner(s) gender race ethnicity or veteran status
Each regression model examined the impact of selected demographic characteristics (age gender race ethnicity and veteran status) and firm characteristics (size business segment ED Resource geographic location hours of counseling received) on a particular resource impact These impacts included perceived usefulness of ED Resource assistance perceived quality of the counseling experience perceived assistance with the decision to start a business and perceived financial impacts (sales cash flow hiring and profits)
Each resource impact is used as a dependent (ie outcome) variable For example the dependent variable for the first model is perceived usefulness of ED Resource assistance The dependent variable for the second model is perceived quality of the counseling experience The dependent variable for the third model is perceived assistance with the decision to start a business The dependent variable for the fourth model is a financial impact score which is a summary measure based on 4 self-reported financial impact measures (the effect of assistance on increases in sales cash flow new hires and profit margins)47
47 Consistent with previous analyses this scale is the sum of the following questionnaire items q51 q52 q55 and q57 Survey questions can be found in the survey instrument in Appendix 4
Impact Study of Entrepreneurial Development 38Resources ndash 2010-2011
Office of Entrepreneurial Development
The set of independent or predictor variables included variables representing the firm and client demographic characteristics include the following
Sales Revenues Client Segment
o Nascent o Start-Up o In-Business
ED Resource (SBDC SCORE or WBC) Geographic Location (Urban suburban rural) Number of hours of assistance (less than 3 3 or more) Respondent Age Gender Race
o Hispanic o American Indian o Asian o BlackAfrican-American o Native HawaiianPacific Islander
Ethnicity o HispanicLatino
Veteran or Service-disabled Veteran
Regression Results
In the results presented in this section statistically significant predictor variables are identified48
Detailed regression results are presented in Appendix 6
The first regression model tested for a relationship between selected firm and client characteristics and the clientrsquos perception of the usefulness of the servicesassistance received 49
Results of this regression suggest that larger firms reported higher levels of perceived usefulness of ED Resource assistance than smaller firms Firms who received less than 3 hours of assistance reported lower levels of perceived usefulness than firms with 3 or more hours of counseling Additionally firms in the In-business segment also reported significantly higher perceived usefulness from ED resource assistance
In terms of client demographics there were no significant differences in perceived usefulness based on age gender veteran status or ethnicity Native American and White clients
48 Relationships are considered statistically-significant at the 005 level Marginal significance is defined as significant at the 010 level 49 The overall model was statistically significant at the 001 level although the R2 a measure of model fit was very small (00149) Coefficients reported here were significant at the 010 level The usable sample size was 2427 Firms with revenue greater than $5000000 and less than $1000 were removed from all regression analyses as were firms with unknown business segment The revenue upper bound of $5 million was used in order to eliminate bias resulting from potential outliers skewing the distributionrsquos measures of central tendency
Impact Study of Entrepreneurial Development 39Resources ndash 2010-2011
Office of Entrepreneurial Development
reported significantly higher perceived usefulness but there were no other differences based on race
The second regression model tested for a relationship between selected firm and client characteristics and perceived ED resource assistance with the decision to start a business50
Consistent with the previous yearrsquos results this analysis suggests that larger firms firms in the In-Business segment and SCORE clients were less likely to report that their decision to start a business was the result of ED resource assistance However there were no significant differences based on any other firm or client demographic characteristics
The third regression model tested for a relationship between selected firm and client characteristics and the self-reported financial impact of ED Resource assistance These impacts include a combination of increases in sales cash flow hiring of new employees and profits51 These results provided no significant results even at a 010 level indicating that no firm level or client demographic characteristics affected the perception of the financial impact of ED Resource assistance
These regression analyses indicate that both firm and client characteristics can be significant determinants of the clientrsquos perception of the usefulness of the servicesassistance received perceived assistance with the decision to start a business or the financial impact of assistance received
Variations in perceived usefulness perceived assistance with the decision to start a business and financial impacts are due in part to differences in firm size ED Resource and hours of assistance Geographic location did not play a significant role in any regression model In addition in some cases there were significant effects of gender age and ethnicity However none of these effects were consistent across outcomes
50 This model was estimated using a logistic regression analysis due to the binary dependent variable (q1c) The overall model was significant at the plt001 level although the pseudo R2 was small (00884) Coefficients reported here were significant at the 010 level Survey questions can be found in the survey instrument in Appendix 4 51 The overall model was not significant at the 010 level the R2 was extremely small (0008)
Impact Study of Entrepreneurial Development 40Resources ndash 2010-2011
Office of Entrepreneurial Development
V SBDC 2010 VS TOTAL ED RESOURCES
The following section presents results from SBDC clients52 First we report the general demographic and financial characteristics of SBDC 2010 clients This is followed by additional findings on the usefulness of SBDC for Nascent Start-up and In-Business firms organized by research question as follows
Is there a relationship between servicesassistance provided by SBDC and the clientrsquos perception of the usefulness and value of servicesassistance received
Is there a relationship between the servicesassistance provided by SBDC and the clientrsquos decision to start a business
Is there a relationship between the servicesassistance provided by SBDC and the clientrsquos decision to implement andor change management andor marketing practices in their business
Are the servicesassistance provided by SBDC having an impact on the clientrsquos financial position in terms of job creation job retention and sales
52 All references to ED Resource clients pertain to ED Resource Partnersrsquo face-to-face counseling clients who received assistance from a designated ED Resource Partner (SBDCSCOREWBC)
Impact Study of Entrepreneurial Development 41Resources ndash 2010-2011
Office of Entrepreneurial Development
Analysis of the Attitudes of SBDC Clients Regarding the Assistance They Received from SBDC
Demographic Characteristics of SBDC Clients
This section describes the general demographic and financial characteristics of SBDC clients These results are based on an analysis of 5113 completed surveys As shown in Figure 51 the largest business segment served by SBDC is the In-Business segment (59) which is five percentage points higher than total ED Resources
Figure 51 ndash SBDC ndash Distribution of Clients by Segment (2010 Clients)53
SBDC vs Total ED Resources
SBDC n = 5113 Total ED Resources n = 10146
Table 51 compares revenues and employment for SBDC vs total ED Resources These results indicate that SBDC clients have higher revenues than total ED Resource clients
Table 51 ndash SBDC Client Revenues and Employment (2010)
Total ED Total ED SBDC SBDC Resources Resources
Average Revenue $774000 $637200 Average Employees 5 4
53 Respondents who reported being in business but who did not provide a valid start date for that business were not assigned to a business segment Therefore the total of client segments served for SBDC may not equal 100
Impact Study of Entrepreneurial Development 42Resources ndash 2010-2011
Office of Entrepreneurial Development
Demographic characteristics of SBDC clients including gender race ethnicity and veteran status are reported in Figure 5254 The demographic makeup of SBDC was comprised of a smaller percentage of Females and a higher percentage of Males than total ED Resources by four and two percentage points respectively Other demographic proportions followed a pattern similar to those of total ED Resources
Figure 52 ndash SBDC ndash Demographic Characteristics (2010 Clients)55
SBDC vs Total ED Resources
SBDC n = 5113 Total ED Resources n = 10146
54 The Veteran and Service-disabled Veteran categories are shown in the figure above Additional results for SBDC clients included Reservist (03) and National Guard Member (04) 55 The total may not equal 100 due to non-respondents and those who selected multiple ethnicities The SBDC demographic distribution was compared to the national averages from the SBO The distribution was comparable across characteristics except for the following SBO figures White business owners were 83 of the small business population Female business owners were 29 Male business owners were 51 and American IndianAlaskan Native business owners were less than 1
Impact Study of Entrepreneurial Development 43Resources ndash 2010-2011
Office of Entrepreneurial Development
Figure 53 shows the distribution of SBDC clients by age of business owner The largest age group served was between the ages of 45 and 54 (29) SBDC clientsrsquo age distribution was consistent with that of total ED Resources
Figure 53 ndash SBDC ndash Age of Business Owner (2010 Clients)56
SBDC vs Total ED Resources
SBDC n = 5113 Total ED Resources n = 10146
56 The SBDC age distribution was compared to the national averages from the SBO The distribution was comparable across characteristics except that SBO reported 65+ at 125 (compared to 5 for SBDC)
Impact Study of Entrepreneurial Development 44Resources ndash 2010-2011
Office of Entrepreneurial Development
Figure 54 shows that the most common types of businesses served by SBDC were in the service and retail categories57 These results are generally consistent with the national averages from the SBO Results that were not consistent included Manufacturing reported in the SBO to be 2 Construction reported to be 13 and Health Care reported to be 958 Also the figure shows the share of SBDC clients in the manufacturing construction technology and restaurant andor eating and drinking industries was higher than total ED Resources
Figure 54 ndash SBDC ndash Type of Business (2010 Clients) 59
SBDC vs Total ED Resources
57 The top 11 categories for 2010 SBDC clients are displayed in the figure above Additional results included Finance Insurance and Real Estate (3) Education (2) Entertainment (2) Publishing (1) Transportation (1) Engineering (2) Day Care (1) 58 Other SBO results that differed with the findings included Finance Insurance and Real Estate (14) and Transportation (5) Industry classifications are not identical 59 Due to non-responses and multiple business type selections the total for all business types might not equal 100
Impact Study of Entrepreneurial Development 45Resources ndash 2010-2011
Office of Entrepreneurial Development
SBDC Client Attitudes Regarding ED Resource Assistance
Usefulness and Value of Services or Assistance Received
Approximately 74 of SBDC clients reported that the information they received from counselors was valuable60 Figure 55 shows ratings of usefulness of SBDC ED Resources provided by business segment and compared to total ED Resources SBDC Nascent firms rated the usefulness of information somewhat higher than Start-up and In-Business firms Nascent and Start-up clients both highly rated the usefulness of the assistance received more often than did total ED Resource clients
Figure 55 ndash SBDC ndashUsefulness of SBDC (2010 Clients)61
SBDC vs Total ED Resources
60 This result does not appear in the figure above which is displayed by business segment This figure was calculated for SBDC clients overall without regard to business segment 61 Low value includes the lsquoSomewhat Valuablersquo and lsquoNot Valuablersquo response categories High value includes the lsquoExtremely Valuablersquo and lsquoValuablersquo response categories
Impact Study of Entrepreneurial Development 46Resources ndash 2010-2011
Office of Entrepreneurial Development
Figure 55A below shows the perceived usefulness of SBDC assistance based upon the number of hours of counseling received Figure 55A shows that SBDC clients who received 5 or more hours of counseling rated usefulness as ldquohighrdquo more frequently than those SBDC clients who received less than 5 hours of counseling
Figure 55A ndash Usefulness of SBDC SBDC by Hours of Counseling vs Total ED Resources Aggregate Hours (2010 Clients)
Impact Study of Entrepreneurial Development 47Resources ndash 2010-2011
Office of Entrepreneurial Development
Clientsrsquo Decision to Change Management Practices
Figure 56 compares SBDC client decisions to change management practices or strategies by business segment As a result of SBDC assistance 56 of Start-up firms changed their management practices or strategies and 58 of In-Business clients reported changing management practices or strategies The levels of SBDC Start-up and In-Business clients that changed their management practices were slightly below those for total ED Resource clients
Figure 56 ndash SBDC ndash Changed Management PracticesStrategies as a Result of SBDC ED Resource Assistance (2010 Clients)
SBDC vs Total ED Resources
Impact Study of Entrepreneurial Development 48Resources ndash 2010-2011
Office of Entrepreneurial Development
Figure 57 below reflects the percentage of firms reporting that SBDC assistance led to the development of business plans marketing plans etc 62 The percentage of SBDC clients that sought assistance with the development of business plans cash flow analyses or preparation of loan packages was higher than that of total ED Resources
Figure 57 ndash SBDC ndash Assistance in Plan Development (2010 Clients)
SBDC vs Total ED Resources
62 The 2010 results for the top 11 categories are displayed in the figure above Additional results included Hiring plan (5) Purchasing Strategy (4) Production Plan (4) Distribution Plan (3) Training Plan for Staff (4) and International Trade (2)
Impact Study of Entrepreneurial Development 49Resources ndash 2010-2011
Office of Entrepreneurial Development
Sales Job Creation and Job Retention
Figure 58 compares SBDC Start-up and In-Business clients in terms of reported financial impact of SBDC assistance on sales profits jobs and the retention of employees irrespective of reasons for seeking assistance63 SBDC Start-up firms reported lower perceived levels of impact regarding both hiring new staff and retaining current staff when compared to total ED Resources SBDC In-Business clientsrsquo reported financial impact surpassed total ED Resources in each category
Figure 58 ndash SBDC ndash Perceived Impact of Assistance (2010 Clients)
SBDC vs Total ED Resources
63 This comparison excludes the Nascent category for total ED Resources and SBDC
Impact Study of Entrepreneurial Development 50Resources ndash 2010-2011
Office of Entrepreneurial Development
Figure 58A compares SBDCrsquos financial impact of assistance on sales profits jobs and the retention of employees to the financial impact results for total ED Resources presented by hours of counseling received The number of hours of counseling received is divided into three categories for SBDC less than 3 hours from 3 to less than 5 hours and 5 or more hours
SBDC clients who received 5 or more hours of counseling reported greater perceived impact of assistance than total ED Resources in each of the categories below For example 41 of clients that received 5 or more hours of SBDC counseling reported an increase in sales and 34 of clients that received 5 or more hours reported an increase in profit margins Total ED Resources reported 34 and 30 in the same categories respectively
Figure 58A ndash SBDC ndash Perceived Impact of Assistance SBDC Hours of Counseling Received for In-Business and Start-ups vs Total ED Resources Aggregate Hours for In-Business and Start-ups (2010 Clients)
Impact Study of Entrepreneurial Development 51Resources ndash 2010-2011
Office of Entrepreneurial Development
[This page is intentionally left blank for two-sided printing]
Impact Study of Entrepreneurial Development 52Resources ndash 2010-2011
Office of Entrepreneurial Development
VI SCORE 2010 VS TOTAL ED RESOURCES
The following section presents results from SCORE clients64 First we report the general demographic and financial characteristics of SCORE clients as provided by 2010 clients This is followed by additional findings on the usefulness of SCORE for Nascent Start-up and In-Business firms organized by research question as follows
Is there a relationship between servicesassistance provided by SCORE and the clientrsquos perception of the usefulness and value of servicesassistance received
Is there a relationship between the servicesassistance provided by SCORE and the clientrsquos decision to start a business
Is there a relationship between the servicesassistance provided by SCORE and the clientrsquos decision to implement andor change management andor marketing practices in their business
Are the servicesassistance provided by SCORE having an impact on the clientrsquos financial position in terms of job creation job retention and sales
64 All references to ED Resource clients pertain to ED Resource Partnersrsquo face-to-face counseling clients who received assistance from a designated ED Resource Partner (SBDCSCOREWBC)
Impact Study of Entrepreneurial Development 53Resources ndash 2010-2011
Office of Entrepreneurial Development
Analysis of the Attitudes of SCORE Clients Regarding the Assistance They Received from SCORE
Demographic Characteristics of SCORE Clients
This section describes the general demographic and financial characteristics of SCORE clients These results are based on an analysis of 4444 completed surveys As shown in Figure 61 the largest business segment served by SCORE was the In-Business segment (49) which is five percentage points lower than the In-Business segment for total ED Resources The Nascent segment was the second largest at 29 and measures three percentage points higher than total ED Resources
Figure 61 ndash SCORE ndash Distribution of Clients by Segment (2010 Clients)65
SCORE vs Total ED Resources
SCORE n = 4444 Total ED Resources n = 10146
Table 61 compares revenues and employment for SCORE clients vs total ED Resources SCORE client revenues are lower than the average for total ED Resources
Table 61 ndash SCORE Client Revenues and Employment (2010)
Total ED SCORE Resources
Average Revenue $502000 $637200 Average Employees 3 4
65 Respondents who reported being in business but who did not provide a valid start date for that business were not assigned to a business segment The total of client segments served for SCORE will therefore not equal 100
Impact Study of Entrepreneurial Development 54Resources ndash 2010-2011
SCORE Total ED Resources
Office of Entrepreneurial Development
Demographic characteristics of SCORE clients including gender race ethnicity and veteran status are reported in Figure 6266 The demographic distribution of SCORE clients follows closely to the pattern of total ED Resources clients overall The percentage of White clients (70) in SCORErsquos demographic makeup is slightly higher than that of total ED Resources (68)
Figure 62 ndash SCORE ndash Demographic Characteristics (2010 Clients)67
SCORE vs Total ED Resources
SCORE n = 4444 Total ED Resources n = 10146
66 The Veteran and Service-disabled Veteran categories are shown in the figure above Additional results for SCORE clients included Reservist (04) and National Guard Member (04) 67 In some instances the total may not equal 100 due to non-respondents and respondents who selected multiple ethnicities The SCORE demographic distribution was compared to the national averages from the SBO The distribution was comparable across characteristics except for the following SBO figures White business owners were 83 of the small business population Female business owners were 29 and Male business owners were 51
Impact Study of Entrepreneurial Development 55Resources ndash 2010-2011
Office of Entrepreneurial Development
Figure 63 shows the distribution of SCORE clients by age of business owner The largest age group served was between the ages of 45 and 54 (27) SCORE clientsrsquo age distribution was consistent with that of total ED Resources
Figure 63 ndash SCORE ndash Age of Business Owner (2010 Clients)68
SCORE vs Total ED Resources
SCORE n = 4444 Total ED Resources n = 10146
68 The SCORE age distribution was compared to the national averages from the SBO The distribution was comparable except that SBO reported 65+ at 125 (compared to 5 for SCORE)
Impact Study of Entrepreneurial Development 56Resources ndash 2010-2011
Office of Entrepreneurial Development
Figure 64 shows that the most common types of businesses served by SCORE were in the service and retail categories69 These results are generally consistent with the national averages from the SBO Results that were not consistent included Manufacturing reported in the SBO to be 2 Construction reported to be 13 and Health Care reported to be 970 Also the figure shows the share of SCORE clients in the technology restaurant andor eating and drinking industries was lower than total ED Resources
Figure 64 ndash SCORE ndash Type of Business (2010 Clients)71
SCORE vs Total ED Resources
69The top 11 categories for 2010 clients are displayed in the figure above Additional results for 2010 included Finance Insurance and Real Estate (3) Education (3) Entertainment (2) Publishing (1) Transportation (1) Engineering (1) Day Care (1) 70 Other SBO results that differed from the findings included Finance Insurance and Real Estate (14) and Transportation (5) Industry classifications are not identical 71 Due to non-responses and multiple business type selections the total for all business types may not equal 100
Impact Study of Entrepreneurial Development 57Resources ndash 2010-2011
Office of Entrepreneurial Development
SCORE Client Attitudes Regarding ED Resource Assistance
Usefulness and Value of Services or Assistance Received
Approximately 73 of SCORE clients reported that the information they received from counselors was valuable72 Figure 65 shows ratings of usefulness of SCORE provided by business segment and compared to total ED Resources For SCORE clients it is apparent that Start-up clients reported high levels of usefulness regarding the assistance they received somewhat less often when compared to other business segments
Figure 65 ndash SCORE ndashUsefulness of SCORE (2010 Clients)73
SCORE vs Total ED Resources
72 This result does not appear in the figure above which is displayed by business segment This percentage was calculated for SCORE clients overall without regard to business segment 73 Low value includes the lsquoSomewhat Valuablersquo and lsquoNot Valuablersquo response categories High value includes the lsquoExtremely Valuablersquo and lsquoValuablersquo response categories
Impact Study of Entrepreneurial Development 58Resources ndash 2010-2011
Office of Entrepreneurial Development
Figure 65A below shows the perceived usefulness of SCORE assistance based upon the number of hours of counseling received Figure 65A shows that 78 of SCORE clients that received 3 or more hours of counseling rated SCORE usefulness as ldquohighrdquo compared to 68 of clients that received less than 3 hours of counseling
Figure 65A ndash Usefulness of SCORE SCORE by Hours of Counseling vs Total ED Resources Aggregate Hours (2010 Clients)
Impact Study of Entrepreneurial Development 59Resources ndash 2010-2011
Office of Entrepreneurial Development
Clientsrsquo Decision to Change Management Practices
Figure 66 compares SCORE client decisions to change management practices or strategies by business segment As a result of SCORE assistance 58 of Start-up firms changed their management practices or strategies and 67 of In-Business clients reported changing management practices or strategies The levels for SCORE Start-up and In-Business clients that changed their management practices and strategies were higher than those for total ED Resources
Figure 66 ndash SCORE ndash Changed Management PracticesStrategies as a Result of SCORE ED Resource Assistance (2010 Clients)
SCORE vs Total ED Resources
Impact Study of Entrepreneurial Development 60Resources ndash 2010-2011
Office of Entrepreneurial Development
Figure 67 below reflects the percentage of firms reporting that SCORE assistance led to the development of business plans marketing plans etc74 The percentage of SCORE clients that sought assistance with pricing strategies (15) was higher than that of total ED Resources (14) SCORE clients reported receiving assistance somewhat less often than total ED Resources for most other categories
Figure 67 ndash SCORE ndash Assistance in Plan Development (2010 Clients)
SCORE vs Total ED Resources
74 The 2010 results for the top 11 categories are displayed in the figure above Additional results for included Hiring plan (4) Purchasing Strategy (4) Production Plan (3) Distribution Plan (3) Training Plan for Staff (3) and International Trade (1)
Impact Study of Entrepreneurial Development 61Resources ndash 2010-2011
Office of Entrepreneurial Development
Sales Job Creation and Job Retention
Figure 68 compares SCORErsquos Start-up and In-Business clients in terms of the reported financial impact of SCORE assistance on sales profits jobs and the retention of employees irrespective of reasons for seeking assistance75 Twenty-five percent of Start-up clients reported that they were able to increase sales as a result of SCORE assistance compared to 34 for total ED Resources Twenty-one percent and 16 of SCORE In-Business clients reported that they were able to retain current staff and hire new staff respectively slightly higher than total ED Resources (20 and 15)
Figure 68 ndash SCORE ndash Perceived Impact of Assistance (2010 Clients)
SCORE vs Total ED Resources
75 This comparison excludes the Nascent category for total ED Resources and SCORE
Impact Study of Entrepreneurial Development 62Resources ndash 2010-2011
Office of Entrepreneurial Development
Figure 68A compares SCORErsquos financial impact of assistance for increasing sales profits jobs and the retention of employees to the financial impact results for total ED Resources presented by hours of counseling received The number of hours of counseling received is divided into two categories for SCORE less than 3 hours and 3 or more hours It is apparent from the figure below that except for the retain current staff category the greater the number of hours of counseling received the greater the perceived impact of assistance reported by SCORE In-Business and Start-up clients
Figure 68A ndash SCORE ndash Perceived Impact of Assistance SCORE Hours of Counseling Received for In-Business and Start-ups vs Total ED Resources Aggregate Hours for In-Business and Start-ups (2010 Clients)
Impact Study of Entrepreneurial Development 63Resources ndash 2010-2011
Office of Entrepreneurial Development
[This page is intentionally left blank for two-sided printing]
Impact Study of Entrepreneurial Development 64Resources ndash 2010-2011
Office of Entrepreneurial Development
VII WBC 2010 VS TOTAL ED RESOURCES
The following section presents results from WBC clients76 First we report the general demographic and financial characteristics of WBC clients as provided by 2010 clients This is followed by additional findings on the usefulness of WBC for Nascent Start-up and In-Business firms organized by research question as follows
Is there a relationship between servicesassistance provided by WBC and the clientrsquos perception of the usefulness and value of servicesassistance received
Is there a relationship between the servicesassistance provided by WBC and the clientrsquos decision to start a business
Is there a relationship between the servicesassistance provided by WBC and the clientrsquos decision to implement andor change management andor marketing practices in their business
Are the servicesassistance provided by WBC having an impact on the clientrsquos financial position in terms of job creation job retention and sales
76 All references to ED Resource clients pertain to ED Resource Partnersrsquo face-to-face counseling clients who received assistance from a designated ED Resource Partner (SBDCSCOREWBC)
Impact Study of Entrepreneurial Development 65Resources ndash 2010-2011
Office of Entrepreneurial Development
Analysis of the Attitudes of WBC Clients Regarding the Assistance They Received from WBC
Demographic Characteristics of WBC Clients
This section describes the general demographic and financial characteristics of WBC clients These results are based on an analysis of 589 completed surveys As shown in Figure 71 the largest business segment served by WBC is the In-Business segment Fifty percent of WBC respondents were In-Business clients compared to 54 of total ED Resource clients The figure also shows that there was a greater share of WBC clients in the Nascent segment (31) compared to total ED Resources (26)
Figure 71 ndash WBC ndash Distribution of Respondents by Segment (2010 Clients)77
WBC vs Total ED Resources
WBC n = 589 Total ED Resources n = 10146
Table 71 compares revenues and employment for WBC clients vs total ED Resources These results indicate that WBC clients are smaller in terms of revenues and number of employees than total ED Resources combined
Table 71 ndash WBC Client Revenues and Employment (2010)
Total ED WBC Resources
Average Revenue $171300 $637200 Average Employees 3 4
WBC Total ED Resources
77 Respondents who reported being in business but who did not provide a valid start date for that business were not assigned to a business segment The total of client segments served for WBC therefore may not equal 100
Impact Study of Entrepreneurial Development 66Resources ndash 2010-2011
Office of Entrepreneurial Development
Demographic characteristics of WBC clients including gender race ethnicity and veteran status are reported in Figure 7278 Not surprisingly about 62 of WBC clients are Female A noteworthy 24 of WBC clients are BlackAfrican American compared to 11 for total ED Resources HispanicLatino clients represent 8 of WBC clients WBC serves a small share of Veterans (5) and Service-disabled veterans (1)
Figure 72 ndash WBC ndash Demographic Characteristics (2010 Clients)79
WBC vs Total ED Resources
WBC n = 589 Total ED Resources n = 10146
78 The Veteran and Service-disabled Veteran categories are shown in the figure above Additional results for WBC clients included Reservist (02) and National Guard Member (00) 79 In some instances the total percentage might not equal 100 due to non-respondents and respondents who selected multiple ethnicities The WBC demographic distribution was compared to the national averages from the SBO The distribution was comparable across characteristics except for the following SBO figures White business owners were 82 of the small business population BlackAfrican American business owners were 12 and Asian business owners were 7
Impact Study of Entrepreneurial Development 67Resources ndash 2010-2011
Office of Entrepreneurial Development
Figure 73 shows the distribution of WBC clients by age of business owner The largest age group served was between the ages of 35-44 which accounts for 24 of WBC clients compared to 22 of total ED Resource clients Approximately 44 of WBC clients were between 18 and 44 years of age making WBC the youngest demographic of the three ED Resources
Figure 73 ndash WBC ndash Age of Business Owner (2009 Clients)80
WBC vs Total ED Resources
WBC n = 589 Total ED Resources n = 10146
80 The 2010 WBC age distribution was compared to the national averages for women-owned businesses from the SBO The distribution was comparable except for the following SBO figures 25-34 was 11 (compared to 18 for WBC) and 65+ was reported at 10 (compared to 5 for WBC)
Impact Study of Entrepreneurial Development 68Resources ndash 2010-2011
Office of Entrepreneurial Development
Figure 74 shows that the most common types of businesses served by WBC besides other were in the service and retail categories81 These results are generally consistent with the national averages from the SBO for women-owned firms Results that were not consistent included Health Care reported to be 16 in the SBO and Manufacturing reported in the SBO to be 182 The figure also shows the share of WBC clients in the service retail and consulting industries was higher than that of total ED Resources while the share of clients in the manufacturing construction technology and health care industries was lower than total ED Resources
Figure 74 ndash WBC ndash Type of Business (2010 Clients)83
WBC vs Total ED Resources
81 The top 11 categories for 2010 clients are displayed in the figure above Additional results included Finance Insurance and Real Estate (4) Education (3) Entertainment (1) Publishing (1) Transportation (3) Engineering (1) Day Care (2) 82 Other SBO results that differed from the findings included Finance Insurance and Real Estate (11) Industry classifications are not identical 83 Due to non-responses and multiple business type selections the total for all business types might not equal 100
Impact Study of Entrepreneurial Development 69Resources ndash 2010-2011
Office of Entrepreneurial Development
WBC Client Attitudes Regarding ED Resource Assistance
Usefulness and Value of Services or Assistance Received
Approximately 72 of WBC clients reported that the information they received from counselors was valuable84 Figure 75 shows ratings of usefulness of WBC provided by business segment and compared to total ED Resources WBC Nascent clients more often rated assistance as useful (78) than did total ED Resources (73) Start-up and In-Business clients rated assistance as useful less often (68) than total ED Resources
Figure 75 ndash WBC ndash Usefulness of WBC (2010 Clients)85
WBC vs Total ED Resources
84 This result does not appear in the figure above which is displayed by business segment This percentage was calculated for WBC clients overall without regard to business segment 85 Low value includes the lsquoSomewhat Valuablersquo and lsquoNot Valuablersquo response categories High value includes the lsquoExtremely Valuablersquo and lsquoValuablersquo response categories
Impact Study of Entrepreneurial Development 70Resources ndash 2010-2011
Office of Entrepreneurial Development
Figure 75A below shows the perceived usefulness of WBC assistance based upon the number of hours of counseling received Figure 75A shows that 76 of WBC clients that received more than 3 or more hours of counseling rated WBC usefulness ldquohighrdquo as compared to 69 of clients that received less than 3 hours of counseling
Figure 75A ndash Usefulness of WBC WBC by Hours of Counseling vs Total ED Resources Aggregate Hours (2010 Clients)
WBC vs Total ED Resources
Impact Study of Entrepreneurial Development 71Resources ndash 2010-2011
Office of Entrepreneurial Development
Clientsrsquo Decision to Change Management Practices
Figure 76 compares WBC client decisions to change management practices or strategies by business segment As a result of WBC assistance 62 of Start-up clients and 64 of In-Business clients reported changing their management practices or strategies The percentages of WBC Start-up and In-Business clients that changed their management practices were higher than that of total ED Resource clients
Figure 76 ndash WBC ndash Changed Management PracticesStrategies as a Result of WBC ED Resource Assistance (2010 Clients)
WBC vs Total ED Resources
Impact Study of Entrepreneurial Development 72Resources ndash 2010-2011
Office of Entrepreneurial Development
Figure 77 below reflects the percentage of firms reporting that WBC ED Resource assistance led to the development of business plans marketing plans etc86 The percentage of WBC clients that sought assistance with in the Other category (7) was less than that of total ED Resources (8) WBC clients reported receiving assistance as often or more often than total ED Resources for all other categories
Figure 77 ndash WBC ndash Assistance in Plan Development (2010 Clients)
WBC vs Total ED Resources
86 The 2010 results for the top 11 categories are displayed in the figure above Additional results included Hiring plan (5) Purchasing Strategy (4) Production Plan (4) Distribution Plan (3) Training Plan for Staff (3) and International Trade (2)
Impact Study of Entrepreneurial Development 73Resources ndash 2010-2011
Office of Entrepreneurial Development
Sales Job Creation and Job Retention
Figure 78 compares WBC Start-up and In-Business clients in terms of the reported financial impact of WBC assistance on sales profits jobs and the retention of employees irrespective of reasons for seeking assistance87 Start-up and In-Business clients reported that WBC assistance resulted in increased profit margin and increased sales substantially more often than total ED Resource clients For example 39 of Start-up clients and 42 of In-Business clients reported an increase in sales as compared to 34 of total ED Resources
Figure 78 ndash WBC ndash Perceived Impact of Assistance (2010 Clients)
WBC vs Total ED Resources
87 This comparison excludes the Nascent category for total ED Resources and WBC
Impact Study of Entrepreneurial Development 74Resources ndash 2010-2011
Office of Entrepreneurial Development
Figure 78A compares WBCrsquos financial impact of assistance on sales profits jobs and the retention of employees to the financial impact results for total ED Resources presented by hours of counseling received The number of hours of counseling received is divided into two categories for WBC less than 3 hours and 3 or more hours
Clients that received 3 or more hours of counseling reported higher impact in all categories compared to clients who received less than 3 hours of counseling The largest disparity occurred in the retain current staff category where there was a difference of 17 percentage points between clients who received 3 or more hours and those who received less than 3 hours
Figure 78A ndash WBC ndash Perceived Impact of Assistance WBC Hours of Counseling Received for In-Business and Start-ups vs Total ED Resources Aggregate Hours for In-Business and Start-ups (2010 Clients)
Impact Study of Entrepreneurial Development 75Resources ndash 2010-2011
Office of Entrepreneurial Development
[This page is intentionally left blank for two-sided printing]
Impact Study of Entrepreneurial Development 76Resources ndash 2010-2011
Office of Entrepreneurial Development
VIII FOLLOW-UP STUDY RESULTS 2008 amp 2009 CLIENTS In this section Concentrance reports findings from our analysis of follow-up surveys of 2008 and 2009 ED Resource clients88 These follow-up surveys were conducted in order to examine the impact of ED Resource assistance over time This yearrsquos follow-up study of 2008 ED Resource clients represents the second follow-up study of this sample The first follow-up survey of this group was conducted as part of the previous yearrsquos study in 2010 The follow-up study of 2009 ED Resource clients is the first follow-up study of these clients
This analysis addresses the following key research questions
What was the rate of transition of Nascent and Start-up firms to the In-Business segment Based on a comparison with the Panel Study of Entrepreneurial Dynamics II89 (PSED II)
what is the impact of ED Resource assistance on firm survival What was the financial impact of servicesassistance provided by SBA ED Resources in
terms of job creation job retention and sales How does the difference in growth rate of ED Resource clients from 2009 to 2010 compare
with key benchmarks such as the gross domestic product (GDP) the Entrex Private Company Index (PCI) and the Standard and Poorrsquos Small Cap Index90
Follow-up Methodology
There were 6770 respondents to the Initial Economic Impact Survey of 2008 clients Of these Concentrance was able to collect follow-up data from 854 respondents These respondents were re-contacted for the second follow up survey Of these Concentrance was able to collect follow-up data from 200 respondents for which detailed data can be tracked to 2011
There were 8493 respondents to the Initial Impact Survey of 2009 clients Of these Concentrance was able to collect follow-up data from 1968 respondents for which detailed data can be tracked to 2011
2008 Clients Sample Size Response Rate Initial Study 6770 29 1st Follow-up 854 13 2nd Follow-up 200 23 2009 Clients Sample Size Response Rate Initial Study 8493 23 1st Follow-up 1968 23
88 All references to ED Resource clients pertain to ED Resource Partnersrsquo face-to-face counseling clients who received assistance from a designated ED Resource Partner (SBDCSCOREWBC) 89 The Panel Study of Entrepreneurial Dynamics II is a nationwide multi-million dollar survey of nascent entrepreneurs funded by the Kauffman Foundation The primary purpose of the study is to identify adults active in business creation obtain detailed information about the start-up effort and perform follow-up interviews to determine outcomes We rely on the PSED I and PSED II as benchmarks however results must also be interpreted with caution due to potential response bias and definitional differences in the ways that firms are classified 90 The three benchmarks used for comparison of SBA ED Resources are GDP - Source httpwwwbeagovnationalxlsgdpchgxls the Private Company Index (PCI) - published by Entrex this index measures revenue performance in the sector of private companies ranging from $3 million to $60 million in annual revenues (httpwwwprivatecompanyindexcom) and the S amp P SmallCap 600 Index - represents approximately 3 of the US market and includes 600 lsquosmall caprsquo companies with market capitalizations between $300 million and $2 billion The SampP SmallCap 600 Index is a commonly used benchmark for growth
Impact Study of Entrepreneurial Development 77Resources ndash 2010-2011
y
f
Office of Entreprreneurial DDevelopm ment
Changess in Businesss Segmentss from 2009 tto 2011
What is tthe rate of trransition of Nascent annd Start-up firms to thee In-Businesss segment
Figure 811 shows the mmovement oof firms fromm their initial segments to the In-Businness segmentt in 2011 Foor example 557 of 2008 Nascent clients had startted businessees by 2011 FFor 2008 clieents that weree initially in thhe In-Busineess segment 994 remaineed in businesss in 2011 AAdditionally Figure 811 shows the mmovement oof firms fromm their initial 2009 client ssegment to thhe In-Busineess segment iin 2011 Forr example 299 of 2009 NNascent cliennts had transiitioned into tthe In-Businness category bby 2011 By comparisonn according tto a study by Reynolds annd Curtin (20008)91 approximmately 19 of nascent enttrepreneurs inn the PSED II had starteed businessess within two yeears of inceptiion
Figure 81 ndash Traansitions and Survvival of 22008 and 2009 Clieents to 20011 In-Bussiness
91 Paul D Reynolds and RRichard T Curttin (2008) ldquoBu siness Creationn in the United States Panel Sttudy of Entrepreneeurial Dynamicss II Initial Asseessmentrdquo Founddations and Trendds in Entrepreneuurship Vol 4 NNo 3 pgs 155ndashndash307
Impact S tudy of Entrepren neurial Develop pment Resource es ndash 2010-2011 1
78
Office of Entrepreneurial Development
Impact of ED Resource Assistance on Firm Survival
Does ED Resource assistance have a positive impact on firm survival
The PSED II data serve as a benchmark for comparing the proportion of Nascent and Start-up businesses that can now be classified as In-Business firms The PSED II is a sample of nascent entrepreneurs who are in the process of going into business a portion of the sample received some form of counseling or assistance
Figure 82 compares the survival rates for firms in the follow-up study with the PSED II92 These results suggest that businesses that received ED Resource assistance had a higher survival rate than other small businesses such as those randomly sampled for the PSED II For example based on the second follow-up study of 2008 ED Resource clients 93 were still in business after two years In contrast only 80 of PSED II firms remained in business after two years93 Similarly in the follow-up study of 2009 ED Resource clients 96 of these firms remained in business after one year compared to 90 of firms in the PSED II sample
In addition to the PSED II analysis ED Resource client survival rates were higher than reported in other studies For example according to a study published in the Monthly Labor Review two-thirds of new employer firms survive at least two years and about 44 survive at least four94
Figure 82 ndash ED Resource Clients have Higher Survival Rates than PSED II Firms
92Source Parker Simon C (2005) ldquoWhat happens to nascent entrepreneurs An econometric analysis of the PSEDrdquo Entrepreneurship in a Diverse World U S Association for Small Business and Entrepreneurship 93 The PSED II reports the rate of disengagement of start-up firms relative to the time of inception According to Reynolds and Curtin (2008) this period is somewhat arbitrary may not actually capture all start-up activities Thus we report an approximate PSED survival rate based on firms at 1 year and 2 years after inception 94 Survival and Longevity in the Business Employment Dynamics Database Monthly Labor Review May 2005
Impact Study of Entrepreneurial Development 79Resources ndash 2010-2011
Office of Entrepreneurial Development
Does the number of hours of ED Resource assistance have a positive impact on firm survival Figure 83 shows the survival rate of ED Resource clients in each category of counseling hours received for the second follow-up survey of 2008 clients and the first follow-up of 2009 clients In the second follow-up firms receiving 3 or more hours of counseling had a marginally higher survival rate than those that received less than 3 hours of counseling However the relationship between additional counseling hours and survival in the first follow-up sample of 2009 clients is less pronounced
Figure 83 - ED Resource Client Survival by Hours of Counseling
Impact Study of Entrepreneurial Development 80Resources ndash 2010-2011
f
f
Office of Entreprreneurial DDevelopm ment
Changess in Revenuees and Empployees
What is tthe financiaal impact of servicesasssistance proovided by SBA ED Ressources in teerms of job creeation job rretention annd sales
Figure 844 compares 22008 clients iin terms of mmean annual revenues andd number of employees inn the initial andd two subseqquent follow--up studies
Accordinng to this mattched pairs comparison mmean revenuues fell from $413900 in 22008 to $3044200 in 2009 This decline in revenues between 20008 and 2009 iis consistent with the reccessionary conditionns of the econnomy duringg this period However ffor the subseet of firms that survived aand reported revenue dataa mean revennues increaseed to $4677000 in 201095
At the samme time the mean numbber of employyees per firmm decreased frrom 68 to 5 for the first follow-upp year and thhen rose againn to 68 for thhe second foollow-up yearr
Figure 84 - Meaan Revennues and Employmment 20008 Clientts Over TTime
20008 Clients n == 2343 1st Foollow-up n = 2550 2nd Follow--up n = 112
95 Revenue s from Nascentt and unknownn business segmments are not inccluded In adddition Start-up oor In-Business firms with revenuues below $10000 and greater tthan $5 million were excludedd from this analyysis as were firmms with reporteed employees below 1 and abbove 998 The revenue upper bound of $5 mmillion was usedd in order to eli minate bias res sulting from potenntial outliers skeewing the distriibutionrsquos measuures of central ttendency
Impact S tudy of Entrepren neurial Develop pment Resource es ndash 2010-2011 1
81
Office of Entreprreneurial DDevelopm ment
The matcched comparison analysis was repeated for the folllow-up sampple of 2009 cllients Figurre 85 comparess firms in terms of mean annual revennues and nummber of emplloyees in 20009 and in thee first follow-upp survey
Accordinng to this mattched pairs comparison mmean revenuues fell from $414100 in 22009 to $3911400 in 2010 According too a survey off small busineess owners cconducted byy the Nationaal Federationn of Independdent Businessses (NFIB) bbusiness ownners in 2009 reported histtorically low expectationss about groowth and employment annd increasingg concerns abbout inflationn From the low of Jan 22009 optimismm has been coontinuously trending upwward to highs not seen sinnce late 2007 potentially indicativee of a laggingg upturn 96 TThe mean number of empployees per fifirm remainedd essentially flat at just ovver 74
Figure 85 - Meaan Revennues and Employmment 20009 Clientts Over TTime
20099 clients n = 30012 1st Followw-up n = 10144
96Dunkelbeerg William C and Holly Wadde (2009) ldquoNFIIB Small Busineess Economic TTrendsrdquo Marchh httpwwwwnfibcompa gesbet amp httppwwwnfibcoomPortals0PDFsbetsbeet201103pdf
Impact S tudy of Entrepren neurial Develop pment Resource es ndash 2010-2011 1
82
Office of Entreprreneurial DDevelopm ment
The folloowing figures show changges in mean rrevenue and eemployment t for 2009 clieents by ED Resourcee97
Figure 85A Mean SBDCC Revenues and Employmeent 20099 Clients Over TTime
2009 SBBDC Clients n = 1567 1st FFollow-up n = 6637
97 The secoond follow-up ssample of 2008 clients includedd only 200 firmms This samplee is insufficient for a statisticallly meaningfull analysis by inddividual ED Resource
Impact S tudy of Entrepren neurial Develop pment Resource es ndash 2010-2011 1
83
Office of Entreprreneurial DDevelopm ment
Figure 85B Mean SCORRE Revennues and Employmment 20009 Clientts Over TTime
2009 SCCORE Clients nn = 1286 1st FFollow-up n = 323
Impact S tudy of Entrepren neurial Develop pment Resource es ndash 2010-20111
84
Office of Entreprreneurial DDevelopm ment
Figure 85C Mean WBC Revenuees and Emmploymennt 2009 Clients Over TTime
2009 SSCORE Clients n = 159 1st FFollow-up n = 54
Impact S tudy of Entrepren neurial Develop pment Resource es ndash 2010-20111
85
Office of Entreprreneurial DDevelopm ment
Figure 866 provides addditional detaail on the chaange in revennues for 20088 and 2009 cclients For example 53 of 20088 clients havee experiencedd revenue grrowth from 22008 to 2010 Additionallly 65 of 22009 clients realized increased revenuees in 2010 coompared to 335 who expperienced a decline inn revenues
Figure 86 Distrribution oof ED Ressource Clientsrsquo Peercentagee Changee in Revenues98
20009 Clients n = 635 2008 Clieents n = 184
98 Firms wiith revenues bellow $1000 andd greater than $55 million were excluded from this analysis BBecause both 20008 and 2009 fiirms needed to have revenues within these paarameters to es tablish approprriate match critteria needed forr the percent chaange comparisoon the 2008 andd 2009 client coounts will not mmatch those in figures 84 amp 8 85
Impact S tudy of Entrepren neurial Develop pment Resource es ndash 2010-2011 1
86
Office of Entrepreneurial Development
Benchmark Comparisons
Figure 87A and 87B depict firm survival over time as compared to the PSED I and PSED II Figure 87A shows firm survival rates after one year of being in business over a period of six years Figure 87B shows firm survival rates after two years of being in business over a period of five years In both figures the benchmarks for comparison are the PSED I and II which provide data for survival rates of businesses after one and two years of being in business99 ED Resource clients have outpaced the samples from both PSED studies for six consecutive years as shown in the figures below
Figure 87A ndash Firm Survival Rates for ED Resource Clients After One Year (Total ED Resources vs PSED studies)
Figure 87B ndash Firm Survival Rates for ED Resource Clients After Two Years (Total ED Resources vs PSED studies)
99 For years 2007 to 2008 the PSED II with updated data became available and was therefore utilized as the new benchmark PSED I analyzes data collected from nascent entrepreneurs from 1998 - 2000 with three follow-up interviews PSED II analyzes data collected from nascent entrepreneurs from 2005 and 2006 with two follow-up interviews This explains the increased survival rates for the benchmarks on each figure 80 to 90 in 87A and 71 to 80 in 87B
Impact Study of Entrepreneurial Development 87Resources ndash 2010-2011
r
y
Office of Entreprreneurial DDevelopm ment
How doees the growtth of ED Reesource clients compare with key bbenchmarkss of econommic growth
Figure 888 compares tthe differenc e in growth rrate of ED RResource cliennts from 20009 to 2010 too three bennchmarks ndash UUS GDP thhe Private Coompany Indexx (PCI) and the Standardd and Poorrsquos Small Capp Index (SampPP) The GDP growth proovides a conttext of how tthe overall ecconomy is performinng The SampPP represents approximateely 3 of thee US markett and includees 600 lsquosmalll caprsquo companiees with markket capitalizattions betweenn $300 millioon and $2 billlion The PCCI measures revenue pperformance in the sectorr of private ccompanies raanging from $$3 million too $60 million in annual revenues
The diffeerence in growwth rate fromm 2009 to 20010 for SBA EED Resourcce clients wass 134 percenntage points AAlthough all tthree benchmmarks indicatted positive ggrowth durinng this time SSBA ED Resourcee clientsrsquo proggress outpaceed the other benchmarks
Figure 88 ED RResource Client Revenue GGrowth CComparedd to Seleccted Benchmarks - PPercent CChange frrom Prevvious Yeaar100
100 SBA EDD figures are baased on Start-upp or In-Businesss firmsrsquo mean rrevenues from tthe two follow--up surveys conducted in 2010 where clients with revvenue less thann $1000 or greaater than $5 milllion in either year were excludded The revenuue upper boundd of $5 million wwas used in ordder to eliminatee bias resulting ffrom potential outliers skewinng the distributionnrsquos measures off central tendenncy The growthh rates for 20099 and 2010 forr each benchmaark are as followws GDP 20099=-26 2010==29 SampP Smmall Cap 600 2 009=238 20010=251 PCCI 2009=220 2010=298 and SBA ED RResources 2009 =-61 2010==73
Impact S tudy of Entrepren neurial Develop pment Resource es ndash 2010-2011 1
88
Office of Entrepreneurial Development
Summary of Follow-up Study Findings
Firm Survival Approximately 57 of 2008 Nascent clients had transitioned to the In-Business segment after two years while 29 of 2009 Nascent clients had gone into business by the beginning of 2011 At the same time 6 of 2008 of In-Business clients and 3 of 2009 clients went out of business by 2011
In addition in the second follow-up 2008 clients receiving 3 or more hours of counseling had a higher survival rate than those who received less than 3 hours of counseling
Based on a comparison to firms in the PSED II businesses who received ED Resource assistance have a higher survival rate than other small businesses For example the survival rate after two years was 93 for ED Resource clients compared to 80 for firms in the PSED II
Financial Impact and Growth These analyses show that ED Resource assistance has had a significant impact on the revenue and employment growth of small business clients For 2008 clients the recession appears to have had a negative impact on 2009 revenue though revenue increased for these clients in 2010 (2nd follow-up 2008 and 1st follow-up 2009) Surviving 2008 clients in the second follow-up experienced a 54 increase in revenues from 2009 to 2010 Still 47 of 2008 clients experienced some negative growth in revenues since 2008 The difference in growth rates from 2009 to 2010 for SBA ED Resource clients was shown to be 134 percentage points Although all three benchmarks indicated positive growth during this time SBA ED Resource clientsrsquo progress outpaced the other benchmarks Firms in the second 2008 client follow-up sample increased from a mean of 50 employees to a mean of 68 employees Mean employment for firms in the first follow-up of 2009 clients stayed relatively flat with an increase from 73 to 74 employees (See Figures 84 85 86 and 88)
Impact Study of Entrepreneurial Development 89Resources ndash 2010-2011
Office of Entrepreneurial Development
[This page is intentionally left blank for two-sided printing]
Impact Study of Entrepreneurial Development 90Resources ndash 2010-2011
Office of Entrepreneurial Development
IX SUMMARY OF QUANTITATIVE FINDINGS
Initial Impact Study of 2010 Clients
1 What is the demographic financial and business profile of firms who utilize SBA ED Resources
Firms that have been in business for more than one year comprise the In-Business client segment Fifty-four percent of ED Resource clients were in the In-Business category Nascent clients represented 26 of ED Resource clients while the smallest segment Start-up clients represented 19101
The average revenue for firms served by ED Resources is $637200 with four employees Firm size varies by ED Resource For example SBDC clients have higher average revenues at $774000 than SCORE clients at $502000 WBC clientsrsquo revenues are lowest with average revenues of $171300 These revenue figures are lower than client groups studied in 2009
ED Resource clients represented a variety of demographic groups Thirty-six percent of clients were Male 36 Female and 17 of firms had Male and Female owners Sixty-eight percent were White 11 BlackAfrican American 7 HispanicLatino 4 Asian and 2 American IndianNative Alaskan Nine percent of ED Resource clients were Veteran and 2 were Service-disabled Veteran The largest age group served by ED Resources accounting for 28 of the total sample included clients between 45 and 54 years of age
ED Resource clients served during 2010 represented a wide variety of business types The most common industries included service retail and manufacturing businesses
ED Resources assisted clients in developing plans and strategies in order to start or better manage their businesses The most frequently reported type of assistance was business plans (35) followed by marketing plans (30) and financial strategy (19)
For 2010 clients the lowfree cost of service was the most commonly reported reason for seeking business counseling from ED Resources at 51 The least commonly reported reason for seeking business counseling from ED Resources was clients having tried other alternatives but were dissatisfied at 9 SCORE clients reported the reputation of SCORE as a reason they sought assistance (55) more often than the lowfree cost of service (52)
101 Respondents (86) who reported being in business but who did not provide a valid start date for that business were not assigned to a business segment
Impact Study of Entrepreneurial Development 91Resources ndash 2010-2011
Office of Entrepreneurial Development
Firms who received less than 3 hours of assistance reported lower levels of perceived usefulness than firms with 3 or more hours of counseling Also firms in the In-Business segment reported significantly higher perceived usefulness from their ED Resources counseling
American IndianAlaskan Native and White firms both reported higher perceived usefulness but there were no other differences based on race There were also no significant effects of clientrsquos age gender veteran status or ethnicity on perceived usefulness of assistance
Unlike some previous years results of this yearsrsquo regression suggest that there were no significant differences in financial impacts of ED Resource assistance based on any factor including ED resource business segment hours of counseling received or geographic location
Impact study data was used to examine four ED Resource client perceptions of impact Findings for each of these impacts are described below
2 Is there a relationship between the servicesassistance provided by ED Resources and the clientrsquos perception of the usefulness and value of the servicesassistance received
In general ED Resource clients perceived information and assistance provided by ED Resource counselors to be valuable Approximately 73 of ED Resource clients overall reported that assistance they received had high value in terms of usefulness This rating was 74 for SBDC 73 for SCORE and 72 for WBC
Seventy-six percent of clients who received 3 or more hours of counseling rated usefulness as ldquohighrdquo whereas 69 of those who received less than 3 hours of counseling did likewise Regression analysis also indicated that clients who received less than 3 hours of counseling reported lower levels of perceived usefulness than clients who received 3 or more hours of counseling
3 Is there a relationship between the servicesassistance provided by ED Resources and the client perceptions of assistance with the decision to start a business
As in the previous yearrsquos study regression results suggest larger firm firms in the In-Business segment and SCORE clients were less likely to report that their decision to start a business was the result of ED Resource assistance
There were no significant differences based on hours of counseling received or client demographic characteristics in regard to perceived assistance with the decision to start a business
Impact Study of Entrepreneurial Development 92Resources ndash 2010-2011
Office of Entrepreneurial Development
4 Is there a positive relationship between the servicesassistance provided by ED Resources and the clientrsquos decision to implement andor change management andor marketing practices in their business
As a result of ED Resource assistance 62 of 2010 In-Business clients and 57 of Start-up clients changed management practices or strategies Clients used ED Resources most widely in developing business plans marketing plans financial strategies and general management
5 Is there a positive relationship between the servicesassistance provided by ED Resources and financial impacts including job creation and retention and increases in sales
Thirty-four percent of Start-up and In-Business clients reported that assistance provided by ED Resources resulted in increased sales In terms of jobs 15 of Start-up and In-Business clients reported that ED Resource assistance led to the hiring of new staff and 20 reported that ED Resources assisted them in retaining current staff The perceived impact of ED Resource assistance on increasing profit margin was 30 a decrease two percentage points from the previous year
For the following financial categories sales profits retaining current staff and hiring of employees ED Resource clients who received 3 or more hours of assistance reported higher financial impacts than firms who received less than 3 hours of assistance This finding was not supported by a regression analysis which examined sales profits cash flow and the hiring of new staff
Increase in sales was the financial category that showed the most prominent correlation with hours of counseling received more than profit margin hiring of new staff or retention of staff Clients that received 3 or more hours of counseling reported increasing their sales 30 of the time whereas clients that received less than 3 hours of counseling increased their sales 19 of the time
Follow-up Study of 2008 and 2009 ED Resource Clients
6 How do the results of this survey compare with the Panel Survey of Entrepreneurial Dynamics (PSED) study
Based on the first follow-up study of 2008 ED Resource clients 95 were still in business while 90 of firms in the PSED II sample remained in business after one year For 2009 ED Resource clients 96 were still in business after one year In addition for the second follow-up study for 2008 clients 93 of ED Resource clients remained in business compared to 80 for those in the PSED II sample
Impact Study of Entrepreneurial Development 93Resources ndash 2010-2011
Office of Entrepreneurial Development
7 Was the financial impact (job creation job retention and sales) on the clients who were provided servicesassistance by SBA ED Resources (SBDC SCORE and WBC) since 2008 greater than or equal to a representative small business population
The follow-up analyses show that ED Resource assistance has had a substantial impact on the revenue and employment growth of small business clients For 2008 clients the recession appears to have had a negative impact on 2009 revenue though revenue increased for these clients in 2010 Surviving 2008 clients in the second follow-up experienced a 54 increase in revenues from 2009 to 2010 Still 47 of 2008 clients experienced some negative growth in revenues since 2008 The difference in growth rates from 2009 to 2010 for SBA ED Resource clients was shown to be 134 percentage points Although all three benchmarks indicated positive growth during this time SBA ED Resource clientsrsquo progress outpaced the other benchmarks Firms in the 2nd 2008 client follow-up sample increased from a mean of 5 employees to a mean 68 employees Mean employment for firms in the first follow-up of 2009 clients stayed relatively flat with an increase from 73 employees to 74 employees (See Figures 84 85 86 and 88)
Impact Study of Entrepreneurial Development 94Resources ndash 2010-2011
Office of Entrepreneurial Development
X SUMMARY OF QUALITATIVE FINDINGS
In addition to completing the survey multiple ED Resource clients provided additional commentary through their responses to survey invitation e-mails Through these communications clients expressed both positive and negative thoughts and feelings about their experiences with ED Resources This section reviews a selection of these comments
Among the positive comments received clients communicated several themes SBA counselors were professional and genuinely interested in providing help to the client Information provided to the clients by SBDC SCORE and WBC was particularly helpful to
their businessesrsquo development Counselors were willing to take the time to have in-depth discussions about business ideas
and offered many helpful suggestions
A very thankful survey respondent wrote at length about the concerted effort that her counselor put into building a relationship and aiding her business The following is an excerpt from her letter
ldquoI truly appreciated having the opportunity to meet and work with [counselor name] He is a great listener director and mentor His guidance is sound And he has a wonderfully open personality that allows people to feel that they can rely on [him] With his outstanding follow-through [counselor name] never disappointed me in any of my business questions and requestsrdquo
Another ED Resource client took the time to commend his counselor responding very positively to the effect the counselor had on his business
ldquoI just wanted to inform you that [counselor name] was one of the best things that ever happened to my company She displayed exemplary professionalism and helped us out tremendouslyrdquo
One respondent although she was unable to secure credit for her business considered ED Resource assistance to be a valuable learning experience
ldquoI would like to let you know that [ED Resources] helped me a lot and I learned so much from the services they provided me for my businessrdquo
The head of a private educational institution highlighted the flexibility of ED Resources She felt that the counselors served as motivators as well as sources of information
ldquoThe [ED Resources counselors] helped us to identify our issues facilitated discussions about options and helped with the energy and direction to move forward to study those optionshellip [ED Resources] has been a huge help to usrdquo
Impact Study of Entrepreneurial Development 95Resources ndash 2010-2011
Office of Entrepreneurial Development
There was also negative feedback provided by survey respondents regarding their experiences with ED Resources Among the negative comments the most common related to the following
Dissatisfaction with the conduct of their counselors on account of their lack of professionalism or disinterest in helping the client
Finding the information they received financial and otherwise to be less than useful or not applicable to their industry
The unavailability or unresponsiveness of ED Resource counselors in regard to calls or emails placed for inquiries or requests
Some ED Resource clients had difficulty establishing communication lines with their counselors One respondent wrote about his negative experience trying to reach his ED Resource counselor Ultimately the client did not receive any assistance
ldquoA person was chosen for me who was currently unavailable for months as he was not even in the area at the time (even though he lived here)hellip Months later he sent me an email saying he was ready to assist mehellipwe could meet and discuss my problems Problem was I was currently working out of the area supporting my clientrsquos contract I guess that was unsatisfactory for himhellipI never heard from him againrdquo
Several ED Resource clients complained about the outdated nature of the advice they received at times referencing current adverse economic conditions One respondent wrote
ldquoThe counselors didnt have a clue how to help me I was looking for a solid marketing plan Sorry but these guys are dinosaurs Didnt seem to be up on current trends in businesshelliprdquo
After making attempts to receive assistance at multiple ED Resource locations one ED Resource client wrote about her dissatisfaction with the limited knowledge and lack of professionalism of the counselors she met with
ldquoThe gentleman the office set me up with for first meeting did not have any experience in graphic design or what I was mainly interested in obtaining web based businessclients I then made another appointment for their downtown [location] office with two men who I was told knew my fieldhellip The meeting was disastrous One man told me that I should just go door to door to find local clients and to not utilize the Internet at allhelliprdquo
One respondent who sought capital assistance from ED Resources was frustrated at the lack of effort put in by her counselors in spite of her high level of preparedness Ultimately the client was left questioning whether ED Resources volunteers had any genuine interest in helping her business
ldquoI visited with [ED Resources] volunteers twice I found them to be distant and unenthusiastic for the most part I presented a full marketing plan right down to the last detail in a comprehensive binder that I spent two years preparingrdquo
Impact Study of Entrepreneurial Development 96Resources ndash 2010-2011
Office of Entrepreneurial Development
XI RECOMMEDATIONS FOR FURTHER RESEARCH
Measuring the effects of ED Resources on business operations as well as financial and economic outcomes requires longitudinal data that track respondents over time
Further research with this dataset could afford comparison of the effects of different kinds of ED Resource assistance and services on financial and economic outcomes for clients
On the basis of our findings Concentrance offers the following recommendation for further research
An additional study could examine the effects of different types of financing (eg SBA Guarantee Loan vs SBA Disaster Loan) on perceived improvements survival and business growth
Impact Study of Entrepreneurial Development 97Resources ndash 2010-2011
Office of Entrepreneurial Development
[This page is intentionally left blank for two-sided printing]
Impact Study of Entrepreneurial Development 98Resources ndash 2010-2011
Office of Entrepreneurial Development
XII APPENDICES
Impact Study of Entrepreneurial Development 99Resources ndash 2010-2011
Office of Entrepreneurial Development
[This page is intentionally left blank for two-sided printing]
Impact Study of Entrepreneurial Development 100Resources ndash 2010-2011
Office of Entrepreneurial Development
Appendix 1 ndash Survey Response Values by Research Topic
Impact Study of Entrepreneurial Development 101Resources ndash 2010-2011
RESEARCH TOPIC RESEARCH TOPIC SURVEY QUESTIONS SURVEY QUESTIONS RESPONSE CODEDATABASE RESPONSE CODEDATABASE
VALUES VALUES
Demographic Characteristics 7 At the time you were assisted by [SBDC SCORE WBC] what was the approximate annual gross revenue for each of the
Open ended between $1000 and $25000000
calendar years below 2009 ______ 2010 ______
8 Counting yourself how many fill-time employees and part-time employees did you employ at the end of the
following years you were in business
Open ended
2009 FullPart ______ 2010 FullPart ______
10 If you are in business what is the primary type of
business Construction Manufacturing Consulting Wholesale Finance Ins and Real
Estate Entertainment Retail Restaurant Engineering Publishing Education
Construction=1 or 0 Manufacturing=1 or 0 Consulting =1 or 0 Wholesale =1 or 0
Finance Ins And Real Estate =1 or 0 Entertainment =1 or 0 Retail =1 or 0 Restaurant =1 or 0 Engineering =1 or 0 Publishing =1 or 0 Education =1 or 0 Service =1 or 0 Health Care =1 or 0 Day Care =1 or 0 Transportation =1 or 0 Technology =1 or 0 Health Wellness or Fitness Yes=1 No= 0 Other = open ended No response
=N
Service Health Care Day Care Transportation Technology Health Wellness andor
Fitness Other
11 Indicate the geographic location of your primary
business
Urban Suburban Rural
Office of Entrepreneurial Development
RERESEARCH TOPIC SEARCH TOPIC SURVEY QUESTIONS SURVEY QUESTIONS SURVEY QUESTIONS RESPONSE CODEDATABASE RESPONSE CODEDATABASE
VALUES VALUES 12 What lead to your decision
to seek business counseling Tried other alternatives Reputation of
SBDCSCOREWBC Lowfree cost of service Referred by
16 Gender Male=1 Female=2 Male and Female Owners=3 No response = N
17 Veteran Status Veteran=1 Service-disabled Veteran=2 Reservist=3 National Guard Member=4 Non-veteran=5 No response= N
18 Age 18-24= 1 25-34 = 2 35-44 = 3 45-54 = 4 55-64 = 5 65-74 = 6 75+ = 7 No response = N
19 Are you Hispanic or Latino Not HispanicLatino Origin
Hispanic or Latino=1 Not of HispanicLatino Origin=0 No response = N
20 Are you American IndianAlaskan Native Asian BlackAfrican American Native HawaiianPacific Islander White
American Indian or Alaskan =1 or 0 Asian =1 or 0 Black or African American =1 or 0 Native Hawaiian or Pacific Islander =1or 0 White =1 or 0 No response = N
Is there a positive relationship between the servicesassistance provided by SBA ED Resources and the clientrsquos perceptions of the usefulness and value of the servicesassistance received
6 Pleas indicate how useful the services were that you received from the counselor who assisted you in identifying and correcting problems in operating your business Relevancy of Counseling Timeliness of Counseling Helpfulness of Counseling
13 Please indicate the value of the information you received from the [WBC SCORE SBDC] counselor you visited
1 Usefulness of information 2 Relevancy of the
information 3 Timeliness of the
information
Extremely Valuable=5 Valuable=4 No Opinion=3 Somewhat Valuable=2 Not Valuable=1 No response = N
15 I would refer the counseling services I reto other small business
ceived es
Strongly Agree=5 Agree=4 No Opinion=3 Disagree=2 Strongly Disagree=1 other=open ended No response = N
Impact Study of Entrepreneurial Development 102Resources ndash 2010-2011
RESEARCH TOPIC RESEARCH TOPIC SURVEY QUESTIONS SURVEY QUESTIONS RESPONSE CODEDATABASE RESPONSE CODEDATABASE
VALUES VALUES
Is there a positive relationship between the servicesassistance provided by SBA ED Resources and
the clientrsquos perceived quality of the counseling
experience
14 Please indicate the counselorrsquos effectiveness in
assisting you 1 The counselor exhibited excellent customer service
techniques 2 The counselor was able
to assist me 3 The counselor exhibited a high level of professionalism
4 The counselor was knowledgeable of current
management practices and issues
5 The counselor identified with my needs
6 I would rate my overall experience with the counselor as excellent
Strongly Agree=5 Agree=4 No Opinion=3 Disagree=2 Strongly Disagree=1 other=open ended No response = N
Is there a positive relationship between the servicesassistance provided by SBA ED Resources and the clientrsquos decision to start a
business
2 If you were not in business at the time you were assisted by the counselor did you decide to go into business as a
result of that assistance
Yes = 1 No=0 No Response = N
Is there a positive relationship between the servicesassistance provided by SBA ED Resources and clientsrsquo decisions to implement andor change management andor marketing practices in their
business
3 As a result of the assistance you received have you changed any of your current
management practices
Yes=1 No=0 No response = N
Office of Entrepreneurial Development
Impact Study of Entrepreneurial Development 103Resources ndash 2010-2011
RESEARCH TOPIC RESEARCH TOPIC SURVEY QUESTIONS SURVEY QUESTIONS RESPONSE CODEDATABASE RESPONSE CODEDATABASE
VALUES VALUES
4 As a result of the assistance I received from the [WBC SCORE SBDC] counselor I was able to develop [ie Business Plan] in order to start or better manage my business [Check all that apply]
Business Plan Marketing Plan Promotional Plan Pricing Strategy Cash Flow Analysis General Management Loan Package Hiring Plan Training Plan for Staff Financial Strategy Web-based Strategy Purchasing Strategy Feasibility Plan Production Plan Distribution Plan International Trade Other
If checked = 1 Not checked = 0 Other =open ended No response = N
Is there a positive relationship between the servicesassistance provided by SBA ED Resources and the clientsrsquo businesses having a positive financial impact on job creation and
retention and increase in sales
5 Please indicate the impact these changes have had on
your firm 1 Increase my sales 2 Improve my cash flow 3 Acquire a bank loan 4 Expand my products
services 5 Hire new staff 6 Revise my marketing
strategy 7 Increase my profit margin 8 Retain current staff 9 Acquire a SBA guarantee
loan 10 Acquire a government
contract 11 Acquire a SBA Disaster
loan 12 Other
Strongly Agree=5 Agree=4 No Opinion=3 Disagree=2 Strongly Disagree=1 other=open ended No response = N
9 If you were projecting to reduce your total number of
employees prior to counseling by SBDCSCOREWBC how many positions have you
retained due to the counseling Full time _____ Part time _____
Open Ended
Office of Entrepreneurial Development
Impact Study of Entrepreneurial Development 104Resources ndash 2010-2011
RESEARCH TOPIC RESEARCH TOPIC SURVEY QUESTIONS SURVEY QUESTIONS RESPONSE CODEDATABASE RESPONSE CODEDATABASE
VALUES VALUES
General Business 1i Are you currently in business
Yes=1 No=0 No response = N
1ii If yes when was the business started
mmyyyy
1iii What is the zip code of your business
Xxxxx
1a If NO when do you plan on starting a business
Within 30 days=1 31-90 days=2 91-120 days=3 No idea at this time=4 No response = N
1b Have you ever been in business
Yes=1 No=0 No response = N
1bi If YES when was the business started
mmyyyy
21i Did you utilize any other SBA resourcesprogram
Yes=1 No=0 No response = N
21ii If YES select those you used [Check all that apply]
SBDC SCORE WBC SBArsquos Guarantee Loan Programs
SBIC Venture Capital Program
Government contracting SBArsquos Surety Bond Program Small Business Training
Network (Online Training)
Disaster Assistance
SCORE =1 or 0 SBDC =1 or 0 Women Business Center =1 or 0
SBArsquos Guarantee Loan Programs =1 or 0 SBIC Financing Program
=1 or 0 SBArsquos Surety Bond Program =1 or 0 No response = N
Office of Entrepreneurial Development
Impact Study of Entrepreneurial Development 105Resources ndash 2010-2011
Office of Entrepreneurial Development
[This page is intentionally left blank for two-sided printing]
Impact Study of Entrepreneurial Development 106Resources ndash 2010-2011
Office of Entrepreneurial Development
Appendix 2 ndash Quantified Survey Results ndash Initial Survey 2010 Clients
Impact Study of Entrepreneurial Development 107Resources ndash 2010-2011
Surveys Questions Percentage of Sample Q1) Are you currently in business
Yes 7476 No 2524Missing 000
Q1a) If no when do you plan on starting a business
Within 30 days 127 31-90 days 362 91-120 days 451 No idea at this time 1542 Missing 7517
Q1b) Have you ever been in business
Yes 918 No 1605 Missing 7478
Q2) If you were not in business at the time you were assisted by the
counselor did you decide to go into business as a result of that
assistance Yes 1605 No 2817Not Applicable (already in
business) 5542
Missing 036 Q3) As a result of the assistance
you received have you changed any of your current management
practicesstrategies
Yes 4486
No 2931 Missing 2583
Q4) As a result of the assistance I received from the counselor I was
able to develop [ie Business Plan] in order to start or better manage my business
Business Plan 3498 Loan Package 829 Purchasing Strategy 407 Marketing Plan 2982 Hiring Plan 482 Feasibility Plan 789 Promotional Plan 1284 Training Plan for Staff 369 Production Plan 406 Pricing Strategy 1439 Financial Strategy 1869 Distribution Plan 330 Cash Flow Analysis 1693 Web-based Strategy 1036 International Trade 147
StGeneral Management
rategy 1779 Other 835
Q5) Please indicate the impact of these changes have had on your firm Strongly Agree=SA Agree=A No Opinion-No Disagree=D Strongly Disagree=SD]
SA A NO D SD Missing
I was able to Increase my sales 725 1803 2870 636 449 3517 Improve my cash flow 682 1816 2827 674 445 3555 Acquire a bank loan 489 518 3631 974 649 3739 Expand my productsservices 666 1702 2808 756 468 3599 Hire new staff 323 817 3664 911 515 377 Revise my marketing strategy 1218 2726 1728 531 392 3404 Increase my profit margin 555 1605 2941 759 471 3669 Retain current staff 337 1177 3628 582 466 3809 Acquire a SBA guarantee loan 313 286 3791 1052 735 3823 Acquire a government contract 127 232 4015 1071 700 3855 Acquire a SBA Disaster loan 030 062 4206 1088 695 3920 Other 559 195 1314 075 241 7616
Office of Entrepreneurial Development
Impact Study of Entrepreneurial Development 108Resources ndash 2010-2011
Q6) Please indicate how useful the services were that you received
from the counselor who assisted you in identifying and correcting problems in operating your business [Very Useful=VU Useful=U No Opinion-NO Somewhat Useful =SU Not Useful =NU]
VU U NO SU NU Missing
Relevancy of Counseling 3720 2023 318 541 525 2872Timeliness of Counseling 3647 2088 505 393 473 2895Helpfulness of Counseling 3855 1960 297 463 540 2885Q7) At the time you were assisted by [SBDCSCOREWBC] what was the approximate annual gross revenue for each of the calendar years below
2009 Revenue given 3205 Missing 6795
2010 Revenue given 3366 Missing 6633
Q8) Counting yourself how many full-time employees and part-time employees did you employ at the end of the following years you were in business
2010 Full-time jobs Average = 27 2009 Full-time jobs Average = 38 2010 Part-time jobs Average = 17 2009 Part-time jobs Average = 28
Q9) At the time you were assisted by [SBDCSCOREWBC] what was the approximate annual gross revenue for each of the calendar years below
Existing Full-time jobs saved Total Full-time Jobs Saved ndash 3768
Existing Part-time jobs saved Total Part-time Jobs Saved ndash 3203
Firms that saved jobs 3746
Office of Entrepreneurial Development
Impact Study of Entrepreneurial Development 109Resources ndash 2010-2011
Q10) If you are in business what is the primary type of business (This question includes multiple responses)
Construction 352 Manufacturing 539 Consulting 522 Wholesale 256 Finance Insurance Real
Estate
188 Entertainment 116 Retail 723
and Drinking Restaurant andor Eating
266 Engineering 095 Publishing 075 Education 181 Service 923 Health Care 216 Day Care 065 Transportation 086 Technology 302
Fi Health Wellness andor
tness 261
Other 1433
Missing 3400 Q11) Indicate the geographic
location of your primary business
Rural 1454 Suburban 2688 Urban 2369 Missing 3489
Q12) What led to your decision to seek business counseling from [SBDCSCOREWBC]
Tried other alternatives but was dissatisfied 821
Reputation of [SBDCSCOREWBC] 4392 Lowfree cost of service 4578
Referred by _____ 3819
Office of Entrepreneurial Development
Impact Study of Entrepreneurial Development 110Resources ndash 2010-2011
Office of Entrepreneurial Development
Q13) Please indicate the value of the information [Extremely Valuable=EV Valuable=V No Opinion=NO Somewhat Valuable=SV Not Valuable=NV]
EV V NO SV NV Missing
Usefulness of Information 4278 3067 318 772 585 980 Relevancy of the Information 4148 3127 393 739 576 1016 Timeliness of the Information 4008 3118 599 636 564 1074 Q14) Please indicate the counselors effectiveness in assisting you [Strongly Agree=SA Agree=A No Opinion-No Disagree=D Strongly Disagree=SD]
SA A NO D SD Missing
The counselor exhibited excellent customer service techniques 5003 2923 498 233 243 1100 The counselor was able to assist me 4397 3081 608 423 397 1094 The counselor exhibited a high level of professionalism 5383 2767 404 148 201 1097 The counselor was knowledgeable of current management practices and issues 4707 2925 784 233 252 1099 The counselor identified with my needs 4426 3039 677 386 374 1098 I would rate my overall experience with the counselor as excellent 4803 2632 631 439 385 1111 Q15) I would refer the counseling services I received to other small businesses [Strongly Disagree=SA Agree=A No Opinion=NO Disagree=D Strongly Disagree=SD]
SA A NO D SD Missing
4847 1515 450 983 1142 1062 Q16) Gender
Male 3560 Female 3576 Both male and female 1698 Missing 1166
Q17) Veteran Status Veteran 858 Service-disabled Veteran 207 Reservist 032 National Guard Member 035 Non-veteran 7524 Missing 1343
Impact Study of Entrepreneurial Development 111Resources ndash 2010-2011
Q18) Age 18-24 169 25-34 1280 35-44 2157 45-54 2752 55-64 2047 65-74 409
75 + 070 Missing 1117
Q19) Are you HispanicLatino 661 Non-HispanicLatino 9339 Missing 0
Q20) Are you American Indian or
Alaskan Native 174 Asian 351 Black or African American 1135Native Hawaiian or Pacific
Islander 053 White 6838Missing 1634
Q21) Did you utilize any other SBA resourcesprogram
Yes 2510 No 5412 Missing 2078
Q21 cont) If yes select those you used
SCORE 792 SBArsquos Guarantee Loan
Program 657 Women Business Center 382 SBIC Venture Capital
Program
041 Government Contracting 322 SBDC 396 SBArsquos Surety Bond
Program
025 Small Business Training
Network (Online Assistance) 627 Disaster Assistance 033 Missing 2885
Office of Entrepreneurial Development
Impact Study of Entrepreneurial Development 112Resources ndash 2010-2011
Office of Entrepreneurial Development
Appendix 3 ndash Quantified Survey Results ndash Follow-up Survey 2010 Clients
2008 2nd Follow Up Results Data
Impact Study of Entrepreneurial Development 113Resources ndash 2010-2011
Surveys Questions Percentage of Sample Q1) Are you currently in business
Yes 8650 No 1350Missing 000
Q2) If no when do you plan on starting a business
Within 30 days 050 31-90 days 000 91-120 days 000 No idea at this time 1300 Missing 8650 Q3) Have you ever been in
business
Yes 950 No 400 Missing 8650
Q4) As a result of the assistance received from the
[SBDCWBCSCORE] Counselor which of the following were you able to develop [ie Business Plan] in order to start or better manage your business [Check all
that apply]
Business Plan 4500 Loan Package 4400Purchasing Strategy 2000 Marketing Plan 1700 Hiring Plan 2450Feasibility Plan 2700 Promotional Plan 1150 Training Plan for Staff 850
Production Plan 400 Pricing Strategy 2050Financial Strategy 1600 Distribution Plan 450
Cash Flow Analysis 1550 Web-based Strategy 950
International Trade 500 General Management 250 Other 1400
Surveys Questions Percentage of Sample
Q5) What was the approximate annual gross revenue of your
business in 2010
Reported 6950 Missing 3050
Q6) Currently how many people (full and part time) including yourself does your business employ
Average Full-Time 55 employees Average Part-Time 18 employees
Q7) Have you utilized any other SBA resourcesprogram
Yes 2200 No 7600 Missing 200
Q8) If YES select those you used [check all that apply]
SCORE 600 SBArsquos Loan Guarantee Programs 150 SBDC 050
SBIC Venture Capital
Program
100 Woman Business Center 550 Government Contracting 000
SBArsquos Surety Bond
Program
100
Small Business Training Network (online training) 300
2009 1st Follow Up Results Data Surveys Questions Percentage of Sample
Q1) Are you currently in business Yes 8298 No 1702 Missing 000
Q2) If no when do you plan on starting a business
Within 30 days 097 31-90 days 152 91-120 days 203 No idea at this time 1225 Missing 8323
Office of Entrepreneurial Development
Impact Study of Entrepreneurial Development 114Resources ndash 2010-2011
Q3) Have you ever been in business
Yes 874 No 813 Missing 8313
Q4) As a result of the assistance received from the [SBDCWBCSCORE] Counselor which of the following were you able to develop [ie Business Plan] in order to start or better manage your business [Check all that apply]
Business Plan 4761 Loan Package 1250 Purchasing Strategy 386 Marketing Plan 3283 Hiring Plan 493 Feasibility Plan 1133 Promotional Plan 1418
Production Plan 371 Pricing Strategy 1499 Financial Strategy 2190 Distribution Plan 234 Cash Flow Analysis 2236 Web-based Strategy 884 International Trade 168 General Management 2266 Other 1758
Q5) What was the approximate annual gross revenue of your business in 2010
Reported 6850 Missing 3150
Q6) Currently how many people (full and part time) including yourself does your business employ
Average Full-Time 49 employees Average Part-Time 34 employees
Q7) Have you utilized any other SBA resourcesprogram
Yes 2602 No 6565 Missing 833
Training Plan for Staff
Surveys Questions Percentage of Sample
300
Office of Entrepreneurial Development
Impact Study of Entrepreneurial Development 115Resources ndash 2010-2011
Surveys Questions Percentage of Sample
Q8) If YES select those you used [check all that apply]
SCORE 986 SBArsquos Loan Guarantee
Programs 655 SBDC 412 SBIC Venture Capital
Program 025 Woman Business Center 310 Government Contracting 381 SBArsquos Surety Bond
Program 020 Small Business Training
Network (online training) 503
Office of Entrepreneurial Development
Impact Study of Entrepreneurial Development 116Resources ndash 2010-2011
Office of Entrepreneurial Development
Appendix 4 ndash Initial Study Survey Instrument
US Small Business Administration Office of Entrepreneurial Development
Initial Economic Impact Survey OMB Number 3245‐0351 Expiration 03312013
Dear Small Business Client
Thank you for your recent visit to [the Small Business Development Center (SBDC) SCORE the Womenrsquos Business Center (WBC)] one of SBArsquos Entrepreneurial Development (ED) Resource Partners We hope you found the business assistance you sought The SBA is always striving to better its programs and deliver relevant and meaningful assistance We want to know if our programs and services are helping the economy by providing useful information on starting and managing a business and eventually helping your business create jobs increasing your businessrsquo revenues and in general fueling the entrepreneurial spirit in America
We would appreciate you taking a few minutes to answer some brief questions that will help us know the quality and impact of the programs All responses to these questions are voluntary and will be held in confidence The data will not be released to any other government agency or private firm Please answer the following questions based on your visit to [the Small Business Development Center (SBDC) SCORE the Womenrsquos Business Center (WBC)]
1 Are you currently in business Yes No If YES when was the business started _ __ _ _ _
mm yyyy What is the zip code of your business location __ __ __ __ __
If Yes to Question 1 skip to Question 2 If No continue to 1a
1a If NO (to Question 1) when do you plan on starting a business Within 30 days 31‐90 days 91‐120 days No idea at this time
1b If NO (to Question 1) have you ever been in business Yes No If YES when was the business started _ _ _ _ _ _
mmyyyy
2 If you were not in business at the time you were assisted by the counselor did you decide to go into business as a result of that assistance
Yes No Not applicable (already in business)
Impact Study of Entrepreneurial Development 117Resources ndash 2010-2011
Office of Entrepreneurial Development
If you answered NO to Question 1 please skip ahead to Question 12
3 As a result of the assistance you received have you changed any of your current management practicesstrategies Yes No
4 As a result of the assistance I received from the [SBDC SCORE WBC] Counselor I was able to develop one or more of the following (ie Business Plan) in order to better manage my business [Check all that apply]
Business Plan Loan Package Purchasing Strategy Marketing Plan Hiring Plan Feasibility Plan Promotional Plan Training Plan for Staff Production Plan Pricing Strategy Financial Strategy Distribution Plan Cash Flow Analysis Web Based Strategy International Trade General Management Other ________________________
5 Please indicate the impact your counseling experience had on your firm [Strongly Agree=SA Agree=A No Opinion=NO Disagree=D Strongly Disagree=SD]
SA A NO D SD I was able to 1 Increase my sales 5 4 3 2 1 2 Improve my cash flow 5 4 3 2 1 3 Acquire a bank loan 5 4 3 2 1 4 Expand my productsservices 5 4 3 2 1 5 Hire new staff 5 4 3 2 1 6 Revise my marketing strategy 5 4 3 2 1 7 Increase my profit margin 5 4 3 2 1 8 Retain current staff 5 4 3 2 1 9 Acquire a SBA guarantee loan 5 4 3 2 1 10 Acquire a government contract 5 4 3 2 1 11 Acquire a SBA Disaster loan 5 4 3 2 1 12 Other (specify ____________________) 5 4 3 2 1
6 Please indicate how useful the services were that you received from the counselor who assisted you in identifying and correcting problems in operating your business
Impact Study of Entrepreneurial Development 118Resources ndash 2010-2011
Very No Somewhat Not Useful Useful Opinion Useful Useful
1 Relevancy of Counseling 5 4 3 2 1 2 Timeliness of Counseling 5 4 3 2 1 3 Helpfulness of Counseling 5 4 3 2 1
Office of Entrepreneurial Development
7 At the time you were assisted by [the Small Business Development Center (SBDC) SCORE the Womenrsquos Business Center (WBC)] what was the approximate annual gross revenue for each of the calendar years below [All data will be held in strict confidence and reported only in the aggregate without identifying any individual small business] Enter dollar figures only Do not include commas or currency symbols
2009 __________________________ 2010 __________________________
8 Counting yourself how many full‐time employees (35 hours or more per week) and part‐time employees (less than 35 hours per week) did you employ at the end of the following years you were in business
2009 _______________ Number of Full‐time employees 2010 _______________ Number of Full‐time employees
2009 _______________ Number of Part‐time employees 2010 _______________ Number of Part‐time employees
9 If you were projecting to reduce your total number of employees prior to receiving counseling from [SBDC SCORE WBC] how many positions have you retained due to the counseling
Existing Full‐time jobs saved ___________ Existing Part‐time jobs saved ___________
10 What is your firmrsquos primary type of business [Please choose only one]
Construction Manufacturing Consulting Wholesale Finance Insurance and Real Estate Entertainment Retail Restaurant andor Eating and Drinking Engineering Publishing Education Service Health Care Day Care Transportation Technology Health Wellness andor Fitness Other (describe) _______________________
11 Indicate the geographic location of your primary business Rural Suburban Urban
12 What led to your decision to seek business counseling from [SBDC SCORE WBC] [Check all that apply]
Tried other alternatives and was dissatisfied Reputation of [SBDC SCORE WBC] Lowfree cost of service Referred by __________________________________
(Fill in blank or add options such as SBA office of ______ )
Other _______________________________________ (Fill in the blank)
Impact Study of Entrepreneurial Development Resources ndash 2010-2011
119
Office of Entrepreneurial Development
13 Please indicate the value of the information you received from the counselor you visited
Extremely No Somewhat Not Valuable Valuable Opinion Valuable Valuable
1 Usefulness of Information 5 4 3 2 1 2 Relevancy of Information 5 4 3 2 1 3 Timeliness of Information 5 4 3 2 1
14 Please indicate the counselorrsquos effectiveness in assisting you [Strongly Agree=SA Agree=A No Opinion=NO Disagree=D Strongly Disagree=SD]
SA A NO D SD 1 The counselor exhibited excellent
customer service techniques 5 4 3 2 1 2 The counselor was able to assist me 5 4 3 2 1 3 The counselor exhibited a high level of
professionalism 5 4 3 2 1 4 The counselor was knowledgeable of current
management practices and issues 5 4 3 2 1 5 The counselor identified with my needs 5 4 3 2 1 6 I would rate my overall experience with
the counselor as excellent 5 4 3 2 1
15 I would refer the counseling services I received to other small businesses
Strongly Agree Agree No Opinion Disagree Strongly Disagree
16 Gender Male owner(s) Female owner(s) Both male and female owners
17 Veterans status Veteran Service‐disabled Veteran Reservist National Guard member Non‐Veteran
18 Age [Circle one] 18‐24 25‐34 35‐44 45‐54 55‐64 65‐74 75+
19 Are you Hispanic or Latino Not of Hispanic or Latino Origin
20 Are you [Please choose one or more] American Indian or Alaskan Native Asian Black or African American Native Hawaiian or Pacific Islander White
Impact Study of Entrepreneurial Development 120Resources ndash 2010-2011
Office of Entrepreneurial Development
21 Did you utilize any of the following SBA resources or programs Yes No
If YES select those you used [Check all that apply] SBDC SCORE SBArsquos Guarantee Loan programs Women Business Center SBIC Venture Capital Program Government Contracting SBArsquos Surety Bond Program Small Business Training Network Disaster Assistance (On‐line training)
PLEASE NOTE The estimated burden for completing this form is 12 minutes per response You are not required to respond to any collection of information unless it displays a currently valid OMB approval number Comments on the burden should be sent to US Small Business Administration Chief AIB 409 3rd St SW Washington DC 20416 and Desk Officer for the Small Business Administration Office of Management and Budget New Executive Building Room 10202 Washington DC 20503 OMB Approval (3245‐0351) PLEASE DO NOT SEND FORMS TO OMB
SBA Form 2214 THANK YOU
Impact Study of Entrepreneurial Development 121Resources ndash 2010-2011
Office of Entrepreneurial Development
[This page is intentionally left blank for two-sided printing]
Impact Study of Entrepreneurial Development 122Resources ndash 2010-2011
Office of Entrepreneurial Development
Appendix 5 ndash Follow-up Survey
US Small Business Administration Office of Entrepreneurial Development Follow‐up Economic Impact Survey
OMB Number 3245‐0351 Expiration 03312013
Dear Small Business Client
Within the last twelve months you were kind enough to respond to our request for some initial data regarding your visit(s) to SBArsquos Entrepreneurial Development resource the [Small Business Development Center (SBDC) Womenrsquos Business Center (WBC) SCORE] To continually understand the impact our programs and services are having on the economy it would be helpful to know if our assistance to you regarding starting and managing a business resulted in job creation increases in your businessrsquo revenues or other results
We understand that you responded to a thorough survey not so long ago but we ask that you help us in answering a few questions for this follow‐up survey which will take less than 5 minutes All responses to these questions are voluntary and will be held in confidence The data will not be released to any other government agency or private firm Based on your visit to the [SBDC WBC SCORE] please use that experience as a benchmark to answer the following
1 Are you currently in business Yes No
If YES when was the business started _ __ _ _ _ mm yyyy
2 If NO when do you plan on starting a business Within 30 days 31‐90 days 91‐120 days No idea at this time
3 Have you ever been in business Yes No If YES when was the business started _ __ _ _ _
mm yyyy
Impact Study of Entrepreneurial Development 123Resources ndash 2010-2011
Office of Entrepreneurial Development
4 As a result of the assistance received from the [SBDCWBCSCORE] Counselor which of the following were you able to develop [ie Business Plan] in order to start or better manage your business [Check all that apply]
Business Plan Loan Package Purchasing Strategy Marketing Plan Hiring Plan Feasibility Plan Promotional Plan Training Plan for Staff Production Plan Pricing Strategy Financial Strategy Distribution Plan Cash Flow Analysis Web Based Strategy International Trade General Management Other ________________________________________
5 What was the approximate annual gross revenue of your business in 2010 $________________00
6 Currently how many people (full and part‐time) including yourself does your business employ
Number of Full‐Time Employees _________________________ Number of Part‐Time Employees _________________________
7 Have you utilized any other SBA resourcesprogram Yes No
8 If YES select those you used [Check all that apply]
SCORE SBArsquos Guarantee Loan programs SBDC SBIC Venture Capital Program Women Business Center Government Contracting SBArsquos Surety Bond Program Small Business Training Network
(online training)
PLEASE NOTE The estimated burden for completing this form is less than 5 minutes per response You are not required to respond to any collection of information unless it displays a currently valid OMB approval number Comments on the burden should be sent to US Small Business Administration Chief AIB 409 3rd St SW Washington DC 20416 and Desk Officer for the Small Business Administration Office of Management and Budget New Executive Building Room 10202 Washington DC 20503 OMB Approval (TBD) PLEASE DO NOT SEND FORMS TO OMB
THANK YOU
Impact Study of Entrepreneurial Development 124Resources ndash 2010-2011
Office of Entrepreneurial Development
Appendix 6 ndash Regression Computations
Regression Results Effects of Firm and Demographic Characteristics on Perceived Usefulness Assistance with the Decision to Start a Business and Financial Impact
Dependent Variable
Independent Variable
Perceived Usefulness
Assistance with Decision to Start a Business (LR)
Financial Impact
Intercept -124024 240905 -191586
SBDC 19242 -040279 48574
SCORE 15332 -072576 49471
lt 3 hours -24964 011296 -53896
Log of Sales 4661 -013453 3762
Gender 2158 -012057 59382
Veteran 6455 00601 4318
Latino -006 -041537 35888
Age 3223 -003744 40697
Native American 61156 038098 -7369
Asian 21109 -082348 46016
Black 44458 -051198 66021
HawaiianPacific Islander
-32923 -075983 -126224
White 42644 -055758 29757
Inbus 49901 -120888 8468
R-Square 0015 0088 0008
Significant at 001 level Significant at 005 level Significant at 010 level
Impact Study of Entrepreneurial Development 125Resources ndash 2010-2011
Office of Entrepreneurial Development
[This page is intentionally left blank for two-sided printing]
Impact Study of Entrepreneurial Development 126Resources ndash 2010-2011
Office of Entrepreneurial Development
Appendix 7 ndash State-by-State Data The tables below display national response data segmented by ED Resource and in aggregate for total ED Resources
SBDC Clients
ED Resource State Surveys Received
SBDC Client Contacts Received
Response Rate
of Total SBDC Clients
SBDC AL 78 342 23 15SBDC AK 9 48 19 02SBDC AS 2 8 25 00SBDC AZ 71 396 18 14SBDC AR 54 207 26 11SBDC CA 527 2593 20 103SBDC CO 101 330 31 20SBDC CT 75 238 32 15SBDC DC 12 45 27 02SBDC DE 16 60 27 03SBDC FL 235 1233 19 46SBDC GA 180 631 29 35SBDC GU 3 9 33 01SBDC HI 23 93 25 04SBDC ID 26 100 26 05SBDC IL 208 957 22 41SBDC IN 124 470 26 24SBDC IA 71 222 32 14SBDC KS 54 207 26 11SBDC KY 77 312 25 15SBDC LA 84 345 24 16SBDC ME 25 97 26 05SBDC MD 93 405 23 18SBDC MA 104 489 21 20SBDC MI 257 765 34 50SBDC MN 99 380 26 19SBDC MS 43 222 19 08SBDC MO 91 381 24 18SBDC MT 22 69 32 04SBDC NE 28 128 22 05SBDC NV 39 153 25 08SBDC NH 17 96 18 03SBDC NJ 143 648 22 28SBDC NM 40 141 28 08SBDC NY 321 1451 22 63SBDC NC 184 621 30 36SBDC ND 8 49 16 02SBDC OH 185 871 21 36
Impact Study of Entrepreneurial Development 127Resources ndash 2010-2011
Office of Entrepreneurial Development
Impact Study of Entrepreneurial Development Resources ndash 2010-2011
ED Resource State Surveys Received
SBDC Client Contacts Received
Response Rate
of Total SBDC Clients
SBDC OK 63 266 24 12 SBDC OR 80 264 30 16 SBDC PA 253 948 27 49 SBDC PR 62 294 21 12 SBDC RI 14 45 31 03 SBDC SC 66 309 21 13 SBDC SD 11 55 20 02 SBDC TN 98 438 22 19 SBDC TX 210 1190 18 41 SBDC UT 56 180 31 11 SBDC VI 5 10 50 01 SBDC VT 13 48 27 03 SBDC VA 151 546 28 30 SBDC WA 149 423 35 29 SBDC WV 24 138 17 05 SBDC WI 117 378 31 23 SBDC WY 12 39 31 02
Totals 5113 20956 1000
SCORE Clients
SCORE Client of Total Surveys Contacts Response SCORE
ED Resource State Received Received Rate Clients SCORE AL 12 99 12 03SCORE AK 0 2 0 00SCORE AZ 113 565 20 25SCORE AR 30 149 20 07SCORE CA 416 2571 16 94SCORE CO 137 484 28 31SCORE CT 161 791 20 36SCORE DC 19 93 20 04SCORE DE 41 211 19 09SCORE FL 309 1619 19 70SCORE GA 62 446 14 14
SCORE HI 26 77 34 06SCORE ID 24 99 24 05SCORE IL 154 994 15 35SCORE IN 73 403 18 16SCORE IA 36 162 22 08
SCORE KS 16 80 20 04SCORE KY 68 335 20 15SCORE LA 19 118 16 04SCORE ME 48 179 27 11
128
Office of Entrepreneurial Development
ED Resource State Surveys Received
SCORE Client Contacts Received
Response Rate
of Total SCORE Clients
SCORE MD 74 374 20 17SCORE MA 164 781 21 37SCORE MI 108 431 25 24SCORE MN 135 626 22 30SCORE MS 2 20 10 00SCORE MO 49 257 19 11SCORE MT 14 52 27 03SCORE NE 15 108 14 03SCORE NV 64 487 13 14SCORE NH 86 334 26 19SCORE NJ 90 467 19 20SCORE NM 31 111 28 07SCORE NY 268 1368 20 60SCORE NC 180 724 25 41SCORE ND 14 67 21 03SCORE OH 225 951 24 51SCORE OK 14 63 22 03SCORE OR 119 588 20 27SCORE PA 254 1081 23 57SCORE RI 13 79 16 03SCORE SC 87 413 21 20SCORE SD 3 14 21 01SCORE TN 68 354 19 15SCORE TX 209 1093 19 47SCORE UT 35 100 35 08SCORE VT 27 116 23 06SCORE VA 112 450 25 25SCORE WA 118 571 21 27SCORE WV 5 24 21 01SCORE WI 97 398 24 22
SCORE WY 0 2 0 00
Total 4444 21981 1000
Impact Study of Entrepreneurial Development 129Resources ndash 2010-2011
WBC Clients
ED Resource State Surveys Received
WBC Client Contacts Received
Response Rate
of Total WBC Clients
WBC AL 28 105 27 48WBC AK 1 4 25 02WBC AS 0 9 0 00WBC AZ 1 18 6 02WBC CA 91 518 18 154WBC CO 4 45 9 07
ED Resource State Surveys Received
WBC Client Contacts Received
Response Rate
of Total WBC Clients
WBC CT 4 35 11 07WBC DC 17 91 19 29WBC DE 4 19 21 07WBC FL 15 78 19 25WBC GA 7 50 14 12WBC IL 11 103 11 19WBC IN 30 173 17 51WBC IA 3 15 20 05WBC KS 12 64 19 20WBC LA 8 79 10 14WBC ME 12 42 29 20WBC MD 21 66 32 36WBC MA 3 18 17 05WBC MI 23 123 19 39WBC MN 9 35 26 15WBC MO 7 37 19 12WBC MT 16 49 33 27WBC NE 8 34 24 14WBC NV 8 48 17 14WBC NM 15 74 20 25WBC NY 43 147 29 73WBC NC 77 480 16 131WBC OH 1 30 3 02WBC OK 9 18 50 15WBC PA 9 48 19 15WBC PR 5 32 16 08WBC RI 4 18 22 07WBC SC 2 10 20 03WBC TN 5 10 50 08WBC TX 28 172 16 48WBC UT 7 27 26 12WBC VT 5 20 25 08WBC VA 6 10 60 10WBC WA 12 85 14 20WBC WV 2 10 20 03WBC WI 16 105 15 27WBC WY 0 8 0 00
Total 589 3162 1000
Office of Entrepreneurial Development
Impact Study of Entrepreneurial Development 130Resources ndash 2010-2011
Office of Entrepreneurial Development
Total ED Resources Clients
Total ED Resources of Total Client ED
Surveys Contacts Response Resources ED Resource State Received Received Rate Clients Total ED Resources AL 118 546 22 12 Total ED Resources AK 10 54 19 01 Total ED Resources AS 2 17 12 00 Total ED Resources AZ 185 979 19 18 Total ED Resources AR 84 356 24 08 Total ED Resources CA 1034 5682 18 102 Total ED Resources CO 242 859 28 24 Total ED Resources CT 240 1064 23 24 Total ED Resources DC 48 229 21 05 Total ED Resources DE 61 290 21 06 Total ED Resources FL 559 2930 19 55 Total ED Resources GA 249 1127 22 25 Total ED Resources GU 3 9 33 00 Total ED Resources HI 49 170 29 05 Total ED Resources ID 50 199 25 05
Total ED Resources IL 373 2054 18 37 Total ED Resources IN 227 1046 22 22 Total ED Resources IA 110 399 28 11 Total ED Resources KS 82 351 23 08 Total ED Resources KY 145 647 22 14 Total ED Resources LA 111 542 20 11 Total ED Resources ME 85 318 27 08 Total ED Resources MD 188 845 22 19 Total ED Resources MA 271 1288 21 27 Total ED Resources MI 388 1319 29 38 Total ED Resources MN 243 1041 23 24 Total ED Resources MS 45 242 19 04 Total ED Resources MO 147 675 22 14 Total ED Resources MT 52 170 31 05 Total ED Resources NE 51 270 19 05 Total ED Resources NV 111 688 16 11 Total ED Resources NH 103 430 24 10 Total ED Resources NJ 233 1115 21 23 Total ED Resources NM 86 326 26 08 Total ED Resources NY 632 2966 21 62 Total ED Resources NC 441 1825 24 43 Total ED Resources ND 22 116 19 02 Total ED Resources OH 411 1852 22 41 Total ED Resources OK 86 347 25 08 Total ED Resources OR 199 852 23 20 Total ED Resources PA 516 2077 25 51 Total ED Resources PR 67 326 21 07
Impact Study of Entrepreneurial Development 131Resources ndash 2010-2011
Office of Entrepreneurial Development
ED Resource State Surveys Received
Total ED Resources Client Contacts Received
Response Rate
of Total ED Resources Clients
Total ED Resources RI 31 142 22 03 Total ED Resources SC 155 732 21 15 Total ED Resources SD 14 69 20 01 Total ED Resources TN 171 802 21 17 Total ED Resources TX 447 2455 18 44 Total ED Resources UT 98 307 32 10 Total ED Resources VI 5 10 50 00 Total ED Resources VT 45 184 24 04 Total ED Resources VA 269 1006 27 27 Total ED Resources WA 279 1079 26 27 Total ED Resources WV 31 172 18 03 Total ED Resources WI 230 881 26 23
Total ED Resources WY 12 49 24 01
Total 10146 46099 1000
Impact Study of Entrepreneurial Development 132Resources ndash 2010-2011

Office of Entrepreneurial Development
[This page is intentionally left blank for two-sided printing]
Impact Study of Entrepreneurial Development ii Resources ndash 2010-2011
Office of Entrepreneurial Development
TABLE OF CONTENTS
TABLE OF CONTENTS iii TABLE OF FIGURES v TABLE OF TABLES vii FOREWORD 1 I INTRODUCTION 3 II EXECUTIVE SUMMARY 5 III METHODOLOGY 13 IV TOTAL ED RESOURCES 2008 - 2009 - 2010 21 V SBDC 2010 VS TOTAL ED RESOURCES 41 VI SCORE 2010 VS TOTAL ED RESOURCES 53 VII WBC 2010 VS TOTAL ED RESOURCES 65 VIII FOLLOW-UP STUDY RESULTS 2008 amp 2009 CLIENTS 77 IX SUMMARY OF QUANTITATIVE FINDINGS 91 XI RECOMMEDATIONS FOR FURTHER RESEARCH 97 XII APPENDICES 99
Appendix 1 ndash Survey Response Values by Research Topic 101 Appendix 2 ndash Quantified Survey Results ndash Initial Survey 2010 Clients 107 Appendix 3 ndash Quantified Survey Results ndash Follow-up Survey 2010 Clients 113 Appendix 4 ndash Initial Study Survey Instrument 117 Appendix 5 ndash Follow-up Survey 123 Appendix 6 ndash Regression Computations 125 Appendix 7 ndash State-by-State Data 127
Impact Study of Entrepreneurial Development Resources ndash 2010-2011
iii
Office of Entrepreneurial Development
[This page is intentionally left blank for two-sided printing]
Impact Study of Entrepreneurial Development iv Resources ndash 2010-2011
Office of Entrepreneurial Development
TABLE OF FIGURES Methodology
Figure 31 ndash Distribution of Respondents by Segment (2010 clients) 16 Total ED Resources 2008-2009-2010
Figure 41 ndash Total ED Resources ndash Client Segments Served 22 Figure 42 ndash Total ED Resources ndash Revenue and Employment (Average ED client Revenues and Number of Employees) 23 Figure 42A ndash Total ED Resources ndash Revenues by Hours of Counseling 24 Figure 43 ndash Total ED Resources ndash Demographic Characteristics 25 Figure 44 ndash Total ED Resources ndash Age of Business Owner 26 Figure 45 ndash Total ED Resources ndash Primary Business Type 27 Figure 46 ndash Total ED Resources ndash What led to your decision to seek business counseling from ED Resources 28 Figure 47 ndash Total ED Resources ndash How useful was the information you received 29 Figure 47A ndash How useful was the information you received Total ED Resources by Hours of Counseling vs Total ED Resources Aggregate Hours 30 Figure 48 ndash Total ED Resources ndash Did you decide to go into business as a result of the assistance you received 31 Figure 49 ndash Total ED Resources ndash Assistance in Plan Development 33 Figure 410 ndash Total ED Resources ndash Perceived Impact of Assistance 34 Figure 410A ndash Total ED Resources ndash Perceived Impact of Assistance (Hours of Counseling Received vs Aggregate Hours) 35 Figure 411 ndash Revenues (000s) for Firms in Selected Demographic Categories 36 Figure 412 ndashTotal Employees for Firms in Selected Demographic Categories 37 Research Findings - SBDC
Impact Study of Entrepreneurial Development v Resources ndash 2010-2011
Figure 51 ndash SBDC ndash Distribution of Clients by Segment (2010 Clients) 42 Figure 52 ndash SBDC ndash Demographic Characteristics (2010 Clients) 43 Figure 53 ndash SBDC ndash Age of Business Owner (2010 Clients) 44 Figure 54 ndash SBDC ndash Type of Business (2010 Clients) 45 Figure 55 ndash SBDC ndashUsefulness of SBDC (2010 Clients) 46 Figure 55A ndash Usefulness of SBDC SBDC by Hours of Counseling vs Total ED Resources Aggregate Hours (2010 Clients) 47 Figure 56 ndash SBDC ndash Changed Management PracticesStrategies as a Result of SBDC ED Resource Assistance (2010 Clients) 48 Figure 57 ndash SBDC ndash Assistance in Plan Development (2010 Clients) 49 Figure 58 ndash SBDC ndash Perceived Impact of Assistance (2010 Clients) 50 Figure 58A ndash SBDC ndash Perceived Impact of Assistance SBDC Hours of Counseling Received for In-Business and Start-ups vs Total ED Resources Aggregate Hours for In-Business and Start-ups (2010 Clients) 51
Office of Entrepreneurial Development
Research Findings - SCORE
Figure 61 ndash SCORE ndash Distribution of Clients by Segment (2010 Clients) 54 Figure 62 ndash SCORE ndash Demographic Characteristics (2010 Clients) 55 Figure 63 ndash SCORE ndash Age of Business Owner (2010 Clients) 56 Figure 64 ndash SCORE ndash Type of Business (2010 Clients) 57 Figure 65 ndash SCORE ndashUsefulness of SCORE (2010 Clients) 58 Figure 65A ndash Usefulness of SCORE SCORE by Hours of Counseling vs Total ED Resources Aggregate Hours (2010 Clients) 59 Figure 66 ndash SCORE ndash Changed Management PracticesStrategies as a Result of SCORE ED Resource Assistance (2010 Clients) 60 Figure 67 ndash SCORE ndash Assistance in Plan Development (2010 Clients) 61 Figure 68 ndash SCORE ndash Perceived Impact of Assistance (2010 Clients) 62 Figure 68A ndash SCORE ndash Perceived Impact of Assistance SCORE Hours of Counseling Received for In-Business and Start-ups vs Total ED Resources Aggregate Hours for In-Business and Start-ups (2010 Clients) 63
Research Findings - WBC
Impact Study of Entrepreneurial Development Resources ndash 2010-2011
vi
Figure 71 ndash WBC ndash Distribution of Respondents by Segment (2010 Clients) 66 Figure 72 ndash WBC ndash Demographic Characteristics (2010 Clients) 67 Figure 73 ndash WBC ndash Age of Business Owner (2009 Clients) 68 Figure 74 ndash WBC ndash Type of Business (2010 Clients) 69 Figure 75 ndash WBC ndash Usefulness of WBC (2010 Clients) 70 Figure 75A ndash Usefulness of WBC WBC by Hours of Counseling vs Total ED Resources Aggregate Hours (2010 Clients) 71 Figure 76 ndash WBC ndash Changed Management PracticesStrategies as a Result of WBC ED Resource Assistance (2010 Clients) 72 Figure 77 ndash WBC ndash Assistance in Plan Development (2010 Clients) 73 Figure 78 ndash WBC ndash Perceived Impact of Assistance (2010 Clients) 74 Figure 78A ndash WBC ndash Perceived Impact of Assistance WBC Hours of Counseling Received for In-Business and Start-ups vs Total ED Resources Aggregate Hours for In-Business and Start-ups (2010 Clients) 75
Office of Entrepreneurial Development
Follow-up Results
Figure 81 ndash Transitions and Survival of 2008 and 2009 Clients to 2011 In-Business 78 Figure 82 ndash ED Resource Clients have Higher Survival Rates than PSED Firms 79 Figure 83 - ED Resource Client Survival by Hours of Counseling 80 Figure 84 - Mean Revenues and Employment 2008 Clients Over Time 81 Figure 85 - Mean Revenues and Employment 2009 Clients Over Time 82 Figure 85A Mean SBDC Revenues and Employment 2009 Clients Over Time 83 Figure 85C Mean WBC Revenues and Employment 2009 Clients Over Time 85 Figure 86 Distribution of ED Resource Clientsrsquo Percentage Change in Revenues 86 Figure 87A ndash Firm Survival Rates for ED Resource Clients After One Year (Total ED Resources vs PSED) 87 Figure 87B ndash Firm Survival Rates for ED Resource Clients After Two Years (Total ED Resources vs PSED) 87 Figure 88 ED Resource Client Revenue Growth Compared to Selected Benchmarks - Percent Change from Previous Year 88
TABLE OF TABLES
Table 31 ndash Sampling Frame 15 Table 32 ndash Follow-up Impact Study Clients 18 Table 41 ndash Total ED Resources-Revenues and Employment (2010) 22 Table 42 ndash ED Resources Impact on Managerial Practices 32 Table 51 ndash SBDC Client Revenues and Employment (2010) 42 Table 61 ndash SCORE Client Revenues and Employment (2010) 54 Table 71 ndash WBC Client Revenues and Employment (2010) 66
Impact Study of Entrepreneurial Development vii Resources ndash 2010-2011
Office of Entrepreneurial Development
[This page is intentionally left blank for two-sided printing]
Impact Study of Entrepreneurial Development viii Resources ndash 2010-2011
Office of Entrepreneurial Development
FOREWORD
Concentrance would like to thank the US Small Business Administrationrsquos (SBA) Office of Entrepreneurship Education and SBArsquos Office of Entrepreneurial Development Program Offices Small Business Development Centers SCORE and Womenrsquos Businesses Centers for their assistance in conducting this research Both headquarter offices and local ED Resources spent considerable effort to ensure that clients from each center were represented in the data collection The rich dataset that now exists is in no small measure due to these efforts
The following individuals contributed to the development of this report
Jane Dwight- Managing Partner Concentrance Consulting Group Matthew C Herman- Project Director Concentrance Consulting Group Benjamin Joiner- Business Analyst Concentrance Consulting Group Dr George Solomon- Senior Policy Advisor SBA Office Of Entrepreneurship Education Dr Vanessa Perry- Associate Professor George Washington University
Impact Study of Entrepreneurial Development 1Resources ndash 2010-2011
Office of Entrepreneurial Development
[This page is intentionally left blank for two-sided printing]
Impact Study of Entrepreneurial Development 2Resources ndash 2010-2011
Office of Entrepreneurial Development
I INTRODUCTION
The US Small Business Administrationrsquos (SBA) Office of Entrepreneurial Development (ED) designed a multi-year time series study to assess the impact of the face-to-face counseling programs it offers to small businesses This study has examined clients who received face-to-face counseling services starting in 2003 The SBA initiated this study as part of the Office of Management and Budgetrsquos (OMB) Program Assessment Rating Tool (PART) SBA contracted with Concentrance Consulting Group to assist in administering the study to analyze the findings and to write this report This report is the eighth report1 in the study and presents the findings from three separate study groups each year This yearrsquos study group includes 2010 clientsrsquo initial attitudinal assessment of their counseling experience and a follow-up with 2009 and 2008 clients to assess the financial impact of the received assistance2
Study Year 2009 Study Year 2010 Study Year 2011
2008 Clients Initial survey First follow-up Second follow-up
2009 Clients Initial survey First follow-up
2010 Clients Initial survey
Study Year 2009 Study Year 2010 Study Year 2011
This study measures attitudinal assessments perceptions of changes in managementmarketing practices and business growth for firms that utilized SBArsquos ED Resource Partnersrsquo face-to-face counseling during the late summer or early fall of 2008 2009 or 2010 The ED Resource Partners include Small Business Development Centers (SBDC) SCORE and Women Business Centers (WBC)
This report includes Executive Summary Methodology
o Research Questions o Sampling data collection response rate and survey administration o Data analysis and analysis of non-response o Follow-up o Limitations
Findings Initial economic impact study o Impact of total ED Resources (2008 - 2009 - 2010) o Regression analysis o Impact of SBDC resources 2010 o Impact of SCORE resources 2010 o Impact of WBC resources 2010 o Quantitative analysis overview o Qualitative analysis of collected client comments
Findings Follow-up study of 2008 and 2009 ED Resource clients Recommendations for further research
1 Each ED Resource final report can be found at httpwwwsbagovaboutsbasbaprogramsedindexhtml 2 For information on 2003 2004 2005 2006 and 2007 clients please see previous reports
Impact Study of Entrepreneurial Development 3Resources ndash 2010-2011
Office of Entrepreneurial Development
The appendix includes the distribution of responses for each survey question sample survey instruments additional regression results and distribution of responses for each ED Resource by state
[This page is intentionally left blank for two-sided printing]
Impact Study of Entrepreneurial Development 4Resources ndash 2010-2011
Office of Entrepreneurial Development
II EXECUTIVE SUMMARY
The US Small Business Administrationrsquos (SBA) Office of Entrepreneurial Development designed a study to assess the impact of its Entrepreneurial Development (ED) Resource Partnersrsquo face-to-face counseling assistance on small business clients and contracted Concentrance Consulting Group to conduct the study Thus far the study has examined ED Resource Partner clients that received face-to-face counseling assistance in 2003 and clients from each subsequent year up to and including the present study of 2010 clients This latest report presents the findings of the initial attitudinal impact study of 2010 ED Resource Partner clients and a follow-up study showing the financial impact on 2009 and 2008 clients Within the report all references to ED Resource Partner clients pertain to ED Resource Partnerrsquos face-to-face counseling clients who received assistance from a designated ED Resource Partner ED Resource Partner Clients Studied Concentrance studied the outcomes of three ED Resource Partners Small Business Development Centers (SBDC) SCORE and Women Business Centers (WBC)
Within each ED Resource Partner we studied three small business client segments including Nascent - Those individuals who have taken one or more positive steps to start a business Start-up - Those individuals who have been in business one year or less and In-Business ndash Those individuals who have been in business more than one year and are
classified as small by the SBA For the 2010 clients who responded to the initial impact study we analyzed demographic characteristics perceived usefulness of assistance and initial impact on businesses We also assessed the survival rates and financial growth of 2009 and 2008 clients Quantitative Findings (Initial Impact Study 2010 Clients)
Concentrance collected coded and analyzed data for 10146 ED Resource clients for an overall response rate of 23 This yearrsquos survey comprised the largest sample and achieved the greatest number of respondents since the inception of the study The table below provides the number of respondents and response rates for each ED Resource
Resource Center
Stratified Sample Size
Usable Sample
Size3
Surveys Received via Web
Surveys Received via Phone
Total Surveys
Received
Response Rate 2010
Clients SBDC 21514 20329 4183 930 5113 25 SCORE 22002 21521 3513 931 4444 21 WBC 3229 3021 450 139 589 20 Total 46745 44871 8146 2000 10146 23
Resource Center
Stratified Sample Size
3 The usable sample size includes the stratified sample minus surveys noted as undeliverable by web or phone due to incorrect contact information The accuracy and completeness of the contact information for clients provided by ED Resource offices was much improved for 2010 clients compared to previous years
Impact Study of Entrepreneurial Development 5Resources ndash 2010-2011
Office of Entreprreneurial DDevelopm ment
The figurre below illusstrates the buusiness segmeent composittion of each ED Resourcce
Distribbution of Responddents by SSegment t (2010 Cllients)4
nn = 10146
NNascent 1143 1306 1880
SStart-up 929 920 1111
B In-
Business 3003 2175 2993
Total 5113 4444 5889
CClient Year Stratified d Sample Si ize
Usea able Sample e Size
Follo ow-up p
Surveys s Received in n 2008
Response Rate
2008 854 854 2nnd 200 23
2009 8493 84993 sst 1 11968 23
The 20088 clients weree resurveyed in 2011 to deetermine finaancial impactt after two yeears in terms of financial ggrowth and ffirm survivall rates Theirr response raate was 23 equal to the previous yeaarrsquos study Thhe 2009 cliennts were also resurveyed aat this time too determine financial imppact and firmm survival rrates after onne year The response ratee for this grooup was also 23 the higghest responnse rate sincee the inceptioon of the studdy for a first follow-up grroup
4 Respondeents (86) who reeported being in business butt who did not pprovide a valid sstart date for thhat business weere not assigned too a business segmment Therefoore percentagess of clients in eaach business se egment may nott equal 100
Impact S tudy of Entrepren neurial Develop pment Resource es ndash 2010-2011 1
6
Office of Entreprreneurial DDevelopm ment
FY2011 0 SBDC SCCORE and WBC clientt s all reporte ed lower rev venues than those serve ed in the previous yee ar SBDC continues too serve the c clients with h the highest t average revenuu es ($774000 0) followedd by SCOREE ($502000) ) and WBC C ($171300)
Average eemployment llevels for SBBDC SCOREE and WBC cclients all felll from 2009 levels
Impact S tudy of Entreprenn eurial Developp ment Resourcee s ndash 2010-2011 1
7
RRev 2008 $6340000 $818400 $229500
RRev 2009 $8553000 $728400 $311200
RRev 2010 $7740000 $502000 $171300
Emmpl 2008 7 7 5
Emmpl 2009 7 6 4
Emmpl 2010 5 3 3
f
t
ED D Resource es served a ddiverse clien nt base in 20 010 similar tto past yearrs regarding g de emographic and busine ess characte eristics
Office of Entreprreneurial DDevelopm ment
The tootal ED Resoource client bbase consisteed of Femalle (36) Malle (36) firmms with MMale and Femmale owners (17) White (68) BlackAfrican AAmerican (111) Veteraan (9) Servvice-disabledd Veteran (2) HispanicLatino (7)) Asian (4)) Ameriican IndianNNative Alaskkan (2) andd Native HawwaiianPacifific Islander (11)5
The percentage of firms ownedd by White aand Veteran clients has ddecreased fromm the prrevious year66 Male and FFemale ownerrs is a new caategory for thhe 2011 studdy whichh partially expplains the deccrease in bothh the Femalee and Male ddemographicss
For 20010 the greatest percentaage of busineess owners (228) were beetween the agges of 45-54 Those bbetween the aages of 35-444 made up 222 of clientss Twenty peercent consissted of clients between thhe ages of 55--64 down thhree percentaage points froom last yeear7 Clients 225-34 were 113 of the tootal ED Resoource client bbase8
The mmost often citted primary bbusiness induustries for 20009 clients re emained the ssame as in ppast years seervice (14) and retail (11) The prrevalence of the service aand retail iindustry categories have rremained levvel over the ppast year howwever manuffacturing connsulting andd health care have all decrreased by appproximately oone percenntage point aand ldquootherrdquo hhas increasedd by three perrcentage poinnts
Firms owned by mmen reported revenues onn average more than twicce as high as those owned by w omen Reveenues for botth groups felll over the paast year The highesst average revvenues by racceethnicity were reporteed by HispannicLatinos followwed by Whitee and Asian fifirms Averagge revenues for every racceethnicity experiienced decreaases especiallly Native HaawaiianPaciific Islanders Veterans experiienced increaases in averagge revenues wwhile Servicee-disabled V eterans reporrted lower revenues thaan the previoous year
FY Y2010 client s gave lowe er ratings (73 3) than th he previous y yearrsquos respo ondents (75 5) to the u usefulness o of the assistaance they re eceived Th he effect of c counseling as sistance on the clientrsquos ability to d develop a bu usiness plan (35) mar rketing pla an (30) ha as remained d relatively c consistent ac cross past st tudies
5 These 20110 demographicc distributions wwere comparedd to the nationaal averages fromm the 2007 Survvey of Businesss Owners froom the US Cennsus Bureau (SBBO) The totall ED Resource s demographic distribution waas compared too the national averages from thee SBO The d isstribution was ccomparable acrross characterisstics except for the following SSBO figures White business ow wners were 83 of the small bbusiness popul lation Female b business ownerrs were 29 MMalebusiness owwners were 51 and BlackAffrican Americann business ownners were at 7 6 Just over 16 of survey respondents diid not answer thhe race questio ons whereas 455 answered laast year Thereffore the drop inn in the numberr of Whites mayy be due to nonn-responses andd not reflective of the actual p opulation 7 Eleven peercent of surveyy respondents ddid not respondd to the age queestion for this yyearrsquos study Laast year only twwo percent didd not respond This may explaain some of thee variation betwween this yearrsquos study and the 22010 study 8 The total ED Resources age distributio n was compareed to the nationnal averages fromm the SBO The distribution was comparablee except that 655+ was reportedd at 125 (commpared to 5 ffor total ED Reesources)
Impact S tudy of Entrepren neurial Develop pment Resource es ndash 2010-2011 1
8
Office of Entreprreneurial DDevelopm ment
Usefulness ratings also include the financiall impact of aassistance on hiring new sstaff (11) retaining cuurrent staff (115) increasing profit mmargin (22) and increasiing sales ((25) The rratings for alll categories hhave gone doown from thee previous yeear
Laa rger firms rr eported higg her levels oo f perceived d usefulness of ED Reso ource as sistance thaa n did smalll er firms F irms that re eceived less than 3 hour rs of as sistance repp orted lowerr levels of pee rceived use efulness tha an firms with h 3 or m ore hours off counselingg
Total ED Resourc ce clients that t received 3 o or more hour rs of counsel ling reported d 76 o of the time th hat counselin ng was useful l versus 69 for clients t that received d less than 3 3 hours of co ounseling
There were no diff ferences in q quality of cou unseling expe erience basedd on businesss segme ent ED Reso ource or geog graphic locatti ion
There were no sign nificant effec cts of clientrsquos s age gender veteran stat tus or ethnic city on per rceived usefu ulness How wever Americ can IndianA Alaskan Nativ ve and White e clients s reported sig gnificantly hi igher perceiv ved usefulnes ss No other significant differe ences based o on race were e found
All though clie nt reported perceptionss of each EDD Resourcee were largelly similar th ere were somm e key diffee rences
For SC CORE client ts 55 repor rted the perc ceived reputa ation of SCO ORE led to th heir decisio on to seek EDD Resource assistance co ompared to 4 44 for SBD DC clients an nd 40 f for WBC clie ents
Appro oximately 39 of WBC S Start-ups and d 42 of WB BC In-Busine ess clients report ted that assist tance they re eceived result ted in increas sed sales com mpared to 25 5 and 33 3 respectiv vely for SCOR RE clients an nd 33 and 37 for SBD DC clients respec ctively
For W WBC clients 3 38 of Start t-ups reporte d that they d decided to go o into busines ss as a resul lt of assistan ce compared d to 33 for SBDC and 3 30 for SCO ORE This tr rend w l l
as a so apparent for Nascent clients
Fi irms in the I In-Business s segment a and larger fir rms were le ss likely to r report that th heir decision n to start a b business wa s the result of ED Reso ource assista ance
Twentty-five percennt of Nascennt clients andd 32 of Starrt-up clients reported thaat their ddecision to sttart a businesss was the ressult of ED RResource assistance
Impact S tudy of Entrepren neurial Develop pment Resource es ndash 2010-2011 1
9
Office of Entreprreneurial DDevelopmment
Consistent with thhe previous yeearrsquos results larger firms firms in the In-Businesss segmeent and SCORRE clients wwere significanntly less likelly to report thhat their decisioons to start bbusinesses weere the resultt of the ED RResource asssistance they received
Fii ndings fromm an analys is of follow--up surveys of 2008 and d 2009 client ts suggest buu sinesses thh at received ED Resourr ce assistan nce have a hi igher surviv val rate thh an other smm all business ses in the PP SED II Th he survival r rate after tw wo years ww as 93 for ED Resourr ce clients cc ompared to o 80 for fir rms in the P PSED II
Appro oximately 57 of 2008 N Nascent client ts had transit tioned to the e In-Business s segme ent after two years while 29 of 200 09 Nascent cl lients had go one into busin ness after o one year On nly six percen nt of 2008 of f In-Business s clients and three percen nt of 2009 c clients went o out of busine ess by 2010
In the e second follo ow-up of 200 08 clients fir rms receiving g 3 or more h hours of couns eling had hig gher survival rates than th hose who rec ceived less th han 3 hours oof couns eling
A com mparison of tthe difference e in growth r rates for SBA A ED Resour rce clients wi ith GDP the Private C Company In ndex (PCI) an nd the Stand dard and Poo orrsquos SmallCap p 600 Index from 2009 t to 2010 show ws that SBA E ED Resource e clients outp paced the oth her bench hmarks with a a difference o of 134 perce entage points s over five p percentage po oints more than the nex xt highest find ding9 Altho ough all three e benchmarks s indicated positiv ve growth du uring this tim me SBA ED R Resource clie entsrsquo progres ssed more rap pidly
9 T ee uu rr EE aa rrhttpwwwwbeagovnationalxlsgdpchhgxls the Privaate Company Inndex (PCI) - puublished by Enttrex this index measures reevenue performmance in the secctor of private ccompanies rangging from $3 mmillion to $60 mmillion in annuall revenues (hhttpwwwpriivatecompanyinndexcom) and the S amp P SmaallCap 600 Indeex - represents approximately 3 of the US maarket and incluudes 600 lsquosmall caprsquo companiess with market ccapitalizations bbetween $300 mmillion and $2 bbillion
he thre benchmarks sed for compa ison of SBA D Resources re GDP - Sou ce
Impact S tudy of Entrepren neurial Develop pment Resource es ndash 2010-2011 1
10
Office of Entrepreneurial Development
Qualitative Findings
A few clients from each ED Resource provided ad hoc commentaries in emails with their survey instrument
Comments were both positive and negative for each ED Resource
Recommendation for Further Research
An additional study could examine the effects of different types of financing (eg SBA Guarantee Loan vs SBA Disaster Loan) on perceived improvements survival and business growth
Methodology
The initial impact study of 2010 clients was quantitative in nature based upon responses to web surveys Statistical analyses utilized frequency distributions average comparisons cross tabulations and regression models This yearrsquos study computed revenue and employment data using means rather than medians which were the bases of previous yearsrsquo studies Given wide fluctuation and disparity in revenue and employment among small businesses using mean comparisons is a more informative measure
The survey of clients resulted in a respondent sample of 10146 clients ED Resources provided a random sample list of 46745 clients served during the late summer or early fall of 2010 Concentrance sent web surveys to ED Resource face-to-face counseling clients via email We sent reminder emails each week for four weeks after the initial emailing Phone surveys were attempted for clients who did not respond to web surveys According to statistical tests there was no evidence of bias due to non-response
Concentrance used regression analyses to test for the impact of client demographics on client perceptions of ED Resource assistance outcomes Each regression model examined the impact of selected demographic characteristics (age gender race ethnicity and veteran status) and firm characteristics (size business segment ED Resource geographic location and hours of assistance) on a particular resource impact These impacts included perceived usefulness of ED Resource assistance perceived impact on the decision to start a business and perceived impact on sales
The respondent sample for the second follow-up survey of 2008 clients was 200 The respondent sample for the first follow-up of 2009 clients was 1968 A matched sample was used to perform pair-wise statistical tests that compared changes in growth and business segment to other benchmarks Revenue and employment growth for ED Resource clients were examined by comparing SBA data to that of the Panel Study of Entrepreneurial Dynamics II10 (PSED II) the Private Company Index and the SampP SmallCap 600 Index
10 The Panel Study of Entrepreneurial Dynamics II is a nationwide multi-million dollar survey of nascent entrepreneurs funded by the Kauffman Foundation The primary purpose of the study is to identify adults active in business creation obtain detailed information about the start-up effort and perform follow-up interviews to determine outcomes We rely on the PSED I and PSED II as benchmarks however results must also be interpreted with caution due to potential response bias and definitional differences in the ways that firms are classified
Impact Study of Entrepreneurial Development 11Resources ndash 2010-2011
Office of Entrepreneurial Development
Limitations to consider when interpreting these results include
Measures of ED Resource impacts are attitudinal and are self-reported by the client
Many respondents did not report revenue data
Estimates of firm survival and growth over time should be interpreted with caution Due to attrition firms that have gone out of business may be under represented
Impact Study of Entrepreneurial Development 12Resources ndash 2010-2011
Office of Entrepreneurial Development
III METHODOLOGY
This report contains findings from the initial impact study of face-to-face ED Resource counseling clients from 2010 and a follow-up study of the 2008 and 2009 clients that participated in initial impact studies in previous years11 The methodology for the initial impact study for 2010 clients is presented first followed by the methodology for the 2008 and 2009 client follow-up study The initial impact study reports clientsrsquo attitudinal assessments of their counseling experience and the follow-up study reports the long-term financial impact of assistance on client firms
Research Questions The following questions are the focus of this study and are addressed in the findings section of this report The last two questions numbers six and seven are addressed in the follow-up study which comprises time series analysis of multi-year data
1 What is the demographic financial and business profile of firms who utilize ED Resources
2 Is there a relationship between the servicesassistance provided by ED Resources (SBDC SCORE and WBC) and the clientrsquos perception of the usefulness and value of the servicesassistance received
3 Is there a relationship between the servicesassistance provided by ED Resources and the clientrsquos decision to start a business
4 Is there a relationship between the servicesassistance provided by ED Resources (SBDC SCORE and WBC) and the clientrsquos decision to implement andor change management andor marketing practices in their business
5 Are the servicesassistance provided by ED Resources (SBDC SCORE and WBC) having an impact on the clientrsquos financial position in terms of job creation job retention and sales
Follow-up study of 2008 and 2009 ED Resource clients
6 Based on a comparison of the total ED Resources with the Panel Study of Entrepreneurial Dynamics II (PSED II)12 what is the impact of ED Resource assistance on firm survival
What was the rate of transition of Nascent and Start-up firms to the In-Business segment
11 All references to ED Resource clients pertain to ED Resource Partnersrsquo face-to-face counseling clients who received assistance from a designated ED Resource Partner (SBDCSCOREWBC) 12 The Panel Study of Entrepreneurial Dynamics II is a nationwide multi-million dollar survey of nascent entrepreneurs funded by the Kauffman Foundation The primary purpose of the study is to identify adults active in business creation obtain detailed information about the start-up effort and perform follow-up interviews to determine outcomes We rely on the PSED I and PSED II as benchmarks however results must also be interpreted with caution due to potential response bias and definitional differences in the ways that firms are classified
Impact Study of Entrepreneurial Development 13Resources ndash 2010-2011
Office of Entrepreneurial Development
7 What is the financial impact of servicesassistance provided by ED Resources as a whole in terms of job creation job retention and sales
How does the difference in growth rate of ED Resource clients from 2009 to 2010 compare with selected growth benchmarks such as the gross domestic product (GDP)13 and Standard amp Poorrsquos SmallCap 600 Index14 and the Entrex Private Company Index (PCI)15
Sampling and Data Collection
This study examines the effects of SBA ED Resource assistance on client firms by respective ED Resource and by clients in the following various stages of business formation Nascent - Individuals who have taken one or more steps to start a business Start-up - Individuals who have been in business one year or less In-Business ndash Individuals who have been in business more than one year and are classified as
small by the SBA
The initial impact study of 2010 clients was quantitative in nature based upon responses to web and telephone surveys The responses provided a statistically significant sample for each ED Resource To determine if the sample size for this study was sufficient Concentrance tested the sample size on the basis of reported sales revenues The initial sample of 2010 clients is sufficiently large enough for accuracy within plus or minus $98861 in reported annual sales revenues at a 99 confidence level16
Table 31 on the following page depicts the distribution of surveys across ED Resource and the response rates by ED Resource The overall response rate was 23 which is comparable to the response rates found in other surveys of entrepreneurs For example Aldrich and Baker (2000) found that nearly a third of surveys of entrepreneurs had response rates below 2517 In another example the National Federation of Independent Business (NFIB) had a response rate of 20 in its Small Business Economic Trends survey conducted in June of 201018
13 Source httpwwwbeagovnationalxlsgdpchgxls 14 The S amp P SmallCap 600 Index - represents approximately 3 of the US market and includes 600 lsquosmall caprsquo companies with market capitalizations between $300 million and $2 billion The SampP SmallCap 600 Index is a commonly used benchmark for growth 15 The Private Company Index (PCI) - published by Entrex this index measures revenue performance in the sector of private companies ranging from $3 million to $60 million in annual revenues (httpwwwprivatecompanyindexcom) 16 This assumes a normal distribution of annual revenues with a standard deviation of $2324497 17 Aldrich Howard E and Ted Baker (2000) ldquoBlinded by the Cites Has there been any progress in entrepreneurship researchrdquo in Entrepreneurship 2000 ed Donald L Sexton and Raymond L Smilor Chicago Upstart Publishing p 377-400 18 William K Dunkelberg and Holly Wade ldquoNFIB Small Business Economic Trendsrdquo NFIBcom July 2010 lthttpwwwnfibcomPortals0PDFsbetsbet201007pdfgt
Impact Study of Entrepreneurial Development 14Resources ndash 2010-2011
Office of Entrepreneurial Development
Table 31 ndash Sampling Frame
Resource Center
Stratified Sample Size
Usable Sample Size 19
Surveys Received via Web
Surveys Received via Phone
Total Surveys
Received
Response Rate 2010
Clients SBDC 21514 20329 4183 930 5113 25 SCORE 22002 21521 3513 931 4444 21 WBC 3229 3021 450 139 589 20 Total 46745 44871 8146 2000 10146 23
Survey Administration Following a successful pilot test of web-based survey administration for the 2008-2009 impact study of ED Resources Concentrance adopted web-based survey administration as the primary technique for this study This delivery mechanism has provided greater efficiency with regard to increasing the number of completed surveys for ED Resource clients ED Resources drew a random sample of clients served during the late summer or early fall of 2010 based on a random sample table provided to each ED Resource See Appendix 4 for the survey instrument Via email Concentrance sent selected clients SBA cover letters and an invitation to take a web-based OMB approved survey We sent reminder emails each week for four weeks after the initial emailing We logged-in all received surveys entered the survey data into a database for analysis and developed an electronic database list of non-respondents for a telephone follow-up survey All surveys were assigned a computer-coded with client codes to facilitate unique identification of each client for follow-up surveys while ensuring privacy
19 The usable sample size includes the stratified sample minus surveys noted as undeliverable by web or phone due to incorrect contact information The accuracy and completeness of the contact information for clients provided by ED Resource offices was much improved for 2010 clients as compared to previous years
Impact Study of Entrepreneurial Development 15Resources ndash 2010-2011
Resource Center
Stratified Sample Size
Usable Sample Size 19
Office of Entreprreneurial DDevelopm ment
Figure 311 shows the distribution oof survey resspondents byy respective EED Resourcee and businesss segment The In-Bussiness segmeent was the laargest segmennt served forr all resourcees The Startt-up segment iis smaller thaan the other segments in part becausee of the narroow definitionn of Start-upss (firms thaat have been in business ffor one year or less)
)20Figure 31 ndash Disstributionn of Resppondents by Segmment (2010 clients)
nn = 10146
Naascent 1143 1306 1800
Staart-up 929 920 111
In-Business
3003 2175 2933
Total 5113 4444 5899
20 Responddents (86) who rreported being in business buut who did not pprovide a valid start date for thhat business wwere not assigneed to a businesss segment Theerefore percenttages of clients iin each businesss segment mayy not equal 100
Impact S tudy of Entrepren neurial Develop pment Resource es ndash 2010-2011 1
16
Office of Entrepreneurial Development
Data Analysis
Analyses included the following methods basic descriptive statistics frequency distributions cross tabulations and regression Concentrance used basic descriptive statistics for continuous variables such as annual sales revenues We used frequency distributions for Likert scales and respondents answered on a scale of 1 to 5 Cross-tabulations were used to compare responses across ED Resources business segments and hours of counseling received Finally Concentrance used multiple regression analyses to test for differences in key outcomes such as perceived usefulness or financial impact of ED Resource assistance based on demographic or firm characteristics We selected these analyses to meet the objectives of each research question and to facilitate interpretation of findings For this yearrsquos study revenue and employment calculations were completed using mean data instead of median data which was utilized for previous yearsrsquo studies
Analysis of Non-Response
SBArsquos research plan for this study included a methodology for estimating potential non-response bias Non-response bias can occur in survey research if respondents differ substantially from those that do not respond The best way to protect against this bias is to improve the response rate An effective method for achieving high response rates is the use of follow-ups and reminders In this study non-response bias was minimized by sending four reminder emails containing a link to the survey and minimized further by telephone follow-ups to non-respondents
We assessed the extent and direction of potential non-response bias by comparing the characteristics of clients who responded to the internet survey with those who did not Of the 10146 total clients surveyed 8146 were surveyed over the web The remaining clients (2000) were surveyed over the phone Clients surveyed over the phone were more likely to report revenue and employment figures Additionally these results hold when other respondent characteristics are controlled for (ED Resource Business Segment and Hours of Counseling Received)21
The next step was to conduct a comparative analysis of the responses between these groups to determine if the difference in response rates would have an impact on our analyses Results of regression analyses revealed no significant differences between these groups in terms total number of employees There was a significant difference in revenue found between phone and web respondents However only a very small portion of the total variance in revenue (02) is explained by this difference 22
21 These findings were based on results of four logistic regression analyses to determine whether web versus phone respondents differed significantly in terms of missing revenues and missing employment data The models were significant at the plt0001 level and the variable indication phone response was always significant at the plt0001 level 22 These findings were based on results of a regression analysis to determine whether web versus phone respondents differed significantly in terms of number of employees where a positive number of total employees are reported A scheffe test reveals no significant difference between phone and web at the 010 level The t-test associated with the regression analysis reveals a non-significant result (t=-161 p=01075) A second regression was performed to determine whether web versus phone respondents differed significantly in terms of reported sales revenues greater than or equal to 1000 A scheffe test for this difference revealed a significant difference between phone and web at the 005 level The t-test associated with the regression analysis reveals a significant result also (t=256 p=00106) The R-square value associated with this model is 0002
Impact Study of Entrepreneurial Development 17Resources ndash 2010-2011
Office of Entrepreneurial Development
Additionally the difference in phone and web respondents was tested against perceived service usefulness Although a significant difference in the service variate was found only a small portion of the variance of each of the service measures can be explained by the difference between phone and web respondents Similar results were found with the perceived value of the information the respondents received 23 Because the evidence of response bias is minimal the phone and web respondents were pooled in subsequent analyses Follow-up Study 2008 and 2009 ndash Sampling Data Collection and Analysis of Non-Response A follow-up study was conducted of both 2008 and 2009 clients in order to evaluate the financial impact on these groups one year and two years after they were counseled by ED Resources There were 854 clients from 2008 that were contacted for a second follow-up in the beginning of 2011 Two-hundred clients responded to this second follow-up which represents a 23 response rate Each of these respondents had valid client codes that could be matched on a one-to-one basis with the initial impact survey respondents Thus for a sample of 200 clients there were detailed data which could be tracked for three years There were 8493 respondents to the initial impact survey of 2009 clients Of those contacted 1968 responded to the survey and provided detailed data that could be tracked for two years Table 32 shows the number of surveys received by total ED Resources and the total response rates
Table 32 ndash Follow-up Impact Study Clients
Client Year Stratified
Sample Size Useable
Sample Size Follow-
up Surveys Received
in 2008 Response
Rate
2008 854 854 2nd 200 23
2009 8493 8493 1st 1968 23
These matched samples were used to perform pair-wise statistical tests that compared changes in growth by business segment and by ED Resource Although there were a small number of observations available for this analysis these findings provide a more precise estimate of changes in revenues and employment over time than aggregate non-matched comparisons
23 These findings were based on results of two multivariate regression analyses and a series of simple linear regression analyses to determine whether web versus phone respondents differed significantly in terms of the reported perceived service usefulness and value of information received The Wilkesrsquo Lambda value is significant for both multivariate analyses indicating there is some linear combination of the perceived usefulness measures and perceived value of received information that is explained by the difference in phone vs web respondents The R-square values of the six individual measures of service and information predicted by the difference in phone vs web respondents was explored These values are range from 00084 to 00238
Impact Study of Entrepreneurial Development 18Resources ndash 2010-2011
Office of Entrepreneurial Development
Limitations
There are several limitations that should be considered when interpreting the results presented in this report These limitations are inherent in the research design and methodology
Measures included in this initial survey are primarily attitudinal and all items are self-reported Thus there are few objective measures that can be used to assess actual client performance or make comparisons with other data sources
Many respondents did not report revenue data which is critical to measuring growth from year-to-year For example out of Start-up and In-Business firms approximately 39 reported zero revenues or did not report revenues
Estimates of firm survival and growth over time should be interpreted with caution Due to attrition firms which have gone out of business may be under-represented
Impact Study of Entrepreneurial Development 19Resources ndash 2010-2011
Office of Entrepreneurial Development
[This page is intentionally left blank for two-sided printing]
Impact Study of Entrepreneurial Development 20Resources ndash 2010-2011
Office of Entrepreneurial Development
IV TOTAL ED RESOURCES 2008 - 2009 - 2010
The following section presents comparison results of face-to-face counseling clients from 2008 2009 and 201024 First the general demographic and financial characteristics of the total ED Resource clients are presented This is followed by additional findings on the impact of the total ED Resources on Nascent Start-up and In-Business firms organized by research question as follows
Is there a relationship between servicesassistance provided by ED Resources (SBDC SCORE and WBC) and the clientrsquos perception of the usefulness and value of servicesassistance received
Is there a relationship between the servicesassistance provided by ED Resources (SBDC SCORE and WBC) and the clientrsquos decision to start a business
Is there a relationship between the servicesassistance provided by ED Resources (SBDC SCORE and WBC) and the clientrsquos decision to implement andor change management andor marketing practices in their business
Are the servicesassistance provided by ED Resources (SBDC SCORE and WBC) having an impact on the clientrsquos financial position in terms of job creation job retention and sales
Please note that comparisons between the 2008 2009 and 2010 initial study clients should be interpreted with caution Concentrance collected cross-sectional data from a different set of firms each year and these firms were operating under different economic conditions To better understand changes over time the follow-up study included in this report tracks the same firms over a three year period
24 All references to ED Resource clients pertain to ED Resource Partnersrsquo face-to-face counseling clients who received assistance from a designated ED Resource Partner (SBDCSCOREWBC)
Impact Study of Entrepreneurial Development 21Resources ndash 2010-2011
Office of Entrepreneurial Development
Demographic Characteristics of ED Resource ClientsThis section describes the general demographic and financial characteristics of total ED Resource clients that were served in 2010 These results are based on an analysis of 10146 completed surveys As shown in Figure 41 the In-Business segment (54) was the largest business segment served by ED Resources in 2010 The size of the In-Business segment remained consistent with the previous year The Start-up segment increased for the third year in a row though the change is in part due to the revised definition of Start-up businesses
Figure 41 ndash Total ED Resources ndash Client Segments Served25
2008 n = 6770 2009 n = 8493 2010 n = 10146
The average annual revenue for ED Resourcesrsquo clients was $637200
Table 41 ndash Total ED Resources-Revenues and Employment26 (2010)
Total ED Resources
Average Revenue $637200
Average Employees 4
25 Respondents (86 for 2010) who reported being in business but who did not provide a valid start date for that business were not assigned to a business segment Therefore the total of client segments served for each year may not equal 100 26 Firms that reported revenues were required to do so within the range of $1000 to $25000000
Impact Study of Entrepreneurial Development 22Resources ndash 2010-2011
Total ED Resources
Rev 2008 $634000 $818400 $229500
Rev 2009 $855300 $728400 $311200
Rev 2010 $774000 $502000 $171300
Empl 2008 7 7 5
Empl 2009 7 6 4
Empl 2010 5 3 3
Office of Entrepreneurial Development
ED Resources continued to differ in terms of the size of firms they served as shown in Figure 42 Again this year SBDC continues to serve the highest revenue clients ($774000 average) followed by SCORE ($502000 average) and WBC ($171300 average) All three of ED Resourcesrsquo clients reported lower average annual revenues than those assisted in 2009 Average employment reported by SBDC SCORE and WBC clients was also lower than clients served in 2009 in all cases especially SCORE In terms of revenues WBC serves a distinct client base from both SBDC and SCORE however SBDC and SCORE do not serve distinct client bases in terms of revenue27
Figure 42 ndash Total ED Resources ndash Revenue and Employment (Average ED client Revenues and Number of Employees)
27 We used a Scheffe test to examine the pair-wise differences to control for the familywise error rate We found significant revenue differences (95 confidence) between WBC and SBDC as well as between WBC and SCORE groups No other significant differences were found
Impact Study of Entrepreneurial Development 23Resources ndash 2010-2011
Office of Entrepreneurial Development
Figure 42A examines the average revenues by the hours of counseling received28 to understand the relationship between client revenues and resource utilization The data shows that clients from SBDC SCORE and WBC that received a greater number of hours of counseling tended to be larger in size For example average revenues for SCORE clients who received less than 3 hours of counseling were $336400 while average revenues for clients who received 3 or more hours of counseling were $618300 This trend is also apparent with SBDC clients where the difference between clients that received 5 or more hours of counseling and those that received from 3 to less than 5 hours of counseling is $148700 The overall average revenues regardless of hours of counseling indicated by the black cross bars in the figure below were $774000 for SBDC 502000 for SCORE and 171300 for WBC
Figure 42A ndash Total ED Resources ndash Revenues by Hours of 29 Counseling
Aggregate Hours Mean Revenue
($502000)
($774000)
($171300)
($637200)
28 For each ED Resource the number of respondents is comparable for each category of hours of counseling received SBDC lt 3 hrs = 1668 ge 3 amp lt 5 hrs = 1668 ge 5 hrs = 1777SCORE lt 3 hrs = 2219 ge 3 hours= 2225WBC lt 3 hrs = 297 ge 3 hours= 292 29 SBDC reports hours of counseling in three categories (lt 3 ge3 to lt5 ge 5) whereas SCORE and WBC report two categories (lt 3 ge 3) SCORE and WBC also provide 5 or more hours of counseling to their clients and these hours are captured in the 3 or more hours of counseling category When comparing ED Resources by hours of counseling those clients receiving 3 or more hours of counseling from SBDC reported average revenues of $843500
Impact Study of Entrepreneurial Development 24Resources ndash 2010-2011
Office of Entrepreneurial Development
Figure 43 presents the demographic characteristics of ED Resource clients in terms of gender race ethnicity and veteran status30 A new category was added to the survey for this year For the first time clients were able to select ldquoMale and Female Ownersrdquo as an answer to the gender of the owner(s) question (See Appendix 4 for a complete survey instrument) Predictably both Male and Female categories dropped sharply from last yearrsquos numbers The proportions of the majority of the race and ethnicity categories have not changed from the previous year with the exception of a reduction in the number of Whites31 Figure 43 ndash Total ED Resources ndash Demographic Characteristics32
2008 n = 6770 2009 n = 8493 2010 n = 10146
30 The Veteran and Service-disabled Veteran categories are shown in the figure above Additional results for total ED Resource clients included Reservist (03) and National Guard Member (04) 31 Just over 16 of survey respondents did not answer the race questions whereas 45 answered last year Therefore the drop in in the number of Whites may be due to non-responses and not reflective of the actual population 32 Totals may not equal 100 due to non-respondents and respondents who selected multiple ethnicities The 2010 total ED Resources demographic distribution was compared to the national averages from the 2007 Survey of Business Owners from the Census Bureau (SBO) The distribution was comparable across characteristics except for the following SBO figures White business owners were 83 of the small business population Female business owners were 29 and Male business owners were 51
Impact Study of Entrepreneurial Development 25Resources ndash 2010-2011
Office of Entrepreneurial Development
Figure 44 shows the distribution of ED Resource clients by age of business owner The largest groups of ED Resource clients belonged to the 45 to 54 and 35 to 44 age categories 28 and 22 respectively This outcome is consistent with the previous years depicted in the figure Both the 18-24 and 25-34 age categories increased slightly from the previous year Differences in findings from the previous year may be due to an increased number of clients that did not respond to the corresponding survey question for age33
Figure 44 ndash Total ED Resources ndash Age of Business Owner34
2008 n = 6770 2009 n = 8493 2010 n = 10146
33 Survey questions can be found in the survey instrument in Appendix 4 q18 requests the clientsrsquo age Eleven percent did not respond to the age question for this yearrsquos study Last year only two percent did not respond 34 The 2010 total ED Resources age distribution was compared to the national averages from the SBO The distribution was comparable except that SBO reported 65+ at 125 (compared to 5 for ED Resources)
Impact Study of Entrepreneurial Development 26Resources ndash 2010-2011
Office of Entrepreneurial Development
As shown in Figure 45 the two highest reported business types besides ldquoOtherrdquo businesses served by ED Resources were the service and retail businesses35 These results are generally consistent with the national averages from the 2007 Survey of Business Owners (SBO) Results that were not consistent included Manufacturing reported in the SBO to be 2 Construction reported to be 13 and Health Care reported to be 936 Also the figure depicts the percentage of clients in the other category as having increased over the past three years
Figure 45 ndash Total ED Resources ndash Primary Business Type37
2008 n = 6770 2009 n = 8493 2010 n = 10146
35 The top 11 results for 2010 are displayed in the figure above Additional results included Finance Insurance and Real Estate (3) Education (3) Entertainment (2) Engineering (1) Transportation (1) Publishing (1) and Day Care (1) 36 Other findings that differed from SBO results included Finance Insurance and Real Estate (14) and Transportation (5) Industry classifications are not identical 37 Several groupings were found to be present among those respondents who classified their business type as ldquoOtherrdquo These included multiple responses for non-profits designart related professions and beauty related professions Due to non-responses the total for all business types may not equal 100
Impact Study of Entrepreneurial Development 27Resources ndash 2010-2011
Office of Entrepreneurial Development
Figure 46 depicts the reasons clients reported seeking business counseling from ED Resources Reputation and lowfree cost of service were the most common reasons for clients to seek assistance from ED Resources SBDC clients reported lowfree cost of service as the most common reason (50) but rated reputation of the ED Resource and referral as equally strong reasons (44) In contrast to the total ED Resources SCORE clients reported that reputation (55) was a stronger reason for seeking assistance than was lowfree cost of service (52) and WBC clients reported that referrals (44) were more often a reason for their seeking assistance as opposed to reputation (40)
Figure 46 ndash Total ED Resources ndash What led to your decision to seek business counseling from ED Resources38
n = 10146
38 The totals do not equal 100 due to respondents selecting multiple factors This figure compares results by individual ED Resource therefore corresponding figures are not repeated in the individual ED Resource sections of this report
Impact Study of Entrepreneurial Development 28Resources ndash 2010-2011
Office of Entrepreneurial Development
Resource Impacts
Usefulness and Value of Services or Assistance Received
As shown in Figure 47 below 73 of 2010 ED Resource clients reported that the information they received from their counselor was valuable
Figure 47 ndash Total ED Resources ndash How useful was the information you received39
2008 n = 6770 2009 n = 8493 2010 n = 10146
39 Low value includes the lsquoSomewhat Valuablersquo and lsquoNot Valuablersquo response categories High value includes the lsquoExtremely Valuablersquo and lsquoValuablersquo response categories Percentages will not total 100 due to non-response
Impact Study of Entrepreneurial Development 29Resources ndash 2010-2011
Office of Entrepreneurial Development
Figure 47A shows the perceived usefulness of ED Resources relative to the number of hours of counseling received recorded in two categories less than 3 hours and 3 or more hours For comparison the overall level of perceived usefulness is also provided in the figure but this segment does not distinguish usefulness by hours of counseling received
As illustrated below ED Resource clients who had three or more hours of counseling rated usefulness of ED Resources as ldquohighrdquo more often than those who had less than three hours of counseling40 Seventy-six percent of clients who received 3 or more hours of counseling rated the usefulness of total ED Resources as ldquohighrdquo versus 69 of those that received less than 3 hours of counseling
Figure 47A ndash How useful was the information you received Total ED Resources by Hours of Counseling vs Total ED Resources Aggregate Hours
40 This finding is supported by the regression analysis beginning on page 39
Impact Study of Entrepreneurial Development 30Resources ndash 2010-2011
Office of Entrepreneurial Development
Decision to Start a Business
Figure 48 depicts the perceived assistance of ED Resources with the clientrsquos decision to start a business These results are presented by individual ED Resource and total ED Resources Results for Nascent and Start-up firms are reported in each category41 Across SBDC SCORE and WBC the relationship between Nascent and Start-up clients remained consistent Start-up clients more often indicated that they decided to go into business as a result of the assistance they received from their respective ED Resource center than Nascent clients
Figure 48 ndash Total ED Resources ndash Did you decide to go into business as a result of the assistance you received42
n = 4589
41 The corresponding survey question for this figure asked ldquoIf you were not in business at the time you were assisted by the counselor did you decide to go into business as a result of that assistancerdquo Therefore In-Business clients were not observed because these clients were in business at the time they received counseling 42 This figure compares results by individual ED Resource therefore corresponding figures are not repeated in the individual ED Resource sections of this report
Impact Study of Entrepreneurial Development 31Resources ndash 2010-2011
Office of Entrepreneurial Development
Clientsrsquo Decision to Change Management Practices
As a result of ED Resource assistance for 2010 clients 57 of Start-up and 62 of In-Business firms changed their current management practices or strategies The percentage of Start-up firms reporting that they changed their management practices or strategies has decreased slightly over the past three years The frequency of In-Business firms reporting changes in management practices or strategies remained consistent from 2009
Table 42 ndash ED Resources Impact on Managerial Practices
Impact Study of Entrepreneurial Development 32Resources ndash 2010-2011
Changed Current Management PracticesStrategies
2008 Clients 2009 Clients 2010 Clients
Changed Current Management PracticesStrategies
2008 Clients 2009 Clients 2010 Clients
Start-up 60 59 57
In-Business 61 62 62
Office of Entrepreneurial Development
Figure 49 below reflects the percentage of firms reporting that ED Resource assistance led to the development of business plans marketing plans etc The frequency of ED Resource clients reporting they received assistance with a Web-based Strategy Financial Strategy Marketing Plan or Pricing Strategy has risen over the past three years of this study The Loan Package category has diminished steadily over the past three years from 12 in 2008 to 8 for 2010
Figure 49 ndash Total ED Resources ndash Assistance in Plan Development43
43 The 2010 results for the top 11 categories are displayed in the figure above Additional results for 2010 included hiring plan (5) purchasing strategy (4) production plan (4) training plan for staff (4) distribution plan (3) and international trade (1) For the 2010 study (2009 clients) the category of e-commerce changed to web-based strategy The 2008 results from that category are still used for comparison
Impact Study of Entrepreneurial Development 33Resources ndash 2010-2011
Office of Entrepreneurial Development
Sales Job Creation and Job Retention
Figure 410 presents findings on the attitudes toward the financial impact of ED Resource assistance irrespective of clientsrsquo reasons for seeking assistance The frequency of ED Resource clients that indicated they were able to increase profit margin retain current staff hire new staff or increase sales as a result of ED Resource assistance was lower for each category when compared to the previous year The number of 2010 ED Resource clients indicating impactful assistance in each category decreased from the previous year The retaining current staff and increased sales categories each experienced a four percentage point decrease
Figure 410 ndash Total ED Resources ndash Perceived Impact of Assistance44
2008 n = 6770 2009 n = 8493 2010 n = 10146
44 See Appendix 2 for a more detailed response to q4 In addition to the reported findings in the figure above data was also collected for 2010 clientsrsquo perceived impact of assistance regarding the acquisition of a bank loan (16) a SBA guarantee loan (18) and a SBA Disaster loan (18)
Impact Study of Entrepreneurial Development 34Resources ndash 2010-2011
Office of Entrepreneurial Development
Figure 410A shows the perceived financial impact of ED Resources relative to the number of hours of counseling received recorded in two categories less than 3 hours and 3 or more hours of counseling received For comparison the overall level of perceived financial impact is also provided which does not distinguish by hours of counseling
It is notable that across all four categories ED Resource clients with 3 or more hours of counseling reported a greater positive financial impact than total ED Resource clients
For example clients that received 3 or more hours of counseling increased their sales 30 of the time whereas clients that received less than 3 hours of counseling increased their sales 19 of the time
Figure 410A ndash Total ED Resources ndash Perceived Impact of Assistance (Hours of Counseling Received vs Aggregate Hours)
Total ED Resources (ge 3 Hours)
Total ED Resources (Aggregate Hours)
Total ED Resources (lt 3 Hours)
Impact Study of Entrepreneurial Development 35Resources ndash 2010-2011
Office of Entrepreneurial Development
Cross-Sectional Demographic Analysis
This section compares revenues and employment for ED Resource clients by gender race ethnicity and veteran status Figure 411 compares average revenues for firms in each demographic category rounded to the nearest $1000 For example this figure shows that in 2010 firms owned by Females ($385000) were on average smaller than firms owned by Males ($778000) and firms owned by Males and Females ($767000)
Veteran-owned firms had an average of $1035000 in revenue the highest revenues by Veterans in the past three years Over the past year reported revenues for Service-disabled Veterans fell to an average of $727000 Regarding race and ethnicity average revenues fell across all demographic categories
Figure 411 ndash Revenues (000s) for Firms in Selected Demographic Categories45
45 Firms that reported revenues were required to do so within the range of $1000 to $25000000 Due to small sample sizes corresponding figures are not repeated in the individual ED Resource sections of this report
Impact Study of Entrepreneurial Development 36Resources ndash 2010-2011
Office of Entrepreneurial Development
Figure 412 compares employment by demographic category Firms owned by Female clients tended to have fewer employees than firms owned by Male clients however firms with both male and female owners a new category for this year had the highest average employment levels in the gender segment This new category also partially explains the drop in average number of employees for both male firms and for female firms HispanicLatino White and American IndianAlaskan Native firms had more employees than other race and ethnicity demographic categories In each category of firms the average number of employees has gone down from 200946
Figure 412 ndashTotal Employees for Firms in Selected Demographic Categories
46 Due to the small sample size of Service-disabled veterans (42) who reported having employees 2009 results should be treated with caution Due to small sample sizes corresponding figures are not repeated in the individual ED Resource sections of this report
Impact Study of Entrepreneurial Development 37Resources ndash 2010-2011
Office of Entrepreneurial Development
Regression Analysis of the Effects of Gender Race Ethnicity and Veteran Status on Key ED Resource Impacts
The following section presents findings from an analysis of the effects of firm and client characteristics on ED Resource impacts We report results from a series of multiple regression analyses These were conducted to test whether respondents differed significantly in perceived usefulness quality of counseling experience and financial impacts of ED Resource assistance based on selected firm (revenues business segment ED Resource contact hours) and demographic (age gender race ethnicity veteran status) characteristics
These analyses address the following research questions
1 Are there differences in perceived usefulness based on firm size business segment ED Resource geographic location hours of counseling age of owner(s) gender race ethnicity or veteran status
2 Are there differences in perceived assistance with the decision to start a business based on firm size business segment ED Resource geographic location hours of counseling age of owner(s) gender race ethnicity or veteran status
3 Are there differences in the financial impact of ED resource assistance based on firm size business segment ED Resource geographic location hours of counseling age of owner(s) gender race ethnicity or veteran status
Each regression model examined the impact of selected demographic characteristics (age gender race ethnicity and veteran status) and firm characteristics (size business segment ED Resource geographic location hours of counseling received) on a particular resource impact These impacts included perceived usefulness of ED Resource assistance perceived quality of the counseling experience perceived assistance with the decision to start a business and perceived financial impacts (sales cash flow hiring and profits)
Each resource impact is used as a dependent (ie outcome) variable For example the dependent variable for the first model is perceived usefulness of ED Resource assistance The dependent variable for the second model is perceived quality of the counseling experience The dependent variable for the third model is perceived assistance with the decision to start a business The dependent variable for the fourth model is a financial impact score which is a summary measure based on 4 self-reported financial impact measures (the effect of assistance on increases in sales cash flow new hires and profit margins)47
47 Consistent with previous analyses this scale is the sum of the following questionnaire items q51 q52 q55 and q57 Survey questions can be found in the survey instrument in Appendix 4
Impact Study of Entrepreneurial Development 38Resources ndash 2010-2011
Office of Entrepreneurial Development
The set of independent or predictor variables included variables representing the firm and client demographic characteristics include the following
Sales Revenues Client Segment
o Nascent o Start-Up o In-Business
ED Resource (SBDC SCORE or WBC) Geographic Location (Urban suburban rural) Number of hours of assistance (less than 3 3 or more) Respondent Age Gender Race
o Hispanic o American Indian o Asian o BlackAfrican-American o Native HawaiianPacific Islander
Ethnicity o HispanicLatino
Veteran or Service-disabled Veteran
Regression Results
In the results presented in this section statistically significant predictor variables are identified48
Detailed regression results are presented in Appendix 6
The first regression model tested for a relationship between selected firm and client characteristics and the clientrsquos perception of the usefulness of the servicesassistance received 49
Results of this regression suggest that larger firms reported higher levels of perceived usefulness of ED Resource assistance than smaller firms Firms who received less than 3 hours of assistance reported lower levels of perceived usefulness than firms with 3 or more hours of counseling Additionally firms in the In-business segment also reported significantly higher perceived usefulness from ED resource assistance
In terms of client demographics there were no significant differences in perceived usefulness based on age gender veteran status or ethnicity Native American and White clients
48 Relationships are considered statistically-significant at the 005 level Marginal significance is defined as significant at the 010 level 49 The overall model was statistically significant at the 001 level although the R2 a measure of model fit was very small (00149) Coefficients reported here were significant at the 010 level The usable sample size was 2427 Firms with revenue greater than $5000000 and less than $1000 were removed from all regression analyses as were firms with unknown business segment The revenue upper bound of $5 million was used in order to eliminate bias resulting from potential outliers skewing the distributionrsquos measures of central tendency
Impact Study of Entrepreneurial Development 39Resources ndash 2010-2011
Office of Entrepreneurial Development
reported significantly higher perceived usefulness but there were no other differences based on race
The second regression model tested for a relationship between selected firm and client characteristics and perceived ED resource assistance with the decision to start a business50
Consistent with the previous yearrsquos results this analysis suggests that larger firms firms in the In-Business segment and SCORE clients were less likely to report that their decision to start a business was the result of ED resource assistance However there were no significant differences based on any other firm or client demographic characteristics
The third regression model tested for a relationship between selected firm and client characteristics and the self-reported financial impact of ED Resource assistance These impacts include a combination of increases in sales cash flow hiring of new employees and profits51 These results provided no significant results even at a 010 level indicating that no firm level or client demographic characteristics affected the perception of the financial impact of ED Resource assistance
These regression analyses indicate that both firm and client characteristics can be significant determinants of the clientrsquos perception of the usefulness of the servicesassistance received perceived assistance with the decision to start a business or the financial impact of assistance received
Variations in perceived usefulness perceived assistance with the decision to start a business and financial impacts are due in part to differences in firm size ED Resource and hours of assistance Geographic location did not play a significant role in any regression model In addition in some cases there were significant effects of gender age and ethnicity However none of these effects were consistent across outcomes
50 This model was estimated using a logistic regression analysis due to the binary dependent variable (q1c) The overall model was significant at the plt001 level although the pseudo R2 was small (00884) Coefficients reported here were significant at the 010 level Survey questions can be found in the survey instrument in Appendix 4 51 The overall model was not significant at the 010 level the R2 was extremely small (0008)
Impact Study of Entrepreneurial Development 40Resources ndash 2010-2011
Office of Entrepreneurial Development
V SBDC 2010 VS TOTAL ED RESOURCES
The following section presents results from SBDC clients52 First we report the general demographic and financial characteristics of SBDC 2010 clients This is followed by additional findings on the usefulness of SBDC for Nascent Start-up and In-Business firms organized by research question as follows
Is there a relationship between servicesassistance provided by SBDC and the clientrsquos perception of the usefulness and value of servicesassistance received
Is there a relationship between the servicesassistance provided by SBDC and the clientrsquos decision to start a business
Is there a relationship between the servicesassistance provided by SBDC and the clientrsquos decision to implement andor change management andor marketing practices in their business
Are the servicesassistance provided by SBDC having an impact on the clientrsquos financial position in terms of job creation job retention and sales
52 All references to ED Resource clients pertain to ED Resource Partnersrsquo face-to-face counseling clients who received assistance from a designated ED Resource Partner (SBDCSCOREWBC)
Impact Study of Entrepreneurial Development 41Resources ndash 2010-2011
Office of Entrepreneurial Development
Analysis of the Attitudes of SBDC Clients Regarding the Assistance They Received from SBDC
Demographic Characteristics of SBDC Clients
This section describes the general demographic and financial characteristics of SBDC clients These results are based on an analysis of 5113 completed surveys As shown in Figure 51 the largest business segment served by SBDC is the In-Business segment (59) which is five percentage points higher than total ED Resources
Figure 51 ndash SBDC ndash Distribution of Clients by Segment (2010 Clients)53
SBDC vs Total ED Resources
SBDC n = 5113 Total ED Resources n = 10146
Table 51 compares revenues and employment for SBDC vs total ED Resources These results indicate that SBDC clients have higher revenues than total ED Resource clients
Table 51 ndash SBDC Client Revenues and Employment (2010)
Total ED Total ED SBDC SBDC Resources Resources
Average Revenue $774000 $637200 Average Employees 5 4
53 Respondents who reported being in business but who did not provide a valid start date for that business were not assigned to a business segment Therefore the total of client segments served for SBDC may not equal 100
Impact Study of Entrepreneurial Development 42Resources ndash 2010-2011
Office of Entrepreneurial Development
Demographic characteristics of SBDC clients including gender race ethnicity and veteran status are reported in Figure 5254 The demographic makeup of SBDC was comprised of a smaller percentage of Females and a higher percentage of Males than total ED Resources by four and two percentage points respectively Other demographic proportions followed a pattern similar to those of total ED Resources
Figure 52 ndash SBDC ndash Demographic Characteristics (2010 Clients)55
SBDC vs Total ED Resources
SBDC n = 5113 Total ED Resources n = 10146
54 The Veteran and Service-disabled Veteran categories are shown in the figure above Additional results for SBDC clients included Reservist (03) and National Guard Member (04) 55 The total may not equal 100 due to non-respondents and those who selected multiple ethnicities The SBDC demographic distribution was compared to the national averages from the SBO The distribution was comparable across characteristics except for the following SBO figures White business owners were 83 of the small business population Female business owners were 29 Male business owners were 51 and American IndianAlaskan Native business owners were less than 1
Impact Study of Entrepreneurial Development 43Resources ndash 2010-2011
Office of Entrepreneurial Development
Figure 53 shows the distribution of SBDC clients by age of business owner The largest age group served was between the ages of 45 and 54 (29) SBDC clientsrsquo age distribution was consistent with that of total ED Resources
Figure 53 ndash SBDC ndash Age of Business Owner (2010 Clients)56
SBDC vs Total ED Resources
SBDC n = 5113 Total ED Resources n = 10146
56 The SBDC age distribution was compared to the national averages from the SBO The distribution was comparable across characteristics except that SBO reported 65+ at 125 (compared to 5 for SBDC)
Impact Study of Entrepreneurial Development 44Resources ndash 2010-2011
Office of Entrepreneurial Development
Figure 54 shows that the most common types of businesses served by SBDC were in the service and retail categories57 These results are generally consistent with the national averages from the SBO Results that were not consistent included Manufacturing reported in the SBO to be 2 Construction reported to be 13 and Health Care reported to be 958 Also the figure shows the share of SBDC clients in the manufacturing construction technology and restaurant andor eating and drinking industries was higher than total ED Resources
Figure 54 ndash SBDC ndash Type of Business (2010 Clients) 59
SBDC vs Total ED Resources
57 The top 11 categories for 2010 SBDC clients are displayed in the figure above Additional results included Finance Insurance and Real Estate (3) Education (2) Entertainment (2) Publishing (1) Transportation (1) Engineering (2) Day Care (1) 58 Other SBO results that differed with the findings included Finance Insurance and Real Estate (14) and Transportation (5) Industry classifications are not identical 59 Due to non-responses and multiple business type selections the total for all business types might not equal 100
Impact Study of Entrepreneurial Development 45Resources ndash 2010-2011
Office of Entrepreneurial Development
SBDC Client Attitudes Regarding ED Resource Assistance
Usefulness and Value of Services or Assistance Received
Approximately 74 of SBDC clients reported that the information they received from counselors was valuable60 Figure 55 shows ratings of usefulness of SBDC ED Resources provided by business segment and compared to total ED Resources SBDC Nascent firms rated the usefulness of information somewhat higher than Start-up and In-Business firms Nascent and Start-up clients both highly rated the usefulness of the assistance received more often than did total ED Resource clients
Figure 55 ndash SBDC ndashUsefulness of SBDC (2010 Clients)61
SBDC vs Total ED Resources
60 This result does not appear in the figure above which is displayed by business segment This figure was calculated for SBDC clients overall without regard to business segment 61 Low value includes the lsquoSomewhat Valuablersquo and lsquoNot Valuablersquo response categories High value includes the lsquoExtremely Valuablersquo and lsquoValuablersquo response categories
Impact Study of Entrepreneurial Development 46Resources ndash 2010-2011
Office of Entrepreneurial Development
Figure 55A below shows the perceived usefulness of SBDC assistance based upon the number of hours of counseling received Figure 55A shows that SBDC clients who received 5 or more hours of counseling rated usefulness as ldquohighrdquo more frequently than those SBDC clients who received less than 5 hours of counseling
Figure 55A ndash Usefulness of SBDC SBDC by Hours of Counseling vs Total ED Resources Aggregate Hours (2010 Clients)
Impact Study of Entrepreneurial Development 47Resources ndash 2010-2011
Office of Entrepreneurial Development
Clientsrsquo Decision to Change Management Practices
Figure 56 compares SBDC client decisions to change management practices or strategies by business segment As a result of SBDC assistance 56 of Start-up firms changed their management practices or strategies and 58 of In-Business clients reported changing management practices or strategies The levels of SBDC Start-up and In-Business clients that changed their management practices were slightly below those for total ED Resource clients
Figure 56 ndash SBDC ndash Changed Management PracticesStrategies as a Result of SBDC ED Resource Assistance (2010 Clients)
SBDC vs Total ED Resources
Impact Study of Entrepreneurial Development 48Resources ndash 2010-2011
Office of Entrepreneurial Development
Figure 57 below reflects the percentage of firms reporting that SBDC assistance led to the development of business plans marketing plans etc 62 The percentage of SBDC clients that sought assistance with the development of business plans cash flow analyses or preparation of loan packages was higher than that of total ED Resources
Figure 57 ndash SBDC ndash Assistance in Plan Development (2010 Clients)
SBDC vs Total ED Resources
62 The 2010 results for the top 11 categories are displayed in the figure above Additional results included Hiring plan (5) Purchasing Strategy (4) Production Plan (4) Distribution Plan (3) Training Plan for Staff (4) and International Trade (2)
Impact Study of Entrepreneurial Development 49Resources ndash 2010-2011
Office of Entrepreneurial Development
Sales Job Creation and Job Retention
Figure 58 compares SBDC Start-up and In-Business clients in terms of reported financial impact of SBDC assistance on sales profits jobs and the retention of employees irrespective of reasons for seeking assistance63 SBDC Start-up firms reported lower perceived levels of impact regarding both hiring new staff and retaining current staff when compared to total ED Resources SBDC In-Business clientsrsquo reported financial impact surpassed total ED Resources in each category
Figure 58 ndash SBDC ndash Perceived Impact of Assistance (2010 Clients)
SBDC vs Total ED Resources
63 This comparison excludes the Nascent category for total ED Resources and SBDC
Impact Study of Entrepreneurial Development 50Resources ndash 2010-2011
Office of Entrepreneurial Development
Figure 58A compares SBDCrsquos financial impact of assistance on sales profits jobs and the retention of employees to the financial impact results for total ED Resources presented by hours of counseling received The number of hours of counseling received is divided into three categories for SBDC less than 3 hours from 3 to less than 5 hours and 5 or more hours
SBDC clients who received 5 or more hours of counseling reported greater perceived impact of assistance than total ED Resources in each of the categories below For example 41 of clients that received 5 or more hours of SBDC counseling reported an increase in sales and 34 of clients that received 5 or more hours reported an increase in profit margins Total ED Resources reported 34 and 30 in the same categories respectively
Figure 58A ndash SBDC ndash Perceived Impact of Assistance SBDC Hours of Counseling Received for In-Business and Start-ups vs Total ED Resources Aggregate Hours for In-Business and Start-ups (2010 Clients)
Impact Study of Entrepreneurial Development 51Resources ndash 2010-2011
Office of Entrepreneurial Development
[This page is intentionally left blank for two-sided printing]
Impact Study of Entrepreneurial Development 52Resources ndash 2010-2011
Office of Entrepreneurial Development
VI SCORE 2010 VS TOTAL ED RESOURCES
The following section presents results from SCORE clients64 First we report the general demographic and financial characteristics of SCORE clients as provided by 2010 clients This is followed by additional findings on the usefulness of SCORE for Nascent Start-up and In-Business firms organized by research question as follows
Is there a relationship between servicesassistance provided by SCORE and the clientrsquos perception of the usefulness and value of servicesassistance received
Is there a relationship between the servicesassistance provided by SCORE and the clientrsquos decision to start a business
Is there a relationship between the servicesassistance provided by SCORE and the clientrsquos decision to implement andor change management andor marketing practices in their business
Are the servicesassistance provided by SCORE having an impact on the clientrsquos financial position in terms of job creation job retention and sales
64 All references to ED Resource clients pertain to ED Resource Partnersrsquo face-to-face counseling clients who received assistance from a designated ED Resource Partner (SBDCSCOREWBC)
Impact Study of Entrepreneurial Development 53Resources ndash 2010-2011
Office of Entrepreneurial Development
Analysis of the Attitudes of SCORE Clients Regarding the Assistance They Received from SCORE
Demographic Characteristics of SCORE Clients
This section describes the general demographic and financial characteristics of SCORE clients These results are based on an analysis of 4444 completed surveys As shown in Figure 61 the largest business segment served by SCORE was the In-Business segment (49) which is five percentage points lower than the In-Business segment for total ED Resources The Nascent segment was the second largest at 29 and measures three percentage points higher than total ED Resources
Figure 61 ndash SCORE ndash Distribution of Clients by Segment (2010 Clients)65
SCORE vs Total ED Resources
SCORE n = 4444 Total ED Resources n = 10146
Table 61 compares revenues and employment for SCORE clients vs total ED Resources SCORE client revenues are lower than the average for total ED Resources
Table 61 ndash SCORE Client Revenues and Employment (2010)
Total ED SCORE Resources
Average Revenue $502000 $637200 Average Employees 3 4
65 Respondents who reported being in business but who did not provide a valid start date for that business were not assigned to a business segment The total of client segments served for SCORE will therefore not equal 100
Impact Study of Entrepreneurial Development 54Resources ndash 2010-2011
SCORE Total ED Resources
Office of Entrepreneurial Development
Demographic characteristics of SCORE clients including gender race ethnicity and veteran status are reported in Figure 6266 The demographic distribution of SCORE clients follows closely to the pattern of total ED Resources clients overall The percentage of White clients (70) in SCORErsquos demographic makeup is slightly higher than that of total ED Resources (68)
Figure 62 ndash SCORE ndash Demographic Characteristics (2010 Clients)67
SCORE vs Total ED Resources
SCORE n = 4444 Total ED Resources n = 10146
66 The Veteran and Service-disabled Veteran categories are shown in the figure above Additional results for SCORE clients included Reservist (04) and National Guard Member (04) 67 In some instances the total may not equal 100 due to non-respondents and respondents who selected multiple ethnicities The SCORE demographic distribution was compared to the national averages from the SBO The distribution was comparable across characteristics except for the following SBO figures White business owners were 83 of the small business population Female business owners were 29 and Male business owners were 51
Impact Study of Entrepreneurial Development 55Resources ndash 2010-2011
Office of Entrepreneurial Development
Figure 63 shows the distribution of SCORE clients by age of business owner The largest age group served was between the ages of 45 and 54 (27) SCORE clientsrsquo age distribution was consistent with that of total ED Resources
Figure 63 ndash SCORE ndash Age of Business Owner (2010 Clients)68
SCORE vs Total ED Resources
SCORE n = 4444 Total ED Resources n = 10146
68 The SCORE age distribution was compared to the national averages from the SBO The distribution was comparable except that SBO reported 65+ at 125 (compared to 5 for SCORE)
Impact Study of Entrepreneurial Development 56Resources ndash 2010-2011
Office of Entrepreneurial Development
Figure 64 shows that the most common types of businesses served by SCORE were in the service and retail categories69 These results are generally consistent with the national averages from the SBO Results that were not consistent included Manufacturing reported in the SBO to be 2 Construction reported to be 13 and Health Care reported to be 970 Also the figure shows the share of SCORE clients in the technology restaurant andor eating and drinking industries was lower than total ED Resources
Figure 64 ndash SCORE ndash Type of Business (2010 Clients)71
SCORE vs Total ED Resources
69The top 11 categories for 2010 clients are displayed in the figure above Additional results for 2010 included Finance Insurance and Real Estate (3) Education (3) Entertainment (2) Publishing (1) Transportation (1) Engineering (1) Day Care (1) 70 Other SBO results that differed from the findings included Finance Insurance and Real Estate (14) and Transportation (5) Industry classifications are not identical 71 Due to non-responses and multiple business type selections the total for all business types may not equal 100
Impact Study of Entrepreneurial Development 57Resources ndash 2010-2011
Office of Entrepreneurial Development
SCORE Client Attitudes Regarding ED Resource Assistance
Usefulness and Value of Services or Assistance Received
Approximately 73 of SCORE clients reported that the information they received from counselors was valuable72 Figure 65 shows ratings of usefulness of SCORE provided by business segment and compared to total ED Resources For SCORE clients it is apparent that Start-up clients reported high levels of usefulness regarding the assistance they received somewhat less often when compared to other business segments
Figure 65 ndash SCORE ndashUsefulness of SCORE (2010 Clients)73
SCORE vs Total ED Resources
72 This result does not appear in the figure above which is displayed by business segment This percentage was calculated for SCORE clients overall without regard to business segment 73 Low value includes the lsquoSomewhat Valuablersquo and lsquoNot Valuablersquo response categories High value includes the lsquoExtremely Valuablersquo and lsquoValuablersquo response categories
Impact Study of Entrepreneurial Development 58Resources ndash 2010-2011
Office of Entrepreneurial Development
Figure 65A below shows the perceived usefulness of SCORE assistance based upon the number of hours of counseling received Figure 65A shows that 78 of SCORE clients that received 3 or more hours of counseling rated SCORE usefulness as ldquohighrdquo compared to 68 of clients that received less than 3 hours of counseling
Figure 65A ndash Usefulness of SCORE SCORE by Hours of Counseling vs Total ED Resources Aggregate Hours (2010 Clients)
Impact Study of Entrepreneurial Development 59Resources ndash 2010-2011
Office of Entrepreneurial Development
Clientsrsquo Decision to Change Management Practices
Figure 66 compares SCORE client decisions to change management practices or strategies by business segment As a result of SCORE assistance 58 of Start-up firms changed their management practices or strategies and 67 of In-Business clients reported changing management practices or strategies The levels for SCORE Start-up and In-Business clients that changed their management practices and strategies were higher than those for total ED Resources
Figure 66 ndash SCORE ndash Changed Management PracticesStrategies as a Result of SCORE ED Resource Assistance (2010 Clients)
SCORE vs Total ED Resources
Impact Study of Entrepreneurial Development 60Resources ndash 2010-2011
Office of Entrepreneurial Development
Figure 67 below reflects the percentage of firms reporting that SCORE assistance led to the development of business plans marketing plans etc74 The percentage of SCORE clients that sought assistance with pricing strategies (15) was higher than that of total ED Resources (14) SCORE clients reported receiving assistance somewhat less often than total ED Resources for most other categories
Figure 67 ndash SCORE ndash Assistance in Plan Development (2010 Clients)
SCORE vs Total ED Resources
74 The 2010 results for the top 11 categories are displayed in the figure above Additional results for included Hiring plan (4) Purchasing Strategy (4) Production Plan (3) Distribution Plan (3) Training Plan for Staff (3) and International Trade (1)
Impact Study of Entrepreneurial Development 61Resources ndash 2010-2011
Office of Entrepreneurial Development
Sales Job Creation and Job Retention
Figure 68 compares SCORErsquos Start-up and In-Business clients in terms of the reported financial impact of SCORE assistance on sales profits jobs and the retention of employees irrespective of reasons for seeking assistance75 Twenty-five percent of Start-up clients reported that they were able to increase sales as a result of SCORE assistance compared to 34 for total ED Resources Twenty-one percent and 16 of SCORE In-Business clients reported that they were able to retain current staff and hire new staff respectively slightly higher than total ED Resources (20 and 15)
Figure 68 ndash SCORE ndash Perceived Impact of Assistance (2010 Clients)
SCORE vs Total ED Resources
75 This comparison excludes the Nascent category for total ED Resources and SCORE
Impact Study of Entrepreneurial Development 62Resources ndash 2010-2011
Office of Entrepreneurial Development
Figure 68A compares SCORErsquos financial impact of assistance for increasing sales profits jobs and the retention of employees to the financial impact results for total ED Resources presented by hours of counseling received The number of hours of counseling received is divided into two categories for SCORE less than 3 hours and 3 or more hours It is apparent from the figure below that except for the retain current staff category the greater the number of hours of counseling received the greater the perceived impact of assistance reported by SCORE In-Business and Start-up clients
Figure 68A ndash SCORE ndash Perceived Impact of Assistance SCORE Hours of Counseling Received for In-Business and Start-ups vs Total ED Resources Aggregate Hours for In-Business and Start-ups (2010 Clients)
Impact Study of Entrepreneurial Development 63Resources ndash 2010-2011
Office of Entrepreneurial Development
[This page is intentionally left blank for two-sided printing]
Impact Study of Entrepreneurial Development 64Resources ndash 2010-2011
Office of Entrepreneurial Development
VII WBC 2010 VS TOTAL ED RESOURCES
The following section presents results from WBC clients76 First we report the general demographic and financial characteristics of WBC clients as provided by 2010 clients This is followed by additional findings on the usefulness of WBC for Nascent Start-up and In-Business firms organized by research question as follows
Is there a relationship between servicesassistance provided by WBC and the clientrsquos perception of the usefulness and value of servicesassistance received
Is there a relationship between the servicesassistance provided by WBC and the clientrsquos decision to start a business
Is there a relationship between the servicesassistance provided by WBC and the clientrsquos decision to implement andor change management andor marketing practices in their business
Are the servicesassistance provided by WBC having an impact on the clientrsquos financial position in terms of job creation job retention and sales
76 All references to ED Resource clients pertain to ED Resource Partnersrsquo face-to-face counseling clients who received assistance from a designated ED Resource Partner (SBDCSCOREWBC)
Impact Study of Entrepreneurial Development 65Resources ndash 2010-2011
Office of Entrepreneurial Development
Analysis of the Attitudes of WBC Clients Regarding the Assistance They Received from WBC
Demographic Characteristics of WBC Clients
This section describes the general demographic and financial characteristics of WBC clients These results are based on an analysis of 589 completed surveys As shown in Figure 71 the largest business segment served by WBC is the In-Business segment Fifty percent of WBC respondents were In-Business clients compared to 54 of total ED Resource clients The figure also shows that there was a greater share of WBC clients in the Nascent segment (31) compared to total ED Resources (26)
Figure 71 ndash WBC ndash Distribution of Respondents by Segment (2010 Clients)77
WBC vs Total ED Resources
WBC n = 589 Total ED Resources n = 10146
Table 71 compares revenues and employment for WBC clients vs total ED Resources These results indicate that WBC clients are smaller in terms of revenues and number of employees than total ED Resources combined
Table 71 ndash WBC Client Revenues and Employment (2010)
Total ED WBC Resources
Average Revenue $171300 $637200 Average Employees 3 4
WBC Total ED Resources
77 Respondents who reported being in business but who did not provide a valid start date for that business were not assigned to a business segment The total of client segments served for WBC therefore may not equal 100
Impact Study of Entrepreneurial Development 66Resources ndash 2010-2011
Office of Entrepreneurial Development
Demographic characteristics of WBC clients including gender race ethnicity and veteran status are reported in Figure 7278 Not surprisingly about 62 of WBC clients are Female A noteworthy 24 of WBC clients are BlackAfrican American compared to 11 for total ED Resources HispanicLatino clients represent 8 of WBC clients WBC serves a small share of Veterans (5) and Service-disabled veterans (1)
Figure 72 ndash WBC ndash Demographic Characteristics (2010 Clients)79
WBC vs Total ED Resources
WBC n = 589 Total ED Resources n = 10146
78 The Veteran and Service-disabled Veteran categories are shown in the figure above Additional results for WBC clients included Reservist (02) and National Guard Member (00) 79 In some instances the total percentage might not equal 100 due to non-respondents and respondents who selected multiple ethnicities The WBC demographic distribution was compared to the national averages from the SBO The distribution was comparable across characteristics except for the following SBO figures White business owners were 82 of the small business population BlackAfrican American business owners were 12 and Asian business owners were 7
Impact Study of Entrepreneurial Development 67Resources ndash 2010-2011
Office of Entrepreneurial Development
Figure 73 shows the distribution of WBC clients by age of business owner The largest age group served was between the ages of 35-44 which accounts for 24 of WBC clients compared to 22 of total ED Resource clients Approximately 44 of WBC clients were between 18 and 44 years of age making WBC the youngest demographic of the three ED Resources
Figure 73 ndash WBC ndash Age of Business Owner (2009 Clients)80
WBC vs Total ED Resources
WBC n = 589 Total ED Resources n = 10146
80 The 2010 WBC age distribution was compared to the national averages for women-owned businesses from the SBO The distribution was comparable except for the following SBO figures 25-34 was 11 (compared to 18 for WBC) and 65+ was reported at 10 (compared to 5 for WBC)
Impact Study of Entrepreneurial Development 68Resources ndash 2010-2011
Office of Entrepreneurial Development
Figure 74 shows that the most common types of businesses served by WBC besides other were in the service and retail categories81 These results are generally consistent with the national averages from the SBO for women-owned firms Results that were not consistent included Health Care reported to be 16 in the SBO and Manufacturing reported in the SBO to be 182 The figure also shows the share of WBC clients in the service retail and consulting industries was higher than that of total ED Resources while the share of clients in the manufacturing construction technology and health care industries was lower than total ED Resources
Figure 74 ndash WBC ndash Type of Business (2010 Clients)83
WBC vs Total ED Resources
81 The top 11 categories for 2010 clients are displayed in the figure above Additional results included Finance Insurance and Real Estate (4) Education (3) Entertainment (1) Publishing (1) Transportation (3) Engineering (1) Day Care (2) 82 Other SBO results that differed from the findings included Finance Insurance and Real Estate (11) Industry classifications are not identical 83 Due to non-responses and multiple business type selections the total for all business types might not equal 100
Impact Study of Entrepreneurial Development 69Resources ndash 2010-2011
Office of Entrepreneurial Development
WBC Client Attitudes Regarding ED Resource Assistance
Usefulness and Value of Services or Assistance Received
Approximately 72 of WBC clients reported that the information they received from counselors was valuable84 Figure 75 shows ratings of usefulness of WBC provided by business segment and compared to total ED Resources WBC Nascent clients more often rated assistance as useful (78) than did total ED Resources (73) Start-up and In-Business clients rated assistance as useful less often (68) than total ED Resources
Figure 75 ndash WBC ndash Usefulness of WBC (2010 Clients)85
WBC vs Total ED Resources
84 This result does not appear in the figure above which is displayed by business segment This percentage was calculated for WBC clients overall without regard to business segment 85 Low value includes the lsquoSomewhat Valuablersquo and lsquoNot Valuablersquo response categories High value includes the lsquoExtremely Valuablersquo and lsquoValuablersquo response categories
Impact Study of Entrepreneurial Development 70Resources ndash 2010-2011
Office of Entrepreneurial Development
Figure 75A below shows the perceived usefulness of WBC assistance based upon the number of hours of counseling received Figure 75A shows that 76 of WBC clients that received more than 3 or more hours of counseling rated WBC usefulness ldquohighrdquo as compared to 69 of clients that received less than 3 hours of counseling
Figure 75A ndash Usefulness of WBC WBC by Hours of Counseling vs Total ED Resources Aggregate Hours (2010 Clients)
WBC vs Total ED Resources
Impact Study of Entrepreneurial Development 71Resources ndash 2010-2011
Office of Entrepreneurial Development
Clientsrsquo Decision to Change Management Practices
Figure 76 compares WBC client decisions to change management practices or strategies by business segment As a result of WBC assistance 62 of Start-up clients and 64 of In-Business clients reported changing their management practices or strategies The percentages of WBC Start-up and In-Business clients that changed their management practices were higher than that of total ED Resource clients
Figure 76 ndash WBC ndash Changed Management PracticesStrategies as a Result of WBC ED Resource Assistance (2010 Clients)
WBC vs Total ED Resources
Impact Study of Entrepreneurial Development 72Resources ndash 2010-2011
Office of Entrepreneurial Development
Figure 77 below reflects the percentage of firms reporting that WBC ED Resource assistance led to the development of business plans marketing plans etc86 The percentage of WBC clients that sought assistance with in the Other category (7) was less than that of total ED Resources (8) WBC clients reported receiving assistance as often or more often than total ED Resources for all other categories
Figure 77 ndash WBC ndash Assistance in Plan Development (2010 Clients)
WBC vs Total ED Resources
86 The 2010 results for the top 11 categories are displayed in the figure above Additional results included Hiring plan (5) Purchasing Strategy (4) Production Plan (4) Distribution Plan (3) Training Plan for Staff (3) and International Trade (2)
Impact Study of Entrepreneurial Development 73Resources ndash 2010-2011
Office of Entrepreneurial Development
Sales Job Creation and Job Retention
Figure 78 compares WBC Start-up and In-Business clients in terms of the reported financial impact of WBC assistance on sales profits jobs and the retention of employees irrespective of reasons for seeking assistance87 Start-up and In-Business clients reported that WBC assistance resulted in increased profit margin and increased sales substantially more often than total ED Resource clients For example 39 of Start-up clients and 42 of In-Business clients reported an increase in sales as compared to 34 of total ED Resources
Figure 78 ndash WBC ndash Perceived Impact of Assistance (2010 Clients)
WBC vs Total ED Resources
87 This comparison excludes the Nascent category for total ED Resources and WBC
Impact Study of Entrepreneurial Development 74Resources ndash 2010-2011
Office of Entrepreneurial Development
Figure 78A compares WBCrsquos financial impact of assistance on sales profits jobs and the retention of employees to the financial impact results for total ED Resources presented by hours of counseling received The number of hours of counseling received is divided into two categories for WBC less than 3 hours and 3 or more hours
Clients that received 3 or more hours of counseling reported higher impact in all categories compared to clients who received less than 3 hours of counseling The largest disparity occurred in the retain current staff category where there was a difference of 17 percentage points between clients who received 3 or more hours and those who received less than 3 hours
Figure 78A ndash WBC ndash Perceived Impact of Assistance WBC Hours of Counseling Received for In-Business and Start-ups vs Total ED Resources Aggregate Hours for In-Business and Start-ups (2010 Clients)
Impact Study of Entrepreneurial Development 75Resources ndash 2010-2011
Office of Entrepreneurial Development
[This page is intentionally left blank for two-sided printing]
Impact Study of Entrepreneurial Development 76Resources ndash 2010-2011
Office of Entrepreneurial Development
VIII FOLLOW-UP STUDY RESULTS 2008 amp 2009 CLIENTS In this section Concentrance reports findings from our analysis of follow-up surveys of 2008 and 2009 ED Resource clients88 These follow-up surveys were conducted in order to examine the impact of ED Resource assistance over time This yearrsquos follow-up study of 2008 ED Resource clients represents the second follow-up study of this sample The first follow-up survey of this group was conducted as part of the previous yearrsquos study in 2010 The follow-up study of 2009 ED Resource clients is the first follow-up study of these clients
This analysis addresses the following key research questions
What was the rate of transition of Nascent and Start-up firms to the In-Business segment Based on a comparison with the Panel Study of Entrepreneurial Dynamics II89 (PSED II)
what is the impact of ED Resource assistance on firm survival What was the financial impact of servicesassistance provided by SBA ED Resources in
terms of job creation job retention and sales How does the difference in growth rate of ED Resource clients from 2009 to 2010 compare
with key benchmarks such as the gross domestic product (GDP) the Entrex Private Company Index (PCI) and the Standard and Poorrsquos Small Cap Index90
Follow-up Methodology
There were 6770 respondents to the Initial Economic Impact Survey of 2008 clients Of these Concentrance was able to collect follow-up data from 854 respondents These respondents were re-contacted for the second follow up survey Of these Concentrance was able to collect follow-up data from 200 respondents for which detailed data can be tracked to 2011
There were 8493 respondents to the Initial Impact Survey of 2009 clients Of these Concentrance was able to collect follow-up data from 1968 respondents for which detailed data can be tracked to 2011
2008 Clients Sample Size Response Rate Initial Study 6770 29 1st Follow-up 854 13 2nd Follow-up 200 23 2009 Clients Sample Size Response Rate Initial Study 8493 23 1st Follow-up 1968 23
88 All references to ED Resource clients pertain to ED Resource Partnersrsquo face-to-face counseling clients who received assistance from a designated ED Resource Partner (SBDCSCOREWBC) 89 The Panel Study of Entrepreneurial Dynamics II is a nationwide multi-million dollar survey of nascent entrepreneurs funded by the Kauffman Foundation The primary purpose of the study is to identify adults active in business creation obtain detailed information about the start-up effort and perform follow-up interviews to determine outcomes We rely on the PSED I and PSED II as benchmarks however results must also be interpreted with caution due to potential response bias and definitional differences in the ways that firms are classified 90 The three benchmarks used for comparison of SBA ED Resources are GDP - Source httpwwwbeagovnationalxlsgdpchgxls the Private Company Index (PCI) - published by Entrex this index measures revenue performance in the sector of private companies ranging from $3 million to $60 million in annual revenues (httpwwwprivatecompanyindexcom) and the S amp P SmallCap 600 Index - represents approximately 3 of the US market and includes 600 lsquosmall caprsquo companies with market capitalizations between $300 million and $2 billion The SampP SmallCap 600 Index is a commonly used benchmark for growth
Impact Study of Entrepreneurial Development 77Resources ndash 2010-2011
y
f
Office of Entreprreneurial DDevelopm ment
Changess in Businesss Segmentss from 2009 tto 2011
What is tthe rate of trransition of Nascent annd Start-up firms to thee In-Businesss segment
Figure 811 shows the mmovement oof firms fromm their initial segments to the In-Businness segmentt in 2011 Foor example 557 of 2008 Nascent clients had startted businessees by 2011 FFor 2008 clieents that weree initially in thhe In-Busineess segment 994 remaineed in businesss in 2011 AAdditionally Figure 811 shows the mmovement oof firms fromm their initial 2009 client ssegment to thhe In-Busineess segment iin 2011 Forr example 299 of 2009 NNascent cliennts had transiitioned into tthe In-Businness category bby 2011 By comparisonn according tto a study by Reynolds annd Curtin (20008)91 approximmately 19 of nascent enttrepreneurs inn the PSED II had starteed businessess within two yeears of inceptiion
Figure 81 ndash Traansitions and Survvival of 22008 and 2009 Clieents to 20011 In-Bussiness
91 Paul D Reynolds and RRichard T Curttin (2008) ldquoBu siness Creationn in the United States Panel Sttudy of Entrepreneeurial Dynamicss II Initial Asseessmentrdquo Founddations and Trendds in Entrepreneuurship Vol 4 NNo 3 pgs 155ndashndash307
Impact S tudy of Entrepren neurial Develop pment Resource es ndash 2010-2011 1
78
Office of Entrepreneurial Development
Impact of ED Resource Assistance on Firm Survival
Does ED Resource assistance have a positive impact on firm survival
The PSED II data serve as a benchmark for comparing the proportion of Nascent and Start-up businesses that can now be classified as In-Business firms The PSED II is a sample of nascent entrepreneurs who are in the process of going into business a portion of the sample received some form of counseling or assistance
Figure 82 compares the survival rates for firms in the follow-up study with the PSED II92 These results suggest that businesses that received ED Resource assistance had a higher survival rate than other small businesses such as those randomly sampled for the PSED II For example based on the second follow-up study of 2008 ED Resource clients 93 were still in business after two years In contrast only 80 of PSED II firms remained in business after two years93 Similarly in the follow-up study of 2009 ED Resource clients 96 of these firms remained in business after one year compared to 90 of firms in the PSED II sample
In addition to the PSED II analysis ED Resource client survival rates were higher than reported in other studies For example according to a study published in the Monthly Labor Review two-thirds of new employer firms survive at least two years and about 44 survive at least four94
Figure 82 ndash ED Resource Clients have Higher Survival Rates than PSED II Firms
92Source Parker Simon C (2005) ldquoWhat happens to nascent entrepreneurs An econometric analysis of the PSEDrdquo Entrepreneurship in a Diverse World U S Association for Small Business and Entrepreneurship 93 The PSED II reports the rate of disengagement of start-up firms relative to the time of inception According to Reynolds and Curtin (2008) this period is somewhat arbitrary may not actually capture all start-up activities Thus we report an approximate PSED survival rate based on firms at 1 year and 2 years after inception 94 Survival and Longevity in the Business Employment Dynamics Database Monthly Labor Review May 2005
Impact Study of Entrepreneurial Development 79Resources ndash 2010-2011
Office of Entrepreneurial Development
Does the number of hours of ED Resource assistance have a positive impact on firm survival Figure 83 shows the survival rate of ED Resource clients in each category of counseling hours received for the second follow-up survey of 2008 clients and the first follow-up of 2009 clients In the second follow-up firms receiving 3 or more hours of counseling had a marginally higher survival rate than those that received less than 3 hours of counseling However the relationship between additional counseling hours and survival in the first follow-up sample of 2009 clients is less pronounced
Figure 83 - ED Resource Client Survival by Hours of Counseling
Impact Study of Entrepreneurial Development 80Resources ndash 2010-2011
f
f
Office of Entreprreneurial DDevelopm ment
Changess in Revenuees and Empployees
What is tthe financiaal impact of servicesasssistance proovided by SBA ED Ressources in teerms of job creeation job rretention annd sales
Figure 844 compares 22008 clients iin terms of mmean annual revenues andd number of employees inn the initial andd two subseqquent follow--up studies
Accordinng to this mattched pairs comparison mmean revenuues fell from $413900 in 22008 to $3044200 in 2009 This decline in revenues between 20008 and 2009 iis consistent with the reccessionary conditionns of the econnomy duringg this period However ffor the subseet of firms that survived aand reported revenue dataa mean revennues increaseed to $4677000 in 201095
At the samme time the mean numbber of employyees per firmm decreased frrom 68 to 5 for the first follow-upp year and thhen rose againn to 68 for thhe second foollow-up yearr
Figure 84 - Meaan Revennues and Employmment 20008 Clientts Over TTime
20008 Clients n == 2343 1st Foollow-up n = 2550 2nd Follow--up n = 112
95 Revenue s from Nascentt and unknownn business segmments are not inccluded In adddition Start-up oor In-Business firms with revenuues below $10000 and greater tthan $5 million were excludedd from this analyysis as were firmms with reporteed employees below 1 and abbove 998 The revenue upper bound of $5 mmillion was usedd in order to eli minate bias res sulting from potenntial outliers skeewing the distriibutionrsquos measuures of central ttendency
Impact S tudy of Entrepren neurial Develop pment Resource es ndash 2010-2011 1
81
Office of Entreprreneurial DDevelopm ment
The matcched comparison analysis was repeated for the folllow-up sampple of 2009 cllients Figurre 85 comparess firms in terms of mean annual revennues and nummber of emplloyees in 20009 and in thee first follow-upp survey
Accordinng to this mattched pairs comparison mmean revenuues fell from $414100 in 22009 to $3911400 in 2010 According too a survey off small busineess owners cconducted byy the Nationaal Federationn of Independdent Businessses (NFIB) bbusiness ownners in 2009 reported histtorically low expectationss about groowth and employment annd increasingg concerns abbout inflationn From the low of Jan 22009 optimismm has been coontinuously trending upwward to highs not seen sinnce late 2007 potentially indicativee of a laggingg upturn 96 TThe mean number of empployees per fifirm remainedd essentially flat at just ovver 74
Figure 85 - Meaan Revennues and Employmment 20009 Clientts Over TTime
20099 clients n = 30012 1st Followw-up n = 10144
96Dunkelbeerg William C and Holly Wadde (2009) ldquoNFIIB Small Busineess Economic TTrendsrdquo Marchh httpwwwwnfibcompa gesbet amp httppwwwnfibcoomPortals0PDFsbetsbeet201103pdf
Impact S tudy of Entrepren neurial Develop pment Resource es ndash 2010-2011 1
82
Office of Entreprreneurial DDevelopm ment
The folloowing figures show changges in mean rrevenue and eemployment t for 2009 clieents by ED Resourcee97
Figure 85A Mean SBDCC Revenues and Employmeent 20099 Clients Over TTime
2009 SBBDC Clients n = 1567 1st FFollow-up n = 6637
97 The secoond follow-up ssample of 2008 clients includedd only 200 firmms This samplee is insufficient for a statisticallly meaningfull analysis by inddividual ED Resource
Impact S tudy of Entrepren neurial Develop pment Resource es ndash 2010-2011 1
83
Office of Entreprreneurial DDevelopm ment
Figure 85B Mean SCORRE Revennues and Employmment 20009 Clientts Over TTime
2009 SCCORE Clients nn = 1286 1st FFollow-up n = 323
Impact S tudy of Entrepren neurial Develop pment Resource es ndash 2010-20111
84
Office of Entreprreneurial DDevelopm ment
Figure 85C Mean WBC Revenuees and Emmploymennt 2009 Clients Over TTime
2009 SSCORE Clients n = 159 1st FFollow-up n = 54
Impact S tudy of Entrepren neurial Develop pment Resource es ndash 2010-20111
85
Office of Entreprreneurial DDevelopm ment
Figure 866 provides addditional detaail on the chaange in revennues for 20088 and 2009 cclients For example 53 of 20088 clients havee experiencedd revenue grrowth from 22008 to 2010 Additionallly 65 of 22009 clients realized increased revenuees in 2010 coompared to 335 who expperienced a decline inn revenues
Figure 86 Distrribution oof ED Ressource Clientsrsquo Peercentagee Changee in Revenues98
20009 Clients n = 635 2008 Clieents n = 184
98 Firms wiith revenues bellow $1000 andd greater than $55 million were excluded from this analysis BBecause both 20008 and 2009 fiirms needed to have revenues within these paarameters to es tablish approprriate match critteria needed forr the percent chaange comparisoon the 2008 andd 2009 client coounts will not mmatch those in figures 84 amp 8 85
Impact S tudy of Entrepren neurial Develop pment Resource es ndash 2010-2011 1
86
Office of Entrepreneurial Development
Benchmark Comparisons
Figure 87A and 87B depict firm survival over time as compared to the PSED I and PSED II Figure 87A shows firm survival rates after one year of being in business over a period of six years Figure 87B shows firm survival rates after two years of being in business over a period of five years In both figures the benchmarks for comparison are the PSED I and II which provide data for survival rates of businesses after one and two years of being in business99 ED Resource clients have outpaced the samples from both PSED studies for six consecutive years as shown in the figures below
Figure 87A ndash Firm Survival Rates for ED Resource Clients After One Year (Total ED Resources vs PSED studies)
Figure 87B ndash Firm Survival Rates for ED Resource Clients After Two Years (Total ED Resources vs PSED studies)
99 For years 2007 to 2008 the PSED II with updated data became available and was therefore utilized as the new benchmark PSED I analyzes data collected from nascent entrepreneurs from 1998 - 2000 with three follow-up interviews PSED II analyzes data collected from nascent entrepreneurs from 2005 and 2006 with two follow-up interviews This explains the increased survival rates for the benchmarks on each figure 80 to 90 in 87A and 71 to 80 in 87B
Impact Study of Entrepreneurial Development 87Resources ndash 2010-2011
r
y
Office of Entreprreneurial DDevelopm ment
How doees the growtth of ED Reesource clients compare with key bbenchmarkss of econommic growth
Figure 888 compares tthe differenc e in growth rrate of ED RResource cliennts from 20009 to 2010 too three bennchmarks ndash UUS GDP thhe Private Coompany Indexx (PCI) and the Standardd and Poorrsquos Small Capp Index (SampPP) The GDP growth proovides a conttext of how tthe overall ecconomy is performinng The SampPP represents approximateely 3 of thee US markett and includees 600 lsquosmalll caprsquo companiees with markket capitalizattions betweenn $300 millioon and $2 billlion The PCCI measures revenue pperformance in the sectorr of private ccompanies raanging from $$3 million too $60 million in annual revenues
The diffeerence in growwth rate fromm 2009 to 20010 for SBA EED Resourcce clients wass 134 percenntage points AAlthough all tthree benchmmarks indicatted positive ggrowth durinng this time SSBA ED Resourcee clientsrsquo proggress outpaceed the other benchmarks
Figure 88 ED RResource Client Revenue GGrowth CComparedd to Seleccted Benchmarks - PPercent CChange frrom Prevvious Yeaar100
100 SBA EDD figures are baased on Start-upp or In-Businesss firmsrsquo mean rrevenues from tthe two follow--up surveys conducted in 2010 where clients with revvenue less thann $1000 or greaater than $5 milllion in either year were excludded The revenuue upper boundd of $5 million wwas used in ordder to eliminatee bias resulting ffrom potential outliers skewinng the distributionnrsquos measures off central tendenncy The growthh rates for 20099 and 2010 forr each benchmaark are as followws GDP 20099=-26 2010==29 SampP Smmall Cap 600 2 009=238 20010=251 PCCI 2009=220 2010=298 and SBA ED RResources 2009 =-61 2010==73
Impact S tudy of Entrepren neurial Develop pment Resource es ndash 2010-2011 1
88
Office of Entrepreneurial Development
Summary of Follow-up Study Findings
Firm Survival Approximately 57 of 2008 Nascent clients had transitioned to the In-Business segment after two years while 29 of 2009 Nascent clients had gone into business by the beginning of 2011 At the same time 6 of 2008 of In-Business clients and 3 of 2009 clients went out of business by 2011
In addition in the second follow-up 2008 clients receiving 3 or more hours of counseling had a higher survival rate than those who received less than 3 hours of counseling
Based on a comparison to firms in the PSED II businesses who received ED Resource assistance have a higher survival rate than other small businesses For example the survival rate after two years was 93 for ED Resource clients compared to 80 for firms in the PSED II
Financial Impact and Growth These analyses show that ED Resource assistance has had a significant impact on the revenue and employment growth of small business clients For 2008 clients the recession appears to have had a negative impact on 2009 revenue though revenue increased for these clients in 2010 (2nd follow-up 2008 and 1st follow-up 2009) Surviving 2008 clients in the second follow-up experienced a 54 increase in revenues from 2009 to 2010 Still 47 of 2008 clients experienced some negative growth in revenues since 2008 The difference in growth rates from 2009 to 2010 for SBA ED Resource clients was shown to be 134 percentage points Although all three benchmarks indicated positive growth during this time SBA ED Resource clientsrsquo progress outpaced the other benchmarks Firms in the second 2008 client follow-up sample increased from a mean of 50 employees to a mean of 68 employees Mean employment for firms in the first follow-up of 2009 clients stayed relatively flat with an increase from 73 to 74 employees (See Figures 84 85 86 and 88)
Impact Study of Entrepreneurial Development 89Resources ndash 2010-2011
Office of Entrepreneurial Development
[This page is intentionally left blank for two-sided printing]
Impact Study of Entrepreneurial Development 90Resources ndash 2010-2011
Office of Entrepreneurial Development
IX SUMMARY OF QUANTITATIVE FINDINGS
Initial Impact Study of 2010 Clients
1 What is the demographic financial and business profile of firms who utilize SBA ED Resources
Firms that have been in business for more than one year comprise the In-Business client segment Fifty-four percent of ED Resource clients were in the In-Business category Nascent clients represented 26 of ED Resource clients while the smallest segment Start-up clients represented 19101
The average revenue for firms served by ED Resources is $637200 with four employees Firm size varies by ED Resource For example SBDC clients have higher average revenues at $774000 than SCORE clients at $502000 WBC clientsrsquo revenues are lowest with average revenues of $171300 These revenue figures are lower than client groups studied in 2009
ED Resource clients represented a variety of demographic groups Thirty-six percent of clients were Male 36 Female and 17 of firms had Male and Female owners Sixty-eight percent were White 11 BlackAfrican American 7 HispanicLatino 4 Asian and 2 American IndianNative Alaskan Nine percent of ED Resource clients were Veteran and 2 were Service-disabled Veteran The largest age group served by ED Resources accounting for 28 of the total sample included clients between 45 and 54 years of age
ED Resource clients served during 2010 represented a wide variety of business types The most common industries included service retail and manufacturing businesses
ED Resources assisted clients in developing plans and strategies in order to start or better manage their businesses The most frequently reported type of assistance was business plans (35) followed by marketing plans (30) and financial strategy (19)
For 2010 clients the lowfree cost of service was the most commonly reported reason for seeking business counseling from ED Resources at 51 The least commonly reported reason for seeking business counseling from ED Resources was clients having tried other alternatives but were dissatisfied at 9 SCORE clients reported the reputation of SCORE as a reason they sought assistance (55) more often than the lowfree cost of service (52)
101 Respondents (86) who reported being in business but who did not provide a valid start date for that business were not assigned to a business segment
Impact Study of Entrepreneurial Development 91Resources ndash 2010-2011
Office of Entrepreneurial Development
Firms who received less than 3 hours of assistance reported lower levels of perceived usefulness than firms with 3 or more hours of counseling Also firms in the In-Business segment reported significantly higher perceived usefulness from their ED Resources counseling
American IndianAlaskan Native and White firms both reported higher perceived usefulness but there were no other differences based on race There were also no significant effects of clientrsquos age gender veteran status or ethnicity on perceived usefulness of assistance
Unlike some previous years results of this yearsrsquo regression suggest that there were no significant differences in financial impacts of ED Resource assistance based on any factor including ED resource business segment hours of counseling received or geographic location
Impact study data was used to examine four ED Resource client perceptions of impact Findings for each of these impacts are described below
2 Is there a relationship between the servicesassistance provided by ED Resources and the clientrsquos perception of the usefulness and value of the servicesassistance received
In general ED Resource clients perceived information and assistance provided by ED Resource counselors to be valuable Approximately 73 of ED Resource clients overall reported that assistance they received had high value in terms of usefulness This rating was 74 for SBDC 73 for SCORE and 72 for WBC
Seventy-six percent of clients who received 3 or more hours of counseling rated usefulness as ldquohighrdquo whereas 69 of those who received less than 3 hours of counseling did likewise Regression analysis also indicated that clients who received less than 3 hours of counseling reported lower levels of perceived usefulness than clients who received 3 or more hours of counseling
3 Is there a relationship between the servicesassistance provided by ED Resources and the client perceptions of assistance with the decision to start a business
As in the previous yearrsquos study regression results suggest larger firm firms in the In-Business segment and SCORE clients were less likely to report that their decision to start a business was the result of ED Resource assistance
There were no significant differences based on hours of counseling received or client demographic characteristics in regard to perceived assistance with the decision to start a business
Impact Study of Entrepreneurial Development 92Resources ndash 2010-2011
Office of Entrepreneurial Development
4 Is there a positive relationship between the servicesassistance provided by ED Resources and the clientrsquos decision to implement andor change management andor marketing practices in their business
As a result of ED Resource assistance 62 of 2010 In-Business clients and 57 of Start-up clients changed management practices or strategies Clients used ED Resources most widely in developing business plans marketing plans financial strategies and general management
5 Is there a positive relationship between the servicesassistance provided by ED Resources and financial impacts including job creation and retention and increases in sales
Thirty-four percent of Start-up and In-Business clients reported that assistance provided by ED Resources resulted in increased sales In terms of jobs 15 of Start-up and In-Business clients reported that ED Resource assistance led to the hiring of new staff and 20 reported that ED Resources assisted them in retaining current staff The perceived impact of ED Resource assistance on increasing profit margin was 30 a decrease two percentage points from the previous year
For the following financial categories sales profits retaining current staff and hiring of employees ED Resource clients who received 3 or more hours of assistance reported higher financial impacts than firms who received less than 3 hours of assistance This finding was not supported by a regression analysis which examined sales profits cash flow and the hiring of new staff
Increase in sales was the financial category that showed the most prominent correlation with hours of counseling received more than profit margin hiring of new staff or retention of staff Clients that received 3 or more hours of counseling reported increasing their sales 30 of the time whereas clients that received less than 3 hours of counseling increased their sales 19 of the time
Follow-up Study of 2008 and 2009 ED Resource Clients
6 How do the results of this survey compare with the Panel Survey of Entrepreneurial Dynamics (PSED) study
Based on the first follow-up study of 2008 ED Resource clients 95 were still in business while 90 of firms in the PSED II sample remained in business after one year For 2009 ED Resource clients 96 were still in business after one year In addition for the second follow-up study for 2008 clients 93 of ED Resource clients remained in business compared to 80 for those in the PSED II sample
Impact Study of Entrepreneurial Development 93Resources ndash 2010-2011
Office of Entrepreneurial Development
7 Was the financial impact (job creation job retention and sales) on the clients who were provided servicesassistance by SBA ED Resources (SBDC SCORE and WBC) since 2008 greater than or equal to a representative small business population
The follow-up analyses show that ED Resource assistance has had a substantial impact on the revenue and employment growth of small business clients For 2008 clients the recession appears to have had a negative impact on 2009 revenue though revenue increased for these clients in 2010 Surviving 2008 clients in the second follow-up experienced a 54 increase in revenues from 2009 to 2010 Still 47 of 2008 clients experienced some negative growth in revenues since 2008 The difference in growth rates from 2009 to 2010 for SBA ED Resource clients was shown to be 134 percentage points Although all three benchmarks indicated positive growth during this time SBA ED Resource clientsrsquo progress outpaced the other benchmarks Firms in the 2nd 2008 client follow-up sample increased from a mean of 5 employees to a mean 68 employees Mean employment for firms in the first follow-up of 2009 clients stayed relatively flat with an increase from 73 employees to 74 employees (See Figures 84 85 86 and 88)
Impact Study of Entrepreneurial Development 94Resources ndash 2010-2011
Office of Entrepreneurial Development
X SUMMARY OF QUALITATIVE FINDINGS
In addition to completing the survey multiple ED Resource clients provided additional commentary through their responses to survey invitation e-mails Through these communications clients expressed both positive and negative thoughts and feelings about their experiences with ED Resources This section reviews a selection of these comments
Among the positive comments received clients communicated several themes SBA counselors were professional and genuinely interested in providing help to the client Information provided to the clients by SBDC SCORE and WBC was particularly helpful to
their businessesrsquo development Counselors were willing to take the time to have in-depth discussions about business ideas
and offered many helpful suggestions
A very thankful survey respondent wrote at length about the concerted effort that her counselor put into building a relationship and aiding her business The following is an excerpt from her letter
ldquoI truly appreciated having the opportunity to meet and work with [counselor name] He is a great listener director and mentor His guidance is sound And he has a wonderfully open personality that allows people to feel that they can rely on [him] With his outstanding follow-through [counselor name] never disappointed me in any of my business questions and requestsrdquo
Another ED Resource client took the time to commend his counselor responding very positively to the effect the counselor had on his business
ldquoI just wanted to inform you that [counselor name] was one of the best things that ever happened to my company She displayed exemplary professionalism and helped us out tremendouslyrdquo
One respondent although she was unable to secure credit for her business considered ED Resource assistance to be a valuable learning experience
ldquoI would like to let you know that [ED Resources] helped me a lot and I learned so much from the services they provided me for my businessrdquo
The head of a private educational institution highlighted the flexibility of ED Resources She felt that the counselors served as motivators as well as sources of information
ldquoThe [ED Resources counselors] helped us to identify our issues facilitated discussions about options and helped with the energy and direction to move forward to study those optionshellip [ED Resources] has been a huge help to usrdquo
Impact Study of Entrepreneurial Development 95Resources ndash 2010-2011
Office of Entrepreneurial Development
There was also negative feedback provided by survey respondents regarding their experiences with ED Resources Among the negative comments the most common related to the following
Dissatisfaction with the conduct of their counselors on account of their lack of professionalism or disinterest in helping the client
Finding the information they received financial and otherwise to be less than useful or not applicable to their industry
The unavailability or unresponsiveness of ED Resource counselors in regard to calls or emails placed for inquiries or requests
Some ED Resource clients had difficulty establishing communication lines with their counselors One respondent wrote about his negative experience trying to reach his ED Resource counselor Ultimately the client did not receive any assistance
ldquoA person was chosen for me who was currently unavailable for months as he was not even in the area at the time (even though he lived here)hellip Months later he sent me an email saying he was ready to assist mehellipwe could meet and discuss my problems Problem was I was currently working out of the area supporting my clientrsquos contract I guess that was unsatisfactory for himhellipI never heard from him againrdquo
Several ED Resource clients complained about the outdated nature of the advice they received at times referencing current adverse economic conditions One respondent wrote
ldquoThe counselors didnt have a clue how to help me I was looking for a solid marketing plan Sorry but these guys are dinosaurs Didnt seem to be up on current trends in businesshelliprdquo
After making attempts to receive assistance at multiple ED Resource locations one ED Resource client wrote about her dissatisfaction with the limited knowledge and lack of professionalism of the counselors she met with
ldquoThe gentleman the office set me up with for first meeting did not have any experience in graphic design or what I was mainly interested in obtaining web based businessclients I then made another appointment for their downtown [location] office with two men who I was told knew my fieldhellip The meeting was disastrous One man told me that I should just go door to door to find local clients and to not utilize the Internet at allhelliprdquo
One respondent who sought capital assistance from ED Resources was frustrated at the lack of effort put in by her counselors in spite of her high level of preparedness Ultimately the client was left questioning whether ED Resources volunteers had any genuine interest in helping her business
ldquoI visited with [ED Resources] volunteers twice I found them to be distant and unenthusiastic for the most part I presented a full marketing plan right down to the last detail in a comprehensive binder that I spent two years preparingrdquo
Impact Study of Entrepreneurial Development 96Resources ndash 2010-2011
Office of Entrepreneurial Development
XI RECOMMEDATIONS FOR FURTHER RESEARCH
Measuring the effects of ED Resources on business operations as well as financial and economic outcomes requires longitudinal data that track respondents over time
Further research with this dataset could afford comparison of the effects of different kinds of ED Resource assistance and services on financial and economic outcomes for clients
On the basis of our findings Concentrance offers the following recommendation for further research
An additional study could examine the effects of different types of financing (eg SBA Guarantee Loan vs SBA Disaster Loan) on perceived improvements survival and business growth
Impact Study of Entrepreneurial Development 97Resources ndash 2010-2011
Office of Entrepreneurial Development
[This page is intentionally left blank for two-sided printing]
Impact Study of Entrepreneurial Development 98Resources ndash 2010-2011
Office of Entrepreneurial Development
XII APPENDICES
Impact Study of Entrepreneurial Development 99Resources ndash 2010-2011
Office of Entrepreneurial Development
[This page is intentionally left blank for two-sided printing]
Impact Study of Entrepreneurial Development 100Resources ndash 2010-2011
Office of Entrepreneurial Development
Appendix 1 ndash Survey Response Values by Research Topic
Impact Study of Entrepreneurial Development 101Resources ndash 2010-2011
RESEARCH TOPIC RESEARCH TOPIC SURVEY QUESTIONS SURVEY QUESTIONS RESPONSE CODEDATABASE RESPONSE CODEDATABASE
VALUES VALUES
Demographic Characteristics 7 At the time you were assisted by [SBDC SCORE WBC] what was the approximate annual gross revenue for each of the
Open ended between $1000 and $25000000
calendar years below 2009 ______ 2010 ______
8 Counting yourself how many fill-time employees and part-time employees did you employ at the end of the
following years you were in business
Open ended
2009 FullPart ______ 2010 FullPart ______
10 If you are in business what is the primary type of
business Construction Manufacturing Consulting Wholesale Finance Ins and Real
Estate Entertainment Retail Restaurant Engineering Publishing Education
Construction=1 or 0 Manufacturing=1 or 0 Consulting =1 or 0 Wholesale =1 or 0
Finance Ins And Real Estate =1 or 0 Entertainment =1 or 0 Retail =1 or 0 Restaurant =1 or 0 Engineering =1 or 0 Publishing =1 or 0 Education =1 or 0 Service =1 or 0 Health Care =1 or 0 Day Care =1 or 0 Transportation =1 or 0 Technology =1 or 0 Health Wellness or Fitness Yes=1 No= 0 Other = open ended No response
=N
Service Health Care Day Care Transportation Technology Health Wellness andor
Fitness Other
11 Indicate the geographic location of your primary
business
Urban Suburban Rural
Office of Entrepreneurial Development
RERESEARCH TOPIC SEARCH TOPIC SURVEY QUESTIONS SURVEY QUESTIONS SURVEY QUESTIONS RESPONSE CODEDATABASE RESPONSE CODEDATABASE
VALUES VALUES 12 What lead to your decision
to seek business counseling Tried other alternatives Reputation of
SBDCSCOREWBC Lowfree cost of service Referred by
16 Gender Male=1 Female=2 Male and Female Owners=3 No response = N
17 Veteran Status Veteran=1 Service-disabled Veteran=2 Reservist=3 National Guard Member=4 Non-veteran=5 No response= N
18 Age 18-24= 1 25-34 = 2 35-44 = 3 45-54 = 4 55-64 = 5 65-74 = 6 75+ = 7 No response = N
19 Are you Hispanic or Latino Not HispanicLatino Origin
Hispanic or Latino=1 Not of HispanicLatino Origin=0 No response = N
20 Are you American IndianAlaskan Native Asian BlackAfrican American Native HawaiianPacific Islander White
American Indian or Alaskan =1 or 0 Asian =1 or 0 Black or African American =1 or 0 Native Hawaiian or Pacific Islander =1or 0 White =1 or 0 No response = N
Is there a positive relationship between the servicesassistance provided by SBA ED Resources and the clientrsquos perceptions of the usefulness and value of the servicesassistance received
6 Pleas indicate how useful the services were that you received from the counselor who assisted you in identifying and correcting problems in operating your business Relevancy of Counseling Timeliness of Counseling Helpfulness of Counseling
13 Please indicate the value of the information you received from the [WBC SCORE SBDC] counselor you visited
1 Usefulness of information 2 Relevancy of the
information 3 Timeliness of the
information
Extremely Valuable=5 Valuable=4 No Opinion=3 Somewhat Valuable=2 Not Valuable=1 No response = N
15 I would refer the counseling services I reto other small business
ceived es
Strongly Agree=5 Agree=4 No Opinion=3 Disagree=2 Strongly Disagree=1 other=open ended No response = N
Impact Study of Entrepreneurial Development 102Resources ndash 2010-2011
RESEARCH TOPIC RESEARCH TOPIC SURVEY QUESTIONS SURVEY QUESTIONS RESPONSE CODEDATABASE RESPONSE CODEDATABASE
VALUES VALUES
Is there a positive relationship between the servicesassistance provided by SBA ED Resources and
the clientrsquos perceived quality of the counseling
experience
14 Please indicate the counselorrsquos effectiveness in
assisting you 1 The counselor exhibited excellent customer service
techniques 2 The counselor was able
to assist me 3 The counselor exhibited a high level of professionalism
4 The counselor was knowledgeable of current
management practices and issues
5 The counselor identified with my needs
6 I would rate my overall experience with the counselor as excellent
Strongly Agree=5 Agree=4 No Opinion=3 Disagree=2 Strongly Disagree=1 other=open ended No response = N
Is there a positive relationship between the servicesassistance provided by SBA ED Resources and the clientrsquos decision to start a
business
2 If you were not in business at the time you were assisted by the counselor did you decide to go into business as a
result of that assistance
Yes = 1 No=0 No Response = N
Is there a positive relationship between the servicesassistance provided by SBA ED Resources and clientsrsquo decisions to implement andor change management andor marketing practices in their
business
3 As a result of the assistance you received have you changed any of your current
management practices
Yes=1 No=0 No response = N
Office of Entrepreneurial Development
Impact Study of Entrepreneurial Development 103Resources ndash 2010-2011
RESEARCH TOPIC RESEARCH TOPIC SURVEY QUESTIONS SURVEY QUESTIONS RESPONSE CODEDATABASE RESPONSE CODEDATABASE
VALUES VALUES
4 As a result of the assistance I received from the [WBC SCORE SBDC] counselor I was able to develop [ie Business Plan] in order to start or better manage my business [Check all that apply]
Business Plan Marketing Plan Promotional Plan Pricing Strategy Cash Flow Analysis General Management Loan Package Hiring Plan Training Plan for Staff Financial Strategy Web-based Strategy Purchasing Strategy Feasibility Plan Production Plan Distribution Plan International Trade Other
If checked = 1 Not checked = 0 Other =open ended No response = N
Is there a positive relationship between the servicesassistance provided by SBA ED Resources and the clientsrsquo businesses having a positive financial impact on job creation and
retention and increase in sales
5 Please indicate the impact these changes have had on
your firm 1 Increase my sales 2 Improve my cash flow 3 Acquire a bank loan 4 Expand my products
services 5 Hire new staff 6 Revise my marketing
strategy 7 Increase my profit margin 8 Retain current staff 9 Acquire a SBA guarantee
loan 10 Acquire a government
contract 11 Acquire a SBA Disaster
loan 12 Other
Strongly Agree=5 Agree=4 No Opinion=3 Disagree=2 Strongly Disagree=1 other=open ended No response = N
9 If you were projecting to reduce your total number of
employees prior to counseling by SBDCSCOREWBC how many positions have you
retained due to the counseling Full time _____ Part time _____
Open Ended
Office of Entrepreneurial Development
Impact Study of Entrepreneurial Development 104Resources ndash 2010-2011
RESEARCH TOPIC RESEARCH TOPIC SURVEY QUESTIONS SURVEY QUESTIONS RESPONSE CODEDATABASE RESPONSE CODEDATABASE
VALUES VALUES
General Business 1i Are you currently in business
Yes=1 No=0 No response = N
1ii If yes when was the business started
mmyyyy
1iii What is the zip code of your business
Xxxxx
1a If NO when do you plan on starting a business
Within 30 days=1 31-90 days=2 91-120 days=3 No idea at this time=4 No response = N
1b Have you ever been in business
Yes=1 No=0 No response = N
1bi If YES when was the business started
mmyyyy
21i Did you utilize any other SBA resourcesprogram
Yes=1 No=0 No response = N
21ii If YES select those you used [Check all that apply]
SBDC SCORE WBC SBArsquos Guarantee Loan Programs
SBIC Venture Capital Program
Government contracting SBArsquos Surety Bond Program Small Business Training
Network (Online Training)
Disaster Assistance
SCORE =1 or 0 SBDC =1 or 0 Women Business Center =1 or 0
SBArsquos Guarantee Loan Programs =1 or 0 SBIC Financing Program
=1 or 0 SBArsquos Surety Bond Program =1 or 0 No response = N
Office of Entrepreneurial Development
Impact Study of Entrepreneurial Development 105Resources ndash 2010-2011
Office of Entrepreneurial Development
[This page is intentionally left blank for two-sided printing]
Impact Study of Entrepreneurial Development 106Resources ndash 2010-2011
Office of Entrepreneurial Development
Appendix 2 ndash Quantified Survey Results ndash Initial Survey 2010 Clients
Impact Study of Entrepreneurial Development 107Resources ndash 2010-2011
Surveys Questions Percentage of Sample Q1) Are you currently in business
Yes 7476 No 2524Missing 000
Q1a) If no when do you plan on starting a business
Within 30 days 127 31-90 days 362 91-120 days 451 No idea at this time 1542 Missing 7517
Q1b) Have you ever been in business
Yes 918 No 1605 Missing 7478
Q2) If you were not in business at the time you were assisted by the
counselor did you decide to go into business as a result of that
assistance Yes 1605 No 2817Not Applicable (already in
business) 5542
Missing 036 Q3) As a result of the assistance
you received have you changed any of your current management
practicesstrategies
Yes 4486
No 2931 Missing 2583
Q4) As a result of the assistance I received from the counselor I was
able to develop [ie Business Plan] in order to start or better manage my business
Business Plan 3498 Loan Package 829 Purchasing Strategy 407 Marketing Plan 2982 Hiring Plan 482 Feasibility Plan 789 Promotional Plan 1284 Training Plan for Staff 369 Production Plan 406 Pricing Strategy 1439 Financial Strategy 1869 Distribution Plan 330 Cash Flow Analysis 1693 Web-based Strategy 1036 International Trade 147
StGeneral Management
rategy 1779 Other 835
Q5) Please indicate the impact of these changes have had on your firm Strongly Agree=SA Agree=A No Opinion-No Disagree=D Strongly Disagree=SD]
SA A NO D SD Missing
I was able to Increase my sales 725 1803 2870 636 449 3517 Improve my cash flow 682 1816 2827 674 445 3555 Acquire a bank loan 489 518 3631 974 649 3739 Expand my productsservices 666 1702 2808 756 468 3599 Hire new staff 323 817 3664 911 515 377 Revise my marketing strategy 1218 2726 1728 531 392 3404 Increase my profit margin 555 1605 2941 759 471 3669 Retain current staff 337 1177 3628 582 466 3809 Acquire a SBA guarantee loan 313 286 3791 1052 735 3823 Acquire a government contract 127 232 4015 1071 700 3855 Acquire a SBA Disaster loan 030 062 4206 1088 695 3920 Other 559 195 1314 075 241 7616
Office of Entrepreneurial Development
Impact Study of Entrepreneurial Development 108Resources ndash 2010-2011
Q6) Please indicate how useful the services were that you received
from the counselor who assisted you in identifying and correcting problems in operating your business [Very Useful=VU Useful=U No Opinion-NO Somewhat Useful =SU Not Useful =NU]
VU U NO SU NU Missing
Relevancy of Counseling 3720 2023 318 541 525 2872Timeliness of Counseling 3647 2088 505 393 473 2895Helpfulness of Counseling 3855 1960 297 463 540 2885Q7) At the time you were assisted by [SBDCSCOREWBC] what was the approximate annual gross revenue for each of the calendar years below
2009 Revenue given 3205 Missing 6795
2010 Revenue given 3366 Missing 6633
Q8) Counting yourself how many full-time employees and part-time employees did you employ at the end of the following years you were in business
2010 Full-time jobs Average = 27 2009 Full-time jobs Average = 38 2010 Part-time jobs Average = 17 2009 Part-time jobs Average = 28
Q9) At the time you were assisted by [SBDCSCOREWBC] what was the approximate annual gross revenue for each of the calendar years below
Existing Full-time jobs saved Total Full-time Jobs Saved ndash 3768
Existing Part-time jobs saved Total Part-time Jobs Saved ndash 3203
Firms that saved jobs 3746
Office of Entrepreneurial Development
Impact Study of Entrepreneurial Development 109Resources ndash 2010-2011
Q10) If you are in business what is the primary type of business (This question includes multiple responses)
Construction 352 Manufacturing 539 Consulting 522 Wholesale 256 Finance Insurance Real
Estate
188 Entertainment 116 Retail 723
and Drinking Restaurant andor Eating
266 Engineering 095 Publishing 075 Education 181 Service 923 Health Care 216 Day Care 065 Transportation 086 Technology 302
Fi Health Wellness andor
tness 261
Other 1433
Missing 3400 Q11) Indicate the geographic
location of your primary business
Rural 1454 Suburban 2688 Urban 2369 Missing 3489
Q12) What led to your decision to seek business counseling from [SBDCSCOREWBC]
Tried other alternatives but was dissatisfied 821
Reputation of [SBDCSCOREWBC] 4392 Lowfree cost of service 4578
Referred by _____ 3819
Office of Entrepreneurial Development
Impact Study of Entrepreneurial Development 110Resources ndash 2010-2011
Office of Entrepreneurial Development
Q13) Please indicate the value of the information [Extremely Valuable=EV Valuable=V No Opinion=NO Somewhat Valuable=SV Not Valuable=NV]
EV V NO SV NV Missing
Usefulness of Information 4278 3067 318 772 585 980 Relevancy of the Information 4148 3127 393 739 576 1016 Timeliness of the Information 4008 3118 599 636 564 1074 Q14) Please indicate the counselors effectiveness in assisting you [Strongly Agree=SA Agree=A No Opinion-No Disagree=D Strongly Disagree=SD]
SA A NO D SD Missing
The counselor exhibited excellent customer service techniques 5003 2923 498 233 243 1100 The counselor was able to assist me 4397 3081 608 423 397 1094 The counselor exhibited a high level of professionalism 5383 2767 404 148 201 1097 The counselor was knowledgeable of current management practices and issues 4707 2925 784 233 252 1099 The counselor identified with my needs 4426 3039 677 386 374 1098 I would rate my overall experience with the counselor as excellent 4803 2632 631 439 385 1111 Q15) I would refer the counseling services I received to other small businesses [Strongly Disagree=SA Agree=A No Opinion=NO Disagree=D Strongly Disagree=SD]
SA A NO D SD Missing
4847 1515 450 983 1142 1062 Q16) Gender
Male 3560 Female 3576 Both male and female 1698 Missing 1166
Q17) Veteran Status Veteran 858 Service-disabled Veteran 207 Reservist 032 National Guard Member 035 Non-veteran 7524 Missing 1343
Impact Study of Entrepreneurial Development 111Resources ndash 2010-2011
Q18) Age 18-24 169 25-34 1280 35-44 2157 45-54 2752 55-64 2047 65-74 409
75 + 070 Missing 1117
Q19) Are you HispanicLatino 661 Non-HispanicLatino 9339 Missing 0
Q20) Are you American Indian or
Alaskan Native 174 Asian 351 Black or African American 1135Native Hawaiian or Pacific
Islander 053 White 6838Missing 1634
Q21) Did you utilize any other SBA resourcesprogram
Yes 2510 No 5412 Missing 2078
Q21 cont) If yes select those you used
SCORE 792 SBArsquos Guarantee Loan
Program 657 Women Business Center 382 SBIC Venture Capital
Program
041 Government Contracting 322 SBDC 396 SBArsquos Surety Bond
Program
025 Small Business Training
Network (Online Assistance) 627 Disaster Assistance 033 Missing 2885
Office of Entrepreneurial Development
Impact Study of Entrepreneurial Development 112Resources ndash 2010-2011
Office of Entrepreneurial Development
Appendix 3 ndash Quantified Survey Results ndash Follow-up Survey 2010 Clients
2008 2nd Follow Up Results Data
Impact Study of Entrepreneurial Development 113Resources ndash 2010-2011
Surveys Questions Percentage of Sample Q1) Are you currently in business
Yes 8650 No 1350Missing 000
Q2) If no when do you plan on starting a business
Within 30 days 050 31-90 days 000 91-120 days 000 No idea at this time 1300 Missing 8650 Q3) Have you ever been in
business
Yes 950 No 400 Missing 8650
Q4) As a result of the assistance received from the
[SBDCWBCSCORE] Counselor which of the following were you able to develop [ie Business Plan] in order to start or better manage your business [Check all
that apply]
Business Plan 4500 Loan Package 4400Purchasing Strategy 2000 Marketing Plan 1700 Hiring Plan 2450Feasibility Plan 2700 Promotional Plan 1150 Training Plan for Staff 850
Production Plan 400 Pricing Strategy 2050Financial Strategy 1600 Distribution Plan 450
Cash Flow Analysis 1550 Web-based Strategy 950
International Trade 500 General Management 250 Other 1400
Surveys Questions Percentage of Sample
Q5) What was the approximate annual gross revenue of your
business in 2010
Reported 6950 Missing 3050
Q6) Currently how many people (full and part time) including yourself does your business employ
Average Full-Time 55 employees Average Part-Time 18 employees
Q7) Have you utilized any other SBA resourcesprogram
Yes 2200 No 7600 Missing 200
Q8) If YES select those you used [check all that apply]
SCORE 600 SBArsquos Loan Guarantee Programs 150 SBDC 050
SBIC Venture Capital
Program
100 Woman Business Center 550 Government Contracting 000
SBArsquos Surety Bond
Program
100
Small Business Training Network (online training) 300
2009 1st Follow Up Results Data Surveys Questions Percentage of Sample
Q1) Are you currently in business Yes 8298 No 1702 Missing 000
Q2) If no when do you plan on starting a business
Within 30 days 097 31-90 days 152 91-120 days 203 No idea at this time 1225 Missing 8323
Office of Entrepreneurial Development
Impact Study of Entrepreneurial Development 114Resources ndash 2010-2011
Q3) Have you ever been in business
Yes 874 No 813 Missing 8313
Q4) As a result of the assistance received from the [SBDCWBCSCORE] Counselor which of the following were you able to develop [ie Business Plan] in order to start or better manage your business [Check all that apply]
Business Plan 4761 Loan Package 1250 Purchasing Strategy 386 Marketing Plan 3283 Hiring Plan 493 Feasibility Plan 1133 Promotional Plan 1418
Production Plan 371 Pricing Strategy 1499 Financial Strategy 2190 Distribution Plan 234 Cash Flow Analysis 2236 Web-based Strategy 884 International Trade 168 General Management 2266 Other 1758
Q5) What was the approximate annual gross revenue of your business in 2010
Reported 6850 Missing 3150
Q6) Currently how many people (full and part time) including yourself does your business employ
Average Full-Time 49 employees Average Part-Time 34 employees
Q7) Have you utilized any other SBA resourcesprogram
Yes 2602 No 6565 Missing 833
Training Plan for Staff
Surveys Questions Percentage of Sample
300
Office of Entrepreneurial Development
Impact Study of Entrepreneurial Development 115Resources ndash 2010-2011
Surveys Questions Percentage of Sample
Q8) If YES select those you used [check all that apply]
SCORE 986 SBArsquos Loan Guarantee
Programs 655 SBDC 412 SBIC Venture Capital
Program 025 Woman Business Center 310 Government Contracting 381 SBArsquos Surety Bond
Program 020 Small Business Training
Network (online training) 503
Office of Entrepreneurial Development
Impact Study of Entrepreneurial Development 116Resources ndash 2010-2011
Office of Entrepreneurial Development
Appendix 4 ndash Initial Study Survey Instrument
US Small Business Administration Office of Entrepreneurial Development
Initial Economic Impact Survey OMB Number 3245‐0351 Expiration 03312013
Dear Small Business Client
Thank you for your recent visit to [the Small Business Development Center (SBDC) SCORE the Womenrsquos Business Center (WBC)] one of SBArsquos Entrepreneurial Development (ED) Resource Partners We hope you found the business assistance you sought The SBA is always striving to better its programs and deliver relevant and meaningful assistance We want to know if our programs and services are helping the economy by providing useful information on starting and managing a business and eventually helping your business create jobs increasing your businessrsquo revenues and in general fueling the entrepreneurial spirit in America
We would appreciate you taking a few minutes to answer some brief questions that will help us know the quality and impact of the programs All responses to these questions are voluntary and will be held in confidence The data will not be released to any other government agency or private firm Please answer the following questions based on your visit to [the Small Business Development Center (SBDC) SCORE the Womenrsquos Business Center (WBC)]
1 Are you currently in business Yes No If YES when was the business started _ __ _ _ _
mm yyyy What is the zip code of your business location __ __ __ __ __
If Yes to Question 1 skip to Question 2 If No continue to 1a
1a If NO (to Question 1) when do you plan on starting a business Within 30 days 31‐90 days 91‐120 days No idea at this time
1b If NO (to Question 1) have you ever been in business Yes No If YES when was the business started _ _ _ _ _ _
mmyyyy
2 If you were not in business at the time you were assisted by the counselor did you decide to go into business as a result of that assistance
Yes No Not applicable (already in business)
Impact Study of Entrepreneurial Development 117Resources ndash 2010-2011
Office of Entrepreneurial Development
If you answered NO to Question 1 please skip ahead to Question 12
3 As a result of the assistance you received have you changed any of your current management practicesstrategies Yes No
4 As a result of the assistance I received from the [SBDC SCORE WBC] Counselor I was able to develop one or more of the following (ie Business Plan) in order to better manage my business [Check all that apply]
Business Plan Loan Package Purchasing Strategy Marketing Plan Hiring Plan Feasibility Plan Promotional Plan Training Plan for Staff Production Plan Pricing Strategy Financial Strategy Distribution Plan Cash Flow Analysis Web Based Strategy International Trade General Management Other ________________________
5 Please indicate the impact your counseling experience had on your firm [Strongly Agree=SA Agree=A No Opinion=NO Disagree=D Strongly Disagree=SD]
SA A NO D SD I was able to 1 Increase my sales 5 4 3 2 1 2 Improve my cash flow 5 4 3 2 1 3 Acquire a bank loan 5 4 3 2 1 4 Expand my productsservices 5 4 3 2 1 5 Hire new staff 5 4 3 2 1 6 Revise my marketing strategy 5 4 3 2 1 7 Increase my profit margin 5 4 3 2 1 8 Retain current staff 5 4 3 2 1 9 Acquire a SBA guarantee loan 5 4 3 2 1 10 Acquire a government contract 5 4 3 2 1 11 Acquire a SBA Disaster loan 5 4 3 2 1 12 Other (specify ____________________) 5 4 3 2 1
6 Please indicate how useful the services were that you received from the counselor who assisted you in identifying and correcting problems in operating your business
Impact Study of Entrepreneurial Development 118Resources ndash 2010-2011
Very No Somewhat Not Useful Useful Opinion Useful Useful
1 Relevancy of Counseling 5 4 3 2 1 2 Timeliness of Counseling 5 4 3 2 1 3 Helpfulness of Counseling 5 4 3 2 1
Office of Entrepreneurial Development
7 At the time you were assisted by [the Small Business Development Center (SBDC) SCORE the Womenrsquos Business Center (WBC)] what was the approximate annual gross revenue for each of the calendar years below [All data will be held in strict confidence and reported only in the aggregate without identifying any individual small business] Enter dollar figures only Do not include commas or currency symbols
2009 __________________________ 2010 __________________________
8 Counting yourself how many full‐time employees (35 hours or more per week) and part‐time employees (less than 35 hours per week) did you employ at the end of the following years you were in business
2009 _______________ Number of Full‐time employees 2010 _______________ Number of Full‐time employees
2009 _______________ Number of Part‐time employees 2010 _______________ Number of Part‐time employees
9 If you were projecting to reduce your total number of employees prior to receiving counseling from [SBDC SCORE WBC] how many positions have you retained due to the counseling
Existing Full‐time jobs saved ___________ Existing Part‐time jobs saved ___________
10 What is your firmrsquos primary type of business [Please choose only one]
Construction Manufacturing Consulting Wholesale Finance Insurance and Real Estate Entertainment Retail Restaurant andor Eating and Drinking Engineering Publishing Education Service Health Care Day Care Transportation Technology Health Wellness andor Fitness Other (describe) _______________________
11 Indicate the geographic location of your primary business Rural Suburban Urban
12 What led to your decision to seek business counseling from [SBDC SCORE WBC] [Check all that apply]
Tried other alternatives and was dissatisfied Reputation of [SBDC SCORE WBC] Lowfree cost of service Referred by __________________________________
(Fill in blank or add options such as SBA office of ______ )
Other _______________________________________ (Fill in the blank)
Impact Study of Entrepreneurial Development Resources ndash 2010-2011
119
Office of Entrepreneurial Development
13 Please indicate the value of the information you received from the counselor you visited
Extremely No Somewhat Not Valuable Valuable Opinion Valuable Valuable
1 Usefulness of Information 5 4 3 2 1 2 Relevancy of Information 5 4 3 2 1 3 Timeliness of Information 5 4 3 2 1
14 Please indicate the counselorrsquos effectiveness in assisting you [Strongly Agree=SA Agree=A No Opinion=NO Disagree=D Strongly Disagree=SD]
SA A NO D SD 1 The counselor exhibited excellent
customer service techniques 5 4 3 2 1 2 The counselor was able to assist me 5 4 3 2 1 3 The counselor exhibited a high level of
professionalism 5 4 3 2 1 4 The counselor was knowledgeable of current
management practices and issues 5 4 3 2 1 5 The counselor identified with my needs 5 4 3 2 1 6 I would rate my overall experience with
the counselor as excellent 5 4 3 2 1
15 I would refer the counseling services I received to other small businesses
Strongly Agree Agree No Opinion Disagree Strongly Disagree
16 Gender Male owner(s) Female owner(s) Both male and female owners
17 Veterans status Veteran Service‐disabled Veteran Reservist National Guard member Non‐Veteran
18 Age [Circle one] 18‐24 25‐34 35‐44 45‐54 55‐64 65‐74 75+
19 Are you Hispanic or Latino Not of Hispanic or Latino Origin
20 Are you [Please choose one or more] American Indian or Alaskan Native Asian Black or African American Native Hawaiian or Pacific Islander White
Impact Study of Entrepreneurial Development 120Resources ndash 2010-2011
Office of Entrepreneurial Development
21 Did you utilize any of the following SBA resources or programs Yes No
If YES select those you used [Check all that apply] SBDC SCORE SBArsquos Guarantee Loan programs Women Business Center SBIC Venture Capital Program Government Contracting SBArsquos Surety Bond Program Small Business Training Network Disaster Assistance (On‐line training)
PLEASE NOTE The estimated burden for completing this form is 12 minutes per response You are not required to respond to any collection of information unless it displays a currently valid OMB approval number Comments on the burden should be sent to US Small Business Administration Chief AIB 409 3rd St SW Washington DC 20416 and Desk Officer for the Small Business Administration Office of Management and Budget New Executive Building Room 10202 Washington DC 20503 OMB Approval (3245‐0351) PLEASE DO NOT SEND FORMS TO OMB
SBA Form 2214 THANK YOU
Impact Study of Entrepreneurial Development 121Resources ndash 2010-2011
Office of Entrepreneurial Development
[This page is intentionally left blank for two-sided printing]
Impact Study of Entrepreneurial Development 122Resources ndash 2010-2011
Office of Entrepreneurial Development
Appendix 5 ndash Follow-up Survey
US Small Business Administration Office of Entrepreneurial Development Follow‐up Economic Impact Survey
OMB Number 3245‐0351 Expiration 03312013
Dear Small Business Client
Within the last twelve months you were kind enough to respond to our request for some initial data regarding your visit(s) to SBArsquos Entrepreneurial Development resource the [Small Business Development Center (SBDC) Womenrsquos Business Center (WBC) SCORE] To continually understand the impact our programs and services are having on the economy it would be helpful to know if our assistance to you regarding starting and managing a business resulted in job creation increases in your businessrsquo revenues or other results
We understand that you responded to a thorough survey not so long ago but we ask that you help us in answering a few questions for this follow‐up survey which will take less than 5 minutes All responses to these questions are voluntary and will be held in confidence The data will not be released to any other government agency or private firm Based on your visit to the [SBDC WBC SCORE] please use that experience as a benchmark to answer the following
1 Are you currently in business Yes No
If YES when was the business started _ __ _ _ _ mm yyyy
2 If NO when do you plan on starting a business Within 30 days 31‐90 days 91‐120 days No idea at this time
3 Have you ever been in business Yes No If YES when was the business started _ __ _ _ _
mm yyyy
Impact Study of Entrepreneurial Development 123Resources ndash 2010-2011
Office of Entrepreneurial Development
4 As a result of the assistance received from the [SBDCWBCSCORE] Counselor which of the following were you able to develop [ie Business Plan] in order to start or better manage your business [Check all that apply]
Business Plan Loan Package Purchasing Strategy Marketing Plan Hiring Plan Feasibility Plan Promotional Plan Training Plan for Staff Production Plan Pricing Strategy Financial Strategy Distribution Plan Cash Flow Analysis Web Based Strategy International Trade General Management Other ________________________________________
5 What was the approximate annual gross revenue of your business in 2010 $________________00
6 Currently how many people (full and part‐time) including yourself does your business employ
Number of Full‐Time Employees _________________________ Number of Part‐Time Employees _________________________
7 Have you utilized any other SBA resourcesprogram Yes No
8 If YES select those you used [Check all that apply]
SCORE SBArsquos Guarantee Loan programs SBDC SBIC Venture Capital Program Women Business Center Government Contracting SBArsquos Surety Bond Program Small Business Training Network
(online training)
PLEASE NOTE The estimated burden for completing this form is less than 5 minutes per response You are not required to respond to any collection of information unless it displays a currently valid OMB approval number Comments on the burden should be sent to US Small Business Administration Chief AIB 409 3rd St SW Washington DC 20416 and Desk Officer for the Small Business Administration Office of Management and Budget New Executive Building Room 10202 Washington DC 20503 OMB Approval (TBD) PLEASE DO NOT SEND FORMS TO OMB
THANK YOU
Impact Study of Entrepreneurial Development 124Resources ndash 2010-2011
Office of Entrepreneurial Development
Appendix 6 ndash Regression Computations
Regression Results Effects of Firm and Demographic Characteristics on Perceived Usefulness Assistance with the Decision to Start a Business and Financial Impact
Dependent Variable
Independent Variable
Perceived Usefulness
Assistance with Decision to Start a Business (LR)
Financial Impact
Intercept -124024 240905 -191586
SBDC 19242 -040279 48574
SCORE 15332 -072576 49471
lt 3 hours -24964 011296 -53896
Log of Sales 4661 -013453 3762
Gender 2158 -012057 59382
Veteran 6455 00601 4318
Latino -006 -041537 35888
Age 3223 -003744 40697
Native American 61156 038098 -7369
Asian 21109 -082348 46016
Black 44458 -051198 66021
HawaiianPacific Islander
-32923 -075983 -126224
White 42644 -055758 29757
Inbus 49901 -120888 8468
R-Square 0015 0088 0008
Significant at 001 level Significant at 005 level Significant at 010 level
Impact Study of Entrepreneurial Development 125Resources ndash 2010-2011
Office of Entrepreneurial Development
[This page is intentionally left blank for two-sided printing]
Impact Study of Entrepreneurial Development 126Resources ndash 2010-2011
Office of Entrepreneurial Development
Appendix 7 ndash State-by-State Data The tables below display national response data segmented by ED Resource and in aggregate for total ED Resources
SBDC Clients
ED Resource State Surveys Received
SBDC Client Contacts Received
Response Rate
of Total SBDC Clients
SBDC AL 78 342 23 15SBDC AK 9 48 19 02SBDC AS 2 8 25 00SBDC AZ 71 396 18 14SBDC AR 54 207 26 11SBDC CA 527 2593 20 103SBDC CO 101 330 31 20SBDC CT 75 238 32 15SBDC DC 12 45 27 02SBDC DE 16 60 27 03SBDC FL 235 1233 19 46SBDC GA 180 631 29 35SBDC GU 3 9 33 01SBDC HI 23 93 25 04SBDC ID 26 100 26 05SBDC IL 208 957 22 41SBDC IN 124 470 26 24SBDC IA 71 222 32 14SBDC KS 54 207 26 11SBDC KY 77 312 25 15SBDC LA 84 345 24 16SBDC ME 25 97 26 05SBDC MD 93 405 23 18SBDC MA 104 489 21 20SBDC MI 257 765 34 50SBDC MN 99 380 26 19SBDC MS 43 222 19 08SBDC MO 91 381 24 18SBDC MT 22 69 32 04SBDC NE 28 128 22 05SBDC NV 39 153 25 08SBDC NH 17 96 18 03SBDC NJ 143 648 22 28SBDC NM 40 141 28 08SBDC NY 321 1451 22 63SBDC NC 184 621 30 36SBDC ND 8 49 16 02SBDC OH 185 871 21 36
Impact Study of Entrepreneurial Development 127Resources ndash 2010-2011
Office of Entrepreneurial Development
Impact Study of Entrepreneurial Development Resources ndash 2010-2011
ED Resource State Surveys Received
SBDC Client Contacts Received
Response Rate
of Total SBDC Clients
SBDC OK 63 266 24 12 SBDC OR 80 264 30 16 SBDC PA 253 948 27 49 SBDC PR 62 294 21 12 SBDC RI 14 45 31 03 SBDC SC 66 309 21 13 SBDC SD 11 55 20 02 SBDC TN 98 438 22 19 SBDC TX 210 1190 18 41 SBDC UT 56 180 31 11 SBDC VI 5 10 50 01 SBDC VT 13 48 27 03 SBDC VA 151 546 28 30 SBDC WA 149 423 35 29 SBDC WV 24 138 17 05 SBDC WI 117 378 31 23 SBDC WY 12 39 31 02
Totals 5113 20956 1000
SCORE Clients
SCORE Client of Total Surveys Contacts Response SCORE
ED Resource State Received Received Rate Clients SCORE AL 12 99 12 03SCORE AK 0 2 0 00SCORE AZ 113 565 20 25SCORE AR 30 149 20 07SCORE CA 416 2571 16 94SCORE CO 137 484 28 31SCORE CT 161 791 20 36SCORE DC 19 93 20 04SCORE DE 41 211 19 09SCORE FL 309 1619 19 70SCORE GA 62 446 14 14
SCORE HI 26 77 34 06SCORE ID 24 99 24 05SCORE IL 154 994 15 35SCORE IN 73 403 18 16SCORE IA 36 162 22 08
SCORE KS 16 80 20 04SCORE KY 68 335 20 15SCORE LA 19 118 16 04SCORE ME 48 179 27 11
128
Office of Entrepreneurial Development
ED Resource State Surveys Received
SCORE Client Contacts Received
Response Rate
of Total SCORE Clients
SCORE MD 74 374 20 17SCORE MA 164 781 21 37SCORE MI 108 431 25 24SCORE MN 135 626 22 30SCORE MS 2 20 10 00SCORE MO 49 257 19 11SCORE MT 14 52 27 03SCORE NE 15 108 14 03SCORE NV 64 487 13 14SCORE NH 86 334 26 19SCORE NJ 90 467 19 20SCORE NM 31 111 28 07SCORE NY 268 1368 20 60SCORE NC 180 724 25 41SCORE ND 14 67 21 03SCORE OH 225 951 24 51SCORE OK 14 63 22 03SCORE OR 119 588 20 27SCORE PA 254 1081 23 57SCORE RI 13 79 16 03SCORE SC 87 413 21 20SCORE SD 3 14 21 01SCORE TN 68 354 19 15SCORE TX 209 1093 19 47SCORE UT 35 100 35 08SCORE VT 27 116 23 06SCORE VA 112 450 25 25SCORE WA 118 571 21 27SCORE WV 5 24 21 01SCORE WI 97 398 24 22
SCORE WY 0 2 0 00
Total 4444 21981 1000
Impact Study of Entrepreneurial Development 129Resources ndash 2010-2011
WBC Clients
ED Resource State Surveys Received
WBC Client Contacts Received
Response Rate
of Total WBC Clients
WBC AL 28 105 27 48WBC AK 1 4 25 02WBC AS 0 9 0 00WBC AZ 1 18 6 02WBC CA 91 518 18 154WBC CO 4 45 9 07
ED Resource State Surveys Received
WBC Client Contacts Received
Response Rate
of Total WBC Clients
WBC CT 4 35 11 07WBC DC 17 91 19 29WBC DE 4 19 21 07WBC FL 15 78 19 25WBC GA 7 50 14 12WBC IL 11 103 11 19WBC IN 30 173 17 51WBC IA 3 15 20 05WBC KS 12 64 19 20WBC LA 8 79 10 14WBC ME 12 42 29 20WBC MD 21 66 32 36WBC MA 3 18 17 05WBC MI 23 123 19 39WBC MN 9 35 26 15WBC MO 7 37 19 12WBC MT 16 49 33 27WBC NE 8 34 24 14WBC NV 8 48 17 14WBC NM 15 74 20 25WBC NY 43 147 29 73WBC NC 77 480 16 131WBC OH 1 30 3 02WBC OK 9 18 50 15WBC PA 9 48 19 15WBC PR 5 32 16 08WBC RI 4 18 22 07WBC SC 2 10 20 03WBC TN 5 10 50 08WBC TX 28 172 16 48WBC UT 7 27 26 12WBC VT 5 20 25 08WBC VA 6 10 60 10WBC WA 12 85 14 20WBC WV 2 10 20 03WBC WI 16 105 15 27WBC WY 0 8 0 00
Total 589 3162 1000
Office of Entrepreneurial Development
Impact Study of Entrepreneurial Development 130Resources ndash 2010-2011
Office of Entrepreneurial Development
Total ED Resources Clients
Total ED Resources of Total Client ED
Surveys Contacts Response Resources ED Resource State Received Received Rate Clients Total ED Resources AL 118 546 22 12 Total ED Resources AK 10 54 19 01 Total ED Resources AS 2 17 12 00 Total ED Resources AZ 185 979 19 18 Total ED Resources AR 84 356 24 08 Total ED Resources CA 1034 5682 18 102 Total ED Resources CO 242 859 28 24 Total ED Resources CT 240 1064 23 24 Total ED Resources DC 48 229 21 05 Total ED Resources DE 61 290 21 06 Total ED Resources FL 559 2930 19 55 Total ED Resources GA 249 1127 22 25 Total ED Resources GU 3 9 33 00 Total ED Resources HI 49 170 29 05 Total ED Resources ID 50 199 25 05
Total ED Resources IL 373 2054 18 37 Total ED Resources IN 227 1046 22 22 Total ED Resources IA 110 399 28 11 Total ED Resources KS 82 351 23 08 Total ED Resources KY 145 647 22 14 Total ED Resources LA 111 542 20 11 Total ED Resources ME 85 318 27 08 Total ED Resources MD 188 845 22 19 Total ED Resources MA 271 1288 21 27 Total ED Resources MI 388 1319 29 38 Total ED Resources MN 243 1041 23 24 Total ED Resources MS 45 242 19 04 Total ED Resources MO 147 675 22 14 Total ED Resources MT 52 170 31 05 Total ED Resources NE 51 270 19 05 Total ED Resources NV 111 688 16 11 Total ED Resources NH 103 430 24 10 Total ED Resources NJ 233 1115 21 23 Total ED Resources NM 86 326 26 08 Total ED Resources NY 632 2966 21 62 Total ED Resources NC 441 1825 24 43 Total ED Resources ND 22 116 19 02 Total ED Resources OH 411 1852 22 41 Total ED Resources OK 86 347 25 08 Total ED Resources OR 199 852 23 20 Total ED Resources PA 516 2077 25 51 Total ED Resources PR 67 326 21 07
Impact Study of Entrepreneurial Development 131Resources ndash 2010-2011
Office of Entrepreneurial Development
ED Resource State Surveys Received
Total ED Resources Client Contacts Received
Response Rate
of Total ED Resources Clients
Total ED Resources RI 31 142 22 03 Total ED Resources SC 155 732 21 15 Total ED Resources SD 14 69 20 01 Total ED Resources TN 171 802 21 17 Total ED Resources TX 447 2455 18 44 Total ED Resources UT 98 307 32 10 Total ED Resources VI 5 10 50 00 Total ED Resources VT 45 184 24 04 Total ED Resources VA 269 1006 27 27 Total ED Resources WA 279 1079 26 27 Total ED Resources WV 31 172 18 03 Total ED Resources WI 230 881 26 23
Total ED Resources WY 12 49 24 01
Total 10146 46099 1000
Impact Study of Entrepreneurial Development 132Resources ndash 2010-2011

Office of Entrepreneurial Development
[This page is intentionally left blank for two-sided printing]
Impact Study of Entrepreneurial Development iv Resources ndash 2010-2011
Office of Entrepreneurial Development
TABLE OF FIGURES Methodology
Figure 31 ndash Distribution of Respondents by Segment (2010 clients) 16 Total ED Resources 2008-2009-2010
Figure 41 ndash Total ED Resources ndash Client Segments Served 22 Figure 42 ndash Total ED Resources ndash Revenue and Employment (Average ED client Revenues and Number of Employees) 23 Figure 42A ndash Total ED Resources ndash Revenues by Hours of Counseling 24 Figure 43 ndash Total ED Resources ndash Demographic Characteristics 25 Figure 44 ndash Total ED Resources ndash Age of Business Owner 26 Figure 45 ndash Total ED Resources ndash Primary Business Type 27 Figure 46 ndash Total ED Resources ndash What led to your decision to seek business counseling from ED Resources 28 Figure 47 ndash Total ED Resources ndash How useful was the information you received 29 Figure 47A ndash How useful was the information you received Total ED Resources by Hours of Counseling vs Total ED Resources Aggregate Hours 30 Figure 48 ndash Total ED Resources ndash Did you decide to go into business as a result of the assistance you received 31 Figure 49 ndash Total ED Resources ndash Assistance in Plan Development 33 Figure 410 ndash Total ED Resources ndash Perceived Impact of Assistance 34 Figure 410A ndash Total ED Resources ndash Perceived Impact of Assistance (Hours of Counseling Received vs Aggregate Hours) 35 Figure 411 ndash Revenues (000s) for Firms in Selected Demographic Categories 36 Figure 412 ndashTotal Employees for Firms in Selected Demographic Categories 37 Research Findings - SBDC
Impact Study of Entrepreneurial Development v Resources ndash 2010-2011
Figure 51 ndash SBDC ndash Distribution of Clients by Segment (2010 Clients) 42 Figure 52 ndash SBDC ndash Demographic Characteristics (2010 Clients) 43 Figure 53 ndash SBDC ndash Age of Business Owner (2010 Clients) 44 Figure 54 ndash SBDC ndash Type of Business (2010 Clients) 45 Figure 55 ndash SBDC ndashUsefulness of SBDC (2010 Clients) 46 Figure 55A ndash Usefulness of SBDC SBDC by Hours of Counseling vs Total ED Resources Aggregate Hours (2010 Clients) 47 Figure 56 ndash SBDC ndash Changed Management PracticesStrategies as a Result of SBDC ED Resource Assistance (2010 Clients) 48 Figure 57 ndash SBDC ndash Assistance in Plan Development (2010 Clients) 49 Figure 58 ndash SBDC ndash Perceived Impact of Assistance (2010 Clients) 50 Figure 58A ndash SBDC ndash Perceived Impact of Assistance SBDC Hours of Counseling Received for In-Business and Start-ups vs Total ED Resources Aggregate Hours for In-Business and Start-ups (2010 Clients) 51
Office of Entrepreneurial Development
Research Findings - SCORE
Figure 61 ndash SCORE ndash Distribution of Clients by Segment (2010 Clients) 54 Figure 62 ndash SCORE ndash Demographic Characteristics (2010 Clients) 55 Figure 63 ndash SCORE ndash Age of Business Owner (2010 Clients) 56 Figure 64 ndash SCORE ndash Type of Business (2010 Clients) 57 Figure 65 ndash SCORE ndashUsefulness of SCORE (2010 Clients) 58 Figure 65A ndash Usefulness of SCORE SCORE by Hours of Counseling vs Total ED Resources Aggregate Hours (2010 Clients) 59 Figure 66 ndash SCORE ndash Changed Management PracticesStrategies as a Result of SCORE ED Resource Assistance (2010 Clients) 60 Figure 67 ndash SCORE ndash Assistance in Plan Development (2010 Clients) 61 Figure 68 ndash SCORE ndash Perceived Impact of Assistance (2010 Clients) 62 Figure 68A ndash SCORE ndash Perceived Impact of Assistance SCORE Hours of Counseling Received for In-Business and Start-ups vs Total ED Resources Aggregate Hours for In-Business and Start-ups (2010 Clients) 63
Research Findings - WBC
Impact Study of Entrepreneurial Development Resources ndash 2010-2011
vi
Figure 71 ndash WBC ndash Distribution of Respondents by Segment (2010 Clients) 66 Figure 72 ndash WBC ndash Demographic Characteristics (2010 Clients) 67 Figure 73 ndash WBC ndash Age of Business Owner (2009 Clients) 68 Figure 74 ndash WBC ndash Type of Business (2010 Clients) 69 Figure 75 ndash WBC ndash Usefulness of WBC (2010 Clients) 70 Figure 75A ndash Usefulness of WBC WBC by Hours of Counseling vs Total ED Resources Aggregate Hours (2010 Clients) 71 Figure 76 ndash WBC ndash Changed Management PracticesStrategies as a Result of WBC ED Resource Assistance (2010 Clients) 72 Figure 77 ndash WBC ndash Assistance in Plan Development (2010 Clients) 73 Figure 78 ndash WBC ndash Perceived Impact of Assistance (2010 Clients) 74 Figure 78A ndash WBC ndash Perceived Impact of Assistance WBC Hours of Counseling Received for In-Business and Start-ups vs Total ED Resources Aggregate Hours for In-Business and Start-ups (2010 Clients) 75
Office of Entrepreneurial Development
Follow-up Results
Figure 81 ndash Transitions and Survival of 2008 and 2009 Clients to 2011 In-Business 78 Figure 82 ndash ED Resource Clients have Higher Survival Rates than PSED Firms 79 Figure 83 - ED Resource Client Survival by Hours of Counseling 80 Figure 84 - Mean Revenues and Employment 2008 Clients Over Time 81 Figure 85 - Mean Revenues and Employment 2009 Clients Over Time 82 Figure 85A Mean SBDC Revenues and Employment 2009 Clients Over Time 83 Figure 85C Mean WBC Revenues and Employment 2009 Clients Over Time 85 Figure 86 Distribution of ED Resource Clientsrsquo Percentage Change in Revenues 86 Figure 87A ndash Firm Survival Rates for ED Resource Clients After One Year (Total ED Resources vs PSED) 87 Figure 87B ndash Firm Survival Rates for ED Resource Clients After Two Years (Total ED Resources vs PSED) 87 Figure 88 ED Resource Client Revenue Growth Compared to Selected Benchmarks - Percent Change from Previous Year 88
TABLE OF TABLES
Table 31 ndash Sampling Frame 15 Table 32 ndash Follow-up Impact Study Clients 18 Table 41 ndash Total ED Resources-Revenues and Employment (2010) 22 Table 42 ndash ED Resources Impact on Managerial Practices 32 Table 51 ndash SBDC Client Revenues and Employment (2010) 42 Table 61 ndash SCORE Client Revenues and Employment (2010) 54 Table 71 ndash WBC Client Revenues and Employment (2010) 66
Impact Study of Entrepreneurial Development vii Resources ndash 2010-2011
Office of Entrepreneurial Development
[This page is intentionally left blank for two-sided printing]
Impact Study of Entrepreneurial Development viii Resources ndash 2010-2011
Office of Entrepreneurial Development
FOREWORD
Concentrance would like to thank the US Small Business Administrationrsquos (SBA) Office of Entrepreneurship Education and SBArsquos Office of Entrepreneurial Development Program Offices Small Business Development Centers SCORE and Womenrsquos Businesses Centers for their assistance in conducting this research Both headquarter offices and local ED Resources spent considerable effort to ensure that clients from each center were represented in the data collection The rich dataset that now exists is in no small measure due to these efforts
The following individuals contributed to the development of this report
Jane Dwight- Managing Partner Concentrance Consulting Group Matthew C Herman- Project Director Concentrance Consulting Group Benjamin Joiner- Business Analyst Concentrance Consulting Group Dr George Solomon- Senior Policy Advisor SBA Office Of Entrepreneurship Education Dr Vanessa Perry- Associate Professor George Washington University
Impact Study of Entrepreneurial Development 1Resources ndash 2010-2011
Office of Entrepreneurial Development
[This page is intentionally left blank for two-sided printing]
Impact Study of Entrepreneurial Development 2Resources ndash 2010-2011
Office of Entrepreneurial Development
I INTRODUCTION
The US Small Business Administrationrsquos (SBA) Office of Entrepreneurial Development (ED) designed a multi-year time series study to assess the impact of the face-to-face counseling programs it offers to small businesses This study has examined clients who received face-to-face counseling services starting in 2003 The SBA initiated this study as part of the Office of Management and Budgetrsquos (OMB) Program Assessment Rating Tool (PART) SBA contracted with Concentrance Consulting Group to assist in administering the study to analyze the findings and to write this report This report is the eighth report1 in the study and presents the findings from three separate study groups each year This yearrsquos study group includes 2010 clientsrsquo initial attitudinal assessment of their counseling experience and a follow-up with 2009 and 2008 clients to assess the financial impact of the received assistance2
Study Year 2009 Study Year 2010 Study Year 2011
2008 Clients Initial survey First follow-up Second follow-up
2009 Clients Initial survey First follow-up
2010 Clients Initial survey
Study Year 2009 Study Year 2010 Study Year 2011
This study measures attitudinal assessments perceptions of changes in managementmarketing practices and business growth for firms that utilized SBArsquos ED Resource Partnersrsquo face-to-face counseling during the late summer or early fall of 2008 2009 or 2010 The ED Resource Partners include Small Business Development Centers (SBDC) SCORE and Women Business Centers (WBC)
This report includes Executive Summary Methodology
o Research Questions o Sampling data collection response rate and survey administration o Data analysis and analysis of non-response o Follow-up o Limitations
Findings Initial economic impact study o Impact of total ED Resources (2008 - 2009 - 2010) o Regression analysis o Impact of SBDC resources 2010 o Impact of SCORE resources 2010 o Impact of WBC resources 2010 o Quantitative analysis overview o Qualitative analysis of collected client comments
Findings Follow-up study of 2008 and 2009 ED Resource clients Recommendations for further research
1 Each ED Resource final report can be found at httpwwwsbagovaboutsbasbaprogramsedindexhtml 2 For information on 2003 2004 2005 2006 and 2007 clients please see previous reports
Impact Study of Entrepreneurial Development 3Resources ndash 2010-2011
Office of Entrepreneurial Development
The appendix includes the distribution of responses for each survey question sample survey instruments additional regression results and distribution of responses for each ED Resource by state
[This page is intentionally left blank for two-sided printing]
Impact Study of Entrepreneurial Development 4Resources ndash 2010-2011
Office of Entrepreneurial Development
II EXECUTIVE SUMMARY
The US Small Business Administrationrsquos (SBA) Office of Entrepreneurial Development designed a study to assess the impact of its Entrepreneurial Development (ED) Resource Partnersrsquo face-to-face counseling assistance on small business clients and contracted Concentrance Consulting Group to conduct the study Thus far the study has examined ED Resource Partner clients that received face-to-face counseling assistance in 2003 and clients from each subsequent year up to and including the present study of 2010 clients This latest report presents the findings of the initial attitudinal impact study of 2010 ED Resource Partner clients and a follow-up study showing the financial impact on 2009 and 2008 clients Within the report all references to ED Resource Partner clients pertain to ED Resource Partnerrsquos face-to-face counseling clients who received assistance from a designated ED Resource Partner ED Resource Partner Clients Studied Concentrance studied the outcomes of three ED Resource Partners Small Business Development Centers (SBDC) SCORE and Women Business Centers (WBC)
Within each ED Resource Partner we studied three small business client segments including Nascent - Those individuals who have taken one or more positive steps to start a business Start-up - Those individuals who have been in business one year or less and In-Business ndash Those individuals who have been in business more than one year and are
classified as small by the SBA For the 2010 clients who responded to the initial impact study we analyzed demographic characteristics perceived usefulness of assistance and initial impact on businesses We also assessed the survival rates and financial growth of 2009 and 2008 clients Quantitative Findings (Initial Impact Study 2010 Clients)
Concentrance collected coded and analyzed data for 10146 ED Resource clients for an overall response rate of 23 This yearrsquos survey comprised the largest sample and achieved the greatest number of respondents since the inception of the study The table below provides the number of respondents and response rates for each ED Resource
Resource Center
Stratified Sample Size
Usable Sample
Size3
Surveys Received via Web
Surveys Received via Phone
Total Surveys
Received
Response Rate 2010
Clients SBDC 21514 20329 4183 930 5113 25 SCORE 22002 21521 3513 931 4444 21 WBC 3229 3021 450 139 589 20 Total 46745 44871 8146 2000 10146 23
Resource Center
Stratified Sample Size
3 The usable sample size includes the stratified sample minus surveys noted as undeliverable by web or phone due to incorrect contact information The accuracy and completeness of the contact information for clients provided by ED Resource offices was much improved for 2010 clients compared to previous years
Impact Study of Entrepreneurial Development 5Resources ndash 2010-2011
Office of Entreprreneurial DDevelopm ment
The figurre below illusstrates the buusiness segmeent composittion of each ED Resourcce
Distribbution of Responddents by SSegment t (2010 Cllients)4
nn = 10146
NNascent 1143 1306 1880
SStart-up 929 920 1111
B In-
Business 3003 2175 2993
Total 5113 4444 5889
CClient Year Stratified d Sample Si ize
Usea able Sample e Size
Follo ow-up p
Surveys s Received in n 2008
Response Rate
2008 854 854 2nnd 200 23
2009 8493 84993 sst 1 11968 23
The 20088 clients weree resurveyed in 2011 to deetermine finaancial impactt after two yeears in terms of financial ggrowth and ffirm survivall rates Theirr response raate was 23 equal to the previous yeaarrsquos study Thhe 2009 cliennts were also resurveyed aat this time too determine financial imppact and firmm survival rrates after onne year The response ratee for this grooup was also 23 the higghest responnse rate sincee the inceptioon of the studdy for a first follow-up grroup
4 Respondeents (86) who reeported being in business butt who did not pprovide a valid sstart date for thhat business weere not assigned too a business segmment Therefoore percentagess of clients in eaach business se egment may nott equal 100
Impact S tudy of Entrepren neurial Develop pment Resource es ndash 2010-2011 1
6
Office of Entreprreneurial DDevelopm ment
FY2011 0 SBDC SCCORE and WBC clientt s all reporte ed lower rev venues than those serve ed in the previous yee ar SBDC continues too serve the c clients with h the highest t average revenuu es ($774000 0) followedd by SCOREE ($502000) ) and WBC C ($171300)
Average eemployment llevels for SBBDC SCOREE and WBC cclients all felll from 2009 levels
Impact S tudy of Entreprenn eurial Developp ment Resourcee s ndash 2010-2011 1
7
RRev 2008 $6340000 $818400 $229500
RRev 2009 $8553000 $728400 $311200
RRev 2010 $7740000 $502000 $171300
Emmpl 2008 7 7 5
Emmpl 2009 7 6 4
Emmpl 2010 5 3 3
f
t
ED D Resource es served a ddiverse clien nt base in 20 010 similar tto past yearrs regarding g de emographic and busine ess characte eristics
Office of Entreprreneurial DDevelopm ment
The tootal ED Resoource client bbase consisteed of Femalle (36) Malle (36) firmms with MMale and Femmale owners (17) White (68) BlackAfrican AAmerican (111) Veteraan (9) Servvice-disabledd Veteran (2) HispanicLatino (7)) Asian (4)) Ameriican IndianNNative Alaskkan (2) andd Native HawwaiianPacifific Islander (11)5
The percentage of firms ownedd by White aand Veteran clients has ddecreased fromm the prrevious year66 Male and FFemale ownerrs is a new caategory for thhe 2011 studdy whichh partially expplains the deccrease in bothh the Femalee and Male ddemographicss
For 20010 the greatest percentaage of busineess owners (228) were beetween the agges of 45-54 Those bbetween the aages of 35-444 made up 222 of clientss Twenty peercent consissted of clients between thhe ages of 55--64 down thhree percentaage points froom last yeear7 Clients 225-34 were 113 of the tootal ED Resoource client bbase8
The mmost often citted primary bbusiness induustries for 20009 clients re emained the ssame as in ppast years seervice (14) and retail (11) The prrevalence of the service aand retail iindustry categories have rremained levvel over the ppast year howwever manuffacturing connsulting andd health care have all decrreased by appproximately oone percenntage point aand ldquootherrdquo hhas increasedd by three perrcentage poinnts
Firms owned by mmen reported revenues onn average more than twicce as high as those owned by w omen Reveenues for botth groups felll over the paast year The highesst average revvenues by racceethnicity were reporteed by HispannicLatinos followwed by Whitee and Asian fifirms Averagge revenues for every racceethnicity experiienced decreaases especiallly Native HaawaiianPaciific Islanders Veterans experiienced increaases in averagge revenues wwhile Servicee-disabled V eterans reporrted lower revenues thaan the previoous year
FY Y2010 client s gave lowe er ratings (73 3) than th he previous y yearrsquos respo ondents (75 5) to the u usefulness o of the assistaance they re eceived Th he effect of c counseling as sistance on the clientrsquos ability to d develop a bu usiness plan (35) mar rketing pla an (30) ha as remained d relatively c consistent ac cross past st tudies
5 These 20110 demographicc distributions wwere comparedd to the nationaal averages fromm the 2007 Survvey of Businesss Owners froom the US Cennsus Bureau (SBBO) The totall ED Resource s demographic distribution waas compared too the national averages from thee SBO The d isstribution was ccomparable acrross characterisstics except for the following SSBO figures White business ow wners were 83 of the small bbusiness popul lation Female b business ownerrs were 29 MMalebusiness owwners were 51 and BlackAffrican Americann business ownners were at 7 6 Just over 16 of survey respondents diid not answer thhe race questio ons whereas 455 answered laast year Thereffore the drop inn in the numberr of Whites mayy be due to nonn-responses andd not reflective of the actual p opulation 7 Eleven peercent of surveyy respondents ddid not respondd to the age queestion for this yyearrsquos study Laast year only twwo percent didd not respond This may explaain some of thee variation betwween this yearrsquos study and the 22010 study 8 The total ED Resources age distributio n was compareed to the nationnal averages fromm the SBO The distribution was comparablee except that 655+ was reportedd at 125 (commpared to 5 ffor total ED Reesources)
Impact S tudy of Entrepren neurial Develop pment Resource es ndash 2010-2011 1
8
Office of Entreprreneurial DDevelopm ment
Usefulness ratings also include the financiall impact of aassistance on hiring new sstaff (11) retaining cuurrent staff (115) increasing profit mmargin (22) and increasiing sales ((25) The rratings for alll categories hhave gone doown from thee previous yeear
Laa rger firms rr eported higg her levels oo f perceived d usefulness of ED Reso ource as sistance thaa n did smalll er firms F irms that re eceived less than 3 hour rs of as sistance repp orted lowerr levels of pee rceived use efulness tha an firms with h 3 or m ore hours off counselingg
Total ED Resourc ce clients that t received 3 o or more hour rs of counsel ling reported d 76 o of the time th hat counselin ng was useful l versus 69 for clients t that received d less than 3 3 hours of co ounseling
There were no diff ferences in q quality of cou unseling expe erience basedd on businesss segme ent ED Reso ource or geog graphic locatti ion
There were no sign nificant effec cts of clientrsquos s age gender veteran stat tus or ethnic city on per rceived usefu ulness How wever Americ can IndianA Alaskan Nativ ve and White e clients s reported sig gnificantly hi igher perceiv ved usefulnes ss No other significant differe ences based o on race were e found
All though clie nt reported perceptionss of each EDD Resourcee were largelly similar th ere were somm e key diffee rences
For SC CORE client ts 55 repor rted the perc ceived reputa ation of SCO ORE led to th heir decisio on to seek EDD Resource assistance co ompared to 4 44 for SBD DC clients an nd 40 f for WBC clie ents
Appro oximately 39 of WBC S Start-ups and d 42 of WB BC In-Busine ess clients report ted that assist tance they re eceived result ted in increas sed sales com mpared to 25 5 and 33 3 respectiv vely for SCOR RE clients an nd 33 and 37 for SBD DC clients respec ctively
For W WBC clients 3 38 of Start t-ups reporte d that they d decided to go o into busines ss as a resul lt of assistan ce compared d to 33 for SBDC and 3 30 for SCO ORE This tr rend w l l
as a so apparent for Nascent clients
Fi irms in the I In-Business s segment a and larger fir rms were le ss likely to r report that th heir decision n to start a b business wa s the result of ED Reso ource assista ance
Twentty-five percennt of Nascennt clients andd 32 of Starrt-up clients reported thaat their ddecision to sttart a businesss was the ressult of ED RResource assistance
Impact S tudy of Entrepren neurial Develop pment Resource es ndash 2010-2011 1
9
Office of Entreprreneurial DDevelopmment
Consistent with thhe previous yeearrsquos results larger firms firms in the In-Businesss segmeent and SCORRE clients wwere significanntly less likelly to report thhat their decisioons to start bbusinesses weere the resultt of the ED RResource asssistance they received
Fii ndings fromm an analys is of follow--up surveys of 2008 and d 2009 client ts suggest buu sinesses thh at received ED Resourr ce assistan nce have a hi igher surviv val rate thh an other smm all business ses in the PP SED II Th he survival r rate after tw wo years ww as 93 for ED Resourr ce clients cc ompared to o 80 for fir rms in the P PSED II
Appro oximately 57 of 2008 N Nascent client ts had transit tioned to the e In-Business s segme ent after two years while 29 of 200 09 Nascent cl lients had go one into busin ness after o one year On nly six percen nt of 2008 of f In-Business s clients and three percen nt of 2009 c clients went o out of busine ess by 2010
In the e second follo ow-up of 200 08 clients fir rms receiving g 3 or more h hours of couns eling had hig gher survival rates than th hose who rec ceived less th han 3 hours oof couns eling
A com mparison of tthe difference e in growth r rates for SBA A ED Resour rce clients wi ith GDP the Private C Company In ndex (PCI) an nd the Stand dard and Poo orrsquos SmallCap p 600 Index from 2009 t to 2010 show ws that SBA E ED Resource e clients outp paced the oth her bench hmarks with a a difference o of 134 perce entage points s over five p percentage po oints more than the nex xt highest find ding9 Altho ough all three e benchmarks s indicated positiv ve growth du uring this tim me SBA ED R Resource clie entsrsquo progres ssed more rap pidly
9 T ee uu rr EE aa rrhttpwwwwbeagovnationalxlsgdpchhgxls the Privaate Company Inndex (PCI) - puublished by Enttrex this index measures reevenue performmance in the secctor of private ccompanies rangging from $3 mmillion to $60 mmillion in annuall revenues (hhttpwwwpriivatecompanyinndexcom) and the S amp P SmaallCap 600 Indeex - represents approximately 3 of the US maarket and incluudes 600 lsquosmall caprsquo companiess with market ccapitalizations bbetween $300 mmillion and $2 bbillion
he thre benchmarks sed for compa ison of SBA D Resources re GDP - Sou ce
Impact S tudy of Entrepren neurial Develop pment Resource es ndash 2010-2011 1
10
Office of Entrepreneurial Development
Qualitative Findings
A few clients from each ED Resource provided ad hoc commentaries in emails with their survey instrument
Comments were both positive and negative for each ED Resource
Recommendation for Further Research
An additional study could examine the effects of different types of financing (eg SBA Guarantee Loan vs SBA Disaster Loan) on perceived improvements survival and business growth
Methodology
The initial impact study of 2010 clients was quantitative in nature based upon responses to web surveys Statistical analyses utilized frequency distributions average comparisons cross tabulations and regression models This yearrsquos study computed revenue and employment data using means rather than medians which were the bases of previous yearsrsquo studies Given wide fluctuation and disparity in revenue and employment among small businesses using mean comparisons is a more informative measure
The survey of clients resulted in a respondent sample of 10146 clients ED Resources provided a random sample list of 46745 clients served during the late summer or early fall of 2010 Concentrance sent web surveys to ED Resource face-to-face counseling clients via email We sent reminder emails each week for four weeks after the initial emailing Phone surveys were attempted for clients who did not respond to web surveys According to statistical tests there was no evidence of bias due to non-response
Concentrance used regression analyses to test for the impact of client demographics on client perceptions of ED Resource assistance outcomes Each regression model examined the impact of selected demographic characteristics (age gender race ethnicity and veteran status) and firm characteristics (size business segment ED Resource geographic location and hours of assistance) on a particular resource impact These impacts included perceived usefulness of ED Resource assistance perceived impact on the decision to start a business and perceived impact on sales
The respondent sample for the second follow-up survey of 2008 clients was 200 The respondent sample for the first follow-up of 2009 clients was 1968 A matched sample was used to perform pair-wise statistical tests that compared changes in growth and business segment to other benchmarks Revenue and employment growth for ED Resource clients were examined by comparing SBA data to that of the Panel Study of Entrepreneurial Dynamics II10 (PSED II) the Private Company Index and the SampP SmallCap 600 Index
10 The Panel Study of Entrepreneurial Dynamics II is a nationwide multi-million dollar survey of nascent entrepreneurs funded by the Kauffman Foundation The primary purpose of the study is to identify adults active in business creation obtain detailed information about the start-up effort and perform follow-up interviews to determine outcomes We rely on the PSED I and PSED II as benchmarks however results must also be interpreted with caution due to potential response bias and definitional differences in the ways that firms are classified
Impact Study of Entrepreneurial Development 11Resources ndash 2010-2011
Office of Entrepreneurial Development
Limitations to consider when interpreting these results include
Measures of ED Resource impacts are attitudinal and are self-reported by the client
Many respondents did not report revenue data
Estimates of firm survival and growth over time should be interpreted with caution Due to attrition firms that have gone out of business may be under represented
Impact Study of Entrepreneurial Development 12Resources ndash 2010-2011
Office of Entrepreneurial Development
III METHODOLOGY
This report contains findings from the initial impact study of face-to-face ED Resource counseling clients from 2010 and a follow-up study of the 2008 and 2009 clients that participated in initial impact studies in previous years11 The methodology for the initial impact study for 2010 clients is presented first followed by the methodology for the 2008 and 2009 client follow-up study The initial impact study reports clientsrsquo attitudinal assessments of their counseling experience and the follow-up study reports the long-term financial impact of assistance on client firms
Research Questions The following questions are the focus of this study and are addressed in the findings section of this report The last two questions numbers six and seven are addressed in the follow-up study which comprises time series analysis of multi-year data
1 What is the demographic financial and business profile of firms who utilize ED Resources
2 Is there a relationship between the servicesassistance provided by ED Resources (SBDC SCORE and WBC) and the clientrsquos perception of the usefulness and value of the servicesassistance received
3 Is there a relationship between the servicesassistance provided by ED Resources and the clientrsquos decision to start a business
4 Is there a relationship between the servicesassistance provided by ED Resources (SBDC SCORE and WBC) and the clientrsquos decision to implement andor change management andor marketing practices in their business
5 Are the servicesassistance provided by ED Resources (SBDC SCORE and WBC) having an impact on the clientrsquos financial position in terms of job creation job retention and sales
Follow-up study of 2008 and 2009 ED Resource clients
6 Based on a comparison of the total ED Resources with the Panel Study of Entrepreneurial Dynamics II (PSED II)12 what is the impact of ED Resource assistance on firm survival
What was the rate of transition of Nascent and Start-up firms to the In-Business segment
11 All references to ED Resource clients pertain to ED Resource Partnersrsquo face-to-face counseling clients who received assistance from a designated ED Resource Partner (SBDCSCOREWBC) 12 The Panel Study of Entrepreneurial Dynamics II is a nationwide multi-million dollar survey of nascent entrepreneurs funded by the Kauffman Foundation The primary purpose of the study is to identify adults active in business creation obtain detailed information about the start-up effort and perform follow-up interviews to determine outcomes We rely on the PSED I and PSED II as benchmarks however results must also be interpreted with caution due to potential response bias and definitional differences in the ways that firms are classified
Impact Study of Entrepreneurial Development 13Resources ndash 2010-2011
Office of Entrepreneurial Development
7 What is the financial impact of servicesassistance provided by ED Resources as a whole in terms of job creation job retention and sales
How does the difference in growth rate of ED Resource clients from 2009 to 2010 compare with selected growth benchmarks such as the gross domestic product (GDP)13 and Standard amp Poorrsquos SmallCap 600 Index14 and the Entrex Private Company Index (PCI)15
Sampling and Data Collection
This study examines the effects of SBA ED Resource assistance on client firms by respective ED Resource and by clients in the following various stages of business formation Nascent - Individuals who have taken one or more steps to start a business Start-up - Individuals who have been in business one year or less In-Business ndash Individuals who have been in business more than one year and are classified as
small by the SBA
The initial impact study of 2010 clients was quantitative in nature based upon responses to web and telephone surveys The responses provided a statistically significant sample for each ED Resource To determine if the sample size for this study was sufficient Concentrance tested the sample size on the basis of reported sales revenues The initial sample of 2010 clients is sufficiently large enough for accuracy within plus or minus $98861 in reported annual sales revenues at a 99 confidence level16
Table 31 on the following page depicts the distribution of surveys across ED Resource and the response rates by ED Resource The overall response rate was 23 which is comparable to the response rates found in other surveys of entrepreneurs For example Aldrich and Baker (2000) found that nearly a third of surveys of entrepreneurs had response rates below 2517 In another example the National Federation of Independent Business (NFIB) had a response rate of 20 in its Small Business Economic Trends survey conducted in June of 201018
13 Source httpwwwbeagovnationalxlsgdpchgxls 14 The S amp P SmallCap 600 Index - represents approximately 3 of the US market and includes 600 lsquosmall caprsquo companies with market capitalizations between $300 million and $2 billion The SampP SmallCap 600 Index is a commonly used benchmark for growth 15 The Private Company Index (PCI) - published by Entrex this index measures revenue performance in the sector of private companies ranging from $3 million to $60 million in annual revenues (httpwwwprivatecompanyindexcom) 16 This assumes a normal distribution of annual revenues with a standard deviation of $2324497 17 Aldrich Howard E and Ted Baker (2000) ldquoBlinded by the Cites Has there been any progress in entrepreneurship researchrdquo in Entrepreneurship 2000 ed Donald L Sexton and Raymond L Smilor Chicago Upstart Publishing p 377-400 18 William K Dunkelberg and Holly Wade ldquoNFIB Small Business Economic Trendsrdquo NFIBcom July 2010 lthttpwwwnfibcomPortals0PDFsbetsbet201007pdfgt
Impact Study of Entrepreneurial Development 14Resources ndash 2010-2011
Office of Entrepreneurial Development
Table 31 ndash Sampling Frame
Resource Center
Stratified Sample Size
Usable Sample Size 19
Surveys Received via Web
Surveys Received via Phone
Total Surveys
Received
Response Rate 2010
Clients SBDC 21514 20329 4183 930 5113 25 SCORE 22002 21521 3513 931 4444 21 WBC 3229 3021 450 139 589 20 Total 46745 44871 8146 2000 10146 23
Survey Administration Following a successful pilot test of web-based survey administration for the 2008-2009 impact study of ED Resources Concentrance adopted web-based survey administration as the primary technique for this study This delivery mechanism has provided greater efficiency with regard to increasing the number of completed surveys for ED Resource clients ED Resources drew a random sample of clients served during the late summer or early fall of 2010 based on a random sample table provided to each ED Resource See Appendix 4 for the survey instrument Via email Concentrance sent selected clients SBA cover letters and an invitation to take a web-based OMB approved survey We sent reminder emails each week for four weeks after the initial emailing We logged-in all received surveys entered the survey data into a database for analysis and developed an electronic database list of non-respondents for a telephone follow-up survey All surveys were assigned a computer-coded with client codes to facilitate unique identification of each client for follow-up surveys while ensuring privacy
19 The usable sample size includes the stratified sample minus surveys noted as undeliverable by web or phone due to incorrect contact information The accuracy and completeness of the contact information for clients provided by ED Resource offices was much improved for 2010 clients as compared to previous years
Impact Study of Entrepreneurial Development 15Resources ndash 2010-2011
Resource Center
Stratified Sample Size
Usable Sample Size 19
Office of Entreprreneurial DDevelopm ment
Figure 311 shows the distribution oof survey resspondents byy respective EED Resourcee and businesss segment The In-Bussiness segmeent was the laargest segmennt served forr all resourcees The Startt-up segment iis smaller thaan the other segments in part becausee of the narroow definitionn of Start-upss (firms thaat have been in business ffor one year or less)
)20Figure 31 ndash Disstributionn of Resppondents by Segmment (2010 clients)
nn = 10146
Naascent 1143 1306 1800
Staart-up 929 920 111
In-Business
3003 2175 2933
Total 5113 4444 5899
20 Responddents (86) who rreported being in business buut who did not pprovide a valid start date for thhat business wwere not assigneed to a businesss segment Theerefore percenttages of clients iin each businesss segment mayy not equal 100
Impact S tudy of Entrepren neurial Develop pment Resource es ndash 2010-2011 1
16
Office of Entrepreneurial Development
Data Analysis
Analyses included the following methods basic descriptive statistics frequency distributions cross tabulations and regression Concentrance used basic descriptive statistics for continuous variables such as annual sales revenues We used frequency distributions for Likert scales and respondents answered on a scale of 1 to 5 Cross-tabulations were used to compare responses across ED Resources business segments and hours of counseling received Finally Concentrance used multiple regression analyses to test for differences in key outcomes such as perceived usefulness or financial impact of ED Resource assistance based on demographic or firm characteristics We selected these analyses to meet the objectives of each research question and to facilitate interpretation of findings For this yearrsquos study revenue and employment calculations were completed using mean data instead of median data which was utilized for previous yearsrsquo studies
Analysis of Non-Response
SBArsquos research plan for this study included a methodology for estimating potential non-response bias Non-response bias can occur in survey research if respondents differ substantially from those that do not respond The best way to protect against this bias is to improve the response rate An effective method for achieving high response rates is the use of follow-ups and reminders In this study non-response bias was minimized by sending four reminder emails containing a link to the survey and minimized further by telephone follow-ups to non-respondents
We assessed the extent and direction of potential non-response bias by comparing the characteristics of clients who responded to the internet survey with those who did not Of the 10146 total clients surveyed 8146 were surveyed over the web The remaining clients (2000) were surveyed over the phone Clients surveyed over the phone were more likely to report revenue and employment figures Additionally these results hold when other respondent characteristics are controlled for (ED Resource Business Segment and Hours of Counseling Received)21
The next step was to conduct a comparative analysis of the responses between these groups to determine if the difference in response rates would have an impact on our analyses Results of regression analyses revealed no significant differences between these groups in terms total number of employees There was a significant difference in revenue found between phone and web respondents However only a very small portion of the total variance in revenue (02) is explained by this difference 22
21 These findings were based on results of four logistic regression analyses to determine whether web versus phone respondents differed significantly in terms of missing revenues and missing employment data The models were significant at the plt0001 level and the variable indication phone response was always significant at the plt0001 level 22 These findings were based on results of a regression analysis to determine whether web versus phone respondents differed significantly in terms of number of employees where a positive number of total employees are reported A scheffe test reveals no significant difference between phone and web at the 010 level The t-test associated with the regression analysis reveals a non-significant result (t=-161 p=01075) A second regression was performed to determine whether web versus phone respondents differed significantly in terms of reported sales revenues greater than or equal to 1000 A scheffe test for this difference revealed a significant difference between phone and web at the 005 level The t-test associated with the regression analysis reveals a significant result also (t=256 p=00106) The R-square value associated with this model is 0002
Impact Study of Entrepreneurial Development 17Resources ndash 2010-2011
Office of Entrepreneurial Development
Additionally the difference in phone and web respondents was tested against perceived service usefulness Although a significant difference in the service variate was found only a small portion of the variance of each of the service measures can be explained by the difference between phone and web respondents Similar results were found with the perceived value of the information the respondents received 23 Because the evidence of response bias is minimal the phone and web respondents were pooled in subsequent analyses Follow-up Study 2008 and 2009 ndash Sampling Data Collection and Analysis of Non-Response A follow-up study was conducted of both 2008 and 2009 clients in order to evaluate the financial impact on these groups one year and two years after they were counseled by ED Resources There were 854 clients from 2008 that were contacted for a second follow-up in the beginning of 2011 Two-hundred clients responded to this second follow-up which represents a 23 response rate Each of these respondents had valid client codes that could be matched on a one-to-one basis with the initial impact survey respondents Thus for a sample of 200 clients there were detailed data which could be tracked for three years There were 8493 respondents to the initial impact survey of 2009 clients Of those contacted 1968 responded to the survey and provided detailed data that could be tracked for two years Table 32 shows the number of surveys received by total ED Resources and the total response rates
Table 32 ndash Follow-up Impact Study Clients
Client Year Stratified
Sample Size Useable
Sample Size Follow-
up Surveys Received
in 2008 Response
Rate
2008 854 854 2nd 200 23
2009 8493 8493 1st 1968 23
These matched samples were used to perform pair-wise statistical tests that compared changes in growth by business segment and by ED Resource Although there were a small number of observations available for this analysis these findings provide a more precise estimate of changes in revenues and employment over time than aggregate non-matched comparisons
23 These findings were based on results of two multivariate regression analyses and a series of simple linear regression analyses to determine whether web versus phone respondents differed significantly in terms of the reported perceived service usefulness and value of information received The Wilkesrsquo Lambda value is significant for both multivariate analyses indicating there is some linear combination of the perceived usefulness measures and perceived value of received information that is explained by the difference in phone vs web respondents The R-square values of the six individual measures of service and information predicted by the difference in phone vs web respondents was explored These values are range from 00084 to 00238
Impact Study of Entrepreneurial Development 18Resources ndash 2010-2011
Office of Entrepreneurial Development
Limitations
There are several limitations that should be considered when interpreting the results presented in this report These limitations are inherent in the research design and methodology
Measures included in this initial survey are primarily attitudinal and all items are self-reported Thus there are few objective measures that can be used to assess actual client performance or make comparisons with other data sources
Many respondents did not report revenue data which is critical to measuring growth from year-to-year For example out of Start-up and In-Business firms approximately 39 reported zero revenues or did not report revenues
Estimates of firm survival and growth over time should be interpreted with caution Due to attrition firms which have gone out of business may be under-represented
Impact Study of Entrepreneurial Development 19Resources ndash 2010-2011
Office of Entrepreneurial Development
[This page is intentionally left blank for two-sided printing]
Impact Study of Entrepreneurial Development 20Resources ndash 2010-2011
Office of Entrepreneurial Development
IV TOTAL ED RESOURCES 2008 - 2009 - 2010
The following section presents comparison results of face-to-face counseling clients from 2008 2009 and 201024 First the general demographic and financial characteristics of the total ED Resource clients are presented This is followed by additional findings on the impact of the total ED Resources on Nascent Start-up and In-Business firms organized by research question as follows
Is there a relationship between servicesassistance provided by ED Resources (SBDC SCORE and WBC) and the clientrsquos perception of the usefulness and value of servicesassistance received
Is there a relationship between the servicesassistance provided by ED Resources (SBDC SCORE and WBC) and the clientrsquos decision to start a business
Is there a relationship between the servicesassistance provided by ED Resources (SBDC SCORE and WBC) and the clientrsquos decision to implement andor change management andor marketing practices in their business
Are the servicesassistance provided by ED Resources (SBDC SCORE and WBC) having an impact on the clientrsquos financial position in terms of job creation job retention and sales
Please note that comparisons between the 2008 2009 and 2010 initial study clients should be interpreted with caution Concentrance collected cross-sectional data from a different set of firms each year and these firms were operating under different economic conditions To better understand changes over time the follow-up study included in this report tracks the same firms over a three year period
24 All references to ED Resource clients pertain to ED Resource Partnersrsquo face-to-face counseling clients who received assistance from a designated ED Resource Partner (SBDCSCOREWBC)
Impact Study of Entrepreneurial Development 21Resources ndash 2010-2011
Office of Entrepreneurial Development
Demographic Characteristics of ED Resource ClientsThis section describes the general demographic and financial characteristics of total ED Resource clients that were served in 2010 These results are based on an analysis of 10146 completed surveys As shown in Figure 41 the In-Business segment (54) was the largest business segment served by ED Resources in 2010 The size of the In-Business segment remained consistent with the previous year The Start-up segment increased for the third year in a row though the change is in part due to the revised definition of Start-up businesses
Figure 41 ndash Total ED Resources ndash Client Segments Served25
2008 n = 6770 2009 n = 8493 2010 n = 10146
The average annual revenue for ED Resourcesrsquo clients was $637200
Table 41 ndash Total ED Resources-Revenues and Employment26 (2010)
Total ED Resources
Average Revenue $637200
Average Employees 4
25 Respondents (86 for 2010) who reported being in business but who did not provide a valid start date for that business were not assigned to a business segment Therefore the total of client segments served for each year may not equal 100 26 Firms that reported revenues were required to do so within the range of $1000 to $25000000
Impact Study of Entrepreneurial Development 22Resources ndash 2010-2011
Total ED Resources
Rev 2008 $634000 $818400 $229500
Rev 2009 $855300 $728400 $311200
Rev 2010 $774000 $502000 $171300
Empl 2008 7 7 5
Empl 2009 7 6 4
Empl 2010 5 3 3
Office of Entrepreneurial Development
ED Resources continued to differ in terms of the size of firms they served as shown in Figure 42 Again this year SBDC continues to serve the highest revenue clients ($774000 average) followed by SCORE ($502000 average) and WBC ($171300 average) All three of ED Resourcesrsquo clients reported lower average annual revenues than those assisted in 2009 Average employment reported by SBDC SCORE and WBC clients was also lower than clients served in 2009 in all cases especially SCORE In terms of revenues WBC serves a distinct client base from both SBDC and SCORE however SBDC and SCORE do not serve distinct client bases in terms of revenue27
Figure 42 ndash Total ED Resources ndash Revenue and Employment (Average ED client Revenues and Number of Employees)
27 We used a Scheffe test to examine the pair-wise differences to control for the familywise error rate We found significant revenue differences (95 confidence) between WBC and SBDC as well as between WBC and SCORE groups No other significant differences were found
Impact Study of Entrepreneurial Development 23Resources ndash 2010-2011
Office of Entrepreneurial Development
Figure 42A examines the average revenues by the hours of counseling received28 to understand the relationship between client revenues and resource utilization The data shows that clients from SBDC SCORE and WBC that received a greater number of hours of counseling tended to be larger in size For example average revenues for SCORE clients who received less than 3 hours of counseling were $336400 while average revenues for clients who received 3 or more hours of counseling were $618300 This trend is also apparent with SBDC clients where the difference between clients that received 5 or more hours of counseling and those that received from 3 to less than 5 hours of counseling is $148700 The overall average revenues regardless of hours of counseling indicated by the black cross bars in the figure below were $774000 for SBDC 502000 for SCORE and 171300 for WBC
Figure 42A ndash Total ED Resources ndash Revenues by Hours of 29 Counseling
Aggregate Hours Mean Revenue
($502000)
($774000)
($171300)
($637200)
28 For each ED Resource the number of respondents is comparable for each category of hours of counseling received SBDC lt 3 hrs = 1668 ge 3 amp lt 5 hrs = 1668 ge 5 hrs = 1777SCORE lt 3 hrs = 2219 ge 3 hours= 2225WBC lt 3 hrs = 297 ge 3 hours= 292 29 SBDC reports hours of counseling in three categories (lt 3 ge3 to lt5 ge 5) whereas SCORE and WBC report two categories (lt 3 ge 3) SCORE and WBC also provide 5 or more hours of counseling to their clients and these hours are captured in the 3 or more hours of counseling category When comparing ED Resources by hours of counseling those clients receiving 3 or more hours of counseling from SBDC reported average revenues of $843500
Impact Study of Entrepreneurial Development 24Resources ndash 2010-2011
Office of Entrepreneurial Development
Figure 43 presents the demographic characteristics of ED Resource clients in terms of gender race ethnicity and veteran status30 A new category was added to the survey for this year For the first time clients were able to select ldquoMale and Female Ownersrdquo as an answer to the gender of the owner(s) question (See Appendix 4 for a complete survey instrument) Predictably both Male and Female categories dropped sharply from last yearrsquos numbers The proportions of the majority of the race and ethnicity categories have not changed from the previous year with the exception of a reduction in the number of Whites31 Figure 43 ndash Total ED Resources ndash Demographic Characteristics32
2008 n = 6770 2009 n = 8493 2010 n = 10146
30 The Veteran and Service-disabled Veteran categories are shown in the figure above Additional results for total ED Resource clients included Reservist (03) and National Guard Member (04) 31 Just over 16 of survey respondents did not answer the race questions whereas 45 answered last year Therefore the drop in in the number of Whites may be due to non-responses and not reflective of the actual population 32 Totals may not equal 100 due to non-respondents and respondents who selected multiple ethnicities The 2010 total ED Resources demographic distribution was compared to the national averages from the 2007 Survey of Business Owners from the Census Bureau (SBO) The distribution was comparable across characteristics except for the following SBO figures White business owners were 83 of the small business population Female business owners were 29 and Male business owners were 51
Impact Study of Entrepreneurial Development 25Resources ndash 2010-2011
Office of Entrepreneurial Development
Figure 44 shows the distribution of ED Resource clients by age of business owner The largest groups of ED Resource clients belonged to the 45 to 54 and 35 to 44 age categories 28 and 22 respectively This outcome is consistent with the previous years depicted in the figure Both the 18-24 and 25-34 age categories increased slightly from the previous year Differences in findings from the previous year may be due to an increased number of clients that did not respond to the corresponding survey question for age33
Figure 44 ndash Total ED Resources ndash Age of Business Owner34
2008 n = 6770 2009 n = 8493 2010 n = 10146
33 Survey questions can be found in the survey instrument in Appendix 4 q18 requests the clientsrsquo age Eleven percent did not respond to the age question for this yearrsquos study Last year only two percent did not respond 34 The 2010 total ED Resources age distribution was compared to the national averages from the SBO The distribution was comparable except that SBO reported 65+ at 125 (compared to 5 for ED Resources)
Impact Study of Entrepreneurial Development 26Resources ndash 2010-2011
Office of Entrepreneurial Development
As shown in Figure 45 the two highest reported business types besides ldquoOtherrdquo businesses served by ED Resources were the service and retail businesses35 These results are generally consistent with the national averages from the 2007 Survey of Business Owners (SBO) Results that were not consistent included Manufacturing reported in the SBO to be 2 Construction reported to be 13 and Health Care reported to be 936 Also the figure depicts the percentage of clients in the other category as having increased over the past three years
Figure 45 ndash Total ED Resources ndash Primary Business Type37
2008 n = 6770 2009 n = 8493 2010 n = 10146
35 The top 11 results for 2010 are displayed in the figure above Additional results included Finance Insurance and Real Estate (3) Education (3) Entertainment (2) Engineering (1) Transportation (1) Publishing (1) and Day Care (1) 36 Other findings that differed from SBO results included Finance Insurance and Real Estate (14) and Transportation (5) Industry classifications are not identical 37 Several groupings were found to be present among those respondents who classified their business type as ldquoOtherrdquo These included multiple responses for non-profits designart related professions and beauty related professions Due to non-responses the total for all business types may not equal 100
Impact Study of Entrepreneurial Development 27Resources ndash 2010-2011
Office of Entrepreneurial Development
Figure 46 depicts the reasons clients reported seeking business counseling from ED Resources Reputation and lowfree cost of service were the most common reasons for clients to seek assistance from ED Resources SBDC clients reported lowfree cost of service as the most common reason (50) but rated reputation of the ED Resource and referral as equally strong reasons (44) In contrast to the total ED Resources SCORE clients reported that reputation (55) was a stronger reason for seeking assistance than was lowfree cost of service (52) and WBC clients reported that referrals (44) were more often a reason for their seeking assistance as opposed to reputation (40)
Figure 46 ndash Total ED Resources ndash What led to your decision to seek business counseling from ED Resources38
n = 10146
38 The totals do not equal 100 due to respondents selecting multiple factors This figure compares results by individual ED Resource therefore corresponding figures are not repeated in the individual ED Resource sections of this report
Impact Study of Entrepreneurial Development 28Resources ndash 2010-2011
Office of Entrepreneurial Development
Resource Impacts
Usefulness and Value of Services or Assistance Received
As shown in Figure 47 below 73 of 2010 ED Resource clients reported that the information they received from their counselor was valuable
Figure 47 ndash Total ED Resources ndash How useful was the information you received39
2008 n = 6770 2009 n = 8493 2010 n = 10146
39 Low value includes the lsquoSomewhat Valuablersquo and lsquoNot Valuablersquo response categories High value includes the lsquoExtremely Valuablersquo and lsquoValuablersquo response categories Percentages will not total 100 due to non-response
Impact Study of Entrepreneurial Development 29Resources ndash 2010-2011
Office of Entrepreneurial Development
Figure 47A shows the perceived usefulness of ED Resources relative to the number of hours of counseling received recorded in two categories less than 3 hours and 3 or more hours For comparison the overall level of perceived usefulness is also provided in the figure but this segment does not distinguish usefulness by hours of counseling received
As illustrated below ED Resource clients who had three or more hours of counseling rated usefulness of ED Resources as ldquohighrdquo more often than those who had less than three hours of counseling40 Seventy-six percent of clients who received 3 or more hours of counseling rated the usefulness of total ED Resources as ldquohighrdquo versus 69 of those that received less than 3 hours of counseling
Figure 47A ndash How useful was the information you received Total ED Resources by Hours of Counseling vs Total ED Resources Aggregate Hours
40 This finding is supported by the regression analysis beginning on page 39
Impact Study of Entrepreneurial Development 30Resources ndash 2010-2011
Office of Entrepreneurial Development
Decision to Start a Business
Figure 48 depicts the perceived assistance of ED Resources with the clientrsquos decision to start a business These results are presented by individual ED Resource and total ED Resources Results for Nascent and Start-up firms are reported in each category41 Across SBDC SCORE and WBC the relationship between Nascent and Start-up clients remained consistent Start-up clients more often indicated that they decided to go into business as a result of the assistance they received from their respective ED Resource center than Nascent clients
Figure 48 ndash Total ED Resources ndash Did you decide to go into business as a result of the assistance you received42
n = 4589
41 The corresponding survey question for this figure asked ldquoIf you were not in business at the time you were assisted by the counselor did you decide to go into business as a result of that assistancerdquo Therefore In-Business clients were not observed because these clients were in business at the time they received counseling 42 This figure compares results by individual ED Resource therefore corresponding figures are not repeated in the individual ED Resource sections of this report
Impact Study of Entrepreneurial Development 31Resources ndash 2010-2011
Office of Entrepreneurial Development
Clientsrsquo Decision to Change Management Practices
As a result of ED Resource assistance for 2010 clients 57 of Start-up and 62 of In-Business firms changed their current management practices or strategies The percentage of Start-up firms reporting that they changed their management practices or strategies has decreased slightly over the past three years The frequency of In-Business firms reporting changes in management practices or strategies remained consistent from 2009
Table 42 ndash ED Resources Impact on Managerial Practices
Impact Study of Entrepreneurial Development 32Resources ndash 2010-2011
Changed Current Management PracticesStrategies
2008 Clients 2009 Clients 2010 Clients
Changed Current Management PracticesStrategies
2008 Clients 2009 Clients 2010 Clients
Start-up 60 59 57
In-Business 61 62 62
Office of Entrepreneurial Development
Figure 49 below reflects the percentage of firms reporting that ED Resource assistance led to the development of business plans marketing plans etc The frequency of ED Resource clients reporting they received assistance with a Web-based Strategy Financial Strategy Marketing Plan or Pricing Strategy has risen over the past three years of this study The Loan Package category has diminished steadily over the past three years from 12 in 2008 to 8 for 2010
Figure 49 ndash Total ED Resources ndash Assistance in Plan Development43
43 The 2010 results for the top 11 categories are displayed in the figure above Additional results for 2010 included hiring plan (5) purchasing strategy (4) production plan (4) training plan for staff (4) distribution plan (3) and international trade (1) For the 2010 study (2009 clients) the category of e-commerce changed to web-based strategy The 2008 results from that category are still used for comparison
Impact Study of Entrepreneurial Development 33Resources ndash 2010-2011
Office of Entrepreneurial Development
Sales Job Creation and Job Retention
Figure 410 presents findings on the attitudes toward the financial impact of ED Resource assistance irrespective of clientsrsquo reasons for seeking assistance The frequency of ED Resource clients that indicated they were able to increase profit margin retain current staff hire new staff or increase sales as a result of ED Resource assistance was lower for each category when compared to the previous year The number of 2010 ED Resource clients indicating impactful assistance in each category decreased from the previous year The retaining current staff and increased sales categories each experienced a four percentage point decrease
Figure 410 ndash Total ED Resources ndash Perceived Impact of Assistance44
2008 n = 6770 2009 n = 8493 2010 n = 10146
44 See Appendix 2 for a more detailed response to q4 In addition to the reported findings in the figure above data was also collected for 2010 clientsrsquo perceived impact of assistance regarding the acquisition of a bank loan (16) a SBA guarantee loan (18) and a SBA Disaster loan (18)
Impact Study of Entrepreneurial Development 34Resources ndash 2010-2011
Office of Entrepreneurial Development
Figure 410A shows the perceived financial impact of ED Resources relative to the number of hours of counseling received recorded in two categories less than 3 hours and 3 or more hours of counseling received For comparison the overall level of perceived financial impact is also provided which does not distinguish by hours of counseling
It is notable that across all four categories ED Resource clients with 3 or more hours of counseling reported a greater positive financial impact than total ED Resource clients
For example clients that received 3 or more hours of counseling increased their sales 30 of the time whereas clients that received less than 3 hours of counseling increased their sales 19 of the time
Figure 410A ndash Total ED Resources ndash Perceived Impact of Assistance (Hours of Counseling Received vs Aggregate Hours)
Total ED Resources (ge 3 Hours)
Total ED Resources (Aggregate Hours)
Total ED Resources (lt 3 Hours)
Impact Study of Entrepreneurial Development 35Resources ndash 2010-2011
Office of Entrepreneurial Development
Cross-Sectional Demographic Analysis
This section compares revenues and employment for ED Resource clients by gender race ethnicity and veteran status Figure 411 compares average revenues for firms in each demographic category rounded to the nearest $1000 For example this figure shows that in 2010 firms owned by Females ($385000) were on average smaller than firms owned by Males ($778000) and firms owned by Males and Females ($767000)
Veteran-owned firms had an average of $1035000 in revenue the highest revenues by Veterans in the past three years Over the past year reported revenues for Service-disabled Veterans fell to an average of $727000 Regarding race and ethnicity average revenues fell across all demographic categories
Figure 411 ndash Revenues (000s) for Firms in Selected Demographic Categories45
45 Firms that reported revenues were required to do so within the range of $1000 to $25000000 Due to small sample sizes corresponding figures are not repeated in the individual ED Resource sections of this report
Impact Study of Entrepreneurial Development 36Resources ndash 2010-2011
Office of Entrepreneurial Development
Figure 412 compares employment by demographic category Firms owned by Female clients tended to have fewer employees than firms owned by Male clients however firms with both male and female owners a new category for this year had the highest average employment levels in the gender segment This new category also partially explains the drop in average number of employees for both male firms and for female firms HispanicLatino White and American IndianAlaskan Native firms had more employees than other race and ethnicity demographic categories In each category of firms the average number of employees has gone down from 200946
Figure 412 ndashTotal Employees for Firms in Selected Demographic Categories
46 Due to the small sample size of Service-disabled veterans (42) who reported having employees 2009 results should be treated with caution Due to small sample sizes corresponding figures are not repeated in the individual ED Resource sections of this report
Impact Study of Entrepreneurial Development 37Resources ndash 2010-2011
Office of Entrepreneurial Development
Regression Analysis of the Effects of Gender Race Ethnicity and Veteran Status on Key ED Resource Impacts
The following section presents findings from an analysis of the effects of firm and client characteristics on ED Resource impacts We report results from a series of multiple regression analyses These were conducted to test whether respondents differed significantly in perceived usefulness quality of counseling experience and financial impacts of ED Resource assistance based on selected firm (revenues business segment ED Resource contact hours) and demographic (age gender race ethnicity veteran status) characteristics
These analyses address the following research questions
1 Are there differences in perceived usefulness based on firm size business segment ED Resource geographic location hours of counseling age of owner(s) gender race ethnicity or veteran status
2 Are there differences in perceived assistance with the decision to start a business based on firm size business segment ED Resource geographic location hours of counseling age of owner(s) gender race ethnicity or veteran status
3 Are there differences in the financial impact of ED resource assistance based on firm size business segment ED Resource geographic location hours of counseling age of owner(s) gender race ethnicity or veteran status
Each regression model examined the impact of selected demographic characteristics (age gender race ethnicity and veteran status) and firm characteristics (size business segment ED Resource geographic location hours of counseling received) on a particular resource impact These impacts included perceived usefulness of ED Resource assistance perceived quality of the counseling experience perceived assistance with the decision to start a business and perceived financial impacts (sales cash flow hiring and profits)
Each resource impact is used as a dependent (ie outcome) variable For example the dependent variable for the first model is perceived usefulness of ED Resource assistance The dependent variable for the second model is perceived quality of the counseling experience The dependent variable for the third model is perceived assistance with the decision to start a business The dependent variable for the fourth model is a financial impact score which is a summary measure based on 4 self-reported financial impact measures (the effect of assistance on increases in sales cash flow new hires and profit margins)47
47 Consistent with previous analyses this scale is the sum of the following questionnaire items q51 q52 q55 and q57 Survey questions can be found in the survey instrument in Appendix 4
Impact Study of Entrepreneurial Development 38Resources ndash 2010-2011
Office of Entrepreneurial Development
The set of independent or predictor variables included variables representing the firm and client demographic characteristics include the following
Sales Revenues Client Segment
o Nascent o Start-Up o In-Business
ED Resource (SBDC SCORE or WBC) Geographic Location (Urban suburban rural) Number of hours of assistance (less than 3 3 or more) Respondent Age Gender Race
o Hispanic o American Indian o Asian o BlackAfrican-American o Native HawaiianPacific Islander
Ethnicity o HispanicLatino
Veteran or Service-disabled Veteran
Regression Results
In the results presented in this section statistically significant predictor variables are identified48
Detailed regression results are presented in Appendix 6
The first regression model tested for a relationship between selected firm and client characteristics and the clientrsquos perception of the usefulness of the servicesassistance received 49
Results of this regression suggest that larger firms reported higher levels of perceived usefulness of ED Resource assistance than smaller firms Firms who received less than 3 hours of assistance reported lower levels of perceived usefulness than firms with 3 or more hours of counseling Additionally firms in the In-business segment also reported significantly higher perceived usefulness from ED resource assistance
In terms of client demographics there were no significant differences in perceived usefulness based on age gender veteran status or ethnicity Native American and White clients
48 Relationships are considered statistically-significant at the 005 level Marginal significance is defined as significant at the 010 level 49 The overall model was statistically significant at the 001 level although the R2 a measure of model fit was very small (00149) Coefficients reported here were significant at the 010 level The usable sample size was 2427 Firms with revenue greater than $5000000 and less than $1000 were removed from all regression analyses as were firms with unknown business segment The revenue upper bound of $5 million was used in order to eliminate bias resulting from potential outliers skewing the distributionrsquos measures of central tendency
Impact Study of Entrepreneurial Development 39Resources ndash 2010-2011
Office of Entrepreneurial Development
reported significantly higher perceived usefulness but there were no other differences based on race
The second regression model tested for a relationship between selected firm and client characteristics and perceived ED resource assistance with the decision to start a business50
Consistent with the previous yearrsquos results this analysis suggests that larger firms firms in the In-Business segment and SCORE clients were less likely to report that their decision to start a business was the result of ED resource assistance However there were no significant differences based on any other firm or client demographic characteristics
The third regression model tested for a relationship between selected firm and client characteristics and the self-reported financial impact of ED Resource assistance These impacts include a combination of increases in sales cash flow hiring of new employees and profits51 These results provided no significant results even at a 010 level indicating that no firm level or client demographic characteristics affected the perception of the financial impact of ED Resource assistance
These regression analyses indicate that both firm and client characteristics can be significant determinants of the clientrsquos perception of the usefulness of the servicesassistance received perceived assistance with the decision to start a business or the financial impact of assistance received
Variations in perceived usefulness perceived assistance with the decision to start a business and financial impacts are due in part to differences in firm size ED Resource and hours of assistance Geographic location did not play a significant role in any regression model In addition in some cases there were significant effects of gender age and ethnicity However none of these effects were consistent across outcomes
50 This model was estimated using a logistic regression analysis due to the binary dependent variable (q1c) The overall model was significant at the plt001 level although the pseudo R2 was small (00884) Coefficients reported here were significant at the 010 level Survey questions can be found in the survey instrument in Appendix 4 51 The overall model was not significant at the 010 level the R2 was extremely small (0008)
Impact Study of Entrepreneurial Development 40Resources ndash 2010-2011
Office of Entrepreneurial Development
V SBDC 2010 VS TOTAL ED RESOURCES
The following section presents results from SBDC clients52 First we report the general demographic and financial characteristics of SBDC 2010 clients This is followed by additional findings on the usefulness of SBDC for Nascent Start-up and In-Business firms organized by research question as follows
Is there a relationship between servicesassistance provided by SBDC and the clientrsquos perception of the usefulness and value of servicesassistance received
Is there a relationship between the servicesassistance provided by SBDC and the clientrsquos decision to start a business
Is there a relationship between the servicesassistance provided by SBDC and the clientrsquos decision to implement andor change management andor marketing practices in their business
Are the servicesassistance provided by SBDC having an impact on the clientrsquos financial position in terms of job creation job retention and sales
52 All references to ED Resource clients pertain to ED Resource Partnersrsquo face-to-face counseling clients who received assistance from a designated ED Resource Partner (SBDCSCOREWBC)
Impact Study of Entrepreneurial Development 41Resources ndash 2010-2011
Office of Entrepreneurial Development
Analysis of the Attitudes of SBDC Clients Regarding the Assistance They Received from SBDC
Demographic Characteristics of SBDC Clients
This section describes the general demographic and financial characteristics of SBDC clients These results are based on an analysis of 5113 completed surveys As shown in Figure 51 the largest business segment served by SBDC is the In-Business segment (59) which is five percentage points higher than total ED Resources
Figure 51 ndash SBDC ndash Distribution of Clients by Segment (2010 Clients)53
SBDC vs Total ED Resources
SBDC n = 5113 Total ED Resources n = 10146
Table 51 compares revenues and employment for SBDC vs total ED Resources These results indicate that SBDC clients have higher revenues than total ED Resource clients
Table 51 ndash SBDC Client Revenues and Employment (2010)
Total ED Total ED SBDC SBDC Resources Resources
Average Revenue $774000 $637200 Average Employees 5 4
53 Respondents who reported being in business but who did not provide a valid start date for that business were not assigned to a business segment Therefore the total of client segments served for SBDC may not equal 100
Impact Study of Entrepreneurial Development 42Resources ndash 2010-2011
Office of Entrepreneurial Development
Demographic characteristics of SBDC clients including gender race ethnicity and veteran status are reported in Figure 5254 The demographic makeup of SBDC was comprised of a smaller percentage of Females and a higher percentage of Males than total ED Resources by four and two percentage points respectively Other demographic proportions followed a pattern similar to those of total ED Resources
Figure 52 ndash SBDC ndash Demographic Characteristics (2010 Clients)55
SBDC vs Total ED Resources
SBDC n = 5113 Total ED Resources n = 10146
54 The Veteran and Service-disabled Veteran categories are shown in the figure above Additional results for SBDC clients included Reservist (03) and National Guard Member (04) 55 The total may not equal 100 due to non-respondents and those who selected multiple ethnicities The SBDC demographic distribution was compared to the national averages from the SBO The distribution was comparable across characteristics except for the following SBO figures White business owners were 83 of the small business population Female business owners were 29 Male business owners were 51 and American IndianAlaskan Native business owners were less than 1
Impact Study of Entrepreneurial Development 43Resources ndash 2010-2011
Office of Entrepreneurial Development
Figure 53 shows the distribution of SBDC clients by age of business owner The largest age group served was between the ages of 45 and 54 (29) SBDC clientsrsquo age distribution was consistent with that of total ED Resources
Figure 53 ndash SBDC ndash Age of Business Owner (2010 Clients)56
SBDC vs Total ED Resources
SBDC n = 5113 Total ED Resources n = 10146
56 The SBDC age distribution was compared to the national averages from the SBO The distribution was comparable across characteristics except that SBO reported 65+ at 125 (compared to 5 for SBDC)
Impact Study of Entrepreneurial Development 44Resources ndash 2010-2011
Office of Entrepreneurial Development
Figure 54 shows that the most common types of businesses served by SBDC were in the service and retail categories57 These results are generally consistent with the national averages from the SBO Results that were not consistent included Manufacturing reported in the SBO to be 2 Construction reported to be 13 and Health Care reported to be 958 Also the figure shows the share of SBDC clients in the manufacturing construction technology and restaurant andor eating and drinking industries was higher than total ED Resources
Figure 54 ndash SBDC ndash Type of Business (2010 Clients) 59
SBDC vs Total ED Resources
57 The top 11 categories for 2010 SBDC clients are displayed in the figure above Additional results included Finance Insurance and Real Estate (3) Education (2) Entertainment (2) Publishing (1) Transportation (1) Engineering (2) Day Care (1) 58 Other SBO results that differed with the findings included Finance Insurance and Real Estate (14) and Transportation (5) Industry classifications are not identical 59 Due to non-responses and multiple business type selections the total for all business types might not equal 100
Impact Study of Entrepreneurial Development 45Resources ndash 2010-2011
Office of Entrepreneurial Development
SBDC Client Attitudes Regarding ED Resource Assistance
Usefulness and Value of Services or Assistance Received
Approximately 74 of SBDC clients reported that the information they received from counselors was valuable60 Figure 55 shows ratings of usefulness of SBDC ED Resources provided by business segment and compared to total ED Resources SBDC Nascent firms rated the usefulness of information somewhat higher than Start-up and In-Business firms Nascent and Start-up clients both highly rated the usefulness of the assistance received more often than did total ED Resource clients
Figure 55 ndash SBDC ndashUsefulness of SBDC (2010 Clients)61
SBDC vs Total ED Resources
60 This result does not appear in the figure above which is displayed by business segment This figure was calculated for SBDC clients overall without regard to business segment 61 Low value includes the lsquoSomewhat Valuablersquo and lsquoNot Valuablersquo response categories High value includes the lsquoExtremely Valuablersquo and lsquoValuablersquo response categories
Impact Study of Entrepreneurial Development 46Resources ndash 2010-2011
Office of Entrepreneurial Development
Figure 55A below shows the perceived usefulness of SBDC assistance based upon the number of hours of counseling received Figure 55A shows that SBDC clients who received 5 or more hours of counseling rated usefulness as ldquohighrdquo more frequently than those SBDC clients who received less than 5 hours of counseling
Figure 55A ndash Usefulness of SBDC SBDC by Hours of Counseling vs Total ED Resources Aggregate Hours (2010 Clients)
Impact Study of Entrepreneurial Development 47Resources ndash 2010-2011
Office of Entrepreneurial Development
Clientsrsquo Decision to Change Management Practices
Figure 56 compares SBDC client decisions to change management practices or strategies by business segment As a result of SBDC assistance 56 of Start-up firms changed their management practices or strategies and 58 of In-Business clients reported changing management practices or strategies The levels of SBDC Start-up and In-Business clients that changed their management practices were slightly below those for total ED Resource clients
Figure 56 ndash SBDC ndash Changed Management PracticesStrategies as a Result of SBDC ED Resource Assistance (2010 Clients)
SBDC vs Total ED Resources
Impact Study of Entrepreneurial Development 48Resources ndash 2010-2011
Office of Entrepreneurial Development
Figure 57 below reflects the percentage of firms reporting that SBDC assistance led to the development of business plans marketing plans etc 62 The percentage of SBDC clients that sought assistance with the development of business plans cash flow analyses or preparation of loan packages was higher than that of total ED Resources
Figure 57 ndash SBDC ndash Assistance in Plan Development (2010 Clients)
SBDC vs Total ED Resources
62 The 2010 results for the top 11 categories are displayed in the figure above Additional results included Hiring plan (5) Purchasing Strategy (4) Production Plan (4) Distribution Plan (3) Training Plan for Staff (4) and International Trade (2)
Impact Study of Entrepreneurial Development 49Resources ndash 2010-2011
Office of Entrepreneurial Development
Sales Job Creation and Job Retention
Figure 58 compares SBDC Start-up and In-Business clients in terms of reported financial impact of SBDC assistance on sales profits jobs and the retention of employees irrespective of reasons for seeking assistance63 SBDC Start-up firms reported lower perceived levels of impact regarding both hiring new staff and retaining current staff when compared to total ED Resources SBDC In-Business clientsrsquo reported financial impact surpassed total ED Resources in each category
Figure 58 ndash SBDC ndash Perceived Impact of Assistance (2010 Clients)
SBDC vs Total ED Resources
63 This comparison excludes the Nascent category for total ED Resources and SBDC
Impact Study of Entrepreneurial Development 50Resources ndash 2010-2011
Office of Entrepreneurial Development
Figure 58A compares SBDCrsquos financial impact of assistance on sales profits jobs and the retention of employees to the financial impact results for total ED Resources presented by hours of counseling received The number of hours of counseling received is divided into three categories for SBDC less than 3 hours from 3 to less than 5 hours and 5 or more hours
SBDC clients who received 5 or more hours of counseling reported greater perceived impact of assistance than total ED Resources in each of the categories below For example 41 of clients that received 5 or more hours of SBDC counseling reported an increase in sales and 34 of clients that received 5 or more hours reported an increase in profit margins Total ED Resources reported 34 and 30 in the same categories respectively
Figure 58A ndash SBDC ndash Perceived Impact of Assistance SBDC Hours of Counseling Received for In-Business and Start-ups vs Total ED Resources Aggregate Hours for In-Business and Start-ups (2010 Clients)
Impact Study of Entrepreneurial Development 51Resources ndash 2010-2011
Office of Entrepreneurial Development
[This page is intentionally left blank for two-sided printing]
Impact Study of Entrepreneurial Development 52Resources ndash 2010-2011
Office of Entrepreneurial Development
VI SCORE 2010 VS TOTAL ED RESOURCES
The following section presents results from SCORE clients64 First we report the general demographic and financial characteristics of SCORE clients as provided by 2010 clients This is followed by additional findings on the usefulness of SCORE for Nascent Start-up and In-Business firms organized by research question as follows
Is there a relationship between servicesassistance provided by SCORE and the clientrsquos perception of the usefulness and value of servicesassistance received
Is there a relationship between the servicesassistance provided by SCORE and the clientrsquos decision to start a business
Is there a relationship between the servicesassistance provided by SCORE and the clientrsquos decision to implement andor change management andor marketing practices in their business
Are the servicesassistance provided by SCORE having an impact on the clientrsquos financial position in terms of job creation job retention and sales
64 All references to ED Resource clients pertain to ED Resource Partnersrsquo face-to-face counseling clients who received assistance from a designated ED Resource Partner (SBDCSCOREWBC)
Impact Study of Entrepreneurial Development 53Resources ndash 2010-2011
Office of Entrepreneurial Development
Analysis of the Attitudes of SCORE Clients Regarding the Assistance They Received from SCORE
Demographic Characteristics of SCORE Clients
This section describes the general demographic and financial characteristics of SCORE clients These results are based on an analysis of 4444 completed surveys As shown in Figure 61 the largest business segment served by SCORE was the In-Business segment (49) which is five percentage points lower than the In-Business segment for total ED Resources The Nascent segment was the second largest at 29 and measures three percentage points higher than total ED Resources
Figure 61 ndash SCORE ndash Distribution of Clients by Segment (2010 Clients)65
SCORE vs Total ED Resources
SCORE n = 4444 Total ED Resources n = 10146
Table 61 compares revenues and employment for SCORE clients vs total ED Resources SCORE client revenues are lower than the average for total ED Resources
Table 61 ndash SCORE Client Revenues and Employment (2010)
Total ED SCORE Resources
Average Revenue $502000 $637200 Average Employees 3 4
65 Respondents who reported being in business but who did not provide a valid start date for that business were not assigned to a business segment The total of client segments served for SCORE will therefore not equal 100
Impact Study of Entrepreneurial Development 54Resources ndash 2010-2011
SCORE Total ED Resources
Office of Entrepreneurial Development
Demographic characteristics of SCORE clients including gender race ethnicity and veteran status are reported in Figure 6266 The demographic distribution of SCORE clients follows closely to the pattern of total ED Resources clients overall The percentage of White clients (70) in SCORErsquos demographic makeup is slightly higher than that of total ED Resources (68)
Figure 62 ndash SCORE ndash Demographic Characteristics (2010 Clients)67
SCORE vs Total ED Resources
SCORE n = 4444 Total ED Resources n = 10146
66 The Veteran and Service-disabled Veteran categories are shown in the figure above Additional results for SCORE clients included Reservist (04) and National Guard Member (04) 67 In some instances the total may not equal 100 due to non-respondents and respondents who selected multiple ethnicities The SCORE demographic distribution was compared to the national averages from the SBO The distribution was comparable across characteristics except for the following SBO figures White business owners were 83 of the small business population Female business owners were 29 and Male business owners were 51
Impact Study of Entrepreneurial Development 55Resources ndash 2010-2011
Office of Entrepreneurial Development
Figure 63 shows the distribution of SCORE clients by age of business owner The largest age group served was between the ages of 45 and 54 (27) SCORE clientsrsquo age distribution was consistent with that of total ED Resources
Figure 63 ndash SCORE ndash Age of Business Owner (2010 Clients)68
SCORE vs Total ED Resources
SCORE n = 4444 Total ED Resources n = 10146
68 The SCORE age distribution was compared to the national averages from the SBO The distribution was comparable except that SBO reported 65+ at 125 (compared to 5 for SCORE)
Impact Study of Entrepreneurial Development 56Resources ndash 2010-2011
Office of Entrepreneurial Development
Figure 64 shows that the most common types of businesses served by SCORE were in the service and retail categories69 These results are generally consistent with the national averages from the SBO Results that were not consistent included Manufacturing reported in the SBO to be 2 Construction reported to be 13 and Health Care reported to be 970 Also the figure shows the share of SCORE clients in the technology restaurant andor eating and drinking industries was lower than total ED Resources
Figure 64 ndash SCORE ndash Type of Business (2010 Clients)71
SCORE vs Total ED Resources
69The top 11 categories for 2010 clients are displayed in the figure above Additional results for 2010 included Finance Insurance and Real Estate (3) Education (3) Entertainment (2) Publishing (1) Transportation (1) Engineering (1) Day Care (1) 70 Other SBO results that differed from the findings included Finance Insurance and Real Estate (14) and Transportation (5) Industry classifications are not identical 71 Due to non-responses and multiple business type selections the total for all business types may not equal 100
Impact Study of Entrepreneurial Development 57Resources ndash 2010-2011
Office of Entrepreneurial Development
SCORE Client Attitudes Regarding ED Resource Assistance
Usefulness and Value of Services or Assistance Received
Approximately 73 of SCORE clients reported that the information they received from counselors was valuable72 Figure 65 shows ratings of usefulness of SCORE provided by business segment and compared to total ED Resources For SCORE clients it is apparent that Start-up clients reported high levels of usefulness regarding the assistance they received somewhat less often when compared to other business segments
Figure 65 ndash SCORE ndashUsefulness of SCORE (2010 Clients)73
SCORE vs Total ED Resources
72 This result does not appear in the figure above which is displayed by business segment This percentage was calculated for SCORE clients overall without regard to business segment 73 Low value includes the lsquoSomewhat Valuablersquo and lsquoNot Valuablersquo response categories High value includes the lsquoExtremely Valuablersquo and lsquoValuablersquo response categories
Impact Study of Entrepreneurial Development 58Resources ndash 2010-2011
Office of Entrepreneurial Development
Figure 65A below shows the perceived usefulness of SCORE assistance based upon the number of hours of counseling received Figure 65A shows that 78 of SCORE clients that received 3 or more hours of counseling rated SCORE usefulness as ldquohighrdquo compared to 68 of clients that received less than 3 hours of counseling
Figure 65A ndash Usefulness of SCORE SCORE by Hours of Counseling vs Total ED Resources Aggregate Hours (2010 Clients)
Impact Study of Entrepreneurial Development 59Resources ndash 2010-2011
Office of Entrepreneurial Development
Clientsrsquo Decision to Change Management Practices
Figure 66 compares SCORE client decisions to change management practices or strategies by business segment As a result of SCORE assistance 58 of Start-up firms changed their management practices or strategies and 67 of In-Business clients reported changing management practices or strategies The levels for SCORE Start-up and In-Business clients that changed their management practices and strategies were higher than those for total ED Resources
Figure 66 ndash SCORE ndash Changed Management PracticesStrategies as a Result of SCORE ED Resource Assistance (2010 Clients)
SCORE vs Total ED Resources
Impact Study of Entrepreneurial Development 60Resources ndash 2010-2011
Office of Entrepreneurial Development
Figure 67 below reflects the percentage of firms reporting that SCORE assistance led to the development of business plans marketing plans etc74 The percentage of SCORE clients that sought assistance with pricing strategies (15) was higher than that of total ED Resources (14) SCORE clients reported receiving assistance somewhat less often than total ED Resources for most other categories
Figure 67 ndash SCORE ndash Assistance in Plan Development (2010 Clients)
SCORE vs Total ED Resources
74 The 2010 results for the top 11 categories are displayed in the figure above Additional results for included Hiring plan (4) Purchasing Strategy (4) Production Plan (3) Distribution Plan (3) Training Plan for Staff (3) and International Trade (1)
Impact Study of Entrepreneurial Development 61Resources ndash 2010-2011
Office of Entrepreneurial Development
Sales Job Creation and Job Retention
Figure 68 compares SCORErsquos Start-up and In-Business clients in terms of the reported financial impact of SCORE assistance on sales profits jobs and the retention of employees irrespective of reasons for seeking assistance75 Twenty-five percent of Start-up clients reported that they were able to increase sales as a result of SCORE assistance compared to 34 for total ED Resources Twenty-one percent and 16 of SCORE In-Business clients reported that they were able to retain current staff and hire new staff respectively slightly higher than total ED Resources (20 and 15)
Figure 68 ndash SCORE ndash Perceived Impact of Assistance (2010 Clients)
SCORE vs Total ED Resources
75 This comparison excludes the Nascent category for total ED Resources and SCORE
Impact Study of Entrepreneurial Development 62Resources ndash 2010-2011
Office of Entrepreneurial Development
Figure 68A compares SCORErsquos financial impact of assistance for increasing sales profits jobs and the retention of employees to the financial impact results for total ED Resources presented by hours of counseling received The number of hours of counseling received is divided into two categories for SCORE less than 3 hours and 3 or more hours It is apparent from the figure below that except for the retain current staff category the greater the number of hours of counseling received the greater the perceived impact of assistance reported by SCORE In-Business and Start-up clients
Figure 68A ndash SCORE ndash Perceived Impact of Assistance SCORE Hours of Counseling Received for In-Business and Start-ups vs Total ED Resources Aggregate Hours for In-Business and Start-ups (2010 Clients)
Impact Study of Entrepreneurial Development 63Resources ndash 2010-2011
Office of Entrepreneurial Development
[This page is intentionally left blank for two-sided printing]
Impact Study of Entrepreneurial Development 64Resources ndash 2010-2011
Office of Entrepreneurial Development
VII WBC 2010 VS TOTAL ED RESOURCES
The following section presents results from WBC clients76 First we report the general demographic and financial characteristics of WBC clients as provided by 2010 clients This is followed by additional findings on the usefulness of WBC for Nascent Start-up and In-Business firms organized by research question as follows
Is there a relationship between servicesassistance provided by WBC and the clientrsquos perception of the usefulness and value of servicesassistance received
Is there a relationship between the servicesassistance provided by WBC and the clientrsquos decision to start a business
Is there a relationship between the servicesassistance provided by WBC and the clientrsquos decision to implement andor change management andor marketing practices in their business
Are the servicesassistance provided by WBC having an impact on the clientrsquos financial position in terms of job creation job retention and sales
76 All references to ED Resource clients pertain to ED Resource Partnersrsquo face-to-face counseling clients who received assistance from a designated ED Resource Partner (SBDCSCOREWBC)
Impact Study of Entrepreneurial Development 65Resources ndash 2010-2011
Office of Entrepreneurial Development
Analysis of the Attitudes of WBC Clients Regarding the Assistance They Received from WBC
Demographic Characteristics of WBC Clients
This section describes the general demographic and financial characteristics of WBC clients These results are based on an analysis of 589 completed surveys As shown in Figure 71 the largest business segment served by WBC is the In-Business segment Fifty percent of WBC respondents were In-Business clients compared to 54 of total ED Resource clients The figure also shows that there was a greater share of WBC clients in the Nascent segment (31) compared to total ED Resources (26)
Figure 71 ndash WBC ndash Distribution of Respondents by Segment (2010 Clients)77
WBC vs Total ED Resources
WBC n = 589 Total ED Resources n = 10146
Table 71 compares revenues and employment for WBC clients vs total ED Resources These results indicate that WBC clients are smaller in terms of revenues and number of employees than total ED Resources combined
Table 71 ndash WBC Client Revenues and Employment (2010)
Total ED WBC Resources
Average Revenue $171300 $637200 Average Employees 3 4
WBC Total ED Resources
77 Respondents who reported being in business but who did not provide a valid start date for that business were not assigned to a business segment The total of client segments served for WBC therefore may not equal 100
Impact Study of Entrepreneurial Development 66Resources ndash 2010-2011
Office of Entrepreneurial Development
Demographic characteristics of WBC clients including gender race ethnicity and veteran status are reported in Figure 7278 Not surprisingly about 62 of WBC clients are Female A noteworthy 24 of WBC clients are BlackAfrican American compared to 11 for total ED Resources HispanicLatino clients represent 8 of WBC clients WBC serves a small share of Veterans (5) and Service-disabled veterans (1)
Figure 72 ndash WBC ndash Demographic Characteristics (2010 Clients)79
WBC vs Total ED Resources
WBC n = 589 Total ED Resources n = 10146
78 The Veteran and Service-disabled Veteran categories are shown in the figure above Additional results for WBC clients included Reservist (02) and National Guard Member (00) 79 In some instances the total percentage might not equal 100 due to non-respondents and respondents who selected multiple ethnicities The WBC demographic distribution was compared to the national averages from the SBO The distribution was comparable across characteristics except for the following SBO figures White business owners were 82 of the small business population BlackAfrican American business owners were 12 and Asian business owners were 7
Impact Study of Entrepreneurial Development 67Resources ndash 2010-2011
Office of Entrepreneurial Development
Figure 73 shows the distribution of WBC clients by age of business owner The largest age group served was between the ages of 35-44 which accounts for 24 of WBC clients compared to 22 of total ED Resource clients Approximately 44 of WBC clients were between 18 and 44 years of age making WBC the youngest demographic of the three ED Resources
Figure 73 ndash WBC ndash Age of Business Owner (2009 Clients)80
WBC vs Total ED Resources
WBC n = 589 Total ED Resources n = 10146
80 The 2010 WBC age distribution was compared to the national averages for women-owned businesses from the SBO The distribution was comparable except for the following SBO figures 25-34 was 11 (compared to 18 for WBC) and 65+ was reported at 10 (compared to 5 for WBC)
Impact Study of Entrepreneurial Development 68Resources ndash 2010-2011
Office of Entrepreneurial Development
Figure 74 shows that the most common types of businesses served by WBC besides other were in the service and retail categories81 These results are generally consistent with the national averages from the SBO for women-owned firms Results that were not consistent included Health Care reported to be 16 in the SBO and Manufacturing reported in the SBO to be 182 The figure also shows the share of WBC clients in the service retail and consulting industries was higher than that of total ED Resources while the share of clients in the manufacturing construction technology and health care industries was lower than total ED Resources
Figure 74 ndash WBC ndash Type of Business (2010 Clients)83
WBC vs Total ED Resources
81 The top 11 categories for 2010 clients are displayed in the figure above Additional results included Finance Insurance and Real Estate (4) Education (3) Entertainment (1) Publishing (1) Transportation (3) Engineering (1) Day Care (2) 82 Other SBO results that differed from the findings included Finance Insurance and Real Estate (11) Industry classifications are not identical 83 Due to non-responses and multiple business type selections the total for all business types might not equal 100
Impact Study of Entrepreneurial Development 69Resources ndash 2010-2011
Office of Entrepreneurial Development
WBC Client Attitudes Regarding ED Resource Assistance
Usefulness and Value of Services or Assistance Received
Approximately 72 of WBC clients reported that the information they received from counselors was valuable84 Figure 75 shows ratings of usefulness of WBC provided by business segment and compared to total ED Resources WBC Nascent clients more often rated assistance as useful (78) than did total ED Resources (73) Start-up and In-Business clients rated assistance as useful less often (68) than total ED Resources
Figure 75 ndash WBC ndash Usefulness of WBC (2010 Clients)85
WBC vs Total ED Resources
84 This result does not appear in the figure above which is displayed by business segment This percentage was calculated for WBC clients overall without regard to business segment 85 Low value includes the lsquoSomewhat Valuablersquo and lsquoNot Valuablersquo response categories High value includes the lsquoExtremely Valuablersquo and lsquoValuablersquo response categories
Impact Study of Entrepreneurial Development 70Resources ndash 2010-2011
Office of Entrepreneurial Development
Figure 75A below shows the perceived usefulness of WBC assistance based upon the number of hours of counseling received Figure 75A shows that 76 of WBC clients that received more than 3 or more hours of counseling rated WBC usefulness ldquohighrdquo as compared to 69 of clients that received less than 3 hours of counseling
Figure 75A ndash Usefulness of WBC WBC by Hours of Counseling vs Total ED Resources Aggregate Hours (2010 Clients)
WBC vs Total ED Resources
Impact Study of Entrepreneurial Development 71Resources ndash 2010-2011
Office of Entrepreneurial Development
Clientsrsquo Decision to Change Management Practices
Figure 76 compares WBC client decisions to change management practices or strategies by business segment As a result of WBC assistance 62 of Start-up clients and 64 of In-Business clients reported changing their management practices or strategies The percentages of WBC Start-up and In-Business clients that changed their management practices were higher than that of total ED Resource clients
Figure 76 ndash WBC ndash Changed Management PracticesStrategies as a Result of WBC ED Resource Assistance (2010 Clients)
WBC vs Total ED Resources
Impact Study of Entrepreneurial Development 72Resources ndash 2010-2011
Office of Entrepreneurial Development
Figure 77 below reflects the percentage of firms reporting that WBC ED Resource assistance led to the development of business plans marketing plans etc86 The percentage of WBC clients that sought assistance with in the Other category (7) was less than that of total ED Resources (8) WBC clients reported receiving assistance as often or more often than total ED Resources for all other categories
Figure 77 ndash WBC ndash Assistance in Plan Development (2010 Clients)
WBC vs Total ED Resources
86 The 2010 results for the top 11 categories are displayed in the figure above Additional results included Hiring plan (5) Purchasing Strategy (4) Production Plan (4) Distribution Plan (3) Training Plan for Staff (3) and International Trade (2)
Impact Study of Entrepreneurial Development 73Resources ndash 2010-2011
Office of Entrepreneurial Development
Sales Job Creation and Job Retention
Figure 78 compares WBC Start-up and In-Business clients in terms of the reported financial impact of WBC assistance on sales profits jobs and the retention of employees irrespective of reasons for seeking assistance87 Start-up and In-Business clients reported that WBC assistance resulted in increased profit margin and increased sales substantially more often than total ED Resource clients For example 39 of Start-up clients and 42 of In-Business clients reported an increase in sales as compared to 34 of total ED Resources
Figure 78 ndash WBC ndash Perceived Impact of Assistance (2010 Clients)
WBC vs Total ED Resources
87 This comparison excludes the Nascent category for total ED Resources and WBC
Impact Study of Entrepreneurial Development 74Resources ndash 2010-2011
Office of Entrepreneurial Development
Figure 78A compares WBCrsquos financial impact of assistance on sales profits jobs and the retention of employees to the financial impact results for total ED Resources presented by hours of counseling received The number of hours of counseling received is divided into two categories for WBC less than 3 hours and 3 or more hours
Clients that received 3 or more hours of counseling reported higher impact in all categories compared to clients who received less than 3 hours of counseling The largest disparity occurred in the retain current staff category where there was a difference of 17 percentage points between clients who received 3 or more hours and those who received less than 3 hours
Figure 78A ndash WBC ndash Perceived Impact of Assistance WBC Hours of Counseling Received for In-Business and Start-ups vs Total ED Resources Aggregate Hours for In-Business and Start-ups (2010 Clients)
Impact Study of Entrepreneurial Development 75Resources ndash 2010-2011
Office of Entrepreneurial Development
[This page is intentionally left blank for two-sided printing]
Impact Study of Entrepreneurial Development 76Resources ndash 2010-2011
Office of Entrepreneurial Development
VIII FOLLOW-UP STUDY RESULTS 2008 amp 2009 CLIENTS In this section Concentrance reports findings from our analysis of follow-up surveys of 2008 and 2009 ED Resource clients88 These follow-up surveys were conducted in order to examine the impact of ED Resource assistance over time This yearrsquos follow-up study of 2008 ED Resource clients represents the second follow-up study of this sample The first follow-up survey of this group was conducted as part of the previous yearrsquos study in 2010 The follow-up study of 2009 ED Resource clients is the first follow-up study of these clients
This analysis addresses the following key research questions
What was the rate of transition of Nascent and Start-up firms to the In-Business segment Based on a comparison with the Panel Study of Entrepreneurial Dynamics II89 (PSED II)
what is the impact of ED Resource assistance on firm survival What was the financial impact of servicesassistance provided by SBA ED Resources in
terms of job creation job retention and sales How does the difference in growth rate of ED Resource clients from 2009 to 2010 compare
with key benchmarks such as the gross domestic product (GDP) the Entrex Private Company Index (PCI) and the Standard and Poorrsquos Small Cap Index90
Follow-up Methodology
There were 6770 respondents to the Initial Economic Impact Survey of 2008 clients Of these Concentrance was able to collect follow-up data from 854 respondents These respondents were re-contacted for the second follow up survey Of these Concentrance was able to collect follow-up data from 200 respondents for which detailed data can be tracked to 2011
There were 8493 respondents to the Initial Impact Survey of 2009 clients Of these Concentrance was able to collect follow-up data from 1968 respondents for which detailed data can be tracked to 2011
2008 Clients Sample Size Response Rate Initial Study 6770 29 1st Follow-up 854 13 2nd Follow-up 200 23 2009 Clients Sample Size Response Rate Initial Study 8493 23 1st Follow-up 1968 23
88 All references to ED Resource clients pertain to ED Resource Partnersrsquo face-to-face counseling clients who received assistance from a designated ED Resource Partner (SBDCSCOREWBC) 89 The Panel Study of Entrepreneurial Dynamics II is a nationwide multi-million dollar survey of nascent entrepreneurs funded by the Kauffman Foundation The primary purpose of the study is to identify adults active in business creation obtain detailed information about the start-up effort and perform follow-up interviews to determine outcomes We rely on the PSED I and PSED II as benchmarks however results must also be interpreted with caution due to potential response bias and definitional differences in the ways that firms are classified 90 The three benchmarks used for comparison of SBA ED Resources are GDP - Source httpwwwbeagovnationalxlsgdpchgxls the Private Company Index (PCI) - published by Entrex this index measures revenue performance in the sector of private companies ranging from $3 million to $60 million in annual revenues (httpwwwprivatecompanyindexcom) and the S amp P SmallCap 600 Index - represents approximately 3 of the US market and includes 600 lsquosmall caprsquo companies with market capitalizations between $300 million and $2 billion The SampP SmallCap 600 Index is a commonly used benchmark for growth
Impact Study of Entrepreneurial Development 77Resources ndash 2010-2011
y
f
Office of Entreprreneurial DDevelopm ment
Changess in Businesss Segmentss from 2009 tto 2011
What is tthe rate of trransition of Nascent annd Start-up firms to thee In-Businesss segment
Figure 811 shows the mmovement oof firms fromm their initial segments to the In-Businness segmentt in 2011 Foor example 557 of 2008 Nascent clients had startted businessees by 2011 FFor 2008 clieents that weree initially in thhe In-Busineess segment 994 remaineed in businesss in 2011 AAdditionally Figure 811 shows the mmovement oof firms fromm their initial 2009 client ssegment to thhe In-Busineess segment iin 2011 Forr example 299 of 2009 NNascent cliennts had transiitioned into tthe In-Businness category bby 2011 By comparisonn according tto a study by Reynolds annd Curtin (20008)91 approximmately 19 of nascent enttrepreneurs inn the PSED II had starteed businessess within two yeears of inceptiion
Figure 81 ndash Traansitions and Survvival of 22008 and 2009 Clieents to 20011 In-Bussiness
91 Paul D Reynolds and RRichard T Curttin (2008) ldquoBu siness Creationn in the United States Panel Sttudy of Entrepreneeurial Dynamicss II Initial Asseessmentrdquo Founddations and Trendds in Entrepreneuurship Vol 4 NNo 3 pgs 155ndashndash307
Impact S tudy of Entrepren neurial Develop pment Resource es ndash 2010-2011 1
78
Office of Entrepreneurial Development
Impact of ED Resource Assistance on Firm Survival
Does ED Resource assistance have a positive impact on firm survival
The PSED II data serve as a benchmark for comparing the proportion of Nascent and Start-up businesses that can now be classified as In-Business firms The PSED II is a sample of nascent entrepreneurs who are in the process of going into business a portion of the sample received some form of counseling or assistance
Figure 82 compares the survival rates for firms in the follow-up study with the PSED II92 These results suggest that businesses that received ED Resource assistance had a higher survival rate than other small businesses such as those randomly sampled for the PSED II For example based on the second follow-up study of 2008 ED Resource clients 93 were still in business after two years In contrast only 80 of PSED II firms remained in business after two years93 Similarly in the follow-up study of 2009 ED Resource clients 96 of these firms remained in business after one year compared to 90 of firms in the PSED II sample
In addition to the PSED II analysis ED Resource client survival rates were higher than reported in other studies For example according to a study published in the Monthly Labor Review two-thirds of new employer firms survive at least two years and about 44 survive at least four94
Figure 82 ndash ED Resource Clients have Higher Survival Rates than PSED II Firms
92Source Parker Simon C (2005) ldquoWhat happens to nascent entrepreneurs An econometric analysis of the PSEDrdquo Entrepreneurship in a Diverse World U S Association for Small Business and Entrepreneurship 93 The PSED II reports the rate of disengagement of start-up firms relative to the time of inception According to Reynolds and Curtin (2008) this period is somewhat arbitrary may not actually capture all start-up activities Thus we report an approximate PSED survival rate based on firms at 1 year and 2 years after inception 94 Survival and Longevity in the Business Employment Dynamics Database Monthly Labor Review May 2005
Impact Study of Entrepreneurial Development 79Resources ndash 2010-2011
Office of Entrepreneurial Development
Does the number of hours of ED Resource assistance have a positive impact on firm survival Figure 83 shows the survival rate of ED Resource clients in each category of counseling hours received for the second follow-up survey of 2008 clients and the first follow-up of 2009 clients In the second follow-up firms receiving 3 or more hours of counseling had a marginally higher survival rate than those that received less than 3 hours of counseling However the relationship between additional counseling hours and survival in the first follow-up sample of 2009 clients is less pronounced
Figure 83 - ED Resource Client Survival by Hours of Counseling
Impact Study of Entrepreneurial Development 80Resources ndash 2010-2011
f
f
Office of Entreprreneurial DDevelopm ment
Changess in Revenuees and Empployees
What is tthe financiaal impact of servicesasssistance proovided by SBA ED Ressources in teerms of job creeation job rretention annd sales
Figure 844 compares 22008 clients iin terms of mmean annual revenues andd number of employees inn the initial andd two subseqquent follow--up studies
Accordinng to this mattched pairs comparison mmean revenuues fell from $413900 in 22008 to $3044200 in 2009 This decline in revenues between 20008 and 2009 iis consistent with the reccessionary conditionns of the econnomy duringg this period However ffor the subseet of firms that survived aand reported revenue dataa mean revennues increaseed to $4677000 in 201095
At the samme time the mean numbber of employyees per firmm decreased frrom 68 to 5 for the first follow-upp year and thhen rose againn to 68 for thhe second foollow-up yearr
Figure 84 - Meaan Revennues and Employmment 20008 Clientts Over TTime
20008 Clients n == 2343 1st Foollow-up n = 2550 2nd Follow--up n = 112
95 Revenue s from Nascentt and unknownn business segmments are not inccluded In adddition Start-up oor In-Business firms with revenuues below $10000 and greater tthan $5 million were excludedd from this analyysis as were firmms with reporteed employees below 1 and abbove 998 The revenue upper bound of $5 mmillion was usedd in order to eli minate bias res sulting from potenntial outliers skeewing the distriibutionrsquos measuures of central ttendency
Impact S tudy of Entrepren neurial Develop pment Resource es ndash 2010-2011 1
81
Office of Entreprreneurial DDevelopm ment
The matcched comparison analysis was repeated for the folllow-up sampple of 2009 cllients Figurre 85 comparess firms in terms of mean annual revennues and nummber of emplloyees in 20009 and in thee first follow-upp survey
Accordinng to this mattched pairs comparison mmean revenuues fell from $414100 in 22009 to $3911400 in 2010 According too a survey off small busineess owners cconducted byy the Nationaal Federationn of Independdent Businessses (NFIB) bbusiness ownners in 2009 reported histtorically low expectationss about groowth and employment annd increasingg concerns abbout inflationn From the low of Jan 22009 optimismm has been coontinuously trending upwward to highs not seen sinnce late 2007 potentially indicativee of a laggingg upturn 96 TThe mean number of empployees per fifirm remainedd essentially flat at just ovver 74
Figure 85 - Meaan Revennues and Employmment 20009 Clientts Over TTime
20099 clients n = 30012 1st Followw-up n = 10144
96Dunkelbeerg William C and Holly Wadde (2009) ldquoNFIIB Small Busineess Economic TTrendsrdquo Marchh httpwwwwnfibcompa gesbet amp httppwwwnfibcoomPortals0PDFsbetsbeet201103pdf
Impact S tudy of Entrepren neurial Develop pment Resource es ndash 2010-2011 1
82
Office of Entreprreneurial DDevelopm ment
The folloowing figures show changges in mean rrevenue and eemployment t for 2009 clieents by ED Resourcee97
Figure 85A Mean SBDCC Revenues and Employmeent 20099 Clients Over TTime
2009 SBBDC Clients n = 1567 1st FFollow-up n = 6637
97 The secoond follow-up ssample of 2008 clients includedd only 200 firmms This samplee is insufficient for a statisticallly meaningfull analysis by inddividual ED Resource
Impact S tudy of Entrepren neurial Develop pment Resource es ndash 2010-2011 1
83
Office of Entreprreneurial DDevelopm ment
Figure 85B Mean SCORRE Revennues and Employmment 20009 Clientts Over TTime
2009 SCCORE Clients nn = 1286 1st FFollow-up n = 323
Impact S tudy of Entrepren neurial Develop pment Resource es ndash 2010-20111
84
Office of Entreprreneurial DDevelopm ment
Figure 85C Mean WBC Revenuees and Emmploymennt 2009 Clients Over TTime
2009 SSCORE Clients n = 159 1st FFollow-up n = 54
Impact S tudy of Entrepren neurial Develop pment Resource es ndash 2010-20111
85
Office of Entreprreneurial DDevelopm ment
Figure 866 provides addditional detaail on the chaange in revennues for 20088 and 2009 cclients For example 53 of 20088 clients havee experiencedd revenue grrowth from 22008 to 2010 Additionallly 65 of 22009 clients realized increased revenuees in 2010 coompared to 335 who expperienced a decline inn revenues
Figure 86 Distrribution oof ED Ressource Clientsrsquo Peercentagee Changee in Revenues98
20009 Clients n = 635 2008 Clieents n = 184
98 Firms wiith revenues bellow $1000 andd greater than $55 million were excluded from this analysis BBecause both 20008 and 2009 fiirms needed to have revenues within these paarameters to es tablish approprriate match critteria needed forr the percent chaange comparisoon the 2008 andd 2009 client coounts will not mmatch those in figures 84 amp 8 85
Impact S tudy of Entrepren neurial Develop pment Resource es ndash 2010-2011 1
86
Office of Entrepreneurial Development
Benchmark Comparisons
Figure 87A and 87B depict firm survival over time as compared to the PSED I and PSED II Figure 87A shows firm survival rates after one year of being in business over a period of six years Figure 87B shows firm survival rates after two years of being in business over a period of five years In both figures the benchmarks for comparison are the PSED I and II which provide data for survival rates of businesses after one and two years of being in business99 ED Resource clients have outpaced the samples from both PSED studies for six consecutive years as shown in the figures below
Figure 87A ndash Firm Survival Rates for ED Resource Clients After One Year (Total ED Resources vs PSED studies)
Figure 87B ndash Firm Survival Rates for ED Resource Clients After Two Years (Total ED Resources vs PSED studies)
99 For years 2007 to 2008 the PSED II with updated data became available and was therefore utilized as the new benchmark PSED I analyzes data collected from nascent entrepreneurs from 1998 - 2000 with three follow-up interviews PSED II analyzes data collected from nascent entrepreneurs from 2005 and 2006 with two follow-up interviews This explains the increased survival rates for the benchmarks on each figure 80 to 90 in 87A and 71 to 80 in 87B
Impact Study of Entrepreneurial Development 87Resources ndash 2010-2011
r
y
Office of Entreprreneurial DDevelopm ment
How doees the growtth of ED Reesource clients compare with key bbenchmarkss of econommic growth
Figure 888 compares tthe differenc e in growth rrate of ED RResource cliennts from 20009 to 2010 too three bennchmarks ndash UUS GDP thhe Private Coompany Indexx (PCI) and the Standardd and Poorrsquos Small Capp Index (SampPP) The GDP growth proovides a conttext of how tthe overall ecconomy is performinng The SampPP represents approximateely 3 of thee US markett and includees 600 lsquosmalll caprsquo companiees with markket capitalizattions betweenn $300 millioon and $2 billlion The PCCI measures revenue pperformance in the sectorr of private ccompanies raanging from $$3 million too $60 million in annual revenues
The diffeerence in growwth rate fromm 2009 to 20010 for SBA EED Resourcce clients wass 134 percenntage points AAlthough all tthree benchmmarks indicatted positive ggrowth durinng this time SSBA ED Resourcee clientsrsquo proggress outpaceed the other benchmarks
Figure 88 ED RResource Client Revenue GGrowth CComparedd to Seleccted Benchmarks - PPercent CChange frrom Prevvious Yeaar100
100 SBA EDD figures are baased on Start-upp or In-Businesss firmsrsquo mean rrevenues from tthe two follow--up surveys conducted in 2010 where clients with revvenue less thann $1000 or greaater than $5 milllion in either year were excludded The revenuue upper boundd of $5 million wwas used in ordder to eliminatee bias resulting ffrom potential outliers skewinng the distributionnrsquos measures off central tendenncy The growthh rates for 20099 and 2010 forr each benchmaark are as followws GDP 20099=-26 2010==29 SampP Smmall Cap 600 2 009=238 20010=251 PCCI 2009=220 2010=298 and SBA ED RResources 2009 =-61 2010==73
Impact S tudy of Entrepren neurial Develop pment Resource es ndash 2010-2011 1
88
Office of Entrepreneurial Development
Summary of Follow-up Study Findings
Firm Survival Approximately 57 of 2008 Nascent clients had transitioned to the In-Business segment after two years while 29 of 2009 Nascent clients had gone into business by the beginning of 2011 At the same time 6 of 2008 of In-Business clients and 3 of 2009 clients went out of business by 2011
In addition in the second follow-up 2008 clients receiving 3 or more hours of counseling had a higher survival rate than those who received less than 3 hours of counseling
Based on a comparison to firms in the PSED II businesses who received ED Resource assistance have a higher survival rate than other small businesses For example the survival rate after two years was 93 for ED Resource clients compared to 80 for firms in the PSED II
Financial Impact and Growth These analyses show that ED Resource assistance has had a significant impact on the revenue and employment growth of small business clients For 2008 clients the recession appears to have had a negative impact on 2009 revenue though revenue increased for these clients in 2010 (2nd follow-up 2008 and 1st follow-up 2009) Surviving 2008 clients in the second follow-up experienced a 54 increase in revenues from 2009 to 2010 Still 47 of 2008 clients experienced some negative growth in revenues since 2008 The difference in growth rates from 2009 to 2010 for SBA ED Resource clients was shown to be 134 percentage points Although all three benchmarks indicated positive growth during this time SBA ED Resource clientsrsquo progress outpaced the other benchmarks Firms in the second 2008 client follow-up sample increased from a mean of 50 employees to a mean of 68 employees Mean employment for firms in the first follow-up of 2009 clients stayed relatively flat with an increase from 73 to 74 employees (See Figures 84 85 86 and 88)
Impact Study of Entrepreneurial Development 89Resources ndash 2010-2011
Office of Entrepreneurial Development
[This page is intentionally left blank for two-sided printing]
Impact Study of Entrepreneurial Development 90Resources ndash 2010-2011
Office of Entrepreneurial Development
IX SUMMARY OF QUANTITATIVE FINDINGS
Initial Impact Study of 2010 Clients
1 What is the demographic financial and business profile of firms who utilize SBA ED Resources
Firms that have been in business for more than one year comprise the In-Business client segment Fifty-four percent of ED Resource clients were in the In-Business category Nascent clients represented 26 of ED Resource clients while the smallest segment Start-up clients represented 19101
The average revenue for firms served by ED Resources is $637200 with four employees Firm size varies by ED Resource For example SBDC clients have higher average revenues at $774000 than SCORE clients at $502000 WBC clientsrsquo revenues are lowest with average revenues of $171300 These revenue figures are lower than client groups studied in 2009
ED Resource clients represented a variety of demographic groups Thirty-six percent of clients were Male 36 Female and 17 of firms had Male and Female owners Sixty-eight percent were White 11 BlackAfrican American 7 HispanicLatino 4 Asian and 2 American IndianNative Alaskan Nine percent of ED Resource clients were Veteran and 2 were Service-disabled Veteran The largest age group served by ED Resources accounting for 28 of the total sample included clients between 45 and 54 years of age
ED Resource clients served during 2010 represented a wide variety of business types The most common industries included service retail and manufacturing businesses
ED Resources assisted clients in developing plans and strategies in order to start or better manage their businesses The most frequently reported type of assistance was business plans (35) followed by marketing plans (30) and financial strategy (19)
For 2010 clients the lowfree cost of service was the most commonly reported reason for seeking business counseling from ED Resources at 51 The least commonly reported reason for seeking business counseling from ED Resources was clients having tried other alternatives but were dissatisfied at 9 SCORE clients reported the reputation of SCORE as a reason they sought assistance (55) more often than the lowfree cost of service (52)
101 Respondents (86) who reported being in business but who did not provide a valid start date for that business were not assigned to a business segment
Impact Study of Entrepreneurial Development 91Resources ndash 2010-2011
Office of Entrepreneurial Development
Firms who received less than 3 hours of assistance reported lower levels of perceived usefulness than firms with 3 or more hours of counseling Also firms in the In-Business segment reported significantly higher perceived usefulness from their ED Resources counseling
American IndianAlaskan Native and White firms both reported higher perceived usefulness but there were no other differences based on race There were also no significant effects of clientrsquos age gender veteran status or ethnicity on perceived usefulness of assistance
Unlike some previous years results of this yearsrsquo regression suggest that there were no significant differences in financial impacts of ED Resource assistance based on any factor including ED resource business segment hours of counseling received or geographic location
Impact study data was used to examine four ED Resource client perceptions of impact Findings for each of these impacts are described below
2 Is there a relationship between the servicesassistance provided by ED Resources and the clientrsquos perception of the usefulness and value of the servicesassistance received
In general ED Resource clients perceived information and assistance provided by ED Resource counselors to be valuable Approximately 73 of ED Resource clients overall reported that assistance they received had high value in terms of usefulness This rating was 74 for SBDC 73 for SCORE and 72 for WBC
Seventy-six percent of clients who received 3 or more hours of counseling rated usefulness as ldquohighrdquo whereas 69 of those who received less than 3 hours of counseling did likewise Regression analysis also indicated that clients who received less than 3 hours of counseling reported lower levels of perceived usefulness than clients who received 3 or more hours of counseling
3 Is there a relationship between the servicesassistance provided by ED Resources and the client perceptions of assistance with the decision to start a business
As in the previous yearrsquos study regression results suggest larger firm firms in the In-Business segment and SCORE clients were less likely to report that their decision to start a business was the result of ED Resource assistance
There were no significant differences based on hours of counseling received or client demographic characteristics in regard to perceived assistance with the decision to start a business
Impact Study of Entrepreneurial Development 92Resources ndash 2010-2011
Office of Entrepreneurial Development
4 Is there a positive relationship between the servicesassistance provided by ED Resources and the clientrsquos decision to implement andor change management andor marketing practices in their business
As a result of ED Resource assistance 62 of 2010 In-Business clients and 57 of Start-up clients changed management practices or strategies Clients used ED Resources most widely in developing business plans marketing plans financial strategies and general management
5 Is there a positive relationship between the servicesassistance provided by ED Resources and financial impacts including job creation and retention and increases in sales
Thirty-four percent of Start-up and In-Business clients reported that assistance provided by ED Resources resulted in increased sales In terms of jobs 15 of Start-up and In-Business clients reported that ED Resource assistance led to the hiring of new staff and 20 reported that ED Resources assisted them in retaining current staff The perceived impact of ED Resource assistance on increasing profit margin was 30 a decrease two percentage points from the previous year
For the following financial categories sales profits retaining current staff and hiring of employees ED Resource clients who received 3 or more hours of assistance reported higher financial impacts than firms who received less than 3 hours of assistance This finding was not supported by a regression analysis which examined sales profits cash flow and the hiring of new staff
Increase in sales was the financial category that showed the most prominent correlation with hours of counseling received more than profit margin hiring of new staff or retention of staff Clients that received 3 or more hours of counseling reported increasing their sales 30 of the time whereas clients that received less than 3 hours of counseling increased their sales 19 of the time
Follow-up Study of 2008 and 2009 ED Resource Clients
6 How do the results of this survey compare with the Panel Survey of Entrepreneurial Dynamics (PSED) study
Based on the first follow-up study of 2008 ED Resource clients 95 were still in business while 90 of firms in the PSED II sample remained in business after one year For 2009 ED Resource clients 96 were still in business after one year In addition for the second follow-up study for 2008 clients 93 of ED Resource clients remained in business compared to 80 for those in the PSED II sample
Impact Study of Entrepreneurial Development 93Resources ndash 2010-2011
Office of Entrepreneurial Development
7 Was the financial impact (job creation job retention and sales) on the clients who were provided servicesassistance by SBA ED Resources (SBDC SCORE and WBC) since 2008 greater than or equal to a representative small business population
The follow-up analyses show that ED Resource assistance has had a substantial impact on the revenue and employment growth of small business clients For 2008 clients the recession appears to have had a negative impact on 2009 revenue though revenue increased for these clients in 2010 Surviving 2008 clients in the second follow-up experienced a 54 increase in revenues from 2009 to 2010 Still 47 of 2008 clients experienced some negative growth in revenues since 2008 The difference in growth rates from 2009 to 2010 for SBA ED Resource clients was shown to be 134 percentage points Although all three benchmarks indicated positive growth during this time SBA ED Resource clientsrsquo progress outpaced the other benchmarks Firms in the 2nd 2008 client follow-up sample increased from a mean of 5 employees to a mean 68 employees Mean employment for firms in the first follow-up of 2009 clients stayed relatively flat with an increase from 73 employees to 74 employees (See Figures 84 85 86 and 88)
Impact Study of Entrepreneurial Development 94Resources ndash 2010-2011
Office of Entrepreneurial Development
X SUMMARY OF QUALITATIVE FINDINGS
In addition to completing the survey multiple ED Resource clients provided additional commentary through their responses to survey invitation e-mails Through these communications clients expressed both positive and negative thoughts and feelings about their experiences with ED Resources This section reviews a selection of these comments
Among the positive comments received clients communicated several themes SBA counselors were professional and genuinely interested in providing help to the client Information provided to the clients by SBDC SCORE and WBC was particularly helpful to
their businessesrsquo development Counselors were willing to take the time to have in-depth discussions about business ideas
and offered many helpful suggestions
A very thankful survey respondent wrote at length about the concerted effort that her counselor put into building a relationship and aiding her business The following is an excerpt from her letter
ldquoI truly appreciated having the opportunity to meet and work with [counselor name] He is a great listener director and mentor His guidance is sound And he has a wonderfully open personality that allows people to feel that they can rely on [him] With his outstanding follow-through [counselor name] never disappointed me in any of my business questions and requestsrdquo
Another ED Resource client took the time to commend his counselor responding very positively to the effect the counselor had on his business
ldquoI just wanted to inform you that [counselor name] was one of the best things that ever happened to my company She displayed exemplary professionalism and helped us out tremendouslyrdquo
One respondent although she was unable to secure credit for her business considered ED Resource assistance to be a valuable learning experience
ldquoI would like to let you know that [ED Resources] helped me a lot and I learned so much from the services they provided me for my businessrdquo
The head of a private educational institution highlighted the flexibility of ED Resources She felt that the counselors served as motivators as well as sources of information
ldquoThe [ED Resources counselors] helped us to identify our issues facilitated discussions about options and helped with the energy and direction to move forward to study those optionshellip [ED Resources] has been a huge help to usrdquo
Impact Study of Entrepreneurial Development 95Resources ndash 2010-2011
Office of Entrepreneurial Development
There was also negative feedback provided by survey respondents regarding their experiences with ED Resources Among the negative comments the most common related to the following
Dissatisfaction with the conduct of their counselors on account of their lack of professionalism or disinterest in helping the client
Finding the information they received financial and otherwise to be less than useful or not applicable to their industry
The unavailability or unresponsiveness of ED Resource counselors in regard to calls or emails placed for inquiries or requests
Some ED Resource clients had difficulty establishing communication lines with their counselors One respondent wrote about his negative experience trying to reach his ED Resource counselor Ultimately the client did not receive any assistance
ldquoA person was chosen for me who was currently unavailable for months as he was not even in the area at the time (even though he lived here)hellip Months later he sent me an email saying he was ready to assist mehellipwe could meet and discuss my problems Problem was I was currently working out of the area supporting my clientrsquos contract I guess that was unsatisfactory for himhellipI never heard from him againrdquo
Several ED Resource clients complained about the outdated nature of the advice they received at times referencing current adverse economic conditions One respondent wrote
ldquoThe counselors didnt have a clue how to help me I was looking for a solid marketing plan Sorry but these guys are dinosaurs Didnt seem to be up on current trends in businesshelliprdquo
After making attempts to receive assistance at multiple ED Resource locations one ED Resource client wrote about her dissatisfaction with the limited knowledge and lack of professionalism of the counselors she met with
ldquoThe gentleman the office set me up with for first meeting did not have any experience in graphic design or what I was mainly interested in obtaining web based businessclients I then made another appointment for their downtown [location] office with two men who I was told knew my fieldhellip The meeting was disastrous One man told me that I should just go door to door to find local clients and to not utilize the Internet at allhelliprdquo
One respondent who sought capital assistance from ED Resources was frustrated at the lack of effort put in by her counselors in spite of her high level of preparedness Ultimately the client was left questioning whether ED Resources volunteers had any genuine interest in helping her business
ldquoI visited with [ED Resources] volunteers twice I found them to be distant and unenthusiastic for the most part I presented a full marketing plan right down to the last detail in a comprehensive binder that I spent two years preparingrdquo
Impact Study of Entrepreneurial Development 96Resources ndash 2010-2011
Office of Entrepreneurial Development
XI RECOMMEDATIONS FOR FURTHER RESEARCH
Measuring the effects of ED Resources on business operations as well as financial and economic outcomes requires longitudinal data that track respondents over time
Further research with this dataset could afford comparison of the effects of different kinds of ED Resource assistance and services on financial and economic outcomes for clients
On the basis of our findings Concentrance offers the following recommendation for further research
An additional study could examine the effects of different types of financing (eg SBA Guarantee Loan vs SBA Disaster Loan) on perceived improvements survival and business growth
Impact Study of Entrepreneurial Development 97Resources ndash 2010-2011
Office of Entrepreneurial Development
[This page is intentionally left blank for two-sided printing]
Impact Study of Entrepreneurial Development 98Resources ndash 2010-2011
Office of Entrepreneurial Development
XII APPENDICES
Impact Study of Entrepreneurial Development 99Resources ndash 2010-2011
Office of Entrepreneurial Development
[This page is intentionally left blank for two-sided printing]
Impact Study of Entrepreneurial Development 100Resources ndash 2010-2011
Office of Entrepreneurial Development
Appendix 1 ndash Survey Response Values by Research Topic
Impact Study of Entrepreneurial Development 101Resources ndash 2010-2011
RESEARCH TOPIC RESEARCH TOPIC SURVEY QUESTIONS SURVEY QUESTIONS RESPONSE CODEDATABASE RESPONSE CODEDATABASE
VALUES VALUES
Demographic Characteristics 7 At the time you were assisted by [SBDC SCORE WBC] what was the approximate annual gross revenue for each of the
Open ended between $1000 and $25000000
calendar years below 2009 ______ 2010 ______
8 Counting yourself how many fill-time employees and part-time employees did you employ at the end of the
following years you were in business
Open ended
2009 FullPart ______ 2010 FullPart ______
10 If you are in business what is the primary type of
business Construction Manufacturing Consulting Wholesale Finance Ins and Real
Estate Entertainment Retail Restaurant Engineering Publishing Education
Construction=1 or 0 Manufacturing=1 or 0 Consulting =1 or 0 Wholesale =1 or 0
Finance Ins And Real Estate =1 or 0 Entertainment =1 or 0 Retail =1 or 0 Restaurant =1 or 0 Engineering =1 or 0 Publishing =1 or 0 Education =1 or 0 Service =1 or 0 Health Care =1 or 0 Day Care =1 or 0 Transportation =1 or 0 Technology =1 or 0 Health Wellness or Fitness Yes=1 No= 0 Other = open ended No response
=N
Service Health Care Day Care Transportation Technology Health Wellness andor
Fitness Other
11 Indicate the geographic location of your primary
business
Urban Suburban Rural
Office of Entrepreneurial Development
RERESEARCH TOPIC SEARCH TOPIC SURVEY QUESTIONS SURVEY QUESTIONS SURVEY QUESTIONS RESPONSE CODEDATABASE RESPONSE CODEDATABASE
VALUES VALUES 12 What lead to your decision
to seek business counseling Tried other alternatives Reputation of
SBDCSCOREWBC Lowfree cost of service Referred by
16 Gender Male=1 Female=2 Male and Female Owners=3 No response = N
17 Veteran Status Veteran=1 Service-disabled Veteran=2 Reservist=3 National Guard Member=4 Non-veteran=5 No response= N
18 Age 18-24= 1 25-34 = 2 35-44 = 3 45-54 = 4 55-64 = 5 65-74 = 6 75+ = 7 No response = N
19 Are you Hispanic or Latino Not HispanicLatino Origin
Hispanic or Latino=1 Not of HispanicLatino Origin=0 No response = N
20 Are you American IndianAlaskan Native Asian BlackAfrican American Native HawaiianPacific Islander White
American Indian or Alaskan =1 or 0 Asian =1 or 0 Black or African American =1 or 0 Native Hawaiian or Pacific Islander =1or 0 White =1 or 0 No response = N
Is there a positive relationship between the servicesassistance provided by SBA ED Resources and the clientrsquos perceptions of the usefulness and value of the servicesassistance received
6 Pleas indicate how useful the services were that you received from the counselor who assisted you in identifying and correcting problems in operating your business Relevancy of Counseling Timeliness of Counseling Helpfulness of Counseling
13 Please indicate the value of the information you received from the [WBC SCORE SBDC] counselor you visited
1 Usefulness of information 2 Relevancy of the
information 3 Timeliness of the
information
Extremely Valuable=5 Valuable=4 No Opinion=3 Somewhat Valuable=2 Not Valuable=1 No response = N
15 I would refer the counseling services I reto other small business
ceived es
Strongly Agree=5 Agree=4 No Opinion=3 Disagree=2 Strongly Disagree=1 other=open ended No response = N
Impact Study of Entrepreneurial Development 102Resources ndash 2010-2011
RESEARCH TOPIC RESEARCH TOPIC SURVEY QUESTIONS SURVEY QUESTIONS RESPONSE CODEDATABASE RESPONSE CODEDATABASE
VALUES VALUES
Is there a positive relationship between the servicesassistance provided by SBA ED Resources and
the clientrsquos perceived quality of the counseling
experience
14 Please indicate the counselorrsquos effectiveness in
assisting you 1 The counselor exhibited excellent customer service
techniques 2 The counselor was able
to assist me 3 The counselor exhibited a high level of professionalism
4 The counselor was knowledgeable of current
management practices and issues
5 The counselor identified with my needs
6 I would rate my overall experience with the counselor as excellent
Strongly Agree=5 Agree=4 No Opinion=3 Disagree=2 Strongly Disagree=1 other=open ended No response = N
Is there a positive relationship between the servicesassistance provided by SBA ED Resources and the clientrsquos decision to start a
business
2 If you were not in business at the time you were assisted by the counselor did you decide to go into business as a
result of that assistance
Yes = 1 No=0 No Response = N
Is there a positive relationship between the servicesassistance provided by SBA ED Resources and clientsrsquo decisions to implement andor change management andor marketing practices in their
business
3 As a result of the assistance you received have you changed any of your current
management practices
Yes=1 No=0 No response = N
Office of Entrepreneurial Development
Impact Study of Entrepreneurial Development 103Resources ndash 2010-2011
RESEARCH TOPIC RESEARCH TOPIC SURVEY QUESTIONS SURVEY QUESTIONS RESPONSE CODEDATABASE RESPONSE CODEDATABASE
VALUES VALUES
4 As a result of the assistance I received from the [WBC SCORE SBDC] counselor I was able to develop [ie Business Plan] in order to start or better manage my business [Check all that apply]
Business Plan Marketing Plan Promotional Plan Pricing Strategy Cash Flow Analysis General Management Loan Package Hiring Plan Training Plan for Staff Financial Strategy Web-based Strategy Purchasing Strategy Feasibility Plan Production Plan Distribution Plan International Trade Other
If checked = 1 Not checked = 0 Other =open ended No response = N
Is there a positive relationship between the servicesassistance provided by SBA ED Resources and the clientsrsquo businesses having a positive financial impact on job creation and
retention and increase in sales
5 Please indicate the impact these changes have had on
your firm 1 Increase my sales 2 Improve my cash flow 3 Acquire a bank loan 4 Expand my products
services 5 Hire new staff 6 Revise my marketing
strategy 7 Increase my profit margin 8 Retain current staff 9 Acquire a SBA guarantee
loan 10 Acquire a government
contract 11 Acquire a SBA Disaster
loan 12 Other
Strongly Agree=5 Agree=4 No Opinion=3 Disagree=2 Strongly Disagree=1 other=open ended No response = N
9 If you were projecting to reduce your total number of
employees prior to counseling by SBDCSCOREWBC how many positions have you
retained due to the counseling Full time _____ Part time _____
Open Ended
Office of Entrepreneurial Development
Impact Study of Entrepreneurial Development 104Resources ndash 2010-2011
RESEARCH TOPIC RESEARCH TOPIC SURVEY QUESTIONS SURVEY QUESTIONS RESPONSE CODEDATABASE RESPONSE CODEDATABASE
VALUES VALUES
General Business 1i Are you currently in business
Yes=1 No=0 No response = N
1ii If yes when was the business started
mmyyyy
1iii What is the zip code of your business
Xxxxx
1a If NO when do you plan on starting a business
Within 30 days=1 31-90 days=2 91-120 days=3 No idea at this time=4 No response = N
1b Have you ever been in business
Yes=1 No=0 No response = N
1bi If YES when was the business started
mmyyyy
21i Did you utilize any other SBA resourcesprogram
Yes=1 No=0 No response = N
21ii If YES select those you used [Check all that apply]
SBDC SCORE WBC SBArsquos Guarantee Loan Programs
SBIC Venture Capital Program
Government contracting SBArsquos Surety Bond Program Small Business Training
Network (Online Training)
Disaster Assistance
SCORE =1 or 0 SBDC =1 or 0 Women Business Center =1 or 0
SBArsquos Guarantee Loan Programs =1 or 0 SBIC Financing Program
=1 or 0 SBArsquos Surety Bond Program =1 or 0 No response = N
Office of Entrepreneurial Development
Impact Study of Entrepreneurial Development 105Resources ndash 2010-2011
Office of Entrepreneurial Development
[This page is intentionally left blank for two-sided printing]
Impact Study of Entrepreneurial Development 106Resources ndash 2010-2011
Office of Entrepreneurial Development
Appendix 2 ndash Quantified Survey Results ndash Initial Survey 2010 Clients
Impact Study of Entrepreneurial Development 107Resources ndash 2010-2011
Surveys Questions Percentage of Sample Q1) Are you currently in business
Yes 7476 No 2524Missing 000
Q1a) If no when do you plan on starting a business
Within 30 days 127 31-90 days 362 91-120 days 451 No idea at this time 1542 Missing 7517
Q1b) Have you ever been in business
Yes 918 No 1605 Missing 7478
Q2) If you were not in business at the time you were assisted by the
counselor did you decide to go into business as a result of that
assistance Yes 1605 No 2817Not Applicable (already in
business) 5542
Missing 036 Q3) As a result of the assistance
you received have you changed any of your current management
practicesstrategies
Yes 4486
No 2931 Missing 2583
Q4) As a result of the assistance I received from the counselor I was
able to develop [ie Business Plan] in order to start or better manage my business
Business Plan 3498 Loan Package 829 Purchasing Strategy 407 Marketing Plan 2982 Hiring Plan 482 Feasibility Plan 789 Promotional Plan 1284 Training Plan for Staff 369 Production Plan 406 Pricing Strategy 1439 Financial Strategy 1869 Distribution Plan 330 Cash Flow Analysis 1693 Web-based Strategy 1036 International Trade 147
StGeneral Management
rategy 1779 Other 835
Q5) Please indicate the impact of these changes have had on your firm Strongly Agree=SA Agree=A No Opinion-No Disagree=D Strongly Disagree=SD]
SA A NO D SD Missing
I was able to Increase my sales 725 1803 2870 636 449 3517 Improve my cash flow 682 1816 2827 674 445 3555 Acquire a bank loan 489 518 3631 974 649 3739 Expand my productsservices 666 1702 2808 756 468 3599 Hire new staff 323 817 3664 911 515 377 Revise my marketing strategy 1218 2726 1728 531 392 3404 Increase my profit margin 555 1605 2941 759 471 3669 Retain current staff 337 1177 3628 582 466 3809 Acquire a SBA guarantee loan 313 286 3791 1052 735 3823 Acquire a government contract 127 232 4015 1071 700 3855 Acquire a SBA Disaster loan 030 062 4206 1088 695 3920 Other 559 195 1314 075 241 7616
Office of Entrepreneurial Development
Impact Study of Entrepreneurial Development 108Resources ndash 2010-2011
Q6) Please indicate how useful the services were that you received
from the counselor who assisted you in identifying and correcting problems in operating your business [Very Useful=VU Useful=U No Opinion-NO Somewhat Useful =SU Not Useful =NU]
VU U NO SU NU Missing
Relevancy of Counseling 3720 2023 318 541 525 2872Timeliness of Counseling 3647 2088 505 393 473 2895Helpfulness of Counseling 3855 1960 297 463 540 2885Q7) At the time you were assisted by [SBDCSCOREWBC] what was the approximate annual gross revenue for each of the calendar years below
2009 Revenue given 3205 Missing 6795
2010 Revenue given 3366 Missing 6633
Q8) Counting yourself how many full-time employees and part-time employees did you employ at the end of the following years you were in business
2010 Full-time jobs Average = 27 2009 Full-time jobs Average = 38 2010 Part-time jobs Average = 17 2009 Part-time jobs Average = 28
Q9) At the time you were assisted by [SBDCSCOREWBC] what was the approximate annual gross revenue for each of the calendar years below
Existing Full-time jobs saved Total Full-time Jobs Saved ndash 3768
Existing Part-time jobs saved Total Part-time Jobs Saved ndash 3203
Firms that saved jobs 3746
Office of Entrepreneurial Development
Impact Study of Entrepreneurial Development 109Resources ndash 2010-2011
Q10) If you are in business what is the primary type of business (This question includes multiple responses)
Construction 352 Manufacturing 539 Consulting 522 Wholesale 256 Finance Insurance Real
Estate
188 Entertainment 116 Retail 723
and Drinking Restaurant andor Eating
266 Engineering 095 Publishing 075 Education 181 Service 923 Health Care 216 Day Care 065 Transportation 086 Technology 302
Fi Health Wellness andor
tness 261
Other 1433
Missing 3400 Q11) Indicate the geographic
location of your primary business
Rural 1454 Suburban 2688 Urban 2369 Missing 3489
Q12) What led to your decision to seek business counseling from [SBDCSCOREWBC]
Tried other alternatives but was dissatisfied 821
Reputation of [SBDCSCOREWBC] 4392 Lowfree cost of service 4578
Referred by _____ 3819
Office of Entrepreneurial Development
Impact Study of Entrepreneurial Development 110Resources ndash 2010-2011
Office of Entrepreneurial Development
Q13) Please indicate the value of the information [Extremely Valuable=EV Valuable=V No Opinion=NO Somewhat Valuable=SV Not Valuable=NV]
EV V NO SV NV Missing
Usefulness of Information 4278 3067 318 772 585 980 Relevancy of the Information 4148 3127 393 739 576 1016 Timeliness of the Information 4008 3118 599 636 564 1074 Q14) Please indicate the counselors effectiveness in assisting you [Strongly Agree=SA Agree=A No Opinion-No Disagree=D Strongly Disagree=SD]
SA A NO D SD Missing
The counselor exhibited excellent customer service techniques 5003 2923 498 233 243 1100 The counselor was able to assist me 4397 3081 608 423 397 1094 The counselor exhibited a high level of professionalism 5383 2767 404 148 201 1097 The counselor was knowledgeable of current management practices and issues 4707 2925 784 233 252 1099 The counselor identified with my needs 4426 3039 677 386 374 1098 I would rate my overall experience with the counselor as excellent 4803 2632 631 439 385 1111 Q15) I would refer the counseling services I received to other small businesses [Strongly Disagree=SA Agree=A No Opinion=NO Disagree=D Strongly Disagree=SD]
SA A NO D SD Missing
4847 1515 450 983 1142 1062 Q16) Gender
Male 3560 Female 3576 Both male and female 1698 Missing 1166
Q17) Veteran Status Veteran 858 Service-disabled Veteran 207 Reservist 032 National Guard Member 035 Non-veteran 7524 Missing 1343
Impact Study of Entrepreneurial Development 111Resources ndash 2010-2011
Q18) Age 18-24 169 25-34 1280 35-44 2157 45-54 2752 55-64 2047 65-74 409
75 + 070 Missing 1117
Q19) Are you HispanicLatino 661 Non-HispanicLatino 9339 Missing 0
Q20) Are you American Indian or
Alaskan Native 174 Asian 351 Black or African American 1135Native Hawaiian or Pacific
Islander 053 White 6838Missing 1634
Q21) Did you utilize any other SBA resourcesprogram
Yes 2510 No 5412 Missing 2078
Q21 cont) If yes select those you used
SCORE 792 SBArsquos Guarantee Loan
Program 657 Women Business Center 382 SBIC Venture Capital
Program
041 Government Contracting 322 SBDC 396 SBArsquos Surety Bond
Program
025 Small Business Training
Network (Online Assistance) 627 Disaster Assistance 033 Missing 2885
Office of Entrepreneurial Development
Impact Study of Entrepreneurial Development 112Resources ndash 2010-2011
Office of Entrepreneurial Development
Appendix 3 ndash Quantified Survey Results ndash Follow-up Survey 2010 Clients
2008 2nd Follow Up Results Data
Impact Study of Entrepreneurial Development 113Resources ndash 2010-2011
Surveys Questions Percentage of Sample Q1) Are you currently in business
Yes 8650 No 1350Missing 000
Q2) If no when do you plan on starting a business
Within 30 days 050 31-90 days 000 91-120 days 000 No idea at this time 1300 Missing 8650 Q3) Have you ever been in
business
Yes 950 No 400 Missing 8650
Q4) As a result of the assistance received from the
[SBDCWBCSCORE] Counselor which of the following were you able to develop [ie Business Plan] in order to start or better manage your business [Check all
that apply]
Business Plan 4500 Loan Package 4400Purchasing Strategy 2000 Marketing Plan 1700 Hiring Plan 2450Feasibility Plan 2700 Promotional Plan 1150 Training Plan for Staff 850
Production Plan 400 Pricing Strategy 2050Financial Strategy 1600 Distribution Plan 450
Cash Flow Analysis 1550 Web-based Strategy 950
International Trade 500 General Management 250 Other 1400
Surveys Questions Percentage of Sample
Q5) What was the approximate annual gross revenue of your
business in 2010
Reported 6950 Missing 3050
Q6) Currently how many people (full and part time) including yourself does your business employ
Average Full-Time 55 employees Average Part-Time 18 employees
Q7) Have you utilized any other SBA resourcesprogram
Yes 2200 No 7600 Missing 200
Q8) If YES select those you used [check all that apply]
SCORE 600 SBArsquos Loan Guarantee Programs 150 SBDC 050
SBIC Venture Capital
Program
100 Woman Business Center 550 Government Contracting 000
SBArsquos Surety Bond
Program
100
Small Business Training Network (online training) 300
2009 1st Follow Up Results Data Surveys Questions Percentage of Sample
Q1) Are you currently in business Yes 8298 No 1702 Missing 000
Q2) If no when do you plan on starting a business
Within 30 days 097 31-90 days 152 91-120 days 203 No idea at this time 1225 Missing 8323
Office of Entrepreneurial Development
Impact Study of Entrepreneurial Development 114Resources ndash 2010-2011
Q3) Have you ever been in business
Yes 874 No 813 Missing 8313
Q4) As a result of the assistance received from the [SBDCWBCSCORE] Counselor which of the following were you able to develop [ie Business Plan] in order to start or better manage your business [Check all that apply]
Business Plan 4761 Loan Package 1250 Purchasing Strategy 386 Marketing Plan 3283 Hiring Plan 493 Feasibility Plan 1133 Promotional Plan 1418
Production Plan 371 Pricing Strategy 1499 Financial Strategy 2190 Distribution Plan 234 Cash Flow Analysis 2236 Web-based Strategy 884 International Trade 168 General Management 2266 Other 1758
Q5) What was the approximate annual gross revenue of your business in 2010
Reported 6850 Missing 3150
Q6) Currently how many people (full and part time) including yourself does your business employ
Average Full-Time 49 employees Average Part-Time 34 employees
Q7) Have you utilized any other SBA resourcesprogram
Yes 2602 No 6565 Missing 833
Training Plan for Staff
Surveys Questions Percentage of Sample
300
Office of Entrepreneurial Development
Impact Study of Entrepreneurial Development 115Resources ndash 2010-2011
Surveys Questions Percentage of Sample
Q8) If YES select those you used [check all that apply]
SCORE 986 SBArsquos Loan Guarantee
Programs 655 SBDC 412 SBIC Venture Capital
Program 025 Woman Business Center 310 Government Contracting 381 SBArsquos Surety Bond
Program 020 Small Business Training
Network (online training) 503
Office of Entrepreneurial Development
Impact Study of Entrepreneurial Development 116Resources ndash 2010-2011
Office of Entrepreneurial Development
Appendix 4 ndash Initial Study Survey Instrument
US Small Business Administration Office of Entrepreneurial Development
Initial Economic Impact Survey OMB Number 3245‐0351 Expiration 03312013
Dear Small Business Client
Thank you for your recent visit to [the Small Business Development Center (SBDC) SCORE the Womenrsquos Business Center (WBC)] one of SBArsquos Entrepreneurial Development (ED) Resource Partners We hope you found the business assistance you sought The SBA is always striving to better its programs and deliver relevant and meaningful assistance We want to know if our programs and services are helping the economy by providing useful information on starting and managing a business and eventually helping your business create jobs increasing your businessrsquo revenues and in general fueling the entrepreneurial spirit in America
We would appreciate you taking a few minutes to answer some brief questions that will help us know the quality and impact of the programs All responses to these questions are voluntary and will be held in confidence The data will not be released to any other government agency or private firm Please answer the following questions based on your visit to [the Small Business Development Center (SBDC) SCORE the Womenrsquos Business Center (WBC)]
1 Are you currently in business Yes No If YES when was the business started _ __ _ _ _
mm yyyy What is the zip code of your business location __ __ __ __ __
If Yes to Question 1 skip to Question 2 If No continue to 1a
1a If NO (to Question 1) when do you plan on starting a business Within 30 days 31‐90 days 91‐120 days No idea at this time
1b If NO (to Question 1) have you ever been in business Yes No If YES when was the business started _ _ _ _ _ _
mmyyyy
2 If you were not in business at the time you were assisted by the counselor did you decide to go into business as a result of that assistance
Yes No Not applicable (already in business)
Impact Study of Entrepreneurial Development 117Resources ndash 2010-2011
Office of Entrepreneurial Development
If you answered NO to Question 1 please skip ahead to Question 12
3 As a result of the assistance you received have you changed any of your current management practicesstrategies Yes No
4 As a result of the assistance I received from the [SBDC SCORE WBC] Counselor I was able to develop one or more of the following (ie Business Plan) in order to better manage my business [Check all that apply]
Business Plan Loan Package Purchasing Strategy Marketing Plan Hiring Plan Feasibility Plan Promotional Plan Training Plan for Staff Production Plan Pricing Strategy Financial Strategy Distribution Plan Cash Flow Analysis Web Based Strategy International Trade General Management Other ________________________
5 Please indicate the impact your counseling experience had on your firm [Strongly Agree=SA Agree=A No Opinion=NO Disagree=D Strongly Disagree=SD]
SA A NO D SD I was able to 1 Increase my sales 5 4 3 2 1 2 Improve my cash flow 5 4 3 2 1 3 Acquire a bank loan 5 4 3 2 1 4 Expand my productsservices 5 4 3 2 1 5 Hire new staff 5 4 3 2 1 6 Revise my marketing strategy 5 4 3 2 1 7 Increase my profit margin 5 4 3 2 1 8 Retain current staff 5 4 3 2 1 9 Acquire a SBA guarantee loan 5 4 3 2 1 10 Acquire a government contract 5 4 3 2 1 11 Acquire a SBA Disaster loan 5 4 3 2 1 12 Other (specify ____________________) 5 4 3 2 1
6 Please indicate how useful the services were that you received from the counselor who assisted you in identifying and correcting problems in operating your business
Impact Study of Entrepreneurial Development 118Resources ndash 2010-2011
Very No Somewhat Not Useful Useful Opinion Useful Useful
1 Relevancy of Counseling 5 4 3 2 1 2 Timeliness of Counseling 5 4 3 2 1 3 Helpfulness of Counseling 5 4 3 2 1
Office of Entrepreneurial Development
7 At the time you were assisted by [the Small Business Development Center (SBDC) SCORE the Womenrsquos Business Center (WBC)] what was the approximate annual gross revenue for each of the calendar years below [All data will be held in strict confidence and reported only in the aggregate without identifying any individual small business] Enter dollar figures only Do not include commas or currency symbols
2009 __________________________ 2010 __________________________
8 Counting yourself how many full‐time employees (35 hours or more per week) and part‐time employees (less than 35 hours per week) did you employ at the end of the following years you were in business
2009 _______________ Number of Full‐time employees 2010 _______________ Number of Full‐time employees
2009 _______________ Number of Part‐time employees 2010 _______________ Number of Part‐time employees
9 If you were projecting to reduce your total number of employees prior to receiving counseling from [SBDC SCORE WBC] how many positions have you retained due to the counseling
Existing Full‐time jobs saved ___________ Existing Part‐time jobs saved ___________
10 What is your firmrsquos primary type of business [Please choose only one]
Construction Manufacturing Consulting Wholesale Finance Insurance and Real Estate Entertainment Retail Restaurant andor Eating and Drinking Engineering Publishing Education Service Health Care Day Care Transportation Technology Health Wellness andor Fitness Other (describe) _______________________
11 Indicate the geographic location of your primary business Rural Suburban Urban
12 What led to your decision to seek business counseling from [SBDC SCORE WBC] [Check all that apply]
Tried other alternatives and was dissatisfied Reputation of [SBDC SCORE WBC] Lowfree cost of service Referred by __________________________________
(Fill in blank or add options such as SBA office of ______ )
Other _______________________________________ (Fill in the blank)
Impact Study of Entrepreneurial Development Resources ndash 2010-2011
119
Office of Entrepreneurial Development
13 Please indicate the value of the information you received from the counselor you visited
Extremely No Somewhat Not Valuable Valuable Opinion Valuable Valuable
1 Usefulness of Information 5 4 3 2 1 2 Relevancy of Information 5 4 3 2 1 3 Timeliness of Information 5 4 3 2 1
14 Please indicate the counselorrsquos effectiveness in assisting you [Strongly Agree=SA Agree=A No Opinion=NO Disagree=D Strongly Disagree=SD]
SA A NO D SD 1 The counselor exhibited excellent
customer service techniques 5 4 3 2 1 2 The counselor was able to assist me 5 4 3 2 1 3 The counselor exhibited a high level of
professionalism 5 4 3 2 1 4 The counselor was knowledgeable of current
management practices and issues 5 4 3 2 1 5 The counselor identified with my needs 5 4 3 2 1 6 I would rate my overall experience with
the counselor as excellent 5 4 3 2 1
15 I would refer the counseling services I received to other small businesses
Strongly Agree Agree No Opinion Disagree Strongly Disagree
16 Gender Male owner(s) Female owner(s) Both male and female owners
17 Veterans status Veteran Service‐disabled Veteran Reservist National Guard member Non‐Veteran
18 Age [Circle one] 18‐24 25‐34 35‐44 45‐54 55‐64 65‐74 75+
19 Are you Hispanic or Latino Not of Hispanic or Latino Origin
20 Are you [Please choose one or more] American Indian or Alaskan Native Asian Black or African American Native Hawaiian or Pacific Islander White
Impact Study of Entrepreneurial Development 120Resources ndash 2010-2011
Office of Entrepreneurial Development
21 Did you utilize any of the following SBA resources or programs Yes No
If YES select those you used [Check all that apply] SBDC SCORE SBArsquos Guarantee Loan programs Women Business Center SBIC Venture Capital Program Government Contracting SBArsquos Surety Bond Program Small Business Training Network Disaster Assistance (On‐line training)
PLEASE NOTE The estimated burden for completing this form is 12 minutes per response You are not required to respond to any collection of information unless it displays a currently valid OMB approval number Comments on the burden should be sent to US Small Business Administration Chief AIB 409 3rd St SW Washington DC 20416 and Desk Officer for the Small Business Administration Office of Management and Budget New Executive Building Room 10202 Washington DC 20503 OMB Approval (3245‐0351) PLEASE DO NOT SEND FORMS TO OMB
SBA Form 2214 THANK YOU
Impact Study of Entrepreneurial Development 121Resources ndash 2010-2011
Office of Entrepreneurial Development
[This page is intentionally left blank for two-sided printing]
Impact Study of Entrepreneurial Development 122Resources ndash 2010-2011
Office of Entrepreneurial Development
Appendix 5 ndash Follow-up Survey
US Small Business Administration Office of Entrepreneurial Development Follow‐up Economic Impact Survey
OMB Number 3245‐0351 Expiration 03312013
Dear Small Business Client
Within the last twelve months you were kind enough to respond to our request for some initial data regarding your visit(s) to SBArsquos Entrepreneurial Development resource the [Small Business Development Center (SBDC) Womenrsquos Business Center (WBC) SCORE] To continually understand the impact our programs and services are having on the economy it would be helpful to know if our assistance to you regarding starting and managing a business resulted in job creation increases in your businessrsquo revenues or other results
We understand that you responded to a thorough survey not so long ago but we ask that you help us in answering a few questions for this follow‐up survey which will take less than 5 minutes All responses to these questions are voluntary and will be held in confidence The data will not be released to any other government agency or private firm Based on your visit to the [SBDC WBC SCORE] please use that experience as a benchmark to answer the following
1 Are you currently in business Yes No
If YES when was the business started _ __ _ _ _ mm yyyy
2 If NO when do you plan on starting a business Within 30 days 31‐90 days 91‐120 days No idea at this time
3 Have you ever been in business Yes No If YES when was the business started _ __ _ _ _
mm yyyy
Impact Study of Entrepreneurial Development 123Resources ndash 2010-2011
Office of Entrepreneurial Development
4 As a result of the assistance received from the [SBDCWBCSCORE] Counselor which of the following were you able to develop [ie Business Plan] in order to start or better manage your business [Check all that apply]
Business Plan Loan Package Purchasing Strategy Marketing Plan Hiring Plan Feasibility Plan Promotional Plan Training Plan for Staff Production Plan Pricing Strategy Financial Strategy Distribution Plan Cash Flow Analysis Web Based Strategy International Trade General Management Other ________________________________________
5 What was the approximate annual gross revenue of your business in 2010 $________________00
6 Currently how many people (full and part‐time) including yourself does your business employ
Number of Full‐Time Employees _________________________ Number of Part‐Time Employees _________________________
7 Have you utilized any other SBA resourcesprogram Yes No
8 If YES select those you used [Check all that apply]
SCORE SBArsquos Guarantee Loan programs SBDC SBIC Venture Capital Program Women Business Center Government Contracting SBArsquos Surety Bond Program Small Business Training Network
(online training)
PLEASE NOTE The estimated burden for completing this form is less than 5 minutes per response You are not required to respond to any collection of information unless it displays a currently valid OMB approval number Comments on the burden should be sent to US Small Business Administration Chief AIB 409 3rd St SW Washington DC 20416 and Desk Officer for the Small Business Administration Office of Management and Budget New Executive Building Room 10202 Washington DC 20503 OMB Approval (TBD) PLEASE DO NOT SEND FORMS TO OMB
THANK YOU
Impact Study of Entrepreneurial Development 124Resources ndash 2010-2011
Office of Entrepreneurial Development
Appendix 6 ndash Regression Computations
Regression Results Effects of Firm and Demographic Characteristics on Perceived Usefulness Assistance with the Decision to Start a Business and Financial Impact
Dependent Variable
Independent Variable
Perceived Usefulness
Assistance with Decision to Start a Business (LR)
Financial Impact
Intercept -124024 240905 -191586
SBDC 19242 -040279 48574
SCORE 15332 -072576 49471
lt 3 hours -24964 011296 -53896
Log of Sales 4661 -013453 3762
Gender 2158 -012057 59382
Veteran 6455 00601 4318
Latino -006 -041537 35888
Age 3223 -003744 40697
Native American 61156 038098 -7369
Asian 21109 -082348 46016
Black 44458 -051198 66021
HawaiianPacific Islander
-32923 -075983 -126224
White 42644 -055758 29757
Inbus 49901 -120888 8468
R-Square 0015 0088 0008
Significant at 001 level Significant at 005 level Significant at 010 level
Impact Study of Entrepreneurial Development 125Resources ndash 2010-2011
Office of Entrepreneurial Development
[This page is intentionally left blank for two-sided printing]
Impact Study of Entrepreneurial Development 126Resources ndash 2010-2011
Office of Entrepreneurial Development
Appendix 7 ndash State-by-State Data The tables below display national response data segmented by ED Resource and in aggregate for total ED Resources
SBDC Clients
ED Resource State Surveys Received
SBDC Client Contacts Received
Response Rate
of Total SBDC Clients
SBDC AL 78 342 23 15SBDC AK 9 48 19 02SBDC AS 2 8 25 00SBDC AZ 71 396 18 14SBDC AR 54 207 26 11SBDC CA 527 2593 20 103SBDC CO 101 330 31 20SBDC CT 75 238 32 15SBDC DC 12 45 27 02SBDC DE 16 60 27 03SBDC FL 235 1233 19 46SBDC GA 180 631 29 35SBDC GU 3 9 33 01SBDC HI 23 93 25 04SBDC ID 26 100 26 05SBDC IL 208 957 22 41SBDC IN 124 470 26 24SBDC IA 71 222 32 14SBDC KS 54 207 26 11SBDC KY 77 312 25 15SBDC LA 84 345 24 16SBDC ME 25 97 26 05SBDC MD 93 405 23 18SBDC MA 104 489 21 20SBDC MI 257 765 34 50SBDC MN 99 380 26 19SBDC MS 43 222 19 08SBDC MO 91 381 24 18SBDC MT 22 69 32 04SBDC NE 28 128 22 05SBDC NV 39 153 25 08SBDC NH 17 96 18 03SBDC NJ 143 648 22 28SBDC NM 40 141 28 08SBDC NY 321 1451 22 63SBDC NC 184 621 30 36SBDC ND 8 49 16 02SBDC OH 185 871 21 36
Impact Study of Entrepreneurial Development 127Resources ndash 2010-2011
Office of Entrepreneurial Development
Impact Study of Entrepreneurial Development Resources ndash 2010-2011
ED Resource State Surveys Received
SBDC Client Contacts Received
Response Rate
of Total SBDC Clients
SBDC OK 63 266 24 12 SBDC OR 80 264 30 16 SBDC PA 253 948 27 49 SBDC PR 62 294 21 12 SBDC RI 14 45 31 03 SBDC SC 66 309 21 13 SBDC SD 11 55 20 02 SBDC TN 98 438 22 19 SBDC TX 210 1190 18 41 SBDC UT 56 180 31 11 SBDC VI 5 10 50 01 SBDC VT 13 48 27 03 SBDC VA 151 546 28 30 SBDC WA 149 423 35 29 SBDC WV 24 138 17 05 SBDC WI 117 378 31 23 SBDC WY 12 39 31 02
Totals 5113 20956 1000
SCORE Clients
SCORE Client of Total Surveys Contacts Response SCORE
ED Resource State Received Received Rate Clients SCORE AL 12 99 12 03SCORE AK 0 2 0 00SCORE AZ 113 565 20 25SCORE AR 30 149 20 07SCORE CA 416 2571 16 94SCORE CO 137 484 28 31SCORE CT 161 791 20 36SCORE DC 19 93 20 04SCORE DE 41 211 19 09SCORE FL 309 1619 19 70SCORE GA 62 446 14 14
SCORE HI 26 77 34 06SCORE ID 24 99 24 05SCORE IL 154 994 15 35SCORE IN 73 403 18 16SCORE IA 36 162 22 08
SCORE KS 16 80 20 04SCORE KY 68 335 20 15SCORE LA 19 118 16 04SCORE ME 48 179 27 11
128
Office of Entrepreneurial Development
ED Resource State Surveys Received
SCORE Client Contacts Received
Response Rate
of Total SCORE Clients
SCORE MD 74 374 20 17SCORE MA 164 781 21 37SCORE MI 108 431 25 24SCORE MN 135 626 22 30SCORE MS 2 20 10 00SCORE MO 49 257 19 11SCORE MT 14 52 27 03SCORE NE 15 108 14 03SCORE NV 64 487 13 14SCORE NH 86 334 26 19SCORE NJ 90 467 19 20SCORE NM 31 111 28 07SCORE NY 268 1368 20 60SCORE NC 180 724 25 41SCORE ND 14 67 21 03SCORE OH 225 951 24 51SCORE OK 14 63 22 03SCORE OR 119 588 20 27SCORE PA 254 1081 23 57SCORE RI 13 79 16 03SCORE SC 87 413 21 20SCORE SD 3 14 21 01SCORE TN 68 354 19 15SCORE TX 209 1093 19 47SCORE UT 35 100 35 08SCORE VT 27 116 23 06SCORE VA 112 450 25 25SCORE WA 118 571 21 27SCORE WV 5 24 21 01SCORE WI 97 398 24 22
SCORE WY 0 2 0 00
Total 4444 21981 1000
Impact Study of Entrepreneurial Development 129Resources ndash 2010-2011
WBC Clients
ED Resource State Surveys Received
WBC Client Contacts Received
Response Rate
of Total WBC Clients
WBC AL 28 105 27 48WBC AK 1 4 25 02WBC AS 0 9 0 00WBC AZ 1 18 6 02WBC CA 91 518 18 154WBC CO 4 45 9 07
ED Resource State Surveys Received
WBC Client Contacts Received
Response Rate
of Total WBC Clients
WBC CT 4 35 11 07WBC DC 17 91 19 29WBC DE 4 19 21 07WBC FL 15 78 19 25WBC GA 7 50 14 12WBC IL 11 103 11 19WBC IN 30 173 17 51WBC IA 3 15 20 05WBC KS 12 64 19 20WBC LA 8 79 10 14WBC ME 12 42 29 20WBC MD 21 66 32 36WBC MA 3 18 17 05WBC MI 23 123 19 39WBC MN 9 35 26 15WBC MO 7 37 19 12WBC MT 16 49 33 27WBC NE 8 34 24 14WBC NV 8 48 17 14WBC NM 15 74 20 25WBC NY 43 147 29 73WBC NC 77 480 16 131WBC OH 1 30 3 02WBC OK 9 18 50 15WBC PA 9 48 19 15WBC PR 5 32 16 08WBC RI 4 18 22 07WBC SC 2 10 20 03WBC TN 5 10 50 08WBC TX 28 172 16 48WBC UT 7 27 26 12WBC VT 5 20 25 08WBC VA 6 10 60 10WBC WA 12 85 14 20WBC WV 2 10 20 03WBC WI 16 105 15 27WBC WY 0 8 0 00
Total 589 3162 1000
Office of Entrepreneurial Development
Impact Study of Entrepreneurial Development 130Resources ndash 2010-2011
Office of Entrepreneurial Development
Total ED Resources Clients
Total ED Resources of Total Client ED
Surveys Contacts Response Resources ED Resource State Received Received Rate Clients Total ED Resources AL 118 546 22 12 Total ED Resources AK 10 54 19 01 Total ED Resources AS 2 17 12 00 Total ED Resources AZ 185 979 19 18 Total ED Resources AR 84 356 24 08 Total ED Resources CA 1034 5682 18 102 Total ED Resources CO 242 859 28 24 Total ED Resources CT 240 1064 23 24 Total ED Resources DC 48 229 21 05 Total ED Resources DE 61 290 21 06 Total ED Resources FL 559 2930 19 55 Total ED Resources GA 249 1127 22 25 Total ED Resources GU 3 9 33 00 Total ED Resources HI 49 170 29 05 Total ED Resources ID 50 199 25 05
Total ED Resources IL 373 2054 18 37 Total ED Resources IN 227 1046 22 22 Total ED Resources IA 110 399 28 11 Total ED Resources KS 82 351 23 08 Total ED Resources KY 145 647 22 14 Total ED Resources LA 111 542 20 11 Total ED Resources ME 85 318 27 08 Total ED Resources MD 188 845 22 19 Total ED Resources MA 271 1288 21 27 Total ED Resources MI 388 1319 29 38 Total ED Resources MN 243 1041 23 24 Total ED Resources MS 45 242 19 04 Total ED Resources MO 147 675 22 14 Total ED Resources MT 52 170 31 05 Total ED Resources NE 51 270 19 05 Total ED Resources NV 111 688 16 11 Total ED Resources NH 103 430 24 10 Total ED Resources NJ 233 1115 21 23 Total ED Resources NM 86 326 26 08 Total ED Resources NY 632 2966 21 62 Total ED Resources NC 441 1825 24 43 Total ED Resources ND 22 116 19 02 Total ED Resources OH 411 1852 22 41 Total ED Resources OK 86 347 25 08 Total ED Resources OR 199 852 23 20 Total ED Resources PA 516 2077 25 51 Total ED Resources PR 67 326 21 07
Impact Study of Entrepreneurial Development 131Resources ndash 2010-2011
Office of Entrepreneurial Development
ED Resource State Surveys Received
Total ED Resources Client Contacts Received
Response Rate
of Total ED Resources Clients
Total ED Resources RI 31 142 22 03 Total ED Resources SC 155 732 21 15 Total ED Resources SD 14 69 20 01 Total ED Resources TN 171 802 21 17 Total ED Resources TX 447 2455 18 44 Total ED Resources UT 98 307 32 10 Total ED Resources VI 5 10 50 00 Total ED Resources VT 45 184 24 04 Total ED Resources VA 269 1006 27 27 Total ED Resources WA 279 1079 26 27 Total ED Resources WV 31 172 18 03 Total ED Resources WI 230 881 26 23
Total ED Resources WY 12 49 24 01
Total 10146 46099 1000
Impact Study of Entrepreneurial Development 132Resources ndash 2010-2011

Office of Entrepreneurial Development
[This page is intentionally left blank for two-sided printing]
Impact Study of Entrepreneurial Development viii Resources ndash 2010-2011
Office of Entrepreneurial Development
FOREWORD
Concentrance would like to thank the US Small Business Administrationrsquos (SBA) Office of Entrepreneurship Education and SBArsquos Office of Entrepreneurial Development Program Offices Small Business Development Centers SCORE and Womenrsquos Businesses Centers for their assistance in conducting this research Both headquarter offices and local ED Resources spent considerable effort to ensure that clients from each center were represented in the data collection The rich dataset that now exists is in no small measure due to these efforts
The following individuals contributed to the development of this report
Jane Dwight- Managing Partner Concentrance Consulting Group Matthew C Herman- Project Director Concentrance Consulting Group Benjamin Joiner- Business Analyst Concentrance Consulting Group Dr George Solomon- Senior Policy Advisor SBA Office Of Entrepreneurship Education Dr Vanessa Perry- Associate Professor George Washington University
Impact Study of Entrepreneurial Development 1Resources ndash 2010-2011
Office of Entrepreneurial Development
[This page is intentionally left blank for two-sided printing]
Impact Study of Entrepreneurial Development 2Resources ndash 2010-2011
Office of Entrepreneurial Development
I INTRODUCTION
The US Small Business Administrationrsquos (SBA) Office of Entrepreneurial Development (ED) designed a multi-year time series study to assess the impact of the face-to-face counseling programs it offers to small businesses This study has examined clients who received face-to-face counseling services starting in 2003 The SBA initiated this study as part of the Office of Management and Budgetrsquos (OMB) Program Assessment Rating Tool (PART) SBA contracted with Concentrance Consulting Group to assist in administering the study to analyze the findings and to write this report This report is the eighth report1 in the study and presents the findings from three separate study groups each year This yearrsquos study group includes 2010 clientsrsquo initial attitudinal assessment of their counseling experience and a follow-up with 2009 and 2008 clients to assess the financial impact of the received assistance2
Study Year 2009 Study Year 2010 Study Year 2011
2008 Clients Initial survey First follow-up Second follow-up
2009 Clients Initial survey First follow-up
2010 Clients Initial survey
Study Year 2009 Study Year 2010 Study Year 2011
This study measures attitudinal assessments perceptions of changes in managementmarketing practices and business growth for firms that utilized SBArsquos ED Resource Partnersrsquo face-to-face counseling during the late summer or early fall of 2008 2009 or 2010 The ED Resource Partners include Small Business Development Centers (SBDC) SCORE and Women Business Centers (WBC)
This report includes Executive Summary Methodology
o Research Questions o Sampling data collection response rate and survey administration o Data analysis and analysis of non-response o Follow-up o Limitations
Findings Initial economic impact study o Impact of total ED Resources (2008 - 2009 - 2010) o Regression analysis o Impact of SBDC resources 2010 o Impact of SCORE resources 2010 o Impact of WBC resources 2010 o Quantitative analysis overview o Qualitative analysis of collected client comments
Findings Follow-up study of 2008 and 2009 ED Resource clients Recommendations for further research
1 Each ED Resource final report can be found at httpwwwsbagovaboutsbasbaprogramsedindexhtml 2 For information on 2003 2004 2005 2006 and 2007 clients please see previous reports
Impact Study of Entrepreneurial Development 3Resources ndash 2010-2011
Office of Entrepreneurial Development
The appendix includes the distribution of responses for each survey question sample survey instruments additional regression results and distribution of responses for each ED Resource by state
[This page is intentionally left blank for two-sided printing]
Impact Study of Entrepreneurial Development 4Resources ndash 2010-2011
Office of Entrepreneurial Development
II EXECUTIVE SUMMARY
The US Small Business Administrationrsquos (SBA) Office of Entrepreneurial Development designed a study to assess the impact of its Entrepreneurial Development (ED) Resource Partnersrsquo face-to-face counseling assistance on small business clients and contracted Concentrance Consulting Group to conduct the study Thus far the study has examined ED Resource Partner clients that received face-to-face counseling assistance in 2003 and clients from each subsequent year up to and including the present study of 2010 clients This latest report presents the findings of the initial attitudinal impact study of 2010 ED Resource Partner clients and a follow-up study showing the financial impact on 2009 and 2008 clients Within the report all references to ED Resource Partner clients pertain to ED Resource Partnerrsquos face-to-face counseling clients who received assistance from a designated ED Resource Partner ED Resource Partner Clients Studied Concentrance studied the outcomes of three ED Resource Partners Small Business Development Centers (SBDC) SCORE and Women Business Centers (WBC)
Within each ED Resource Partner we studied three small business client segments including Nascent - Those individuals who have taken one or more positive steps to start a business Start-up - Those individuals who have been in business one year or less and In-Business ndash Those individuals who have been in business more than one year and are
classified as small by the SBA For the 2010 clients who responded to the initial impact study we analyzed demographic characteristics perceived usefulness of assistance and initial impact on businesses We also assessed the survival rates and financial growth of 2009 and 2008 clients Quantitative Findings (Initial Impact Study 2010 Clients)
Concentrance collected coded and analyzed data for 10146 ED Resource clients for an overall response rate of 23 This yearrsquos survey comprised the largest sample and achieved the greatest number of respondents since the inception of the study The table below provides the number of respondents and response rates for each ED Resource
Resource Center
Stratified Sample Size
Usable Sample
Size3
Surveys Received via Web
Surveys Received via Phone
Total Surveys
Received
Response Rate 2010
Clients SBDC 21514 20329 4183 930 5113 25 SCORE 22002 21521 3513 931 4444 21 WBC 3229 3021 450 139 589 20 Total 46745 44871 8146 2000 10146 23
Resource Center
Stratified Sample Size
3 The usable sample size includes the stratified sample minus surveys noted as undeliverable by web or phone due to incorrect contact information The accuracy and completeness of the contact information for clients provided by ED Resource offices was much improved for 2010 clients compared to previous years
Impact Study of Entrepreneurial Development 5Resources ndash 2010-2011
Office of Entreprreneurial DDevelopm ment
The figurre below illusstrates the buusiness segmeent composittion of each ED Resourcce
Distribbution of Responddents by SSegment t (2010 Cllients)4
nn = 10146
NNascent 1143 1306 1880
SStart-up 929 920 1111
B In-
Business 3003 2175 2993
Total 5113 4444 5889
CClient Year Stratified d Sample Si ize
Usea able Sample e Size
Follo ow-up p
Surveys s Received in n 2008
Response Rate
2008 854 854 2nnd 200 23
2009 8493 84993 sst 1 11968 23
The 20088 clients weree resurveyed in 2011 to deetermine finaancial impactt after two yeears in terms of financial ggrowth and ffirm survivall rates Theirr response raate was 23 equal to the previous yeaarrsquos study Thhe 2009 cliennts were also resurveyed aat this time too determine financial imppact and firmm survival rrates after onne year The response ratee for this grooup was also 23 the higghest responnse rate sincee the inceptioon of the studdy for a first follow-up grroup
4 Respondeents (86) who reeported being in business butt who did not pprovide a valid sstart date for thhat business weere not assigned too a business segmment Therefoore percentagess of clients in eaach business se egment may nott equal 100
Impact S tudy of Entrepren neurial Develop pment Resource es ndash 2010-2011 1
6
Office of Entreprreneurial DDevelopm ment
FY2011 0 SBDC SCCORE and WBC clientt s all reporte ed lower rev venues than those serve ed in the previous yee ar SBDC continues too serve the c clients with h the highest t average revenuu es ($774000 0) followedd by SCOREE ($502000) ) and WBC C ($171300)
Average eemployment llevels for SBBDC SCOREE and WBC cclients all felll from 2009 levels
Impact S tudy of Entreprenn eurial Developp ment Resourcee s ndash 2010-2011 1
7
RRev 2008 $6340000 $818400 $229500
RRev 2009 $8553000 $728400 $311200
RRev 2010 $7740000 $502000 $171300
Emmpl 2008 7 7 5
Emmpl 2009 7 6 4
Emmpl 2010 5 3 3
f
t
ED D Resource es served a ddiverse clien nt base in 20 010 similar tto past yearrs regarding g de emographic and busine ess characte eristics
Office of Entreprreneurial DDevelopm ment
The tootal ED Resoource client bbase consisteed of Femalle (36) Malle (36) firmms with MMale and Femmale owners (17) White (68) BlackAfrican AAmerican (111) Veteraan (9) Servvice-disabledd Veteran (2) HispanicLatino (7)) Asian (4)) Ameriican IndianNNative Alaskkan (2) andd Native HawwaiianPacifific Islander (11)5
The percentage of firms ownedd by White aand Veteran clients has ddecreased fromm the prrevious year66 Male and FFemale ownerrs is a new caategory for thhe 2011 studdy whichh partially expplains the deccrease in bothh the Femalee and Male ddemographicss
For 20010 the greatest percentaage of busineess owners (228) were beetween the agges of 45-54 Those bbetween the aages of 35-444 made up 222 of clientss Twenty peercent consissted of clients between thhe ages of 55--64 down thhree percentaage points froom last yeear7 Clients 225-34 were 113 of the tootal ED Resoource client bbase8
The mmost often citted primary bbusiness induustries for 20009 clients re emained the ssame as in ppast years seervice (14) and retail (11) The prrevalence of the service aand retail iindustry categories have rremained levvel over the ppast year howwever manuffacturing connsulting andd health care have all decrreased by appproximately oone percenntage point aand ldquootherrdquo hhas increasedd by three perrcentage poinnts
Firms owned by mmen reported revenues onn average more than twicce as high as those owned by w omen Reveenues for botth groups felll over the paast year The highesst average revvenues by racceethnicity were reporteed by HispannicLatinos followwed by Whitee and Asian fifirms Averagge revenues for every racceethnicity experiienced decreaases especiallly Native HaawaiianPaciific Islanders Veterans experiienced increaases in averagge revenues wwhile Servicee-disabled V eterans reporrted lower revenues thaan the previoous year
FY Y2010 client s gave lowe er ratings (73 3) than th he previous y yearrsquos respo ondents (75 5) to the u usefulness o of the assistaance they re eceived Th he effect of c counseling as sistance on the clientrsquos ability to d develop a bu usiness plan (35) mar rketing pla an (30) ha as remained d relatively c consistent ac cross past st tudies
5 These 20110 demographicc distributions wwere comparedd to the nationaal averages fromm the 2007 Survvey of Businesss Owners froom the US Cennsus Bureau (SBBO) The totall ED Resource s demographic distribution waas compared too the national averages from thee SBO The d isstribution was ccomparable acrross characterisstics except for the following SSBO figures White business ow wners were 83 of the small bbusiness popul lation Female b business ownerrs were 29 MMalebusiness owwners were 51 and BlackAffrican Americann business ownners were at 7 6 Just over 16 of survey respondents diid not answer thhe race questio ons whereas 455 answered laast year Thereffore the drop inn in the numberr of Whites mayy be due to nonn-responses andd not reflective of the actual p opulation 7 Eleven peercent of surveyy respondents ddid not respondd to the age queestion for this yyearrsquos study Laast year only twwo percent didd not respond This may explaain some of thee variation betwween this yearrsquos study and the 22010 study 8 The total ED Resources age distributio n was compareed to the nationnal averages fromm the SBO The distribution was comparablee except that 655+ was reportedd at 125 (commpared to 5 ffor total ED Reesources)
Impact S tudy of Entrepren neurial Develop pment Resource es ndash 2010-2011 1
8
Office of Entreprreneurial DDevelopm ment
Usefulness ratings also include the financiall impact of aassistance on hiring new sstaff (11) retaining cuurrent staff (115) increasing profit mmargin (22) and increasiing sales ((25) The rratings for alll categories hhave gone doown from thee previous yeear
Laa rger firms rr eported higg her levels oo f perceived d usefulness of ED Reso ource as sistance thaa n did smalll er firms F irms that re eceived less than 3 hour rs of as sistance repp orted lowerr levels of pee rceived use efulness tha an firms with h 3 or m ore hours off counselingg
Total ED Resourc ce clients that t received 3 o or more hour rs of counsel ling reported d 76 o of the time th hat counselin ng was useful l versus 69 for clients t that received d less than 3 3 hours of co ounseling
There were no diff ferences in q quality of cou unseling expe erience basedd on businesss segme ent ED Reso ource or geog graphic locatti ion
There were no sign nificant effec cts of clientrsquos s age gender veteran stat tus or ethnic city on per rceived usefu ulness How wever Americ can IndianA Alaskan Nativ ve and White e clients s reported sig gnificantly hi igher perceiv ved usefulnes ss No other significant differe ences based o on race were e found
All though clie nt reported perceptionss of each EDD Resourcee were largelly similar th ere were somm e key diffee rences
For SC CORE client ts 55 repor rted the perc ceived reputa ation of SCO ORE led to th heir decisio on to seek EDD Resource assistance co ompared to 4 44 for SBD DC clients an nd 40 f for WBC clie ents
Appro oximately 39 of WBC S Start-ups and d 42 of WB BC In-Busine ess clients report ted that assist tance they re eceived result ted in increas sed sales com mpared to 25 5 and 33 3 respectiv vely for SCOR RE clients an nd 33 and 37 for SBD DC clients respec ctively
For W WBC clients 3 38 of Start t-ups reporte d that they d decided to go o into busines ss as a resul lt of assistan ce compared d to 33 for SBDC and 3 30 for SCO ORE This tr rend w l l
as a so apparent for Nascent clients
Fi irms in the I In-Business s segment a and larger fir rms were le ss likely to r report that th heir decision n to start a b business wa s the result of ED Reso ource assista ance
Twentty-five percennt of Nascennt clients andd 32 of Starrt-up clients reported thaat their ddecision to sttart a businesss was the ressult of ED RResource assistance
Impact S tudy of Entrepren neurial Develop pment Resource es ndash 2010-2011 1
9
Office of Entreprreneurial DDevelopmment
Consistent with thhe previous yeearrsquos results larger firms firms in the In-Businesss segmeent and SCORRE clients wwere significanntly less likelly to report thhat their decisioons to start bbusinesses weere the resultt of the ED RResource asssistance they received
Fii ndings fromm an analys is of follow--up surveys of 2008 and d 2009 client ts suggest buu sinesses thh at received ED Resourr ce assistan nce have a hi igher surviv val rate thh an other smm all business ses in the PP SED II Th he survival r rate after tw wo years ww as 93 for ED Resourr ce clients cc ompared to o 80 for fir rms in the P PSED II
Appro oximately 57 of 2008 N Nascent client ts had transit tioned to the e In-Business s segme ent after two years while 29 of 200 09 Nascent cl lients had go one into busin ness after o one year On nly six percen nt of 2008 of f In-Business s clients and three percen nt of 2009 c clients went o out of busine ess by 2010
In the e second follo ow-up of 200 08 clients fir rms receiving g 3 or more h hours of couns eling had hig gher survival rates than th hose who rec ceived less th han 3 hours oof couns eling
A com mparison of tthe difference e in growth r rates for SBA A ED Resour rce clients wi ith GDP the Private C Company In ndex (PCI) an nd the Stand dard and Poo orrsquos SmallCap p 600 Index from 2009 t to 2010 show ws that SBA E ED Resource e clients outp paced the oth her bench hmarks with a a difference o of 134 perce entage points s over five p percentage po oints more than the nex xt highest find ding9 Altho ough all three e benchmarks s indicated positiv ve growth du uring this tim me SBA ED R Resource clie entsrsquo progres ssed more rap pidly
9 T ee uu rr EE aa rrhttpwwwwbeagovnationalxlsgdpchhgxls the Privaate Company Inndex (PCI) - puublished by Enttrex this index measures reevenue performmance in the secctor of private ccompanies rangging from $3 mmillion to $60 mmillion in annuall revenues (hhttpwwwpriivatecompanyinndexcom) and the S amp P SmaallCap 600 Indeex - represents approximately 3 of the US maarket and incluudes 600 lsquosmall caprsquo companiess with market ccapitalizations bbetween $300 mmillion and $2 bbillion
he thre benchmarks sed for compa ison of SBA D Resources re GDP - Sou ce
Impact S tudy of Entrepren neurial Develop pment Resource es ndash 2010-2011 1
10
Office of Entrepreneurial Development
Qualitative Findings
A few clients from each ED Resource provided ad hoc commentaries in emails with their survey instrument
Comments were both positive and negative for each ED Resource
Recommendation for Further Research
An additional study could examine the effects of different types of financing (eg SBA Guarantee Loan vs SBA Disaster Loan) on perceived improvements survival and business growth
Methodology
The initial impact study of 2010 clients was quantitative in nature based upon responses to web surveys Statistical analyses utilized frequency distributions average comparisons cross tabulations and regression models This yearrsquos study computed revenue and employment data using means rather than medians which were the bases of previous yearsrsquo studies Given wide fluctuation and disparity in revenue and employment among small businesses using mean comparisons is a more informative measure
The survey of clients resulted in a respondent sample of 10146 clients ED Resources provided a random sample list of 46745 clients served during the late summer or early fall of 2010 Concentrance sent web surveys to ED Resource face-to-face counseling clients via email We sent reminder emails each week for four weeks after the initial emailing Phone surveys were attempted for clients who did not respond to web surveys According to statistical tests there was no evidence of bias due to non-response
Concentrance used regression analyses to test for the impact of client demographics on client perceptions of ED Resource assistance outcomes Each regression model examined the impact of selected demographic characteristics (age gender race ethnicity and veteran status) and firm characteristics (size business segment ED Resource geographic location and hours of assistance) on a particular resource impact These impacts included perceived usefulness of ED Resource assistance perceived impact on the decision to start a business and perceived impact on sales
The respondent sample for the second follow-up survey of 2008 clients was 200 The respondent sample for the first follow-up of 2009 clients was 1968 A matched sample was used to perform pair-wise statistical tests that compared changes in growth and business segment to other benchmarks Revenue and employment growth for ED Resource clients were examined by comparing SBA data to that of the Panel Study of Entrepreneurial Dynamics II10 (PSED II) the Private Company Index and the SampP SmallCap 600 Index
10 The Panel Study of Entrepreneurial Dynamics II is a nationwide multi-million dollar survey of nascent entrepreneurs funded by the Kauffman Foundation The primary purpose of the study is to identify adults active in business creation obtain detailed information about the start-up effort and perform follow-up interviews to determine outcomes We rely on the PSED I and PSED II as benchmarks however results must also be interpreted with caution due to potential response bias and definitional differences in the ways that firms are classified
Impact Study of Entrepreneurial Development 11Resources ndash 2010-2011
Office of Entrepreneurial Development
Limitations to consider when interpreting these results include
Measures of ED Resource impacts are attitudinal and are self-reported by the client
Many respondents did not report revenue data
Estimates of firm survival and growth over time should be interpreted with caution Due to attrition firms that have gone out of business may be under represented
Impact Study of Entrepreneurial Development 12Resources ndash 2010-2011
Office of Entrepreneurial Development
III METHODOLOGY
This report contains findings from the initial impact study of face-to-face ED Resource counseling clients from 2010 and a follow-up study of the 2008 and 2009 clients that participated in initial impact studies in previous years11 The methodology for the initial impact study for 2010 clients is presented first followed by the methodology for the 2008 and 2009 client follow-up study The initial impact study reports clientsrsquo attitudinal assessments of their counseling experience and the follow-up study reports the long-term financial impact of assistance on client firms
Research Questions The following questions are the focus of this study and are addressed in the findings section of this report The last two questions numbers six and seven are addressed in the follow-up study which comprises time series analysis of multi-year data
1 What is the demographic financial and business profile of firms who utilize ED Resources
2 Is there a relationship between the servicesassistance provided by ED Resources (SBDC SCORE and WBC) and the clientrsquos perception of the usefulness and value of the servicesassistance received
3 Is there a relationship between the servicesassistance provided by ED Resources and the clientrsquos decision to start a business
4 Is there a relationship between the servicesassistance provided by ED Resources (SBDC SCORE and WBC) and the clientrsquos decision to implement andor change management andor marketing practices in their business
5 Are the servicesassistance provided by ED Resources (SBDC SCORE and WBC) having an impact on the clientrsquos financial position in terms of job creation job retention and sales
Follow-up study of 2008 and 2009 ED Resource clients
6 Based on a comparison of the total ED Resources with the Panel Study of Entrepreneurial Dynamics II (PSED II)12 what is the impact of ED Resource assistance on firm survival
What was the rate of transition of Nascent and Start-up firms to the In-Business segment
11 All references to ED Resource clients pertain to ED Resource Partnersrsquo face-to-face counseling clients who received assistance from a designated ED Resource Partner (SBDCSCOREWBC) 12 The Panel Study of Entrepreneurial Dynamics II is a nationwide multi-million dollar survey of nascent entrepreneurs funded by the Kauffman Foundation The primary purpose of the study is to identify adults active in business creation obtain detailed information about the start-up effort and perform follow-up interviews to determine outcomes We rely on the PSED I and PSED II as benchmarks however results must also be interpreted with caution due to potential response bias and definitional differences in the ways that firms are classified
Impact Study of Entrepreneurial Development 13Resources ndash 2010-2011
Office of Entrepreneurial Development
7 What is the financial impact of servicesassistance provided by ED Resources as a whole in terms of job creation job retention and sales
How does the difference in growth rate of ED Resource clients from 2009 to 2010 compare with selected growth benchmarks such as the gross domestic product (GDP)13 and Standard amp Poorrsquos SmallCap 600 Index14 and the Entrex Private Company Index (PCI)15
Sampling and Data Collection
This study examines the effects of SBA ED Resource assistance on client firms by respective ED Resource and by clients in the following various stages of business formation Nascent - Individuals who have taken one or more steps to start a business Start-up - Individuals who have been in business one year or less In-Business ndash Individuals who have been in business more than one year and are classified as
small by the SBA
The initial impact study of 2010 clients was quantitative in nature based upon responses to web and telephone surveys The responses provided a statistically significant sample for each ED Resource To determine if the sample size for this study was sufficient Concentrance tested the sample size on the basis of reported sales revenues The initial sample of 2010 clients is sufficiently large enough for accuracy within plus or minus $98861 in reported annual sales revenues at a 99 confidence level16
Table 31 on the following page depicts the distribution of surveys across ED Resource and the response rates by ED Resource The overall response rate was 23 which is comparable to the response rates found in other surveys of entrepreneurs For example Aldrich and Baker (2000) found that nearly a third of surveys of entrepreneurs had response rates below 2517 In another example the National Federation of Independent Business (NFIB) had a response rate of 20 in its Small Business Economic Trends survey conducted in June of 201018
13 Source httpwwwbeagovnationalxlsgdpchgxls 14 The S amp P SmallCap 600 Index - represents approximately 3 of the US market and includes 600 lsquosmall caprsquo companies with market capitalizations between $300 million and $2 billion The SampP SmallCap 600 Index is a commonly used benchmark for growth 15 The Private Company Index (PCI) - published by Entrex this index measures revenue performance in the sector of private companies ranging from $3 million to $60 million in annual revenues (httpwwwprivatecompanyindexcom) 16 This assumes a normal distribution of annual revenues with a standard deviation of $2324497 17 Aldrich Howard E and Ted Baker (2000) ldquoBlinded by the Cites Has there been any progress in entrepreneurship researchrdquo in Entrepreneurship 2000 ed Donald L Sexton and Raymond L Smilor Chicago Upstart Publishing p 377-400 18 William K Dunkelberg and Holly Wade ldquoNFIB Small Business Economic Trendsrdquo NFIBcom July 2010 lthttpwwwnfibcomPortals0PDFsbetsbet201007pdfgt
Impact Study of Entrepreneurial Development 14Resources ndash 2010-2011
Office of Entrepreneurial Development
Table 31 ndash Sampling Frame
Resource Center
Stratified Sample Size
Usable Sample Size 19
Surveys Received via Web
Surveys Received via Phone
Total Surveys
Received
Response Rate 2010
Clients SBDC 21514 20329 4183 930 5113 25 SCORE 22002 21521 3513 931 4444 21 WBC 3229 3021 450 139 589 20 Total 46745 44871 8146 2000 10146 23
Survey Administration Following a successful pilot test of web-based survey administration for the 2008-2009 impact study of ED Resources Concentrance adopted web-based survey administration as the primary technique for this study This delivery mechanism has provided greater efficiency with regard to increasing the number of completed surveys for ED Resource clients ED Resources drew a random sample of clients served during the late summer or early fall of 2010 based on a random sample table provided to each ED Resource See Appendix 4 for the survey instrument Via email Concentrance sent selected clients SBA cover letters and an invitation to take a web-based OMB approved survey We sent reminder emails each week for four weeks after the initial emailing We logged-in all received surveys entered the survey data into a database for analysis and developed an electronic database list of non-respondents for a telephone follow-up survey All surveys were assigned a computer-coded with client codes to facilitate unique identification of each client for follow-up surveys while ensuring privacy
19 The usable sample size includes the stratified sample minus surveys noted as undeliverable by web or phone due to incorrect contact information The accuracy and completeness of the contact information for clients provided by ED Resource offices was much improved for 2010 clients as compared to previous years
Impact Study of Entrepreneurial Development 15Resources ndash 2010-2011
Resource Center
Stratified Sample Size
Usable Sample Size 19
Office of Entreprreneurial DDevelopm ment
Figure 311 shows the distribution oof survey resspondents byy respective EED Resourcee and businesss segment The In-Bussiness segmeent was the laargest segmennt served forr all resourcees The Startt-up segment iis smaller thaan the other segments in part becausee of the narroow definitionn of Start-upss (firms thaat have been in business ffor one year or less)
)20Figure 31 ndash Disstributionn of Resppondents by Segmment (2010 clients)
nn = 10146
Naascent 1143 1306 1800
Staart-up 929 920 111
In-Business
3003 2175 2933
Total 5113 4444 5899
20 Responddents (86) who rreported being in business buut who did not pprovide a valid start date for thhat business wwere not assigneed to a businesss segment Theerefore percenttages of clients iin each businesss segment mayy not equal 100
Impact S tudy of Entrepren neurial Develop pment Resource es ndash 2010-2011 1
16
Office of Entrepreneurial Development
Data Analysis
Analyses included the following methods basic descriptive statistics frequency distributions cross tabulations and regression Concentrance used basic descriptive statistics for continuous variables such as annual sales revenues We used frequency distributions for Likert scales and respondents answered on a scale of 1 to 5 Cross-tabulations were used to compare responses across ED Resources business segments and hours of counseling received Finally Concentrance used multiple regression analyses to test for differences in key outcomes such as perceived usefulness or financial impact of ED Resource assistance based on demographic or firm characteristics We selected these analyses to meet the objectives of each research question and to facilitate interpretation of findings For this yearrsquos study revenue and employment calculations were completed using mean data instead of median data which was utilized for previous yearsrsquo studies
Analysis of Non-Response
SBArsquos research plan for this study included a methodology for estimating potential non-response bias Non-response bias can occur in survey research if respondents differ substantially from those that do not respond The best way to protect against this bias is to improve the response rate An effective method for achieving high response rates is the use of follow-ups and reminders In this study non-response bias was minimized by sending four reminder emails containing a link to the survey and minimized further by telephone follow-ups to non-respondents
We assessed the extent and direction of potential non-response bias by comparing the characteristics of clients who responded to the internet survey with those who did not Of the 10146 total clients surveyed 8146 were surveyed over the web The remaining clients (2000) were surveyed over the phone Clients surveyed over the phone were more likely to report revenue and employment figures Additionally these results hold when other respondent characteristics are controlled for (ED Resource Business Segment and Hours of Counseling Received)21
The next step was to conduct a comparative analysis of the responses between these groups to determine if the difference in response rates would have an impact on our analyses Results of regression analyses revealed no significant differences between these groups in terms total number of employees There was a significant difference in revenue found between phone and web respondents However only a very small portion of the total variance in revenue (02) is explained by this difference 22
21 These findings were based on results of four logistic regression analyses to determine whether web versus phone respondents differed significantly in terms of missing revenues and missing employment data The models were significant at the plt0001 level and the variable indication phone response was always significant at the plt0001 level 22 These findings were based on results of a regression analysis to determine whether web versus phone respondents differed significantly in terms of number of employees where a positive number of total employees are reported A scheffe test reveals no significant difference between phone and web at the 010 level The t-test associated with the regression analysis reveals a non-significant result (t=-161 p=01075) A second regression was performed to determine whether web versus phone respondents differed significantly in terms of reported sales revenues greater than or equal to 1000 A scheffe test for this difference revealed a significant difference between phone and web at the 005 level The t-test associated with the regression analysis reveals a significant result also (t=256 p=00106) The R-square value associated with this model is 0002
Impact Study of Entrepreneurial Development 17Resources ndash 2010-2011
Office of Entrepreneurial Development
Additionally the difference in phone and web respondents was tested against perceived service usefulness Although a significant difference in the service variate was found only a small portion of the variance of each of the service measures can be explained by the difference between phone and web respondents Similar results were found with the perceived value of the information the respondents received 23 Because the evidence of response bias is minimal the phone and web respondents were pooled in subsequent analyses Follow-up Study 2008 and 2009 ndash Sampling Data Collection and Analysis of Non-Response A follow-up study was conducted of both 2008 and 2009 clients in order to evaluate the financial impact on these groups one year and two years after they were counseled by ED Resources There were 854 clients from 2008 that were contacted for a second follow-up in the beginning of 2011 Two-hundred clients responded to this second follow-up which represents a 23 response rate Each of these respondents had valid client codes that could be matched on a one-to-one basis with the initial impact survey respondents Thus for a sample of 200 clients there were detailed data which could be tracked for three years There were 8493 respondents to the initial impact survey of 2009 clients Of those contacted 1968 responded to the survey and provided detailed data that could be tracked for two years Table 32 shows the number of surveys received by total ED Resources and the total response rates
Table 32 ndash Follow-up Impact Study Clients
Client Year Stratified
Sample Size Useable
Sample Size Follow-
up Surveys Received
in 2008 Response
Rate
2008 854 854 2nd 200 23
2009 8493 8493 1st 1968 23
These matched samples were used to perform pair-wise statistical tests that compared changes in growth by business segment and by ED Resource Although there were a small number of observations available for this analysis these findings provide a more precise estimate of changes in revenues and employment over time than aggregate non-matched comparisons
23 These findings were based on results of two multivariate regression analyses and a series of simple linear regression analyses to determine whether web versus phone respondents differed significantly in terms of the reported perceived service usefulness and value of information received The Wilkesrsquo Lambda value is significant for both multivariate analyses indicating there is some linear combination of the perceived usefulness measures and perceived value of received information that is explained by the difference in phone vs web respondents The R-square values of the six individual measures of service and information predicted by the difference in phone vs web respondents was explored These values are range from 00084 to 00238
Impact Study of Entrepreneurial Development 18Resources ndash 2010-2011
Office of Entrepreneurial Development
Limitations
There are several limitations that should be considered when interpreting the results presented in this report These limitations are inherent in the research design and methodology
Measures included in this initial survey are primarily attitudinal and all items are self-reported Thus there are few objective measures that can be used to assess actual client performance or make comparisons with other data sources
Many respondents did not report revenue data which is critical to measuring growth from year-to-year For example out of Start-up and In-Business firms approximately 39 reported zero revenues or did not report revenues
Estimates of firm survival and growth over time should be interpreted with caution Due to attrition firms which have gone out of business may be under-represented
Impact Study of Entrepreneurial Development 19Resources ndash 2010-2011
Office of Entrepreneurial Development
[This page is intentionally left blank for two-sided printing]
Impact Study of Entrepreneurial Development 20Resources ndash 2010-2011
Office of Entrepreneurial Development
IV TOTAL ED RESOURCES 2008 - 2009 - 2010
The following section presents comparison results of face-to-face counseling clients from 2008 2009 and 201024 First the general demographic and financial characteristics of the total ED Resource clients are presented This is followed by additional findings on the impact of the total ED Resources on Nascent Start-up and In-Business firms organized by research question as follows
Is there a relationship between servicesassistance provided by ED Resources (SBDC SCORE and WBC) and the clientrsquos perception of the usefulness and value of servicesassistance received
Is there a relationship between the servicesassistance provided by ED Resources (SBDC SCORE and WBC) and the clientrsquos decision to start a business
Is there a relationship between the servicesassistance provided by ED Resources (SBDC SCORE and WBC) and the clientrsquos decision to implement andor change management andor marketing practices in their business
Are the servicesassistance provided by ED Resources (SBDC SCORE and WBC) having an impact on the clientrsquos financial position in terms of job creation job retention and sales
Please note that comparisons between the 2008 2009 and 2010 initial study clients should be interpreted with caution Concentrance collected cross-sectional data from a different set of firms each year and these firms were operating under different economic conditions To better understand changes over time the follow-up study included in this report tracks the same firms over a three year period
24 All references to ED Resource clients pertain to ED Resource Partnersrsquo face-to-face counseling clients who received assistance from a designated ED Resource Partner (SBDCSCOREWBC)
Impact Study of Entrepreneurial Development 21Resources ndash 2010-2011
Office of Entrepreneurial Development
Demographic Characteristics of ED Resource ClientsThis section describes the general demographic and financial characteristics of total ED Resource clients that were served in 2010 These results are based on an analysis of 10146 completed surveys As shown in Figure 41 the In-Business segment (54) was the largest business segment served by ED Resources in 2010 The size of the In-Business segment remained consistent with the previous year The Start-up segment increased for the third year in a row though the change is in part due to the revised definition of Start-up businesses
Figure 41 ndash Total ED Resources ndash Client Segments Served25
2008 n = 6770 2009 n = 8493 2010 n = 10146
The average annual revenue for ED Resourcesrsquo clients was $637200
Table 41 ndash Total ED Resources-Revenues and Employment26 (2010)
Total ED Resources
Average Revenue $637200
Average Employees 4
25 Respondents (86 for 2010) who reported being in business but who did not provide a valid start date for that business were not assigned to a business segment Therefore the total of client segments served for each year may not equal 100 26 Firms that reported revenues were required to do so within the range of $1000 to $25000000
Impact Study of Entrepreneurial Development 22Resources ndash 2010-2011
Total ED Resources
Rev 2008 $634000 $818400 $229500
Rev 2009 $855300 $728400 $311200
Rev 2010 $774000 $502000 $171300
Empl 2008 7 7 5
Empl 2009 7 6 4
Empl 2010 5 3 3
Office of Entrepreneurial Development
ED Resources continued to differ in terms of the size of firms they served as shown in Figure 42 Again this year SBDC continues to serve the highest revenue clients ($774000 average) followed by SCORE ($502000 average) and WBC ($171300 average) All three of ED Resourcesrsquo clients reported lower average annual revenues than those assisted in 2009 Average employment reported by SBDC SCORE and WBC clients was also lower than clients served in 2009 in all cases especially SCORE In terms of revenues WBC serves a distinct client base from both SBDC and SCORE however SBDC and SCORE do not serve distinct client bases in terms of revenue27
Figure 42 ndash Total ED Resources ndash Revenue and Employment (Average ED client Revenues and Number of Employees)
27 We used a Scheffe test to examine the pair-wise differences to control for the familywise error rate We found significant revenue differences (95 confidence) between WBC and SBDC as well as between WBC and SCORE groups No other significant differences were found
Impact Study of Entrepreneurial Development 23Resources ndash 2010-2011
Office of Entrepreneurial Development
Figure 42A examines the average revenues by the hours of counseling received28 to understand the relationship between client revenues and resource utilization The data shows that clients from SBDC SCORE and WBC that received a greater number of hours of counseling tended to be larger in size For example average revenues for SCORE clients who received less than 3 hours of counseling were $336400 while average revenues for clients who received 3 or more hours of counseling were $618300 This trend is also apparent with SBDC clients where the difference between clients that received 5 or more hours of counseling and those that received from 3 to less than 5 hours of counseling is $148700 The overall average revenues regardless of hours of counseling indicated by the black cross bars in the figure below were $774000 for SBDC 502000 for SCORE and 171300 for WBC
Figure 42A ndash Total ED Resources ndash Revenues by Hours of 29 Counseling
Aggregate Hours Mean Revenue
($502000)
($774000)
($171300)
($637200)
28 For each ED Resource the number of respondents is comparable for each category of hours of counseling received SBDC lt 3 hrs = 1668 ge 3 amp lt 5 hrs = 1668 ge 5 hrs = 1777SCORE lt 3 hrs = 2219 ge 3 hours= 2225WBC lt 3 hrs = 297 ge 3 hours= 292 29 SBDC reports hours of counseling in three categories (lt 3 ge3 to lt5 ge 5) whereas SCORE and WBC report two categories (lt 3 ge 3) SCORE and WBC also provide 5 or more hours of counseling to their clients and these hours are captured in the 3 or more hours of counseling category When comparing ED Resources by hours of counseling those clients receiving 3 or more hours of counseling from SBDC reported average revenues of $843500
Impact Study of Entrepreneurial Development 24Resources ndash 2010-2011
Office of Entrepreneurial Development
Figure 43 presents the demographic characteristics of ED Resource clients in terms of gender race ethnicity and veteran status30 A new category was added to the survey for this year For the first time clients were able to select ldquoMale and Female Ownersrdquo as an answer to the gender of the owner(s) question (See Appendix 4 for a complete survey instrument) Predictably both Male and Female categories dropped sharply from last yearrsquos numbers The proportions of the majority of the race and ethnicity categories have not changed from the previous year with the exception of a reduction in the number of Whites31 Figure 43 ndash Total ED Resources ndash Demographic Characteristics32
2008 n = 6770 2009 n = 8493 2010 n = 10146
30 The Veteran and Service-disabled Veteran categories are shown in the figure above Additional results for total ED Resource clients included Reservist (03) and National Guard Member (04) 31 Just over 16 of survey respondents did not answer the race questions whereas 45 answered last year Therefore the drop in in the number of Whites may be due to non-responses and not reflective of the actual population 32 Totals may not equal 100 due to non-respondents and respondents who selected multiple ethnicities The 2010 total ED Resources demographic distribution was compared to the national averages from the 2007 Survey of Business Owners from the Census Bureau (SBO) The distribution was comparable across characteristics except for the following SBO figures White business owners were 83 of the small business population Female business owners were 29 and Male business owners were 51
Impact Study of Entrepreneurial Development 25Resources ndash 2010-2011
Office of Entrepreneurial Development
Figure 44 shows the distribution of ED Resource clients by age of business owner The largest groups of ED Resource clients belonged to the 45 to 54 and 35 to 44 age categories 28 and 22 respectively This outcome is consistent with the previous years depicted in the figure Both the 18-24 and 25-34 age categories increased slightly from the previous year Differences in findings from the previous year may be due to an increased number of clients that did not respond to the corresponding survey question for age33
Figure 44 ndash Total ED Resources ndash Age of Business Owner34
2008 n = 6770 2009 n = 8493 2010 n = 10146
33 Survey questions can be found in the survey instrument in Appendix 4 q18 requests the clientsrsquo age Eleven percent did not respond to the age question for this yearrsquos study Last year only two percent did not respond 34 The 2010 total ED Resources age distribution was compared to the national averages from the SBO The distribution was comparable except that SBO reported 65+ at 125 (compared to 5 for ED Resources)
Impact Study of Entrepreneurial Development 26Resources ndash 2010-2011
Office of Entrepreneurial Development
As shown in Figure 45 the two highest reported business types besides ldquoOtherrdquo businesses served by ED Resources were the service and retail businesses35 These results are generally consistent with the national averages from the 2007 Survey of Business Owners (SBO) Results that were not consistent included Manufacturing reported in the SBO to be 2 Construction reported to be 13 and Health Care reported to be 936 Also the figure depicts the percentage of clients in the other category as having increased over the past three years
Figure 45 ndash Total ED Resources ndash Primary Business Type37
2008 n = 6770 2009 n = 8493 2010 n = 10146
35 The top 11 results for 2010 are displayed in the figure above Additional results included Finance Insurance and Real Estate (3) Education (3) Entertainment (2) Engineering (1) Transportation (1) Publishing (1) and Day Care (1) 36 Other findings that differed from SBO results included Finance Insurance and Real Estate (14) and Transportation (5) Industry classifications are not identical 37 Several groupings were found to be present among those respondents who classified their business type as ldquoOtherrdquo These included multiple responses for non-profits designart related professions and beauty related professions Due to non-responses the total for all business types may not equal 100
Impact Study of Entrepreneurial Development 27Resources ndash 2010-2011
Office of Entrepreneurial Development
Figure 46 depicts the reasons clients reported seeking business counseling from ED Resources Reputation and lowfree cost of service were the most common reasons for clients to seek assistance from ED Resources SBDC clients reported lowfree cost of service as the most common reason (50) but rated reputation of the ED Resource and referral as equally strong reasons (44) In contrast to the total ED Resources SCORE clients reported that reputation (55) was a stronger reason for seeking assistance than was lowfree cost of service (52) and WBC clients reported that referrals (44) were more often a reason for their seeking assistance as opposed to reputation (40)
Figure 46 ndash Total ED Resources ndash What led to your decision to seek business counseling from ED Resources38
n = 10146
38 The totals do not equal 100 due to respondents selecting multiple factors This figure compares results by individual ED Resource therefore corresponding figures are not repeated in the individual ED Resource sections of this report
Impact Study of Entrepreneurial Development 28Resources ndash 2010-2011
Office of Entrepreneurial Development
Resource Impacts
Usefulness and Value of Services or Assistance Received
As shown in Figure 47 below 73 of 2010 ED Resource clients reported that the information they received from their counselor was valuable
Figure 47 ndash Total ED Resources ndash How useful was the information you received39
2008 n = 6770 2009 n = 8493 2010 n = 10146
39 Low value includes the lsquoSomewhat Valuablersquo and lsquoNot Valuablersquo response categories High value includes the lsquoExtremely Valuablersquo and lsquoValuablersquo response categories Percentages will not total 100 due to non-response
Impact Study of Entrepreneurial Development 29Resources ndash 2010-2011
Office of Entrepreneurial Development
Figure 47A shows the perceived usefulness of ED Resources relative to the number of hours of counseling received recorded in two categories less than 3 hours and 3 or more hours For comparison the overall level of perceived usefulness is also provided in the figure but this segment does not distinguish usefulness by hours of counseling received
As illustrated below ED Resource clients who had three or more hours of counseling rated usefulness of ED Resources as ldquohighrdquo more often than those who had less than three hours of counseling40 Seventy-six percent of clients who received 3 or more hours of counseling rated the usefulness of total ED Resources as ldquohighrdquo versus 69 of those that received less than 3 hours of counseling
Figure 47A ndash How useful was the information you received Total ED Resources by Hours of Counseling vs Total ED Resources Aggregate Hours
40 This finding is supported by the regression analysis beginning on page 39
Impact Study of Entrepreneurial Development 30Resources ndash 2010-2011
Office of Entrepreneurial Development
Decision to Start a Business
Figure 48 depicts the perceived assistance of ED Resources with the clientrsquos decision to start a business These results are presented by individual ED Resource and total ED Resources Results for Nascent and Start-up firms are reported in each category41 Across SBDC SCORE and WBC the relationship between Nascent and Start-up clients remained consistent Start-up clients more often indicated that they decided to go into business as a result of the assistance they received from their respective ED Resource center than Nascent clients
Figure 48 ndash Total ED Resources ndash Did you decide to go into business as a result of the assistance you received42
n = 4589
41 The corresponding survey question for this figure asked ldquoIf you were not in business at the time you were assisted by the counselor did you decide to go into business as a result of that assistancerdquo Therefore In-Business clients were not observed because these clients were in business at the time they received counseling 42 This figure compares results by individual ED Resource therefore corresponding figures are not repeated in the individual ED Resource sections of this report
Impact Study of Entrepreneurial Development 31Resources ndash 2010-2011
Office of Entrepreneurial Development
Clientsrsquo Decision to Change Management Practices
As a result of ED Resource assistance for 2010 clients 57 of Start-up and 62 of In-Business firms changed their current management practices or strategies The percentage of Start-up firms reporting that they changed their management practices or strategies has decreased slightly over the past three years The frequency of In-Business firms reporting changes in management practices or strategies remained consistent from 2009
Table 42 ndash ED Resources Impact on Managerial Practices
Impact Study of Entrepreneurial Development 32Resources ndash 2010-2011
Changed Current Management PracticesStrategies
2008 Clients 2009 Clients 2010 Clients
Changed Current Management PracticesStrategies
2008 Clients 2009 Clients 2010 Clients
Start-up 60 59 57
In-Business 61 62 62
Office of Entrepreneurial Development
Figure 49 below reflects the percentage of firms reporting that ED Resource assistance led to the development of business plans marketing plans etc The frequency of ED Resource clients reporting they received assistance with a Web-based Strategy Financial Strategy Marketing Plan or Pricing Strategy has risen over the past three years of this study The Loan Package category has diminished steadily over the past three years from 12 in 2008 to 8 for 2010
Figure 49 ndash Total ED Resources ndash Assistance in Plan Development43
43 The 2010 results for the top 11 categories are displayed in the figure above Additional results for 2010 included hiring plan (5) purchasing strategy (4) production plan (4) training plan for staff (4) distribution plan (3) and international trade (1) For the 2010 study (2009 clients) the category of e-commerce changed to web-based strategy The 2008 results from that category are still used for comparison
Impact Study of Entrepreneurial Development 33Resources ndash 2010-2011
Office of Entrepreneurial Development
Sales Job Creation and Job Retention
Figure 410 presents findings on the attitudes toward the financial impact of ED Resource assistance irrespective of clientsrsquo reasons for seeking assistance The frequency of ED Resource clients that indicated they were able to increase profit margin retain current staff hire new staff or increase sales as a result of ED Resource assistance was lower for each category when compared to the previous year The number of 2010 ED Resource clients indicating impactful assistance in each category decreased from the previous year The retaining current staff and increased sales categories each experienced a four percentage point decrease
Figure 410 ndash Total ED Resources ndash Perceived Impact of Assistance44
2008 n = 6770 2009 n = 8493 2010 n = 10146
44 See Appendix 2 for a more detailed response to q4 In addition to the reported findings in the figure above data was also collected for 2010 clientsrsquo perceived impact of assistance regarding the acquisition of a bank loan (16) a SBA guarantee loan (18) and a SBA Disaster loan (18)
Impact Study of Entrepreneurial Development 34Resources ndash 2010-2011
Office of Entrepreneurial Development
Figure 410A shows the perceived financial impact of ED Resources relative to the number of hours of counseling received recorded in two categories less than 3 hours and 3 or more hours of counseling received For comparison the overall level of perceived financial impact is also provided which does not distinguish by hours of counseling
It is notable that across all four categories ED Resource clients with 3 or more hours of counseling reported a greater positive financial impact than total ED Resource clients
For example clients that received 3 or more hours of counseling increased their sales 30 of the time whereas clients that received less than 3 hours of counseling increased their sales 19 of the time
Figure 410A ndash Total ED Resources ndash Perceived Impact of Assistance (Hours of Counseling Received vs Aggregate Hours)
Total ED Resources (ge 3 Hours)
Total ED Resources (Aggregate Hours)
Total ED Resources (lt 3 Hours)
Impact Study of Entrepreneurial Development 35Resources ndash 2010-2011
Office of Entrepreneurial Development
Cross-Sectional Demographic Analysis
This section compares revenues and employment for ED Resource clients by gender race ethnicity and veteran status Figure 411 compares average revenues for firms in each demographic category rounded to the nearest $1000 For example this figure shows that in 2010 firms owned by Females ($385000) were on average smaller than firms owned by Males ($778000) and firms owned by Males and Females ($767000)
Veteran-owned firms had an average of $1035000 in revenue the highest revenues by Veterans in the past three years Over the past year reported revenues for Service-disabled Veterans fell to an average of $727000 Regarding race and ethnicity average revenues fell across all demographic categories
Figure 411 ndash Revenues (000s) for Firms in Selected Demographic Categories45
45 Firms that reported revenues were required to do so within the range of $1000 to $25000000 Due to small sample sizes corresponding figures are not repeated in the individual ED Resource sections of this report
Impact Study of Entrepreneurial Development 36Resources ndash 2010-2011
Office of Entrepreneurial Development
Figure 412 compares employment by demographic category Firms owned by Female clients tended to have fewer employees than firms owned by Male clients however firms with both male and female owners a new category for this year had the highest average employment levels in the gender segment This new category also partially explains the drop in average number of employees for both male firms and for female firms HispanicLatino White and American IndianAlaskan Native firms had more employees than other race and ethnicity demographic categories In each category of firms the average number of employees has gone down from 200946
Figure 412 ndashTotal Employees for Firms in Selected Demographic Categories
46 Due to the small sample size of Service-disabled veterans (42) who reported having employees 2009 results should be treated with caution Due to small sample sizes corresponding figures are not repeated in the individual ED Resource sections of this report
Impact Study of Entrepreneurial Development 37Resources ndash 2010-2011
Office of Entrepreneurial Development
Regression Analysis of the Effects of Gender Race Ethnicity and Veteran Status on Key ED Resource Impacts
The following section presents findings from an analysis of the effects of firm and client characteristics on ED Resource impacts We report results from a series of multiple regression analyses These were conducted to test whether respondents differed significantly in perceived usefulness quality of counseling experience and financial impacts of ED Resource assistance based on selected firm (revenues business segment ED Resource contact hours) and demographic (age gender race ethnicity veteran status) characteristics
These analyses address the following research questions
1 Are there differences in perceived usefulness based on firm size business segment ED Resource geographic location hours of counseling age of owner(s) gender race ethnicity or veteran status
2 Are there differences in perceived assistance with the decision to start a business based on firm size business segment ED Resource geographic location hours of counseling age of owner(s) gender race ethnicity or veteran status
3 Are there differences in the financial impact of ED resource assistance based on firm size business segment ED Resource geographic location hours of counseling age of owner(s) gender race ethnicity or veteran status
Each regression model examined the impact of selected demographic characteristics (age gender race ethnicity and veteran status) and firm characteristics (size business segment ED Resource geographic location hours of counseling received) on a particular resource impact These impacts included perceived usefulness of ED Resource assistance perceived quality of the counseling experience perceived assistance with the decision to start a business and perceived financial impacts (sales cash flow hiring and profits)
Each resource impact is used as a dependent (ie outcome) variable For example the dependent variable for the first model is perceived usefulness of ED Resource assistance The dependent variable for the second model is perceived quality of the counseling experience The dependent variable for the third model is perceived assistance with the decision to start a business The dependent variable for the fourth model is a financial impact score which is a summary measure based on 4 self-reported financial impact measures (the effect of assistance on increases in sales cash flow new hires and profit margins)47
47 Consistent with previous analyses this scale is the sum of the following questionnaire items q51 q52 q55 and q57 Survey questions can be found in the survey instrument in Appendix 4
Impact Study of Entrepreneurial Development 38Resources ndash 2010-2011
Office of Entrepreneurial Development
The set of independent or predictor variables included variables representing the firm and client demographic characteristics include the following
Sales Revenues Client Segment
o Nascent o Start-Up o In-Business
ED Resource (SBDC SCORE or WBC) Geographic Location (Urban suburban rural) Number of hours of assistance (less than 3 3 or more) Respondent Age Gender Race
o Hispanic o American Indian o Asian o BlackAfrican-American o Native HawaiianPacific Islander
Ethnicity o HispanicLatino
Veteran or Service-disabled Veteran
Regression Results
In the results presented in this section statistically significant predictor variables are identified48
Detailed regression results are presented in Appendix 6
The first regression model tested for a relationship between selected firm and client characteristics and the clientrsquos perception of the usefulness of the servicesassistance received 49
Results of this regression suggest that larger firms reported higher levels of perceived usefulness of ED Resource assistance than smaller firms Firms who received less than 3 hours of assistance reported lower levels of perceived usefulness than firms with 3 or more hours of counseling Additionally firms in the In-business segment also reported significantly higher perceived usefulness from ED resource assistance
In terms of client demographics there were no significant differences in perceived usefulness based on age gender veteran status or ethnicity Native American and White clients
48 Relationships are considered statistically-significant at the 005 level Marginal significance is defined as significant at the 010 level 49 The overall model was statistically significant at the 001 level although the R2 a measure of model fit was very small (00149) Coefficients reported here were significant at the 010 level The usable sample size was 2427 Firms with revenue greater than $5000000 and less than $1000 were removed from all regression analyses as were firms with unknown business segment The revenue upper bound of $5 million was used in order to eliminate bias resulting from potential outliers skewing the distributionrsquos measures of central tendency
Impact Study of Entrepreneurial Development 39Resources ndash 2010-2011
Office of Entrepreneurial Development
reported significantly higher perceived usefulness but there were no other differences based on race
The second regression model tested for a relationship between selected firm and client characteristics and perceived ED resource assistance with the decision to start a business50
Consistent with the previous yearrsquos results this analysis suggests that larger firms firms in the In-Business segment and SCORE clients were less likely to report that their decision to start a business was the result of ED resource assistance However there were no significant differences based on any other firm or client demographic characteristics
The third regression model tested for a relationship between selected firm and client characteristics and the self-reported financial impact of ED Resource assistance These impacts include a combination of increases in sales cash flow hiring of new employees and profits51 These results provided no significant results even at a 010 level indicating that no firm level or client demographic characteristics affected the perception of the financial impact of ED Resource assistance
These regression analyses indicate that both firm and client characteristics can be significant determinants of the clientrsquos perception of the usefulness of the servicesassistance received perceived assistance with the decision to start a business or the financial impact of assistance received
Variations in perceived usefulness perceived assistance with the decision to start a business and financial impacts are due in part to differences in firm size ED Resource and hours of assistance Geographic location did not play a significant role in any regression model In addition in some cases there were significant effects of gender age and ethnicity However none of these effects were consistent across outcomes
50 This model was estimated using a logistic regression analysis due to the binary dependent variable (q1c) The overall model was significant at the plt001 level although the pseudo R2 was small (00884) Coefficients reported here were significant at the 010 level Survey questions can be found in the survey instrument in Appendix 4 51 The overall model was not significant at the 010 level the R2 was extremely small (0008)
Impact Study of Entrepreneurial Development 40Resources ndash 2010-2011
Office of Entrepreneurial Development
V SBDC 2010 VS TOTAL ED RESOURCES
The following section presents results from SBDC clients52 First we report the general demographic and financial characteristics of SBDC 2010 clients This is followed by additional findings on the usefulness of SBDC for Nascent Start-up and In-Business firms organized by research question as follows
Is there a relationship between servicesassistance provided by SBDC and the clientrsquos perception of the usefulness and value of servicesassistance received
Is there a relationship between the servicesassistance provided by SBDC and the clientrsquos decision to start a business
Is there a relationship between the servicesassistance provided by SBDC and the clientrsquos decision to implement andor change management andor marketing practices in their business
Are the servicesassistance provided by SBDC having an impact on the clientrsquos financial position in terms of job creation job retention and sales
52 All references to ED Resource clients pertain to ED Resource Partnersrsquo face-to-face counseling clients who received assistance from a designated ED Resource Partner (SBDCSCOREWBC)
Impact Study of Entrepreneurial Development 41Resources ndash 2010-2011
Office of Entrepreneurial Development
Analysis of the Attitudes of SBDC Clients Regarding the Assistance They Received from SBDC
Demographic Characteristics of SBDC Clients
This section describes the general demographic and financial characteristics of SBDC clients These results are based on an analysis of 5113 completed surveys As shown in Figure 51 the largest business segment served by SBDC is the In-Business segment (59) which is five percentage points higher than total ED Resources
Figure 51 ndash SBDC ndash Distribution of Clients by Segment (2010 Clients)53
SBDC vs Total ED Resources
SBDC n = 5113 Total ED Resources n = 10146
Table 51 compares revenues and employment for SBDC vs total ED Resources These results indicate that SBDC clients have higher revenues than total ED Resource clients
Table 51 ndash SBDC Client Revenues and Employment (2010)
Total ED Total ED SBDC SBDC Resources Resources
Average Revenue $774000 $637200 Average Employees 5 4
53 Respondents who reported being in business but who did not provide a valid start date for that business were not assigned to a business segment Therefore the total of client segments served for SBDC may not equal 100
Impact Study of Entrepreneurial Development 42Resources ndash 2010-2011
Office of Entrepreneurial Development
Demographic characteristics of SBDC clients including gender race ethnicity and veteran status are reported in Figure 5254 The demographic makeup of SBDC was comprised of a smaller percentage of Females and a higher percentage of Males than total ED Resources by four and two percentage points respectively Other demographic proportions followed a pattern similar to those of total ED Resources
Figure 52 ndash SBDC ndash Demographic Characteristics (2010 Clients)55
SBDC vs Total ED Resources
SBDC n = 5113 Total ED Resources n = 10146
54 The Veteran and Service-disabled Veteran categories are shown in the figure above Additional results for SBDC clients included Reservist (03) and National Guard Member (04) 55 The total may not equal 100 due to non-respondents and those who selected multiple ethnicities The SBDC demographic distribution was compared to the national averages from the SBO The distribution was comparable across characteristics except for the following SBO figures White business owners were 83 of the small business population Female business owners were 29 Male business owners were 51 and American IndianAlaskan Native business owners were less than 1
Impact Study of Entrepreneurial Development 43Resources ndash 2010-2011
Office of Entrepreneurial Development
Figure 53 shows the distribution of SBDC clients by age of business owner The largest age group served was between the ages of 45 and 54 (29) SBDC clientsrsquo age distribution was consistent with that of total ED Resources
Figure 53 ndash SBDC ndash Age of Business Owner (2010 Clients)56
SBDC vs Total ED Resources
SBDC n = 5113 Total ED Resources n = 10146
56 The SBDC age distribution was compared to the national averages from the SBO The distribution was comparable across characteristics except that SBO reported 65+ at 125 (compared to 5 for SBDC)
Impact Study of Entrepreneurial Development 44Resources ndash 2010-2011
Office of Entrepreneurial Development
Figure 54 shows that the most common types of businesses served by SBDC were in the service and retail categories57 These results are generally consistent with the national averages from the SBO Results that were not consistent included Manufacturing reported in the SBO to be 2 Construction reported to be 13 and Health Care reported to be 958 Also the figure shows the share of SBDC clients in the manufacturing construction technology and restaurant andor eating and drinking industries was higher than total ED Resources
Figure 54 ndash SBDC ndash Type of Business (2010 Clients) 59
SBDC vs Total ED Resources
57 The top 11 categories for 2010 SBDC clients are displayed in the figure above Additional results included Finance Insurance and Real Estate (3) Education (2) Entertainment (2) Publishing (1) Transportation (1) Engineering (2) Day Care (1) 58 Other SBO results that differed with the findings included Finance Insurance and Real Estate (14) and Transportation (5) Industry classifications are not identical 59 Due to non-responses and multiple business type selections the total for all business types might not equal 100
Impact Study of Entrepreneurial Development 45Resources ndash 2010-2011
Office of Entrepreneurial Development
SBDC Client Attitudes Regarding ED Resource Assistance
Usefulness and Value of Services or Assistance Received
Approximately 74 of SBDC clients reported that the information they received from counselors was valuable60 Figure 55 shows ratings of usefulness of SBDC ED Resources provided by business segment and compared to total ED Resources SBDC Nascent firms rated the usefulness of information somewhat higher than Start-up and In-Business firms Nascent and Start-up clients both highly rated the usefulness of the assistance received more often than did total ED Resource clients
Figure 55 ndash SBDC ndashUsefulness of SBDC (2010 Clients)61
SBDC vs Total ED Resources
60 This result does not appear in the figure above which is displayed by business segment This figure was calculated for SBDC clients overall without regard to business segment 61 Low value includes the lsquoSomewhat Valuablersquo and lsquoNot Valuablersquo response categories High value includes the lsquoExtremely Valuablersquo and lsquoValuablersquo response categories
Impact Study of Entrepreneurial Development 46Resources ndash 2010-2011
Office of Entrepreneurial Development
Figure 55A below shows the perceived usefulness of SBDC assistance based upon the number of hours of counseling received Figure 55A shows that SBDC clients who received 5 or more hours of counseling rated usefulness as ldquohighrdquo more frequently than those SBDC clients who received less than 5 hours of counseling
Figure 55A ndash Usefulness of SBDC SBDC by Hours of Counseling vs Total ED Resources Aggregate Hours (2010 Clients)
Impact Study of Entrepreneurial Development 47Resources ndash 2010-2011
Office of Entrepreneurial Development
Clientsrsquo Decision to Change Management Practices
Figure 56 compares SBDC client decisions to change management practices or strategies by business segment As a result of SBDC assistance 56 of Start-up firms changed their management practices or strategies and 58 of In-Business clients reported changing management practices or strategies The levels of SBDC Start-up and In-Business clients that changed their management practices were slightly below those for total ED Resource clients
Figure 56 ndash SBDC ndash Changed Management PracticesStrategies as a Result of SBDC ED Resource Assistance (2010 Clients)
SBDC vs Total ED Resources
Impact Study of Entrepreneurial Development 48Resources ndash 2010-2011
Office of Entrepreneurial Development
Figure 57 below reflects the percentage of firms reporting that SBDC assistance led to the development of business plans marketing plans etc 62 The percentage of SBDC clients that sought assistance with the development of business plans cash flow analyses or preparation of loan packages was higher than that of total ED Resources
Figure 57 ndash SBDC ndash Assistance in Plan Development (2010 Clients)
SBDC vs Total ED Resources
62 The 2010 results for the top 11 categories are displayed in the figure above Additional results included Hiring plan (5) Purchasing Strategy (4) Production Plan (4) Distribution Plan (3) Training Plan for Staff (4) and International Trade (2)
Impact Study of Entrepreneurial Development 49Resources ndash 2010-2011
Office of Entrepreneurial Development
Sales Job Creation and Job Retention
Figure 58 compares SBDC Start-up and In-Business clients in terms of reported financial impact of SBDC assistance on sales profits jobs and the retention of employees irrespective of reasons for seeking assistance63 SBDC Start-up firms reported lower perceived levels of impact regarding both hiring new staff and retaining current staff when compared to total ED Resources SBDC In-Business clientsrsquo reported financial impact surpassed total ED Resources in each category
Figure 58 ndash SBDC ndash Perceived Impact of Assistance (2010 Clients)
SBDC vs Total ED Resources
63 This comparison excludes the Nascent category for total ED Resources and SBDC
Impact Study of Entrepreneurial Development 50Resources ndash 2010-2011
Office of Entrepreneurial Development
Figure 58A compares SBDCrsquos financial impact of assistance on sales profits jobs and the retention of employees to the financial impact results for total ED Resources presented by hours of counseling received The number of hours of counseling received is divided into three categories for SBDC less than 3 hours from 3 to less than 5 hours and 5 or more hours
SBDC clients who received 5 or more hours of counseling reported greater perceived impact of assistance than total ED Resources in each of the categories below For example 41 of clients that received 5 or more hours of SBDC counseling reported an increase in sales and 34 of clients that received 5 or more hours reported an increase in profit margins Total ED Resources reported 34 and 30 in the same categories respectively
Figure 58A ndash SBDC ndash Perceived Impact of Assistance SBDC Hours of Counseling Received for In-Business and Start-ups vs Total ED Resources Aggregate Hours for In-Business and Start-ups (2010 Clients)
Impact Study of Entrepreneurial Development 51Resources ndash 2010-2011
Office of Entrepreneurial Development
[This page is intentionally left blank for two-sided printing]
Impact Study of Entrepreneurial Development 52Resources ndash 2010-2011
Office of Entrepreneurial Development
VI SCORE 2010 VS TOTAL ED RESOURCES
The following section presents results from SCORE clients64 First we report the general demographic and financial characteristics of SCORE clients as provided by 2010 clients This is followed by additional findings on the usefulness of SCORE for Nascent Start-up and In-Business firms organized by research question as follows
Is there a relationship between servicesassistance provided by SCORE and the clientrsquos perception of the usefulness and value of servicesassistance received
Is there a relationship between the servicesassistance provided by SCORE and the clientrsquos decision to start a business
Is there a relationship between the servicesassistance provided by SCORE and the clientrsquos decision to implement andor change management andor marketing practices in their business
Are the servicesassistance provided by SCORE having an impact on the clientrsquos financial position in terms of job creation job retention and sales
64 All references to ED Resource clients pertain to ED Resource Partnersrsquo face-to-face counseling clients who received assistance from a designated ED Resource Partner (SBDCSCOREWBC)
Impact Study of Entrepreneurial Development 53Resources ndash 2010-2011
Office of Entrepreneurial Development
Analysis of the Attitudes of SCORE Clients Regarding the Assistance They Received from SCORE
Demographic Characteristics of SCORE Clients
This section describes the general demographic and financial characteristics of SCORE clients These results are based on an analysis of 4444 completed surveys As shown in Figure 61 the largest business segment served by SCORE was the In-Business segment (49) which is five percentage points lower than the In-Business segment for total ED Resources The Nascent segment was the second largest at 29 and measures three percentage points higher than total ED Resources
Figure 61 ndash SCORE ndash Distribution of Clients by Segment (2010 Clients)65
SCORE vs Total ED Resources
SCORE n = 4444 Total ED Resources n = 10146
Table 61 compares revenues and employment for SCORE clients vs total ED Resources SCORE client revenues are lower than the average for total ED Resources
Table 61 ndash SCORE Client Revenues and Employment (2010)
Total ED SCORE Resources
Average Revenue $502000 $637200 Average Employees 3 4
65 Respondents who reported being in business but who did not provide a valid start date for that business were not assigned to a business segment The total of client segments served for SCORE will therefore not equal 100
Impact Study of Entrepreneurial Development 54Resources ndash 2010-2011
SCORE Total ED Resources
Office of Entrepreneurial Development
Demographic characteristics of SCORE clients including gender race ethnicity and veteran status are reported in Figure 6266 The demographic distribution of SCORE clients follows closely to the pattern of total ED Resources clients overall The percentage of White clients (70) in SCORErsquos demographic makeup is slightly higher than that of total ED Resources (68)
Figure 62 ndash SCORE ndash Demographic Characteristics (2010 Clients)67
SCORE vs Total ED Resources
SCORE n = 4444 Total ED Resources n = 10146
66 The Veteran and Service-disabled Veteran categories are shown in the figure above Additional results for SCORE clients included Reservist (04) and National Guard Member (04) 67 In some instances the total may not equal 100 due to non-respondents and respondents who selected multiple ethnicities The SCORE demographic distribution was compared to the national averages from the SBO The distribution was comparable across characteristics except for the following SBO figures White business owners were 83 of the small business population Female business owners were 29 and Male business owners were 51
Impact Study of Entrepreneurial Development 55Resources ndash 2010-2011
Office of Entrepreneurial Development
Figure 63 shows the distribution of SCORE clients by age of business owner The largest age group served was between the ages of 45 and 54 (27) SCORE clientsrsquo age distribution was consistent with that of total ED Resources
Figure 63 ndash SCORE ndash Age of Business Owner (2010 Clients)68
SCORE vs Total ED Resources
SCORE n = 4444 Total ED Resources n = 10146
68 The SCORE age distribution was compared to the national averages from the SBO The distribution was comparable except that SBO reported 65+ at 125 (compared to 5 for SCORE)
Impact Study of Entrepreneurial Development 56Resources ndash 2010-2011
Office of Entrepreneurial Development
Figure 64 shows that the most common types of businesses served by SCORE were in the service and retail categories69 These results are generally consistent with the national averages from the SBO Results that were not consistent included Manufacturing reported in the SBO to be 2 Construction reported to be 13 and Health Care reported to be 970 Also the figure shows the share of SCORE clients in the technology restaurant andor eating and drinking industries was lower than total ED Resources
Figure 64 ndash SCORE ndash Type of Business (2010 Clients)71
SCORE vs Total ED Resources
69The top 11 categories for 2010 clients are displayed in the figure above Additional results for 2010 included Finance Insurance and Real Estate (3) Education (3) Entertainment (2) Publishing (1) Transportation (1) Engineering (1) Day Care (1) 70 Other SBO results that differed from the findings included Finance Insurance and Real Estate (14) and Transportation (5) Industry classifications are not identical 71 Due to non-responses and multiple business type selections the total for all business types may not equal 100
Impact Study of Entrepreneurial Development 57Resources ndash 2010-2011
Office of Entrepreneurial Development
SCORE Client Attitudes Regarding ED Resource Assistance
Usefulness and Value of Services or Assistance Received
Approximately 73 of SCORE clients reported that the information they received from counselors was valuable72 Figure 65 shows ratings of usefulness of SCORE provided by business segment and compared to total ED Resources For SCORE clients it is apparent that Start-up clients reported high levels of usefulness regarding the assistance they received somewhat less often when compared to other business segments
Figure 65 ndash SCORE ndashUsefulness of SCORE (2010 Clients)73
SCORE vs Total ED Resources
72 This result does not appear in the figure above which is displayed by business segment This percentage was calculated for SCORE clients overall without regard to business segment 73 Low value includes the lsquoSomewhat Valuablersquo and lsquoNot Valuablersquo response categories High value includes the lsquoExtremely Valuablersquo and lsquoValuablersquo response categories
Impact Study of Entrepreneurial Development 58Resources ndash 2010-2011
Office of Entrepreneurial Development
Figure 65A below shows the perceived usefulness of SCORE assistance based upon the number of hours of counseling received Figure 65A shows that 78 of SCORE clients that received 3 or more hours of counseling rated SCORE usefulness as ldquohighrdquo compared to 68 of clients that received less than 3 hours of counseling
Figure 65A ndash Usefulness of SCORE SCORE by Hours of Counseling vs Total ED Resources Aggregate Hours (2010 Clients)
Impact Study of Entrepreneurial Development 59Resources ndash 2010-2011
Office of Entrepreneurial Development
Clientsrsquo Decision to Change Management Practices
Figure 66 compares SCORE client decisions to change management practices or strategies by business segment As a result of SCORE assistance 58 of Start-up firms changed their management practices or strategies and 67 of In-Business clients reported changing management practices or strategies The levels for SCORE Start-up and In-Business clients that changed their management practices and strategies were higher than those for total ED Resources
Figure 66 ndash SCORE ndash Changed Management PracticesStrategies as a Result of SCORE ED Resource Assistance (2010 Clients)
SCORE vs Total ED Resources
Impact Study of Entrepreneurial Development 60Resources ndash 2010-2011
Office of Entrepreneurial Development
Figure 67 below reflects the percentage of firms reporting that SCORE assistance led to the development of business plans marketing plans etc74 The percentage of SCORE clients that sought assistance with pricing strategies (15) was higher than that of total ED Resources (14) SCORE clients reported receiving assistance somewhat less often than total ED Resources for most other categories
Figure 67 ndash SCORE ndash Assistance in Plan Development (2010 Clients)
SCORE vs Total ED Resources
74 The 2010 results for the top 11 categories are displayed in the figure above Additional results for included Hiring plan (4) Purchasing Strategy (4) Production Plan (3) Distribution Plan (3) Training Plan for Staff (3) and International Trade (1)
Impact Study of Entrepreneurial Development 61Resources ndash 2010-2011
Office of Entrepreneurial Development
Sales Job Creation and Job Retention
Figure 68 compares SCORErsquos Start-up and In-Business clients in terms of the reported financial impact of SCORE assistance on sales profits jobs and the retention of employees irrespective of reasons for seeking assistance75 Twenty-five percent of Start-up clients reported that they were able to increase sales as a result of SCORE assistance compared to 34 for total ED Resources Twenty-one percent and 16 of SCORE In-Business clients reported that they were able to retain current staff and hire new staff respectively slightly higher than total ED Resources (20 and 15)
Figure 68 ndash SCORE ndash Perceived Impact of Assistance (2010 Clients)
SCORE vs Total ED Resources
75 This comparison excludes the Nascent category for total ED Resources and SCORE
Impact Study of Entrepreneurial Development 62Resources ndash 2010-2011
Office of Entrepreneurial Development
Figure 68A compares SCORErsquos financial impact of assistance for increasing sales profits jobs and the retention of employees to the financial impact results for total ED Resources presented by hours of counseling received The number of hours of counseling received is divided into two categories for SCORE less than 3 hours and 3 or more hours It is apparent from the figure below that except for the retain current staff category the greater the number of hours of counseling received the greater the perceived impact of assistance reported by SCORE In-Business and Start-up clients
Figure 68A ndash SCORE ndash Perceived Impact of Assistance SCORE Hours of Counseling Received for In-Business and Start-ups vs Total ED Resources Aggregate Hours for In-Business and Start-ups (2010 Clients)
Impact Study of Entrepreneurial Development 63Resources ndash 2010-2011
Office of Entrepreneurial Development
[This page is intentionally left blank for two-sided printing]
Impact Study of Entrepreneurial Development 64Resources ndash 2010-2011
Office of Entrepreneurial Development
VII WBC 2010 VS TOTAL ED RESOURCES
The following section presents results from WBC clients76 First we report the general demographic and financial characteristics of WBC clients as provided by 2010 clients This is followed by additional findings on the usefulness of WBC for Nascent Start-up and In-Business firms organized by research question as follows
Is there a relationship between servicesassistance provided by WBC and the clientrsquos perception of the usefulness and value of servicesassistance received
Is there a relationship between the servicesassistance provided by WBC and the clientrsquos decision to start a business
Is there a relationship between the servicesassistance provided by WBC and the clientrsquos decision to implement andor change management andor marketing practices in their business
Are the servicesassistance provided by WBC having an impact on the clientrsquos financial position in terms of job creation job retention and sales
76 All references to ED Resource clients pertain to ED Resource Partnersrsquo face-to-face counseling clients who received assistance from a designated ED Resource Partner (SBDCSCOREWBC)
Impact Study of Entrepreneurial Development 65Resources ndash 2010-2011
Office of Entrepreneurial Development
Analysis of the Attitudes of WBC Clients Regarding the Assistance They Received from WBC
Demographic Characteristics of WBC Clients
This section describes the general demographic and financial characteristics of WBC clients These results are based on an analysis of 589 completed surveys As shown in Figure 71 the largest business segment served by WBC is the In-Business segment Fifty percent of WBC respondents were In-Business clients compared to 54 of total ED Resource clients The figure also shows that there was a greater share of WBC clients in the Nascent segment (31) compared to total ED Resources (26)
Figure 71 ndash WBC ndash Distribution of Respondents by Segment (2010 Clients)77
WBC vs Total ED Resources
WBC n = 589 Total ED Resources n = 10146
Table 71 compares revenues and employment for WBC clients vs total ED Resources These results indicate that WBC clients are smaller in terms of revenues and number of employees than total ED Resources combined
Table 71 ndash WBC Client Revenues and Employment (2010)
Total ED WBC Resources
Average Revenue $171300 $637200 Average Employees 3 4
WBC Total ED Resources
77 Respondents who reported being in business but who did not provide a valid start date for that business were not assigned to a business segment The total of client segments served for WBC therefore may not equal 100
Impact Study of Entrepreneurial Development 66Resources ndash 2010-2011
Office of Entrepreneurial Development
Demographic characteristics of WBC clients including gender race ethnicity and veteran status are reported in Figure 7278 Not surprisingly about 62 of WBC clients are Female A noteworthy 24 of WBC clients are BlackAfrican American compared to 11 for total ED Resources HispanicLatino clients represent 8 of WBC clients WBC serves a small share of Veterans (5) and Service-disabled veterans (1)
Figure 72 ndash WBC ndash Demographic Characteristics (2010 Clients)79
WBC vs Total ED Resources
WBC n = 589 Total ED Resources n = 10146
78 The Veteran and Service-disabled Veteran categories are shown in the figure above Additional results for WBC clients included Reservist (02) and National Guard Member (00) 79 In some instances the total percentage might not equal 100 due to non-respondents and respondents who selected multiple ethnicities The WBC demographic distribution was compared to the national averages from the SBO The distribution was comparable across characteristics except for the following SBO figures White business owners were 82 of the small business population BlackAfrican American business owners were 12 and Asian business owners were 7
Impact Study of Entrepreneurial Development 67Resources ndash 2010-2011
Office of Entrepreneurial Development
Figure 73 shows the distribution of WBC clients by age of business owner The largest age group served was between the ages of 35-44 which accounts for 24 of WBC clients compared to 22 of total ED Resource clients Approximately 44 of WBC clients were between 18 and 44 years of age making WBC the youngest demographic of the three ED Resources
Figure 73 ndash WBC ndash Age of Business Owner (2009 Clients)80
WBC vs Total ED Resources
WBC n = 589 Total ED Resources n = 10146
80 The 2010 WBC age distribution was compared to the national averages for women-owned businesses from the SBO The distribution was comparable except for the following SBO figures 25-34 was 11 (compared to 18 for WBC) and 65+ was reported at 10 (compared to 5 for WBC)
Impact Study of Entrepreneurial Development 68Resources ndash 2010-2011
Office of Entrepreneurial Development
Figure 74 shows that the most common types of businesses served by WBC besides other were in the service and retail categories81 These results are generally consistent with the national averages from the SBO for women-owned firms Results that were not consistent included Health Care reported to be 16 in the SBO and Manufacturing reported in the SBO to be 182 The figure also shows the share of WBC clients in the service retail and consulting industries was higher than that of total ED Resources while the share of clients in the manufacturing construction technology and health care industries was lower than total ED Resources
Figure 74 ndash WBC ndash Type of Business (2010 Clients)83
WBC vs Total ED Resources
81 The top 11 categories for 2010 clients are displayed in the figure above Additional results included Finance Insurance and Real Estate (4) Education (3) Entertainment (1) Publishing (1) Transportation (3) Engineering (1) Day Care (2) 82 Other SBO results that differed from the findings included Finance Insurance and Real Estate (11) Industry classifications are not identical 83 Due to non-responses and multiple business type selections the total for all business types might not equal 100
Impact Study of Entrepreneurial Development 69Resources ndash 2010-2011
Office of Entrepreneurial Development
WBC Client Attitudes Regarding ED Resource Assistance
Usefulness and Value of Services or Assistance Received
Approximately 72 of WBC clients reported that the information they received from counselors was valuable84 Figure 75 shows ratings of usefulness of WBC provided by business segment and compared to total ED Resources WBC Nascent clients more often rated assistance as useful (78) than did total ED Resources (73) Start-up and In-Business clients rated assistance as useful less often (68) than total ED Resources
Figure 75 ndash WBC ndash Usefulness of WBC (2010 Clients)85
WBC vs Total ED Resources
84 This result does not appear in the figure above which is displayed by business segment This percentage was calculated for WBC clients overall without regard to business segment 85 Low value includes the lsquoSomewhat Valuablersquo and lsquoNot Valuablersquo response categories High value includes the lsquoExtremely Valuablersquo and lsquoValuablersquo response categories
Impact Study of Entrepreneurial Development 70Resources ndash 2010-2011
Office of Entrepreneurial Development
Figure 75A below shows the perceived usefulness of WBC assistance based upon the number of hours of counseling received Figure 75A shows that 76 of WBC clients that received more than 3 or more hours of counseling rated WBC usefulness ldquohighrdquo as compared to 69 of clients that received less than 3 hours of counseling
Figure 75A ndash Usefulness of WBC WBC by Hours of Counseling vs Total ED Resources Aggregate Hours (2010 Clients)
WBC vs Total ED Resources
Impact Study of Entrepreneurial Development 71Resources ndash 2010-2011
Office of Entrepreneurial Development
Clientsrsquo Decision to Change Management Practices
Figure 76 compares WBC client decisions to change management practices or strategies by business segment As a result of WBC assistance 62 of Start-up clients and 64 of In-Business clients reported changing their management practices or strategies The percentages of WBC Start-up and In-Business clients that changed their management practices were higher than that of total ED Resource clients
Figure 76 ndash WBC ndash Changed Management PracticesStrategies as a Result of WBC ED Resource Assistance (2010 Clients)
WBC vs Total ED Resources
Impact Study of Entrepreneurial Development 72Resources ndash 2010-2011
Office of Entrepreneurial Development
Figure 77 below reflects the percentage of firms reporting that WBC ED Resource assistance led to the development of business plans marketing plans etc86 The percentage of WBC clients that sought assistance with in the Other category (7) was less than that of total ED Resources (8) WBC clients reported receiving assistance as often or more often than total ED Resources for all other categories
Figure 77 ndash WBC ndash Assistance in Plan Development (2010 Clients)
WBC vs Total ED Resources
86 The 2010 results for the top 11 categories are displayed in the figure above Additional results included Hiring plan (5) Purchasing Strategy (4) Production Plan (4) Distribution Plan (3) Training Plan for Staff (3) and International Trade (2)
Impact Study of Entrepreneurial Development 73Resources ndash 2010-2011
Office of Entrepreneurial Development
Sales Job Creation and Job Retention
Figure 78 compares WBC Start-up and In-Business clients in terms of the reported financial impact of WBC assistance on sales profits jobs and the retention of employees irrespective of reasons for seeking assistance87 Start-up and In-Business clients reported that WBC assistance resulted in increased profit margin and increased sales substantially more often than total ED Resource clients For example 39 of Start-up clients and 42 of In-Business clients reported an increase in sales as compared to 34 of total ED Resources
Figure 78 ndash WBC ndash Perceived Impact of Assistance (2010 Clients)
WBC vs Total ED Resources
87 This comparison excludes the Nascent category for total ED Resources and WBC
Impact Study of Entrepreneurial Development 74Resources ndash 2010-2011
Office of Entrepreneurial Development
Figure 78A compares WBCrsquos financial impact of assistance on sales profits jobs and the retention of employees to the financial impact results for total ED Resources presented by hours of counseling received The number of hours of counseling received is divided into two categories for WBC less than 3 hours and 3 or more hours
Clients that received 3 or more hours of counseling reported higher impact in all categories compared to clients who received less than 3 hours of counseling The largest disparity occurred in the retain current staff category where there was a difference of 17 percentage points between clients who received 3 or more hours and those who received less than 3 hours
Figure 78A ndash WBC ndash Perceived Impact of Assistance WBC Hours of Counseling Received for In-Business and Start-ups vs Total ED Resources Aggregate Hours for In-Business and Start-ups (2010 Clients)
Impact Study of Entrepreneurial Development 75Resources ndash 2010-2011
Office of Entrepreneurial Development
[This page is intentionally left blank for two-sided printing]
Impact Study of Entrepreneurial Development 76Resources ndash 2010-2011
Office of Entrepreneurial Development
VIII FOLLOW-UP STUDY RESULTS 2008 amp 2009 CLIENTS In this section Concentrance reports findings from our analysis of follow-up surveys of 2008 and 2009 ED Resource clients88 These follow-up surveys were conducted in order to examine the impact of ED Resource assistance over time This yearrsquos follow-up study of 2008 ED Resource clients represents the second follow-up study of this sample The first follow-up survey of this group was conducted as part of the previous yearrsquos study in 2010 The follow-up study of 2009 ED Resource clients is the first follow-up study of these clients
This analysis addresses the following key research questions
What was the rate of transition of Nascent and Start-up firms to the In-Business segment Based on a comparison with the Panel Study of Entrepreneurial Dynamics II89 (PSED II)
what is the impact of ED Resource assistance on firm survival What was the financial impact of servicesassistance provided by SBA ED Resources in
terms of job creation job retention and sales How does the difference in growth rate of ED Resource clients from 2009 to 2010 compare
with key benchmarks such as the gross domestic product (GDP) the Entrex Private Company Index (PCI) and the Standard and Poorrsquos Small Cap Index90
Follow-up Methodology
There were 6770 respondents to the Initial Economic Impact Survey of 2008 clients Of these Concentrance was able to collect follow-up data from 854 respondents These respondents were re-contacted for the second follow up survey Of these Concentrance was able to collect follow-up data from 200 respondents for which detailed data can be tracked to 2011
There were 8493 respondents to the Initial Impact Survey of 2009 clients Of these Concentrance was able to collect follow-up data from 1968 respondents for which detailed data can be tracked to 2011
2008 Clients Sample Size Response Rate Initial Study 6770 29 1st Follow-up 854 13 2nd Follow-up 200 23 2009 Clients Sample Size Response Rate Initial Study 8493 23 1st Follow-up 1968 23
88 All references to ED Resource clients pertain to ED Resource Partnersrsquo face-to-face counseling clients who received assistance from a designated ED Resource Partner (SBDCSCOREWBC) 89 The Panel Study of Entrepreneurial Dynamics II is a nationwide multi-million dollar survey of nascent entrepreneurs funded by the Kauffman Foundation The primary purpose of the study is to identify adults active in business creation obtain detailed information about the start-up effort and perform follow-up interviews to determine outcomes We rely on the PSED I and PSED II as benchmarks however results must also be interpreted with caution due to potential response bias and definitional differences in the ways that firms are classified 90 The three benchmarks used for comparison of SBA ED Resources are GDP - Source httpwwwbeagovnationalxlsgdpchgxls the Private Company Index (PCI) - published by Entrex this index measures revenue performance in the sector of private companies ranging from $3 million to $60 million in annual revenues (httpwwwprivatecompanyindexcom) and the S amp P SmallCap 600 Index - represents approximately 3 of the US market and includes 600 lsquosmall caprsquo companies with market capitalizations between $300 million and $2 billion The SampP SmallCap 600 Index is a commonly used benchmark for growth
Impact Study of Entrepreneurial Development 77Resources ndash 2010-2011
y
f
Office of Entreprreneurial DDevelopm ment
Changess in Businesss Segmentss from 2009 tto 2011
What is tthe rate of trransition of Nascent annd Start-up firms to thee In-Businesss segment
Figure 811 shows the mmovement oof firms fromm their initial segments to the In-Businness segmentt in 2011 Foor example 557 of 2008 Nascent clients had startted businessees by 2011 FFor 2008 clieents that weree initially in thhe In-Busineess segment 994 remaineed in businesss in 2011 AAdditionally Figure 811 shows the mmovement oof firms fromm their initial 2009 client ssegment to thhe In-Busineess segment iin 2011 Forr example 299 of 2009 NNascent cliennts had transiitioned into tthe In-Businness category bby 2011 By comparisonn according tto a study by Reynolds annd Curtin (20008)91 approximmately 19 of nascent enttrepreneurs inn the PSED II had starteed businessess within two yeears of inceptiion
Figure 81 ndash Traansitions and Survvival of 22008 and 2009 Clieents to 20011 In-Bussiness
91 Paul D Reynolds and RRichard T Curttin (2008) ldquoBu siness Creationn in the United States Panel Sttudy of Entrepreneeurial Dynamicss II Initial Asseessmentrdquo Founddations and Trendds in Entrepreneuurship Vol 4 NNo 3 pgs 155ndashndash307
Impact S tudy of Entrepren neurial Develop pment Resource es ndash 2010-2011 1
78
Office of Entrepreneurial Development
Impact of ED Resource Assistance on Firm Survival
Does ED Resource assistance have a positive impact on firm survival
The PSED II data serve as a benchmark for comparing the proportion of Nascent and Start-up businesses that can now be classified as In-Business firms The PSED II is a sample of nascent entrepreneurs who are in the process of going into business a portion of the sample received some form of counseling or assistance
Figure 82 compares the survival rates for firms in the follow-up study with the PSED II92 These results suggest that businesses that received ED Resource assistance had a higher survival rate than other small businesses such as those randomly sampled for the PSED II For example based on the second follow-up study of 2008 ED Resource clients 93 were still in business after two years In contrast only 80 of PSED II firms remained in business after two years93 Similarly in the follow-up study of 2009 ED Resource clients 96 of these firms remained in business after one year compared to 90 of firms in the PSED II sample
In addition to the PSED II analysis ED Resource client survival rates were higher than reported in other studies For example according to a study published in the Monthly Labor Review two-thirds of new employer firms survive at least two years and about 44 survive at least four94
Figure 82 ndash ED Resource Clients have Higher Survival Rates than PSED II Firms
92Source Parker Simon C (2005) ldquoWhat happens to nascent entrepreneurs An econometric analysis of the PSEDrdquo Entrepreneurship in a Diverse World U S Association for Small Business and Entrepreneurship 93 The PSED II reports the rate of disengagement of start-up firms relative to the time of inception According to Reynolds and Curtin (2008) this period is somewhat arbitrary may not actually capture all start-up activities Thus we report an approximate PSED survival rate based on firms at 1 year and 2 years after inception 94 Survival and Longevity in the Business Employment Dynamics Database Monthly Labor Review May 2005
Impact Study of Entrepreneurial Development 79Resources ndash 2010-2011
Office of Entrepreneurial Development
Does the number of hours of ED Resource assistance have a positive impact on firm survival Figure 83 shows the survival rate of ED Resource clients in each category of counseling hours received for the second follow-up survey of 2008 clients and the first follow-up of 2009 clients In the second follow-up firms receiving 3 or more hours of counseling had a marginally higher survival rate than those that received less than 3 hours of counseling However the relationship between additional counseling hours and survival in the first follow-up sample of 2009 clients is less pronounced
Figure 83 - ED Resource Client Survival by Hours of Counseling
Impact Study of Entrepreneurial Development 80Resources ndash 2010-2011
f
f
Office of Entreprreneurial DDevelopm ment
Changess in Revenuees and Empployees
What is tthe financiaal impact of servicesasssistance proovided by SBA ED Ressources in teerms of job creeation job rretention annd sales
Figure 844 compares 22008 clients iin terms of mmean annual revenues andd number of employees inn the initial andd two subseqquent follow--up studies
Accordinng to this mattched pairs comparison mmean revenuues fell from $413900 in 22008 to $3044200 in 2009 This decline in revenues between 20008 and 2009 iis consistent with the reccessionary conditionns of the econnomy duringg this period However ffor the subseet of firms that survived aand reported revenue dataa mean revennues increaseed to $4677000 in 201095
At the samme time the mean numbber of employyees per firmm decreased frrom 68 to 5 for the first follow-upp year and thhen rose againn to 68 for thhe second foollow-up yearr
Figure 84 - Meaan Revennues and Employmment 20008 Clientts Over TTime
20008 Clients n == 2343 1st Foollow-up n = 2550 2nd Follow--up n = 112
95 Revenue s from Nascentt and unknownn business segmments are not inccluded In adddition Start-up oor In-Business firms with revenuues below $10000 and greater tthan $5 million were excludedd from this analyysis as were firmms with reporteed employees below 1 and abbove 998 The revenue upper bound of $5 mmillion was usedd in order to eli minate bias res sulting from potenntial outliers skeewing the distriibutionrsquos measuures of central ttendency
Impact S tudy of Entrepren neurial Develop pment Resource es ndash 2010-2011 1
81
Office of Entreprreneurial DDevelopm ment
The matcched comparison analysis was repeated for the folllow-up sampple of 2009 cllients Figurre 85 comparess firms in terms of mean annual revennues and nummber of emplloyees in 20009 and in thee first follow-upp survey
Accordinng to this mattched pairs comparison mmean revenuues fell from $414100 in 22009 to $3911400 in 2010 According too a survey off small busineess owners cconducted byy the Nationaal Federationn of Independdent Businessses (NFIB) bbusiness ownners in 2009 reported histtorically low expectationss about groowth and employment annd increasingg concerns abbout inflationn From the low of Jan 22009 optimismm has been coontinuously trending upwward to highs not seen sinnce late 2007 potentially indicativee of a laggingg upturn 96 TThe mean number of empployees per fifirm remainedd essentially flat at just ovver 74
Figure 85 - Meaan Revennues and Employmment 20009 Clientts Over TTime
20099 clients n = 30012 1st Followw-up n = 10144
96Dunkelbeerg William C and Holly Wadde (2009) ldquoNFIIB Small Busineess Economic TTrendsrdquo Marchh httpwwwwnfibcompa gesbet amp httppwwwnfibcoomPortals0PDFsbetsbeet201103pdf
Impact S tudy of Entrepren neurial Develop pment Resource es ndash 2010-2011 1
82
Office of Entreprreneurial DDevelopm ment
The folloowing figures show changges in mean rrevenue and eemployment t for 2009 clieents by ED Resourcee97
Figure 85A Mean SBDCC Revenues and Employmeent 20099 Clients Over TTime
2009 SBBDC Clients n = 1567 1st FFollow-up n = 6637
97 The secoond follow-up ssample of 2008 clients includedd only 200 firmms This samplee is insufficient for a statisticallly meaningfull analysis by inddividual ED Resource
Impact S tudy of Entrepren neurial Develop pment Resource es ndash 2010-2011 1
83
Office of Entreprreneurial DDevelopm ment
Figure 85B Mean SCORRE Revennues and Employmment 20009 Clientts Over TTime
2009 SCCORE Clients nn = 1286 1st FFollow-up n = 323
Impact S tudy of Entrepren neurial Develop pment Resource es ndash 2010-20111
84
Office of Entreprreneurial DDevelopm ment
Figure 85C Mean WBC Revenuees and Emmploymennt 2009 Clients Over TTime
2009 SSCORE Clients n = 159 1st FFollow-up n = 54
Impact S tudy of Entrepren neurial Develop pment Resource es ndash 2010-20111
85
Office of Entreprreneurial DDevelopm ment
Figure 866 provides addditional detaail on the chaange in revennues for 20088 and 2009 cclients For example 53 of 20088 clients havee experiencedd revenue grrowth from 22008 to 2010 Additionallly 65 of 22009 clients realized increased revenuees in 2010 coompared to 335 who expperienced a decline inn revenues
Figure 86 Distrribution oof ED Ressource Clientsrsquo Peercentagee Changee in Revenues98
20009 Clients n = 635 2008 Clieents n = 184
98 Firms wiith revenues bellow $1000 andd greater than $55 million were excluded from this analysis BBecause both 20008 and 2009 fiirms needed to have revenues within these paarameters to es tablish approprriate match critteria needed forr the percent chaange comparisoon the 2008 andd 2009 client coounts will not mmatch those in figures 84 amp 8 85
Impact S tudy of Entrepren neurial Develop pment Resource es ndash 2010-2011 1
86
Office of Entrepreneurial Development
Benchmark Comparisons
Figure 87A and 87B depict firm survival over time as compared to the PSED I and PSED II Figure 87A shows firm survival rates after one year of being in business over a period of six years Figure 87B shows firm survival rates after two years of being in business over a period of five years In both figures the benchmarks for comparison are the PSED I and II which provide data for survival rates of businesses after one and two years of being in business99 ED Resource clients have outpaced the samples from both PSED studies for six consecutive years as shown in the figures below
Figure 87A ndash Firm Survival Rates for ED Resource Clients After One Year (Total ED Resources vs PSED studies)
Figure 87B ndash Firm Survival Rates for ED Resource Clients After Two Years (Total ED Resources vs PSED studies)
99 For years 2007 to 2008 the PSED II with updated data became available and was therefore utilized as the new benchmark PSED I analyzes data collected from nascent entrepreneurs from 1998 - 2000 with three follow-up interviews PSED II analyzes data collected from nascent entrepreneurs from 2005 and 2006 with two follow-up interviews This explains the increased survival rates for the benchmarks on each figure 80 to 90 in 87A and 71 to 80 in 87B
Impact Study of Entrepreneurial Development 87Resources ndash 2010-2011
r
y
Office of Entreprreneurial DDevelopm ment
How doees the growtth of ED Reesource clients compare with key bbenchmarkss of econommic growth
Figure 888 compares tthe differenc e in growth rrate of ED RResource cliennts from 20009 to 2010 too three bennchmarks ndash UUS GDP thhe Private Coompany Indexx (PCI) and the Standardd and Poorrsquos Small Capp Index (SampPP) The GDP growth proovides a conttext of how tthe overall ecconomy is performinng The SampPP represents approximateely 3 of thee US markett and includees 600 lsquosmalll caprsquo companiees with markket capitalizattions betweenn $300 millioon and $2 billlion The PCCI measures revenue pperformance in the sectorr of private ccompanies raanging from $$3 million too $60 million in annual revenues
The diffeerence in growwth rate fromm 2009 to 20010 for SBA EED Resourcce clients wass 134 percenntage points AAlthough all tthree benchmmarks indicatted positive ggrowth durinng this time SSBA ED Resourcee clientsrsquo proggress outpaceed the other benchmarks
Figure 88 ED RResource Client Revenue GGrowth CComparedd to Seleccted Benchmarks - PPercent CChange frrom Prevvious Yeaar100
100 SBA EDD figures are baased on Start-upp or In-Businesss firmsrsquo mean rrevenues from tthe two follow--up surveys conducted in 2010 where clients with revvenue less thann $1000 or greaater than $5 milllion in either year were excludded The revenuue upper boundd of $5 million wwas used in ordder to eliminatee bias resulting ffrom potential outliers skewinng the distributionnrsquos measures off central tendenncy The growthh rates for 20099 and 2010 forr each benchmaark are as followws GDP 20099=-26 2010==29 SampP Smmall Cap 600 2 009=238 20010=251 PCCI 2009=220 2010=298 and SBA ED RResources 2009 =-61 2010==73
Impact S tudy of Entrepren neurial Develop pment Resource es ndash 2010-2011 1
88
Office of Entrepreneurial Development
Summary of Follow-up Study Findings
Firm Survival Approximately 57 of 2008 Nascent clients had transitioned to the In-Business segment after two years while 29 of 2009 Nascent clients had gone into business by the beginning of 2011 At the same time 6 of 2008 of In-Business clients and 3 of 2009 clients went out of business by 2011
In addition in the second follow-up 2008 clients receiving 3 or more hours of counseling had a higher survival rate than those who received less than 3 hours of counseling
Based on a comparison to firms in the PSED II businesses who received ED Resource assistance have a higher survival rate than other small businesses For example the survival rate after two years was 93 for ED Resource clients compared to 80 for firms in the PSED II
Financial Impact and Growth These analyses show that ED Resource assistance has had a significant impact on the revenue and employment growth of small business clients For 2008 clients the recession appears to have had a negative impact on 2009 revenue though revenue increased for these clients in 2010 (2nd follow-up 2008 and 1st follow-up 2009) Surviving 2008 clients in the second follow-up experienced a 54 increase in revenues from 2009 to 2010 Still 47 of 2008 clients experienced some negative growth in revenues since 2008 The difference in growth rates from 2009 to 2010 for SBA ED Resource clients was shown to be 134 percentage points Although all three benchmarks indicated positive growth during this time SBA ED Resource clientsrsquo progress outpaced the other benchmarks Firms in the second 2008 client follow-up sample increased from a mean of 50 employees to a mean of 68 employees Mean employment for firms in the first follow-up of 2009 clients stayed relatively flat with an increase from 73 to 74 employees (See Figures 84 85 86 and 88)
Impact Study of Entrepreneurial Development 89Resources ndash 2010-2011
Office of Entrepreneurial Development
[This page is intentionally left blank for two-sided printing]
Impact Study of Entrepreneurial Development 90Resources ndash 2010-2011
Office of Entrepreneurial Development
IX SUMMARY OF QUANTITATIVE FINDINGS
Initial Impact Study of 2010 Clients
1 What is the demographic financial and business profile of firms who utilize SBA ED Resources
Firms that have been in business for more than one year comprise the In-Business client segment Fifty-four percent of ED Resource clients were in the In-Business category Nascent clients represented 26 of ED Resource clients while the smallest segment Start-up clients represented 19101
The average revenue for firms served by ED Resources is $637200 with four employees Firm size varies by ED Resource For example SBDC clients have higher average revenues at $774000 than SCORE clients at $502000 WBC clientsrsquo revenues are lowest with average revenues of $171300 These revenue figures are lower than client groups studied in 2009
ED Resource clients represented a variety of demographic groups Thirty-six percent of clients were Male 36 Female and 17 of firms had Male and Female owners Sixty-eight percent were White 11 BlackAfrican American 7 HispanicLatino 4 Asian and 2 American IndianNative Alaskan Nine percent of ED Resource clients were Veteran and 2 were Service-disabled Veteran The largest age group served by ED Resources accounting for 28 of the total sample included clients between 45 and 54 years of age
ED Resource clients served during 2010 represented a wide variety of business types The most common industries included service retail and manufacturing businesses
ED Resources assisted clients in developing plans and strategies in order to start or better manage their businesses The most frequently reported type of assistance was business plans (35) followed by marketing plans (30) and financial strategy (19)
For 2010 clients the lowfree cost of service was the most commonly reported reason for seeking business counseling from ED Resources at 51 The least commonly reported reason for seeking business counseling from ED Resources was clients having tried other alternatives but were dissatisfied at 9 SCORE clients reported the reputation of SCORE as a reason they sought assistance (55) more often than the lowfree cost of service (52)
101 Respondents (86) who reported being in business but who did not provide a valid start date for that business were not assigned to a business segment
Impact Study of Entrepreneurial Development 91Resources ndash 2010-2011
Office of Entrepreneurial Development
Firms who received less than 3 hours of assistance reported lower levels of perceived usefulness than firms with 3 or more hours of counseling Also firms in the In-Business segment reported significantly higher perceived usefulness from their ED Resources counseling
American IndianAlaskan Native and White firms both reported higher perceived usefulness but there were no other differences based on race There were also no significant effects of clientrsquos age gender veteran status or ethnicity on perceived usefulness of assistance
Unlike some previous years results of this yearsrsquo regression suggest that there were no significant differences in financial impacts of ED Resource assistance based on any factor including ED resource business segment hours of counseling received or geographic location
Impact study data was used to examine four ED Resource client perceptions of impact Findings for each of these impacts are described below
2 Is there a relationship between the servicesassistance provided by ED Resources and the clientrsquos perception of the usefulness and value of the servicesassistance received
In general ED Resource clients perceived information and assistance provided by ED Resource counselors to be valuable Approximately 73 of ED Resource clients overall reported that assistance they received had high value in terms of usefulness This rating was 74 for SBDC 73 for SCORE and 72 for WBC
Seventy-six percent of clients who received 3 or more hours of counseling rated usefulness as ldquohighrdquo whereas 69 of those who received less than 3 hours of counseling did likewise Regression analysis also indicated that clients who received less than 3 hours of counseling reported lower levels of perceived usefulness than clients who received 3 or more hours of counseling
3 Is there a relationship between the servicesassistance provided by ED Resources and the client perceptions of assistance with the decision to start a business
As in the previous yearrsquos study regression results suggest larger firm firms in the In-Business segment and SCORE clients were less likely to report that their decision to start a business was the result of ED Resource assistance
There were no significant differences based on hours of counseling received or client demographic characteristics in regard to perceived assistance with the decision to start a business
Impact Study of Entrepreneurial Development 92Resources ndash 2010-2011
Office of Entrepreneurial Development
4 Is there a positive relationship between the servicesassistance provided by ED Resources and the clientrsquos decision to implement andor change management andor marketing practices in their business
As a result of ED Resource assistance 62 of 2010 In-Business clients and 57 of Start-up clients changed management practices or strategies Clients used ED Resources most widely in developing business plans marketing plans financial strategies and general management
5 Is there a positive relationship between the servicesassistance provided by ED Resources and financial impacts including job creation and retention and increases in sales
Thirty-four percent of Start-up and In-Business clients reported that assistance provided by ED Resources resulted in increased sales In terms of jobs 15 of Start-up and In-Business clients reported that ED Resource assistance led to the hiring of new staff and 20 reported that ED Resources assisted them in retaining current staff The perceived impact of ED Resource assistance on increasing profit margin was 30 a decrease two percentage points from the previous year
For the following financial categories sales profits retaining current staff and hiring of employees ED Resource clients who received 3 or more hours of assistance reported higher financial impacts than firms who received less than 3 hours of assistance This finding was not supported by a regression analysis which examined sales profits cash flow and the hiring of new staff
Increase in sales was the financial category that showed the most prominent correlation with hours of counseling received more than profit margin hiring of new staff or retention of staff Clients that received 3 or more hours of counseling reported increasing their sales 30 of the time whereas clients that received less than 3 hours of counseling increased their sales 19 of the time
Follow-up Study of 2008 and 2009 ED Resource Clients
6 How do the results of this survey compare with the Panel Survey of Entrepreneurial Dynamics (PSED) study
Based on the first follow-up study of 2008 ED Resource clients 95 were still in business while 90 of firms in the PSED II sample remained in business after one year For 2009 ED Resource clients 96 were still in business after one year In addition for the second follow-up study for 2008 clients 93 of ED Resource clients remained in business compared to 80 for those in the PSED II sample
Impact Study of Entrepreneurial Development 93Resources ndash 2010-2011
Office of Entrepreneurial Development
7 Was the financial impact (job creation job retention and sales) on the clients who were provided servicesassistance by SBA ED Resources (SBDC SCORE and WBC) since 2008 greater than or equal to a representative small business population
The follow-up analyses show that ED Resource assistance has had a substantial impact on the revenue and employment growth of small business clients For 2008 clients the recession appears to have had a negative impact on 2009 revenue though revenue increased for these clients in 2010 Surviving 2008 clients in the second follow-up experienced a 54 increase in revenues from 2009 to 2010 Still 47 of 2008 clients experienced some negative growth in revenues since 2008 The difference in growth rates from 2009 to 2010 for SBA ED Resource clients was shown to be 134 percentage points Although all three benchmarks indicated positive growth during this time SBA ED Resource clientsrsquo progress outpaced the other benchmarks Firms in the 2nd 2008 client follow-up sample increased from a mean of 5 employees to a mean 68 employees Mean employment for firms in the first follow-up of 2009 clients stayed relatively flat with an increase from 73 employees to 74 employees (See Figures 84 85 86 and 88)
Impact Study of Entrepreneurial Development 94Resources ndash 2010-2011
Office of Entrepreneurial Development
X SUMMARY OF QUALITATIVE FINDINGS
In addition to completing the survey multiple ED Resource clients provided additional commentary through their responses to survey invitation e-mails Through these communications clients expressed both positive and negative thoughts and feelings about their experiences with ED Resources This section reviews a selection of these comments
Among the positive comments received clients communicated several themes SBA counselors were professional and genuinely interested in providing help to the client Information provided to the clients by SBDC SCORE and WBC was particularly helpful to
their businessesrsquo development Counselors were willing to take the time to have in-depth discussions about business ideas
and offered many helpful suggestions
A very thankful survey respondent wrote at length about the concerted effort that her counselor put into building a relationship and aiding her business The following is an excerpt from her letter
ldquoI truly appreciated having the opportunity to meet and work with [counselor name] He is a great listener director and mentor His guidance is sound And he has a wonderfully open personality that allows people to feel that they can rely on [him] With his outstanding follow-through [counselor name] never disappointed me in any of my business questions and requestsrdquo
Another ED Resource client took the time to commend his counselor responding very positively to the effect the counselor had on his business
ldquoI just wanted to inform you that [counselor name] was one of the best things that ever happened to my company She displayed exemplary professionalism and helped us out tremendouslyrdquo
One respondent although she was unable to secure credit for her business considered ED Resource assistance to be a valuable learning experience
ldquoI would like to let you know that [ED Resources] helped me a lot and I learned so much from the services they provided me for my businessrdquo
The head of a private educational institution highlighted the flexibility of ED Resources She felt that the counselors served as motivators as well as sources of information
ldquoThe [ED Resources counselors] helped us to identify our issues facilitated discussions about options and helped with the energy and direction to move forward to study those optionshellip [ED Resources] has been a huge help to usrdquo
Impact Study of Entrepreneurial Development 95Resources ndash 2010-2011
Office of Entrepreneurial Development
There was also negative feedback provided by survey respondents regarding their experiences with ED Resources Among the negative comments the most common related to the following
Dissatisfaction with the conduct of their counselors on account of their lack of professionalism or disinterest in helping the client
Finding the information they received financial and otherwise to be less than useful or not applicable to their industry
The unavailability or unresponsiveness of ED Resource counselors in regard to calls or emails placed for inquiries or requests
Some ED Resource clients had difficulty establishing communication lines with their counselors One respondent wrote about his negative experience trying to reach his ED Resource counselor Ultimately the client did not receive any assistance
ldquoA person was chosen for me who was currently unavailable for months as he was not even in the area at the time (even though he lived here)hellip Months later he sent me an email saying he was ready to assist mehellipwe could meet and discuss my problems Problem was I was currently working out of the area supporting my clientrsquos contract I guess that was unsatisfactory for himhellipI never heard from him againrdquo
Several ED Resource clients complained about the outdated nature of the advice they received at times referencing current adverse economic conditions One respondent wrote
ldquoThe counselors didnt have a clue how to help me I was looking for a solid marketing plan Sorry but these guys are dinosaurs Didnt seem to be up on current trends in businesshelliprdquo
After making attempts to receive assistance at multiple ED Resource locations one ED Resource client wrote about her dissatisfaction with the limited knowledge and lack of professionalism of the counselors she met with
ldquoThe gentleman the office set me up with for first meeting did not have any experience in graphic design or what I was mainly interested in obtaining web based businessclients I then made another appointment for their downtown [location] office with two men who I was told knew my fieldhellip The meeting was disastrous One man told me that I should just go door to door to find local clients and to not utilize the Internet at allhelliprdquo
One respondent who sought capital assistance from ED Resources was frustrated at the lack of effort put in by her counselors in spite of her high level of preparedness Ultimately the client was left questioning whether ED Resources volunteers had any genuine interest in helping her business
ldquoI visited with [ED Resources] volunteers twice I found them to be distant and unenthusiastic for the most part I presented a full marketing plan right down to the last detail in a comprehensive binder that I spent two years preparingrdquo
Impact Study of Entrepreneurial Development 96Resources ndash 2010-2011
Office of Entrepreneurial Development
XI RECOMMEDATIONS FOR FURTHER RESEARCH
Measuring the effects of ED Resources on business operations as well as financial and economic outcomes requires longitudinal data that track respondents over time
Further research with this dataset could afford comparison of the effects of different kinds of ED Resource assistance and services on financial and economic outcomes for clients
On the basis of our findings Concentrance offers the following recommendation for further research
An additional study could examine the effects of different types of financing (eg SBA Guarantee Loan vs SBA Disaster Loan) on perceived improvements survival and business growth
Impact Study of Entrepreneurial Development 97Resources ndash 2010-2011
Office of Entrepreneurial Development
[This page is intentionally left blank for two-sided printing]
Impact Study of Entrepreneurial Development 98Resources ndash 2010-2011
Office of Entrepreneurial Development
XII APPENDICES
Impact Study of Entrepreneurial Development 99Resources ndash 2010-2011
Office of Entrepreneurial Development
[This page is intentionally left blank for two-sided printing]
Impact Study of Entrepreneurial Development 100Resources ndash 2010-2011
Office of Entrepreneurial Development
Appendix 1 ndash Survey Response Values by Research Topic
Impact Study of Entrepreneurial Development 101Resources ndash 2010-2011
RESEARCH TOPIC RESEARCH TOPIC SURVEY QUESTIONS SURVEY QUESTIONS RESPONSE CODEDATABASE RESPONSE CODEDATABASE
VALUES VALUES
Demographic Characteristics 7 At the time you were assisted by [SBDC SCORE WBC] what was the approximate annual gross revenue for each of the
Open ended between $1000 and $25000000
calendar years below 2009 ______ 2010 ______
8 Counting yourself how many fill-time employees and part-time employees did you employ at the end of the
following years you were in business
Open ended
2009 FullPart ______ 2010 FullPart ______
10 If you are in business what is the primary type of
business Construction Manufacturing Consulting Wholesale Finance Ins and Real
Estate Entertainment Retail Restaurant Engineering Publishing Education
Construction=1 or 0 Manufacturing=1 or 0 Consulting =1 or 0 Wholesale =1 or 0
Finance Ins And Real Estate =1 or 0 Entertainment =1 or 0 Retail =1 or 0 Restaurant =1 or 0 Engineering =1 or 0 Publishing =1 or 0 Education =1 or 0 Service =1 or 0 Health Care =1 or 0 Day Care =1 or 0 Transportation =1 or 0 Technology =1 or 0 Health Wellness or Fitness Yes=1 No= 0 Other = open ended No response
=N
Service Health Care Day Care Transportation Technology Health Wellness andor
Fitness Other
11 Indicate the geographic location of your primary
business
Urban Suburban Rural
Office of Entrepreneurial Development
RERESEARCH TOPIC SEARCH TOPIC SURVEY QUESTIONS SURVEY QUESTIONS SURVEY QUESTIONS RESPONSE CODEDATABASE RESPONSE CODEDATABASE
VALUES VALUES 12 What lead to your decision
to seek business counseling Tried other alternatives Reputation of
SBDCSCOREWBC Lowfree cost of service Referred by
16 Gender Male=1 Female=2 Male and Female Owners=3 No response = N
17 Veteran Status Veteran=1 Service-disabled Veteran=2 Reservist=3 National Guard Member=4 Non-veteran=5 No response= N
18 Age 18-24= 1 25-34 = 2 35-44 = 3 45-54 = 4 55-64 = 5 65-74 = 6 75+ = 7 No response = N
19 Are you Hispanic or Latino Not HispanicLatino Origin
Hispanic or Latino=1 Not of HispanicLatino Origin=0 No response = N
20 Are you American IndianAlaskan Native Asian BlackAfrican American Native HawaiianPacific Islander White
American Indian or Alaskan =1 or 0 Asian =1 or 0 Black or African American =1 or 0 Native Hawaiian or Pacific Islander =1or 0 White =1 or 0 No response = N
Is there a positive relationship between the servicesassistance provided by SBA ED Resources and the clientrsquos perceptions of the usefulness and value of the servicesassistance received
6 Pleas indicate how useful the services were that you received from the counselor who assisted you in identifying and correcting problems in operating your business Relevancy of Counseling Timeliness of Counseling Helpfulness of Counseling
13 Please indicate the value of the information you received from the [WBC SCORE SBDC] counselor you visited
1 Usefulness of information 2 Relevancy of the
information 3 Timeliness of the
information
Extremely Valuable=5 Valuable=4 No Opinion=3 Somewhat Valuable=2 Not Valuable=1 No response = N
15 I would refer the counseling services I reto other small business
ceived es
Strongly Agree=5 Agree=4 No Opinion=3 Disagree=2 Strongly Disagree=1 other=open ended No response = N
Impact Study of Entrepreneurial Development 102Resources ndash 2010-2011
RESEARCH TOPIC RESEARCH TOPIC SURVEY QUESTIONS SURVEY QUESTIONS RESPONSE CODEDATABASE RESPONSE CODEDATABASE
VALUES VALUES
Is there a positive relationship between the servicesassistance provided by SBA ED Resources and
the clientrsquos perceived quality of the counseling
experience
14 Please indicate the counselorrsquos effectiveness in
assisting you 1 The counselor exhibited excellent customer service
techniques 2 The counselor was able
to assist me 3 The counselor exhibited a high level of professionalism
4 The counselor was knowledgeable of current
management practices and issues
5 The counselor identified with my needs
6 I would rate my overall experience with the counselor as excellent
Strongly Agree=5 Agree=4 No Opinion=3 Disagree=2 Strongly Disagree=1 other=open ended No response = N
Is there a positive relationship between the servicesassistance provided by SBA ED Resources and the clientrsquos decision to start a
business
2 If you were not in business at the time you were assisted by the counselor did you decide to go into business as a
result of that assistance
Yes = 1 No=0 No Response = N
Is there a positive relationship between the servicesassistance provided by SBA ED Resources and clientsrsquo decisions to implement andor change management andor marketing practices in their
business
3 As a result of the assistance you received have you changed any of your current
management practices
Yes=1 No=0 No response = N
Office of Entrepreneurial Development
Impact Study of Entrepreneurial Development 103Resources ndash 2010-2011
RESEARCH TOPIC RESEARCH TOPIC SURVEY QUESTIONS SURVEY QUESTIONS RESPONSE CODEDATABASE RESPONSE CODEDATABASE
VALUES VALUES
4 As a result of the assistance I received from the [WBC SCORE SBDC] counselor I was able to develop [ie Business Plan] in order to start or better manage my business [Check all that apply]
Business Plan Marketing Plan Promotional Plan Pricing Strategy Cash Flow Analysis General Management Loan Package Hiring Plan Training Plan for Staff Financial Strategy Web-based Strategy Purchasing Strategy Feasibility Plan Production Plan Distribution Plan International Trade Other
If checked = 1 Not checked = 0 Other =open ended No response = N
Is there a positive relationship between the servicesassistance provided by SBA ED Resources and the clientsrsquo businesses having a positive financial impact on job creation and
retention and increase in sales
5 Please indicate the impact these changes have had on
your firm 1 Increase my sales 2 Improve my cash flow 3 Acquire a bank loan 4 Expand my products
services 5 Hire new staff 6 Revise my marketing
strategy 7 Increase my profit margin 8 Retain current staff 9 Acquire a SBA guarantee
loan 10 Acquire a government
contract 11 Acquire a SBA Disaster
loan 12 Other
Strongly Agree=5 Agree=4 No Opinion=3 Disagree=2 Strongly Disagree=1 other=open ended No response = N
9 If you were projecting to reduce your total number of
employees prior to counseling by SBDCSCOREWBC how many positions have you
retained due to the counseling Full time _____ Part time _____
Open Ended
Office of Entrepreneurial Development
Impact Study of Entrepreneurial Development 104Resources ndash 2010-2011
RESEARCH TOPIC RESEARCH TOPIC SURVEY QUESTIONS SURVEY QUESTIONS RESPONSE CODEDATABASE RESPONSE CODEDATABASE
VALUES VALUES
General Business 1i Are you currently in business
Yes=1 No=0 No response = N
1ii If yes when was the business started
mmyyyy
1iii What is the zip code of your business
Xxxxx
1a If NO when do you plan on starting a business
Within 30 days=1 31-90 days=2 91-120 days=3 No idea at this time=4 No response = N
1b Have you ever been in business
Yes=1 No=0 No response = N
1bi If YES when was the business started
mmyyyy
21i Did you utilize any other SBA resourcesprogram
Yes=1 No=0 No response = N
21ii If YES select those you used [Check all that apply]
SBDC SCORE WBC SBArsquos Guarantee Loan Programs
SBIC Venture Capital Program
Government contracting SBArsquos Surety Bond Program Small Business Training
Network (Online Training)
Disaster Assistance
SCORE =1 or 0 SBDC =1 or 0 Women Business Center =1 or 0
SBArsquos Guarantee Loan Programs =1 or 0 SBIC Financing Program
=1 or 0 SBArsquos Surety Bond Program =1 or 0 No response = N
Office of Entrepreneurial Development
Impact Study of Entrepreneurial Development 105Resources ndash 2010-2011
Office of Entrepreneurial Development
[This page is intentionally left blank for two-sided printing]
Impact Study of Entrepreneurial Development 106Resources ndash 2010-2011
Office of Entrepreneurial Development
Appendix 2 ndash Quantified Survey Results ndash Initial Survey 2010 Clients
Impact Study of Entrepreneurial Development 107Resources ndash 2010-2011
Surveys Questions Percentage of Sample Q1) Are you currently in business
Yes 7476 No 2524Missing 000
Q1a) If no when do you plan on starting a business
Within 30 days 127 31-90 days 362 91-120 days 451 No idea at this time 1542 Missing 7517
Q1b) Have you ever been in business
Yes 918 No 1605 Missing 7478
Q2) If you were not in business at the time you were assisted by the
counselor did you decide to go into business as a result of that
assistance Yes 1605 No 2817Not Applicable (already in
business) 5542
Missing 036 Q3) As a result of the assistance
you received have you changed any of your current management
practicesstrategies
Yes 4486
No 2931 Missing 2583
Q4) As a result of the assistance I received from the counselor I was
able to develop [ie Business Plan] in order to start or better manage my business
Business Plan 3498 Loan Package 829 Purchasing Strategy 407 Marketing Plan 2982 Hiring Plan 482 Feasibility Plan 789 Promotional Plan 1284 Training Plan for Staff 369 Production Plan 406 Pricing Strategy 1439 Financial Strategy 1869 Distribution Plan 330 Cash Flow Analysis 1693 Web-based Strategy 1036 International Trade 147
StGeneral Management
rategy 1779 Other 835
Q5) Please indicate the impact of these changes have had on your firm Strongly Agree=SA Agree=A No Opinion-No Disagree=D Strongly Disagree=SD]
SA A NO D SD Missing
I was able to Increase my sales 725 1803 2870 636 449 3517 Improve my cash flow 682 1816 2827 674 445 3555 Acquire a bank loan 489 518 3631 974 649 3739 Expand my productsservices 666 1702 2808 756 468 3599 Hire new staff 323 817 3664 911 515 377 Revise my marketing strategy 1218 2726 1728 531 392 3404 Increase my profit margin 555 1605 2941 759 471 3669 Retain current staff 337 1177 3628 582 466 3809 Acquire a SBA guarantee loan 313 286 3791 1052 735 3823 Acquire a government contract 127 232 4015 1071 700 3855 Acquire a SBA Disaster loan 030 062 4206 1088 695 3920 Other 559 195 1314 075 241 7616
Office of Entrepreneurial Development
Impact Study of Entrepreneurial Development 108Resources ndash 2010-2011
Q6) Please indicate how useful the services were that you received
from the counselor who assisted you in identifying and correcting problems in operating your business [Very Useful=VU Useful=U No Opinion-NO Somewhat Useful =SU Not Useful =NU]
VU U NO SU NU Missing
Relevancy of Counseling 3720 2023 318 541 525 2872Timeliness of Counseling 3647 2088 505 393 473 2895Helpfulness of Counseling 3855 1960 297 463 540 2885Q7) At the time you were assisted by [SBDCSCOREWBC] what was the approximate annual gross revenue for each of the calendar years below
2009 Revenue given 3205 Missing 6795
2010 Revenue given 3366 Missing 6633
Q8) Counting yourself how many full-time employees and part-time employees did you employ at the end of the following years you were in business
2010 Full-time jobs Average = 27 2009 Full-time jobs Average = 38 2010 Part-time jobs Average = 17 2009 Part-time jobs Average = 28
Q9) At the time you were assisted by [SBDCSCOREWBC] what was the approximate annual gross revenue for each of the calendar years below
Existing Full-time jobs saved Total Full-time Jobs Saved ndash 3768
Existing Part-time jobs saved Total Part-time Jobs Saved ndash 3203
Firms that saved jobs 3746
Office of Entrepreneurial Development
Impact Study of Entrepreneurial Development 109Resources ndash 2010-2011
Q10) If you are in business what is the primary type of business (This question includes multiple responses)
Construction 352 Manufacturing 539 Consulting 522 Wholesale 256 Finance Insurance Real
Estate
188 Entertainment 116 Retail 723
and Drinking Restaurant andor Eating
266 Engineering 095 Publishing 075 Education 181 Service 923 Health Care 216 Day Care 065 Transportation 086 Technology 302
Fi Health Wellness andor
tness 261
Other 1433
Missing 3400 Q11) Indicate the geographic
location of your primary business
Rural 1454 Suburban 2688 Urban 2369 Missing 3489
Q12) What led to your decision to seek business counseling from [SBDCSCOREWBC]
Tried other alternatives but was dissatisfied 821
Reputation of [SBDCSCOREWBC] 4392 Lowfree cost of service 4578
Referred by _____ 3819
Office of Entrepreneurial Development
Impact Study of Entrepreneurial Development 110Resources ndash 2010-2011
Office of Entrepreneurial Development
Q13) Please indicate the value of the information [Extremely Valuable=EV Valuable=V No Opinion=NO Somewhat Valuable=SV Not Valuable=NV]
EV V NO SV NV Missing
Usefulness of Information 4278 3067 318 772 585 980 Relevancy of the Information 4148 3127 393 739 576 1016 Timeliness of the Information 4008 3118 599 636 564 1074 Q14) Please indicate the counselors effectiveness in assisting you [Strongly Agree=SA Agree=A No Opinion-No Disagree=D Strongly Disagree=SD]
SA A NO D SD Missing
The counselor exhibited excellent customer service techniques 5003 2923 498 233 243 1100 The counselor was able to assist me 4397 3081 608 423 397 1094 The counselor exhibited a high level of professionalism 5383 2767 404 148 201 1097 The counselor was knowledgeable of current management practices and issues 4707 2925 784 233 252 1099 The counselor identified with my needs 4426 3039 677 386 374 1098 I would rate my overall experience with the counselor as excellent 4803 2632 631 439 385 1111 Q15) I would refer the counseling services I received to other small businesses [Strongly Disagree=SA Agree=A No Opinion=NO Disagree=D Strongly Disagree=SD]
SA A NO D SD Missing
4847 1515 450 983 1142 1062 Q16) Gender
Male 3560 Female 3576 Both male and female 1698 Missing 1166
Q17) Veteran Status Veteran 858 Service-disabled Veteran 207 Reservist 032 National Guard Member 035 Non-veteran 7524 Missing 1343
Impact Study of Entrepreneurial Development 111Resources ndash 2010-2011
Q18) Age 18-24 169 25-34 1280 35-44 2157 45-54 2752 55-64 2047 65-74 409
75 + 070 Missing 1117
Q19) Are you HispanicLatino 661 Non-HispanicLatino 9339 Missing 0
Q20) Are you American Indian or
Alaskan Native 174 Asian 351 Black or African American 1135Native Hawaiian or Pacific
Islander 053 White 6838Missing 1634
Q21) Did you utilize any other SBA resourcesprogram
Yes 2510 No 5412 Missing 2078
Q21 cont) If yes select those you used
SCORE 792 SBArsquos Guarantee Loan
Program 657 Women Business Center 382 SBIC Venture Capital
Program
041 Government Contracting 322 SBDC 396 SBArsquos Surety Bond
Program
025 Small Business Training
Network (Online Assistance) 627 Disaster Assistance 033 Missing 2885
Office of Entrepreneurial Development
Impact Study of Entrepreneurial Development 112Resources ndash 2010-2011
Office of Entrepreneurial Development
Appendix 3 ndash Quantified Survey Results ndash Follow-up Survey 2010 Clients
2008 2nd Follow Up Results Data
Impact Study of Entrepreneurial Development 113Resources ndash 2010-2011
Surveys Questions Percentage of Sample Q1) Are you currently in business
Yes 8650 No 1350Missing 000
Q2) If no when do you plan on starting a business
Within 30 days 050 31-90 days 000 91-120 days 000 No idea at this time 1300 Missing 8650 Q3) Have you ever been in
business
Yes 950 No 400 Missing 8650
Q4) As a result of the assistance received from the
[SBDCWBCSCORE] Counselor which of the following were you able to develop [ie Business Plan] in order to start or better manage your business [Check all
that apply]
Business Plan 4500 Loan Package 4400Purchasing Strategy 2000 Marketing Plan 1700 Hiring Plan 2450Feasibility Plan 2700 Promotional Plan 1150 Training Plan for Staff 850
Production Plan 400 Pricing Strategy 2050Financial Strategy 1600 Distribution Plan 450
Cash Flow Analysis 1550 Web-based Strategy 950
International Trade 500 General Management 250 Other 1400
Surveys Questions Percentage of Sample
Q5) What was the approximate annual gross revenue of your
business in 2010
Reported 6950 Missing 3050
Q6) Currently how many people (full and part time) including yourself does your business employ
Average Full-Time 55 employees Average Part-Time 18 employees
Q7) Have you utilized any other SBA resourcesprogram
Yes 2200 No 7600 Missing 200
Q8) If YES select those you used [check all that apply]
SCORE 600 SBArsquos Loan Guarantee Programs 150 SBDC 050
SBIC Venture Capital
Program
100 Woman Business Center 550 Government Contracting 000
SBArsquos Surety Bond
Program
100
Small Business Training Network (online training) 300
2009 1st Follow Up Results Data Surveys Questions Percentage of Sample
Q1) Are you currently in business Yes 8298 No 1702 Missing 000
Q2) If no when do you plan on starting a business
Within 30 days 097 31-90 days 152 91-120 days 203 No idea at this time 1225 Missing 8323
Office of Entrepreneurial Development
Impact Study of Entrepreneurial Development 114Resources ndash 2010-2011
Q3) Have you ever been in business
Yes 874 No 813 Missing 8313
Q4) As a result of the assistance received from the [SBDCWBCSCORE] Counselor which of the following were you able to develop [ie Business Plan] in order to start or better manage your business [Check all that apply]
Business Plan 4761 Loan Package 1250 Purchasing Strategy 386 Marketing Plan 3283 Hiring Plan 493 Feasibility Plan 1133 Promotional Plan 1418
Production Plan 371 Pricing Strategy 1499 Financial Strategy 2190 Distribution Plan 234 Cash Flow Analysis 2236 Web-based Strategy 884 International Trade 168 General Management 2266 Other 1758
Q5) What was the approximate annual gross revenue of your business in 2010
Reported 6850 Missing 3150
Q6) Currently how many people (full and part time) including yourself does your business employ
Average Full-Time 49 employees Average Part-Time 34 employees
Q7) Have you utilized any other SBA resourcesprogram
Yes 2602 No 6565 Missing 833
Training Plan for Staff
Surveys Questions Percentage of Sample
300
Office of Entrepreneurial Development
Impact Study of Entrepreneurial Development 115Resources ndash 2010-2011
Surveys Questions Percentage of Sample
Q8) If YES select those you used [check all that apply]
SCORE 986 SBArsquos Loan Guarantee
Programs 655 SBDC 412 SBIC Venture Capital
Program 025 Woman Business Center 310 Government Contracting 381 SBArsquos Surety Bond
Program 020 Small Business Training
Network (online training) 503
Office of Entrepreneurial Development
Impact Study of Entrepreneurial Development 116Resources ndash 2010-2011
Office of Entrepreneurial Development
Appendix 4 ndash Initial Study Survey Instrument
US Small Business Administration Office of Entrepreneurial Development
Initial Economic Impact Survey OMB Number 3245‐0351 Expiration 03312013
Dear Small Business Client
Thank you for your recent visit to [the Small Business Development Center (SBDC) SCORE the Womenrsquos Business Center (WBC)] one of SBArsquos Entrepreneurial Development (ED) Resource Partners We hope you found the business assistance you sought The SBA is always striving to better its programs and deliver relevant and meaningful assistance We want to know if our programs and services are helping the economy by providing useful information on starting and managing a business and eventually helping your business create jobs increasing your businessrsquo revenues and in general fueling the entrepreneurial spirit in America
We would appreciate you taking a few minutes to answer some brief questions that will help us know the quality and impact of the programs All responses to these questions are voluntary and will be held in confidence The data will not be released to any other government agency or private firm Please answer the following questions based on your visit to [the Small Business Development Center (SBDC) SCORE the Womenrsquos Business Center (WBC)]
1 Are you currently in business Yes No If YES when was the business started _ __ _ _ _
mm yyyy What is the zip code of your business location __ __ __ __ __
If Yes to Question 1 skip to Question 2 If No continue to 1a
1a If NO (to Question 1) when do you plan on starting a business Within 30 days 31‐90 days 91‐120 days No idea at this time
1b If NO (to Question 1) have you ever been in business Yes No If YES when was the business started _ _ _ _ _ _
mmyyyy
2 If you were not in business at the time you were assisted by the counselor did you decide to go into business as a result of that assistance
Yes No Not applicable (already in business)
Impact Study of Entrepreneurial Development 117Resources ndash 2010-2011
Office of Entrepreneurial Development
If you answered NO to Question 1 please skip ahead to Question 12
3 As a result of the assistance you received have you changed any of your current management practicesstrategies Yes No
4 As a result of the assistance I received from the [SBDC SCORE WBC] Counselor I was able to develop one or more of the following (ie Business Plan) in order to better manage my business [Check all that apply]
Business Plan Loan Package Purchasing Strategy Marketing Plan Hiring Plan Feasibility Plan Promotional Plan Training Plan for Staff Production Plan Pricing Strategy Financial Strategy Distribution Plan Cash Flow Analysis Web Based Strategy International Trade General Management Other ________________________
5 Please indicate the impact your counseling experience had on your firm [Strongly Agree=SA Agree=A No Opinion=NO Disagree=D Strongly Disagree=SD]
SA A NO D SD I was able to 1 Increase my sales 5 4 3 2 1 2 Improve my cash flow 5 4 3 2 1 3 Acquire a bank loan 5 4 3 2 1 4 Expand my productsservices 5 4 3 2 1 5 Hire new staff 5 4 3 2 1 6 Revise my marketing strategy 5 4 3 2 1 7 Increase my profit margin 5 4 3 2 1 8 Retain current staff 5 4 3 2 1 9 Acquire a SBA guarantee loan 5 4 3 2 1 10 Acquire a government contract 5 4 3 2 1 11 Acquire a SBA Disaster loan 5 4 3 2 1 12 Other (specify ____________________) 5 4 3 2 1
6 Please indicate how useful the services were that you received from the counselor who assisted you in identifying and correcting problems in operating your business
Impact Study of Entrepreneurial Development 118Resources ndash 2010-2011
Very No Somewhat Not Useful Useful Opinion Useful Useful
1 Relevancy of Counseling 5 4 3 2 1 2 Timeliness of Counseling 5 4 3 2 1 3 Helpfulness of Counseling 5 4 3 2 1
Office of Entrepreneurial Development
7 At the time you were assisted by [the Small Business Development Center (SBDC) SCORE the Womenrsquos Business Center (WBC)] what was the approximate annual gross revenue for each of the calendar years below [All data will be held in strict confidence and reported only in the aggregate without identifying any individual small business] Enter dollar figures only Do not include commas or currency symbols
2009 __________________________ 2010 __________________________
8 Counting yourself how many full‐time employees (35 hours or more per week) and part‐time employees (less than 35 hours per week) did you employ at the end of the following years you were in business
2009 _______________ Number of Full‐time employees 2010 _______________ Number of Full‐time employees
2009 _______________ Number of Part‐time employees 2010 _______________ Number of Part‐time employees
9 If you were projecting to reduce your total number of employees prior to receiving counseling from [SBDC SCORE WBC] how many positions have you retained due to the counseling
Existing Full‐time jobs saved ___________ Existing Part‐time jobs saved ___________
10 What is your firmrsquos primary type of business [Please choose only one]
Construction Manufacturing Consulting Wholesale Finance Insurance and Real Estate Entertainment Retail Restaurant andor Eating and Drinking Engineering Publishing Education Service Health Care Day Care Transportation Technology Health Wellness andor Fitness Other (describe) _______________________
11 Indicate the geographic location of your primary business Rural Suburban Urban
12 What led to your decision to seek business counseling from [SBDC SCORE WBC] [Check all that apply]
Tried other alternatives and was dissatisfied Reputation of [SBDC SCORE WBC] Lowfree cost of service Referred by __________________________________
(Fill in blank or add options such as SBA office of ______ )
Other _______________________________________ (Fill in the blank)
Impact Study of Entrepreneurial Development Resources ndash 2010-2011
119
Office of Entrepreneurial Development
13 Please indicate the value of the information you received from the counselor you visited
Extremely No Somewhat Not Valuable Valuable Opinion Valuable Valuable
1 Usefulness of Information 5 4 3 2 1 2 Relevancy of Information 5 4 3 2 1 3 Timeliness of Information 5 4 3 2 1
14 Please indicate the counselorrsquos effectiveness in assisting you [Strongly Agree=SA Agree=A No Opinion=NO Disagree=D Strongly Disagree=SD]
SA A NO D SD 1 The counselor exhibited excellent
customer service techniques 5 4 3 2 1 2 The counselor was able to assist me 5 4 3 2 1 3 The counselor exhibited a high level of
professionalism 5 4 3 2 1 4 The counselor was knowledgeable of current
management practices and issues 5 4 3 2 1 5 The counselor identified with my needs 5 4 3 2 1 6 I would rate my overall experience with
the counselor as excellent 5 4 3 2 1
15 I would refer the counseling services I received to other small businesses
Strongly Agree Agree No Opinion Disagree Strongly Disagree
16 Gender Male owner(s) Female owner(s) Both male and female owners
17 Veterans status Veteran Service‐disabled Veteran Reservist National Guard member Non‐Veteran
18 Age [Circle one] 18‐24 25‐34 35‐44 45‐54 55‐64 65‐74 75+
19 Are you Hispanic or Latino Not of Hispanic or Latino Origin
20 Are you [Please choose one or more] American Indian or Alaskan Native Asian Black or African American Native Hawaiian or Pacific Islander White
Impact Study of Entrepreneurial Development 120Resources ndash 2010-2011
Office of Entrepreneurial Development
21 Did you utilize any of the following SBA resources or programs Yes No
If YES select those you used [Check all that apply] SBDC SCORE SBArsquos Guarantee Loan programs Women Business Center SBIC Venture Capital Program Government Contracting SBArsquos Surety Bond Program Small Business Training Network Disaster Assistance (On‐line training)
PLEASE NOTE The estimated burden for completing this form is 12 minutes per response You are not required to respond to any collection of information unless it displays a currently valid OMB approval number Comments on the burden should be sent to US Small Business Administration Chief AIB 409 3rd St SW Washington DC 20416 and Desk Officer for the Small Business Administration Office of Management and Budget New Executive Building Room 10202 Washington DC 20503 OMB Approval (3245‐0351) PLEASE DO NOT SEND FORMS TO OMB
SBA Form 2214 THANK YOU
Impact Study of Entrepreneurial Development 121Resources ndash 2010-2011
Office of Entrepreneurial Development
[This page is intentionally left blank for two-sided printing]
Impact Study of Entrepreneurial Development 122Resources ndash 2010-2011
Office of Entrepreneurial Development
Appendix 5 ndash Follow-up Survey
US Small Business Administration Office of Entrepreneurial Development Follow‐up Economic Impact Survey
OMB Number 3245‐0351 Expiration 03312013
Dear Small Business Client
Within the last twelve months you were kind enough to respond to our request for some initial data regarding your visit(s) to SBArsquos Entrepreneurial Development resource the [Small Business Development Center (SBDC) Womenrsquos Business Center (WBC) SCORE] To continually understand the impact our programs and services are having on the economy it would be helpful to know if our assistance to you regarding starting and managing a business resulted in job creation increases in your businessrsquo revenues or other results
We understand that you responded to a thorough survey not so long ago but we ask that you help us in answering a few questions for this follow‐up survey which will take less than 5 minutes All responses to these questions are voluntary and will be held in confidence The data will not be released to any other government agency or private firm Based on your visit to the [SBDC WBC SCORE] please use that experience as a benchmark to answer the following
1 Are you currently in business Yes No
If YES when was the business started _ __ _ _ _ mm yyyy
2 If NO when do you plan on starting a business Within 30 days 31‐90 days 91‐120 days No idea at this time
3 Have you ever been in business Yes No If YES when was the business started _ __ _ _ _
mm yyyy
Impact Study of Entrepreneurial Development 123Resources ndash 2010-2011
Office of Entrepreneurial Development
4 As a result of the assistance received from the [SBDCWBCSCORE] Counselor which of the following were you able to develop [ie Business Plan] in order to start or better manage your business [Check all that apply]
Business Plan Loan Package Purchasing Strategy Marketing Plan Hiring Plan Feasibility Plan Promotional Plan Training Plan for Staff Production Plan Pricing Strategy Financial Strategy Distribution Plan Cash Flow Analysis Web Based Strategy International Trade General Management Other ________________________________________
5 What was the approximate annual gross revenue of your business in 2010 $________________00
6 Currently how many people (full and part‐time) including yourself does your business employ
Number of Full‐Time Employees _________________________ Number of Part‐Time Employees _________________________
7 Have you utilized any other SBA resourcesprogram Yes No
8 If YES select those you used [Check all that apply]
SCORE SBArsquos Guarantee Loan programs SBDC SBIC Venture Capital Program Women Business Center Government Contracting SBArsquos Surety Bond Program Small Business Training Network
(online training)
PLEASE NOTE The estimated burden for completing this form is less than 5 minutes per response You are not required to respond to any collection of information unless it displays a currently valid OMB approval number Comments on the burden should be sent to US Small Business Administration Chief AIB 409 3rd St SW Washington DC 20416 and Desk Officer for the Small Business Administration Office of Management and Budget New Executive Building Room 10202 Washington DC 20503 OMB Approval (TBD) PLEASE DO NOT SEND FORMS TO OMB
THANK YOU
Impact Study of Entrepreneurial Development 124Resources ndash 2010-2011
Office of Entrepreneurial Development
Appendix 6 ndash Regression Computations
Regression Results Effects of Firm and Demographic Characteristics on Perceived Usefulness Assistance with the Decision to Start a Business and Financial Impact
Dependent Variable
Independent Variable
Perceived Usefulness
Assistance with Decision to Start a Business (LR)
Financial Impact
Intercept -124024 240905 -191586
SBDC 19242 -040279 48574
SCORE 15332 -072576 49471
lt 3 hours -24964 011296 -53896
Log of Sales 4661 -013453 3762
Gender 2158 -012057 59382
Veteran 6455 00601 4318
Latino -006 -041537 35888
Age 3223 -003744 40697
Native American 61156 038098 -7369
Asian 21109 -082348 46016
Black 44458 -051198 66021
HawaiianPacific Islander
-32923 -075983 -126224
White 42644 -055758 29757
Inbus 49901 -120888 8468
R-Square 0015 0088 0008
Significant at 001 level Significant at 005 level Significant at 010 level
Impact Study of Entrepreneurial Development 125Resources ndash 2010-2011
Office of Entrepreneurial Development
[This page is intentionally left blank for two-sided printing]
Impact Study of Entrepreneurial Development 126Resources ndash 2010-2011
Office of Entrepreneurial Development
Appendix 7 ndash State-by-State Data The tables below display national response data segmented by ED Resource and in aggregate for total ED Resources
SBDC Clients
ED Resource State Surveys Received
SBDC Client Contacts Received
Response Rate
of Total SBDC Clients
SBDC AL 78 342 23 15SBDC AK 9 48 19 02SBDC AS 2 8 25 00SBDC AZ 71 396 18 14SBDC AR 54 207 26 11SBDC CA 527 2593 20 103SBDC CO 101 330 31 20SBDC CT 75 238 32 15SBDC DC 12 45 27 02SBDC DE 16 60 27 03SBDC FL 235 1233 19 46SBDC GA 180 631 29 35SBDC GU 3 9 33 01SBDC HI 23 93 25 04SBDC ID 26 100 26 05SBDC IL 208 957 22 41SBDC IN 124 470 26 24SBDC IA 71 222 32 14SBDC KS 54 207 26 11SBDC KY 77 312 25 15SBDC LA 84 345 24 16SBDC ME 25 97 26 05SBDC MD 93 405 23 18SBDC MA 104 489 21 20SBDC MI 257 765 34 50SBDC MN 99 380 26 19SBDC MS 43 222 19 08SBDC MO 91 381 24 18SBDC MT 22 69 32 04SBDC NE 28 128 22 05SBDC NV 39 153 25 08SBDC NH 17 96 18 03SBDC NJ 143 648 22 28SBDC NM 40 141 28 08SBDC NY 321 1451 22 63SBDC NC 184 621 30 36SBDC ND 8 49 16 02SBDC OH 185 871 21 36
Impact Study of Entrepreneurial Development 127Resources ndash 2010-2011
Office of Entrepreneurial Development
Impact Study of Entrepreneurial Development Resources ndash 2010-2011
ED Resource State Surveys Received
SBDC Client Contacts Received
Response Rate
of Total SBDC Clients
SBDC OK 63 266 24 12 SBDC OR 80 264 30 16 SBDC PA 253 948 27 49 SBDC PR 62 294 21 12 SBDC RI 14 45 31 03 SBDC SC 66 309 21 13 SBDC SD 11 55 20 02 SBDC TN 98 438 22 19 SBDC TX 210 1190 18 41 SBDC UT 56 180 31 11 SBDC VI 5 10 50 01 SBDC VT 13 48 27 03 SBDC VA 151 546 28 30 SBDC WA 149 423 35 29 SBDC WV 24 138 17 05 SBDC WI 117 378 31 23 SBDC WY 12 39 31 02
Totals 5113 20956 1000
SCORE Clients
SCORE Client of Total Surveys Contacts Response SCORE
ED Resource State Received Received Rate Clients SCORE AL 12 99 12 03SCORE AK 0 2 0 00SCORE AZ 113 565 20 25SCORE AR 30 149 20 07SCORE CA 416 2571 16 94SCORE CO 137 484 28 31SCORE CT 161 791 20 36SCORE DC 19 93 20 04SCORE DE 41 211 19 09SCORE FL 309 1619 19 70SCORE GA 62 446 14 14
SCORE HI 26 77 34 06SCORE ID 24 99 24 05SCORE IL 154 994 15 35SCORE IN 73 403 18 16SCORE IA 36 162 22 08
SCORE KS 16 80 20 04SCORE KY 68 335 20 15SCORE LA 19 118 16 04SCORE ME 48 179 27 11
128
Office of Entrepreneurial Development
ED Resource State Surveys Received
SCORE Client Contacts Received
Response Rate
of Total SCORE Clients
SCORE MD 74 374 20 17SCORE MA 164 781 21 37SCORE MI 108 431 25 24SCORE MN 135 626 22 30SCORE MS 2 20 10 00SCORE MO 49 257 19 11SCORE MT 14 52 27 03SCORE NE 15 108 14 03SCORE NV 64 487 13 14SCORE NH 86 334 26 19SCORE NJ 90 467 19 20SCORE NM 31 111 28 07SCORE NY 268 1368 20 60SCORE NC 180 724 25 41SCORE ND 14 67 21 03SCORE OH 225 951 24 51SCORE OK 14 63 22 03SCORE OR 119 588 20 27SCORE PA 254 1081 23 57SCORE RI 13 79 16 03SCORE SC 87 413 21 20SCORE SD 3 14 21 01SCORE TN 68 354 19 15SCORE TX 209 1093 19 47SCORE UT 35 100 35 08SCORE VT 27 116 23 06SCORE VA 112 450 25 25SCORE WA 118 571 21 27SCORE WV 5 24 21 01SCORE WI 97 398 24 22
SCORE WY 0 2 0 00
Total 4444 21981 1000
Impact Study of Entrepreneurial Development 129Resources ndash 2010-2011
WBC Clients
ED Resource State Surveys Received
WBC Client Contacts Received
Response Rate
of Total WBC Clients
WBC AL 28 105 27 48WBC AK 1 4 25 02WBC AS 0 9 0 00WBC AZ 1 18 6 02WBC CA 91 518 18 154WBC CO 4 45 9 07
ED Resource State Surveys Received
WBC Client Contacts Received
Response Rate
of Total WBC Clients
WBC CT 4 35 11 07WBC DC 17 91 19 29WBC DE 4 19 21 07WBC FL 15 78 19 25WBC GA 7 50 14 12WBC IL 11 103 11 19WBC IN 30 173 17 51WBC IA 3 15 20 05WBC KS 12 64 19 20WBC LA 8 79 10 14WBC ME 12 42 29 20WBC MD 21 66 32 36WBC MA 3 18 17 05WBC MI 23 123 19 39WBC MN 9 35 26 15WBC MO 7 37 19 12WBC MT 16 49 33 27WBC NE 8 34 24 14WBC NV 8 48 17 14WBC NM 15 74 20 25WBC NY 43 147 29 73WBC NC 77 480 16 131WBC OH 1 30 3 02WBC OK 9 18 50 15WBC PA 9 48 19 15WBC PR 5 32 16 08WBC RI 4 18 22 07WBC SC 2 10 20 03WBC TN 5 10 50 08WBC TX 28 172 16 48WBC UT 7 27 26 12WBC VT 5 20 25 08WBC VA 6 10 60 10WBC WA 12 85 14 20WBC WV 2 10 20 03WBC WI 16 105 15 27WBC WY 0 8 0 00
Total 589 3162 1000
Office of Entrepreneurial Development
Impact Study of Entrepreneurial Development 130Resources ndash 2010-2011
Office of Entrepreneurial Development
Total ED Resources Clients
Total ED Resources of Total Client ED
Surveys Contacts Response Resources ED Resource State Received Received Rate Clients Total ED Resources AL 118 546 22 12 Total ED Resources AK 10 54 19 01 Total ED Resources AS 2 17 12 00 Total ED Resources AZ 185 979 19 18 Total ED Resources AR 84 356 24 08 Total ED Resources CA 1034 5682 18 102 Total ED Resources CO 242 859 28 24 Total ED Resources CT 240 1064 23 24 Total ED Resources DC 48 229 21 05 Total ED Resources DE 61 290 21 06 Total ED Resources FL 559 2930 19 55 Total ED Resources GA 249 1127 22 25 Total ED Resources GU 3 9 33 00 Total ED Resources HI 49 170 29 05 Total ED Resources ID 50 199 25 05
Total ED Resources IL 373 2054 18 37 Total ED Resources IN 227 1046 22 22 Total ED Resources IA 110 399 28 11 Total ED Resources KS 82 351 23 08 Total ED Resources KY 145 647 22 14 Total ED Resources LA 111 542 20 11 Total ED Resources ME 85 318 27 08 Total ED Resources MD 188 845 22 19 Total ED Resources MA 271 1288 21 27 Total ED Resources MI 388 1319 29 38 Total ED Resources MN 243 1041 23 24 Total ED Resources MS 45 242 19 04 Total ED Resources MO 147 675 22 14 Total ED Resources MT 52 170 31 05 Total ED Resources NE 51 270 19 05 Total ED Resources NV 111 688 16 11 Total ED Resources NH 103 430 24 10 Total ED Resources NJ 233 1115 21 23 Total ED Resources NM 86 326 26 08 Total ED Resources NY 632 2966 21 62 Total ED Resources NC 441 1825 24 43 Total ED Resources ND 22 116 19 02 Total ED Resources OH 411 1852 22 41 Total ED Resources OK 86 347 25 08 Total ED Resources OR 199 852 23 20 Total ED Resources PA 516 2077 25 51 Total ED Resources PR 67 326 21 07
Impact Study of Entrepreneurial Development 131Resources ndash 2010-2011
Office of Entrepreneurial Development
ED Resource State Surveys Received
Total ED Resources Client Contacts Received
Response Rate
of Total ED Resources Clients
Total ED Resources RI 31 142 22 03 Total ED Resources SC 155 732 21 15 Total ED Resources SD 14 69 20 01 Total ED Resources TN 171 802 21 17 Total ED Resources TX 447 2455 18 44 Total ED Resources UT 98 307 32 10 Total ED Resources VI 5 10 50 00 Total ED Resources VT 45 184 24 04 Total ED Resources VA 269 1006 27 27 Total ED Resources WA 279 1079 26 27 Total ED Resources WV 31 172 18 03 Total ED Resources WI 230 881 26 23
Total ED Resources WY 12 49 24 01
Total 10146 46099 1000
Impact Study of Entrepreneurial Development 132Resources ndash 2010-2011

Office of Entrepreneurial Development
[This page is intentionally left blank for two-sided printing]
Impact Study of Entrepreneurial Development 2Resources ndash 2010-2011
Office of Entrepreneurial Development
I INTRODUCTION
The US Small Business Administrationrsquos (SBA) Office of Entrepreneurial Development (ED) designed a multi-year time series study to assess the impact of the face-to-face counseling programs it offers to small businesses This study has examined clients who received face-to-face counseling services starting in 2003 The SBA initiated this study as part of the Office of Management and Budgetrsquos (OMB) Program Assessment Rating Tool (PART) SBA contracted with Concentrance Consulting Group to assist in administering the study to analyze the findings and to write this report This report is the eighth report1 in the study and presents the findings from three separate study groups each year This yearrsquos study group includes 2010 clientsrsquo initial attitudinal assessment of their counseling experience and a follow-up with 2009 and 2008 clients to assess the financial impact of the received assistance2
Study Year 2009 Study Year 2010 Study Year 2011
2008 Clients Initial survey First follow-up Second follow-up
2009 Clients Initial survey First follow-up
2010 Clients Initial survey
Study Year 2009 Study Year 2010 Study Year 2011
This study measures attitudinal assessments perceptions of changes in managementmarketing practices and business growth for firms that utilized SBArsquos ED Resource Partnersrsquo face-to-face counseling during the late summer or early fall of 2008 2009 or 2010 The ED Resource Partners include Small Business Development Centers (SBDC) SCORE and Women Business Centers (WBC)
This report includes Executive Summary Methodology
o Research Questions o Sampling data collection response rate and survey administration o Data analysis and analysis of non-response o Follow-up o Limitations
Findings Initial economic impact study o Impact of total ED Resources (2008 - 2009 - 2010) o Regression analysis o Impact of SBDC resources 2010 o Impact of SCORE resources 2010 o Impact of WBC resources 2010 o Quantitative analysis overview o Qualitative analysis of collected client comments
Findings Follow-up study of 2008 and 2009 ED Resource clients Recommendations for further research
1 Each ED Resource final report can be found at httpwwwsbagovaboutsbasbaprogramsedindexhtml 2 For information on 2003 2004 2005 2006 and 2007 clients please see previous reports
Impact Study of Entrepreneurial Development 3Resources ndash 2010-2011
Office of Entrepreneurial Development
The appendix includes the distribution of responses for each survey question sample survey instruments additional regression results and distribution of responses for each ED Resource by state
[This page is intentionally left blank for two-sided printing]
Impact Study of Entrepreneurial Development 4Resources ndash 2010-2011
Office of Entrepreneurial Development
II EXECUTIVE SUMMARY
The US Small Business Administrationrsquos (SBA) Office of Entrepreneurial Development designed a study to assess the impact of its Entrepreneurial Development (ED) Resource Partnersrsquo face-to-face counseling assistance on small business clients and contracted Concentrance Consulting Group to conduct the study Thus far the study has examined ED Resource Partner clients that received face-to-face counseling assistance in 2003 and clients from each subsequent year up to and including the present study of 2010 clients This latest report presents the findings of the initial attitudinal impact study of 2010 ED Resource Partner clients and a follow-up study showing the financial impact on 2009 and 2008 clients Within the report all references to ED Resource Partner clients pertain to ED Resource Partnerrsquos face-to-face counseling clients who received assistance from a designated ED Resource Partner ED Resource Partner Clients Studied Concentrance studied the outcomes of three ED Resource Partners Small Business Development Centers (SBDC) SCORE and Women Business Centers (WBC)
Within each ED Resource Partner we studied three small business client segments including Nascent - Those individuals who have taken one or more positive steps to start a business Start-up - Those individuals who have been in business one year or less and In-Business ndash Those individuals who have been in business more than one year and are
classified as small by the SBA For the 2010 clients who responded to the initial impact study we analyzed demographic characteristics perceived usefulness of assistance and initial impact on businesses We also assessed the survival rates and financial growth of 2009 and 2008 clients Quantitative Findings (Initial Impact Study 2010 Clients)
Concentrance collected coded and analyzed data for 10146 ED Resource clients for an overall response rate of 23 This yearrsquos survey comprised the largest sample and achieved the greatest number of respondents since the inception of the study The table below provides the number of respondents and response rates for each ED Resource
Resource Center
Stratified Sample Size
Usable Sample
Size3
Surveys Received via Web
Surveys Received via Phone
Total Surveys
Received
Response Rate 2010
Clients SBDC 21514 20329 4183 930 5113 25 SCORE 22002 21521 3513 931 4444 21 WBC 3229 3021 450 139 589 20 Total 46745 44871 8146 2000 10146 23
Resource Center
Stratified Sample Size
3 The usable sample size includes the stratified sample minus surveys noted as undeliverable by web or phone due to incorrect contact information The accuracy and completeness of the contact information for clients provided by ED Resource offices was much improved for 2010 clients compared to previous years
Impact Study of Entrepreneurial Development 5Resources ndash 2010-2011
Office of Entreprreneurial DDevelopm ment
The figurre below illusstrates the buusiness segmeent composittion of each ED Resourcce
Distribbution of Responddents by SSegment t (2010 Cllients)4
nn = 10146
NNascent 1143 1306 1880
SStart-up 929 920 1111
B In-
Business 3003 2175 2993
Total 5113 4444 5889
CClient Year Stratified d Sample Si ize
Usea able Sample e Size
Follo ow-up p
Surveys s Received in n 2008
Response Rate
2008 854 854 2nnd 200 23
2009 8493 84993 sst 1 11968 23
The 20088 clients weree resurveyed in 2011 to deetermine finaancial impactt after two yeears in terms of financial ggrowth and ffirm survivall rates Theirr response raate was 23 equal to the previous yeaarrsquos study Thhe 2009 cliennts were also resurveyed aat this time too determine financial imppact and firmm survival rrates after onne year The response ratee for this grooup was also 23 the higghest responnse rate sincee the inceptioon of the studdy for a first follow-up grroup
4 Respondeents (86) who reeported being in business butt who did not pprovide a valid sstart date for thhat business weere not assigned too a business segmment Therefoore percentagess of clients in eaach business se egment may nott equal 100
Impact S tudy of Entrepren neurial Develop pment Resource es ndash 2010-2011 1
6
Office of Entreprreneurial DDevelopm ment
FY2011 0 SBDC SCCORE and WBC clientt s all reporte ed lower rev venues than those serve ed in the previous yee ar SBDC continues too serve the c clients with h the highest t average revenuu es ($774000 0) followedd by SCOREE ($502000) ) and WBC C ($171300)
Average eemployment llevels for SBBDC SCOREE and WBC cclients all felll from 2009 levels
Impact S tudy of Entreprenn eurial Developp ment Resourcee s ndash 2010-2011 1
7
RRev 2008 $6340000 $818400 $229500
RRev 2009 $8553000 $728400 $311200
RRev 2010 $7740000 $502000 $171300
Emmpl 2008 7 7 5
Emmpl 2009 7 6 4
Emmpl 2010 5 3 3
f
t
ED D Resource es served a ddiverse clien nt base in 20 010 similar tto past yearrs regarding g de emographic and busine ess characte eristics
Office of Entreprreneurial DDevelopm ment
The tootal ED Resoource client bbase consisteed of Femalle (36) Malle (36) firmms with MMale and Femmale owners (17) White (68) BlackAfrican AAmerican (111) Veteraan (9) Servvice-disabledd Veteran (2) HispanicLatino (7)) Asian (4)) Ameriican IndianNNative Alaskkan (2) andd Native HawwaiianPacifific Islander (11)5
The percentage of firms ownedd by White aand Veteran clients has ddecreased fromm the prrevious year66 Male and FFemale ownerrs is a new caategory for thhe 2011 studdy whichh partially expplains the deccrease in bothh the Femalee and Male ddemographicss
For 20010 the greatest percentaage of busineess owners (228) were beetween the agges of 45-54 Those bbetween the aages of 35-444 made up 222 of clientss Twenty peercent consissted of clients between thhe ages of 55--64 down thhree percentaage points froom last yeear7 Clients 225-34 were 113 of the tootal ED Resoource client bbase8
The mmost often citted primary bbusiness induustries for 20009 clients re emained the ssame as in ppast years seervice (14) and retail (11) The prrevalence of the service aand retail iindustry categories have rremained levvel over the ppast year howwever manuffacturing connsulting andd health care have all decrreased by appproximately oone percenntage point aand ldquootherrdquo hhas increasedd by three perrcentage poinnts
Firms owned by mmen reported revenues onn average more than twicce as high as those owned by w omen Reveenues for botth groups felll over the paast year The highesst average revvenues by racceethnicity were reporteed by HispannicLatinos followwed by Whitee and Asian fifirms Averagge revenues for every racceethnicity experiienced decreaases especiallly Native HaawaiianPaciific Islanders Veterans experiienced increaases in averagge revenues wwhile Servicee-disabled V eterans reporrted lower revenues thaan the previoous year
FY Y2010 client s gave lowe er ratings (73 3) than th he previous y yearrsquos respo ondents (75 5) to the u usefulness o of the assistaance they re eceived Th he effect of c counseling as sistance on the clientrsquos ability to d develop a bu usiness plan (35) mar rketing pla an (30) ha as remained d relatively c consistent ac cross past st tudies
5 These 20110 demographicc distributions wwere comparedd to the nationaal averages fromm the 2007 Survvey of Businesss Owners froom the US Cennsus Bureau (SBBO) The totall ED Resource s demographic distribution waas compared too the national averages from thee SBO The d isstribution was ccomparable acrross characterisstics except for the following SSBO figures White business ow wners were 83 of the small bbusiness popul lation Female b business ownerrs were 29 MMalebusiness owwners were 51 and BlackAffrican Americann business ownners were at 7 6 Just over 16 of survey respondents diid not answer thhe race questio ons whereas 455 answered laast year Thereffore the drop inn in the numberr of Whites mayy be due to nonn-responses andd not reflective of the actual p opulation 7 Eleven peercent of surveyy respondents ddid not respondd to the age queestion for this yyearrsquos study Laast year only twwo percent didd not respond This may explaain some of thee variation betwween this yearrsquos study and the 22010 study 8 The total ED Resources age distributio n was compareed to the nationnal averages fromm the SBO The distribution was comparablee except that 655+ was reportedd at 125 (commpared to 5 ffor total ED Reesources)
Impact S tudy of Entrepren neurial Develop pment Resource es ndash 2010-2011 1
8
Office of Entreprreneurial DDevelopm ment
Usefulness ratings also include the financiall impact of aassistance on hiring new sstaff (11) retaining cuurrent staff (115) increasing profit mmargin (22) and increasiing sales ((25) The rratings for alll categories hhave gone doown from thee previous yeear
Laa rger firms rr eported higg her levels oo f perceived d usefulness of ED Reso ource as sistance thaa n did smalll er firms F irms that re eceived less than 3 hour rs of as sistance repp orted lowerr levels of pee rceived use efulness tha an firms with h 3 or m ore hours off counselingg
Total ED Resourc ce clients that t received 3 o or more hour rs of counsel ling reported d 76 o of the time th hat counselin ng was useful l versus 69 for clients t that received d less than 3 3 hours of co ounseling
There were no diff ferences in q quality of cou unseling expe erience basedd on businesss segme ent ED Reso ource or geog graphic locatti ion
There were no sign nificant effec cts of clientrsquos s age gender veteran stat tus or ethnic city on per rceived usefu ulness How wever Americ can IndianA Alaskan Nativ ve and White e clients s reported sig gnificantly hi igher perceiv ved usefulnes ss No other significant differe ences based o on race were e found
All though clie nt reported perceptionss of each EDD Resourcee were largelly similar th ere were somm e key diffee rences
For SC CORE client ts 55 repor rted the perc ceived reputa ation of SCO ORE led to th heir decisio on to seek EDD Resource assistance co ompared to 4 44 for SBD DC clients an nd 40 f for WBC clie ents
Appro oximately 39 of WBC S Start-ups and d 42 of WB BC In-Busine ess clients report ted that assist tance they re eceived result ted in increas sed sales com mpared to 25 5 and 33 3 respectiv vely for SCOR RE clients an nd 33 and 37 for SBD DC clients respec ctively
For W WBC clients 3 38 of Start t-ups reporte d that they d decided to go o into busines ss as a resul lt of assistan ce compared d to 33 for SBDC and 3 30 for SCO ORE This tr rend w l l
as a so apparent for Nascent clients
Fi irms in the I In-Business s segment a and larger fir rms were le ss likely to r report that th heir decision n to start a b business wa s the result of ED Reso ource assista ance
Twentty-five percennt of Nascennt clients andd 32 of Starrt-up clients reported thaat their ddecision to sttart a businesss was the ressult of ED RResource assistance
Impact S tudy of Entrepren neurial Develop pment Resource es ndash 2010-2011 1
9
Office of Entreprreneurial DDevelopmment
Consistent with thhe previous yeearrsquos results larger firms firms in the In-Businesss segmeent and SCORRE clients wwere significanntly less likelly to report thhat their decisioons to start bbusinesses weere the resultt of the ED RResource asssistance they received
Fii ndings fromm an analys is of follow--up surveys of 2008 and d 2009 client ts suggest buu sinesses thh at received ED Resourr ce assistan nce have a hi igher surviv val rate thh an other smm all business ses in the PP SED II Th he survival r rate after tw wo years ww as 93 for ED Resourr ce clients cc ompared to o 80 for fir rms in the P PSED II
Appro oximately 57 of 2008 N Nascent client ts had transit tioned to the e In-Business s segme ent after two years while 29 of 200 09 Nascent cl lients had go one into busin ness after o one year On nly six percen nt of 2008 of f In-Business s clients and three percen nt of 2009 c clients went o out of busine ess by 2010
In the e second follo ow-up of 200 08 clients fir rms receiving g 3 or more h hours of couns eling had hig gher survival rates than th hose who rec ceived less th han 3 hours oof couns eling
A com mparison of tthe difference e in growth r rates for SBA A ED Resour rce clients wi ith GDP the Private C Company In ndex (PCI) an nd the Stand dard and Poo orrsquos SmallCap p 600 Index from 2009 t to 2010 show ws that SBA E ED Resource e clients outp paced the oth her bench hmarks with a a difference o of 134 perce entage points s over five p percentage po oints more than the nex xt highest find ding9 Altho ough all three e benchmarks s indicated positiv ve growth du uring this tim me SBA ED R Resource clie entsrsquo progres ssed more rap pidly
9 T ee uu rr EE aa rrhttpwwwwbeagovnationalxlsgdpchhgxls the Privaate Company Inndex (PCI) - puublished by Enttrex this index measures reevenue performmance in the secctor of private ccompanies rangging from $3 mmillion to $60 mmillion in annuall revenues (hhttpwwwpriivatecompanyinndexcom) and the S amp P SmaallCap 600 Indeex - represents approximately 3 of the US maarket and incluudes 600 lsquosmall caprsquo companiess with market ccapitalizations bbetween $300 mmillion and $2 bbillion
he thre benchmarks sed for compa ison of SBA D Resources re GDP - Sou ce
Impact S tudy of Entrepren neurial Develop pment Resource es ndash 2010-2011 1
10
Office of Entrepreneurial Development
Qualitative Findings
A few clients from each ED Resource provided ad hoc commentaries in emails with their survey instrument
Comments were both positive and negative for each ED Resource
Recommendation for Further Research
An additional study could examine the effects of different types of financing (eg SBA Guarantee Loan vs SBA Disaster Loan) on perceived improvements survival and business growth
Methodology
The initial impact study of 2010 clients was quantitative in nature based upon responses to web surveys Statistical analyses utilized frequency distributions average comparisons cross tabulations and regression models This yearrsquos study computed revenue and employment data using means rather than medians which were the bases of previous yearsrsquo studies Given wide fluctuation and disparity in revenue and employment among small businesses using mean comparisons is a more informative measure
The survey of clients resulted in a respondent sample of 10146 clients ED Resources provided a random sample list of 46745 clients served during the late summer or early fall of 2010 Concentrance sent web surveys to ED Resource face-to-face counseling clients via email We sent reminder emails each week for four weeks after the initial emailing Phone surveys were attempted for clients who did not respond to web surveys According to statistical tests there was no evidence of bias due to non-response
Concentrance used regression analyses to test for the impact of client demographics on client perceptions of ED Resource assistance outcomes Each regression model examined the impact of selected demographic characteristics (age gender race ethnicity and veteran status) and firm characteristics (size business segment ED Resource geographic location and hours of assistance) on a particular resource impact These impacts included perceived usefulness of ED Resource assistance perceived impact on the decision to start a business and perceived impact on sales
The respondent sample for the second follow-up survey of 2008 clients was 200 The respondent sample for the first follow-up of 2009 clients was 1968 A matched sample was used to perform pair-wise statistical tests that compared changes in growth and business segment to other benchmarks Revenue and employment growth for ED Resource clients were examined by comparing SBA data to that of the Panel Study of Entrepreneurial Dynamics II10 (PSED II) the Private Company Index and the SampP SmallCap 600 Index
10 The Panel Study of Entrepreneurial Dynamics II is a nationwide multi-million dollar survey of nascent entrepreneurs funded by the Kauffman Foundation The primary purpose of the study is to identify adults active in business creation obtain detailed information about the start-up effort and perform follow-up interviews to determine outcomes We rely on the PSED I and PSED II as benchmarks however results must also be interpreted with caution due to potential response bias and definitional differences in the ways that firms are classified
Impact Study of Entrepreneurial Development 11Resources ndash 2010-2011
Office of Entrepreneurial Development
Limitations to consider when interpreting these results include
Measures of ED Resource impacts are attitudinal and are self-reported by the client
Many respondents did not report revenue data
Estimates of firm survival and growth over time should be interpreted with caution Due to attrition firms that have gone out of business may be under represented
Impact Study of Entrepreneurial Development 12Resources ndash 2010-2011
Office of Entrepreneurial Development
III METHODOLOGY
This report contains findings from the initial impact study of face-to-face ED Resource counseling clients from 2010 and a follow-up study of the 2008 and 2009 clients that participated in initial impact studies in previous years11 The methodology for the initial impact study for 2010 clients is presented first followed by the methodology for the 2008 and 2009 client follow-up study The initial impact study reports clientsrsquo attitudinal assessments of their counseling experience and the follow-up study reports the long-term financial impact of assistance on client firms
Research Questions The following questions are the focus of this study and are addressed in the findings section of this report The last two questions numbers six and seven are addressed in the follow-up study which comprises time series analysis of multi-year data
1 What is the demographic financial and business profile of firms who utilize ED Resources
2 Is there a relationship between the servicesassistance provided by ED Resources (SBDC SCORE and WBC) and the clientrsquos perception of the usefulness and value of the servicesassistance received
3 Is there a relationship between the servicesassistance provided by ED Resources and the clientrsquos decision to start a business
4 Is there a relationship between the servicesassistance provided by ED Resources (SBDC SCORE and WBC) and the clientrsquos decision to implement andor change management andor marketing practices in their business
5 Are the servicesassistance provided by ED Resources (SBDC SCORE and WBC) having an impact on the clientrsquos financial position in terms of job creation job retention and sales
Follow-up study of 2008 and 2009 ED Resource clients
6 Based on a comparison of the total ED Resources with the Panel Study of Entrepreneurial Dynamics II (PSED II)12 what is the impact of ED Resource assistance on firm survival
What was the rate of transition of Nascent and Start-up firms to the In-Business segment
11 All references to ED Resource clients pertain to ED Resource Partnersrsquo face-to-face counseling clients who received assistance from a designated ED Resource Partner (SBDCSCOREWBC) 12 The Panel Study of Entrepreneurial Dynamics II is a nationwide multi-million dollar survey of nascent entrepreneurs funded by the Kauffman Foundation The primary purpose of the study is to identify adults active in business creation obtain detailed information about the start-up effort and perform follow-up interviews to determine outcomes We rely on the PSED I and PSED II as benchmarks however results must also be interpreted with caution due to potential response bias and definitional differences in the ways that firms are classified
Impact Study of Entrepreneurial Development 13Resources ndash 2010-2011
Office of Entrepreneurial Development
7 What is the financial impact of servicesassistance provided by ED Resources as a whole in terms of job creation job retention and sales
How does the difference in growth rate of ED Resource clients from 2009 to 2010 compare with selected growth benchmarks such as the gross domestic product (GDP)13 and Standard amp Poorrsquos SmallCap 600 Index14 and the Entrex Private Company Index (PCI)15
Sampling and Data Collection
This study examines the effects of SBA ED Resource assistance on client firms by respective ED Resource and by clients in the following various stages of business formation Nascent - Individuals who have taken one or more steps to start a business Start-up - Individuals who have been in business one year or less In-Business ndash Individuals who have been in business more than one year and are classified as
small by the SBA
The initial impact study of 2010 clients was quantitative in nature based upon responses to web and telephone surveys The responses provided a statistically significant sample for each ED Resource To determine if the sample size for this study was sufficient Concentrance tested the sample size on the basis of reported sales revenues The initial sample of 2010 clients is sufficiently large enough for accuracy within plus or minus $98861 in reported annual sales revenues at a 99 confidence level16
Table 31 on the following page depicts the distribution of surveys across ED Resource and the response rates by ED Resource The overall response rate was 23 which is comparable to the response rates found in other surveys of entrepreneurs For example Aldrich and Baker (2000) found that nearly a third of surveys of entrepreneurs had response rates below 2517 In another example the National Federation of Independent Business (NFIB) had a response rate of 20 in its Small Business Economic Trends survey conducted in June of 201018
13 Source httpwwwbeagovnationalxlsgdpchgxls 14 The S amp P SmallCap 600 Index - represents approximately 3 of the US market and includes 600 lsquosmall caprsquo companies with market capitalizations between $300 million and $2 billion The SampP SmallCap 600 Index is a commonly used benchmark for growth 15 The Private Company Index (PCI) - published by Entrex this index measures revenue performance in the sector of private companies ranging from $3 million to $60 million in annual revenues (httpwwwprivatecompanyindexcom) 16 This assumes a normal distribution of annual revenues with a standard deviation of $2324497 17 Aldrich Howard E and Ted Baker (2000) ldquoBlinded by the Cites Has there been any progress in entrepreneurship researchrdquo in Entrepreneurship 2000 ed Donald L Sexton and Raymond L Smilor Chicago Upstart Publishing p 377-400 18 William K Dunkelberg and Holly Wade ldquoNFIB Small Business Economic Trendsrdquo NFIBcom July 2010 lthttpwwwnfibcomPortals0PDFsbetsbet201007pdfgt
Impact Study of Entrepreneurial Development 14Resources ndash 2010-2011
Office of Entrepreneurial Development
Table 31 ndash Sampling Frame
Resource Center
Stratified Sample Size
Usable Sample Size 19
Surveys Received via Web
Surveys Received via Phone
Total Surveys
Received
Response Rate 2010
Clients SBDC 21514 20329 4183 930 5113 25 SCORE 22002 21521 3513 931 4444 21 WBC 3229 3021 450 139 589 20 Total 46745 44871 8146 2000 10146 23
Survey Administration Following a successful pilot test of web-based survey administration for the 2008-2009 impact study of ED Resources Concentrance adopted web-based survey administration as the primary technique for this study This delivery mechanism has provided greater efficiency with regard to increasing the number of completed surveys for ED Resource clients ED Resources drew a random sample of clients served during the late summer or early fall of 2010 based on a random sample table provided to each ED Resource See Appendix 4 for the survey instrument Via email Concentrance sent selected clients SBA cover letters and an invitation to take a web-based OMB approved survey We sent reminder emails each week for four weeks after the initial emailing We logged-in all received surveys entered the survey data into a database for analysis and developed an electronic database list of non-respondents for a telephone follow-up survey All surveys were assigned a computer-coded with client codes to facilitate unique identification of each client for follow-up surveys while ensuring privacy
19 The usable sample size includes the stratified sample minus surveys noted as undeliverable by web or phone due to incorrect contact information The accuracy and completeness of the contact information for clients provided by ED Resource offices was much improved for 2010 clients as compared to previous years
Impact Study of Entrepreneurial Development 15Resources ndash 2010-2011
Resource Center
Stratified Sample Size
Usable Sample Size 19
Office of Entreprreneurial DDevelopm ment
Figure 311 shows the distribution oof survey resspondents byy respective EED Resourcee and businesss segment The In-Bussiness segmeent was the laargest segmennt served forr all resourcees The Startt-up segment iis smaller thaan the other segments in part becausee of the narroow definitionn of Start-upss (firms thaat have been in business ffor one year or less)
)20Figure 31 ndash Disstributionn of Resppondents by Segmment (2010 clients)
nn = 10146
Naascent 1143 1306 1800
Staart-up 929 920 111
In-Business
3003 2175 2933
Total 5113 4444 5899
20 Responddents (86) who rreported being in business buut who did not pprovide a valid start date for thhat business wwere not assigneed to a businesss segment Theerefore percenttages of clients iin each businesss segment mayy not equal 100
Impact S tudy of Entrepren neurial Develop pment Resource es ndash 2010-2011 1
16
Office of Entrepreneurial Development
Data Analysis
Analyses included the following methods basic descriptive statistics frequency distributions cross tabulations and regression Concentrance used basic descriptive statistics for continuous variables such as annual sales revenues We used frequency distributions for Likert scales and respondents answered on a scale of 1 to 5 Cross-tabulations were used to compare responses across ED Resources business segments and hours of counseling received Finally Concentrance used multiple regression analyses to test for differences in key outcomes such as perceived usefulness or financial impact of ED Resource assistance based on demographic or firm characteristics We selected these analyses to meet the objectives of each research question and to facilitate interpretation of findings For this yearrsquos study revenue and employment calculations were completed using mean data instead of median data which was utilized for previous yearsrsquo studies
Analysis of Non-Response
SBArsquos research plan for this study included a methodology for estimating potential non-response bias Non-response bias can occur in survey research if respondents differ substantially from those that do not respond The best way to protect against this bias is to improve the response rate An effective method for achieving high response rates is the use of follow-ups and reminders In this study non-response bias was minimized by sending four reminder emails containing a link to the survey and minimized further by telephone follow-ups to non-respondents
We assessed the extent and direction of potential non-response bias by comparing the characteristics of clients who responded to the internet survey with those who did not Of the 10146 total clients surveyed 8146 were surveyed over the web The remaining clients (2000) were surveyed over the phone Clients surveyed over the phone were more likely to report revenue and employment figures Additionally these results hold when other respondent characteristics are controlled for (ED Resource Business Segment and Hours of Counseling Received)21
The next step was to conduct a comparative analysis of the responses between these groups to determine if the difference in response rates would have an impact on our analyses Results of regression analyses revealed no significant differences between these groups in terms total number of employees There was a significant difference in revenue found between phone and web respondents However only a very small portion of the total variance in revenue (02) is explained by this difference 22
21 These findings were based on results of four logistic regression analyses to determine whether web versus phone respondents differed significantly in terms of missing revenues and missing employment data The models were significant at the plt0001 level and the variable indication phone response was always significant at the plt0001 level 22 These findings were based on results of a regression analysis to determine whether web versus phone respondents differed significantly in terms of number of employees where a positive number of total employees are reported A scheffe test reveals no significant difference between phone and web at the 010 level The t-test associated with the regression analysis reveals a non-significant result (t=-161 p=01075) A second regression was performed to determine whether web versus phone respondents differed significantly in terms of reported sales revenues greater than or equal to 1000 A scheffe test for this difference revealed a significant difference between phone and web at the 005 level The t-test associated with the regression analysis reveals a significant result also (t=256 p=00106) The R-square value associated with this model is 0002
Impact Study of Entrepreneurial Development 17Resources ndash 2010-2011
Office of Entrepreneurial Development
Additionally the difference in phone and web respondents was tested against perceived service usefulness Although a significant difference in the service variate was found only a small portion of the variance of each of the service measures can be explained by the difference between phone and web respondents Similar results were found with the perceived value of the information the respondents received 23 Because the evidence of response bias is minimal the phone and web respondents were pooled in subsequent analyses Follow-up Study 2008 and 2009 ndash Sampling Data Collection and Analysis of Non-Response A follow-up study was conducted of both 2008 and 2009 clients in order to evaluate the financial impact on these groups one year and two years after they were counseled by ED Resources There were 854 clients from 2008 that were contacted for a second follow-up in the beginning of 2011 Two-hundred clients responded to this second follow-up which represents a 23 response rate Each of these respondents had valid client codes that could be matched on a one-to-one basis with the initial impact survey respondents Thus for a sample of 200 clients there were detailed data which could be tracked for three years There were 8493 respondents to the initial impact survey of 2009 clients Of those contacted 1968 responded to the survey and provided detailed data that could be tracked for two years Table 32 shows the number of surveys received by total ED Resources and the total response rates
Table 32 ndash Follow-up Impact Study Clients
Client Year Stratified
Sample Size Useable
Sample Size Follow-
up Surveys Received
in 2008 Response
Rate
2008 854 854 2nd 200 23
2009 8493 8493 1st 1968 23
These matched samples were used to perform pair-wise statistical tests that compared changes in growth by business segment and by ED Resource Although there were a small number of observations available for this analysis these findings provide a more precise estimate of changes in revenues and employment over time than aggregate non-matched comparisons
23 These findings were based on results of two multivariate regression analyses and a series of simple linear regression analyses to determine whether web versus phone respondents differed significantly in terms of the reported perceived service usefulness and value of information received The Wilkesrsquo Lambda value is significant for both multivariate analyses indicating there is some linear combination of the perceived usefulness measures and perceived value of received information that is explained by the difference in phone vs web respondents The R-square values of the six individual measures of service and information predicted by the difference in phone vs web respondents was explored These values are range from 00084 to 00238
Impact Study of Entrepreneurial Development 18Resources ndash 2010-2011
Office of Entrepreneurial Development
Limitations
There are several limitations that should be considered when interpreting the results presented in this report These limitations are inherent in the research design and methodology
Measures included in this initial survey are primarily attitudinal and all items are self-reported Thus there are few objective measures that can be used to assess actual client performance or make comparisons with other data sources
Many respondents did not report revenue data which is critical to measuring growth from year-to-year For example out of Start-up and In-Business firms approximately 39 reported zero revenues or did not report revenues
Estimates of firm survival and growth over time should be interpreted with caution Due to attrition firms which have gone out of business may be under-represented
Impact Study of Entrepreneurial Development 19Resources ndash 2010-2011
Office of Entrepreneurial Development
[This page is intentionally left blank for two-sided printing]
Impact Study of Entrepreneurial Development 20Resources ndash 2010-2011
Office of Entrepreneurial Development
IV TOTAL ED RESOURCES 2008 - 2009 - 2010
The following section presents comparison results of face-to-face counseling clients from 2008 2009 and 201024 First the general demographic and financial characteristics of the total ED Resource clients are presented This is followed by additional findings on the impact of the total ED Resources on Nascent Start-up and In-Business firms organized by research question as follows
Is there a relationship between servicesassistance provided by ED Resources (SBDC SCORE and WBC) and the clientrsquos perception of the usefulness and value of servicesassistance received
Is there a relationship between the servicesassistance provided by ED Resources (SBDC SCORE and WBC) and the clientrsquos decision to start a business
Is there a relationship between the servicesassistance provided by ED Resources (SBDC SCORE and WBC) and the clientrsquos decision to implement andor change management andor marketing practices in their business
Are the servicesassistance provided by ED Resources (SBDC SCORE and WBC) having an impact on the clientrsquos financial position in terms of job creation job retention and sales
Please note that comparisons between the 2008 2009 and 2010 initial study clients should be interpreted with caution Concentrance collected cross-sectional data from a different set of firms each year and these firms were operating under different economic conditions To better understand changes over time the follow-up study included in this report tracks the same firms over a three year period
24 All references to ED Resource clients pertain to ED Resource Partnersrsquo face-to-face counseling clients who received assistance from a designated ED Resource Partner (SBDCSCOREWBC)
Impact Study of Entrepreneurial Development 21Resources ndash 2010-2011
Office of Entrepreneurial Development
Demographic Characteristics of ED Resource ClientsThis section describes the general demographic and financial characteristics of total ED Resource clients that were served in 2010 These results are based on an analysis of 10146 completed surveys As shown in Figure 41 the In-Business segment (54) was the largest business segment served by ED Resources in 2010 The size of the In-Business segment remained consistent with the previous year The Start-up segment increased for the third year in a row though the change is in part due to the revised definition of Start-up businesses
Figure 41 ndash Total ED Resources ndash Client Segments Served25
2008 n = 6770 2009 n = 8493 2010 n = 10146
The average annual revenue for ED Resourcesrsquo clients was $637200
Table 41 ndash Total ED Resources-Revenues and Employment26 (2010)
Total ED Resources
Average Revenue $637200
Average Employees 4
25 Respondents (86 for 2010) who reported being in business but who did not provide a valid start date for that business were not assigned to a business segment Therefore the total of client segments served for each year may not equal 100 26 Firms that reported revenues were required to do so within the range of $1000 to $25000000
Impact Study of Entrepreneurial Development 22Resources ndash 2010-2011
Total ED Resources
Rev 2008 $634000 $818400 $229500
Rev 2009 $855300 $728400 $311200
Rev 2010 $774000 $502000 $171300
Empl 2008 7 7 5
Empl 2009 7 6 4
Empl 2010 5 3 3
Office of Entrepreneurial Development
ED Resources continued to differ in terms of the size of firms they served as shown in Figure 42 Again this year SBDC continues to serve the highest revenue clients ($774000 average) followed by SCORE ($502000 average) and WBC ($171300 average) All three of ED Resourcesrsquo clients reported lower average annual revenues than those assisted in 2009 Average employment reported by SBDC SCORE and WBC clients was also lower than clients served in 2009 in all cases especially SCORE In terms of revenues WBC serves a distinct client base from both SBDC and SCORE however SBDC and SCORE do not serve distinct client bases in terms of revenue27
Figure 42 ndash Total ED Resources ndash Revenue and Employment (Average ED client Revenues and Number of Employees)
27 We used a Scheffe test to examine the pair-wise differences to control for the familywise error rate We found significant revenue differences (95 confidence) between WBC and SBDC as well as between WBC and SCORE groups No other significant differences were found
Impact Study of Entrepreneurial Development 23Resources ndash 2010-2011
Office of Entrepreneurial Development
Figure 42A examines the average revenues by the hours of counseling received28 to understand the relationship between client revenues and resource utilization The data shows that clients from SBDC SCORE and WBC that received a greater number of hours of counseling tended to be larger in size For example average revenues for SCORE clients who received less than 3 hours of counseling were $336400 while average revenues for clients who received 3 or more hours of counseling were $618300 This trend is also apparent with SBDC clients where the difference between clients that received 5 or more hours of counseling and those that received from 3 to less than 5 hours of counseling is $148700 The overall average revenues regardless of hours of counseling indicated by the black cross bars in the figure below were $774000 for SBDC 502000 for SCORE and 171300 for WBC
Figure 42A ndash Total ED Resources ndash Revenues by Hours of 29 Counseling
Aggregate Hours Mean Revenue
($502000)
($774000)
($171300)
($637200)
28 For each ED Resource the number of respondents is comparable for each category of hours of counseling received SBDC lt 3 hrs = 1668 ge 3 amp lt 5 hrs = 1668 ge 5 hrs = 1777SCORE lt 3 hrs = 2219 ge 3 hours= 2225WBC lt 3 hrs = 297 ge 3 hours= 292 29 SBDC reports hours of counseling in three categories (lt 3 ge3 to lt5 ge 5) whereas SCORE and WBC report two categories (lt 3 ge 3) SCORE and WBC also provide 5 or more hours of counseling to their clients and these hours are captured in the 3 or more hours of counseling category When comparing ED Resources by hours of counseling those clients receiving 3 or more hours of counseling from SBDC reported average revenues of $843500
Impact Study of Entrepreneurial Development 24Resources ndash 2010-2011
Office of Entrepreneurial Development
Figure 43 presents the demographic characteristics of ED Resource clients in terms of gender race ethnicity and veteran status30 A new category was added to the survey for this year For the first time clients were able to select ldquoMale and Female Ownersrdquo as an answer to the gender of the owner(s) question (See Appendix 4 for a complete survey instrument) Predictably both Male and Female categories dropped sharply from last yearrsquos numbers The proportions of the majority of the race and ethnicity categories have not changed from the previous year with the exception of a reduction in the number of Whites31 Figure 43 ndash Total ED Resources ndash Demographic Characteristics32
2008 n = 6770 2009 n = 8493 2010 n = 10146
30 The Veteran and Service-disabled Veteran categories are shown in the figure above Additional results for total ED Resource clients included Reservist (03) and National Guard Member (04) 31 Just over 16 of survey respondents did not answer the race questions whereas 45 answered last year Therefore the drop in in the number of Whites may be due to non-responses and not reflective of the actual population 32 Totals may not equal 100 due to non-respondents and respondents who selected multiple ethnicities The 2010 total ED Resources demographic distribution was compared to the national averages from the 2007 Survey of Business Owners from the Census Bureau (SBO) The distribution was comparable across characteristics except for the following SBO figures White business owners were 83 of the small business population Female business owners were 29 and Male business owners were 51
Impact Study of Entrepreneurial Development 25Resources ndash 2010-2011
Office of Entrepreneurial Development
Figure 44 shows the distribution of ED Resource clients by age of business owner The largest groups of ED Resource clients belonged to the 45 to 54 and 35 to 44 age categories 28 and 22 respectively This outcome is consistent with the previous years depicted in the figure Both the 18-24 and 25-34 age categories increased slightly from the previous year Differences in findings from the previous year may be due to an increased number of clients that did not respond to the corresponding survey question for age33
Figure 44 ndash Total ED Resources ndash Age of Business Owner34
2008 n = 6770 2009 n = 8493 2010 n = 10146
33 Survey questions can be found in the survey instrument in Appendix 4 q18 requests the clientsrsquo age Eleven percent did not respond to the age question for this yearrsquos study Last year only two percent did not respond 34 The 2010 total ED Resources age distribution was compared to the national averages from the SBO The distribution was comparable except that SBO reported 65+ at 125 (compared to 5 for ED Resources)
Impact Study of Entrepreneurial Development 26Resources ndash 2010-2011
Office of Entrepreneurial Development
As shown in Figure 45 the two highest reported business types besides ldquoOtherrdquo businesses served by ED Resources were the service and retail businesses35 These results are generally consistent with the national averages from the 2007 Survey of Business Owners (SBO) Results that were not consistent included Manufacturing reported in the SBO to be 2 Construction reported to be 13 and Health Care reported to be 936 Also the figure depicts the percentage of clients in the other category as having increased over the past three years
Figure 45 ndash Total ED Resources ndash Primary Business Type37
2008 n = 6770 2009 n = 8493 2010 n = 10146
35 The top 11 results for 2010 are displayed in the figure above Additional results included Finance Insurance and Real Estate (3) Education (3) Entertainment (2) Engineering (1) Transportation (1) Publishing (1) and Day Care (1) 36 Other findings that differed from SBO results included Finance Insurance and Real Estate (14) and Transportation (5) Industry classifications are not identical 37 Several groupings were found to be present among those respondents who classified their business type as ldquoOtherrdquo These included multiple responses for non-profits designart related professions and beauty related professions Due to non-responses the total for all business types may not equal 100
Impact Study of Entrepreneurial Development 27Resources ndash 2010-2011
Office of Entrepreneurial Development
Figure 46 depicts the reasons clients reported seeking business counseling from ED Resources Reputation and lowfree cost of service were the most common reasons for clients to seek assistance from ED Resources SBDC clients reported lowfree cost of service as the most common reason (50) but rated reputation of the ED Resource and referral as equally strong reasons (44) In contrast to the total ED Resources SCORE clients reported that reputation (55) was a stronger reason for seeking assistance than was lowfree cost of service (52) and WBC clients reported that referrals (44) were more often a reason for their seeking assistance as opposed to reputation (40)
Figure 46 ndash Total ED Resources ndash What led to your decision to seek business counseling from ED Resources38
n = 10146
38 The totals do not equal 100 due to respondents selecting multiple factors This figure compares results by individual ED Resource therefore corresponding figures are not repeated in the individual ED Resource sections of this report
Impact Study of Entrepreneurial Development 28Resources ndash 2010-2011
Office of Entrepreneurial Development
Resource Impacts
Usefulness and Value of Services or Assistance Received
As shown in Figure 47 below 73 of 2010 ED Resource clients reported that the information they received from their counselor was valuable
Figure 47 ndash Total ED Resources ndash How useful was the information you received39
2008 n = 6770 2009 n = 8493 2010 n = 10146
39 Low value includes the lsquoSomewhat Valuablersquo and lsquoNot Valuablersquo response categories High value includes the lsquoExtremely Valuablersquo and lsquoValuablersquo response categories Percentages will not total 100 due to non-response
Impact Study of Entrepreneurial Development 29Resources ndash 2010-2011
Office of Entrepreneurial Development
Figure 47A shows the perceived usefulness of ED Resources relative to the number of hours of counseling received recorded in two categories less than 3 hours and 3 or more hours For comparison the overall level of perceived usefulness is also provided in the figure but this segment does not distinguish usefulness by hours of counseling received
As illustrated below ED Resource clients who had three or more hours of counseling rated usefulness of ED Resources as ldquohighrdquo more often than those who had less than three hours of counseling40 Seventy-six percent of clients who received 3 or more hours of counseling rated the usefulness of total ED Resources as ldquohighrdquo versus 69 of those that received less than 3 hours of counseling
Figure 47A ndash How useful was the information you received Total ED Resources by Hours of Counseling vs Total ED Resources Aggregate Hours
40 This finding is supported by the regression analysis beginning on page 39
Impact Study of Entrepreneurial Development 30Resources ndash 2010-2011
Office of Entrepreneurial Development
Decision to Start a Business
Figure 48 depicts the perceived assistance of ED Resources with the clientrsquos decision to start a business These results are presented by individual ED Resource and total ED Resources Results for Nascent and Start-up firms are reported in each category41 Across SBDC SCORE and WBC the relationship between Nascent and Start-up clients remained consistent Start-up clients more often indicated that they decided to go into business as a result of the assistance they received from their respective ED Resource center than Nascent clients
Figure 48 ndash Total ED Resources ndash Did you decide to go into business as a result of the assistance you received42
n = 4589
41 The corresponding survey question for this figure asked ldquoIf you were not in business at the time you were assisted by the counselor did you decide to go into business as a result of that assistancerdquo Therefore In-Business clients were not observed because these clients were in business at the time they received counseling 42 This figure compares results by individual ED Resource therefore corresponding figures are not repeated in the individual ED Resource sections of this report
Impact Study of Entrepreneurial Development 31Resources ndash 2010-2011
Office of Entrepreneurial Development
Clientsrsquo Decision to Change Management Practices
As a result of ED Resource assistance for 2010 clients 57 of Start-up and 62 of In-Business firms changed their current management practices or strategies The percentage of Start-up firms reporting that they changed their management practices or strategies has decreased slightly over the past three years The frequency of In-Business firms reporting changes in management practices or strategies remained consistent from 2009
Table 42 ndash ED Resources Impact on Managerial Practices
Impact Study of Entrepreneurial Development 32Resources ndash 2010-2011
Changed Current Management PracticesStrategies
2008 Clients 2009 Clients 2010 Clients
Changed Current Management PracticesStrategies
2008 Clients 2009 Clients 2010 Clients
Start-up 60 59 57
In-Business 61 62 62
Office of Entrepreneurial Development
Figure 49 below reflects the percentage of firms reporting that ED Resource assistance led to the development of business plans marketing plans etc The frequency of ED Resource clients reporting they received assistance with a Web-based Strategy Financial Strategy Marketing Plan or Pricing Strategy has risen over the past three years of this study The Loan Package category has diminished steadily over the past three years from 12 in 2008 to 8 for 2010
Figure 49 ndash Total ED Resources ndash Assistance in Plan Development43
43 The 2010 results for the top 11 categories are displayed in the figure above Additional results for 2010 included hiring plan (5) purchasing strategy (4) production plan (4) training plan for staff (4) distribution plan (3) and international trade (1) For the 2010 study (2009 clients) the category of e-commerce changed to web-based strategy The 2008 results from that category are still used for comparison
Impact Study of Entrepreneurial Development 33Resources ndash 2010-2011
Office of Entrepreneurial Development
Sales Job Creation and Job Retention
Figure 410 presents findings on the attitudes toward the financial impact of ED Resource assistance irrespective of clientsrsquo reasons for seeking assistance The frequency of ED Resource clients that indicated they were able to increase profit margin retain current staff hire new staff or increase sales as a result of ED Resource assistance was lower for each category when compared to the previous year The number of 2010 ED Resource clients indicating impactful assistance in each category decreased from the previous year The retaining current staff and increased sales categories each experienced a four percentage point decrease
Figure 410 ndash Total ED Resources ndash Perceived Impact of Assistance44
2008 n = 6770 2009 n = 8493 2010 n = 10146
44 See Appendix 2 for a more detailed response to q4 In addition to the reported findings in the figure above data was also collected for 2010 clientsrsquo perceived impact of assistance regarding the acquisition of a bank loan (16) a SBA guarantee loan (18) and a SBA Disaster loan (18)
Impact Study of Entrepreneurial Development 34Resources ndash 2010-2011
Office of Entrepreneurial Development
Figure 410A shows the perceived financial impact of ED Resources relative to the number of hours of counseling received recorded in two categories less than 3 hours and 3 or more hours of counseling received For comparison the overall level of perceived financial impact is also provided which does not distinguish by hours of counseling
It is notable that across all four categories ED Resource clients with 3 or more hours of counseling reported a greater positive financial impact than total ED Resource clients
For example clients that received 3 or more hours of counseling increased their sales 30 of the time whereas clients that received less than 3 hours of counseling increased their sales 19 of the time
Figure 410A ndash Total ED Resources ndash Perceived Impact of Assistance (Hours of Counseling Received vs Aggregate Hours)
Total ED Resources (ge 3 Hours)
Total ED Resources (Aggregate Hours)
Total ED Resources (lt 3 Hours)
Impact Study of Entrepreneurial Development 35Resources ndash 2010-2011
Office of Entrepreneurial Development
Cross-Sectional Demographic Analysis
This section compares revenues and employment for ED Resource clients by gender race ethnicity and veteran status Figure 411 compares average revenues for firms in each demographic category rounded to the nearest $1000 For example this figure shows that in 2010 firms owned by Females ($385000) were on average smaller than firms owned by Males ($778000) and firms owned by Males and Females ($767000)
Veteran-owned firms had an average of $1035000 in revenue the highest revenues by Veterans in the past three years Over the past year reported revenues for Service-disabled Veterans fell to an average of $727000 Regarding race and ethnicity average revenues fell across all demographic categories
Figure 411 ndash Revenues (000s) for Firms in Selected Demographic Categories45
45 Firms that reported revenues were required to do so within the range of $1000 to $25000000 Due to small sample sizes corresponding figures are not repeated in the individual ED Resource sections of this report
Impact Study of Entrepreneurial Development 36Resources ndash 2010-2011
Office of Entrepreneurial Development
Figure 412 compares employment by demographic category Firms owned by Female clients tended to have fewer employees than firms owned by Male clients however firms with both male and female owners a new category for this year had the highest average employment levels in the gender segment This new category also partially explains the drop in average number of employees for both male firms and for female firms HispanicLatino White and American IndianAlaskan Native firms had more employees than other race and ethnicity demographic categories In each category of firms the average number of employees has gone down from 200946
Figure 412 ndashTotal Employees for Firms in Selected Demographic Categories
46 Due to the small sample size of Service-disabled veterans (42) who reported having employees 2009 results should be treated with caution Due to small sample sizes corresponding figures are not repeated in the individual ED Resource sections of this report
Impact Study of Entrepreneurial Development 37Resources ndash 2010-2011
Office of Entrepreneurial Development
Regression Analysis of the Effects of Gender Race Ethnicity and Veteran Status on Key ED Resource Impacts
The following section presents findings from an analysis of the effects of firm and client characteristics on ED Resource impacts We report results from a series of multiple regression analyses These were conducted to test whether respondents differed significantly in perceived usefulness quality of counseling experience and financial impacts of ED Resource assistance based on selected firm (revenues business segment ED Resource contact hours) and demographic (age gender race ethnicity veteran status) characteristics
These analyses address the following research questions
1 Are there differences in perceived usefulness based on firm size business segment ED Resource geographic location hours of counseling age of owner(s) gender race ethnicity or veteran status
2 Are there differences in perceived assistance with the decision to start a business based on firm size business segment ED Resource geographic location hours of counseling age of owner(s) gender race ethnicity or veteran status
3 Are there differences in the financial impact of ED resource assistance based on firm size business segment ED Resource geographic location hours of counseling age of owner(s) gender race ethnicity or veteran status
Each regression model examined the impact of selected demographic characteristics (age gender race ethnicity and veteran status) and firm characteristics (size business segment ED Resource geographic location hours of counseling received) on a particular resource impact These impacts included perceived usefulness of ED Resource assistance perceived quality of the counseling experience perceived assistance with the decision to start a business and perceived financial impacts (sales cash flow hiring and profits)
Each resource impact is used as a dependent (ie outcome) variable For example the dependent variable for the first model is perceived usefulness of ED Resource assistance The dependent variable for the second model is perceived quality of the counseling experience The dependent variable for the third model is perceived assistance with the decision to start a business The dependent variable for the fourth model is a financial impact score which is a summary measure based on 4 self-reported financial impact measures (the effect of assistance on increases in sales cash flow new hires and profit margins)47
47 Consistent with previous analyses this scale is the sum of the following questionnaire items q51 q52 q55 and q57 Survey questions can be found in the survey instrument in Appendix 4
Impact Study of Entrepreneurial Development 38Resources ndash 2010-2011
Office of Entrepreneurial Development
The set of independent or predictor variables included variables representing the firm and client demographic characteristics include the following
Sales Revenues Client Segment
o Nascent o Start-Up o In-Business
ED Resource (SBDC SCORE or WBC) Geographic Location (Urban suburban rural) Number of hours of assistance (less than 3 3 or more) Respondent Age Gender Race
o Hispanic o American Indian o Asian o BlackAfrican-American o Native HawaiianPacific Islander
Ethnicity o HispanicLatino
Veteran or Service-disabled Veteran
Regression Results
In the results presented in this section statistically significant predictor variables are identified48
Detailed regression results are presented in Appendix 6
The first regression model tested for a relationship between selected firm and client characteristics and the clientrsquos perception of the usefulness of the servicesassistance received 49
Results of this regression suggest that larger firms reported higher levels of perceived usefulness of ED Resource assistance than smaller firms Firms who received less than 3 hours of assistance reported lower levels of perceived usefulness than firms with 3 or more hours of counseling Additionally firms in the In-business segment also reported significantly higher perceived usefulness from ED resource assistance
In terms of client demographics there were no significant differences in perceived usefulness based on age gender veteran status or ethnicity Native American and White clients
48 Relationships are considered statistically-significant at the 005 level Marginal significance is defined as significant at the 010 level 49 The overall model was statistically significant at the 001 level although the R2 a measure of model fit was very small (00149) Coefficients reported here were significant at the 010 level The usable sample size was 2427 Firms with revenue greater than $5000000 and less than $1000 were removed from all regression analyses as were firms with unknown business segment The revenue upper bound of $5 million was used in order to eliminate bias resulting from potential outliers skewing the distributionrsquos measures of central tendency
Impact Study of Entrepreneurial Development 39Resources ndash 2010-2011
Office of Entrepreneurial Development
reported significantly higher perceived usefulness but there were no other differences based on race
The second regression model tested for a relationship between selected firm and client characteristics and perceived ED resource assistance with the decision to start a business50
Consistent with the previous yearrsquos results this analysis suggests that larger firms firms in the In-Business segment and SCORE clients were less likely to report that their decision to start a business was the result of ED resource assistance However there were no significant differences based on any other firm or client demographic characteristics
The third regression model tested for a relationship between selected firm and client characteristics and the self-reported financial impact of ED Resource assistance These impacts include a combination of increases in sales cash flow hiring of new employees and profits51 These results provided no significant results even at a 010 level indicating that no firm level or client demographic characteristics affected the perception of the financial impact of ED Resource assistance
These regression analyses indicate that both firm and client characteristics can be significant determinants of the clientrsquos perception of the usefulness of the servicesassistance received perceived assistance with the decision to start a business or the financial impact of assistance received
Variations in perceived usefulness perceived assistance with the decision to start a business and financial impacts are due in part to differences in firm size ED Resource and hours of assistance Geographic location did not play a significant role in any regression model In addition in some cases there were significant effects of gender age and ethnicity However none of these effects were consistent across outcomes
50 This model was estimated using a logistic regression analysis due to the binary dependent variable (q1c) The overall model was significant at the plt001 level although the pseudo R2 was small (00884) Coefficients reported here were significant at the 010 level Survey questions can be found in the survey instrument in Appendix 4 51 The overall model was not significant at the 010 level the R2 was extremely small (0008)
Impact Study of Entrepreneurial Development 40Resources ndash 2010-2011
Office of Entrepreneurial Development
V SBDC 2010 VS TOTAL ED RESOURCES
The following section presents results from SBDC clients52 First we report the general demographic and financial characteristics of SBDC 2010 clients This is followed by additional findings on the usefulness of SBDC for Nascent Start-up and In-Business firms organized by research question as follows
Is there a relationship between servicesassistance provided by SBDC and the clientrsquos perception of the usefulness and value of servicesassistance received
Is there a relationship between the servicesassistance provided by SBDC and the clientrsquos decision to start a business
Is there a relationship between the servicesassistance provided by SBDC and the clientrsquos decision to implement andor change management andor marketing practices in their business
Are the servicesassistance provided by SBDC having an impact on the clientrsquos financial position in terms of job creation job retention and sales
52 All references to ED Resource clients pertain to ED Resource Partnersrsquo face-to-face counseling clients who received assistance from a designated ED Resource Partner (SBDCSCOREWBC)
Impact Study of Entrepreneurial Development 41Resources ndash 2010-2011
Office of Entrepreneurial Development
Analysis of the Attitudes of SBDC Clients Regarding the Assistance They Received from SBDC
Demographic Characteristics of SBDC Clients
This section describes the general demographic and financial characteristics of SBDC clients These results are based on an analysis of 5113 completed surveys As shown in Figure 51 the largest business segment served by SBDC is the In-Business segment (59) which is five percentage points higher than total ED Resources
Figure 51 ndash SBDC ndash Distribution of Clients by Segment (2010 Clients)53
SBDC vs Total ED Resources
SBDC n = 5113 Total ED Resources n = 10146
Table 51 compares revenues and employment for SBDC vs total ED Resources These results indicate that SBDC clients have higher revenues than total ED Resource clients
Table 51 ndash SBDC Client Revenues and Employment (2010)
Total ED Total ED SBDC SBDC Resources Resources
Average Revenue $774000 $637200 Average Employees 5 4
53 Respondents who reported being in business but who did not provide a valid start date for that business were not assigned to a business segment Therefore the total of client segments served for SBDC may not equal 100
Impact Study of Entrepreneurial Development 42Resources ndash 2010-2011
Office of Entrepreneurial Development
Demographic characteristics of SBDC clients including gender race ethnicity and veteran status are reported in Figure 5254 The demographic makeup of SBDC was comprised of a smaller percentage of Females and a higher percentage of Males than total ED Resources by four and two percentage points respectively Other demographic proportions followed a pattern similar to those of total ED Resources
Figure 52 ndash SBDC ndash Demographic Characteristics (2010 Clients)55
SBDC vs Total ED Resources
SBDC n = 5113 Total ED Resources n = 10146
54 The Veteran and Service-disabled Veteran categories are shown in the figure above Additional results for SBDC clients included Reservist (03) and National Guard Member (04) 55 The total may not equal 100 due to non-respondents and those who selected multiple ethnicities The SBDC demographic distribution was compared to the national averages from the SBO The distribution was comparable across characteristics except for the following SBO figures White business owners were 83 of the small business population Female business owners were 29 Male business owners were 51 and American IndianAlaskan Native business owners were less than 1
Impact Study of Entrepreneurial Development 43Resources ndash 2010-2011
Office of Entrepreneurial Development
Figure 53 shows the distribution of SBDC clients by age of business owner The largest age group served was between the ages of 45 and 54 (29) SBDC clientsrsquo age distribution was consistent with that of total ED Resources
Figure 53 ndash SBDC ndash Age of Business Owner (2010 Clients)56
SBDC vs Total ED Resources
SBDC n = 5113 Total ED Resources n = 10146
56 The SBDC age distribution was compared to the national averages from the SBO The distribution was comparable across characteristics except that SBO reported 65+ at 125 (compared to 5 for SBDC)
Impact Study of Entrepreneurial Development 44Resources ndash 2010-2011
Office of Entrepreneurial Development
Figure 54 shows that the most common types of businesses served by SBDC were in the service and retail categories57 These results are generally consistent with the national averages from the SBO Results that were not consistent included Manufacturing reported in the SBO to be 2 Construction reported to be 13 and Health Care reported to be 958 Also the figure shows the share of SBDC clients in the manufacturing construction technology and restaurant andor eating and drinking industries was higher than total ED Resources
Figure 54 ndash SBDC ndash Type of Business (2010 Clients) 59
SBDC vs Total ED Resources
57 The top 11 categories for 2010 SBDC clients are displayed in the figure above Additional results included Finance Insurance and Real Estate (3) Education (2) Entertainment (2) Publishing (1) Transportation (1) Engineering (2) Day Care (1) 58 Other SBO results that differed with the findings included Finance Insurance and Real Estate (14) and Transportation (5) Industry classifications are not identical 59 Due to non-responses and multiple business type selections the total for all business types might not equal 100
Impact Study of Entrepreneurial Development 45Resources ndash 2010-2011
Office of Entrepreneurial Development
SBDC Client Attitudes Regarding ED Resource Assistance
Usefulness and Value of Services or Assistance Received
Approximately 74 of SBDC clients reported that the information they received from counselors was valuable60 Figure 55 shows ratings of usefulness of SBDC ED Resources provided by business segment and compared to total ED Resources SBDC Nascent firms rated the usefulness of information somewhat higher than Start-up and In-Business firms Nascent and Start-up clients both highly rated the usefulness of the assistance received more often than did total ED Resource clients
Figure 55 ndash SBDC ndashUsefulness of SBDC (2010 Clients)61
SBDC vs Total ED Resources
60 This result does not appear in the figure above which is displayed by business segment This figure was calculated for SBDC clients overall without regard to business segment 61 Low value includes the lsquoSomewhat Valuablersquo and lsquoNot Valuablersquo response categories High value includes the lsquoExtremely Valuablersquo and lsquoValuablersquo response categories
Impact Study of Entrepreneurial Development 46Resources ndash 2010-2011
Office of Entrepreneurial Development
Figure 55A below shows the perceived usefulness of SBDC assistance based upon the number of hours of counseling received Figure 55A shows that SBDC clients who received 5 or more hours of counseling rated usefulness as ldquohighrdquo more frequently than those SBDC clients who received less than 5 hours of counseling
Figure 55A ndash Usefulness of SBDC SBDC by Hours of Counseling vs Total ED Resources Aggregate Hours (2010 Clients)
Impact Study of Entrepreneurial Development 47Resources ndash 2010-2011
Office of Entrepreneurial Development
Clientsrsquo Decision to Change Management Practices
Figure 56 compares SBDC client decisions to change management practices or strategies by business segment As a result of SBDC assistance 56 of Start-up firms changed their management practices or strategies and 58 of In-Business clients reported changing management practices or strategies The levels of SBDC Start-up and In-Business clients that changed their management practices were slightly below those for total ED Resource clients
Figure 56 ndash SBDC ndash Changed Management PracticesStrategies as a Result of SBDC ED Resource Assistance (2010 Clients)
SBDC vs Total ED Resources
Impact Study of Entrepreneurial Development 48Resources ndash 2010-2011
Office of Entrepreneurial Development
Figure 57 below reflects the percentage of firms reporting that SBDC assistance led to the development of business plans marketing plans etc 62 The percentage of SBDC clients that sought assistance with the development of business plans cash flow analyses or preparation of loan packages was higher than that of total ED Resources
Figure 57 ndash SBDC ndash Assistance in Plan Development (2010 Clients)
SBDC vs Total ED Resources
62 The 2010 results for the top 11 categories are displayed in the figure above Additional results included Hiring plan (5) Purchasing Strategy (4) Production Plan (4) Distribution Plan (3) Training Plan for Staff (4) and International Trade (2)
Impact Study of Entrepreneurial Development 49Resources ndash 2010-2011
Office of Entrepreneurial Development
Sales Job Creation and Job Retention
Figure 58 compares SBDC Start-up and In-Business clients in terms of reported financial impact of SBDC assistance on sales profits jobs and the retention of employees irrespective of reasons for seeking assistance63 SBDC Start-up firms reported lower perceived levels of impact regarding both hiring new staff and retaining current staff when compared to total ED Resources SBDC In-Business clientsrsquo reported financial impact surpassed total ED Resources in each category
Figure 58 ndash SBDC ndash Perceived Impact of Assistance (2010 Clients)
SBDC vs Total ED Resources
63 This comparison excludes the Nascent category for total ED Resources and SBDC
Impact Study of Entrepreneurial Development 50Resources ndash 2010-2011
Office of Entrepreneurial Development
Figure 58A compares SBDCrsquos financial impact of assistance on sales profits jobs and the retention of employees to the financial impact results for total ED Resources presented by hours of counseling received The number of hours of counseling received is divided into three categories for SBDC less than 3 hours from 3 to less than 5 hours and 5 or more hours
SBDC clients who received 5 or more hours of counseling reported greater perceived impact of assistance than total ED Resources in each of the categories below For example 41 of clients that received 5 or more hours of SBDC counseling reported an increase in sales and 34 of clients that received 5 or more hours reported an increase in profit margins Total ED Resources reported 34 and 30 in the same categories respectively
Figure 58A ndash SBDC ndash Perceived Impact of Assistance SBDC Hours of Counseling Received for In-Business and Start-ups vs Total ED Resources Aggregate Hours for In-Business and Start-ups (2010 Clients)
Impact Study of Entrepreneurial Development 51Resources ndash 2010-2011
Office of Entrepreneurial Development
[This page is intentionally left blank for two-sided printing]
Impact Study of Entrepreneurial Development 52Resources ndash 2010-2011
Office of Entrepreneurial Development
VI SCORE 2010 VS TOTAL ED RESOURCES
The following section presents results from SCORE clients64 First we report the general demographic and financial characteristics of SCORE clients as provided by 2010 clients This is followed by additional findings on the usefulness of SCORE for Nascent Start-up and In-Business firms organized by research question as follows
Is there a relationship between servicesassistance provided by SCORE and the clientrsquos perception of the usefulness and value of servicesassistance received
Is there a relationship between the servicesassistance provided by SCORE and the clientrsquos decision to start a business
Is there a relationship between the servicesassistance provided by SCORE and the clientrsquos decision to implement andor change management andor marketing practices in their business
Are the servicesassistance provided by SCORE having an impact on the clientrsquos financial position in terms of job creation job retention and sales
64 All references to ED Resource clients pertain to ED Resource Partnersrsquo face-to-face counseling clients who received assistance from a designated ED Resource Partner (SBDCSCOREWBC)
Impact Study of Entrepreneurial Development 53Resources ndash 2010-2011
Office of Entrepreneurial Development
Analysis of the Attitudes of SCORE Clients Regarding the Assistance They Received from SCORE
Demographic Characteristics of SCORE Clients
This section describes the general demographic and financial characteristics of SCORE clients These results are based on an analysis of 4444 completed surveys As shown in Figure 61 the largest business segment served by SCORE was the In-Business segment (49) which is five percentage points lower than the In-Business segment for total ED Resources The Nascent segment was the second largest at 29 and measures three percentage points higher than total ED Resources
Figure 61 ndash SCORE ndash Distribution of Clients by Segment (2010 Clients)65
SCORE vs Total ED Resources
SCORE n = 4444 Total ED Resources n = 10146
Table 61 compares revenues and employment for SCORE clients vs total ED Resources SCORE client revenues are lower than the average for total ED Resources
Table 61 ndash SCORE Client Revenues and Employment (2010)
Total ED SCORE Resources
Average Revenue $502000 $637200 Average Employees 3 4
65 Respondents who reported being in business but who did not provide a valid start date for that business were not assigned to a business segment The total of client segments served for SCORE will therefore not equal 100
Impact Study of Entrepreneurial Development 54Resources ndash 2010-2011
SCORE Total ED Resources
Office of Entrepreneurial Development
Demographic characteristics of SCORE clients including gender race ethnicity and veteran status are reported in Figure 6266 The demographic distribution of SCORE clients follows closely to the pattern of total ED Resources clients overall The percentage of White clients (70) in SCORErsquos demographic makeup is slightly higher than that of total ED Resources (68)
Figure 62 ndash SCORE ndash Demographic Characteristics (2010 Clients)67
SCORE vs Total ED Resources
SCORE n = 4444 Total ED Resources n = 10146
66 The Veteran and Service-disabled Veteran categories are shown in the figure above Additional results for SCORE clients included Reservist (04) and National Guard Member (04) 67 In some instances the total may not equal 100 due to non-respondents and respondents who selected multiple ethnicities The SCORE demographic distribution was compared to the national averages from the SBO The distribution was comparable across characteristics except for the following SBO figures White business owners were 83 of the small business population Female business owners were 29 and Male business owners were 51
Impact Study of Entrepreneurial Development 55Resources ndash 2010-2011
Office of Entrepreneurial Development
Figure 63 shows the distribution of SCORE clients by age of business owner The largest age group served was between the ages of 45 and 54 (27) SCORE clientsrsquo age distribution was consistent with that of total ED Resources
Figure 63 ndash SCORE ndash Age of Business Owner (2010 Clients)68
SCORE vs Total ED Resources
SCORE n = 4444 Total ED Resources n = 10146
68 The SCORE age distribution was compared to the national averages from the SBO The distribution was comparable except that SBO reported 65+ at 125 (compared to 5 for SCORE)
Impact Study of Entrepreneurial Development 56Resources ndash 2010-2011
Office of Entrepreneurial Development
Figure 64 shows that the most common types of businesses served by SCORE were in the service and retail categories69 These results are generally consistent with the national averages from the SBO Results that were not consistent included Manufacturing reported in the SBO to be 2 Construction reported to be 13 and Health Care reported to be 970 Also the figure shows the share of SCORE clients in the technology restaurant andor eating and drinking industries was lower than total ED Resources
Figure 64 ndash SCORE ndash Type of Business (2010 Clients)71
SCORE vs Total ED Resources
69The top 11 categories for 2010 clients are displayed in the figure above Additional results for 2010 included Finance Insurance and Real Estate (3) Education (3) Entertainment (2) Publishing (1) Transportation (1) Engineering (1) Day Care (1) 70 Other SBO results that differed from the findings included Finance Insurance and Real Estate (14) and Transportation (5) Industry classifications are not identical 71 Due to non-responses and multiple business type selections the total for all business types may not equal 100
Impact Study of Entrepreneurial Development 57Resources ndash 2010-2011
Office of Entrepreneurial Development
SCORE Client Attitudes Regarding ED Resource Assistance
Usefulness and Value of Services or Assistance Received
Approximately 73 of SCORE clients reported that the information they received from counselors was valuable72 Figure 65 shows ratings of usefulness of SCORE provided by business segment and compared to total ED Resources For SCORE clients it is apparent that Start-up clients reported high levels of usefulness regarding the assistance they received somewhat less often when compared to other business segments
Figure 65 ndash SCORE ndashUsefulness of SCORE (2010 Clients)73
SCORE vs Total ED Resources
72 This result does not appear in the figure above which is displayed by business segment This percentage was calculated for SCORE clients overall without regard to business segment 73 Low value includes the lsquoSomewhat Valuablersquo and lsquoNot Valuablersquo response categories High value includes the lsquoExtremely Valuablersquo and lsquoValuablersquo response categories
Impact Study of Entrepreneurial Development 58Resources ndash 2010-2011
Office of Entrepreneurial Development
Figure 65A below shows the perceived usefulness of SCORE assistance based upon the number of hours of counseling received Figure 65A shows that 78 of SCORE clients that received 3 or more hours of counseling rated SCORE usefulness as ldquohighrdquo compared to 68 of clients that received less than 3 hours of counseling
Figure 65A ndash Usefulness of SCORE SCORE by Hours of Counseling vs Total ED Resources Aggregate Hours (2010 Clients)
Impact Study of Entrepreneurial Development 59Resources ndash 2010-2011
Office of Entrepreneurial Development
Clientsrsquo Decision to Change Management Practices
Figure 66 compares SCORE client decisions to change management practices or strategies by business segment As a result of SCORE assistance 58 of Start-up firms changed their management practices or strategies and 67 of In-Business clients reported changing management practices or strategies The levels for SCORE Start-up and In-Business clients that changed their management practices and strategies were higher than those for total ED Resources
Figure 66 ndash SCORE ndash Changed Management PracticesStrategies as a Result of SCORE ED Resource Assistance (2010 Clients)
SCORE vs Total ED Resources
Impact Study of Entrepreneurial Development 60Resources ndash 2010-2011
Office of Entrepreneurial Development
Figure 67 below reflects the percentage of firms reporting that SCORE assistance led to the development of business plans marketing plans etc74 The percentage of SCORE clients that sought assistance with pricing strategies (15) was higher than that of total ED Resources (14) SCORE clients reported receiving assistance somewhat less often than total ED Resources for most other categories
Figure 67 ndash SCORE ndash Assistance in Plan Development (2010 Clients)
SCORE vs Total ED Resources
74 The 2010 results for the top 11 categories are displayed in the figure above Additional results for included Hiring plan (4) Purchasing Strategy (4) Production Plan (3) Distribution Plan (3) Training Plan for Staff (3) and International Trade (1)
Impact Study of Entrepreneurial Development 61Resources ndash 2010-2011
Office of Entrepreneurial Development
Sales Job Creation and Job Retention
Figure 68 compares SCORErsquos Start-up and In-Business clients in terms of the reported financial impact of SCORE assistance on sales profits jobs and the retention of employees irrespective of reasons for seeking assistance75 Twenty-five percent of Start-up clients reported that they were able to increase sales as a result of SCORE assistance compared to 34 for total ED Resources Twenty-one percent and 16 of SCORE In-Business clients reported that they were able to retain current staff and hire new staff respectively slightly higher than total ED Resources (20 and 15)
Figure 68 ndash SCORE ndash Perceived Impact of Assistance (2010 Clients)
SCORE vs Total ED Resources
75 This comparison excludes the Nascent category for total ED Resources and SCORE
Impact Study of Entrepreneurial Development 62Resources ndash 2010-2011
Office of Entrepreneurial Development
Figure 68A compares SCORErsquos financial impact of assistance for increasing sales profits jobs and the retention of employees to the financial impact results for total ED Resources presented by hours of counseling received The number of hours of counseling received is divided into two categories for SCORE less than 3 hours and 3 or more hours It is apparent from the figure below that except for the retain current staff category the greater the number of hours of counseling received the greater the perceived impact of assistance reported by SCORE In-Business and Start-up clients
Figure 68A ndash SCORE ndash Perceived Impact of Assistance SCORE Hours of Counseling Received for In-Business and Start-ups vs Total ED Resources Aggregate Hours for In-Business and Start-ups (2010 Clients)
Impact Study of Entrepreneurial Development 63Resources ndash 2010-2011
Office of Entrepreneurial Development
[This page is intentionally left blank for two-sided printing]
Impact Study of Entrepreneurial Development 64Resources ndash 2010-2011
Office of Entrepreneurial Development
VII WBC 2010 VS TOTAL ED RESOURCES
The following section presents results from WBC clients76 First we report the general demographic and financial characteristics of WBC clients as provided by 2010 clients This is followed by additional findings on the usefulness of WBC for Nascent Start-up and In-Business firms organized by research question as follows
Is there a relationship between servicesassistance provided by WBC and the clientrsquos perception of the usefulness and value of servicesassistance received
Is there a relationship between the servicesassistance provided by WBC and the clientrsquos decision to start a business
Is there a relationship between the servicesassistance provided by WBC and the clientrsquos decision to implement andor change management andor marketing practices in their business
Are the servicesassistance provided by WBC having an impact on the clientrsquos financial position in terms of job creation job retention and sales
76 All references to ED Resource clients pertain to ED Resource Partnersrsquo face-to-face counseling clients who received assistance from a designated ED Resource Partner (SBDCSCOREWBC)
Impact Study of Entrepreneurial Development 65Resources ndash 2010-2011
Office of Entrepreneurial Development
Analysis of the Attitudes of WBC Clients Regarding the Assistance They Received from WBC
Demographic Characteristics of WBC Clients
This section describes the general demographic and financial characteristics of WBC clients These results are based on an analysis of 589 completed surveys As shown in Figure 71 the largest business segment served by WBC is the In-Business segment Fifty percent of WBC respondents were In-Business clients compared to 54 of total ED Resource clients The figure also shows that there was a greater share of WBC clients in the Nascent segment (31) compared to total ED Resources (26)
Figure 71 ndash WBC ndash Distribution of Respondents by Segment (2010 Clients)77
WBC vs Total ED Resources
WBC n = 589 Total ED Resources n = 10146
Table 71 compares revenues and employment for WBC clients vs total ED Resources These results indicate that WBC clients are smaller in terms of revenues and number of employees than total ED Resources combined
Table 71 ndash WBC Client Revenues and Employment (2010)
Total ED WBC Resources
Average Revenue $171300 $637200 Average Employees 3 4
WBC Total ED Resources
77 Respondents who reported being in business but who did not provide a valid start date for that business were not assigned to a business segment The total of client segments served for WBC therefore may not equal 100
Impact Study of Entrepreneurial Development 66Resources ndash 2010-2011
Office of Entrepreneurial Development
Demographic characteristics of WBC clients including gender race ethnicity and veteran status are reported in Figure 7278 Not surprisingly about 62 of WBC clients are Female A noteworthy 24 of WBC clients are BlackAfrican American compared to 11 for total ED Resources HispanicLatino clients represent 8 of WBC clients WBC serves a small share of Veterans (5) and Service-disabled veterans (1)
Figure 72 ndash WBC ndash Demographic Characteristics (2010 Clients)79
WBC vs Total ED Resources
WBC n = 589 Total ED Resources n = 10146
78 The Veteran and Service-disabled Veteran categories are shown in the figure above Additional results for WBC clients included Reservist (02) and National Guard Member (00) 79 In some instances the total percentage might not equal 100 due to non-respondents and respondents who selected multiple ethnicities The WBC demographic distribution was compared to the national averages from the SBO The distribution was comparable across characteristics except for the following SBO figures White business owners were 82 of the small business population BlackAfrican American business owners were 12 and Asian business owners were 7
Impact Study of Entrepreneurial Development 67Resources ndash 2010-2011
Office of Entrepreneurial Development
Figure 73 shows the distribution of WBC clients by age of business owner The largest age group served was between the ages of 35-44 which accounts for 24 of WBC clients compared to 22 of total ED Resource clients Approximately 44 of WBC clients were between 18 and 44 years of age making WBC the youngest demographic of the three ED Resources
Figure 73 ndash WBC ndash Age of Business Owner (2009 Clients)80
WBC vs Total ED Resources
WBC n = 589 Total ED Resources n = 10146
80 The 2010 WBC age distribution was compared to the national averages for women-owned businesses from the SBO The distribution was comparable except for the following SBO figures 25-34 was 11 (compared to 18 for WBC) and 65+ was reported at 10 (compared to 5 for WBC)
Impact Study of Entrepreneurial Development 68Resources ndash 2010-2011
Office of Entrepreneurial Development
Figure 74 shows that the most common types of businesses served by WBC besides other were in the service and retail categories81 These results are generally consistent with the national averages from the SBO for women-owned firms Results that were not consistent included Health Care reported to be 16 in the SBO and Manufacturing reported in the SBO to be 182 The figure also shows the share of WBC clients in the service retail and consulting industries was higher than that of total ED Resources while the share of clients in the manufacturing construction technology and health care industries was lower than total ED Resources
Figure 74 ndash WBC ndash Type of Business (2010 Clients)83
WBC vs Total ED Resources
81 The top 11 categories for 2010 clients are displayed in the figure above Additional results included Finance Insurance and Real Estate (4) Education (3) Entertainment (1) Publishing (1) Transportation (3) Engineering (1) Day Care (2) 82 Other SBO results that differed from the findings included Finance Insurance and Real Estate (11) Industry classifications are not identical 83 Due to non-responses and multiple business type selections the total for all business types might not equal 100
Impact Study of Entrepreneurial Development 69Resources ndash 2010-2011
Office of Entrepreneurial Development
WBC Client Attitudes Regarding ED Resource Assistance
Usefulness and Value of Services or Assistance Received
Approximately 72 of WBC clients reported that the information they received from counselors was valuable84 Figure 75 shows ratings of usefulness of WBC provided by business segment and compared to total ED Resources WBC Nascent clients more often rated assistance as useful (78) than did total ED Resources (73) Start-up and In-Business clients rated assistance as useful less often (68) than total ED Resources
Figure 75 ndash WBC ndash Usefulness of WBC (2010 Clients)85
WBC vs Total ED Resources
84 This result does not appear in the figure above which is displayed by business segment This percentage was calculated for WBC clients overall without regard to business segment 85 Low value includes the lsquoSomewhat Valuablersquo and lsquoNot Valuablersquo response categories High value includes the lsquoExtremely Valuablersquo and lsquoValuablersquo response categories
Impact Study of Entrepreneurial Development 70Resources ndash 2010-2011
Office of Entrepreneurial Development
Figure 75A below shows the perceived usefulness of WBC assistance based upon the number of hours of counseling received Figure 75A shows that 76 of WBC clients that received more than 3 or more hours of counseling rated WBC usefulness ldquohighrdquo as compared to 69 of clients that received less than 3 hours of counseling
Figure 75A ndash Usefulness of WBC WBC by Hours of Counseling vs Total ED Resources Aggregate Hours (2010 Clients)
WBC vs Total ED Resources
Impact Study of Entrepreneurial Development 71Resources ndash 2010-2011
Office of Entrepreneurial Development
Clientsrsquo Decision to Change Management Practices
Figure 76 compares WBC client decisions to change management practices or strategies by business segment As a result of WBC assistance 62 of Start-up clients and 64 of In-Business clients reported changing their management practices or strategies The percentages of WBC Start-up and In-Business clients that changed their management practices were higher than that of total ED Resource clients
Figure 76 ndash WBC ndash Changed Management PracticesStrategies as a Result of WBC ED Resource Assistance (2010 Clients)
WBC vs Total ED Resources
Impact Study of Entrepreneurial Development 72Resources ndash 2010-2011
Office of Entrepreneurial Development
Figure 77 below reflects the percentage of firms reporting that WBC ED Resource assistance led to the development of business plans marketing plans etc86 The percentage of WBC clients that sought assistance with in the Other category (7) was less than that of total ED Resources (8) WBC clients reported receiving assistance as often or more often than total ED Resources for all other categories
Figure 77 ndash WBC ndash Assistance in Plan Development (2010 Clients)
WBC vs Total ED Resources
86 The 2010 results for the top 11 categories are displayed in the figure above Additional results included Hiring plan (5) Purchasing Strategy (4) Production Plan (4) Distribution Plan (3) Training Plan for Staff (3) and International Trade (2)
Impact Study of Entrepreneurial Development 73Resources ndash 2010-2011
Office of Entrepreneurial Development
Sales Job Creation and Job Retention
Figure 78 compares WBC Start-up and In-Business clients in terms of the reported financial impact of WBC assistance on sales profits jobs and the retention of employees irrespective of reasons for seeking assistance87 Start-up and In-Business clients reported that WBC assistance resulted in increased profit margin and increased sales substantially more often than total ED Resource clients For example 39 of Start-up clients and 42 of In-Business clients reported an increase in sales as compared to 34 of total ED Resources
Figure 78 ndash WBC ndash Perceived Impact of Assistance (2010 Clients)
WBC vs Total ED Resources
87 This comparison excludes the Nascent category for total ED Resources and WBC
Impact Study of Entrepreneurial Development 74Resources ndash 2010-2011
Office of Entrepreneurial Development
Figure 78A compares WBCrsquos financial impact of assistance on sales profits jobs and the retention of employees to the financial impact results for total ED Resources presented by hours of counseling received The number of hours of counseling received is divided into two categories for WBC less than 3 hours and 3 or more hours
Clients that received 3 or more hours of counseling reported higher impact in all categories compared to clients who received less than 3 hours of counseling The largest disparity occurred in the retain current staff category where there was a difference of 17 percentage points between clients who received 3 or more hours and those who received less than 3 hours
Figure 78A ndash WBC ndash Perceived Impact of Assistance WBC Hours of Counseling Received for In-Business and Start-ups vs Total ED Resources Aggregate Hours for In-Business and Start-ups (2010 Clients)
Impact Study of Entrepreneurial Development 75Resources ndash 2010-2011
Office of Entrepreneurial Development
[This page is intentionally left blank for two-sided printing]
Impact Study of Entrepreneurial Development 76Resources ndash 2010-2011
Office of Entrepreneurial Development
VIII FOLLOW-UP STUDY RESULTS 2008 amp 2009 CLIENTS In this section Concentrance reports findings from our analysis of follow-up surveys of 2008 and 2009 ED Resource clients88 These follow-up surveys were conducted in order to examine the impact of ED Resource assistance over time This yearrsquos follow-up study of 2008 ED Resource clients represents the second follow-up study of this sample The first follow-up survey of this group was conducted as part of the previous yearrsquos study in 2010 The follow-up study of 2009 ED Resource clients is the first follow-up study of these clients
This analysis addresses the following key research questions
What was the rate of transition of Nascent and Start-up firms to the In-Business segment Based on a comparison with the Panel Study of Entrepreneurial Dynamics II89 (PSED II)
what is the impact of ED Resource assistance on firm survival What was the financial impact of servicesassistance provided by SBA ED Resources in
terms of job creation job retention and sales How does the difference in growth rate of ED Resource clients from 2009 to 2010 compare
with key benchmarks such as the gross domestic product (GDP) the Entrex Private Company Index (PCI) and the Standard and Poorrsquos Small Cap Index90
Follow-up Methodology
There were 6770 respondents to the Initial Economic Impact Survey of 2008 clients Of these Concentrance was able to collect follow-up data from 854 respondents These respondents were re-contacted for the second follow up survey Of these Concentrance was able to collect follow-up data from 200 respondents for which detailed data can be tracked to 2011
There were 8493 respondents to the Initial Impact Survey of 2009 clients Of these Concentrance was able to collect follow-up data from 1968 respondents for which detailed data can be tracked to 2011
2008 Clients Sample Size Response Rate Initial Study 6770 29 1st Follow-up 854 13 2nd Follow-up 200 23 2009 Clients Sample Size Response Rate Initial Study 8493 23 1st Follow-up 1968 23
88 All references to ED Resource clients pertain to ED Resource Partnersrsquo face-to-face counseling clients who received assistance from a designated ED Resource Partner (SBDCSCOREWBC) 89 The Panel Study of Entrepreneurial Dynamics II is a nationwide multi-million dollar survey of nascent entrepreneurs funded by the Kauffman Foundation The primary purpose of the study is to identify adults active in business creation obtain detailed information about the start-up effort and perform follow-up interviews to determine outcomes We rely on the PSED I and PSED II as benchmarks however results must also be interpreted with caution due to potential response bias and definitional differences in the ways that firms are classified 90 The three benchmarks used for comparison of SBA ED Resources are GDP - Source httpwwwbeagovnationalxlsgdpchgxls the Private Company Index (PCI) - published by Entrex this index measures revenue performance in the sector of private companies ranging from $3 million to $60 million in annual revenues (httpwwwprivatecompanyindexcom) and the S amp P SmallCap 600 Index - represents approximately 3 of the US market and includes 600 lsquosmall caprsquo companies with market capitalizations between $300 million and $2 billion The SampP SmallCap 600 Index is a commonly used benchmark for growth
Impact Study of Entrepreneurial Development 77Resources ndash 2010-2011
y
f
Office of Entreprreneurial DDevelopm ment
Changess in Businesss Segmentss from 2009 tto 2011
What is tthe rate of trransition of Nascent annd Start-up firms to thee In-Businesss segment
Figure 811 shows the mmovement oof firms fromm their initial segments to the In-Businness segmentt in 2011 Foor example 557 of 2008 Nascent clients had startted businessees by 2011 FFor 2008 clieents that weree initially in thhe In-Busineess segment 994 remaineed in businesss in 2011 AAdditionally Figure 811 shows the mmovement oof firms fromm their initial 2009 client ssegment to thhe In-Busineess segment iin 2011 Forr example 299 of 2009 NNascent cliennts had transiitioned into tthe In-Businness category bby 2011 By comparisonn according tto a study by Reynolds annd Curtin (20008)91 approximmately 19 of nascent enttrepreneurs inn the PSED II had starteed businessess within two yeears of inceptiion
Figure 81 ndash Traansitions and Survvival of 22008 and 2009 Clieents to 20011 In-Bussiness
91 Paul D Reynolds and RRichard T Curttin (2008) ldquoBu siness Creationn in the United States Panel Sttudy of Entrepreneeurial Dynamicss II Initial Asseessmentrdquo Founddations and Trendds in Entrepreneuurship Vol 4 NNo 3 pgs 155ndashndash307
Impact S tudy of Entrepren neurial Develop pment Resource es ndash 2010-2011 1
78
Office of Entrepreneurial Development
Impact of ED Resource Assistance on Firm Survival
Does ED Resource assistance have a positive impact on firm survival
The PSED II data serve as a benchmark for comparing the proportion of Nascent and Start-up businesses that can now be classified as In-Business firms The PSED II is a sample of nascent entrepreneurs who are in the process of going into business a portion of the sample received some form of counseling or assistance
Figure 82 compares the survival rates for firms in the follow-up study with the PSED II92 These results suggest that businesses that received ED Resource assistance had a higher survival rate than other small businesses such as those randomly sampled for the PSED II For example based on the second follow-up study of 2008 ED Resource clients 93 were still in business after two years In contrast only 80 of PSED II firms remained in business after two years93 Similarly in the follow-up study of 2009 ED Resource clients 96 of these firms remained in business after one year compared to 90 of firms in the PSED II sample
In addition to the PSED II analysis ED Resource client survival rates were higher than reported in other studies For example according to a study published in the Monthly Labor Review two-thirds of new employer firms survive at least two years and about 44 survive at least four94
Figure 82 ndash ED Resource Clients have Higher Survival Rates than PSED II Firms
92Source Parker Simon C (2005) ldquoWhat happens to nascent entrepreneurs An econometric analysis of the PSEDrdquo Entrepreneurship in a Diverse World U S Association for Small Business and Entrepreneurship 93 The PSED II reports the rate of disengagement of start-up firms relative to the time of inception According to Reynolds and Curtin (2008) this period is somewhat arbitrary may not actually capture all start-up activities Thus we report an approximate PSED survival rate based on firms at 1 year and 2 years after inception 94 Survival and Longevity in the Business Employment Dynamics Database Monthly Labor Review May 2005
Impact Study of Entrepreneurial Development 79Resources ndash 2010-2011
Office of Entrepreneurial Development
Does the number of hours of ED Resource assistance have a positive impact on firm survival Figure 83 shows the survival rate of ED Resource clients in each category of counseling hours received for the second follow-up survey of 2008 clients and the first follow-up of 2009 clients In the second follow-up firms receiving 3 or more hours of counseling had a marginally higher survival rate than those that received less than 3 hours of counseling However the relationship between additional counseling hours and survival in the first follow-up sample of 2009 clients is less pronounced
Figure 83 - ED Resource Client Survival by Hours of Counseling
Impact Study of Entrepreneurial Development 80Resources ndash 2010-2011
f
f
Office of Entreprreneurial DDevelopm ment
Changess in Revenuees and Empployees
What is tthe financiaal impact of servicesasssistance proovided by SBA ED Ressources in teerms of job creeation job rretention annd sales
Figure 844 compares 22008 clients iin terms of mmean annual revenues andd number of employees inn the initial andd two subseqquent follow--up studies
Accordinng to this mattched pairs comparison mmean revenuues fell from $413900 in 22008 to $3044200 in 2009 This decline in revenues between 20008 and 2009 iis consistent with the reccessionary conditionns of the econnomy duringg this period However ffor the subseet of firms that survived aand reported revenue dataa mean revennues increaseed to $4677000 in 201095
At the samme time the mean numbber of employyees per firmm decreased frrom 68 to 5 for the first follow-upp year and thhen rose againn to 68 for thhe second foollow-up yearr
Figure 84 - Meaan Revennues and Employmment 20008 Clientts Over TTime
20008 Clients n == 2343 1st Foollow-up n = 2550 2nd Follow--up n = 112
95 Revenue s from Nascentt and unknownn business segmments are not inccluded In adddition Start-up oor In-Business firms with revenuues below $10000 and greater tthan $5 million were excludedd from this analyysis as were firmms with reporteed employees below 1 and abbove 998 The revenue upper bound of $5 mmillion was usedd in order to eli minate bias res sulting from potenntial outliers skeewing the distriibutionrsquos measuures of central ttendency
Impact S tudy of Entrepren neurial Develop pment Resource es ndash 2010-2011 1
81
Office of Entreprreneurial DDevelopm ment
The matcched comparison analysis was repeated for the folllow-up sampple of 2009 cllients Figurre 85 comparess firms in terms of mean annual revennues and nummber of emplloyees in 20009 and in thee first follow-upp survey
Accordinng to this mattched pairs comparison mmean revenuues fell from $414100 in 22009 to $3911400 in 2010 According too a survey off small busineess owners cconducted byy the Nationaal Federationn of Independdent Businessses (NFIB) bbusiness ownners in 2009 reported histtorically low expectationss about groowth and employment annd increasingg concerns abbout inflationn From the low of Jan 22009 optimismm has been coontinuously trending upwward to highs not seen sinnce late 2007 potentially indicativee of a laggingg upturn 96 TThe mean number of empployees per fifirm remainedd essentially flat at just ovver 74
Figure 85 - Meaan Revennues and Employmment 20009 Clientts Over TTime
20099 clients n = 30012 1st Followw-up n = 10144
96Dunkelbeerg William C and Holly Wadde (2009) ldquoNFIIB Small Busineess Economic TTrendsrdquo Marchh httpwwwwnfibcompa gesbet amp httppwwwnfibcoomPortals0PDFsbetsbeet201103pdf
Impact S tudy of Entrepren neurial Develop pment Resource es ndash 2010-2011 1
82
Office of Entreprreneurial DDevelopm ment
The folloowing figures show changges in mean rrevenue and eemployment t for 2009 clieents by ED Resourcee97
Figure 85A Mean SBDCC Revenues and Employmeent 20099 Clients Over TTime
2009 SBBDC Clients n = 1567 1st FFollow-up n = 6637
97 The secoond follow-up ssample of 2008 clients includedd only 200 firmms This samplee is insufficient for a statisticallly meaningfull analysis by inddividual ED Resource
Impact S tudy of Entrepren neurial Develop pment Resource es ndash 2010-2011 1
83
Office of Entreprreneurial DDevelopm ment
Figure 85B Mean SCORRE Revennues and Employmment 20009 Clientts Over TTime
2009 SCCORE Clients nn = 1286 1st FFollow-up n = 323
Impact S tudy of Entrepren neurial Develop pment Resource es ndash 2010-20111
84
Office of Entreprreneurial DDevelopm ment
Figure 85C Mean WBC Revenuees and Emmploymennt 2009 Clients Over TTime
2009 SSCORE Clients n = 159 1st FFollow-up n = 54
Impact S tudy of Entrepren neurial Develop pment Resource es ndash 2010-20111
85
Office of Entreprreneurial DDevelopm ment
Figure 866 provides addditional detaail on the chaange in revennues for 20088 and 2009 cclients For example 53 of 20088 clients havee experiencedd revenue grrowth from 22008 to 2010 Additionallly 65 of 22009 clients realized increased revenuees in 2010 coompared to 335 who expperienced a decline inn revenues
Figure 86 Distrribution oof ED Ressource Clientsrsquo Peercentagee Changee in Revenues98
20009 Clients n = 635 2008 Clieents n = 184
98 Firms wiith revenues bellow $1000 andd greater than $55 million were excluded from this analysis BBecause both 20008 and 2009 fiirms needed to have revenues within these paarameters to es tablish approprriate match critteria needed forr the percent chaange comparisoon the 2008 andd 2009 client coounts will not mmatch those in figures 84 amp 8 85
Impact S tudy of Entrepren neurial Develop pment Resource es ndash 2010-2011 1
86
Office of Entrepreneurial Development
Benchmark Comparisons
Figure 87A and 87B depict firm survival over time as compared to the PSED I and PSED II Figure 87A shows firm survival rates after one year of being in business over a period of six years Figure 87B shows firm survival rates after two years of being in business over a period of five years In both figures the benchmarks for comparison are the PSED I and II which provide data for survival rates of businesses after one and two years of being in business99 ED Resource clients have outpaced the samples from both PSED studies for six consecutive years as shown in the figures below
Figure 87A ndash Firm Survival Rates for ED Resource Clients After One Year (Total ED Resources vs PSED studies)
Figure 87B ndash Firm Survival Rates for ED Resource Clients After Two Years (Total ED Resources vs PSED studies)
99 For years 2007 to 2008 the PSED II with updated data became available and was therefore utilized as the new benchmark PSED I analyzes data collected from nascent entrepreneurs from 1998 - 2000 with three follow-up interviews PSED II analyzes data collected from nascent entrepreneurs from 2005 and 2006 with two follow-up interviews This explains the increased survival rates for the benchmarks on each figure 80 to 90 in 87A and 71 to 80 in 87B
Impact Study of Entrepreneurial Development 87Resources ndash 2010-2011
r
y
Office of Entreprreneurial DDevelopm ment
How doees the growtth of ED Reesource clients compare with key bbenchmarkss of econommic growth
Figure 888 compares tthe differenc e in growth rrate of ED RResource cliennts from 20009 to 2010 too three bennchmarks ndash UUS GDP thhe Private Coompany Indexx (PCI) and the Standardd and Poorrsquos Small Capp Index (SampPP) The GDP growth proovides a conttext of how tthe overall ecconomy is performinng The SampPP represents approximateely 3 of thee US markett and includees 600 lsquosmalll caprsquo companiees with markket capitalizattions betweenn $300 millioon and $2 billlion The PCCI measures revenue pperformance in the sectorr of private ccompanies raanging from $$3 million too $60 million in annual revenues
The diffeerence in growwth rate fromm 2009 to 20010 for SBA EED Resourcce clients wass 134 percenntage points AAlthough all tthree benchmmarks indicatted positive ggrowth durinng this time SSBA ED Resourcee clientsrsquo proggress outpaceed the other benchmarks
Figure 88 ED RResource Client Revenue GGrowth CComparedd to Seleccted Benchmarks - PPercent CChange frrom Prevvious Yeaar100
100 SBA EDD figures are baased on Start-upp or In-Businesss firmsrsquo mean rrevenues from tthe two follow--up surveys conducted in 2010 where clients with revvenue less thann $1000 or greaater than $5 milllion in either year were excludded The revenuue upper boundd of $5 million wwas used in ordder to eliminatee bias resulting ffrom potential outliers skewinng the distributionnrsquos measures off central tendenncy The growthh rates for 20099 and 2010 forr each benchmaark are as followws GDP 20099=-26 2010==29 SampP Smmall Cap 600 2 009=238 20010=251 PCCI 2009=220 2010=298 and SBA ED RResources 2009 =-61 2010==73
Impact S tudy of Entrepren neurial Develop pment Resource es ndash 2010-2011 1
88
Office of Entrepreneurial Development
Summary of Follow-up Study Findings
Firm Survival Approximately 57 of 2008 Nascent clients had transitioned to the In-Business segment after two years while 29 of 2009 Nascent clients had gone into business by the beginning of 2011 At the same time 6 of 2008 of In-Business clients and 3 of 2009 clients went out of business by 2011
In addition in the second follow-up 2008 clients receiving 3 or more hours of counseling had a higher survival rate than those who received less than 3 hours of counseling
Based on a comparison to firms in the PSED II businesses who received ED Resource assistance have a higher survival rate than other small businesses For example the survival rate after two years was 93 for ED Resource clients compared to 80 for firms in the PSED II
Financial Impact and Growth These analyses show that ED Resource assistance has had a significant impact on the revenue and employment growth of small business clients For 2008 clients the recession appears to have had a negative impact on 2009 revenue though revenue increased for these clients in 2010 (2nd follow-up 2008 and 1st follow-up 2009) Surviving 2008 clients in the second follow-up experienced a 54 increase in revenues from 2009 to 2010 Still 47 of 2008 clients experienced some negative growth in revenues since 2008 The difference in growth rates from 2009 to 2010 for SBA ED Resource clients was shown to be 134 percentage points Although all three benchmarks indicated positive growth during this time SBA ED Resource clientsrsquo progress outpaced the other benchmarks Firms in the second 2008 client follow-up sample increased from a mean of 50 employees to a mean of 68 employees Mean employment for firms in the first follow-up of 2009 clients stayed relatively flat with an increase from 73 to 74 employees (See Figures 84 85 86 and 88)
Impact Study of Entrepreneurial Development 89Resources ndash 2010-2011
Office of Entrepreneurial Development
[This page is intentionally left blank for two-sided printing]
Impact Study of Entrepreneurial Development 90Resources ndash 2010-2011
Office of Entrepreneurial Development
IX SUMMARY OF QUANTITATIVE FINDINGS
Initial Impact Study of 2010 Clients
1 What is the demographic financial and business profile of firms who utilize SBA ED Resources
Firms that have been in business for more than one year comprise the In-Business client segment Fifty-four percent of ED Resource clients were in the In-Business category Nascent clients represented 26 of ED Resource clients while the smallest segment Start-up clients represented 19101
The average revenue for firms served by ED Resources is $637200 with four employees Firm size varies by ED Resource For example SBDC clients have higher average revenues at $774000 than SCORE clients at $502000 WBC clientsrsquo revenues are lowest with average revenues of $171300 These revenue figures are lower than client groups studied in 2009
ED Resource clients represented a variety of demographic groups Thirty-six percent of clients were Male 36 Female and 17 of firms had Male and Female owners Sixty-eight percent were White 11 BlackAfrican American 7 HispanicLatino 4 Asian and 2 American IndianNative Alaskan Nine percent of ED Resource clients were Veteran and 2 were Service-disabled Veteran The largest age group served by ED Resources accounting for 28 of the total sample included clients between 45 and 54 years of age
ED Resource clients served during 2010 represented a wide variety of business types The most common industries included service retail and manufacturing businesses
ED Resources assisted clients in developing plans and strategies in order to start or better manage their businesses The most frequently reported type of assistance was business plans (35) followed by marketing plans (30) and financial strategy (19)
For 2010 clients the lowfree cost of service was the most commonly reported reason for seeking business counseling from ED Resources at 51 The least commonly reported reason for seeking business counseling from ED Resources was clients having tried other alternatives but were dissatisfied at 9 SCORE clients reported the reputation of SCORE as a reason they sought assistance (55) more often than the lowfree cost of service (52)
101 Respondents (86) who reported being in business but who did not provide a valid start date for that business were not assigned to a business segment
Impact Study of Entrepreneurial Development 91Resources ndash 2010-2011
Office of Entrepreneurial Development
Firms who received less than 3 hours of assistance reported lower levels of perceived usefulness than firms with 3 or more hours of counseling Also firms in the In-Business segment reported significantly higher perceived usefulness from their ED Resources counseling
American IndianAlaskan Native and White firms both reported higher perceived usefulness but there were no other differences based on race There were also no significant effects of clientrsquos age gender veteran status or ethnicity on perceived usefulness of assistance
Unlike some previous years results of this yearsrsquo regression suggest that there were no significant differences in financial impacts of ED Resource assistance based on any factor including ED resource business segment hours of counseling received or geographic location
Impact study data was used to examine four ED Resource client perceptions of impact Findings for each of these impacts are described below
2 Is there a relationship between the servicesassistance provided by ED Resources and the clientrsquos perception of the usefulness and value of the servicesassistance received
In general ED Resource clients perceived information and assistance provided by ED Resource counselors to be valuable Approximately 73 of ED Resource clients overall reported that assistance they received had high value in terms of usefulness This rating was 74 for SBDC 73 for SCORE and 72 for WBC
Seventy-six percent of clients who received 3 or more hours of counseling rated usefulness as ldquohighrdquo whereas 69 of those who received less than 3 hours of counseling did likewise Regression analysis also indicated that clients who received less than 3 hours of counseling reported lower levels of perceived usefulness than clients who received 3 or more hours of counseling
3 Is there a relationship between the servicesassistance provided by ED Resources and the client perceptions of assistance with the decision to start a business
As in the previous yearrsquos study regression results suggest larger firm firms in the In-Business segment and SCORE clients were less likely to report that their decision to start a business was the result of ED Resource assistance
There were no significant differences based on hours of counseling received or client demographic characteristics in regard to perceived assistance with the decision to start a business
Impact Study of Entrepreneurial Development 92Resources ndash 2010-2011
Office of Entrepreneurial Development
4 Is there a positive relationship between the servicesassistance provided by ED Resources and the clientrsquos decision to implement andor change management andor marketing practices in their business
As a result of ED Resource assistance 62 of 2010 In-Business clients and 57 of Start-up clients changed management practices or strategies Clients used ED Resources most widely in developing business plans marketing plans financial strategies and general management
5 Is there a positive relationship between the servicesassistance provided by ED Resources and financial impacts including job creation and retention and increases in sales
Thirty-four percent of Start-up and In-Business clients reported that assistance provided by ED Resources resulted in increased sales In terms of jobs 15 of Start-up and In-Business clients reported that ED Resource assistance led to the hiring of new staff and 20 reported that ED Resources assisted them in retaining current staff The perceived impact of ED Resource assistance on increasing profit margin was 30 a decrease two percentage points from the previous year
For the following financial categories sales profits retaining current staff and hiring of employees ED Resource clients who received 3 or more hours of assistance reported higher financial impacts than firms who received less than 3 hours of assistance This finding was not supported by a regression analysis which examined sales profits cash flow and the hiring of new staff
Increase in sales was the financial category that showed the most prominent correlation with hours of counseling received more than profit margin hiring of new staff or retention of staff Clients that received 3 or more hours of counseling reported increasing their sales 30 of the time whereas clients that received less than 3 hours of counseling increased their sales 19 of the time
Follow-up Study of 2008 and 2009 ED Resource Clients
6 How do the results of this survey compare with the Panel Survey of Entrepreneurial Dynamics (PSED) study
Based on the first follow-up study of 2008 ED Resource clients 95 were still in business while 90 of firms in the PSED II sample remained in business after one year For 2009 ED Resource clients 96 were still in business after one year In addition for the second follow-up study for 2008 clients 93 of ED Resource clients remained in business compared to 80 for those in the PSED II sample
Impact Study of Entrepreneurial Development 93Resources ndash 2010-2011
Office of Entrepreneurial Development
7 Was the financial impact (job creation job retention and sales) on the clients who were provided servicesassistance by SBA ED Resources (SBDC SCORE and WBC) since 2008 greater than or equal to a representative small business population
The follow-up analyses show that ED Resource assistance has had a substantial impact on the revenue and employment growth of small business clients For 2008 clients the recession appears to have had a negative impact on 2009 revenue though revenue increased for these clients in 2010 Surviving 2008 clients in the second follow-up experienced a 54 increase in revenues from 2009 to 2010 Still 47 of 2008 clients experienced some negative growth in revenues since 2008 The difference in growth rates from 2009 to 2010 for SBA ED Resource clients was shown to be 134 percentage points Although all three benchmarks indicated positive growth during this time SBA ED Resource clientsrsquo progress outpaced the other benchmarks Firms in the 2nd 2008 client follow-up sample increased from a mean of 5 employees to a mean 68 employees Mean employment for firms in the first follow-up of 2009 clients stayed relatively flat with an increase from 73 employees to 74 employees (See Figures 84 85 86 and 88)
Impact Study of Entrepreneurial Development 94Resources ndash 2010-2011
Office of Entrepreneurial Development
X SUMMARY OF QUALITATIVE FINDINGS
In addition to completing the survey multiple ED Resource clients provided additional commentary through their responses to survey invitation e-mails Through these communications clients expressed both positive and negative thoughts and feelings about their experiences with ED Resources This section reviews a selection of these comments
Among the positive comments received clients communicated several themes SBA counselors were professional and genuinely interested in providing help to the client Information provided to the clients by SBDC SCORE and WBC was particularly helpful to
their businessesrsquo development Counselors were willing to take the time to have in-depth discussions about business ideas
and offered many helpful suggestions
A very thankful survey respondent wrote at length about the concerted effort that her counselor put into building a relationship and aiding her business The following is an excerpt from her letter
ldquoI truly appreciated having the opportunity to meet and work with [counselor name] He is a great listener director and mentor His guidance is sound And he has a wonderfully open personality that allows people to feel that they can rely on [him] With his outstanding follow-through [counselor name] never disappointed me in any of my business questions and requestsrdquo
Another ED Resource client took the time to commend his counselor responding very positively to the effect the counselor had on his business
ldquoI just wanted to inform you that [counselor name] was one of the best things that ever happened to my company She displayed exemplary professionalism and helped us out tremendouslyrdquo
One respondent although she was unable to secure credit for her business considered ED Resource assistance to be a valuable learning experience
ldquoI would like to let you know that [ED Resources] helped me a lot and I learned so much from the services they provided me for my businessrdquo
The head of a private educational institution highlighted the flexibility of ED Resources She felt that the counselors served as motivators as well as sources of information
ldquoThe [ED Resources counselors] helped us to identify our issues facilitated discussions about options and helped with the energy and direction to move forward to study those optionshellip [ED Resources] has been a huge help to usrdquo
Impact Study of Entrepreneurial Development 95Resources ndash 2010-2011
Office of Entrepreneurial Development
There was also negative feedback provided by survey respondents regarding their experiences with ED Resources Among the negative comments the most common related to the following
Dissatisfaction with the conduct of their counselors on account of their lack of professionalism or disinterest in helping the client
Finding the information they received financial and otherwise to be less than useful or not applicable to their industry
The unavailability or unresponsiveness of ED Resource counselors in regard to calls or emails placed for inquiries or requests
Some ED Resource clients had difficulty establishing communication lines with their counselors One respondent wrote about his negative experience trying to reach his ED Resource counselor Ultimately the client did not receive any assistance
ldquoA person was chosen for me who was currently unavailable for months as he was not even in the area at the time (even though he lived here)hellip Months later he sent me an email saying he was ready to assist mehellipwe could meet and discuss my problems Problem was I was currently working out of the area supporting my clientrsquos contract I guess that was unsatisfactory for himhellipI never heard from him againrdquo
Several ED Resource clients complained about the outdated nature of the advice they received at times referencing current adverse economic conditions One respondent wrote
ldquoThe counselors didnt have a clue how to help me I was looking for a solid marketing plan Sorry but these guys are dinosaurs Didnt seem to be up on current trends in businesshelliprdquo
After making attempts to receive assistance at multiple ED Resource locations one ED Resource client wrote about her dissatisfaction with the limited knowledge and lack of professionalism of the counselors she met with
ldquoThe gentleman the office set me up with for first meeting did not have any experience in graphic design or what I was mainly interested in obtaining web based businessclients I then made another appointment for their downtown [location] office with two men who I was told knew my fieldhellip The meeting was disastrous One man told me that I should just go door to door to find local clients and to not utilize the Internet at allhelliprdquo
One respondent who sought capital assistance from ED Resources was frustrated at the lack of effort put in by her counselors in spite of her high level of preparedness Ultimately the client was left questioning whether ED Resources volunteers had any genuine interest in helping her business
ldquoI visited with [ED Resources] volunteers twice I found them to be distant and unenthusiastic for the most part I presented a full marketing plan right down to the last detail in a comprehensive binder that I spent two years preparingrdquo
Impact Study of Entrepreneurial Development 96Resources ndash 2010-2011
Office of Entrepreneurial Development
XI RECOMMEDATIONS FOR FURTHER RESEARCH
Measuring the effects of ED Resources on business operations as well as financial and economic outcomes requires longitudinal data that track respondents over time
Further research with this dataset could afford comparison of the effects of different kinds of ED Resource assistance and services on financial and economic outcomes for clients
On the basis of our findings Concentrance offers the following recommendation for further research
An additional study could examine the effects of different types of financing (eg SBA Guarantee Loan vs SBA Disaster Loan) on perceived improvements survival and business growth
Impact Study of Entrepreneurial Development 97Resources ndash 2010-2011
Office of Entrepreneurial Development
[This page is intentionally left blank for two-sided printing]
Impact Study of Entrepreneurial Development 98Resources ndash 2010-2011
Office of Entrepreneurial Development
XII APPENDICES
Impact Study of Entrepreneurial Development 99Resources ndash 2010-2011
Office of Entrepreneurial Development
[This page is intentionally left blank for two-sided printing]
Impact Study of Entrepreneurial Development 100Resources ndash 2010-2011
Office of Entrepreneurial Development
Appendix 1 ndash Survey Response Values by Research Topic
Impact Study of Entrepreneurial Development 101Resources ndash 2010-2011
RESEARCH TOPIC RESEARCH TOPIC SURVEY QUESTIONS SURVEY QUESTIONS RESPONSE CODEDATABASE RESPONSE CODEDATABASE
VALUES VALUES
Demographic Characteristics 7 At the time you were assisted by [SBDC SCORE WBC] what was the approximate annual gross revenue for each of the
Open ended between $1000 and $25000000
calendar years below 2009 ______ 2010 ______
8 Counting yourself how many fill-time employees and part-time employees did you employ at the end of the
following years you were in business
Open ended
2009 FullPart ______ 2010 FullPart ______
10 If you are in business what is the primary type of
business Construction Manufacturing Consulting Wholesale Finance Ins and Real
Estate Entertainment Retail Restaurant Engineering Publishing Education
Construction=1 or 0 Manufacturing=1 or 0 Consulting =1 or 0 Wholesale =1 or 0
Finance Ins And Real Estate =1 or 0 Entertainment =1 or 0 Retail =1 or 0 Restaurant =1 or 0 Engineering =1 or 0 Publishing =1 or 0 Education =1 or 0 Service =1 or 0 Health Care =1 or 0 Day Care =1 or 0 Transportation =1 or 0 Technology =1 or 0 Health Wellness or Fitness Yes=1 No= 0 Other = open ended No response
=N
Service Health Care Day Care Transportation Technology Health Wellness andor
Fitness Other
11 Indicate the geographic location of your primary
business
Urban Suburban Rural
Office of Entrepreneurial Development
RERESEARCH TOPIC SEARCH TOPIC SURVEY QUESTIONS SURVEY QUESTIONS SURVEY QUESTIONS RESPONSE CODEDATABASE RESPONSE CODEDATABASE
VALUES VALUES 12 What lead to your decision
to seek business counseling Tried other alternatives Reputation of
SBDCSCOREWBC Lowfree cost of service Referred by
16 Gender Male=1 Female=2 Male and Female Owners=3 No response = N
17 Veteran Status Veteran=1 Service-disabled Veteran=2 Reservist=3 National Guard Member=4 Non-veteran=5 No response= N
18 Age 18-24= 1 25-34 = 2 35-44 = 3 45-54 = 4 55-64 = 5 65-74 = 6 75+ = 7 No response = N
19 Are you Hispanic or Latino Not HispanicLatino Origin
Hispanic or Latino=1 Not of HispanicLatino Origin=0 No response = N
20 Are you American IndianAlaskan Native Asian BlackAfrican American Native HawaiianPacific Islander White
American Indian or Alaskan =1 or 0 Asian =1 or 0 Black or African American =1 or 0 Native Hawaiian or Pacific Islander =1or 0 White =1 or 0 No response = N
Is there a positive relationship between the servicesassistance provided by SBA ED Resources and the clientrsquos perceptions of the usefulness and value of the servicesassistance received
6 Pleas indicate how useful the services were that you received from the counselor who assisted you in identifying and correcting problems in operating your business Relevancy of Counseling Timeliness of Counseling Helpfulness of Counseling
13 Please indicate the value of the information you received from the [WBC SCORE SBDC] counselor you visited
1 Usefulness of information 2 Relevancy of the
information 3 Timeliness of the
information
Extremely Valuable=5 Valuable=4 No Opinion=3 Somewhat Valuable=2 Not Valuable=1 No response = N
15 I would refer the counseling services I reto other small business
ceived es
Strongly Agree=5 Agree=4 No Opinion=3 Disagree=2 Strongly Disagree=1 other=open ended No response = N
Impact Study of Entrepreneurial Development 102Resources ndash 2010-2011
RESEARCH TOPIC RESEARCH TOPIC SURVEY QUESTIONS SURVEY QUESTIONS RESPONSE CODEDATABASE RESPONSE CODEDATABASE
VALUES VALUES
Is there a positive relationship between the servicesassistance provided by SBA ED Resources and
the clientrsquos perceived quality of the counseling
experience
14 Please indicate the counselorrsquos effectiveness in
assisting you 1 The counselor exhibited excellent customer service
techniques 2 The counselor was able
to assist me 3 The counselor exhibited a high level of professionalism
4 The counselor was knowledgeable of current
management practices and issues
5 The counselor identified with my needs
6 I would rate my overall experience with the counselor as excellent
Strongly Agree=5 Agree=4 No Opinion=3 Disagree=2 Strongly Disagree=1 other=open ended No response = N
Is there a positive relationship between the servicesassistance provided by SBA ED Resources and the clientrsquos decision to start a
business
2 If you were not in business at the time you were assisted by the counselor did you decide to go into business as a
result of that assistance
Yes = 1 No=0 No Response = N
Is there a positive relationship between the servicesassistance provided by SBA ED Resources and clientsrsquo decisions to implement andor change management andor marketing practices in their
business
3 As a result of the assistance you received have you changed any of your current
management practices
Yes=1 No=0 No response = N
Office of Entrepreneurial Development
Impact Study of Entrepreneurial Development 103Resources ndash 2010-2011
RESEARCH TOPIC RESEARCH TOPIC SURVEY QUESTIONS SURVEY QUESTIONS RESPONSE CODEDATABASE RESPONSE CODEDATABASE
VALUES VALUES
4 As a result of the assistance I received from the [WBC SCORE SBDC] counselor I was able to develop [ie Business Plan] in order to start or better manage my business [Check all that apply]
Business Plan Marketing Plan Promotional Plan Pricing Strategy Cash Flow Analysis General Management Loan Package Hiring Plan Training Plan for Staff Financial Strategy Web-based Strategy Purchasing Strategy Feasibility Plan Production Plan Distribution Plan International Trade Other
If checked = 1 Not checked = 0 Other =open ended No response = N
Is there a positive relationship between the servicesassistance provided by SBA ED Resources and the clientsrsquo businesses having a positive financial impact on job creation and
retention and increase in sales
5 Please indicate the impact these changes have had on
your firm 1 Increase my sales 2 Improve my cash flow 3 Acquire a bank loan 4 Expand my products
services 5 Hire new staff 6 Revise my marketing
strategy 7 Increase my profit margin 8 Retain current staff 9 Acquire a SBA guarantee
loan 10 Acquire a government
contract 11 Acquire a SBA Disaster
loan 12 Other
Strongly Agree=5 Agree=4 No Opinion=3 Disagree=2 Strongly Disagree=1 other=open ended No response = N
9 If you were projecting to reduce your total number of
employees prior to counseling by SBDCSCOREWBC how many positions have you
retained due to the counseling Full time _____ Part time _____
Open Ended
Office of Entrepreneurial Development
Impact Study of Entrepreneurial Development 104Resources ndash 2010-2011
RESEARCH TOPIC RESEARCH TOPIC SURVEY QUESTIONS SURVEY QUESTIONS RESPONSE CODEDATABASE RESPONSE CODEDATABASE
VALUES VALUES
General Business 1i Are you currently in business
Yes=1 No=0 No response = N
1ii If yes when was the business started
mmyyyy
1iii What is the zip code of your business
Xxxxx
1a If NO when do you plan on starting a business
Within 30 days=1 31-90 days=2 91-120 days=3 No idea at this time=4 No response = N
1b Have you ever been in business
Yes=1 No=0 No response = N
1bi If YES when was the business started
mmyyyy
21i Did you utilize any other SBA resourcesprogram
Yes=1 No=0 No response = N
21ii If YES select those you used [Check all that apply]
SBDC SCORE WBC SBArsquos Guarantee Loan Programs
SBIC Venture Capital Program
Government contracting SBArsquos Surety Bond Program Small Business Training
Network (Online Training)
Disaster Assistance
SCORE =1 or 0 SBDC =1 or 0 Women Business Center =1 or 0
SBArsquos Guarantee Loan Programs =1 or 0 SBIC Financing Program
=1 or 0 SBArsquos Surety Bond Program =1 or 0 No response = N
Office of Entrepreneurial Development
Impact Study of Entrepreneurial Development 105Resources ndash 2010-2011
Office of Entrepreneurial Development
[This page is intentionally left blank for two-sided printing]
Impact Study of Entrepreneurial Development 106Resources ndash 2010-2011
Office of Entrepreneurial Development
Appendix 2 ndash Quantified Survey Results ndash Initial Survey 2010 Clients
Impact Study of Entrepreneurial Development 107Resources ndash 2010-2011
Surveys Questions Percentage of Sample Q1) Are you currently in business
Yes 7476 No 2524Missing 000
Q1a) If no when do you plan on starting a business
Within 30 days 127 31-90 days 362 91-120 days 451 No idea at this time 1542 Missing 7517
Q1b) Have you ever been in business
Yes 918 No 1605 Missing 7478
Q2) If you were not in business at the time you were assisted by the
counselor did you decide to go into business as a result of that
assistance Yes 1605 No 2817Not Applicable (already in
business) 5542
Missing 036 Q3) As a result of the assistance
you received have you changed any of your current management
practicesstrategies
Yes 4486
No 2931 Missing 2583
Q4) As a result of the assistance I received from the counselor I was
able to develop [ie Business Plan] in order to start or better manage my business
Business Plan 3498 Loan Package 829 Purchasing Strategy 407 Marketing Plan 2982 Hiring Plan 482 Feasibility Plan 789 Promotional Plan 1284 Training Plan for Staff 369 Production Plan 406 Pricing Strategy 1439 Financial Strategy 1869 Distribution Plan 330 Cash Flow Analysis 1693 Web-based Strategy 1036 International Trade 147
StGeneral Management
rategy 1779 Other 835
Q5) Please indicate the impact of these changes have had on your firm Strongly Agree=SA Agree=A No Opinion-No Disagree=D Strongly Disagree=SD]
SA A NO D SD Missing
I was able to Increase my sales 725 1803 2870 636 449 3517 Improve my cash flow 682 1816 2827 674 445 3555 Acquire a bank loan 489 518 3631 974 649 3739 Expand my productsservices 666 1702 2808 756 468 3599 Hire new staff 323 817 3664 911 515 377 Revise my marketing strategy 1218 2726 1728 531 392 3404 Increase my profit margin 555 1605 2941 759 471 3669 Retain current staff 337 1177 3628 582 466 3809 Acquire a SBA guarantee loan 313 286 3791 1052 735 3823 Acquire a government contract 127 232 4015 1071 700 3855 Acquire a SBA Disaster loan 030 062 4206 1088 695 3920 Other 559 195 1314 075 241 7616
Office of Entrepreneurial Development
Impact Study of Entrepreneurial Development 108Resources ndash 2010-2011
Q6) Please indicate how useful the services were that you received
from the counselor who assisted you in identifying and correcting problems in operating your business [Very Useful=VU Useful=U No Opinion-NO Somewhat Useful =SU Not Useful =NU]
VU U NO SU NU Missing
Relevancy of Counseling 3720 2023 318 541 525 2872Timeliness of Counseling 3647 2088 505 393 473 2895Helpfulness of Counseling 3855 1960 297 463 540 2885Q7) At the time you were assisted by [SBDCSCOREWBC] what was the approximate annual gross revenue for each of the calendar years below
2009 Revenue given 3205 Missing 6795
2010 Revenue given 3366 Missing 6633
Q8) Counting yourself how many full-time employees and part-time employees did you employ at the end of the following years you were in business
2010 Full-time jobs Average = 27 2009 Full-time jobs Average = 38 2010 Part-time jobs Average = 17 2009 Part-time jobs Average = 28
Q9) At the time you were assisted by [SBDCSCOREWBC] what was the approximate annual gross revenue for each of the calendar years below
Existing Full-time jobs saved Total Full-time Jobs Saved ndash 3768
Existing Part-time jobs saved Total Part-time Jobs Saved ndash 3203
Firms that saved jobs 3746
Office of Entrepreneurial Development
Impact Study of Entrepreneurial Development 109Resources ndash 2010-2011
Q10) If you are in business what is the primary type of business (This question includes multiple responses)
Construction 352 Manufacturing 539 Consulting 522 Wholesale 256 Finance Insurance Real
Estate
188 Entertainment 116 Retail 723
and Drinking Restaurant andor Eating
266 Engineering 095 Publishing 075 Education 181 Service 923 Health Care 216 Day Care 065 Transportation 086 Technology 302
Fi Health Wellness andor
tness 261
Other 1433
Missing 3400 Q11) Indicate the geographic
location of your primary business
Rural 1454 Suburban 2688 Urban 2369 Missing 3489
Q12) What led to your decision to seek business counseling from [SBDCSCOREWBC]
Tried other alternatives but was dissatisfied 821
Reputation of [SBDCSCOREWBC] 4392 Lowfree cost of service 4578
Referred by _____ 3819
Office of Entrepreneurial Development
Impact Study of Entrepreneurial Development 110Resources ndash 2010-2011
Office of Entrepreneurial Development
Q13) Please indicate the value of the information [Extremely Valuable=EV Valuable=V No Opinion=NO Somewhat Valuable=SV Not Valuable=NV]
EV V NO SV NV Missing
Usefulness of Information 4278 3067 318 772 585 980 Relevancy of the Information 4148 3127 393 739 576 1016 Timeliness of the Information 4008 3118 599 636 564 1074 Q14) Please indicate the counselors effectiveness in assisting you [Strongly Agree=SA Agree=A No Opinion-No Disagree=D Strongly Disagree=SD]
SA A NO D SD Missing
The counselor exhibited excellent customer service techniques 5003 2923 498 233 243 1100 The counselor was able to assist me 4397 3081 608 423 397 1094 The counselor exhibited a high level of professionalism 5383 2767 404 148 201 1097 The counselor was knowledgeable of current management practices and issues 4707 2925 784 233 252 1099 The counselor identified with my needs 4426 3039 677 386 374 1098 I would rate my overall experience with the counselor as excellent 4803 2632 631 439 385 1111 Q15) I would refer the counseling services I received to other small businesses [Strongly Disagree=SA Agree=A No Opinion=NO Disagree=D Strongly Disagree=SD]
SA A NO D SD Missing
4847 1515 450 983 1142 1062 Q16) Gender
Male 3560 Female 3576 Both male and female 1698 Missing 1166
Q17) Veteran Status Veteran 858 Service-disabled Veteran 207 Reservist 032 National Guard Member 035 Non-veteran 7524 Missing 1343
Impact Study of Entrepreneurial Development 111Resources ndash 2010-2011
Q18) Age 18-24 169 25-34 1280 35-44 2157 45-54 2752 55-64 2047 65-74 409
75 + 070 Missing 1117
Q19) Are you HispanicLatino 661 Non-HispanicLatino 9339 Missing 0
Q20) Are you American Indian or
Alaskan Native 174 Asian 351 Black or African American 1135Native Hawaiian or Pacific
Islander 053 White 6838Missing 1634
Q21) Did you utilize any other SBA resourcesprogram
Yes 2510 No 5412 Missing 2078
Q21 cont) If yes select those you used
SCORE 792 SBArsquos Guarantee Loan
Program 657 Women Business Center 382 SBIC Venture Capital
Program
041 Government Contracting 322 SBDC 396 SBArsquos Surety Bond
Program
025 Small Business Training
Network (Online Assistance) 627 Disaster Assistance 033 Missing 2885
Office of Entrepreneurial Development
Impact Study of Entrepreneurial Development 112Resources ndash 2010-2011
Office of Entrepreneurial Development
Appendix 3 ndash Quantified Survey Results ndash Follow-up Survey 2010 Clients
2008 2nd Follow Up Results Data
Impact Study of Entrepreneurial Development 113Resources ndash 2010-2011
Surveys Questions Percentage of Sample Q1) Are you currently in business
Yes 8650 No 1350Missing 000
Q2) If no when do you plan on starting a business
Within 30 days 050 31-90 days 000 91-120 days 000 No idea at this time 1300 Missing 8650 Q3) Have you ever been in
business
Yes 950 No 400 Missing 8650
Q4) As a result of the assistance received from the
[SBDCWBCSCORE] Counselor which of the following were you able to develop [ie Business Plan] in order to start or better manage your business [Check all
that apply]
Business Plan 4500 Loan Package 4400Purchasing Strategy 2000 Marketing Plan 1700 Hiring Plan 2450Feasibility Plan 2700 Promotional Plan 1150 Training Plan for Staff 850
Production Plan 400 Pricing Strategy 2050Financial Strategy 1600 Distribution Plan 450
Cash Flow Analysis 1550 Web-based Strategy 950
International Trade 500 General Management 250 Other 1400
Surveys Questions Percentage of Sample
Q5) What was the approximate annual gross revenue of your
business in 2010
Reported 6950 Missing 3050
Q6) Currently how many people (full and part time) including yourself does your business employ
Average Full-Time 55 employees Average Part-Time 18 employees
Q7) Have you utilized any other SBA resourcesprogram
Yes 2200 No 7600 Missing 200
Q8) If YES select those you used [check all that apply]
SCORE 600 SBArsquos Loan Guarantee Programs 150 SBDC 050
SBIC Venture Capital
Program
100 Woman Business Center 550 Government Contracting 000
SBArsquos Surety Bond
Program
100
Small Business Training Network (online training) 300
2009 1st Follow Up Results Data Surveys Questions Percentage of Sample
Q1) Are you currently in business Yes 8298 No 1702 Missing 000
Q2) If no when do you plan on starting a business
Within 30 days 097 31-90 days 152 91-120 days 203 No idea at this time 1225 Missing 8323
Office of Entrepreneurial Development
Impact Study of Entrepreneurial Development 114Resources ndash 2010-2011
Q3) Have you ever been in business
Yes 874 No 813 Missing 8313
Q4) As a result of the assistance received from the [SBDCWBCSCORE] Counselor which of the following were you able to develop [ie Business Plan] in order to start or better manage your business [Check all that apply]
Business Plan 4761 Loan Package 1250 Purchasing Strategy 386 Marketing Plan 3283 Hiring Plan 493 Feasibility Plan 1133 Promotional Plan 1418
Production Plan 371 Pricing Strategy 1499 Financial Strategy 2190 Distribution Plan 234 Cash Flow Analysis 2236 Web-based Strategy 884 International Trade 168 General Management 2266 Other 1758
Q5) What was the approximate annual gross revenue of your business in 2010
Reported 6850 Missing 3150
Q6) Currently how many people (full and part time) including yourself does your business employ
Average Full-Time 49 employees Average Part-Time 34 employees
Q7) Have you utilized any other SBA resourcesprogram
Yes 2602 No 6565 Missing 833
Training Plan for Staff
Surveys Questions Percentage of Sample
300
Office of Entrepreneurial Development
Impact Study of Entrepreneurial Development 115Resources ndash 2010-2011
Surveys Questions Percentage of Sample
Q8) If YES select those you used [check all that apply]
SCORE 986 SBArsquos Loan Guarantee
Programs 655 SBDC 412 SBIC Venture Capital
Program 025 Woman Business Center 310 Government Contracting 381 SBArsquos Surety Bond
Program 020 Small Business Training
Network (online training) 503
Office of Entrepreneurial Development
Impact Study of Entrepreneurial Development 116Resources ndash 2010-2011
Office of Entrepreneurial Development
Appendix 4 ndash Initial Study Survey Instrument
US Small Business Administration Office of Entrepreneurial Development
Initial Economic Impact Survey OMB Number 3245‐0351 Expiration 03312013
Dear Small Business Client
Thank you for your recent visit to [the Small Business Development Center (SBDC) SCORE the Womenrsquos Business Center (WBC)] one of SBArsquos Entrepreneurial Development (ED) Resource Partners We hope you found the business assistance you sought The SBA is always striving to better its programs and deliver relevant and meaningful assistance We want to know if our programs and services are helping the economy by providing useful information on starting and managing a business and eventually helping your business create jobs increasing your businessrsquo revenues and in general fueling the entrepreneurial spirit in America
We would appreciate you taking a few minutes to answer some brief questions that will help us know the quality and impact of the programs All responses to these questions are voluntary and will be held in confidence The data will not be released to any other government agency or private firm Please answer the following questions based on your visit to [the Small Business Development Center (SBDC) SCORE the Womenrsquos Business Center (WBC)]
1 Are you currently in business Yes No If YES when was the business started _ __ _ _ _
mm yyyy What is the zip code of your business location __ __ __ __ __
If Yes to Question 1 skip to Question 2 If No continue to 1a
1a If NO (to Question 1) when do you plan on starting a business Within 30 days 31‐90 days 91‐120 days No idea at this time
1b If NO (to Question 1) have you ever been in business Yes No If YES when was the business started _ _ _ _ _ _
mmyyyy
2 If you were not in business at the time you were assisted by the counselor did you decide to go into business as a result of that assistance
Yes No Not applicable (already in business)
Impact Study of Entrepreneurial Development 117Resources ndash 2010-2011
Office of Entrepreneurial Development
If you answered NO to Question 1 please skip ahead to Question 12
3 As a result of the assistance you received have you changed any of your current management practicesstrategies Yes No
4 As a result of the assistance I received from the [SBDC SCORE WBC] Counselor I was able to develop one or more of the following (ie Business Plan) in order to better manage my business [Check all that apply]
Business Plan Loan Package Purchasing Strategy Marketing Plan Hiring Plan Feasibility Plan Promotional Plan Training Plan for Staff Production Plan Pricing Strategy Financial Strategy Distribution Plan Cash Flow Analysis Web Based Strategy International Trade General Management Other ________________________
5 Please indicate the impact your counseling experience had on your firm [Strongly Agree=SA Agree=A No Opinion=NO Disagree=D Strongly Disagree=SD]
SA A NO D SD I was able to 1 Increase my sales 5 4 3 2 1 2 Improve my cash flow 5 4 3 2 1 3 Acquire a bank loan 5 4 3 2 1 4 Expand my productsservices 5 4 3 2 1 5 Hire new staff 5 4 3 2 1 6 Revise my marketing strategy 5 4 3 2 1 7 Increase my profit margin 5 4 3 2 1 8 Retain current staff 5 4 3 2 1 9 Acquire a SBA guarantee loan 5 4 3 2 1 10 Acquire a government contract 5 4 3 2 1 11 Acquire a SBA Disaster loan 5 4 3 2 1 12 Other (specify ____________________) 5 4 3 2 1
6 Please indicate how useful the services were that you received from the counselor who assisted you in identifying and correcting problems in operating your business
Impact Study of Entrepreneurial Development 118Resources ndash 2010-2011
Very No Somewhat Not Useful Useful Opinion Useful Useful
1 Relevancy of Counseling 5 4 3 2 1 2 Timeliness of Counseling 5 4 3 2 1 3 Helpfulness of Counseling 5 4 3 2 1
Office of Entrepreneurial Development
7 At the time you were assisted by [the Small Business Development Center (SBDC) SCORE the Womenrsquos Business Center (WBC)] what was the approximate annual gross revenue for each of the calendar years below [All data will be held in strict confidence and reported only in the aggregate without identifying any individual small business] Enter dollar figures only Do not include commas or currency symbols
2009 __________________________ 2010 __________________________
8 Counting yourself how many full‐time employees (35 hours or more per week) and part‐time employees (less than 35 hours per week) did you employ at the end of the following years you were in business
2009 _______________ Number of Full‐time employees 2010 _______________ Number of Full‐time employees
2009 _______________ Number of Part‐time employees 2010 _______________ Number of Part‐time employees
9 If you were projecting to reduce your total number of employees prior to receiving counseling from [SBDC SCORE WBC] how many positions have you retained due to the counseling
Existing Full‐time jobs saved ___________ Existing Part‐time jobs saved ___________
10 What is your firmrsquos primary type of business [Please choose only one]
Construction Manufacturing Consulting Wholesale Finance Insurance and Real Estate Entertainment Retail Restaurant andor Eating and Drinking Engineering Publishing Education Service Health Care Day Care Transportation Technology Health Wellness andor Fitness Other (describe) _______________________
11 Indicate the geographic location of your primary business Rural Suburban Urban
12 What led to your decision to seek business counseling from [SBDC SCORE WBC] [Check all that apply]
Tried other alternatives and was dissatisfied Reputation of [SBDC SCORE WBC] Lowfree cost of service Referred by __________________________________
(Fill in blank or add options such as SBA office of ______ )
Other _______________________________________ (Fill in the blank)
Impact Study of Entrepreneurial Development Resources ndash 2010-2011
119
Office of Entrepreneurial Development
13 Please indicate the value of the information you received from the counselor you visited
Extremely No Somewhat Not Valuable Valuable Opinion Valuable Valuable
1 Usefulness of Information 5 4 3 2 1 2 Relevancy of Information 5 4 3 2 1 3 Timeliness of Information 5 4 3 2 1
14 Please indicate the counselorrsquos effectiveness in assisting you [Strongly Agree=SA Agree=A No Opinion=NO Disagree=D Strongly Disagree=SD]
SA A NO D SD 1 The counselor exhibited excellent
customer service techniques 5 4 3 2 1 2 The counselor was able to assist me 5 4 3 2 1 3 The counselor exhibited a high level of
professionalism 5 4 3 2 1 4 The counselor was knowledgeable of current
management practices and issues 5 4 3 2 1 5 The counselor identified with my needs 5 4 3 2 1 6 I would rate my overall experience with
the counselor as excellent 5 4 3 2 1
15 I would refer the counseling services I received to other small businesses
Strongly Agree Agree No Opinion Disagree Strongly Disagree
16 Gender Male owner(s) Female owner(s) Both male and female owners
17 Veterans status Veteran Service‐disabled Veteran Reservist National Guard member Non‐Veteran
18 Age [Circle one] 18‐24 25‐34 35‐44 45‐54 55‐64 65‐74 75+
19 Are you Hispanic or Latino Not of Hispanic or Latino Origin
20 Are you [Please choose one or more] American Indian or Alaskan Native Asian Black or African American Native Hawaiian or Pacific Islander White
Impact Study of Entrepreneurial Development 120Resources ndash 2010-2011
Office of Entrepreneurial Development
21 Did you utilize any of the following SBA resources or programs Yes No
If YES select those you used [Check all that apply] SBDC SCORE SBArsquos Guarantee Loan programs Women Business Center SBIC Venture Capital Program Government Contracting SBArsquos Surety Bond Program Small Business Training Network Disaster Assistance (On‐line training)
PLEASE NOTE The estimated burden for completing this form is 12 minutes per response You are not required to respond to any collection of information unless it displays a currently valid OMB approval number Comments on the burden should be sent to US Small Business Administration Chief AIB 409 3rd St SW Washington DC 20416 and Desk Officer for the Small Business Administration Office of Management and Budget New Executive Building Room 10202 Washington DC 20503 OMB Approval (3245‐0351) PLEASE DO NOT SEND FORMS TO OMB
SBA Form 2214 THANK YOU
Impact Study of Entrepreneurial Development 121Resources ndash 2010-2011
Office of Entrepreneurial Development
[This page is intentionally left blank for two-sided printing]
Impact Study of Entrepreneurial Development 122Resources ndash 2010-2011
Office of Entrepreneurial Development
Appendix 5 ndash Follow-up Survey
US Small Business Administration Office of Entrepreneurial Development Follow‐up Economic Impact Survey
OMB Number 3245‐0351 Expiration 03312013
Dear Small Business Client
Within the last twelve months you were kind enough to respond to our request for some initial data regarding your visit(s) to SBArsquos Entrepreneurial Development resource the [Small Business Development Center (SBDC) Womenrsquos Business Center (WBC) SCORE] To continually understand the impact our programs and services are having on the economy it would be helpful to know if our assistance to you regarding starting and managing a business resulted in job creation increases in your businessrsquo revenues or other results
We understand that you responded to a thorough survey not so long ago but we ask that you help us in answering a few questions for this follow‐up survey which will take less than 5 minutes All responses to these questions are voluntary and will be held in confidence The data will not be released to any other government agency or private firm Based on your visit to the [SBDC WBC SCORE] please use that experience as a benchmark to answer the following
1 Are you currently in business Yes No
If YES when was the business started _ __ _ _ _ mm yyyy
2 If NO when do you plan on starting a business Within 30 days 31‐90 days 91‐120 days No idea at this time
3 Have you ever been in business Yes No If YES when was the business started _ __ _ _ _
mm yyyy
Impact Study of Entrepreneurial Development 123Resources ndash 2010-2011
Office of Entrepreneurial Development
4 As a result of the assistance received from the [SBDCWBCSCORE] Counselor which of the following were you able to develop [ie Business Plan] in order to start or better manage your business [Check all that apply]
Business Plan Loan Package Purchasing Strategy Marketing Plan Hiring Plan Feasibility Plan Promotional Plan Training Plan for Staff Production Plan Pricing Strategy Financial Strategy Distribution Plan Cash Flow Analysis Web Based Strategy International Trade General Management Other ________________________________________
5 What was the approximate annual gross revenue of your business in 2010 $________________00
6 Currently how many people (full and part‐time) including yourself does your business employ
Number of Full‐Time Employees _________________________ Number of Part‐Time Employees _________________________
7 Have you utilized any other SBA resourcesprogram Yes No
8 If YES select those you used [Check all that apply]
SCORE SBArsquos Guarantee Loan programs SBDC SBIC Venture Capital Program Women Business Center Government Contracting SBArsquos Surety Bond Program Small Business Training Network
(online training)
PLEASE NOTE The estimated burden for completing this form is less than 5 minutes per response You are not required to respond to any collection of information unless it displays a currently valid OMB approval number Comments on the burden should be sent to US Small Business Administration Chief AIB 409 3rd St SW Washington DC 20416 and Desk Officer for the Small Business Administration Office of Management and Budget New Executive Building Room 10202 Washington DC 20503 OMB Approval (TBD) PLEASE DO NOT SEND FORMS TO OMB
THANK YOU
Impact Study of Entrepreneurial Development 124Resources ndash 2010-2011
Office of Entrepreneurial Development
Appendix 6 ndash Regression Computations
Regression Results Effects of Firm and Demographic Characteristics on Perceived Usefulness Assistance with the Decision to Start a Business and Financial Impact
Dependent Variable
Independent Variable
Perceived Usefulness
Assistance with Decision to Start a Business (LR)
Financial Impact
Intercept -124024 240905 -191586
SBDC 19242 -040279 48574
SCORE 15332 -072576 49471
lt 3 hours -24964 011296 -53896
Log of Sales 4661 -013453 3762
Gender 2158 -012057 59382
Veteran 6455 00601 4318
Latino -006 -041537 35888
Age 3223 -003744 40697
Native American 61156 038098 -7369
Asian 21109 -082348 46016
Black 44458 -051198 66021
HawaiianPacific Islander
-32923 -075983 -126224
White 42644 -055758 29757
Inbus 49901 -120888 8468
R-Square 0015 0088 0008
Significant at 001 level Significant at 005 level Significant at 010 level
Impact Study of Entrepreneurial Development 125Resources ndash 2010-2011
Office of Entrepreneurial Development
[This page is intentionally left blank for two-sided printing]
Impact Study of Entrepreneurial Development 126Resources ndash 2010-2011
Office of Entrepreneurial Development
Appendix 7 ndash State-by-State Data The tables below display national response data segmented by ED Resource and in aggregate for total ED Resources
SBDC Clients
ED Resource State Surveys Received
SBDC Client Contacts Received
Response Rate
of Total SBDC Clients
SBDC AL 78 342 23 15SBDC AK 9 48 19 02SBDC AS 2 8 25 00SBDC AZ 71 396 18 14SBDC AR 54 207 26 11SBDC CA 527 2593 20 103SBDC CO 101 330 31 20SBDC CT 75 238 32 15SBDC DC 12 45 27 02SBDC DE 16 60 27 03SBDC FL 235 1233 19 46SBDC GA 180 631 29 35SBDC GU 3 9 33 01SBDC HI 23 93 25 04SBDC ID 26 100 26 05SBDC IL 208 957 22 41SBDC IN 124 470 26 24SBDC IA 71 222 32 14SBDC KS 54 207 26 11SBDC KY 77 312 25 15SBDC LA 84 345 24 16SBDC ME 25 97 26 05SBDC MD 93 405 23 18SBDC MA 104 489 21 20SBDC MI 257 765 34 50SBDC MN 99 380 26 19SBDC MS 43 222 19 08SBDC MO 91 381 24 18SBDC MT 22 69 32 04SBDC NE 28 128 22 05SBDC NV 39 153 25 08SBDC NH 17 96 18 03SBDC NJ 143 648 22 28SBDC NM 40 141 28 08SBDC NY 321 1451 22 63SBDC NC 184 621 30 36SBDC ND 8 49 16 02SBDC OH 185 871 21 36
Impact Study of Entrepreneurial Development 127Resources ndash 2010-2011
Office of Entrepreneurial Development
Impact Study of Entrepreneurial Development Resources ndash 2010-2011
ED Resource State Surveys Received
SBDC Client Contacts Received
Response Rate
of Total SBDC Clients
SBDC OK 63 266 24 12 SBDC OR 80 264 30 16 SBDC PA 253 948 27 49 SBDC PR 62 294 21 12 SBDC RI 14 45 31 03 SBDC SC 66 309 21 13 SBDC SD 11 55 20 02 SBDC TN 98 438 22 19 SBDC TX 210 1190 18 41 SBDC UT 56 180 31 11 SBDC VI 5 10 50 01 SBDC VT 13 48 27 03 SBDC VA 151 546 28 30 SBDC WA 149 423 35 29 SBDC WV 24 138 17 05 SBDC WI 117 378 31 23 SBDC WY 12 39 31 02
Totals 5113 20956 1000
SCORE Clients
SCORE Client of Total Surveys Contacts Response SCORE
ED Resource State Received Received Rate Clients SCORE AL 12 99 12 03SCORE AK 0 2 0 00SCORE AZ 113 565 20 25SCORE AR 30 149 20 07SCORE CA 416 2571 16 94SCORE CO 137 484 28 31SCORE CT 161 791 20 36SCORE DC 19 93 20 04SCORE DE 41 211 19 09SCORE FL 309 1619 19 70SCORE GA 62 446 14 14
SCORE HI 26 77 34 06SCORE ID 24 99 24 05SCORE IL 154 994 15 35SCORE IN 73 403 18 16SCORE IA 36 162 22 08
SCORE KS 16 80 20 04SCORE KY 68 335 20 15SCORE LA 19 118 16 04SCORE ME 48 179 27 11
128
Office of Entrepreneurial Development
ED Resource State Surveys Received
SCORE Client Contacts Received
Response Rate
of Total SCORE Clients
SCORE MD 74 374 20 17SCORE MA 164 781 21 37SCORE MI 108 431 25 24SCORE MN 135 626 22 30SCORE MS 2 20 10 00SCORE MO 49 257 19 11SCORE MT 14 52 27 03SCORE NE 15 108 14 03SCORE NV 64 487 13 14SCORE NH 86 334 26 19SCORE NJ 90 467 19 20SCORE NM 31 111 28 07SCORE NY 268 1368 20 60SCORE NC 180 724 25 41SCORE ND 14 67 21 03SCORE OH 225 951 24 51SCORE OK 14 63 22 03SCORE OR 119 588 20 27SCORE PA 254 1081 23 57SCORE RI 13 79 16 03SCORE SC 87 413 21 20SCORE SD 3 14 21 01SCORE TN 68 354 19 15SCORE TX 209 1093 19 47SCORE UT 35 100 35 08SCORE VT 27 116 23 06SCORE VA 112 450 25 25SCORE WA 118 571 21 27SCORE WV 5 24 21 01SCORE WI 97 398 24 22
SCORE WY 0 2 0 00
Total 4444 21981 1000
Impact Study of Entrepreneurial Development 129Resources ndash 2010-2011
WBC Clients
ED Resource State Surveys Received
WBC Client Contacts Received
Response Rate
of Total WBC Clients
WBC AL 28 105 27 48WBC AK 1 4 25 02WBC AS 0 9 0 00WBC AZ 1 18 6 02WBC CA 91 518 18 154WBC CO 4 45 9 07
ED Resource State Surveys Received
WBC Client Contacts Received
Response Rate
of Total WBC Clients
WBC CT 4 35 11 07WBC DC 17 91 19 29WBC DE 4 19 21 07WBC FL 15 78 19 25WBC GA 7 50 14 12WBC IL 11 103 11 19WBC IN 30 173 17 51WBC IA 3 15 20 05WBC KS 12 64 19 20WBC LA 8 79 10 14WBC ME 12 42 29 20WBC MD 21 66 32 36WBC MA 3 18 17 05WBC MI 23 123 19 39WBC MN 9 35 26 15WBC MO 7 37 19 12WBC MT 16 49 33 27WBC NE 8 34 24 14WBC NV 8 48 17 14WBC NM 15 74 20 25WBC NY 43 147 29 73WBC NC 77 480 16 131WBC OH 1 30 3 02WBC OK 9 18 50 15WBC PA 9 48 19 15WBC PR 5 32 16 08WBC RI 4 18 22 07WBC SC 2 10 20 03WBC TN 5 10 50 08WBC TX 28 172 16 48WBC UT 7 27 26 12WBC VT 5 20 25 08WBC VA 6 10 60 10WBC WA 12 85 14 20WBC WV 2 10 20 03WBC WI 16 105 15 27WBC WY 0 8 0 00
Total 589 3162 1000
Office of Entrepreneurial Development
Impact Study of Entrepreneurial Development 130Resources ndash 2010-2011
Office of Entrepreneurial Development
Total ED Resources Clients
Total ED Resources of Total Client ED
Surveys Contacts Response Resources ED Resource State Received Received Rate Clients Total ED Resources AL 118 546 22 12 Total ED Resources AK 10 54 19 01 Total ED Resources AS 2 17 12 00 Total ED Resources AZ 185 979 19 18 Total ED Resources AR 84 356 24 08 Total ED Resources CA 1034 5682 18 102 Total ED Resources CO 242 859 28 24 Total ED Resources CT 240 1064 23 24 Total ED Resources DC 48 229 21 05 Total ED Resources DE 61 290 21 06 Total ED Resources FL 559 2930 19 55 Total ED Resources GA 249 1127 22 25 Total ED Resources GU 3 9 33 00 Total ED Resources HI 49 170 29 05 Total ED Resources ID 50 199 25 05
Total ED Resources IL 373 2054 18 37 Total ED Resources IN 227 1046 22 22 Total ED Resources IA 110 399 28 11 Total ED Resources KS 82 351 23 08 Total ED Resources KY 145 647 22 14 Total ED Resources LA 111 542 20 11 Total ED Resources ME 85 318 27 08 Total ED Resources MD 188 845 22 19 Total ED Resources MA 271 1288 21 27 Total ED Resources MI 388 1319 29 38 Total ED Resources MN 243 1041 23 24 Total ED Resources MS 45 242 19 04 Total ED Resources MO 147 675 22 14 Total ED Resources MT 52 170 31 05 Total ED Resources NE 51 270 19 05 Total ED Resources NV 111 688 16 11 Total ED Resources NH 103 430 24 10 Total ED Resources NJ 233 1115 21 23 Total ED Resources NM 86 326 26 08 Total ED Resources NY 632 2966 21 62 Total ED Resources NC 441 1825 24 43 Total ED Resources ND 22 116 19 02 Total ED Resources OH 411 1852 22 41 Total ED Resources OK 86 347 25 08 Total ED Resources OR 199 852 23 20 Total ED Resources PA 516 2077 25 51 Total ED Resources PR 67 326 21 07
Impact Study of Entrepreneurial Development 131Resources ndash 2010-2011
Office of Entrepreneurial Development
ED Resource State Surveys Received
Total ED Resources Client Contacts Received
Response Rate
of Total ED Resources Clients
Total ED Resources RI 31 142 22 03 Total ED Resources SC 155 732 21 15 Total ED Resources SD 14 69 20 01 Total ED Resources TN 171 802 21 17 Total ED Resources TX 447 2455 18 44 Total ED Resources UT 98 307 32 10 Total ED Resources VI 5 10 50 00 Total ED Resources VT 45 184 24 04 Total ED Resources VA 269 1006 27 27 Total ED Resources WA 279 1079 26 27 Total ED Resources WV 31 172 18 03 Total ED Resources WI 230 881 26 23
Total ED Resources WY 12 49 24 01
Total 10146 46099 1000
Impact Study of Entrepreneurial Development 132Resources ndash 2010-2011

Office of Entrepreneurial Development
I INTRODUCTION
The US Small Business Administrationrsquos (SBA) Office of Entrepreneurial Development (ED) designed a multi-year time series study to assess the impact of the face-to-face counseling programs it offers to small businesses This study has examined clients who received face-to-face counseling services starting in 2003 The SBA initiated this study as part of the Office of Management and Budgetrsquos (OMB) Program Assessment Rating Tool (PART) SBA contracted with Concentrance Consulting Group to assist in administering the study to analyze the findings and to write this report This report is the eighth report1 in the study and presents the findings from three separate study groups each year This yearrsquos study group includes 2010 clientsrsquo initial attitudinal assessment of their counseling experience and a follow-up with 2009 and 2008 clients to assess the financial impact of the received assistance2
Study Year 2009 Study Year 2010 Study Year 2011
2008 Clients Initial survey First follow-up Second follow-up
2009 Clients Initial survey First follow-up
2010 Clients Initial survey
Study Year 2009 Study Year 2010 Study Year 2011
This study measures attitudinal assessments perceptions of changes in managementmarketing practices and business growth for firms that utilized SBArsquos ED Resource Partnersrsquo face-to-face counseling during the late summer or early fall of 2008 2009 or 2010 The ED Resource Partners include Small Business Development Centers (SBDC) SCORE and Women Business Centers (WBC)
This report includes Executive Summary Methodology
o Research Questions o Sampling data collection response rate and survey administration o Data analysis and analysis of non-response o Follow-up o Limitations
Findings Initial economic impact study o Impact of total ED Resources (2008 - 2009 - 2010) o Regression analysis o Impact of SBDC resources 2010 o Impact of SCORE resources 2010 o Impact of WBC resources 2010 o Quantitative analysis overview o Qualitative analysis of collected client comments
Findings Follow-up study of 2008 and 2009 ED Resource clients Recommendations for further research
1 Each ED Resource final report can be found at httpwwwsbagovaboutsbasbaprogramsedindexhtml 2 For information on 2003 2004 2005 2006 and 2007 clients please see previous reports
Impact Study of Entrepreneurial Development 3Resources ndash 2010-2011
Office of Entrepreneurial Development
The appendix includes the distribution of responses for each survey question sample survey instruments additional regression results and distribution of responses for each ED Resource by state
[This page is intentionally left blank for two-sided printing]
Impact Study of Entrepreneurial Development 4Resources ndash 2010-2011
Office of Entrepreneurial Development
II EXECUTIVE SUMMARY
The US Small Business Administrationrsquos (SBA) Office of Entrepreneurial Development designed a study to assess the impact of its Entrepreneurial Development (ED) Resource Partnersrsquo face-to-face counseling assistance on small business clients and contracted Concentrance Consulting Group to conduct the study Thus far the study has examined ED Resource Partner clients that received face-to-face counseling assistance in 2003 and clients from each subsequent year up to and including the present study of 2010 clients This latest report presents the findings of the initial attitudinal impact study of 2010 ED Resource Partner clients and a follow-up study showing the financial impact on 2009 and 2008 clients Within the report all references to ED Resource Partner clients pertain to ED Resource Partnerrsquos face-to-face counseling clients who received assistance from a designated ED Resource Partner ED Resource Partner Clients Studied Concentrance studied the outcomes of three ED Resource Partners Small Business Development Centers (SBDC) SCORE and Women Business Centers (WBC)
Within each ED Resource Partner we studied three small business client segments including Nascent - Those individuals who have taken one or more positive steps to start a business Start-up - Those individuals who have been in business one year or less and In-Business ndash Those individuals who have been in business more than one year and are
classified as small by the SBA For the 2010 clients who responded to the initial impact study we analyzed demographic characteristics perceived usefulness of assistance and initial impact on businesses We also assessed the survival rates and financial growth of 2009 and 2008 clients Quantitative Findings (Initial Impact Study 2010 Clients)
Concentrance collected coded and analyzed data for 10146 ED Resource clients for an overall response rate of 23 This yearrsquos survey comprised the largest sample and achieved the greatest number of respondents since the inception of the study The table below provides the number of respondents and response rates for each ED Resource
Resource Center
Stratified Sample Size
Usable Sample
Size3
Surveys Received via Web
Surveys Received via Phone
Total Surveys
Received
Response Rate 2010
Clients SBDC 21514 20329 4183 930 5113 25 SCORE 22002 21521 3513 931 4444 21 WBC 3229 3021 450 139 589 20 Total 46745 44871 8146 2000 10146 23
Resource Center
Stratified Sample Size
3 The usable sample size includes the stratified sample minus surveys noted as undeliverable by web or phone due to incorrect contact information The accuracy and completeness of the contact information for clients provided by ED Resource offices was much improved for 2010 clients compared to previous years
Impact Study of Entrepreneurial Development 5Resources ndash 2010-2011
Office of Entreprreneurial DDevelopm ment
The figurre below illusstrates the buusiness segmeent composittion of each ED Resourcce
Distribbution of Responddents by SSegment t (2010 Cllients)4
nn = 10146
NNascent 1143 1306 1880
SStart-up 929 920 1111
B In-
Business 3003 2175 2993
Total 5113 4444 5889
CClient Year Stratified d Sample Si ize
Usea able Sample e Size
Follo ow-up p
Surveys s Received in n 2008
Response Rate
2008 854 854 2nnd 200 23
2009 8493 84993 sst 1 11968 23
The 20088 clients weree resurveyed in 2011 to deetermine finaancial impactt after two yeears in terms of financial ggrowth and ffirm survivall rates Theirr response raate was 23 equal to the previous yeaarrsquos study Thhe 2009 cliennts were also resurveyed aat this time too determine financial imppact and firmm survival rrates after onne year The response ratee for this grooup was also 23 the higghest responnse rate sincee the inceptioon of the studdy for a first follow-up grroup
4 Respondeents (86) who reeported being in business butt who did not pprovide a valid sstart date for thhat business weere not assigned too a business segmment Therefoore percentagess of clients in eaach business se egment may nott equal 100
Impact S tudy of Entrepren neurial Develop pment Resource es ndash 2010-2011 1
6
Office of Entreprreneurial DDevelopm ment
FY2011 0 SBDC SCCORE and WBC clientt s all reporte ed lower rev venues than those serve ed in the previous yee ar SBDC continues too serve the c clients with h the highest t average revenuu es ($774000 0) followedd by SCOREE ($502000) ) and WBC C ($171300)
Average eemployment llevels for SBBDC SCOREE and WBC cclients all felll from 2009 levels
Impact S tudy of Entreprenn eurial Developp ment Resourcee s ndash 2010-2011 1
7
RRev 2008 $6340000 $818400 $229500
RRev 2009 $8553000 $728400 $311200
RRev 2010 $7740000 $502000 $171300
Emmpl 2008 7 7 5
Emmpl 2009 7 6 4
Emmpl 2010 5 3 3
f
t
ED D Resource es served a ddiverse clien nt base in 20 010 similar tto past yearrs regarding g de emographic and busine ess characte eristics
Office of Entreprreneurial DDevelopm ment
The tootal ED Resoource client bbase consisteed of Femalle (36) Malle (36) firmms with MMale and Femmale owners (17) White (68) BlackAfrican AAmerican (111) Veteraan (9) Servvice-disabledd Veteran (2) HispanicLatino (7)) Asian (4)) Ameriican IndianNNative Alaskkan (2) andd Native HawwaiianPacifific Islander (11)5
The percentage of firms ownedd by White aand Veteran clients has ddecreased fromm the prrevious year66 Male and FFemale ownerrs is a new caategory for thhe 2011 studdy whichh partially expplains the deccrease in bothh the Femalee and Male ddemographicss
For 20010 the greatest percentaage of busineess owners (228) were beetween the agges of 45-54 Those bbetween the aages of 35-444 made up 222 of clientss Twenty peercent consissted of clients between thhe ages of 55--64 down thhree percentaage points froom last yeear7 Clients 225-34 were 113 of the tootal ED Resoource client bbase8
The mmost often citted primary bbusiness induustries for 20009 clients re emained the ssame as in ppast years seervice (14) and retail (11) The prrevalence of the service aand retail iindustry categories have rremained levvel over the ppast year howwever manuffacturing connsulting andd health care have all decrreased by appproximately oone percenntage point aand ldquootherrdquo hhas increasedd by three perrcentage poinnts
Firms owned by mmen reported revenues onn average more than twicce as high as those owned by w omen Reveenues for botth groups felll over the paast year The highesst average revvenues by racceethnicity were reporteed by HispannicLatinos followwed by Whitee and Asian fifirms Averagge revenues for every racceethnicity experiienced decreaases especiallly Native HaawaiianPaciific Islanders Veterans experiienced increaases in averagge revenues wwhile Servicee-disabled V eterans reporrted lower revenues thaan the previoous year
FY Y2010 client s gave lowe er ratings (73 3) than th he previous y yearrsquos respo ondents (75 5) to the u usefulness o of the assistaance they re eceived Th he effect of c counseling as sistance on the clientrsquos ability to d develop a bu usiness plan (35) mar rketing pla an (30) ha as remained d relatively c consistent ac cross past st tudies
5 These 20110 demographicc distributions wwere comparedd to the nationaal averages fromm the 2007 Survvey of Businesss Owners froom the US Cennsus Bureau (SBBO) The totall ED Resource s demographic distribution waas compared too the national averages from thee SBO The d isstribution was ccomparable acrross characterisstics except for the following SSBO figures White business ow wners were 83 of the small bbusiness popul lation Female b business ownerrs were 29 MMalebusiness owwners were 51 and BlackAffrican Americann business ownners were at 7 6 Just over 16 of survey respondents diid not answer thhe race questio ons whereas 455 answered laast year Thereffore the drop inn in the numberr of Whites mayy be due to nonn-responses andd not reflective of the actual p opulation 7 Eleven peercent of surveyy respondents ddid not respondd to the age queestion for this yyearrsquos study Laast year only twwo percent didd not respond This may explaain some of thee variation betwween this yearrsquos study and the 22010 study 8 The total ED Resources age distributio n was compareed to the nationnal averages fromm the SBO The distribution was comparablee except that 655+ was reportedd at 125 (commpared to 5 ffor total ED Reesources)
Impact S tudy of Entrepren neurial Develop pment Resource es ndash 2010-2011 1
8
Office of Entreprreneurial DDevelopm ment
Usefulness ratings also include the financiall impact of aassistance on hiring new sstaff (11) retaining cuurrent staff (115) increasing profit mmargin (22) and increasiing sales ((25) The rratings for alll categories hhave gone doown from thee previous yeear
Laa rger firms rr eported higg her levels oo f perceived d usefulness of ED Reso ource as sistance thaa n did smalll er firms F irms that re eceived less than 3 hour rs of as sistance repp orted lowerr levels of pee rceived use efulness tha an firms with h 3 or m ore hours off counselingg
Total ED Resourc ce clients that t received 3 o or more hour rs of counsel ling reported d 76 o of the time th hat counselin ng was useful l versus 69 for clients t that received d less than 3 3 hours of co ounseling
There were no diff ferences in q quality of cou unseling expe erience basedd on businesss segme ent ED Reso ource or geog graphic locatti ion
There were no sign nificant effec cts of clientrsquos s age gender veteran stat tus or ethnic city on per rceived usefu ulness How wever Americ can IndianA Alaskan Nativ ve and White e clients s reported sig gnificantly hi igher perceiv ved usefulnes ss No other significant differe ences based o on race were e found
All though clie nt reported perceptionss of each EDD Resourcee were largelly similar th ere were somm e key diffee rences
For SC CORE client ts 55 repor rted the perc ceived reputa ation of SCO ORE led to th heir decisio on to seek EDD Resource assistance co ompared to 4 44 for SBD DC clients an nd 40 f for WBC clie ents
Appro oximately 39 of WBC S Start-ups and d 42 of WB BC In-Busine ess clients report ted that assist tance they re eceived result ted in increas sed sales com mpared to 25 5 and 33 3 respectiv vely for SCOR RE clients an nd 33 and 37 for SBD DC clients respec ctively
For W WBC clients 3 38 of Start t-ups reporte d that they d decided to go o into busines ss as a resul lt of assistan ce compared d to 33 for SBDC and 3 30 for SCO ORE This tr rend w l l
as a so apparent for Nascent clients
Fi irms in the I In-Business s segment a and larger fir rms were le ss likely to r report that th heir decision n to start a b business wa s the result of ED Reso ource assista ance
Twentty-five percennt of Nascennt clients andd 32 of Starrt-up clients reported thaat their ddecision to sttart a businesss was the ressult of ED RResource assistance
Impact S tudy of Entrepren neurial Develop pment Resource es ndash 2010-2011 1
9
Office of Entreprreneurial DDevelopmment
Consistent with thhe previous yeearrsquos results larger firms firms in the In-Businesss segmeent and SCORRE clients wwere significanntly less likelly to report thhat their decisioons to start bbusinesses weere the resultt of the ED RResource asssistance they received
Fii ndings fromm an analys is of follow--up surveys of 2008 and d 2009 client ts suggest buu sinesses thh at received ED Resourr ce assistan nce have a hi igher surviv val rate thh an other smm all business ses in the PP SED II Th he survival r rate after tw wo years ww as 93 for ED Resourr ce clients cc ompared to o 80 for fir rms in the P PSED II
Appro oximately 57 of 2008 N Nascent client ts had transit tioned to the e In-Business s segme ent after two years while 29 of 200 09 Nascent cl lients had go one into busin ness after o one year On nly six percen nt of 2008 of f In-Business s clients and three percen nt of 2009 c clients went o out of busine ess by 2010
In the e second follo ow-up of 200 08 clients fir rms receiving g 3 or more h hours of couns eling had hig gher survival rates than th hose who rec ceived less th han 3 hours oof couns eling
A com mparison of tthe difference e in growth r rates for SBA A ED Resour rce clients wi ith GDP the Private C Company In ndex (PCI) an nd the Stand dard and Poo orrsquos SmallCap p 600 Index from 2009 t to 2010 show ws that SBA E ED Resource e clients outp paced the oth her bench hmarks with a a difference o of 134 perce entage points s over five p percentage po oints more than the nex xt highest find ding9 Altho ough all three e benchmarks s indicated positiv ve growth du uring this tim me SBA ED R Resource clie entsrsquo progres ssed more rap pidly
9 T ee uu rr EE aa rrhttpwwwwbeagovnationalxlsgdpchhgxls the Privaate Company Inndex (PCI) - puublished by Enttrex this index measures reevenue performmance in the secctor of private ccompanies rangging from $3 mmillion to $60 mmillion in annuall revenues (hhttpwwwpriivatecompanyinndexcom) and the S amp P SmaallCap 600 Indeex - represents approximately 3 of the US maarket and incluudes 600 lsquosmall caprsquo companiess with market ccapitalizations bbetween $300 mmillion and $2 bbillion
he thre benchmarks sed for compa ison of SBA D Resources re GDP - Sou ce
Impact S tudy of Entrepren neurial Develop pment Resource es ndash 2010-2011 1
10
Office of Entrepreneurial Development
Qualitative Findings
A few clients from each ED Resource provided ad hoc commentaries in emails with their survey instrument
Comments were both positive and negative for each ED Resource
Recommendation for Further Research
An additional study could examine the effects of different types of financing (eg SBA Guarantee Loan vs SBA Disaster Loan) on perceived improvements survival and business growth
Methodology
The initial impact study of 2010 clients was quantitative in nature based upon responses to web surveys Statistical analyses utilized frequency distributions average comparisons cross tabulations and regression models This yearrsquos study computed revenue and employment data using means rather than medians which were the bases of previous yearsrsquo studies Given wide fluctuation and disparity in revenue and employment among small businesses using mean comparisons is a more informative measure
The survey of clients resulted in a respondent sample of 10146 clients ED Resources provided a random sample list of 46745 clients served during the late summer or early fall of 2010 Concentrance sent web surveys to ED Resource face-to-face counseling clients via email We sent reminder emails each week for four weeks after the initial emailing Phone surveys were attempted for clients who did not respond to web surveys According to statistical tests there was no evidence of bias due to non-response
Concentrance used regression analyses to test for the impact of client demographics on client perceptions of ED Resource assistance outcomes Each regression model examined the impact of selected demographic characteristics (age gender race ethnicity and veteran status) and firm characteristics (size business segment ED Resource geographic location and hours of assistance) on a particular resource impact These impacts included perceived usefulness of ED Resource assistance perceived impact on the decision to start a business and perceived impact on sales
The respondent sample for the second follow-up survey of 2008 clients was 200 The respondent sample for the first follow-up of 2009 clients was 1968 A matched sample was used to perform pair-wise statistical tests that compared changes in growth and business segment to other benchmarks Revenue and employment growth for ED Resource clients were examined by comparing SBA data to that of the Panel Study of Entrepreneurial Dynamics II10 (PSED II) the Private Company Index and the SampP SmallCap 600 Index
10 The Panel Study of Entrepreneurial Dynamics II is a nationwide multi-million dollar survey of nascent entrepreneurs funded by the Kauffman Foundation The primary purpose of the study is to identify adults active in business creation obtain detailed information about the start-up effort and perform follow-up interviews to determine outcomes We rely on the PSED I and PSED II as benchmarks however results must also be interpreted with caution due to potential response bias and definitional differences in the ways that firms are classified
Impact Study of Entrepreneurial Development 11Resources ndash 2010-2011
Office of Entrepreneurial Development
Limitations to consider when interpreting these results include
Measures of ED Resource impacts are attitudinal and are self-reported by the client
Many respondents did not report revenue data
Estimates of firm survival and growth over time should be interpreted with caution Due to attrition firms that have gone out of business may be under represented
Impact Study of Entrepreneurial Development 12Resources ndash 2010-2011
Office of Entrepreneurial Development
III METHODOLOGY
This report contains findings from the initial impact study of face-to-face ED Resource counseling clients from 2010 and a follow-up study of the 2008 and 2009 clients that participated in initial impact studies in previous years11 The methodology for the initial impact study for 2010 clients is presented first followed by the methodology for the 2008 and 2009 client follow-up study The initial impact study reports clientsrsquo attitudinal assessments of their counseling experience and the follow-up study reports the long-term financial impact of assistance on client firms
Research Questions The following questions are the focus of this study and are addressed in the findings section of this report The last two questions numbers six and seven are addressed in the follow-up study which comprises time series analysis of multi-year data
1 What is the demographic financial and business profile of firms who utilize ED Resources
2 Is there a relationship between the servicesassistance provided by ED Resources (SBDC SCORE and WBC) and the clientrsquos perception of the usefulness and value of the servicesassistance received
3 Is there a relationship between the servicesassistance provided by ED Resources and the clientrsquos decision to start a business
4 Is there a relationship between the servicesassistance provided by ED Resources (SBDC SCORE and WBC) and the clientrsquos decision to implement andor change management andor marketing practices in their business
5 Are the servicesassistance provided by ED Resources (SBDC SCORE and WBC) having an impact on the clientrsquos financial position in terms of job creation job retention and sales
Follow-up study of 2008 and 2009 ED Resource clients
6 Based on a comparison of the total ED Resources with the Panel Study of Entrepreneurial Dynamics II (PSED II)12 what is the impact of ED Resource assistance on firm survival
What was the rate of transition of Nascent and Start-up firms to the In-Business segment
11 All references to ED Resource clients pertain to ED Resource Partnersrsquo face-to-face counseling clients who received assistance from a designated ED Resource Partner (SBDCSCOREWBC) 12 The Panel Study of Entrepreneurial Dynamics II is a nationwide multi-million dollar survey of nascent entrepreneurs funded by the Kauffman Foundation The primary purpose of the study is to identify adults active in business creation obtain detailed information about the start-up effort and perform follow-up interviews to determine outcomes We rely on the PSED I and PSED II as benchmarks however results must also be interpreted with caution due to potential response bias and definitional differences in the ways that firms are classified
Impact Study of Entrepreneurial Development 13Resources ndash 2010-2011
Office of Entrepreneurial Development
7 What is the financial impact of servicesassistance provided by ED Resources as a whole in terms of job creation job retention and sales
How does the difference in growth rate of ED Resource clients from 2009 to 2010 compare with selected growth benchmarks such as the gross domestic product (GDP)13 and Standard amp Poorrsquos SmallCap 600 Index14 and the Entrex Private Company Index (PCI)15
Sampling and Data Collection
This study examines the effects of SBA ED Resource assistance on client firms by respective ED Resource and by clients in the following various stages of business formation Nascent - Individuals who have taken one or more steps to start a business Start-up - Individuals who have been in business one year or less In-Business ndash Individuals who have been in business more than one year and are classified as
small by the SBA
The initial impact study of 2010 clients was quantitative in nature based upon responses to web and telephone surveys The responses provided a statistically significant sample for each ED Resource To determine if the sample size for this study was sufficient Concentrance tested the sample size on the basis of reported sales revenues The initial sample of 2010 clients is sufficiently large enough for accuracy within plus or minus $98861 in reported annual sales revenues at a 99 confidence level16
Table 31 on the following page depicts the distribution of surveys across ED Resource and the response rates by ED Resource The overall response rate was 23 which is comparable to the response rates found in other surveys of entrepreneurs For example Aldrich and Baker (2000) found that nearly a third of surveys of entrepreneurs had response rates below 2517 In another example the National Federation of Independent Business (NFIB) had a response rate of 20 in its Small Business Economic Trends survey conducted in June of 201018
13 Source httpwwwbeagovnationalxlsgdpchgxls 14 The S amp P SmallCap 600 Index - represents approximately 3 of the US market and includes 600 lsquosmall caprsquo companies with market capitalizations between $300 million and $2 billion The SampP SmallCap 600 Index is a commonly used benchmark for growth 15 The Private Company Index (PCI) - published by Entrex this index measures revenue performance in the sector of private companies ranging from $3 million to $60 million in annual revenues (httpwwwprivatecompanyindexcom) 16 This assumes a normal distribution of annual revenues with a standard deviation of $2324497 17 Aldrich Howard E and Ted Baker (2000) ldquoBlinded by the Cites Has there been any progress in entrepreneurship researchrdquo in Entrepreneurship 2000 ed Donald L Sexton and Raymond L Smilor Chicago Upstart Publishing p 377-400 18 William K Dunkelberg and Holly Wade ldquoNFIB Small Business Economic Trendsrdquo NFIBcom July 2010 lthttpwwwnfibcomPortals0PDFsbetsbet201007pdfgt
Impact Study of Entrepreneurial Development 14Resources ndash 2010-2011
Office of Entrepreneurial Development
Table 31 ndash Sampling Frame
Resource Center
Stratified Sample Size
Usable Sample Size 19
Surveys Received via Web
Surveys Received via Phone
Total Surveys
Received
Response Rate 2010
Clients SBDC 21514 20329 4183 930 5113 25 SCORE 22002 21521 3513 931 4444 21 WBC 3229 3021 450 139 589 20 Total 46745 44871 8146 2000 10146 23
Survey Administration Following a successful pilot test of web-based survey administration for the 2008-2009 impact study of ED Resources Concentrance adopted web-based survey administration as the primary technique for this study This delivery mechanism has provided greater efficiency with regard to increasing the number of completed surveys for ED Resource clients ED Resources drew a random sample of clients served during the late summer or early fall of 2010 based on a random sample table provided to each ED Resource See Appendix 4 for the survey instrument Via email Concentrance sent selected clients SBA cover letters and an invitation to take a web-based OMB approved survey We sent reminder emails each week for four weeks after the initial emailing We logged-in all received surveys entered the survey data into a database for analysis and developed an electronic database list of non-respondents for a telephone follow-up survey All surveys were assigned a computer-coded with client codes to facilitate unique identification of each client for follow-up surveys while ensuring privacy
19 The usable sample size includes the stratified sample minus surveys noted as undeliverable by web or phone due to incorrect contact information The accuracy and completeness of the contact information for clients provided by ED Resource offices was much improved for 2010 clients as compared to previous years
Impact Study of Entrepreneurial Development 15Resources ndash 2010-2011
Resource Center
Stratified Sample Size
Usable Sample Size 19
Office of Entreprreneurial DDevelopm ment
Figure 311 shows the distribution oof survey resspondents byy respective EED Resourcee and businesss segment The In-Bussiness segmeent was the laargest segmennt served forr all resourcees The Startt-up segment iis smaller thaan the other segments in part becausee of the narroow definitionn of Start-upss (firms thaat have been in business ffor one year or less)
)20Figure 31 ndash Disstributionn of Resppondents by Segmment (2010 clients)
nn = 10146
Naascent 1143 1306 1800
Staart-up 929 920 111
In-Business
3003 2175 2933
Total 5113 4444 5899
20 Responddents (86) who rreported being in business buut who did not pprovide a valid start date for thhat business wwere not assigneed to a businesss segment Theerefore percenttages of clients iin each businesss segment mayy not equal 100
Impact S tudy of Entrepren neurial Develop pment Resource es ndash 2010-2011 1
16
Office of Entrepreneurial Development
Data Analysis
Analyses included the following methods basic descriptive statistics frequency distributions cross tabulations and regression Concentrance used basic descriptive statistics for continuous variables such as annual sales revenues We used frequency distributions for Likert scales and respondents answered on a scale of 1 to 5 Cross-tabulations were used to compare responses across ED Resources business segments and hours of counseling received Finally Concentrance used multiple regression analyses to test for differences in key outcomes such as perceived usefulness or financial impact of ED Resource assistance based on demographic or firm characteristics We selected these analyses to meet the objectives of each research question and to facilitate interpretation of findings For this yearrsquos study revenue and employment calculations were completed using mean data instead of median data which was utilized for previous yearsrsquo studies
Analysis of Non-Response
SBArsquos research plan for this study included a methodology for estimating potential non-response bias Non-response bias can occur in survey research if respondents differ substantially from those that do not respond The best way to protect against this bias is to improve the response rate An effective method for achieving high response rates is the use of follow-ups and reminders In this study non-response bias was minimized by sending four reminder emails containing a link to the survey and minimized further by telephone follow-ups to non-respondents
We assessed the extent and direction of potential non-response bias by comparing the characteristics of clients who responded to the internet survey with those who did not Of the 10146 total clients surveyed 8146 were surveyed over the web The remaining clients (2000) were surveyed over the phone Clients surveyed over the phone were more likely to report revenue and employment figures Additionally these results hold when other respondent characteristics are controlled for (ED Resource Business Segment and Hours of Counseling Received)21
The next step was to conduct a comparative analysis of the responses between these groups to determine if the difference in response rates would have an impact on our analyses Results of regression analyses revealed no significant differences between these groups in terms total number of employees There was a significant difference in revenue found between phone and web respondents However only a very small portion of the total variance in revenue (02) is explained by this difference 22
21 These findings were based on results of four logistic regression analyses to determine whether web versus phone respondents differed significantly in terms of missing revenues and missing employment data The models were significant at the plt0001 level and the variable indication phone response was always significant at the plt0001 level 22 These findings were based on results of a regression analysis to determine whether web versus phone respondents differed significantly in terms of number of employees where a positive number of total employees are reported A scheffe test reveals no significant difference between phone and web at the 010 level The t-test associated with the regression analysis reveals a non-significant result (t=-161 p=01075) A second regression was performed to determine whether web versus phone respondents differed significantly in terms of reported sales revenues greater than or equal to 1000 A scheffe test for this difference revealed a significant difference between phone and web at the 005 level The t-test associated with the regression analysis reveals a significant result also (t=256 p=00106) The R-square value associated with this model is 0002
Impact Study of Entrepreneurial Development 17Resources ndash 2010-2011
Office of Entrepreneurial Development
Additionally the difference in phone and web respondents was tested against perceived service usefulness Although a significant difference in the service variate was found only a small portion of the variance of each of the service measures can be explained by the difference between phone and web respondents Similar results were found with the perceived value of the information the respondents received 23 Because the evidence of response bias is minimal the phone and web respondents were pooled in subsequent analyses Follow-up Study 2008 and 2009 ndash Sampling Data Collection and Analysis of Non-Response A follow-up study was conducted of both 2008 and 2009 clients in order to evaluate the financial impact on these groups one year and two years after they were counseled by ED Resources There were 854 clients from 2008 that were contacted for a second follow-up in the beginning of 2011 Two-hundred clients responded to this second follow-up which represents a 23 response rate Each of these respondents had valid client codes that could be matched on a one-to-one basis with the initial impact survey respondents Thus for a sample of 200 clients there were detailed data which could be tracked for three years There were 8493 respondents to the initial impact survey of 2009 clients Of those contacted 1968 responded to the survey and provided detailed data that could be tracked for two years Table 32 shows the number of surveys received by total ED Resources and the total response rates
Table 32 ndash Follow-up Impact Study Clients
Client Year Stratified
Sample Size Useable
Sample Size Follow-
up Surveys Received
in 2008 Response
Rate
2008 854 854 2nd 200 23
2009 8493 8493 1st 1968 23
These matched samples were used to perform pair-wise statistical tests that compared changes in growth by business segment and by ED Resource Although there were a small number of observations available for this analysis these findings provide a more precise estimate of changes in revenues and employment over time than aggregate non-matched comparisons
23 These findings were based on results of two multivariate regression analyses and a series of simple linear regression analyses to determine whether web versus phone respondents differed significantly in terms of the reported perceived service usefulness and value of information received The Wilkesrsquo Lambda value is significant for both multivariate analyses indicating there is some linear combination of the perceived usefulness measures and perceived value of received information that is explained by the difference in phone vs web respondents The R-square values of the six individual measures of service and information predicted by the difference in phone vs web respondents was explored These values are range from 00084 to 00238
Impact Study of Entrepreneurial Development 18Resources ndash 2010-2011
Office of Entrepreneurial Development
Limitations
There are several limitations that should be considered when interpreting the results presented in this report These limitations are inherent in the research design and methodology
Measures included in this initial survey are primarily attitudinal and all items are self-reported Thus there are few objective measures that can be used to assess actual client performance or make comparisons with other data sources
Many respondents did not report revenue data which is critical to measuring growth from year-to-year For example out of Start-up and In-Business firms approximately 39 reported zero revenues or did not report revenues
Estimates of firm survival and growth over time should be interpreted with caution Due to attrition firms which have gone out of business may be under-represented
Impact Study of Entrepreneurial Development 19Resources ndash 2010-2011
Office of Entrepreneurial Development
[This page is intentionally left blank for two-sided printing]
Impact Study of Entrepreneurial Development 20Resources ndash 2010-2011
Office of Entrepreneurial Development
IV TOTAL ED RESOURCES 2008 - 2009 - 2010
The following section presents comparison results of face-to-face counseling clients from 2008 2009 and 201024 First the general demographic and financial characteristics of the total ED Resource clients are presented This is followed by additional findings on the impact of the total ED Resources on Nascent Start-up and In-Business firms organized by research question as follows
Is there a relationship between servicesassistance provided by ED Resources (SBDC SCORE and WBC) and the clientrsquos perception of the usefulness and value of servicesassistance received
Is there a relationship between the servicesassistance provided by ED Resources (SBDC SCORE and WBC) and the clientrsquos decision to start a business
Is there a relationship between the servicesassistance provided by ED Resources (SBDC SCORE and WBC) and the clientrsquos decision to implement andor change management andor marketing practices in their business
Are the servicesassistance provided by ED Resources (SBDC SCORE and WBC) having an impact on the clientrsquos financial position in terms of job creation job retention and sales
Please note that comparisons between the 2008 2009 and 2010 initial study clients should be interpreted with caution Concentrance collected cross-sectional data from a different set of firms each year and these firms were operating under different economic conditions To better understand changes over time the follow-up study included in this report tracks the same firms over a three year period
24 All references to ED Resource clients pertain to ED Resource Partnersrsquo face-to-face counseling clients who received assistance from a designated ED Resource Partner (SBDCSCOREWBC)
Impact Study of Entrepreneurial Development 21Resources ndash 2010-2011
Office of Entrepreneurial Development
Demographic Characteristics of ED Resource ClientsThis section describes the general demographic and financial characteristics of total ED Resource clients that were served in 2010 These results are based on an analysis of 10146 completed surveys As shown in Figure 41 the In-Business segment (54) was the largest business segment served by ED Resources in 2010 The size of the In-Business segment remained consistent with the previous year The Start-up segment increased for the third year in a row though the change is in part due to the revised definition of Start-up businesses
Figure 41 ndash Total ED Resources ndash Client Segments Served25
2008 n = 6770 2009 n = 8493 2010 n = 10146
The average annual revenue for ED Resourcesrsquo clients was $637200
Table 41 ndash Total ED Resources-Revenues and Employment26 (2010)
Total ED Resources
Average Revenue $637200
Average Employees 4
25 Respondents (86 for 2010) who reported being in business but who did not provide a valid start date for that business were not assigned to a business segment Therefore the total of client segments served for each year may not equal 100 26 Firms that reported revenues were required to do so within the range of $1000 to $25000000
Impact Study of Entrepreneurial Development 22Resources ndash 2010-2011
Total ED Resources
Rev 2008 $634000 $818400 $229500
Rev 2009 $855300 $728400 $311200
Rev 2010 $774000 $502000 $171300
Empl 2008 7 7 5
Empl 2009 7 6 4
Empl 2010 5 3 3
Office of Entrepreneurial Development
ED Resources continued to differ in terms of the size of firms they served as shown in Figure 42 Again this year SBDC continues to serve the highest revenue clients ($774000 average) followed by SCORE ($502000 average) and WBC ($171300 average) All three of ED Resourcesrsquo clients reported lower average annual revenues than those assisted in 2009 Average employment reported by SBDC SCORE and WBC clients was also lower than clients served in 2009 in all cases especially SCORE In terms of revenues WBC serves a distinct client base from both SBDC and SCORE however SBDC and SCORE do not serve distinct client bases in terms of revenue27
Figure 42 ndash Total ED Resources ndash Revenue and Employment (Average ED client Revenues and Number of Employees)
27 We used a Scheffe test to examine the pair-wise differences to control for the familywise error rate We found significant revenue differences (95 confidence) between WBC and SBDC as well as between WBC and SCORE groups No other significant differences were found
Impact Study of Entrepreneurial Development 23Resources ndash 2010-2011
Office of Entrepreneurial Development
Figure 42A examines the average revenues by the hours of counseling received28 to understand the relationship between client revenues and resource utilization The data shows that clients from SBDC SCORE and WBC that received a greater number of hours of counseling tended to be larger in size For example average revenues for SCORE clients who received less than 3 hours of counseling were $336400 while average revenues for clients who received 3 or more hours of counseling were $618300 This trend is also apparent with SBDC clients where the difference between clients that received 5 or more hours of counseling and those that received from 3 to less than 5 hours of counseling is $148700 The overall average revenues regardless of hours of counseling indicated by the black cross bars in the figure below were $774000 for SBDC 502000 for SCORE and 171300 for WBC
Figure 42A ndash Total ED Resources ndash Revenues by Hours of 29 Counseling
Aggregate Hours Mean Revenue
($502000)
($774000)
($171300)
($637200)
28 For each ED Resource the number of respondents is comparable for each category of hours of counseling received SBDC lt 3 hrs = 1668 ge 3 amp lt 5 hrs = 1668 ge 5 hrs = 1777SCORE lt 3 hrs = 2219 ge 3 hours= 2225WBC lt 3 hrs = 297 ge 3 hours= 292 29 SBDC reports hours of counseling in three categories (lt 3 ge3 to lt5 ge 5) whereas SCORE and WBC report two categories (lt 3 ge 3) SCORE and WBC also provide 5 or more hours of counseling to their clients and these hours are captured in the 3 or more hours of counseling category When comparing ED Resources by hours of counseling those clients receiving 3 or more hours of counseling from SBDC reported average revenues of $843500
Impact Study of Entrepreneurial Development 24Resources ndash 2010-2011
Office of Entrepreneurial Development
Figure 43 presents the demographic characteristics of ED Resource clients in terms of gender race ethnicity and veteran status30 A new category was added to the survey for this year For the first time clients were able to select ldquoMale and Female Ownersrdquo as an answer to the gender of the owner(s) question (See Appendix 4 for a complete survey instrument) Predictably both Male and Female categories dropped sharply from last yearrsquos numbers The proportions of the majority of the race and ethnicity categories have not changed from the previous year with the exception of a reduction in the number of Whites31 Figure 43 ndash Total ED Resources ndash Demographic Characteristics32
2008 n = 6770 2009 n = 8493 2010 n = 10146
30 The Veteran and Service-disabled Veteran categories are shown in the figure above Additional results for total ED Resource clients included Reservist (03) and National Guard Member (04) 31 Just over 16 of survey respondents did not answer the race questions whereas 45 answered last year Therefore the drop in in the number of Whites may be due to non-responses and not reflective of the actual population 32 Totals may not equal 100 due to non-respondents and respondents who selected multiple ethnicities The 2010 total ED Resources demographic distribution was compared to the national averages from the 2007 Survey of Business Owners from the Census Bureau (SBO) The distribution was comparable across characteristics except for the following SBO figures White business owners were 83 of the small business population Female business owners were 29 and Male business owners were 51
Impact Study of Entrepreneurial Development 25Resources ndash 2010-2011
Office of Entrepreneurial Development
Figure 44 shows the distribution of ED Resource clients by age of business owner The largest groups of ED Resource clients belonged to the 45 to 54 and 35 to 44 age categories 28 and 22 respectively This outcome is consistent with the previous years depicted in the figure Both the 18-24 and 25-34 age categories increased slightly from the previous year Differences in findings from the previous year may be due to an increased number of clients that did not respond to the corresponding survey question for age33
Figure 44 ndash Total ED Resources ndash Age of Business Owner34
2008 n = 6770 2009 n = 8493 2010 n = 10146
33 Survey questions can be found in the survey instrument in Appendix 4 q18 requests the clientsrsquo age Eleven percent did not respond to the age question for this yearrsquos study Last year only two percent did not respond 34 The 2010 total ED Resources age distribution was compared to the national averages from the SBO The distribution was comparable except that SBO reported 65+ at 125 (compared to 5 for ED Resources)
Impact Study of Entrepreneurial Development 26Resources ndash 2010-2011
Office of Entrepreneurial Development
As shown in Figure 45 the two highest reported business types besides ldquoOtherrdquo businesses served by ED Resources were the service and retail businesses35 These results are generally consistent with the national averages from the 2007 Survey of Business Owners (SBO) Results that were not consistent included Manufacturing reported in the SBO to be 2 Construction reported to be 13 and Health Care reported to be 936 Also the figure depicts the percentage of clients in the other category as having increased over the past three years
Figure 45 ndash Total ED Resources ndash Primary Business Type37
2008 n = 6770 2009 n = 8493 2010 n = 10146
35 The top 11 results for 2010 are displayed in the figure above Additional results included Finance Insurance and Real Estate (3) Education (3) Entertainment (2) Engineering (1) Transportation (1) Publishing (1) and Day Care (1) 36 Other findings that differed from SBO results included Finance Insurance and Real Estate (14) and Transportation (5) Industry classifications are not identical 37 Several groupings were found to be present among those respondents who classified their business type as ldquoOtherrdquo These included multiple responses for non-profits designart related professions and beauty related professions Due to non-responses the total for all business types may not equal 100
Impact Study of Entrepreneurial Development 27Resources ndash 2010-2011
Office of Entrepreneurial Development
Figure 46 depicts the reasons clients reported seeking business counseling from ED Resources Reputation and lowfree cost of service were the most common reasons for clients to seek assistance from ED Resources SBDC clients reported lowfree cost of service as the most common reason (50) but rated reputation of the ED Resource and referral as equally strong reasons (44) In contrast to the total ED Resources SCORE clients reported that reputation (55) was a stronger reason for seeking assistance than was lowfree cost of service (52) and WBC clients reported that referrals (44) were more often a reason for their seeking assistance as opposed to reputation (40)
Figure 46 ndash Total ED Resources ndash What led to your decision to seek business counseling from ED Resources38
n = 10146
38 The totals do not equal 100 due to respondents selecting multiple factors This figure compares results by individual ED Resource therefore corresponding figures are not repeated in the individual ED Resource sections of this report
Impact Study of Entrepreneurial Development 28Resources ndash 2010-2011
Office of Entrepreneurial Development
Resource Impacts
Usefulness and Value of Services or Assistance Received
As shown in Figure 47 below 73 of 2010 ED Resource clients reported that the information they received from their counselor was valuable
Figure 47 ndash Total ED Resources ndash How useful was the information you received39
2008 n = 6770 2009 n = 8493 2010 n = 10146
39 Low value includes the lsquoSomewhat Valuablersquo and lsquoNot Valuablersquo response categories High value includes the lsquoExtremely Valuablersquo and lsquoValuablersquo response categories Percentages will not total 100 due to non-response
Impact Study of Entrepreneurial Development 29Resources ndash 2010-2011
Office of Entrepreneurial Development
Figure 47A shows the perceived usefulness of ED Resources relative to the number of hours of counseling received recorded in two categories less than 3 hours and 3 or more hours For comparison the overall level of perceived usefulness is also provided in the figure but this segment does not distinguish usefulness by hours of counseling received
As illustrated below ED Resource clients who had three or more hours of counseling rated usefulness of ED Resources as ldquohighrdquo more often than those who had less than three hours of counseling40 Seventy-six percent of clients who received 3 or more hours of counseling rated the usefulness of total ED Resources as ldquohighrdquo versus 69 of those that received less than 3 hours of counseling
Figure 47A ndash How useful was the information you received Total ED Resources by Hours of Counseling vs Total ED Resources Aggregate Hours
40 This finding is supported by the regression analysis beginning on page 39
Impact Study of Entrepreneurial Development 30Resources ndash 2010-2011
Office of Entrepreneurial Development
Decision to Start a Business
Figure 48 depicts the perceived assistance of ED Resources with the clientrsquos decision to start a business These results are presented by individual ED Resource and total ED Resources Results for Nascent and Start-up firms are reported in each category41 Across SBDC SCORE and WBC the relationship between Nascent and Start-up clients remained consistent Start-up clients more often indicated that they decided to go into business as a result of the assistance they received from their respective ED Resource center than Nascent clients
Figure 48 ndash Total ED Resources ndash Did you decide to go into business as a result of the assistance you received42
n = 4589
41 The corresponding survey question for this figure asked ldquoIf you were not in business at the time you were assisted by the counselor did you decide to go into business as a result of that assistancerdquo Therefore In-Business clients were not observed because these clients were in business at the time they received counseling 42 This figure compares results by individual ED Resource therefore corresponding figures are not repeated in the individual ED Resource sections of this report
Impact Study of Entrepreneurial Development 31Resources ndash 2010-2011
Office of Entrepreneurial Development
Clientsrsquo Decision to Change Management Practices
As a result of ED Resource assistance for 2010 clients 57 of Start-up and 62 of In-Business firms changed their current management practices or strategies The percentage of Start-up firms reporting that they changed their management practices or strategies has decreased slightly over the past three years The frequency of In-Business firms reporting changes in management practices or strategies remained consistent from 2009
Table 42 ndash ED Resources Impact on Managerial Practices
Impact Study of Entrepreneurial Development 32Resources ndash 2010-2011
Changed Current Management PracticesStrategies
2008 Clients 2009 Clients 2010 Clients
Changed Current Management PracticesStrategies
2008 Clients 2009 Clients 2010 Clients
Start-up 60 59 57
In-Business 61 62 62
Office of Entrepreneurial Development
Figure 49 below reflects the percentage of firms reporting that ED Resource assistance led to the development of business plans marketing plans etc The frequency of ED Resource clients reporting they received assistance with a Web-based Strategy Financial Strategy Marketing Plan or Pricing Strategy has risen over the past three years of this study The Loan Package category has diminished steadily over the past three years from 12 in 2008 to 8 for 2010
Figure 49 ndash Total ED Resources ndash Assistance in Plan Development43
43 The 2010 results for the top 11 categories are displayed in the figure above Additional results for 2010 included hiring plan (5) purchasing strategy (4) production plan (4) training plan for staff (4) distribution plan (3) and international trade (1) For the 2010 study (2009 clients) the category of e-commerce changed to web-based strategy The 2008 results from that category are still used for comparison
Impact Study of Entrepreneurial Development 33Resources ndash 2010-2011
Office of Entrepreneurial Development
Sales Job Creation and Job Retention
Figure 410 presents findings on the attitudes toward the financial impact of ED Resource assistance irrespective of clientsrsquo reasons for seeking assistance The frequency of ED Resource clients that indicated they were able to increase profit margin retain current staff hire new staff or increase sales as a result of ED Resource assistance was lower for each category when compared to the previous year The number of 2010 ED Resource clients indicating impactful assistance in each category decreased from the previous year The retaining current staff and increased sales categories each experienced a four percentage point decrease
Figure 410 ndash Total ED Resources ndash Perceived Impact of Assistance44
2008 n = 6770 2009 n = 8493 2010 n = 10146
44 See Appendix 2 for a more detailed response to q4 In addition to the reported findings in the figure above data was also collected for 2010 clientsrsquo perceived impact of assistance regarding the acquisition of a bank loan (16) a SBA guarantee loan (18) and a SBA Disaster loan (18)
Impact Study of Entrepreneurial Development 34Resources ndash 2010-2011
Office of Entrepreneurial Development
Figure 410A shows the perceived financial impact of ED Resources relative to the number of hours of counseling received recorded in two categories less than 3 hours and 3 or more hours of counseling received For comparison the overall level of perceived financial impact is also provided which does not distinguish by hours of counseling
It is notable that across all four categories ED Resource clients with 3 or more hours of counseling reported a greater positive financial impact than total ED Resource clients
For example clients that received 3 or more hours of counseling increased their sales 30 of the time whereas clients that received less than 3 hours of counseling increased their sales 19 of the time
Figure 410A ndash Total ED Resources ndash Perceived Impact of Assistance (Hours of Counseling Received vs Aggregate Hours)
Total ED Resources (ge 3 Hours)
Total ED Resources (Aggregate Hours)
Total ED Resources (lt 3 Hours)
Impact Study of Entrepreneurial Development 35Resources ndash 2010-2011
Office of Entrepreneurial Development
Cross-Sectional Demographic Analysis
This section compares revenues and employment for ED Resource clients by gender race ethnicity and veteran status Figure 411 compares average revenues for firms in each demographic category rounded to the nearest $1000 For example this figure shows that in 2010 firms owned by Females ($385000) were on average smaller than firms owned by Males ($778000) and firms owned by Males and Females ($767000)
Veteran-owned firms had an average of $1035000 in revenue the highest revenues by Veterans in the past three years Over the past year reported revenues for Service-disabled Veterans fell to an average of $727000 Regarding race and ethnicity average revenues fell across all demographic categories
Figure 411 ndash Revenues (000s) for Firms in Selected Demographic Categories45
45 Firms that reported revenues were required to do so within the range of $1000 to $25000000 Due to small sample sizes corresponding figures are not repeated in the individual ED Resource sections of this report
Impact Study of Entrepreneurial Development 36Resources ndash 2010-2011
Office of Entrepreneurial Development
Figure 412 compares employment by demographic category Firms owned by Female clients tended to have fewer employees than firms owned by Male clients however firms with both male and female owners a new category for this year had the highest average employment levels in the gender segment This new category also partially explains the drop in average number of employees for both male firms and for female firms HispanicLatino White and American IndianAlaskan Native firms had more employees than other race and ethnicity demographic categories In each category of firms the average number of employees has gone down from 200946
Figure 412 ndashTotal Employees for Firms in Selected Demographic Categories
46 Due to the small sample size of Service-disabled veterans (42) who reported having employees 2009 results should be treated with caution Due to small sample sizes corresponding figures are not repeated in the individual ED Resource sections of this report
Impact Study of Entrepreneurial Development 37Resources ndash 2010-2011
Office of Entrepreneurial Development
Regression Analysis of the Effects of Gender Race Ethnicity and Veteran Status on Key ED Resource Impacts
The following section presents findings from an analysis of the effects of firm and client characteristics on ED Resource impacts We report results from a series of multiple regression analyses These were conducted to test whether respondents differed significantly in perceived usefulness quality of counseling experience and financial impacts of ED Resource assistance based on selected firm (revenues business segment ED Resource contact hours) and demographic (age gender race ethnicity veteran status) characteristics
These analyses address the following research questions
1 Are there differences in perceived usefulness based on firm size business segment ED Resource geographic location hours of counseling age of owner(s) gender race ethnicity or veteran status
2 Are there differences in perceived assistance with the decision to start a business based on firm size business segment ED Resource geographic location hours of counseling age of owner(s) gender race ethnicity or veteran status
3 Are there differences in the financial impact of ED resource assistance based on firm size business segment ED Resource geographic location hours of counseling age of owner(s) gender race ethnicity or veteran status
Each regression model examined the impact of selected demographic characteristics (age gender race ethnicity and veteran status) and firm characteristics (size business segment ED Resource geographic location hours of counseling received) on a particular resource impact These impacts included perceived usefulness of ED Resource assistance perceived quality of the counseling experience perceived assistance with the decision to start a business and perceived financial impacts (sales cash flow hiring and profits)
Each resource impact is used as a dependent (ie outcome) variable For example the dependent variable for the first model is perceived usefulness of ED Resource assistance The dependent variable for the second model is perceived quality of the counseling experience The dependent variable for the third model is perceived assistance with the decision to start a business The dependent variable for the fourth model is a financial impact score which is a summary measure based on 4 self-reported financial impact measures (the effect of assistance on increases in sales cash flow new hires and profit margins)47
47 Consistent with previous analyses this scale is the sum of the following questionnaire items q51 q52 q55 and q57 Survey questions can be found in the survey instrument in Appendix 4
Impact Study of Entrepreneurial Development 38Resources ndash 2010-2011
Office of Entrepreneurial Development
The set of independent or predictor variables included variables representing the firm and client demographic characteristics include the following
Sales Revenues Client Segment
o Nascent o Start-Up o In-Business
ED Resource (SBDC SCORE or WBC) Geographic Location (Urban suburban rural) Number of hours of assistance (less than 3 3 or more) Respondent Age Gender Race
o Hispanic o American Indian o Asian o BlackAfrican-American o Native HawaiianPacific Islander
Ethnicity o HispanicLatino
Veteran or Service-disabled Veteran
Regression Results
In the results presented in this section statistically significant predictor variables are identified48
Detailed regression results are presented in Appendix 6
The first regression model tested for a relationship between selected firm and client characteristics and the clientrsquos perception of the usefulness of the servicesassistance received 49
Results of this regression suggest that larger firms reported higher levels of perceived usefulness of ED Resource assistance than smaller firms Firms who received less than 3 hours of assistance reported lower levels of perceived usefulness than firms with 3 or more hours of counseling Additionally firms in the In-business segment also reported significantly higher perceived usefulness from ED resource assistance
In terms of client demographics there were no significant differences in perceived usefulness based on age gender veteran status or ethnicity Native American and White clients
48 Relationships are considered statistically-significant at the 005 level Marginal significance is defined as significant at the 010 level 49 The overall model was statistically significant at the 001 level although the R2 a measure of model fit was very small (00149) Coefficients reported here were significant at the 010 level The usable sample size was 2427 Firms with revenue greater than $5000000 and less than $1000 were removed from all regression analyses as were firms with unknown business segment The revenue upper bound of $5 million was used in order to eliminate bias resulting from potential outliers skewing the distributionrsquos measures of central tendency
Impact Study of Entrepreneurial Development 39Resources ndash 2010-2011
Office of Entrepreneurial Development
reported significantly higher perceived usefulness but there were no other differences based on race
The second regression model tested for a relationship between selected firm and client characteristics and perceived ED resource assistance with the decision to start a business50
Consistent with the previous yearrsquos results this analysis suggests that larger firms firms in the In-Business segment and SCORE clients were less likely to report that their decision to start a business was the result of ED resource assistance However there were no significant differences based on any other firm or client demographic characteristics
The third regression model tested for a relationship between selected firm and client characteristics and the self-reported financial impact of ED Resource assistance These impacts include a combination of increases in sales cash flow hiring of new employees and profits51 These results provided no significant results even at a 010 level indicating that no firm level or client demographic characteristics affected the perception of the financial impact of ED Resource assistance
These regression analyses indicate that both firm and client characteristics can be significant determinants of the clientrsquos perception of the usefulness of the servicesassistance received perceived assistance with the decision to start a business or the financial impact of assistance received
Variations in perceived usefulness perceived assistance with the decision to start a business and financial impacts are due in part to differences in firm size ED Resource and hours of assistance Geographic location did not play a significant role in any regression model In addition in some cases there were significant effects of gender age and ethnicity However none of these effects were consistent across outcomes
50 This model was estimated using a logistic regression analysis due to the binary dependent variable (q1c) The overall model was significant at the plt001 level although the pseudo R2 was small (00884) Coefficients reported here were significant at the 010 level Survey questions can be found in the survey instrument in Appendix 4 51 The overall model was not significant at the 010 level the R2 was extremely small (0008)
Impact Study of Entrepreneurial Development 40Resources ndash 2010-2011
Office of Entrepreneurial Development
V SBDC 2010 VS TOTAL ED RESOURCES
The following section presents results from SBDC clients52 First we report the general demographic and financial characteristics of SBDC 2010 clients This is followed by additional findings on the usefulness of SBDC for Nascent Start-up and In-Business firms organized by research question as follows
Is there a relationship between servicesassistance provided by SBDC and the clientrsquos perception of the usefulness and value of servicesassistance received
Is there a relationship between the servicesassistance provided by SBDC and the clientrsquos decision to start a business
Is there a relationship between the servicesassistance provided by SBDC and the clientrsquos decision to implement andor change management andor marketing practices in their business
Are the servicesassistance provided by SBDC having an impact on the clientrsquos financial position in terms of job creation job retention and sales
52 All references to ED Resource clients pertain to ED Resource Partnersrsquo face-to-face counseling clients who received assistance from a designated ED Resource Partner (SBDCSCOREWBC)
Impact Study of Entrepreneurial Development 41Resources ndash 2010-2011
Office of Entrepreneurial Development
Analysis of the Attitudes of SBDC Clients Regarding the Assistance They Received from SBDC
Demographic Characteristics of SBDC Clients
This section describes the general demographic and financial characteristics of SBDC clients These results are based on an analysis of 5113 completed surveys As shown in Figure 51 the largest business segment served by SBDC is the In-Business segment (59) which is five percentage points higher than total ED Resources
Figure 51 ndash SBDC ndash Distribution of Clients by Segment (2010 Clients)53
SBDC vs Total ED Resources
SBDC n = 5113 Total ED Resources n = 10146
Table 51 compares revenues and employment for SBDC vs total ED Resources These results indicate that SBDC clients have higher revenues than total ED Resource clients
Table 51 ndash SBDC Client Revenues and Employment (2010)
Total ED Total ED SBDC SBDC Resources Resources
Average Revenue $774000 $637200 Average Employees 5 4
53 Respondents who reported being in business but who did not provide a valid start date for that business were not assigned to a business segment Therefore the total of client segments served for SBDC may not equal 100
Impact Study of Entrepreneurial Development 42Resources ndash 2010-2011
Office of Entrepreneurial Development
Demographic characteristics of SBDC clients including gender race ethnicity and veteran status are reported in Figure 5254 The demographic makeup of SBDC was comprised of a smaller percentage of Females and a higher percentage of Males than total ED Resources by four and two percentage points respectively Other demographic proportions followed a pattern similar to those of total ED Resources
Figure 52 ndash SBDC ndash Demographic Characteristics (2010 Clients)55
SBDC vs Total ED Resources
SBDC n = 5113 Total ED Resources n = 10146
54 The Veteran and Service-disabled Veteran categories are shown in the figure above Additional results for SBDC clients included Reservist (03) and National Guard Member (04) 55 The total may not equal 100 due to non-respondents and those who selected multiple ethnicities The SBDC demographic distribution was compared to the national averages from the SBO The distribution was comparable across characteristics except for the following SBO figures White business owners were 83 of the small business population Female business owners were 29 Male business owners were 51 and American IndianAlaskan Native business owners were less than 1
Impact Study of Entrepreneurial Development 43Resources ndash 2010-2011
Office of Entrepreneurial Development
Figure 53 shows the distribution of SBDC clients by age of business owner The largest age group served was between the ages of 45 and 54 (29) SBDC clientsrsquo age distribution was consistent with that of total ED Resources
Figure 53 ndash SBDC ndash Age of Business Owner (2010 Clients)56
SBDC vs Total ED Resources
SBDC n = 5113 Total ED Resources n = 10146
56 The SBDC age distribution was compared to the national averages from the SBO The distribution was comparable across characteristics except that SBO reported 65+ at 125 (compared to 5 for SBDC)
Impact Study of Entrepreneurial Development 44Resources ndash 2010-2011
Office of Entrepreneurial Development
Figure 54 shows that the most common types of businesses served by SBDC were in the service and retail categories57 These results are generally consistent with the national averages from the SBO Results that were not consistent included Manufacturing reported in the SBO to be 2 Construction reported to be 13 and Health Care reported to be 958 Also the figure shows the share of SBDC clients in the manufacturing construction technology and restaurant andor eating and drinking industries was higher than total ED Resources
Figure 54 ndash SBDC ndash Type of Business (2010 Clients) 59
SBDC vs Total ED Resources
57 The top 11 categories for 2010 SBDC clients are displayed in the figure above Additional results included Finance Insurance and Real Estate (3) Education (2) Entertainment (2) Publishing (1) Transportation (1) Engineering (2) Day Care (1) 58 Other SBO results that differed with the findings included Finance Insurance and Real Estate (14) and Transportation (5) Industry classifications are not identical 59 Due to non-responses and multiple business type selections the total for all business types might not equal 100
Impact Study of Entrepreneurial Development 45Resources ndash 2010-2011
Office of Entrepreneurial Development
SBDC Client Attitudes Regarding ED Resource Assistance
Usefulness and Value of Services or Assistance Received
Approximately 74 of SBDC clients reported that the information they received from counselors was valuable60 Figure 55 shows ratings of usefulness of SBDC ED Resources provided by business segment and compared to total ED Resources SBDC Nascent firms rated the usefulness of information somewhat higher than Start-up and In-Business firms Nascent and Start-up clients both highly rated the usefulness of the assistance received more often than did total ED Resource clients
Figure 55 ndash SBDC ndashUsefulness of SBDC (2010 Clients)61
SBDC vs Total ED Resources
60 This result does not appear in the figure above which is displayed by business segment This figure was calculated for SBDC clients overall without regard to business segment 61 Low value includes the lsquoSomewhat Valuablersquo and lsquoNot Valuablersquo response categories High value includes the lsquoExtremely Valuablersquo and lsquoValuablersquo response categories
Impact Study of Entrepreneurial Development 46Resources ndash 2010-2011
Office of Entrepreneurial Development
Figure 55A below shows the perceived usefulness of SBDC assistance based upon the number of hours of counseling received Figure 55A shows that SBDC clients who received 5 or more hours of counseling rated usefulness as ldquohighrdquo more frequently than those SBDC clients who received less than 5 hours of counseling
Figure 55A ndash Usefulness of SBDC SBDC by Hours of Counseling vs Total ED Resources Aggregate Hours (2010 Clients)
Impact Study of Entrepreneurial Development 47Resources ndash 2010-2011
Office of Entrepreneurial Development
Clientsrsquo Decision to Change Management Practices
Figure 56 compares SBDC client decisions to change management practices or strategies by business segment As a result of SBDC assistance 56 of Start-up firms changed their management practices or strategies and 58 of In-Business clients reported changing management practices or strategies The levels of SBDC Start-up and In-Business clients that changed their management practices were slightly below those for total ED Resource clients
Figure 56 ndash SBDC ndash Changed Management PracticesStrategies as a Result of SBDC ED Resource Assistance (2010 Clients)
SBDC vs Total ED Resources
Impact Study of Entrepreneurial Development 48Resources ndash 2010-2011
Office of Entrepreneurial Development
Figure 57 below reflects the percentage of firms reporting that SBDC assistance led to the development of business plans marketing plans etc 62 The percentage of SBDC clients that sought assistance with the development of business plans cash flow analyses or preparation of loan packages was higher than that of total ED Resources
Figure 57 ndash SBDC ndash Assistance in Plan Development (2010 Clients)
SBDC vs Total ED Resources
62 The 2010 results for the top 11 categories are displayed in the figure above Additional results included Hiring plan (5) Purchasing Strategy (4) Production Plan (4) Distribution Plan (3) Training Plan for Staff (4) and International Trade (2)
Impact Study of Entrepreneurial Development 49Resources ndash 2010-2011
Office of Entrepreneurial Development
Sales Job Creation and Job Retention
Figure 58 compares SBDC Start-up and In-Business clients in terms of reported financial impact of SBDC assistance on sales profits jobs and the retention of employees irrespective of reasons for seeking assistance63 SBDC Start-up firms reported lower perceived levels of impact regarding both hiring new staff and retaining current staff when compared to total ED Resources SBDC In-Business clientsrsquo reported financial impact surpassed total ED Resources in each category
Figure 58 ndash SBDC ndash Perceived Impact of Assistance (2010 Clients)
SBDC vs Total ED Resources
63 This comparison excludes the Nascent category for total ED Resources and SBDC
Impact Study of Entrepreneurial Development 50Resources ndash 2010-2011
Office of Entrepreneurial Development
Figure 58A compares SBDCrsquos financial impact of assistance on sales profits jobs and the retention of employees to the financial impact results for total ED Resources presented by hours of counseling received The number of hours of counseling received is divided into three categories for SBDC less than 3 hours from 3 to less than 5 hours and 5 or more hours
SBDC clients who received 5 or more hours of counseling reported greater perceived impact of assistance than total ED Resources in each of the categories below For example 41 of clients that received 5 or more hours of SBDC counseling reported an increase in sales and 34 of clients that received 5 or more hours reported an increase in profit margins Total ED Resources reported 34 and 30 in the same categories respectively
Figure 58A ndash SBDC ndash Perceived Impact of Assistance SBDC Hours of Counseling Received for In-Business and Start-ups vs Total ED Resources Aggregate Hours for In-Business and Start-ups (2010 Clients)
Impact Study of Entrepreneurial Development 51Resources ndash 2010-2011
Office of Entrepreneurial Development
[This page is intentionally left blank for two-sided printing]
Impact Study of Entrepreneurial Development 52Resources ndash 2010-2011
Office of Entrepreneurial Development
VI SCORE 2010 VS TOTAL ED RESOURCES
The following section presents results from SCORE clients64 First we report the general demographic and financial characteristics of SCORE clients as provided by 2010 clients This is followed by additional findings on the usefulness of SCORE for Nascent Start-up and In-Business firms organized by research question as follows
Is there a relationship between servicesassistance provided by SCORE and the clientrsquos perception of the usefulness and value of servicesassistance received
Is there a relationship between the servicesassistance provided by SCORE and the clientrsquos decision to start a business
Is there a relationship between the servicesassistance provided by SCORE and the clientrsquos decision to implement andor change management andor marketing practices in their business
Are the servicesassistance provided by SCORE having an impact on the clientrsquos financial position in terms of job creation job retention and sales
64 All references to ED Resource clients pertain to ED Resource Partnersrsquo face-to-face counseling clients who received assistance from a designated ED Resource Partner (SBDCSCOREWBC)
Impact Study of Entrepreneurial Development 53Resources ndash 2010-2011
Office of Entrepreneurial Development
Analysis of the Attitudes of SCORE Clients Regarding the Assistance They Received from SCORE
Demographic Characteristics of SCORE Clients
This section describes the general demographic and financial characteristics of SCORE clients These results are based on an analysis of 4444 completed surveys As shown in Figure 61 the largest business segment served by SCORE was the In-Business segment (49) which is five percentage points lower than the In-Business segment for total ED Resources The Nascent segment was the second largest at 29 and measures three percentage points higher than total ED Resources
Figure 61 ndash SCORE ndash Distribution of Clients by Segment (2010 Clients)65
SCORE vs Total ED Resources
SCORE n = 4444 Total ED Resources n = 10146
Table 61 compares revenues and employment for SCORE clients vs total ED Resources SCORE client revenues are lower than the average for total ED Resources
Table 61 ndash SCORE Client Revenues and Employment (2010)
Total ED SCORE Resources
Average Revenue $502000 $637200 Average Employees 3 4
65 Respondents who reported being in business but who did not provide a valid start date for that business were not assigned to a business segment The total of client segments served for SCORE will therefore not equal 100
Impact Study of Entrepreneurial Development 54Resources ndash 2010-2011
SCORE Total ED Resources
Office of Entrepreneurial Development
Demographic characteristics of SCORE clients including gender race ethnicity and veteran status are reported in Figure 6266 The demographic distribution of SCORE clients follows closely to the pattern of total ED Resources clients overall The percentage of White clients (70) in SCORErsquos demographic makeup is slightly higher than that of total ED Resources (68)
Figure 62 ndash SCORE ndash Demographic Characteristics (2010 Clients)67
SCORE vs Total ED Resources
SCORE n = 4444 Total ED Resources n = 10146
66 The Veteran and Service-disabled Veteran categories are shown in the figure above Additional results for SCORE clients included Reservist (04) and National Guard Member (04) 67 In some instances the total may not equal 100 due to non-respondents and respondents who selected multiple ethnicities The SCORE demographic distribution was compared to the national averages from the SBO The distribution was comparable across characteristics except for the following SBO figures White business owners were 83 of the small business population Female business owners were 29 and Male business owners were 51
Impact Study of Entrepreneurial Development 55Resources ndash 2010-2011
Office of Entrepreneurial Development
Figure 63 shows the distribution of SCORE clients by age of business owner The largest age group served was between the ages of 45 and 54 (27) SCORE clientsrsquo age distribution was consistent with that of total ED Resources
Figure 63 ndash SCORE ndash Age of Business Owner (2010 Clients)68
SCORE vs Total ED Resources
SCORE n = 4444 Total ED Resources n = 10146
68 The SCORE age distribution was compared to the national averages from the SBO The distribution was comparable except that SBO reported 65+ at 125 (compared to 5 for SCORE)
Impact Study of Entrepreneurial Development 56Resources ndash 2010-2011
Office of Entrepreneurial Development
Figure 64 shows that the most common types of businesses served by SCORE were in the service and retail categories69 These results are generally consistent with the national averages from the SBO Results that were not consistent included Manufacturing reported in the SBO to be 2 Construction reported to be 13 and Health Care reported to be 970 Also the figure shows the share of SCORE clients in the technology restaurant andor eating and drinking industries was lower than total ED Resources
Figure 64 ndash SCORE ndash Type of Business (2010 Clients)71
SCORE vs Total ED Resources
69The top 11 categories for 2010 clients are displayed in the figure above Additional results for 2010 included Finance Insurance and Real Estate (3) Education (3) Entertainment (2) Publishing (1) Transportation (1) Engineering (1) Day Care (1) 70 Other SBO results that differed from the findings included Finance Insurance and Real Estate (14) and Transportation (5) Industry classifications are not identical 71 Due to non-responses and multiple business type selections the total for all business types may not equal 100
Impact Study of Entrepreneurial Development 57Resources ndash 2010-2011
Office of Entrepreneurial Development
SCORE Client Attitudes Regarding ED Resource Assistance
Usefulness and Value of Services or Assistance Received
Approximately 73 of SCORE clients reported that the information they received from counselors was valuable72 Figure 65 shows ratings of usefulness of SCORE provided by business segment and compared to total ED Resources For SCORE clients it is apparent that Start-up clients reported high levels of usefulness regarding the assistance they received somewhat less often when compared to other business segments
Figure 65 ndash SCORE ndashUsefulness of SCORE (2010 Clients)73
SCORE vs Total ED Resources
72 This result does not appear in the figure above which is displayed by business segment This percentage was calculated for SCORE clients overall without regard to business segment 73 Low value includes the lsquoSomewhat Valuablersquo and lsquoNot Valuablersquo response categories High value includes the lsquoExtremely Valuablersquo and lsquoValuablersquo response categories
Impact Study of Entrepreneurial Development 58Resources ndash 2010-2011
Office of Entrepreneurial Development
Figure 65A below shows the perceived usefulness of SCORE assistance based upon the number of hours of counseling received Figure 65A shows that 78 of SCORE clients that received 3 or more hours of counseling rated SCORE usefulness as ldquohighrdquo compared to 68 of clients that received less than 3 hours of counseling
Figure 65A ndash Usefulness of SCORE SCORE by Hours of Counseling vs Total ED Resources Aggregate Hours (2010 Clients)
Impact Study of Entrepreneurial Development 59Resources ndash 2010-2011
Office of Entrepreneurial Development
Clientsrsquo Decision to Change Management Practices
Figure 66 compares SCORE client decisions to change management practices or strategies by business segment As a result of SCORE assistance 58 of Start-up firms changed their management practices or strategies and 67 of In-Business clients reported changing management practices or strategies The levels for SCORE Start-up and In-Business clients that changed their management practices and strategies were higher than those for total ED Resources
Figure 66 ndash SCORE ndash Changed Management PracticesStrategies as a Result of SCORE ED Resource Assistance (2010 Clients)
SCORE vs Total ED Resources
Impact Study of Entrepreneurial Development 60Resources ndash 2010-2011
Office of Entrepreneurial Development
Figure 67 below reflects the percentage of firms reporting that SCORE assistance led to the development of business plans marketing plans etc74 The percentage of SCORE clients that sought assistance with pricing strategies (15) was higher than that of total ED Resources (14) SCORE clients reported receiving assistance somewhat less often than total ED Resources for most other categories
Figure 67 ndash SCORE ndash Assistance in Plan Development (2010 Clients)
SCORE vs Total ED Resources
74 The 2010 results for the top 11 categories are displayed in the figure above Additional results for included Hiring plan (4) Purchasing Strategy (4) Production Plan (3) Distribution Plan (3) Training Plan for Staff (3) and International Trade (1)
Impact Study of Entrepreneurial Development 61Resources ndash 2010-2011
Office of Entrepreneurial Development
Sales Job Creation and Job Retention
Figure 68 compares SCORErsquos Start-up and In-Business clients in terms of the reported financial impact of SCORE assistance on sales profits jobs and the retention of employees irrespective of reasons for seeking assistance75 Twenty-five percent of Start-up clients reported that they were able to increase sales as a result of SCORE assistance compared to 34 for total ED Resources Twenty-one percent and 16 of SCORE In-Business clients reported that they were able to retain current staff and hire new staff respectively slightly higher than total ED Resources (20 and 15)
Figure 68 ndash SCORE ndash Perceived Impact of Assistance (2010 Clients)
SCORE vs Total ED Resources
75 This comparison excludes the Nascent category for total ED Resources and SCORE
Impact Study of Entrepreneurial Development 62Resources ndash 2010-2011
Office of Entrepreneurial Development
Figure 68A compares SCORErsquos financial impact of assistance for increasing sales profits jobs and the retention of employees to the financial impact results for total ED Resources presented by hours of counseling received The number of hours of counseling received is divided into two categories for SCORE less than 3 hours and 3 or more hours It is apparent from the figure below that except for the retain current staff category the greater the number of hours of counseling received the greater the perceived impact of assistance reported by SCORE In-Business and Start-up clients
Figure 68A ndash SCORE ndash Perceived Impact of Assistance SCORE Hours of Counseling Received for In-Business and Start-ups vs Total ED Resources Aggregate Hours for In-Business and Start-ups (2010 Clients)
Impact Study of Entrepreneurial Development 63Resources ndash 2010-2011
Office of Entrepreneurial Development
[This page is intentionally left blank for two-sided printing]
Impact Study of Entrepreneurial Development 64Resources ndash 2010-2011
Office of Entrepreneurial Development
VII WBC 2010 VS TOTAL ED RESOURCES
The following section presents results from WBC clients76 First we report the general demographic and financial characteristics of WBC clients as provided by 2010 clients This is followed by additional findings on the usefulness of WBC for Nascent Start-up and In-Business firms organized by research question as follows
Is there a relationship between servicesassistance provided by WBC and the clientrsquos perception of the usefulness and value of servicesassistance received
Is there a relationship between the servicesassistance provided by WBC and the clientrsquos decision to start a business
Is there a relationship between the servicesassistance provided by WBC and the clientrsquos decision to implement andor change management andor marketing practices in their business
Are the servicesassistance provided by WBC having an impact on the clientrsquos financial position in terms of job creation job retention and sales
76 All references to ED Resource clients pertain to ED Resource Partnersrsquo face-to-face counseling clients who received assistance from a designated ED Resource Partner (SBDCSCOREWBC)
Impact Study of Entrepreneurial Development 65Resources ndash 2010-2011
Office of Entrepreneurial Development
Analysis of the Attitudes of WBC Clients Regarding the Assistance They Received from WBC
Demographic Characteristics of WBC Clients
This section describes the general demographic and financial characteristics of WBC clients These results are based on an analysis of 589 completed surveys As shown in Figure 71 the largest business segment served by WBC is the In-Business segment Fifty percent of WBC respondents were In-Business clients compared to 54 of total ED Resource clients The figure also shows that there was a greater share of WBC clients in the Nascent segment (31) compared to total ED Resources (26)
Figure 71 ndash WBC ndash Distribution of Respondents by Segment (2010 Clients)77
WBC vs Total ED Resources
WBC n = 589 Total ED Resources n = 10146
Table 71 compares revenues and employment for WBC clients vs total ED Resources These results indicate that WBC clients are smaller in terms of revenues and number of employees than total ED Resources combined
Table 71 ndash WBC Client Revenues and Employment (2010)
Total ED WBC Resources
Average Revenue $171300 $637200 Average Employees 3 4
WBC Total ED Resources
77 Respondents who reported being in business but who did not provide a valid start date for that business were not assigned to a business segment The total of client segments served for WBC therefore may not equal 100
Impact Study of Entrepreneurial Development 66Resources ndash 2010-2011
Office of Entrepreneurial Development
Demographic characteristics of WBC clients including gender race ethnicity and veteran status are reported in Figure 7278 Not surprisingly about 62 of WBC clients are Female A noteworthy 24 of WBC clients are BlackAfrican American compared to 11 for total ED Resources HispanicLatino clients represent 8 of WBC clients WBC serves a small share of Veterans (5) and Service-disabled veterans (1)
Figure 72 ndash WBC ndash Demographic Characteristics (2010 Clients)79
WBC vs Total ED Resources
WBC n = 589 Total ED Resources n = 10146
78 The Veteran and Service-disabled Veteran categories are shown in the figure above Additional results for WBC clients included Reservist (02) and National Guard Member (00) 79 In some instances the total percentage might not equal 100 due to non-respondents and respondents who selected multiple ethnicities The WBC demographic distribution was compared to the national averages from the SBO The distribution was comparable across characteristics except for the following SBO figures White business owners were 82 of the small business population BlackAfrican American business owners were 12 and Asian business owners were 7
Impact Study of Entrepreneurial Development 67Resources ndash 2010-2011
Office of Entrepreneurial Development
Figure 73 shows the distribution of WBC clients by age of business owner The largest age group served was between the ages of 35-44 which accounts for 24 of WBC clients compared to 22 of total ED Resource clients Approximately 44 of WBC clients were between 18 and 44 years of age making WBC the youngest demographic of the three ED Resources
Figure 73 ndash WBC ndash Age of Business Owner (2009 Clients)80
WBC vs Total ED Resources
WBC n = 589 Total ED Resources n = 10146
80 The 2010 WBC age distribution was compared to the national averages for women-owned businesses from the SBO The distribution was comparable except for the following SBO figures 25-34 was 11 (compared to 18 for WBC) and 65+ was reported at 10 (compared to 5 for WBC)
Impact Study of Entrepreneurial Development 68Resources ndash 2010-2011
Office of Entrepreneurial Development
Figure 74 shows that the most common types of businesses served by WBC besides other were in the service and retail categories81 These results are generally consistent with the national averages from the SBO for women-owned firms Results that were not consistent included Health Care reported to be 16 in the SBO and Manufacturing reported in the SBO to be 182 The figure also shows the share of WBC clients in the service retail and consulting industries was higher than that of total ED Resources while the share of clients in the manufacturing construction technology and health care industries was lower than total ED Resources
Figure 74 ndash WBC ndash Type of Business (2010 Clients)83
WBC vs Total ED Resources
81 The top 11 categories for 2010 clients are displayed in the figure above Additional results included Finance Insurance and Real Estate (4) Education (3) Entertainment (1) Publishing (1) Transportation (3) Engineering (1) Day Care (2) 82 Other SBO results that differed from the findings included Finance Insurance and Real Estate (11) Industry classifications are not identical 83 Due to non-responses and multiple business type selections the total for all business types might not equal 100
Impact Study of Entrepreneurial Development 69Resources ndash 2010-2011
Office of Entrepreneurial Development
WBC Client Attitudes Regarding ED Resource Assistance
Usefulness and Value of Services or Assistance Received
Approximately 72 of WBC clients reported that the information they received from counselors was valuable84 Figure 75 shows ratings of usefulness of WBC provided by business segment and compared to total ED Resources WBC Nascent clients more often rated assistance as useful (78) than did total ED Resources (73) Start-up and In-Business clients rated assistance as useful less often (68) than total ED Resources
Figure 75 ndash WBC ndash Usefulness of WBC (2010 Clients)85
WBC vs Total ED Resources
84 This result does not appear in the figure above which is displayed by business segment This percentage was calculated for WBC clients overall without regard to business segment 85 Low value includes the lsquoSomewhat Valuablersquo and lsquoNot Valuablersquo response categories High value includes the lsquoExtremely Valuablersquo and lsquoValuablersquo response categories
Impact Study of Entrepreneurial Development 70Resources ndash 2010-2011
Office of Entrepreneurial Development
Figure 75A below shows the perceived usefulness of WBC assistance based upon the number of hours of counseling received Figure 75A shows that 76 of WBC clients that received more than 3 or more hours of counseling rated WBC usefulness ldquohighrdquo as compared to 69 of clients that received less than 3 hours of counseling
Figure 75A ndash Usefulness of WBC WBC by Hours of Counseling vs Total ED Resources Aggregate Hours (2010 Clients)
WBC vs Total ED Resources
Impact Study of Entrepreneurial Development 71Resources ndash 2010-2011
Office of Entrepreneurial Development
Clientsrsquo Decision to Change Management Practices
Figure 76 compares WBC client decisions to change management practices or strategies by business segment As a result of WBC assistance 62 of Start-up clients and 64 of In-Business clients reported changing their management practices or strategies The percentages of WBC Start-up and In-Business clients that changed their management practices were higher than that of total ED Resource clients
Figure 76 ndash WBC ndash Changed Management PracticesStrategies as a Result of WBC ED Resource Assistance (2010 Clients)
WBC vs Total ED Resources
Impact Study of Entrepreneurial Development 72Resources ndash 2010-2011
Office of Entrepreneurial Development
Figure 77 below reflects the percentage of firms reporting that WBC ED Resource assistance led to the development of business plans marketing plans etc86 The percentage of WBC clients that sought assistance with in the Other category (7) was less than that of total ED Resources (8) WBC clients reported receiving assistance as often or more often than total ED Resources for all other categories
Figure 77 ndash WBC ndash Assistance in Plan Development (2010 Clients)
WBC vs Total ED Resources
86 The 2010 results for the top 11 categories are displayed in the figure above Additional results included Hiring plan (5) Purchasing Strategy (4) Production Plan (4) Distribution Plan (3) Training Plan for Staff (3) and International Trade (2)
Impact Study of Entrepreneurial Development 73Resources ndash 2010-2011
Office of Entrepreneurial Development
Sales Job Creation and Job Retention
Figure 78 compares WBC Start-up and In-Business clients in terms of the reported financial impact of WBC assistance on sales profits jobs and the retention of employees irrespective of reasons for seeking assistance87 Start-up and In-Business clients reported that WBC assistance resulted in increased profit margin and increased sales substantially more often than total ED Resource clients For example 39 of Start-up clients and 42 of In-Business clients reported an increase in sales as compared to 34 of total ED Resources
Figure 78 ndash WBC ndash Perceived Impact of Assistance (2010 Clients)
WBC vs Total ED Resources
87 This comparison excludes the Nascent category for total ED Resources and WBC
Impact Study of Entrepreneurial Development 74Resources ndash 2010-2011
Office of Entrepreneurial Development
Figure 78A compares WBCrsquos financial impact of assistance on sales profits jobs and the retention of employees to the financial impact results for total ED Resources presented by hours of counseling received The number of hours of counseling received is divided into two categories for WBC less than 3 hours and 3 or more hours
Clients that received 3 or more hours of counseling reported higher impact in all categories compared to clients who received less than 3 hours of counseling The largest disparity occurred in the retain current staff category where there was a difference of 17 percentage points between clients who received 3 or more hours and those who received less than 3 hours
Figure 78A ndash WBC ndash Perceived Impact of Assistance WBC Hours of Counseling Received for In-Business and Start-ups vs Total ED Resources Aggregate Hours for In-Business and Start-ups (2010 Clients)
Impact Study of Entrepreneurial Development 75Resources ndash 2010-2011
Office of Entrepreneurial Development
[This page is intentionally left blank for two-sided printing]
Impact Study of Entrepreneurial Development 76Resources ndash 2010-2011
Office of Entrepreneurial Development
VIII FOLLOW-UP STUDY RESULTS 2008 amp 2009 CLIENTS In this section Concentrance reports findings from our analysis of follow-up surveys of 2008 and 2009 ED Resource clients88 These follow-up surveys were conducted in order to examine the impact of ED Resource assistance over time This yearrsquos follow-up study of 2008 ED Resource clients represents the second follow-up study of this sample The first follow-up survey of this group was conducted as part of the previous yearrsquos study in 2010 The follow-up study of 2009 ED Resource clients is the first follow-up study of these clients
This analysis addresses the following key research questions
What was the rate of transition of Nascent and Start-up firms to the In-Business segment Based on a comparison with the Panel Study of Entrepreneurial Dynamics II89 (PSED II)
what is the impact of ED Resource assistance on firm survival What was the financial impact of servicesassistance provided by SBA ED Resources in
terms of job creation job retention and sales How does the difference in growth rate of ED Resource clients from 2009 to 2010 compare
with key benchmarks such as the gross domestic product (GDP) the Entrex Private Company Index (PCI) and the Standard and Poorrsquos Small Cap Index90
Follow-up Methodology
There were 6770 respondents to the Initial Economic Impact Survey of 2008 clients Of these Concentrance was able to collect follow-up data from 854 respondents These respondents were re-contacted for the second follow up survey Of these Concentrance was able to collect follow-up data from 200 respondents for which detailed data can be tracked to 2011
There were 8493 respondents to the Initial Impact Survey of 2009 clients Of these Concentrance was able to collect follow-up data from 1968 respondents for which detailed data can be tracked to 2011
2008 Clients Sample Size Response Rate Initial Study 6770 29 1st Follow-up 854 13 2nd Follow-up 200 23 2009 Clients Sample Size Response Rate Initial Study 8493 23 1st Follow-up 1968 23
88 All references to ED Resource clients pertain to ED Resource Partnersrsquo face-to-face counseling clients who received assistance from a designated ED Resource Partner (SBDCSCOREWBC) 89 The Panel Study of Entrepreneurial Dynamics II is a nationwide multi-million dollar survey of nascent entrepreneurs funded by the Kauffman Foundation The primary purpose of the study is to identify adults active in business creation obtain detailed information about the start-up effort and perform follow-up interviews to determine outcomes We rely on the PSED I and PSED II as benchmarks however results must also be interpreted with caution due to potential response bias and definitional differences in the ways that firms are classified 90 The three benchmarks used for comparison of SBA ED Resources are GDP - Source httpwwwbeagovnationalxlsgdpchgxls the Private Company Index (PCI) - published by Entrex this index measures revenue performance in the sector of private companies ranging from $3 million to $60 million in annual revenues (httpwwwprivatecompanyindexcom) and the S amp P SmallCap 600 Index - represents approximately 3 of the US market and includes 600 lsquosmall caprsquo companies with market capitalizations between $300 million and $2 billion The SampP SmallCap 600 Index is a commonly used benchmark for growth
Impact Study of Entrepreneurial Development 77Resources ndash 2010-2011
y
f
Office of Entreprreneurial DDevelopm ment
Changess in Businesss Segmentss from 2009 tto 2011
What is tthe rate of trransition of Nascent annd Start-up firms to thee In-Businesss segment
Figure 811 shows the mmovement oof firms fromm their initial segments to the In-Businness segmentt in 2011 Foor example 557 of 2008 Nascent clients had startted businessees by 2011 FFor 2008 clieents that weree initially in thhe In-Busineess segment 994 remaineed in businesss in 2011 AAdditionally Figure 811 shows the mmovement oof firms fromm their initial 2009 client ssegment to thhe In-Busineess segment iin 2011 Forr example 299 of 2009 NNascent cliennts had transiitioned into tthe In-Businness category bby 2011 By comparisonn according tto a study by Reynolds annd Curtin (20008)91 approximmately 19 of nascent enttrepreneurs inn the PSED II had starteed businessess within two yeears of inceptiion
Figure 81 ndash Traansitions and Survvival of 22008 and 2009 Clieents to 20011 In-Bussiness
91 Paul D Reynolds and RRichard T Curttin (2008) ldquoBu siness Creationn in the United States Panel Sttudy of Entrepreneeurial Dynamicss II Initial Asseessmentrdquo Founddations and Trendds in Entrepreneuurship Vol 4 NNo 3 pgs 155ndashndash307
Impact S tudy of Entrepren neurial Develop pment Resource es ndash 2010-2011 1
78
Office of Entrepreneurial Development
Impact of ED Resource Assistance on Firm Survival
Does ED Resource assistance have a positive impact on firm survival
The PSED II data serve as a benchmark for comparing the proportion of Nascent and Start-up businesses that can now be classified as In-Business firms The PSED II is a sample of nascent entrepreneurs who are in the process of going into business a portion of the sample received some form of counseling or assistance
Figure 82 compares the survival rates for firms in the follow-up study with the PSED II92 These results suggest that businesses that received ED Resource assistance had a higher survival rate than other small businesses such as those randomly sampled for the PSED II For example based on the second follow-up study of 2008 ED Resource clients 93 were still in business after two years In contrast only 80 of PSED II firms remained in business after two years93 Similarly in the follow-up study of 2009 ED Resource clients 96 of these firms remained in business after one year compared to 90 of firms in the PSED II sample
In addition to the PSED II analysis ED Resource client survival rates were higher than reported in other studies For example according to a study published in the Monthly Labor Review two-thirds of new employer firms survive at least two years and about 44 survive at least four94
Figure 82 ndash ED Resource Clients have Higher Survival Rates than PSED II Firms
92Source Parker Simon C (2005) ldquoWhat happens to nascent entrepreneurs An econometric analysis of the PSEDrdquo Entrepreneurship in a Diverse World U S Association for Small Business and Entrepreneurship 93 The PSED II reports the rate of disengagement of start-up firms relative to the time of inception According to Reynolds and Curtin (2008) this period is somewhat arbitrary may not actually capture all start-up activities Thus we report an approximate PSED survival rate based on firms at 1 year and 2 years after inception 94 Survival and Longevity in the Business Employment Dynamics Database Monthly Labor Review May 2005
Impact Study of Entrepreneurial Development 79Resources ndash 2010-2011
Office of Entrepreneurial Development
Does the number of hours of ED Resource assistance have a positive impact on firm survival Figure 83 shows the survival rate of ED Resource clients in each category of counseling hours received for the second follow-up survey of 2008 clients and the first follow-up of 2009 clients In the second follow-up firms receiving 3 or more hours of counseling had a marginally higher survival rate than those that received less than 3 hours of counseling However the relationship between additional counseling hours and survival in the first follow-up sample of 2009 clients is less pronounced
Figure 83 - ED Resource Client Survival by Hours of Counseling
Impact Study of Entrepreneurial Development 80Resources ndash 2010-2011
f
f
Office of Entreprreneurial DDevelopm ment
Changess in Revenuees and Empployees
What is tthe financiaal impact of servicesasssistance proovided by SBA ED Ressources in teerms of job creeation job rretention annd sales
Figure 844 compares 22008 clients iin terms of mmean annual revenues andd number of employees inn the initial andd two subseqquent follow--up studies
Accordinng to this mattched pairs comparison mmean revenuues fell from $413900 in 22008 to $3044200 in 2009 This decline in revenues between 20008 and 2009 iis consistent with the reccessionary conditionns of the econnomy duringg this period However ffor the subseet of firms that survived aand reported revenue dataa mean revennues increaseed to $4677000 in 201095
At the samme time the mean numbber of employyees per firmm decreased frrom 68 to 5 for the first follow-upp year and thhen rose againn to 68 for thhe second foollow-up yearr
Figure 84 - Meaan Revennues and Employmment 20008 Clientts Over TTime
20008 Clients n == 2343 1st Foollow-up n = 2550 2nd Follow--up n = 112
95 Revenue s from Nascentt and unknownn business segmments are not inccluded In adddition Start-up oor In-Business firms with revenuues below $10000 and greater tthan $5 million were excludedd from this analyysis as were firmms with reporteed employees below 1 and abbove 998 The revenue upper bound of $5 mmillion was usedd in order to eli minate bias res sulting from potenntial outliers skeewing the distriibutionrsquos measuures of central ttendency
Impact S tudy of Entrepren neurial Develop pment Resource es ndash 2010-2011 1
81
Office of Entreprreneurial DDevelopm ment
The matcched comparison analysis was repeated for the folllow-up sampple of 2009 cllients Figurre 85 comparess firms in terms of mean annual revennues and nummber of emplloyees in 20009 and in thee first follow-upp survey
Accordinng to this mattched pairs comparison mmean revenuues fell from $414100 in 22009 to $3911400 in 2010 According too a survey off small busineess owners cconducted byy the Nationaal Federationn of Independdent Businessses (NFIB) bbusiness ownners in 2009 reported histtorically low expectationss about groowth and employment annd increasingg concerns abbout inflationn From the low of Jan 22009 optimismm has been coontinuously trending upwward to highs not seen sinnce late 2007 potentially indicativee of a laggingg upturn 96 TThe mean number of empployees per fifirm remainedd essentially flat at just ovver 74
Figure 85 - Meaan Revennues and Employmment 20009 Clientts Over TTime
20099 clients n = 30012 1st Followw-up n = 10144
96Dunkelbeerg William C and Holly Wadde (2009) ldquoNFIIB Small Busineess Economic TTrendsrdquo Marchh httpwwwwnfibcompa gesbet amp httppwwwnfibcoomPortals0PDFsbetsbeet201103pdf
Impact S tudy of Entrepren neurial Develop pment Resource es ndash 2010-2011 1
82
Office of Entreprreneurial DDevelopm ment
The folloowing figures show changges in mean rrevenue and eemployment t for 2009 clieents by ED Resourcee97
Figure 85A Mean SBDCC Revenues and Employmeent 20099 Clients Over TTime
2009 SBBDC Clients n = 1567 1st FFollow-up n = 6637
97 The secoond follow-up ssample of 2008 clients includedd only 200 firmms This samplee is insufficient for a statisticallly meaningfull analysis by inddividual ED Resource
Impact S tudy of Entrepren neurial Develop pment Resource es ndash 2010-2011 1
83
Office of Entreprreneurial DDevelopm ment
Figure 85B Mean SCORRE Revennues and Employmment 20009 Clientts Over TTime
2009 SCCORE Clients nn = 1286 1st FFollow-up n = 323
Impact S tudy of Entrepren neurial Develop pment Resource es ndash 2010-20111
84
Office of Entreprreneurial DDevelopm ment
Figure 85C Mean WBC Revenuees and Emmploymennt 2009 Clients Over TTime
2009 SSCORE Clients n = 159 1st FFollow-up n = 54
Impact S tudy of Entrepren neurial Develop pment Resource es ndash 2010-20111
85
Office of Entreprreneurial DDevelopm ment
Figure 866 provides addditional detaail on the chaange in revennues for 20088 and 2009 cclients For example 53 of 20088 clients havee experiencedd revenue grrowth from 22008 to 2010 Additionallly 65 of 22009 clients realized increased revenuees in 2010 coompared to 335 who expperienced a decline inn revenues
Figure 86 Distrribution oof ED Ressource Clientsrsquo Peercentagee Changee in Revenues98
20009 Clients n = 635 2008 Clieents n = 184
98 Firms wiith revenues bellow $1000 andd greater than $55 million were excluded from this analysis BBecause both 20008 and 2009 fiirms needed to have revenues within these paarameters to es tablish approprriate match critteria needed forr the percent chaange comparisoon the 2008 andd 2009 client coounts will not mmatch those in figures 84 amp 8 85
Impact S tudy of Entrepren neurial Develop pment Resource es ndash 2010-2011 1
86
Office of Entrepreneurial Development
Benchmark Comparisons
Figure 87A and 87B depict firm survival over time as compared to the PSED I and PSED II Figure 87A shows firm survival rates after one year of being in business over a period of six years Figure 87B shows firm survival rates after two years of being in business over a period of five years In both figures the benchmarks for comparison are the PSED I and II which provide data for survival rates of businesses after one and two years of being in business99 ED Resource clients have outpaced the samples from both PSED studies for six consecutive years as shown in the figures below
Figure 87A ndash Firm Survival Rates for ED Resource Clients After One Year (Total ED Resources vs PSED studies)
Figure 87B ndash Firm Survival Rates for ED Resource Clients After Two Years (Total ED Resources vs PSED studies)
99 For years 2007 to 2008 the PSED II with updated data became available and was therefore utilized as the new benchmark PSED I analyzes data collected from nascent entrepreneurs from 1998 - 2000 with three follow-up interviews PSED II analyzes data collected from nascent entrepreneurs from 2005 and 2006 with two follow-up interviews This explains the increased survival rates for the benchmarks on each figure 80 to 90 in 87A and 71 to 80 in 87B
Impact Study of Entrepreneurial Development 87Resources ndash 2010-2011
r
y
Office of Entreprreneurial DDevelopm ment
How doees the growtth of ED Reesource clients compare with key bbenchmarkss of econommic growth
Figure 888 compares tthe differenc e in growth rrate of ED RResource cliennts from 20009 to 2010 too three bennchmarks ndash UUS GDP thhe Private Coompany Indexx (PCI) and the Standardd and Poorrsquos Small Capp Index (SampPP) The GDP growth proovides a conttext of how tthe overall ecconomy is performinng The SampPP represents approximateely 3 of thee US markett and includees 600 lsquosmalll caprsquo companiees with markket capitalizattions betweenn $300 millioon and $2 billlion The PCCI measures revenue pperformance in the sectorr of private ccompanies raanging from $$3 million too $60 million in annual revenues
The diffeerence in growwth rate fromm 2009 to 20010 for SBA EED Resourcce clients wass 134 percenntage points AAlthough all tthree benchmmarks indicatted positive ggrowth durinng this time SSBA ED Resourcee clientsrsquo proggress outpaceed the other benchmarks
Figure 88 ED RResource Client Revenue GGrowth CComparedd to Seleccted Benchmarks - PPercent CChange frrom Prevvious Yeaar100
100 SBA EDD figures are baased on Start-upp or In-Businesss firmsrsquo mean rrevenues from tthe two follow--up surveys conducted in 2010 where clients with revvenue less thann $1000 or greaater than $5 milllion in either year were excludded The revenuue upper boundd of $5 million wwas used in ordder to eliminatee bias resulting ffrom potential outliers skewinng the distributionnrsquos measures off central tendenncy The growthh rates for 20099 and 2010 forr each benchmaark are as followws GDP 20099=-26 2010==29 SampP Smmall Cap 600 2 009=238 20010=251 PCCI 2009=220 2010=298 and SBA ED RResources 2009 =-61 2010==73
Impact S tudy of Entrepren neurial Develop pment Resource es ndash 2010-2011 1
88
Office of Entrepreneurial Development
Summary of Follow-up Study Findings
Firm Survival Approximately 57 of 2008 Nascent clients had transitioned to the In-Business segment after two years while 29 of 2009 Nascent clients had gone into business by the beginning of 2011 At the same time 6 of 2008 of In-Business clients and 3 of 2009 clients went out of business by 2011
In addition in the second follow-up 2008 clients receiving 3 or more hours of counseling had a higher survival rate than those who received less than 3 hours of counseling
Based on a comparison to firms in the PSED II businesses who received ED Resource assistance have a higher survival rate than other small businesses For example the survival rate after two years was 93 for ED Resource clients compared to 80 for firms in the PSED II
Financial Impact and Growth These analyses show that ED Resource assistance has had a significant impact on the revenue and employment growth of small business clients For 2008 clients the recession appears to have had a negative impact on 2009 revenue though revenue increased for these clients in 2010 (2nd follow-up 2008 and 1st follow-up 2009) Surviving 2008 clients in the second follow-up experienced a 54 increase in revenues from 2009 to 2010 Still 47 of 2008 clients experienced some negative growth in revenues since 2008 The difference in growth rates from 2009 to 2010 for SBA ED Resource clients was shown to be 134 percentage points Although all three benchmarks indicated positive growth during this time SBA ED Resource clientsrsquo progress outpaced the other benchmarks Firms in the second 2008 client follow-up sample increased from a mean of 50 employees to a mean of 68 employees Mean employment for firms in the first follow-up of 2009 clients stayed relatively flat with an increase from 73 to 74 employees (See Figures 84 85 86 and 88)
Impact Study of Entrepreneurial Development 89Resources ndash 2010-2011
Office of Entrepreneurial Development
[This page is intentionally left blank for two-sided printing]
Impact Study of Entrepreneurial Development 90Resources ndash 2010-2011
Office of Entrepreneurial Development
IX SUMMARY OF QUANTITATIVE FINDINGS
Initial Impact Study of 2010 Clients
1 What is the demographic financial and business profile of firms who utilize SBA ED Resources
Firms that have been in business for more than one year comprise the In-Business client segment Fifty-four percent of ED Resource clients were in the In-Business category Nascent clients represented 26 of ED Resource clients while the smallest segment Start-up clients represented 19101
The average revenue for firms served by ED Resources is $637200 with four employees Firm size varies by ED Resource For example SBDC clients have higher average revenues at $774000 than SCORE clients at $502000 WBC clientsrsquo revenues are lowest with average revenues of $171300 These revenue figures are lower than client groups studied in 2009
ED Resource clients represented a variety of demographic groups Thirty-six percent of clients were Male 36 Female and 17 of firms had Male and Female owners Sixty-eight percent were White 11 BlackAfrican American 7 HispanicLatino 4 Asian and 2 American IndianNative Alaskan Nine percent of ED Resource clients were Veteran and 2 were Service-disabled Veteran The largest age group served by ED Resources accounting for 28 of the total sample included clients between 45 and 54 years of age
ED Resource clients served during 2010 represented a wide variety of business types The most common industries included service retail and manufacturing businesses
ED Resources assisted clients in developing plans and strategies in order to start or better manage their businesses The most frequently reported type of assistance was business plans (35) followed by marketing plans (30) and financial strategy (19)
For 2010 clients the lowfree cost of service was the most commonly reported reason for seeking business counseling from ED Resources at 51 The least commonly reported reason for seeking business counseling from ED Resources was clients having tried other alternatives but were dissatisfied at 9 SCORE clients reported the reputation of SCORE as a reason they sought assistance (55) more often than the lowfree cost of service (52)
101 Respondents (86) who reported being in business but who did not provide a valid start date for that business were not assigned to a business segment
Impact Study of Entrepreneurial Development 91Resources ndash 2010-2011
Office of Entrepreneurial Development
Firms who received less than 3 hours of assistance reported lower levels of perceived usefulness than firms with 3 or more hours of counseling Also firms in the In-Business segment reported significantly higher perceived usefulness from their ED Resources counseling
American IndianAlaskan Native and White firms both reported higher perceived usefulness but there were no other differences based on race There were also no significant effects of clientrsquos age gender veteran status or ethnicity on perceived usefulness of assistance
Unlike some previous years results of this yearsrsquo regression suggest that there were no significant differences in financial impacts of ED Resource assistance based on any factor including ED resource business segment hours of counseling received or geographic location
Impact study data was used to examine four ED Resource client perceptions of impact Findings for each of these impacts are described below
2 Is there a relationship between the servicesassistance provided by ED Resources and the clientrsquos perception of the usefulness and value of the servicesassistance received
In general ED Resource clients perceived information and assistance provided by ED Resource counselors to be valuable Approximately 73 of ED Resource clients overall reported that assistance they received had high value in terms of usefulness This rating was 74 for SBDC 73 for SCORE and 72 for WBC
Seventy-six percent of clients who received 3 or more hours of counseling rated usefulness as ldquohighrdquo whereas 69 of those who received less than 3 hours of counseling did likewise Regression analysis also indicated that clients who received less than 3 hours of counseling reported lower levels of perceived usefulness than clients who received 3 or more hours of counseling
3 Is there a relationship between the servicesassistance provided by ED Resources and the client perceptions of assistance with the decision to start a business
As in the previous yearrsquos study regression results suggest larger firm firms in the In-Business segment and SCORE clients were less likely to report that their decision to start a business was the result of ED Resource assistance
There were no significant differences based on hours of counseling received or client demographic characteristics in regard to perceived assistance with the decision to start a business
Impact Study of Entrepreneurial Development 92Resources ndash 2010-2011
Office of Entrepreneurial Development
4 Is there a positive relationship between the servicesassistance provided by ED Resources and the clientrsquos decision to implement andor change management andor marketing practices in their business
As a result of ED Resource assistance 62 of 2010 In-Business clients and 57 of Start-up clients changed management practices or strategies Clients used ED Resources most widely in developing business plans marketing plans financial strategies and general management
5 Is there a positive relationship between the servicesassistance provided by ED Resources and financial impacts including job creation and retention and increases in sales
Thirty-four percent of Start-up and In-Business clients reported that assistance provided by ED Resources resulted in increased sales In terms of jobs 15 of Start-up and In-Business clients reported that ED Resource assistance led to the hiring of new staff and 20 reported that ED Resources assisted them in retaining current staff The perceived impact of ED Resource assistance on increasing profit margin was 30 a decrease two percentage points from the previous year
For the following financial categories sales profits retaining current staff and hiring of employees ED Resource clients who received 3 or more hours of assistance reported higher financial impacts than firms who received less than 3 hours of assistance This finding was not supported by a regression analysis which examined sales profits cash flow and the hiring of new staff
Increase in sales was the financial category that showed the most prominent correlation with hours of counseling received more than profit margin hiring of new staff or retention of staff Clients that received 3 or more hours of counseling reported increasing their sales 30 of the time whereas clients that received less than 3 hours of counseling increased their sales 19 of the time
Follow-up Study of 2008 and 2009 ED Resource Clients
6 How do the results of this survey compare with the Panel Survey of Entrepreneurial Dynamics (PSED) study
Based on the first follow-up study of 2008 ED Resource clients 95 were still in business while 90 of firms in the PSED II sample remained in business after one year For 2009 ED Resource clients 96 were still in business after one year In addition for the second follow-up study for 2008 clients 93 of ED Resource clients remained in business compared to 80 for those in the PSED II sample
Impact Study of Entrepreneurial Development 93Resources ndash 2010-2011
Office of Entrepreneurial Development
7 Was the financial impact (job creation job retention and sales) on the clients who were provided servicesassistance by SBA ED Resources (SBDC SCORE and WBC) since 2008 greater than or equal to a representative small business population
The follow-up analyses show that ED Resource assistance has had a substantial impact on the revenue and employment growth of small business clients For 2008 clients the recession appears to have had a negative impact on 2009 revenue though revenue increased for these clients in 2010 Surviving 2008 clients in the second follow-up experienced a 54 increase in revenues from 2009 to 2010 Still 47 of 2008 clients experienced some negative growth in revenues since 2008 The difference in growth rates from 2009 to 2010 for SBA ED Resource clients was shown to be 134 percentage points Although all three benchmarks indicated positive growth during this time SBA ED Resource clientsrsquo progress outpaced the other benchmarks Firms in the 2nd 2008 client follow-up sample increased from a mean of 5 employees to a mean 68 employees Mean employment for firms in the first follow-up of 2009 clients stayed relatively flat with an increase from 73 employees to 74 employees (See Figures 84 85 86 and 88)
Impact Study of Entrepreneurial Development 94Resources ndash 2010-2011
Office of Entrepreneurial Development
X SUMMARY OF QUALITATIVE FINDINGS
In addition to completing the survey multiple ED Resource clients provided additional commentary through their responses to survey invitation e-mails Through these communications clients expressed both positive and negative thoughts and feelings about their experiences with ED Resources This section reviews a selection of these comments
Among the positive comments received clients communicated several themes SBA counselors were professional and genuinely interested in providing help to the client Information provided to the clients by SBDC SCORE and WBC was particularly helpful to
their businessesrsquo development Counselors were willing to take the time to have in-depth discussions about business ideas
and offered many helpful suggestions
A very thankful survey respondent wrote at length about the concerted effort that her counselor put into building a relationship and aiding her business The following is an excerpt from her letter
ldquoI truly appreciated having the opportunity to meet and work with [counselor name] He is a great listener director and mentor His guidance is sound And he has a wonderfully open personality that allows people to feel that they can rely on [him] With his outstanding follow-through [counselor name] never disappointed me in any of my business questions and requestsrdquo
Another ED Resource client took the time to commend his counselor responding very positively to the effect the counselor had on his business
ldquoI just wanted to inform you that [counselor name] was one of the best things that ever happened to my company She displayed exemplary professionalism and helped us out tremendouslyrdquo
One respondent although she was unable to secure credit for her business considered ED Resource assistance to be a valuable learning experience
ldquoI would like to let you know that [ED Resources] helped me a lot and I learned so much from the services they provided me for my businessrdquo
The head of a private educational institution highlighted the flexibility of ED Resources She felt that the counselors served as motivators as well as sources of information
ldquoThe [ED Resources counselors] helped us to identify our issues facilitated discussions about options and helped with the energy and direction to move forward to study those optionshellip [ED Resources] has been a huge help to usrdquo
Impact Study of Entrepreneurial Development 95Resources ndash 2010-2011
Office of Entrepreneurial Development
There was also negative feedback provided by survey respondents regarding their experiences with ED Resources Among the negative comments the most common related to the following
Dissatisfaction with the conduct of their counselors on account of their lack of professionalism or disinterest in helping the client
Finding the information they received financial and otherwise to be less than useful or not applicable to their industry
The unavailability or unresponsiveness of ED Resource counselors in regard to calls or emails placed for inquiries or requests
Some ED Resource clients had difficulty establishing communication lines with their counselors One respondent wrote about his negative experience trying to reach his ED Resource counselor Ultimately the client did not receive any assistance
ldquoA person was chosen for me who was currently unavailable for months as he was not even in the area at the time (even though he lived here)hellip Months later he sent me an email saying he was ready to assist mehellipwe could meet and discuss my problems Problem was I was currently working out of the area supporting my clientrsquos contract I guess that was unsatisfactory for himhellipI never heard from him againrdquo
Several ED Resource clients complained about the outdated nature of the advice they received at times referencing current adverse economic conditions One respondent wrote
ldquoThe counselors didnt have a clue how to help me I was looking for a solid marketing plan Sorry but these guys are dinosaurs Didnt seem to be up on current trends in businesshelliprdquo
After making attempts to receive assistance at multiple ED Resource locations one ED Resource client wrote about her dissatisfaction with the limited knowledge and lack of professionalism of the counselors she met with
ldquoThe gentleman the office set me up with for first meeting did not have any experience in graphic design or what I was mainly interested in obtaining web based businessclients I then made another appointment for their downtown [location] office with two men who I was told knew my fieldhellip The meeting was disastrous One man told me that I should just go door to door to find local clients and to not utilize the Internet at allhelliprdquo
One respondent who sought capital assistance from ED Resources was frustrated at the lack of effort put in by her counselors in spite of her high level of preparedness Ultimately the client was left questioning whether ED Resources volunteers had any genuine interest in helping her business
ldquoI visited with [ED Resources] volunteers twice I found them to be distant and unenthusiastic for the most part I presented a full marketing plan right down to the last detail in a comprehensive binder that I spent two years preparingrdquo
Impact Study of Entrepreneurial Development 96Resources ndash 2010-2011
Office of Entrepreneurial Development
XI RECOMMEDATIONS FOR FURTHER RESEARCH
Measuring the effects of ED Resources on business operations as well as financial and economic outcomes requires longitudinal data that track respondents over time
Further research with this dataset could afford comparison of the effects of different kinds of ED Resource assistance and services on financial and economic outcomes for clients
On the basis of our findings Concentrance offers the following recommendation for further research
An additional study could examine the effects of different types of financing (eg SBA Guarantee Loan vs SBA Disaster Loan) on perceived improvements survival and business growth
Impact Study of Entrepreneurial Development 97Resources ndash 2010-2011
Office of Entrepreneurial Development
[This page is intentionally left blank for two-sided printing]
Impact Study of Entrepreneurial Development 98Resources ndash 2010-2011
Office of Entrepreneurial Development
XII APPENDICES
Impact Study of Entrepreneurial Development 99Resources ndash 2010-2011
Office of Entrepreneurial Development
[This page is intentionally left blank for two-sided printing]
Impact Study of Entrepreneurial Development 100Resources ndash 2010-2011
Office of Entrepreneurial Development
Appendix 1 ndash Survey Response Values by Research Topic
Impact Study of Entrepreneurial Development 101Resources ndash 2010-2011
RESEARCH TOPIC RESEARCH TOPIC SURVEY QUESTIONS SURVEY QUESTIONS RESPONSE CODEDATABASE RESPONSE CODEDATABASE
VALUES VALUES
Demographic Characteristics 7 At the time you were assisted by [SBDC SCORE WBC] what was the approximate annual gross revenue for each of the
Open ended between $1000 and $25000000
calendar years below 2009 ______ 2010 ______
8 Counting yourself how many fill-time employees and part-time employees did you employ at the end of the
following years you were in business
Open ended
2009 FullPart ______ 2010 FullPart ______
10 If you are in business what is the primary type of
business Construction Manufacturing Consulting Wholesale Finance Ins and Real
Estate Entertainment Retail Restaurant Engineering Publishing Education
Construction=1 or 0 Manufacturing=1 or 0 Consulting =1 or 0 Wholesale =1 or 0
Finance Ins And Real Estate =1 or 0 Entertainment =1 or 0 Retail =1 or 0 Restaurant =1 or 0 Engineering =1 or 0 Publishing =1 or 0 Education =1 or 0 Service =1 or 0 Health Care =1 or 0 Day Care =1 or 0 Transportation =1 or 0 Technology =1 or 0 Health Wellness or Fitness Yes=1 No= 0 Other = open ended No response
=N
Service Health Care Day Care Transportation Technology Health Wellness andor
Fitness Other
11 Indicate the geographic location of your primary
business
Urban Suburban Rural
Office of Entrepreneurial Development
RERESEARCH TOPIC SEARCH TOPIC SURVEY QUESTIONS SURVEY QUESTIONS SURVEY QUESTIONS RESPONSE CODEDATABASE RESPONSE CODEDATABASE
VALUES VALUES 12 What lead to your decision
to seek business counseling Tried other alternatives Reputation of
SBDCSCOREWBC Lowfree cost of service Referred by
16 Gender Male=1 Female=2 Male and Female Owners=3 No response = N
17 Veteran Status Veteran=1 Service-disabled Veteran=2 Reservist=3 National Guard Member=4 Non-veteran=5 No response= N
18 Age 18-24= 1 25-34 = 2 35-44 = 3 45-54 = 4 55-64 = 5 65-74 = 6 75+ = 7 No response = N
19 Are you Hispanic or Latino Not HispanicLatino Origin
Hispanic or Latino=1 Not of HispanicLatino Origin=0 No response = N
20 Are you American IndianAlaskan Native Asian BlackAfrican American Native HawaiianPacific Islander White
American Indian or Alaskan =1 or 0 Asian =1 or 0 Black or African American =1 or 0 Native Hawaiian or Pacific Islander =1or 0 White =1 or 0 No response = N
Is there a positive relationship between the servicesassistance provided by SBA ED Resources and the clientrsquos perceptions of the usefulness and value of the servicesassistance received
6 Pleas indicate how useful the services were that you received from the counselor who assisted you in identifying and correcting problems in operating your business Relevancy of Counseling Timeliness of Counseling Helpfulness of Counseling
13 Please indicate the value of the information you received from the [WBC SCORE SBDC] counselor you visited
1 Usefulness of information 2 Relevancy of the
information 3 Timeliness of the
information
Extremely Valuable=5 Valuable=4 No Opinion=3 Somewhat Valuable=2 Not Valuable=1 No response = N
15 I would refer the counseling services I reto other small business
ceived es
Strongly Agree=5 Agree=4 No Opinion=3 Disagree=2 Strongly Disagree=1 other=open ended No response = N
Impact Study of Entrepreneurial Development 102Resources ndash 2010-2011
RESEARCH TOPIC RESEARCH TOPIC SURVEY QUESTIONS SURVEY QUESTIONS RESPONSE CODEDATABASE RESPONSE CODEDATABASE
VALUES VALUES
Is there a positive relationship between the servicesassistance provided by SBA ED Resources and
the clientrsquos perceived quality of the counseling
experience
14 Please indicate the counselorrsquos effectiveness in
assisting you 1 The counselor exhibited excellent customer service
techniques 2 The counselor was able
to assist me 3 The counselor exhibited a high level of professionalism
4 The counselor was knowledgeable of current
management practices and issues
5 The counselor identified with my needs
6 I would rate my overall experience with the counselor as excellent
Strongly Agree=5 Agree=4 No Opinion=3 Disagree=2 Strongly Disagree=1 other=open ended No response = N
Is there a positive relationship between the servicesassistance provided by SBA ED Resources and the clientrsquos decision to start a
business
2 If you were not in business at the time you were assisted by the counselor did you decide to go into business as a
result of that assistance
Yes = 1 No=0 No Response = N
Is there a positive relationship between the servicesassistance provided by SBA ED Resources and clientsrsquo decisions to implement andor change management andor marketing practices in their
business
3 As a result of the assistance you received have you changed any of your current
management practices
Yes=1 No=0 No response = N
Office of Entrepreneurial Development
Impact Study of Entrepreneurial Development 103Resources ndash 2010-2011
RESEARCH TOPIC RESEARCH TOPIC SURVEY QUESTIONS SURVEY QUESTIONS RESPONSE CODEDATABASE RESPONSE CODEDATABASE
VALUES VALUES
4 As a result of the assistance I received from the [WBC SCORE SBDC] counselor I was able to develop [ie Business Plan] in order to start or better manage my business [Check all that apply]
Business Plan Marketing Plan Promotional Plan Pricing Strategy Cash Flow Analysis General Management Loan Package Hiring Plan Training Plan for Staff Financial Strategy Web-based Strategy Purchasing Strategy Feasibility Plan Production Plan Distribution Plan International Trade Other
If checked = 1 Not checked = 0 Other =open ended No response = N
Is there a positive relationship between the servicesassistance provided by SBA ED Resources and the clientsrsquo businesses having a positive financial impact on job creation and
retention and increase in sales
5 Please indicate the impact these changes have had on
your firm 1 Increase my sales 2 Improve my cash flow 3 Acquire a bank loan 4 Expand my products
services 5 Hire new staff 6 Revise my marketing
strategy 7 Increase my profit margin 8 Retain current staff 9 Acquire a SBA guarantee
loan 10 Acquire a government
contract 11 Acquire a SBA Disaster
loan 12 Other
Strongly Agree=5 Agree=4 No Opinion=3 Disagree=2 Strongly Disagree=1 other=open ended No response = N
9 If you were projecting to reduce your total number of
employees prior to counseling by SBDCSCOREWBC how many positions have you
retained due to the counseling Full time _____ Part time _____
Open Ended
Office of Entrepreneurial Development
Impact Study of Entrepreneurial Development 104Resources ndash 2010-2011
RESEARCH TOPIC RESEARCH TOPIC SURVEY QUESTIONS SURVEY QUESTIONS RESPONSE CODEDATABASE RESPONSE CODEDATABASE
VALUES VALUES
General Business 1i Are you currently in business
Yes=1 No=0 No response = N
1ii If yes when was the business started
mmyyyy
1iii What is the zip code of your business
Xxxxx
1a If NO when do you plan on starting a business
Within 30 days=1 31-90 days=2 91-120 days=3 No idea at this time=4 No response = N
1b Have you ever been in business
Yes=1 No=0 No response = N
1bi If YES when was the business started
mmyyyy
21i Did you utilize any other SBA resourcesprogram
Yes=1 No=0 No response = N
21ii If YES select those you used [Check all that apply]
SBDC SCORE WBC SBArsquos Guarantee Loan Programs
SBIC Venture Capital Program
Government contracting SBArsquos Surety Bond Program Small Business Training
Network (Online Training)
Disaster Assistance
SCORE =1 or 0 SBDC =1 or 0 Women Business Center =1 or 0
SBArsquos Guarantee Loan Programs =1 or 0 SBIC Financing Program
=1 or 0 SBArsquos Surety Bond Program =1 or 0 No response = N
Office of Entrepreneurial Development
Impact Study of Entrepreneurial Development 105Resources ndash 2010-2011
Office of Entrepreneurial Development
[This page is intentionally left blank for two-sided printing]
Impact Study of Entrepreneurial Development 106Resources ndash 2010-2011
Office of Entrepreneurial Development
Appendix 2 ndash Quantified Survey Results ndash Initial Survey 2010 Clients
Impact Study of Entrepreneurial Development 107Resources ndash 2010-2011
Surveys Questions Percentage of Sample Q1) Are you currently in business
Yes 7476 No 2524Missing 000
Q1a) If no when do you plan on starting a business
Within 30 days 127 31-90 days 362 91-120 days 451 No idea at this time 1542 Missing 7517
Q1b) Have you ever been in business
Yes 918 No 1605 Missing 7478
Q2) If you were not in business at the time you were assisted by the
counselor did you decide to go into business as a result of that
assistance Yes 1605 No 2817Not Applicable (already in
business) 5542
Missing 036 Q3) As a result of the assistance
you received have you changed any of your current management
practicesstrategies
Yes 4486
No 2931 Missing 2583
Q4) As a result of the assistance I received from the counselor I was
able to develop [ie Business Plan] in order to start or better manage my business
Business Plan 3498 Loan Package 829 Purchasing Strategy 407 Marketing Plan 2982 Hiring Plan 482 Feasibility Plan 789 Promotional Plan 1284 Training Plan for Staff 369 Production Plan 406 Pricing Strategy 1439 Financial Strategy 1869 Distribution Plan 330 Cash Flow Analysis 1693 Web-based Strategy 1036 International Trade 147
StGeneral Management
rategy 1779 Other 835
Q5) Please indicate the impact of these changes have had on your firm Strongly Agree=SA Agree=A No Opinion-No Disagree=D Strongly Disagree=SD]
SA A NO D SD Missing
I was able to Increase my sales 725 1803 2870 636 449 3517 Improve my cash flow 682 1816 2827 674 445 3555 Acquire a bank loan 489 518 3631 974 649 3739 Expand my productsservices 666 1702 2808 756 468 3599 Hire new staff 323 817 3664 911 515 377 Revise my marketing strategy 1218 2726 1728 531 392 3404 Increase my profit margin 555 1605 2941 759 471 3669 Retain current staff 337 1177 3628 582 466 3809 Acquire a SBA guarantee loan 313 286 3791 1052 735 3823 Acquire a government contract 127 232 4015 1071 700 3855 Acquire a SBA Disaster loan 030 062 4206 1088 695 3920 Other 559 195 1314 075 241 7616
Office of Entrepreneurial Development
Impact Study of Entrepreneurial Development 108Resources ndash 2010-2011
Q6) Please indicate how useful the services were that you received
from the counselor who assisted you in identifying and correcting problems in operating your business [Very Useful=VU Useful=U No Opinion-NO Somewhat Useful =SU Not Useful =NU]
VU U NO SU NU Missing
Relevancy of Counseling 3720 2023 318 541 525 2872Timeliness of Counseling 3647 2088 505 393 473 2895Helpfulness of Counseling 3855 1960 297 463 540 2885Q7) At the time you were assisted by [SBDCSCOREWBC] what was the approximate annual gross revenue for each of the calendar years below
2009 Revenue given 3205 Missing 6795
2010 Revenue given 3366 Missing 6633
Q8) Counting yourself how many full-time employees and part-time employees did you employ at the end of the following years you were in business
2010 Full-time jobs Average = 27 2009 Full-time jobs Average = 38 2010 Part-time jobs Average = 17 2009 Part-time jobs Average = 28
Q9) At the time you were assisted by [SBDCSCOREWBC] what was the approximate annual gross revenue for each of the calendar years below
Existing Full-time jobs saved Total Full-time Jobs Saved ndash 3768
Existing Part-time jobs saved Total Part-time Jobs Saved ndash 3203
Firms that saved jobs 3746
Office of Entrepreneurial Development
Impact Study of Entrepreneurial Development 109Resources ndash 2010-2011
Q10) If you are in business what is the primary type of business (This question includes multiple responses)
Construction 352 Manufacturing 539 Consulting 522 Wholesale 256 Finance Insurance Real
Estate
188 Entertainment 116 Retail 723
and Drinking Restaurant andor Eating
266 Engineering 095 Publishing 075 Education 181 Service 923 Health Care 216 Day Care 065 Transportation 086 Technology 302
Fi Health Wellness andor
tness 261
Other 1433
Missing 3400 Q11) Indicate the geographic
location of your primary business
Rural 1454 Suburban 2688 Urban 2369 Missing 3489
Q12) What led to your decision to seek business counseling from [SBDCSCOREWBC]
Tried other alternatives but was dissatisfied 821
Reputation of [SBDCSCOREWBC] 4392 Lowfree cost of service 4578
Referred by _____ 3819
Office of Entrepreneurial Development
Impact Study of Entrepreneurial Development 110Resources ndash 2010-2011
Office of Entrepreneurial Development
Q13) Please indicate the value of the information [Extremely Valuable=EV Valuable=V No Opinion=NO Somewhat Valuable=SV Not Valuable=NV]
EV V NO SV NV Missing
Usefulness of Information 4278 3067 318 772 585 980 Relevancy of the Information 4148 3127 393 739 576 1016 Timeliness of the Information 4008 3118 599 636 564 1074 Q14) Please indicate the counselors effectiveness in assisting you [Strongly Agree=SA Agree=A No Opinion-No Disagree=D Strongly Disagree=SD]
SA A NO D SD Missing
The counselor exhibited excellent customer service techniques 5003 2923 498 233 243 1100 The counselor was able to assist me 4397 3081 608 423 397 1094 The counselor exhibited a high level of professionalism 5383 2767 404 148 201 1097 The counselor was knowledgeable of current management practices and issues 4707 2925 784 233 252 1099 The counselor identified with my needs 4426 3039 677 386 374 1098 I would rate my overall experience with the counselor as excellent 4803 2632 631 439 385 1111 Q15) I would refer the counseling services I received to other small businesses [Strongly Disagree=SA Agree=A No Opinion=NO Disagree=D Strongly Disagree=SD]
SA A NO D SD Missing
4847 1515 450 983 1142 1062 Q16) Gender
Male 3560 Female 3576 Both male and female 1698 Missing 1166
Q17) Veteran Status Veteran 858 Service-disabled Veteran 207 Reservist 032 National Guard Member 035 Non-veteran 7524 Missing 1343
Impact Study of Entrepreneurial Development 111Resources ndash 2010-2011
Q18) Age 18-24 169 25-34 1280 35-44 2157 45-54 2752 55-64 2047 65-74 409
75 + 070 Missing 1117
Q19) Are you HispanicLatino 661 Non-HispanicLatino 9339 Missing 0
Q20) Are you American Indian or
Alaskan Native 174 Asian 351 Black or African American 1135Native Hawaiian or Pacific
Islander 053 White 6838Missing 1634
Q21) Did you utilize any other SBA resourcesprogram
Yes 2510 No 5412 Missing 2078
Q21 cont) If yes select those you used
SCORE 792 SBArsquos Guarantee Loan
Program 657 Women Business Center 382 SBIC Venture Capital
Program
041 Government Contracting 322 SBDC 396 SBArsquos Surety Bond
Program
025 Small Business Training
Network (Online Assistance) 627 Disaster Assistance 033 Missing 2885
Office of Entrepreneurial Development
Impact Study of Entrepreneurial Development 112Resources ndash 2010-2011
Office of Entrepreneurial Development
Appendix 3 ndash Quantified Survey Results ndash Follow-up Survey 2010 Clients
2008 2nd Follow Up Results Data
Impact Study of Entrepreneurial Development 113Resources ndash 2010-2011
Surveys Questions Percentage of Sample Q1) Are you currently in business
Yes 8650 No 1350Missing 000
Q2) If no when do you plan on starting a business
Within 30 days 050 31-90 days 000 91-120 days 000 No idea at this time 1300 Missing 8650 Q3) Have you ever been in
business
Yes 950 No 400 Missing 8650
Q4) As a result of the assistance received from the
[SBDCWBCSCORE] Counselor which of the following were you able to develop [ie Business Plan] in order to start or better manage your business [Check all
that apply]
Business Plan 4500 Loan Package 4400Purchasing Strategy 2000 Marketing Plan 1700 Hiring Plan 2450Feasibility Plan 2700 Promotional Plan 1150 Training Plan for Staff 850
Production Plan 400 Pricing Strategy 2050Financial Strategy 1600 Distribution Plan 450
Cash Flow Analysis 1550 Web-based Strategy 950
International Trade 500 General Management 250 Other 1400
Surveys Questions Percentage of Sample
Q5) What was the approximate annual gross revenue of your
business in 2010
Reported 6950 Missing 3050
Q6) Currently how many people (full and part time) including yourself does your business employ
Average Full-Time 55 employees Average Part-Time 18 employees
Q7) Have you utilized any other SBA resourcesprogram
Yes 2200 No 7600 Missing 200
Q8) If YES select those you used [check all that apply]
SCORE 600 SBArsquos Loan Guarantee Programs 150 SBDC 050
SBIC Venture Capital
Program
100 Woman Business Center 550 Government Contracting 000
SBArsquos Surety Bond
Program
100
Small Business Training Network (online training) 300
2009 1st Follow Up Results Data Surveys Questions Percentage of Sample
Q1) Are you currently in business Yes 8298 No 1702 Missing 000
Q2) If no when do you plan on starting a business
Within 30 days 097 31-90 days 152 91-120 days 203 No idea at this time 1225 Missing 8323
Office of Entrepreneurial Development
Impact Study of Entrepreneurial Development 114Resources ndash 2010-2011
Q3) Have you ever been in business
Yes 874 No 813 Missing 8313
Q4) As a result of the assistance received from the [SBDCWBCSCORE] Counselor which of the following were you able to develop [ie Business Plan] in order to start or better manage your business [Check all that apply]
Business Plan 4761 Loan Package 1250 Purchasing Strategy 386 Marketing Plan 3283 Hiring Plan 493 Feasibility Plan 1133 Promotional Plan 1418
Production Plan 371 Pricing Strategy 1499 Financial Strategy 2190 Distribution Plan 234 Cash Flow Analysis 2236 Web-based Strategy 884 International Trade 168 General Management 2266 Other 1758
Q5) What was the approximate annual gross revenue of your business in 2010
Reported 6850 Missing 3150
Q6) Currently how many people (full and part time) including yourself does your business employ
Average Full-Time 49 employees Average Part-Time 34 employees
Q7) Have you utilized any other SBA resourcesprogram
Yes 2602 No 6565 Missing 833
Training Plan for Staff
Surveys Questions Percentage of Sample
300
Office of Entrepreneurial Development
Impact Study of Entrepreneurial Development 115Resources ndash 2010-2011
Surveys Questions Percentage of Sample
Q8) If YES select those you used [check all that apply]
SCORE 986 SBArsquos Loan Guarantee
Programs 655 SBDC 412 SBIC Venture Capital
Program 025 Woman Business Center 310 Government Contracting 381 SBArsquos Surety Bond
Program 020 Small Business Training
Network (online training) 503
Office of Entrepreneurial Development
Impact Study of Entrepreneurial Development 116Resources ndash 2010-2011
Office of Entrepreneurial Development
Appendix 4 ndash Initial Study Survey Instrument
US Small Business Administration Office of Entrepreneurial Development
Initial Economic Impact Survey OMB Number 3245‐0351 Expiration 03312013
Dear Small Business Client
Thank you for your recent visit to [the Small Business Development Center (SBDC) SCORE the Womenrsquos Business Center (WBC)] one of SBArsquos Entrepreneurial Development (ED) Resource Partners We hope you found the business assistance you sought The SBA is always striving to better its programs and deliver relevant and meaningful assistance We want to know if our programs and services are helping the economy by providing useful information on starting and managing a business and eventually helping your business create jobs increasing your businessrsquo revenues and in general fueling the entrepreneurial spirit in America
We would appreciate you taking a few minutes to answer some brief questions that will help us know the quality and impact of the programs All responses to these questions are voluntary and will be held in confidence The data will not be released to any other government agency or private firm Please answer the following questions based on your visit to [the Small Business Development Center (SBDC) SCORE the Womenrsquos Business Center (WBC)]
1 Are you currently in business Yes No If YES when was the business started _ __ _ _ _
mm yyyy What is the zip code of your business location __ __ __ __ __
If Yes to Question 1 skip to Question 2 If No continue to 1a
1a If NO (to Question 1) when do you plan on starting a business Within 30 days 31‐90 days 91‐120 days No idea at this time
1b If NO (to Question 1) have you ever been in business Yes No If YES when was the business started _ _ _ _ _ _
mmyyyy
2 If you were not in business at the time you were assisted by the counselor did you decide to go into business as a result of that assistance
Yes No Not applicable (already in business)
Impact Study of Entrepreneurial Development 117Resources ndash 2010-2011
Office of Entrepreneurial Development
If you answered NO to Question 1 please skip ahead to Question 12
3 As a result of the assistance you received have you changed any of your current management practicesstrategies Yes No
4 As a result of the assistance I received from the [SBDC SCORE WBC] Counselor I was able to develop one or more of the following (ie Business Plan) in order to better manage my business [Check all that apply]
Business Plan Loan Package Purchasing Strategy Marketing Plan Hiring Plan Feasibility Plan Promotional Plan Training Plan for Staff Production Plan Pricing Strategy Financial Strategy Distribution Plan Cash Flow Analysis Web Based Strategy International Trade General Management Other ________________________
5 Please indicate the impact your counseling experience had on your firm [Strongly Agree=SA Agree=A No Opinion=NO Disagree=D Strongly Disagree=SD]
SA A NO D SD I was able to 1 Increase my sales 5 4 3 2 1 2 Improve my cash flow 5 4 3 2 1 3 Acquire a bank loan 5 4 3 2 1 4 Expand my productsservices 5 4 3 2 1 5 Hire new staff 5 4 3 2 1 6 Revise my marketing strategy 5 4 3 2 1 7 Increase my profit margin 5 4 3 2 1 8 Retain current staff 5 4 3 2 1 9 Acquire a SBA guarantee loan 5 4 3 2 1 10 Acquire a government contract 5 4 3 2 1 11 Acquire a SBA Disaster loan 5 4 3 2 1 12 Other (specify ____________________) 5 4 3 2 1
6 Please indicate how useful the services were that you received from the counselor who assisted you in identifying and correcting problems in operating your business
Impact Study of Entrepreneurial Development 118Resources ndash 2010-2011
Very No Somewhat Not Useful Useful Opinion Useful Useful
1 Relevancy of Counseling 5 4 3 2 1 2 Timeliness of Counseling 5 4 3 2 1 3 Helpfulness of Counseling 5 4 3 2 1
Office of Entrepreneurial Development
7 At the time you were assisted by [the Small Business Development Center (SBDC) SCORE the Womenrsquos Business Center (WBC)] what was the approximate annual gross revenue for each of the calendar years below [All data will be held in strict confidence and reported only in the aggregate without identifying any individual small business] Enter dollar figures only Do not include commas or currency symbols
2009 __________________________ 2010 __________________________
8 Counting yourself how many full‐time employees (35 hours or more per week) and part‐time employees (less than 35 hours per week) did you employ at the end of the following years you were in business
2009 _______________ Number of Full‐time employees 2010 _______________ Number of Full‐time employees
2009 _______________ Number of Part‐time employees 2010 _______________ Number of Part‐time employees
9 If you were projecting to reduce your total number of employees prior to receiving counseling from [SBDC SCORE WBC] how many positions have you retained due to the counseling
Existing Full‐time jobs saved ___________ Existing Part‐time jobs saved ___________
10 What is your firmrsquos primary type of business [Please choose only one]
Construction Manufacturing Consulting Wholesale Finance Insurance and Real Estate Entertainment Retail Restaurant andor Eating and Drinking Engineering Publishing Education Service Health Care Day Care Transportation Technology Health Wellness andor Fitness Other (describe) _______________________
11 Indicate the geographic location of your primary business Rural Suburban Urban
12 What led to your decision to seek business counseling from [SBDC SCORE WBC] [Check all that apply]
Tried other alternatives and was dissatisfied Reputation of [SBDC SCORE WBC] Lowfree cost of service Referred by __________________________________
(Fill in blank or add options such as SBA office of ______ )
Other _______________________________________ (Fill in the blank)
Impact Study of Entrepreneurial Development Resources ndash 2010-2011
119
Office of Entrepreneurial Development
13 Please indicate the value of the information you received from the counselor you visited
Extremely No Somewhat Not Valuable Valuable Opinion Valuable Valuable
1 Usefulness of Information 5 4 3 2 1 2 Relevancy of Information 5 4 3 2 1 3 Timeliness of Information 5 4 3 2 1
14 Please indicate the counselorrsquos effectiveness in assisting you [Strongly Agree=SA Agree=A No Opinion=NO Disagree=D Strongly Disagree=SD]
SA A NO D SD 1 The counselor exhibited excellent
customer service techniques 5 4 3 2 1 2 The counselor was able to assist me 5 4 3 2 1 3 The counselor exhibited a high level of
professionalism 5 4 3 2 1 4 The counselor was knowledgeable of current
management practices and issues 5 4 3 2 1 5 The counselor identified with my needs 5 4 3 2 1 6 I would rate my overall experience with
the counselor as excellent 5 4 3 2 1
15 I would refer the counseling services I received to other small businesses
Strongly Agree Agree No Opinion Disagree Strongly Disagree
16 Gender Male owner(s) Female owner(s) Both male and female owners
17 Veterans status Veteran Service‐disabled Veteran Reservist National Guard member Non‐Veteran
18 Age [Circle one] 18‐24 25‐34 35‐44 45‐54 55‐64 65‐74 75+
19 Are you Hispanic or Latino Not of Hispanic or Latino Origin
20 Are you [Please choose one or more] American Indian or Alaskan Native Asian Black or African American Native Hawaiian or Pacific Islander White
Impact Study of Entrepreneurial Development 120Resources ndash 2010-2011
Office of Entrepreneurial Development
21 Did you utilize any of the following SBA resources or programs Yes No
If YES select those you used [Check all that apply] SBDC SCORE SBArsquos Guarantee Loan programs Women Business Center SBIC Venture Capital Program Government Contracting SBArsquos Surety Bond Program Small Business Training Network Disaster Assistance (On‐line training)
PLEASE NOTE The estimated burden for completing this form is 12 minutes per response You are not required to respond to any collection of information unless it displays a currently valid OMB approval number Comments on the burden should be sent to US Small Business Administration Chief AIB 409 3rd St SW Washington DC 20416 and Desk Officer for the Small Business Administration Office of Management and Budget New Executive Building Room 10202 Washington DC 20503 OMB Approval (3245‐0351) PLEASE DO NOT SEND FORMS TO OMB
SBA Form 2214 THANK YOU
Impact Study of Entrepreneurial Development 121Resources ndash 2010-2011
Office of Entrepreneurial Development
[This page is intentionally left blank for two-sided printing]
Impact Study of Entrepreneurial Development 122Resources ndash 2010-2011
Office of Entrepreneurial Development
Appendix 5 ndash Follow-up Survey
US Small Business Administration Office of Entrepreneurial Development Follow‐up Economic Impact Survey
OMB Number 3245‐0351 Expiration 03312013
Dear Small Business Client
Within the last twelve months you were kind enough to respond to our request for some initial data regarding your visit(s) to SBArsquos Entrepreneurial Development resource the [Small Business Development Center (SBDC) Womenrsquos Business Center (WBC) SCORE] To continually understand the impact our programs and services are having on the economy it would be helpful to know if our assistance to you regarding starting and managing a business resulted in job creation increases in your businessrsquo revenues or other results
We understand that you responded to a thorough survey not so long ago but we ask that you help us in answering a few questions for this follow‐up survey which will take less than 5 minutes All responses to these questions are voluntary and will be held in confidence The data will not be released to any other government agency or private firm Based on your visit to the [SBDC WBC SCORE] please use that experience as a benchmark to answer the following
1 Are you currently in business Yes No
If YES when was the business started _ __ _ _ _ mm yyyy
2 If NO when do you plan on starting a business Within 30 days 31‐90 days 91‐120 days No idea at this time
3 Have you ever been in business Yes No If YES when was the business started _ __ _ _ _
mm yyyy
Impact Study of Entrepreneurial Development 123Resources ndash 2010-2011
Office of Entrepreneurial Development
4 As a result of the assistance received from the [SBDCWBCSCORE] Counselor which of the following were you able to develop [ie Business Plan] in order to start or better manage your business [Check all that apply]
Business Plan Loan Package Purchasing Strategy Marketing Plan Hiring Plan Feasibility Plan Promotional Plan Training Plan for Staff Production Plan Pricing Strategy Financial Strategy Distribution Plan Cash Flow Analysis Web Based Strategy International Trade General Management Other ________________________________________
5 What was the approximate annual gross revenue of your business in 2010 $________________00
6 Currently how many people (full and part‐time) including yourself does your business employ
Number of Full‐Time Employees _________________________ Number of Part‐Time Employees _________________________
7 Have you utilized any other SBA resourcesprogram Yes No
8 If YES select those you used [Check all that apply]
SCORE SBArsquos Guarantee Loan programs SBDC SBIC Venture Capital Program Women Business Center Government Contracting SBArsquos Surety Bond Program Small Business Training Network
(online training)
PLEASE NOTE The estimated burden for completing this form is less than 5 minutes per response You are not required to respond to any collection of information unless it displays a currently valid OMB approval number Comments on the burden should be sent to US Small Business Administration Chief AIB 409 3rd St SW Washington DC 20416 and Desk Officer for the Small Business Administration Office of Management and Budget New Executive Building Room 10202 Washington DC 20503 OMB Approval (TBD) PLEASE DO NOT SEND FORMS TO OMB
THANK YOU
Impact Study of Entrepreneurial Development 124Resources ndash 2010-2011
Office of Entrepreneurial Development
Appendix 6 ndash Regression Computations
Regression Results Effects of Firm and Demographic Characteristics on Perceived Usefulness Assistance with the Decision to Start a Business and Financial Impact
Dependent Variable
Independent Variable
Perceived Usefulness
Assistance with Decision to Start a Business (LR)
Financial Impact
Intercept -124024 240905 -191586
SBDC 19242 -040279 48574
SCORE 15332 -072576 49471
lt 3 hours -24964 011296 -53896
Log of Sales 4661 -013453 3762
Gender 2158 -012057 59382
Veteran 6455 00601 4318
Latino -006 -041537 35888
Age 3223 -003744 40697
Native American 61156 038098 -7369
Asian 21109 -082348 46016
Black 44458 -051198 66021
HawaiianPacific Islander
-32923 -075983 -126224
White 42644 -055758 29757
Inbus 49901 -120888 8468
R-Square 0015 0088 0008
Significant at 001 level Significant at 005 level Significant at 010 level
Impact Study of Entrepreneurial Development 125Resources ndash 2010-2011
Office of Entrepreneurial Development
[This page is intentionally left blank for two-sided printing]
Impact Study of Entrepreneurial Development 126Resources ndash 2010-2011
Office of Entrepreneurial Development
Appendix 7 ndash State-by-State Data The tables below display national response data segmented by ED Resource and in aggregate for total ED Resources
SBDC Clients
ED Resource State Surveys Received
SBDC Client Contacts Received
Response Rate
of Total SBDC Clients
SBDC AL 78 342 23 15SBDC AK 9 48 19 02SBDC AS 2 8 25 00SBDC AZ 71 396 18 14SBDC AR 54 207 26 11SBDC CA 527 2593 20 103SBDC CO 101 330 31 20SBDC CT 75 238 32 15SBDC DC 12 45 27 02SBDC DE 16 60 27 03SBDC FL 235 1233 19 46SBDC GA 180 631 29 35SBDC GU 3 9 33 01SBDC HI 23 93 25 04SBDC ID 26 100 26 05SBDC IL 208 957 22 41SBDC IN 124 470 26 24SBDC IA 71 222 32 14SBDC KS 54 207 26 11SBDC KY 77 312 25 15SBDC LA 84 345 24 16SBDC ME 25 97 26 05SBDC MD 93 405 23 18SBDC MA 104 489 21 20SBDC MI 257 765 34 50SBDC MN 99 380 26 19SBDC MS 43 222 19 08SBDC MO 91 381 24 18SBDC MT 22 69 32 04SBDC NE 28 128 22 05SBDC NV 39 153 25 08SBDC NH 17 96 18 03SBDC NJ 143 648 22 28SBDC NM 40 141 28 08SBDC NY 321 1451 22 63SBDC NC 184 621 30 36SBDC ND 8 49 16 02SBDC OH 185 871 21 36
Impact Study of Entrepreneurial Development 127Resources ndash 2010-2011
Office of Entrepreneurial Development
Impact Study of Entrepreneurial Development Resources ndash 2010-2011
ED Resource State Surveys Received
SBDC Client Contacts Received
Response Rate
of Total SBDC Clients
SBDC OK 63 266 24 12 SBDC OR 80 264 30 16 SBDC PA 253 948 27 49 SBDC PR 62 294 21 12 SBDC RI 14 45 31 03 SBDC SC 66 309 21 13 SBDC SD 11 55 20 02 SBDC TN 98 438 22 19 SBDC TX 210 1190 18 41 SBDC UT 56 180 31 11 SBDC VI 5 10 50 01 SBDC VT 13 48 27 03 SBDC VA 151 546 28 30 SBDC WA 149 423 35 29 SBDC WV 24 138 17 05 SBDC WI 117 378 31 23 SBDC WY 12 39 31 02
Totals 5113 20956 1000
SCORE Clients
SCORE Client of Total Surveys Contacts Response SCORE
ED Resource State Received Received Rate Clients SCORE AL 12 99 12 03SCORE AK 0 2 0 00SCORE AZ 113 565 20 25SCORE AR 30 149 20 07SCORE CA 416 2571 16 94SCORE CO 137 484 28 31SCORE CT 161 791 20 36SCORE DC 19 93 20 04SCORE DE 41 211 19 09SCORE FL 309 1619 19 70SCORE GA 62 446 14 14
SCORE HI 26 77 34 06SCORE ID 24 99 24 05SCORE IL 154 994 15 35SCORE IN 73 403 18 16SCORE IA 36 162 22 08
SCORE KS 16 80 20 04SCORE KY 68 335 20 15SCORE LA 19 118 16 04SCORE ME 48 179 27 11
128
Office of Entrepreneurial Development
ED Resource State Surveys Received
SCORE Client Contacts Received
Response Rate
of Total SCORE Clients
SCORE MD 74 374 20 17SCORE MA 164 781 21 37SCORE MI 108 431 25 24SCORE MN 135 626 22 30SCORE MS 2 20 10 00SCORE MO 49 257 19 11SCORE MT 14 52 27 03SCORE NE 15 108 14 03SCORE NV 64 487 13 14SCORE NH 86 334 26 19SCORE NJ 90 467 19 20SCORE NM 31 111 28 07SCORE NY 268 1368 20 60SCORE NC 180 724 25 41SCORE ND 14 67 21 03SCORE OH 225 951 24 51SCORE OK 14 63 22 03SCORE OR 119 588 20 27SCORE PA 254 1081 23 57SCORE RI 13 79 16 03SCORE SC 87 413 21 20SCORE SD 3 14 21 01SCORE TN 68 354 19 15SCORE TX 209 1093 19 47SCORE UT 35 100 35 08SCORE VT 27 116 23 06SCORE VA 112 450 25 25SCORE WA 118 571 21 27SCORE WV 5 24 21 01SCORE WI 97 398 24 22
SCORE WY 0 2 0 00
Total 4444 21981 1000
Impact Study of Entrepreneurial Development 129Resources ndash 2010-2011
WBC Clients
ED Resource State Surveys Received
WBC Client Contacts Received
Response Rate
of Total WBC Clients
WBC AL 28 105 27 48WBC AK 1 4 25 02WBC AS 0 9 0 00WBC AZ 1 18 6 02WBC CA 91 518 18 154WBC CO 4 45 9 07
ED Resource State Surveys Received
WBC Client Contacts Received
Response Rate
of Total WBC Clients
WBC CT 4 35 11 07WBC DC 17 91 19 29WBC DE 4 19 21 07WBC FL 15 78 19 25WBC GA 7 50 14 12WBC IL 11 103 11 19WBC IN 30 173 17 51WBC IA 3 15 20 05WBC KS 12 64 19 20WBC LA 8 79 10 14WBC ME 12 42 29 20WBC MD 21 66 32 36WBC MA 3 18 17 05WBC MI 23 123 19 39WBC MN 9 35 26 15WBC MO 7 37 19 12WBC MT 16 49 33 27WBC NE 8 34 24 14WBC NV 8 48 17 14WBC NM 15 74 20 25WBC NY 43 147 29 73WBC NC 77 480 16 131WBC OH 1 30 3 02WBC OK 9 18 50 15WBC PA 9 48 19 15WBC PR 5 32 16 08WBC RI 4 18 22 07WBC SC 2 10 20 03WBC TN 5 10 50 08WBC TX 28 172 16 48WBC UT 7 27 26 12WBC VT 5 20 25 08WBC VA 6 10 60 10WBC WA 12 85 14 20WBC WV 2 10 20 03WBC WI 16 105 15 27WBC WY 0 8 0 00
Total 589 3162 1000
Office of Entrepreneurial Development
Impact Study of Entrepreneurial Development 130Resources ndash 2010-2011
Office of Entrepreneurial Development
Total ED Resources Clients
Total ED Resources of Total Client ED
Surveys Contacts Response Resources ED Resource State Received Received Rate Clients Total ED Resources AL 118 546 22 12 Total ED Resources AK 10 54 19 01 Total ED Resources AS 2 17 12 00 Total ED Resources AZ 185 979 19 18 Total ED Resources AR 84 356 24 08 Total ED Resources CA 1034 5682 18 102 Total ED Resources CO 242 859 28 24 Total ED Resources CT 240 1064 23 24 Total ED Resources DC 48 229 21 05 Total ED Resources DE 61 290 21 06 Total ED Resources FL 559 2930 19 55 Total ED Resources GA 249 1127 22 25 Total ED Resources GU 3 9 33 00 Total ED Resources HI 49 170 29 05 Total ED Resources ID 50 199 25 05
Total ED Resources IL 373 2054 18 37 Total ED Resources IN 227 1046 22 22 Total ED Resources IA 110 399 28 11 Total ED Resources KS 82 351 23 08 Total ED Resources KY 145 647 22 14 Total ED Resources LA 111 542 20 11 Total ED Resources ME 85 318 27 08 Total ED Resources MD 188 845 22 19 Total ED Resources MA 271 1288 21 27 Total ED Resources MI 388 1319 29 38 Total ED Resources MN 243 1041 23 24 Total ED Resources MS 45 242 19 04 Total ED Resources MO 147 675 22 14 Total ED Resources MT 52 170 31 05 Total ED Resources NE 51 270 19 05 Total ED Resources NV 111 688 16 11 Total ED Resources NH 103 430 24 10 Total ED Resources NJ 233 1115 21 23 Total ED Resources NM 86 326 26 08 Total ED Resources NY 632 2966 21 62 Total ED Resources NC 441 1825 24 43 Total ED Resources ND 22 116 19 02 Total ED Resources OH 411 1852 22 41 Total ED Resources OK 86 347 25 08 Total ED Resources OR 199 852 23 20 Total ED Resources PA 516 2077 25 51 Total ED Resources PR 67 326 21 07
Impact Study of Entrepreneurial Development 131Resources ndash 2010-2011
Office of Entrepreneurial Development
ED Resource State Surveys Received
Total ED Resources Client Contacts Received
Response Rate
of Total ED Resources Clients
Total ED Resources RI 31 142 22 03 Total ED Resources SC 155 732 21 15 Total ED Resources SD 14 69 20 01 Total ED Resources TN 171 802 21 17 Total ED Resources TX 447 2455 18 44 Total ED Resources UT 98 307 32 10 Total ED Resources VI 5 10 50 00 Total ED Resources VT 45 184 24 04 Total ED Resources VA 269 1006 27 27 Total ED Resources WA 279 1079 26 27 Total ED Resources WV 31 172 18 03 Total ED Resources WI 230 881 26 23
Total ED Resources WY 12 49 24 01
Total 10146 46099 1000
Impact Study of Entrepreneurial Development 132Resources ndash 2010-2011