sbn holdings limited annual report 2016 - standard bank us... · 2018-09-27 · namibia. our...
TRANSCRIPT

SBN Holdings Limited Annual report
2016

1915–2016
Celebrating 101 years of moving Namibia forward
Our success and growth over the long term is built on making a difference in the communities in which we operate. We are commercially and morally bound to serve Namibia and her people, in return for the long-term profitable growth we envisage as the leading financial services group on the continent. We are committed to moving Namibia forward.
Standard Bank’s first branch opened in 1915 in Lüderitz. Standard Bank is one of Namibia’s oldest companies. The bank’s original vision was to understand its customers better, have people with strong knowledge of local business conditions and to do a better job of connecting borrowers with lenders. This vision created the platform for the kind of bank it would become and the qualities on which its customers and clients would come to rely.
Over its history, Standard Bank has grown from a mere few staff members to over 1 700 today, and extended its roots deep into the fabric of Namibian society. We have evolved and adapted along with our customers and clients, growing a rich heritage while nurturing and protecting our reputation. We uphold high standards of corporate governance and are committed to advancing the principles and practices of sustainable development. We are inspired to advance national development objectives.
Standard Bank currently has a strong presence in Namibia. These points constitute:
Branches
58ATMs
266Standard Bank has always lived up to the promise of bringing banking to the nation and we have succeeded in doing so by having a wide ATM network of ATMs in Namibia.
1915 1919 1920 1927 1928 1929 1935 1950
LüderitzSwakopmund
Windhoek
GrootfonteinOkahandjaOmaruru
Otjiwarongo
TsumebWalvis Bay
KeetmanshoopOutjo
Mariental Gobabis Otavi Bethanie
1954 1956 1974 1978 1979 1980 1983 1994
Aranos Maltahohe Ausspannplatz Oshakati Khorixas Katutura Gustav Voigts Centre
Henties Bay
1996 1997 1998 1999 2002 2003 2007 2008
GameWernhill Service
Centre
Arandis OndangwaNorthern
Industrial Area Oshakati South
Oshikango RehobothRosh Pinah
RunduAussenkehr
Omuthiya
EenhanaKatima MuliloMaerua Mall
Kuisebmund
2009 2010 2011 2012 2013 2014 2015 2016
Klein Windhoek Okalongo
Okahao Nkurenkuru Otjinene
OpuwoWalvis Bay
OngwediwaOutapi
(ombalantu)
Khomasdal Oshana
The GroveMondesa
Okahandja
OkuryangavaOkongo Agency
RuacanaSwakopmund
(Waterfront)

SBN Holdings Limited Annual report 2016 1
About Standard Bank Namibia 2Our integrated pillars of operation 3
Our value creation story 4
What we do 6
Group strategy 8
Strategic objectives 9 In, for and across Africa 10
Measuring our strategic progress 12
Our material issues 14
Responding to our stakeholders 16
Our socioeconomic impact 18
Chairman’s report 20Chief executive’s review 24Financial review 28Corporate governance report 32Board of directors 40
Executive committee 42
Annual financial statements 44Directors’ responsibilities and approval 46
Independent auditors’ report 47
Directors’ report 49
Statements of financial position 50
Statements of profit or loss 51
Statements of other comprehensive income 52
Statements of changes in equity 54
Statements of cash flows 55
Accounting policy elections 56
Key management assumptions 57
Notes to the annual financial statements 59
Annexure A – Subsidiaries 98
Annexure B – Joint ventures 99
Annexure C – Risk and capital management 100
Annexure D – Emoluments of directors 136
Annexure E – Detailed group accounting policies 137
OversightThe board audit subcommittee is responsible for providing oversight of the financial reporting process. The committee recommended the report for approval to the SBN Holdings board of directors, which was obtained on 23 March 2017.
FeedbackWe welcome the views of our stakeholders on this report. Please contact Sigrid Tjijorokisa: Group company secretary at [email protected] with your feedback.
Reporting suiteTo meet the information needs of our diverse stakeholders, we produce the following reports:
The Annual Report (this report)Our primary report to stakeholders which provides an assessment of our ability to create value over time.
The Corporate Social Investment ReportSets out our corporate social investment initiatives for 2016.
AIRThe Sustainability ReportThis report covers our operations and covers the material focus areas in relation to our strategy.
SDCSI
www.standardbank.com.na/namibia/about-us/company-overview/Annual-reports
Contents
Standard Bank Corporate social
investment report 2016
SBN Holdings Limited Annual report
2016

2
ABOUT STANDARD BANK NAMIBIA
About Standard Bank Namibia
Our listings and shareholdersHeadquartered in Windhoek, SBN Holdings is 90% owned by
Standard Bank Group and 10% owned by Purros Investments Trust, our staff empowerment scheme.
Over the years, our customers and clients have come to rely on us to understand their needs, employ people with strong knowledge of local business conditions and connect borrowers with lenders. We are proud to be part of Standard Bank Group, a large financial services organisation rooted in Africa and with operations in 22 countries.
From humble beginnings of three branches, today, Standard Bank Namibia operates a distribution network of 58 branches and 266 ATMs across Namibia. Our workforce has grown to over 1 700 employees and our roots have extended deep into the fabric of Namibian society.
Standard Bank is committed to making banking available to all Namibians.
Standard Bank opened its first commercial branch in August 1915 in Lüderitz, making it one of Namibia’s oldest companies today.
Our company structure
90%
10%
100%
Stanfin (Namibia)
Standard Insurance Brokers (Namibia)
Purros Investments Trust
Standard Bank Group
SBN Holdings
100% Standard Bank Namibia Nominees
Standard Bank Namibia
NAMIBIA IS OUR HOME
– we drive her growth
To this end we have evolved and adapted together with our customers and clients, developing a rich heritage while nurturing and protecting our reputation. We uphold high standards of corporate governance, are committed to advancing the principles and practices of sustainable development and are inspired to advance national development objectives.
Our success and growth over the long term is built on making a difference in the communities in which we operate. We are commercially and morally bound to serve Namibia and her people, in return for the long-term profitable growth we envisage as a leading financial services group on the continent.

SBN Holdings Limited Annual report 2016 3
Our integrated pillars of operation
Our third business area includes the results of centralised support functions (back office), including those functions that were previously embedded in the business segments. The direct costs of support functions are recharged to the business segments.
Mortgage lending Instalment sale and finance
leases Card products Transactional products Lending products Bancassurance
PBB provides banking and other financial services to individual customers and to small- to medium-sized enterprises.
CIB offers corporate and investment banking services to its clients, which include governments, parastatals, larger corporates, financial institutions and international counterparties.
Global markets Transactional products and
services Investment banking
Personal & Business Banking (PBB)
Corporate & Investment Banking (CIB) Other
OUR OFFERING
CONTRIBUTIONS TO SBN HOLDINGS PAT
PROFIT AFTER TAX (PAT) PROFIT AFTER TAX (PAT)
N$310 million2015: N$356 million
N$218 million2015: N$171 million
N$11 million2015: N$2 million (loss)
57% 41% 2%

4
Our value creation story
Governance approach to value creation over time
Our governance approach promotes strategic decision making that combines long-term and shorter-term outcomes, to reconcile the interests of the group and society in our pursuit of sustainable value.
Our material issues synthesise the interests of the group and those of its stakeholders. They are linked to our value drivers, direct the focus of our strategic planning and management priorities, and inform our reporting to stakeholders.
Managing economic headwinds
Acting on our material issues
Group strategy
Bus
iness
units and corporate functions
Risk appetiteOperating contextOur group strategy is focused on
creating shared value, and represents our commitment to the shared future we intend to create for our clients, our people and our other stakeholders.
Our clients are at the centre of everything we do. This is the central organising principle in the work we are doing to build a digital bank, redesign our operating models, and to develop our people and change our culture – which together will create long-term sustainable competitive advantage.
Our business units and corporate functions have aligned their operating strategies to the group strategy, to ensure effective and coordinated execution within and across our operations for the benefit of our clients.
Our strategy is achieved within the parameters of our risk appetite, which implies conscious risk taking. To enable regular changes to our risk appetite in response to challenges in our operating context, we are instilling a risk-aware culture throughout the group and continually enhancing our risk management capabilities.
Our strategy represents an effective approach to the structural shifts in our industry. Global megatrends such as the technological revolution, increasing stakeholder pressure, and socioeconomic and environmental challenges are imposing the need for wide-reaching transformation in the way we do business.
We remain flexible in our strategic responses to the cyclical pressures in our markets. We identify pockets of opportunity for revenue generation, and employ well-developed risk models to anticipate and manage the impact of risks that are heightened during times of economic stress.
Our clients
Responding to our stakeholders
Our stakeholders are the providers of the capital we need to create value. Stakeholder inclusivity and responsiveness enables us to secure and maintain these inputs, and to identify opportunities and challenges.
Clients
Performance linked to value creationWe are embedding a high-performance culture and creating an environment in which our people are empowered and motivated to deliver exceptional client experiences, and are rewarded for their contribution towards realising our purpose and vision.
Remuneration that drives value over timeOur reward philosophy is being evolved to reflect the group strategy. We combine reward elements that link directly to strategic and financial performance criteria and thresholds. These awards are made on a discretionary basis to avoid penalising executives for factors outside of their control that impact on value creation.
ABOUT STANDARD BANK NAMIBIA

SBN Holdings Limited Annual report 2016 5
Ethical and effective leadershipEthical and effective leadership relates to uniting purpose and performance. Embedding an ethical culture recognises that the trust of our stakeholders is the basis on which we compete and win.
Corporate citizenshipCorporate citizenship relates to the integral role we play in the socioeconomic wellbeing of Namibia. It commits us to using our resources responsibly as inputs to our business model, and balances our needs with those of society.
Sustainable developmentSustainable development commits us to enhance the resources and relationships we rely on today, for the future. Our plans to measure social, environmental and economic returns, will enable us to account for the total returns we deliver in line with our purpose.
Our strategic value drivers are outlined starting on page 9. The chief executive’s review on page 24, assesses our strategic performance for the year.
Driving Namibia’s growth over the
long term
Our multi-generational purpose recognises the
mutual interdependency of Namibia’s wellbeing and
that of the group. It is the ultimate expression of our
commitment to Namibian growth that is inclusive
and sustainable, and in turn secures viable
markets for our long-term profitability and value
creation.
Creating value for society
Social relevance is fundamental to our survival
and success, and is implied in our purpose and vision.
We are moving towards measuring our social return,
and to obtain a truer picture of our broader value
outcomes. This involves identifying the social,
economic and environmental risks and opportunities that
Namibia presents and how our business activities can
respond to these.
Creating value for the group
Our strategic value drivers align our allocation of
resources to our strategy. We have identified five key
value drivers, shown below, and continue to work on
selecting the appropriate metrics for each, which are
supporting more effective resource allocation and
appropriate trade-off decisions.
• Client focus • Employee engagement
• Risk and conduct • Financial outcome
• Social, economic and environmental
outcome
The chairman’s report on page 20 discusses key governance
developments and substantiates our commitment to corporate citizenship and sustainability.
The governance and remuneration report discusses how our governance framework and processes, and our board and committees, support the creation and protection of value.
Embracing innovation
Shareholders and investment analysts
Putting our clients’ best interests at the
centre of our business
Employees and their representatives
Leveraging our investments in IT
Communities and civil society
Motivating our people
Suppliers
What we do on page 6 links our business activities to socially beneficial outcomes.
Managing regulatory
change
Governments and regulators

6
What we do
Net profit
Retained equity which is reinvested to sustain and
grow our business
Income after credit impairments
Expenses
Dividends to our shareholders
Direct and indirect taxes to governments and other
related regulators
Credit risk Interest rate risk Insurance risk Business and reputational risk
Liquidity risk Market risk Operational risk, including compliance, environmental and/or social risk
As a financial services organisation with a broad offering of products and services, our goal is for all of our business units and corporate functions to work together in an integrated manner to seamlessly deliver on our clients’ financial needs.
ABOUT STANDARD BANK NAMIBIA
INCOME
EXPENSES
Interest expense
Net fee and commission
revenue
Trading revenue
Other revenue
Other operating costs
Interest income and credit
impairments
Source funding from client
deposits and other funders.
Provide transactional
banking facilities and knowledge-based
services to clients.
Market access and risk mitigation
products to businesses.
Revenue from other sources linked to
core business, as well as strategic
investments.
Invest in our operations.
Lend money to our
clients.
Invest in our people.
Staff costs
bankin
g activities
BU
SIN
ES
S A
CT
IVIT
IES
Inco
me
sta
tem
en
t im
pa
ct
Our clients are at the cen
tre of everything we do
banking and insurance activ
ities
Net interest income
1
2
3
4
5
6
7

SBN Holdings Limited Annual report 2016 7
1 Creates assets from which we derive interest income over time.
Lending enables individual clients to create wealth and generate income, helps business clients remain sustainable and supports employment and inclusive economic growth in Namibia.
2 Enables lending, creating liabilities that generate interest expense.
Funding provides our depositors with long-term returns, while mitigating against the erosion of their capital due to inflation.
3 Generates income through fee and commission revenue.
Transactional banking facilitates the movement of wealth, providing clients with convenient access to their funds. Our knowledge-based services, which include corporate advisory and loan structuring services, allow our clients to benefit from our experience and track record on the continent, and enables us to connect them to global pools of capital.
4 Creates trading revenue through participation in foreign exchange, commodity, credit, interest rate and equity instruments.
Market access enables businesses to grow, provides a conduit for investment into Namibia and helps economies monetise resources and diversify. Risk mitigation products enable financial protection and diversification through risk transfer.
5 Creates other sources of revenue, including insurance-related revenue and income from strategic investments.
Strategic investments support inclusive economic activity and enable wealth creation, while also contributing to investments that drive the socioeconomic development of Namibia. Short-term insurance activities offer protection of the value of assets against unforeseen loss.
6 Enables the group to invest in strategic information technology (IT) infrastructure, to enhance our capabilities and improve efficiency, and to deliver relevant products and services that meet our clients’ needs.
Investing in our operations enables us to develop innovative products and to continue meeting our clients’ needs, which supports our social relevance and legitimacy, maintains our positive contribution to the Namibian economy and strengthens our competitive position.
7 We invest in our people to align them to our strategic objective of consistently delivering excellent client experiences.
We hire locally wherever possible and through our activities, sustain other jobs in local economies. Training and development enhances the level of financial services and related skills in Namibia.
What this means for society
What this means for the group

8
ABOUT STANDARD BANK NAMIBIA
Why we can confidently deliver on our purpose
Legitimacy
Great
PEOPLE
PIONEERING
Passionate about
Namibia
The reason we exist Purpose
Group strategy Our strategy is centred on our commitment to Africa and directs our growth and evolution to the shared benefit of our clients, our people and all our stakeholders. It allows us to lead with purpose, to build a better business, and to position our footprint and platform for the future.
OU
R G
RO
UP
ST
RA
TE
GY
Risk Finance IT Operations Human capital Marketing and
communications
Compliance Legal Internal audit Group real
estate services
CORPORATE FUNCTIONS
BUSINESS UNITS
Corporate & Investment Banking
Personal & Business Banking
Liberty
Sta
nd
ard
B
an
k W
ealt
h
*Brand Finance: Africa’s most valuable banking brand, September 2016.
Technology andclient offerings(blue wallet blue voucher)
54 348 people
Brand*
1 20countries of operation in sub-Saharan Africa
What we aspire to be
Vision
directs and guides our business units and corporate functions
who leverage our presence and diverse capabilities to deliver on our group strategy
The behaviours and qualities that define us at our best
Values
Africa is our home, we drive her growth.
To be Africa’s (Namibia’s) agile provider of innovative financial solutions
Our values support our legitimacy, and are the basis on which we earn the trust
of our stakeholders:
Being proactive
Constantly raising the bar
Delivering to our shareholders
Serving our customers
Growing our people
Working in teams
Respecting each other
Upholding the highest levels of integrity
Heritage and brand >150 years
Commercial pragmatism
Brave long-term decisions
Present in AFRICA AND BEYOND
Committed to our clients & the trust they have in us

SBN Holdings Limited Annual report 2016 9
Strategic objectives
In 2015, the SBN Holdings leadership team commenced with the implementation of our 2015 – 2017 strategy, founded on a strong sense of team work and common purpose as evidenced by the collaboration and coordination of activities and plans across the bank.
The 2015 – 2017 strategic plan is underpinned by our values and the following themes:
Client centricityThis strategic objective aims to provide an excellent customer experience to everyone that engages with us. In doing this, we aim to employ a culture of continuous improvements to our systems, processes, products and people, as well as commit to a deep understanding of our customers’ needs and requirements in order to customise our propositions.
We want to position the bank as the employer of choice in Namibia. To this end, we have reviewed our staff engagement and recognition programmes, and have strengthened our training programmes given the business requirements. We cannot achieve the change and progress we are planning without a strong, motivated, skilled and engaged workforce.
Employer of choice
Given the journey that the bank has travelled in the implementation of the new core banking system, it is imperative that we prioritise the need to review and update our processes, products and services to optimise the new core banking system. In order to make this possible, we are creating an enabling environment for harvesting new ideas and look for opportunities for change and continuous improvement.
Continuous innovation
This pillar of our strategy is aimed at making the bank the preferred bank in our chosen market segments, supported by products and services that are solution driven, in line with our customers’ needs. This pillar looks at the refreshing of our value propositions to our customers for our key products and focus segments to ensure ongoing relevance and preference.
Trusted & preferred bank
All the above initiatives are geared toward the bank realising accelerated growth over the coming years. The management team has set itself ambitious but achievable targets for growth over the three-year strategy period.
Accelerated growth
The state-of-the-art systems and technologies that the bank has invested in and implemented over the last three years provide a foundation for system optimisation, efficiencies and cutting edge innovation in the years ahead.
Technology optimisation

10
ABOUT STANDARD BANK NAMIBIA
Tanzania
AngolaZambia
Namibia
Botswana
Zimbabwe
South Africa Lesotho
Swaziland
Mauritius
Malawi
EthiopiaSouth SudanNigeria
GhanaCôte
d’Ivoire
Kenya
Uganda
DRC
Mozambique
In, for and across Africa
Our diverse portfolio of operations has demonstrated resilience in withstanding cyclical pressures of generally slower economic growth and low commodity prices, and the spill-over effects of currency dislocation, regulatory reactivity and socio-political instability. Our contribution to driving more inclusive growth and promoting policy reform that supports economic diversification and development over the long term, will assist in extending Africa’s structural growth path notwithstanding the immediate economic challenges.
Our purpose-led strategy is designed to realise the opportunities presented by Africa’s longer-term structural trends.
Standard Bank
Representative office
Africa’s relative underdevelopment enables the implementation of the latest technologies, leapfrogging older technologies such as fixed-line communications with mobile networks, and coal-fired power with renewable energy.
50% of Africans will live in cities by 20301
Africa’s rapid rate of urbanisation is expected to continue rising from 36% in 2010 to 50% in 2030. This conglomeration of people provides governments and businesses with an opportunity to lower the cost of providing products and services.
200 million Africans aged 15 to 24 by 20504
Africa’s population is expected to double by 2050. With an estimated median age of 20, Africa’s youthful population will place increasing pressure on governments and businesses to drive employment growth as a greater number of Africans reach working age.
1.5 billion Africans of working age (15 to 64) by 20503
Africa’s working population is currently 659 million people, expected to grow to 861 million by 2020 and 1.5 billion by 2050.
28.7% of Africans are
online2
5.4% average GDP growth in sub-Saharan Africa from 2005 to 20156
GDP growth in Africa as a whole for the same period was slightly lower at 4.0%. This compares to the global average of 3.8% and 1.5% growth in developed economies over the same period.
136% increase in inter-Africa trade from 2005 to 20155
Inter-Africa trade increased from USD28,8 billion in 2005 to USD68 billion in 2015.
We are well positioned to facilitate the growing interregional trade and investment flows across the continent, to assist the economic growth of African countries and the expansion of multinationals into Africa.
Facilitating Africa’s growth
AFRICA

SBN Holdings Limited Annual report 2016 11
47.8% growth in China-Africa foreign direct investment (FDI)7
FDI into Africa from China is shifting from extraction to manufacturing industries.
Connecting Africa to developed world economic centres Our presence in, and connection with, global financial centres enables us to facilitate investment and development flows into Africa, and to access international capital to facilitate growth, diversification and development in Africa.
USD929 billion in world trade with Africa in 20157
This represents a 178% increase from USD334 billion a decade ago. About 70% of Africa’s exports are metals and minerals, indicating the need for economic diversification.31% of capital flowing into Africa is from worker
remittances8
Remittances replaced foreign aid as the largest external inflow to Africa in 2009, as Africa’s dependence on official development assistance eased by 18.7% to USD83,7 billion in 2015, from USD103 billion in 2014.
One third of the world’s mineral reserves are in Africa11
The continent also has 10% of world oil reserves and the largest cobalt and diamond reserves in the world, and 95% of the world’s platinum reserves are located in South Africa. Commodities remain fundamental to modern economies, and Africa’s resources remain largely either undiscovered or underexploited.
38.4% less Africans living below the international poverty line over the last decade10
Africans living below USD1,9 a day has fallen to 39.1% compared to 63.5% a decade ago.
60% of the world’s arable land is in Africa9
The underutilisation of arable land across the continent holds vast potential for increased commercial agriculture and production of agricultural goods. Mitigating the impact of climate change will be an essential part of realising this potential.
Facilitating China-Africa trade and investmentChina remains Africa’s largest trading partner and an increasingly important source of foreign investment across Africa. Our strategic partnership with ICBC provides us with a unique opportunity to provide financial services to clients operating in the China-Africa corridor.
1 African Development Bank – Urbanization in Africa (2012).
2 Internet World Stats (June 2016) – www.internetworldstats.com.
3 UN Population Statistics.
4 Africa Economic Outlook – Promoting Youth Employment in Africa (2012).
5 International Trade Centre.
6 International Monetary Fund; Standard Bank Research.
7 Annualised compound growth Overseas Development Institute (ODI, 2016).
8 African Development Bank – Organisation for Economic Co-operation and Development.
9 World Bank.
10 African Development Bank.
11 Economics Intelligence Unit – African Development Bank.

12
ABOUT STANDARD BANK NAMIBIA
Measuring our strategic progress
During 2016, we embarked on a journey across the group to develop clearly defined strategic value drivers. These drivers provide the group and its stakeholders with transparent and consolidated information that we believe is of most relevance in measuring the group’s sustainability lead strategy and performance in delivering value to the group’s stakeholders.
Strategic value drivers*
CLIENT FOCUS EMPLOYEE ENGAGEMENT
What this means
Placing clients at the centre of everything we do
Making Standard Bank a great place to work
How the driver aligns with our strategy
Clients are at the heart of our business and by focusing on our clients we will achieve a profitable and sustainable business.
Our focus is to consistently create excellent client experiences, by understanding our clients and by offering the products, services and solutions that our clients need.
We strive to create a great place to work where our people feel deeply connected with our purpose and our clients, are empowered and recognised for delivering against our strategic objectives, and have made the most of every opportunity to achieve their full potential. How our people think and feel about work directly correlates with our client satisfaction levels and our ability to deliver our strategy.
How we measure our progress and performance
To understand our clients better we measure their satisfaction in terms of:
Net Promoter Score (NPS) for PBB
Client satisfaction index (CSI) for CIB.
These scores are determined from client surveys conducted in phases throughout the year to obtain an annual result.
To determine engagement levels, we consider the following:
Deloitte Best Company to Work for Survey.
What we are working toward
Over and above these existing measures, the group is looking to develop a holistic client experience measure across segments, business units and geographies. This will provide more detail on accessibility, ease of doing business, personalised offerings, staff engagement, brand value and reputation, executional excellence and value for money.
The employee survey will be conducted annually across the group.
Our performance to delivering on our strategy
The results of our client surveys indicate that we have met expectations in servicing our clients. We will continue to explore ways to better our results.
Deloitte Best Company to Work for Survey has shown improvements on the rating from 3.55 to 3.62 in 2016.
SBN Holdings Limited Annual report 2016 13
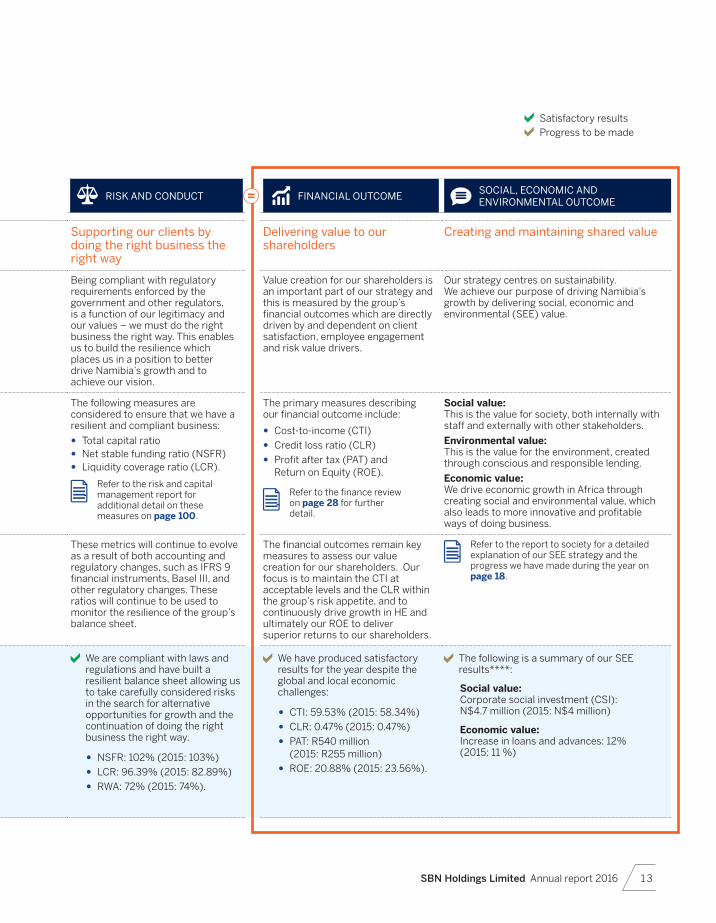
RISK AND CONDUCT FINANCIAL OUTCOMESOCIAL, ECONOMIC AND ENVIRONMENTAL OUTCOME
Supporting our clients by doing the right business the right way
Delivering value to our shareholders
Creating and maintaining shared value
Being compliant with regulatory requirements enforced by the government and other regulators, is a function of our legitimacy and our values – we must do the right business the right way. This enables us to build the resilience which places us in a position to better drive Namibia’s growth and to achieve our vision.
Value creation for our shareholders is an important part of our strategy and this is measured by the group’s financial outcomes which are directly driven by and dependent on client satisfaction, employee engagement and risk value drivers.
Our strategy centres on sustainability. We achieve our purpose of driving Namibia’s growth by delivering social, economic and environmental (SEE) value.
The following measures are considered to ensure that we have a resilient and compliant business:
Total capital ratio Net stable funding ratio (NSFR) Liquidity coverage ratio (LCR).
Refer to the risk and capital management report for additional detail on these measures on page 100.
The primary measures describing our financial outcome include:
Cost-to-income (CTI)
Credit loss ratio (CLR)
Profit after tax (PAT) and Return on Equity (ROE).
Refer to the finance review on page 28 for further detail.
Social value:This is the value for society, both internally with staff and externally with other stakeholders.
Environmental value: This is the value for the environment, created through conscious and responsible lending.
Economic value: We drive economic growth in Africa through creating social and environmental value, which also leads to more innovative and profitable ways of doing business.
These metrics will continue to evolve as a result of both accounting and regulatory changes, such as IFRS 9 financial instruments, Basel III, and other regulatory changes. These ratios will continue to be used to monitor the resilience of the group’s balance sheet.
The financial outcomes remain key measures to assess our value creation for our shareholders. Our focus is to maintain the CTI at acceptable levels and the CLR within the group’s risk appetite, and to continuously drive growth in HE and ultimately our ROE to deliver superior returns to our shareholders.
Refer to the report to society for a detailed explanation of our SEE strategy and the progress we have made during the year on page 18.
We are compliant with laws and regulations and have built a resilient balance sheet allowing us to take carefully considered risks in the search for alternative opportunities for growth and the continuation of doing the right business the right way.
NSFR: 102% (2015: 103%)
LCR: 96.39% (2015: 82.89%)
RWA: 72% (2015: 74%).
We have produced satisfactory results for the year despite the global and local economic challenges:
CTI: 59.53% (2015: 58.34%)
CLR: 0.47% (2015: 0.47%)
PAT: R540 million (2015: R255 million)
ROE: 20.88% (2015: 23.56%).
The following is a summary of our SEE results****:
Social value: Corporate social investment (CSI):
N$4.7 million (2015: N$4 million)
Economic value: Increase in loans and advances: 12%
(2015: 11 %)
Satisfactory results
Progress to be made
14
INPUTS
INTERNAL
EXTERNAL
ABOUT STANDARD BANK NAMIBIA
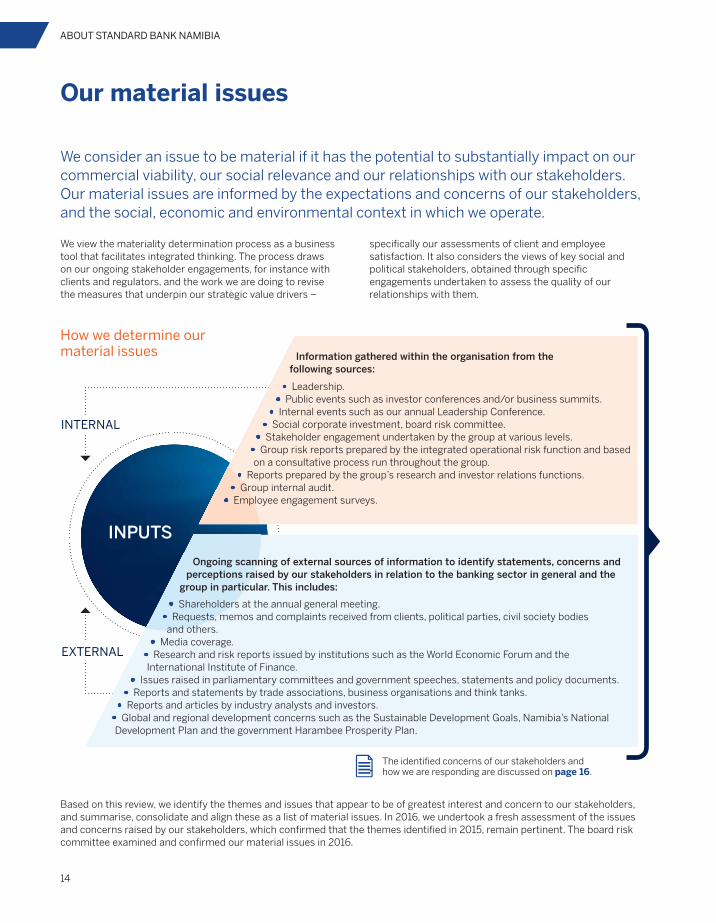
Our material issues
We view the materiality determination process as a business tool that facilitates integrated thinking. The process draws on our ongoing stakeholder engagements, for instance with clients and regulators, and the work we are doing to revise the measures that underpin our strategic value drivers –
We consider an issue to be material if it has the potential to substantially impact on our commercial viability, our social relevance and our relationships with our stakeholders. Our material issues are informed by the expectations and concerns of our stakeholders, and the social, economic and environmental context in which we operate.
How we determine our material issues
Based on this review, we identify the themes and issues that appear to be of greatest interest and concern to our stakeholders, and summarise, consolidate and align these as a list of material issues. In 2016, we undertook a fresh assessment of the issues and concerns raised by our stakeholders, which confirmed that the themes identified in 2015, remain pertinent. The board risk committee examined and confirmed our material issues in 2016.
The identified concerns of our stakeholders and how we are responding are discussed on page 16.
specifically our assessments of client and employee satisfaction. It also considers the views of key social and political stakeholders, obtained through specific engagements undertaken to assess the quality of our relationships with them.
Information gathered within the organisation from thefollowing sources:
Ongoing scanning of external sources of information to identify statements, concerns andperceptions raised by our stakeholders in relation to the banking sector in general and the
group in particular. This includes:
• Shareholders at the annual general meeting.• Requests, memos and complaints received from clients, political parties, civil society bodies and others.
• Media coverage.• Research and risk reports issued by institutions such as the World Economic Forum and the International Institute of Finance.
• Issues raised in parliamentary committees and government speeches, statements and policy documents.• Reports and statements by trade associations, business organisations and think tanks.
• Reports and articles by industry analysts and investors. • Global and regional development concerns such as the Sustainable Development Goals, Namibia’s National Development Plan and the government Harambee Prosperity Plan.
• Leadership.• Public events such as investor conferences and/or business summits.
• Internal events such as our annual Leadership Conference.• Social corporate investment, board risk committee.
• Stakeholder engagement undertaken by the group at various levels.• Group risk reports prepared by the integrated operational risk function and based on a consultative process run throughout the group.
• Reports prepared by the group’s research and investor relations functions.• Group internal audit.
• Employee engagement surveys.

SBN Holdings Limited Annual report 2016 15
1Our customers and clients are the reason we are in business.
Our intentHow we design our products, deliver our services, conduct ourselves and make strategic decisions should all be done in the best interests of our clients.
What we will do to realise the opportunities presented by our strategy Instil a culture that values excellent client experiences, ethical and fair conduct and market
integrity among all our people. Constantly leverage new technologies to meet changing client expectations and enter
partnerships for innovation. Ensure appropriate technical capability and skill to prevent our clients from being exploited. Keep client information private and ensure the veracity of client data.
2Our employees enable our ability to meet our objectives, provide a positive client experience, comply with our regulatory obligations and create shareholder value.
Our intentWe are committed to embedding a culture that encourages and rewards excellence and ensures adherence to our values.
What we will do to realise the opportunities presented by our strategy Ensure we have the right skills and capabilities to successfully execute our strategy, manage
differing expectations of a multi-generational workforce and comply with local transformation legislation.
Build an ethical and risk-aware culture that mitigates the risk of internal fraud, client exploitation and unethical conduct.
Capacitate our people to perform in a technology-led environment.
3Namibia is our home and we are committed to the expansion and deepening of our business across the country.
Our intentWe will work with our clients to support economic growth and diversification and counterbalance the slowdown in emerging markets and the related decline in commodity prices.
What we will do to realise the opportunities presented by our strategy Maintain profitability within our risk appetite while navigating challenging economic and
regulatory environments, meeting client expectations and competing effectively. Invest in innovative products and services. Ensure robust monitoring of strategy implementation and harmonise strategies across the
business. Maintain a forward-looking view of potential socio-political landscape and put appropriate
business continuity measures in place.
4Continual innovation.
Our intentWe will continue to innovate so that we are able to constantly improve the value and experience we provide for our clients and to stay ahead of our competitors.
What we will do to realise the opportunities presented by our strategy Deliver new products and services to market quickly without compromising system stability. Develop a culture that encourages innovation and challenges established processes, with a view
to delivering excellent client experiences to differentiate us in a commoditised and low-cost competitive environment.
Develop the capacity of our people to ensure they are resilient and supportive of business changes. Ensure third parties maintain the security of client information, where it is necessary to share
such information to develop innovative solutions. Address social challenges through innovation.
5The regulatory frameworks governing financial services providers, at national and global level, are continually evolving with supervisory powers of certain regulatory bodies having significantly increased.
Our intentWe will continue to work closely with all our regulators to ensure that we manage regulatory developments effectively, while minimising as far as possible negative impacts on clients, employees and areas of business.
What we will do to realise the opportunities presented by our strategy Adhere to associated regulations when processing data shared across third-party networks and
monitor service providers to ensure compliance with privacy controls. Maintain and enhance our ability to comply with changing regulation across jurisdictions and
comply with capital requirements at all times, in a way that does not compromise client experience. Instil a compliance mindset across the group.
6Our IT systems and functionality is essential to our ability to provide our clients with uninterrupted access to safe, secure and reliable products and services, and to mitigate risk.
Our intentWe will strive to improve the stability and technical sophistication of our IT systems and functionality to improve the services we provide to our clients.
What we will do to realise the opportunities presented by our strategy Balance client expectation for innovation against maintaining system stability. Constantly monitor and anticipate criminal exploitation of our systems and cyber-attacks on our
services, and deploy prevention and mitigation measures. Ensure that our systems maintain the privacy of client information and put additional measures in
place to protect our data stores.

16
ABOUT STANDARD BANK NAMIBIA
To protect our legitimacy, which is necessary to compete effectively and create value, we work hard to build and maintain relationships of trust with our stakeholders based on open and proactive engagement.
Our stakeholders are those individuals or organisations that have an interest in our success or failure and whose opinions and actions can impact on our ability to execute our strategy and conduct our business activities. Outlined below are the top issues raised by our key stakeholders and our strategic initiatives that respond to these concerns.
Concern Our strategic initiatives Material issue
Clients
Improving client service levels and providing cheaper, more convenient banking options.
Groupwide focus on enhancing client experience through: IT platform modernisation programme. Innovative digital services that provide relevant banking and wealth solutions
per client segment. Empowering client-facing staff to make decisions. Changing organisational structures and ways of working.
2 5 6
Increasing process efficiency and automation of payments to reduce delays, errors and complexity.
Managing the impact of compliance requirements on client experience.
Technologically-enabled compliance and risk solutions. Digital services that meet regulatory requirements.
2 4 5 6
Preserving multi-generational wealth and delivering solutions for younger high net worth individuals.
Integrated multi-generational wealth solutions. Leadership Academies to guide this client segment.
2
Higher expectations of personalised, relevant advice from financial advisers.
New client-focused operating model in Wealth. Goals-based investment philosophy where product and advisory services are
aligned to the principles of the pending Retail Distribution Review.
2 4
Concerns with respect to cybercrime and fraud.
Sophisticated fraud detection and mitigation tools. Regular client and staff awareness campaigns.
2 5 6
Suppliers
Aligning the group’s procurement practices to support transformation in Namibia.
Proactive and deliberate approach, including targets, to ensure the equitable participation of black-owned businesses in Standard Bank’s supply chain.
Redirecting goods and services previously procured from foreign suppliers to local black suppliers, where feasible.
Supplier development programmes for small businesses, including access to financing, where relevant.
1 4
Employees and their representatives
The need to develop new skills in a changing operating environment due to the rise of digitisation and automation.
Wide range of continuous learning programmes. Leadership, youth and specialised skills development programmes. University partnerships to develop IT curricula. Initiatives such as upskilling, retraining and redeployment to assist
employees affected by changes to business operating models and the introduction of new ways of working.
3 6
Driving diversity and inclusion to create a workforce that is locally relevant.
Diversity and inclusion framework. Employment equity targets in Namibia. Accelerate the development of local talent pipelines in operating countries,
and the advancement of black employees in Namibia.
1 3 4
Responding to our stakeholders

SBN Holdings Limited Annual report 2016 17
Our ongoing stakeholder engagement initiatives and those specifically related to determining the group’s material issues are outlined on page 14, and discussed comprehensively in the report to society.
Concern Our strategic initiatives Material issue
Governments and regulators
Rebuilding trust and maintaining stability in the financial sector, and compliance with various legislative changes.
Adoption of global best practice in financial standards. Strong relationships with local banking regulators and central bank officials. Standardised groupwide compliance model. Cooperation between compliance teams at group and country level. Skills sharing through cross-jurisdictional secondments. Automated compliance monitoring and reporting. Standardisation of the methodology to assess and prepare for the impact of
new regulation.
1 4 6
Improving the control environment in the Africa Regions.
Embedding compliance and risk-aware behaviour.
Strong focus on employee conduct and values. Regulatory awareness initiatives and compulsory compliance training.
1 3 4
Shareholders and investment analysts
The group’s resilience to challenging economic conditions, globally and in South Africa.
Leverage our diversified portfolio at sector, regional and client levels, by allocating capital to select growth opportunities.
Regular risk assessments and adjustment of risk appetite. Retain quality client segments and grow select client segments in PBB. Increase CIB’s exposure to growth sectors and economies, offsetting
declines in commodity sectors. Support clients facing difficulties through appropriate debt restructuring.
1 2
Maintaining asset quality.
Managing costs and improving the cost-to-income ratio.
Maintain disciplined cost management. Achieve global benchmarks for IT expenditure from 2018.
2 4
Improving the performance of ICBCS.
The strategic cooperation agreement with ICBC remains an important element in both our Africa strategy and in the future of the group’s other banking interests.
1 2
Unclear executive pay and long and short-term incentive structures.
Review the current remuneration policy and how it links to the group’s strategic value drivers to provide stakeholders with a better understanding of executive remuneration structures.
3 4
Communities and civil society
Contributing to alleviating societal challenges across the continent.
Business activities facilitate financial inclusion, infrastructure investment, entrepreneurship, enterprise development and job creation.
Initiatives and digital solutions that support small businesses to become sustainable.
Support for civil society organisations. Learnership programmes that provide on-the-job experience for matriculants
and graduates. Standard Bank Namibia Buy a Brick campaign. CE outreach
1 2 5
Contributing to initiatives that address macroeconomic and socio-political challenges.
Funding for higher education. Standard Bank bursary programmes. Work with government, corporates and universities to develop sustainable
tertiary education funding solutions. Fawena
1 3
The group’s efforts to mitigate the impact of climate change.
Managing environmental and social risk related to financing activities. Standard Bank-financed renewable energy projects. Adoption of green building principles and measures to reduce the direct
environmental impact of activities.
1 2
18
ABOUT STANDARD BANK NAMIBIA
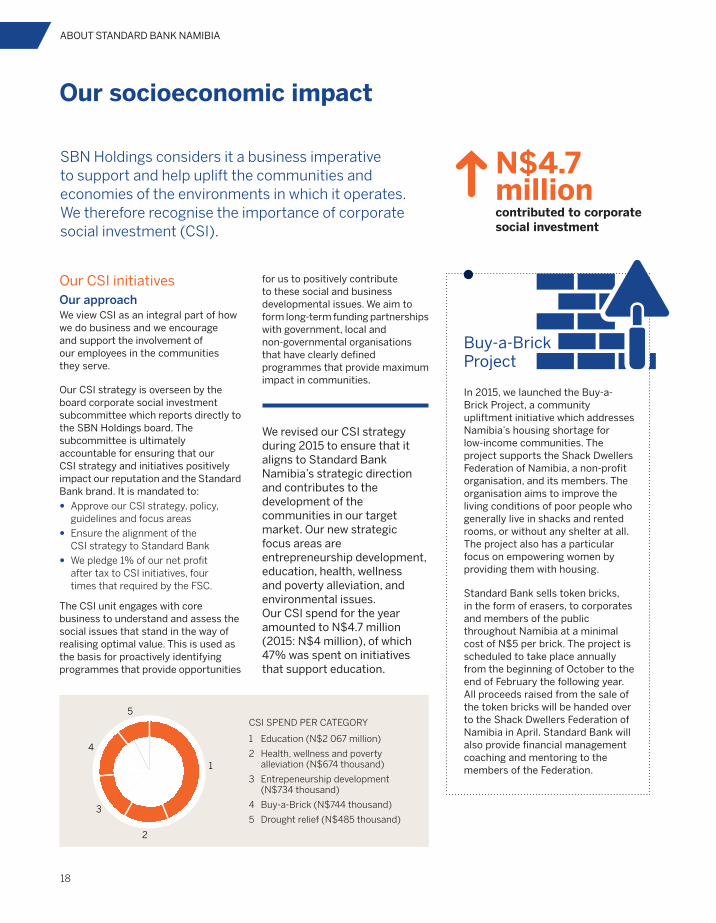
SBN Holdings considers it a business imperative to support and help uplift the communities and economies of the environments in which it operates. We therefore recognise the importance of corporate social investment (CSI).
Our socioeconomic impact
Our CSI initiativesOur approachWe view CSI as an integral part of how we do business and we encourage and support the involvement of our employees in the communities they serve.
Our CSI strategy is overseen by the board corporate social investment subcommittee which reports directly to the SBN Holdings board. The subcommittee is ultimately accountable for ensuring that our CSI strategy and initiatives positively impact our reputation and the Standard Bank brand. It is mandated to:
Approve our CSI strategy, policy, guidelines and focus areas
Ensure the alignment of the CSI strategy to Standard Bank
We pledge 1% of our net profit after tax to CSI initiatives, four times that required by the FSC.
The CSI unit engages with core business to understand and assess the social issues that stand in the way of realising optimal value. This is used as the basis for proactively identifying programmes that provide opportunities
We revised our CSI strategy during 2015 to ensure that it aligns to Standard Bank Namibia’s strategic direction and contributes to the development of the communities in our target market. Our new strategic focus areas are entrepreneurship development, education, health, wellness and poverty alleviation, and environmental issues. Our CSI spend for the year amounted to N$4.7 million (2015: N$4 million), of which 47% was spent on initiatives that support education.
In 2015, we launched the Buy-a-Brick Project, a community upliftment initiative which addresses Namibia’s housing shortage for low-income communities. The project supports the Shack Dwellers Federation of Namibia, a non-profit organisation, and its members. The organisation aims to improve the living conditions of poor people who generally live in shacks and rented rooms, or without any shelter at all. The project also has a particular focus on empowering women by providing them with housing.
Standard Bank sells token bricks, in the form of erasers, to corporates and members of the public throughout Namibia at a minimal cost of N$5 per brick. The project is scheduled to take place annually from the beginning of October to the end of February the following year. All proceeds raised from the sale of the token bricks will be handed over to the Shack Dwellers Federation of Namibia in April. Standard Bank will also provide financial management coaching and mentoring to the members of the Federation.
CSI SPEND PER CATEGORY
1 Education (N$2 067 million)
2 Health, wellness and poverty alleviation (N$674 thousand)
3 Entrepeneurship development (N$734 thousand)
4 Buy-a-Brick (N$744 thousand)
5 Drought relief (N$485 thousand)
N$4.7 millioncontributed to corporate social investment
for us to positively contribute to these social and business developmental issues. We aim to form long-term funding partnerships with government, local and non-governmental organisations that have clearly defined programmes that provide maximum impact in communities.
1
4
5
2
3
Buy-a-Brick Project

SBN Holdings Limited Annual report 2016 19
Our footprint
Lüderitz
Rosh Pinah
Keetmanshoop
Maltahohe Mariental
Aranos
Rehoboth
WindhoekWalvis Bay
SwakopmundArandis
OmaruruOkahandja
Gobabis
Otjinene
OtjiwarongoKhorixas
Outjo
Tsumeb
RunduOndangwaOngwediva
Eenhana
OpuwoOkahao
OkalongoOshikango
OutapiRuacana Nkurenkuru
Katima Mulilo
Grootfontein
Standard Bank was the first commercial
bank to open its doors in Lüderitz in 1915.
The credo of the bank is simple, the approach direct, and the
results are positive. We offer a complete range of financial
services, be it Corporate, Commercial, Personal or
Business Banking. We have an extensive branch network
and ATMs all over Namibia, with specialist support divisions
such as Standard Insurance Brokers, Vehicle and Asset
Finance and our Home Loans Department.
Omuthiya
Bethanie
Aussenkehr
Otavi
Henties Bay
Oshakati

20
Chairman’s report
Overview2016 was a tumultuous year. Globally, two key events stole the limelight – the UK’s “Brexit” vote and the US election. The ambiguity in the run-up to these events, as well as the contrarian outcomes drove uncertainty and volatility. Overall, global growth is expected to have been in line with the International Monetary Fund’s (IMF) expectations, i.e. at 3.1% for the year. In Namibia, the threat of a sovereign downgrade by rating agencies to sub-investment grade persisted and emerged towards the end of 2016. This in turn negatively impacted the already weak business and consumer confidence and further delayed much needed domestic investment and job creation opportunities. Inflationary pressures brought about by the drought and the weak exchange rate placed
additional pressure on already constrained consumers. Demand for credit was weaker year-on-year and displayed a decelerating trend over the year, with household demand broadly flat, compounded by policy changes seeking to stem the demand for credit on motor vehicles and reduce speculation within the property market.
Overall GDP growth for 2016 is expected to have been around 1%, down from 5.3% in 2015. In certain sectors, such as agriculture and mining, growth oscillated between expansion and contraction over the year, while other sectors, such as finance, real estate business and personal services, continued to report growth quarter-on-quarter despite the difficult conditions. In 2H16, on the back of positive global sentiment, firmer commodity prices and some recovery in the currency,
Namibia’s economic outlook improved. This momentum, combined with the fiscal decisiveness by the Minister of Finance on certain of the areas of concern raised by the rating agencies, aided the country in maintaining an investment grade rating. There remains a broad recognition that there is still considerable work to be done, not only to avoid a downgrade in 2017, but more importantly, to deliver the inclusive growth required to tackle poverty and unemployment and transform the economy into one in which everyone can share in its benefits.
Against this backdrop, the group showed resilience in its financial performance for 2016 with profit after tax increasing by 3% compared to 2015. Furthermore, our capital position and liquidity remained strong, with a total capital adequacy ratio of 15.35% for
“The group showed resilience in its financial performance for 2016 with profit after tax increasing by 3% compared to 2015.”
CHAIRMAN'S REPORT

SBN Holdings Limited Annual report 2016 21
SBNH and liquid assets well in excess of prudential requirements.
The “Tuyende” journey has the board’s full support, specifically the emphasis given to defining the factors that underpin the bank’s legitimacy and the trust our stakeholders have in us. Our results for 2016 are testimony to the challenges we face on this journey – more work is required to ensure that we are in a position to fully realise the potential inherent in the bank’s brand and that the market offers.
Our people are the custodians of the customer experience and the overall strength of our brand, and are therefore the ultimate determinant of success and competitive advantage. Attracting and retaining the skills we need, and creating a desirable and differentiated workplace culture is a complex undertaking in a
highly competitive environment where the ability to attract top talent is critical. As such, “Tuyende” emphasises the importance of empowering our people and developing great leaders. During 2016, we reviewed our employee value propositions and looked to embed our values and culture, which together will differentiate us as an employer.
Compliance with Basel II has been at the forefront of the central bank’s policy for monitoring capital adequacy. The bank remains well capitalised on both Tier I
and total capital ratios, as well as maintaining conservative buffers for both liquidity and other risk positions. At the end of 2016, the Bank of Namibia communicated the draft requirements of Basel III for consultation. The group has already begun to monitor the internal compliance established by Basel III so as to be well-prepared for any proposed adoption date and transitional arrangements. Where possible, we contribute actively and constructively to the development of national policy, legislation and regulation
Herbert Maier
N$540 millionPROFIT AFTER TAX2015: N$525 million +3%
“During 2016, we reviewed our employee value propositions and looked to embed our values and culture, which together will differentiate us as an employer.”

22
CHAIRMAN'S REPORT continued
the agriculture sectors. Commodity exporters will welcome higher prices. Namibia’s forecast growth is expected to improve to 2.9% in 2017, but remains subject to government commitment to reduce consumptive expenditure, and event risk such as rating agency decision points during the year. Lastly, BON has indicated that it expects rates to remain on hold, subject to inflation and exchange rate developments, which is likely to continue to constrain household consumptions and fixed investment.
With these dynamics in mind, we look to our clients, to the challenges and opportunities they may face, and seek ways to partner with them on their journeys in 2017 and beyond. As we focus on delivering market-leading client experiences, we continue to invest in our client-facing digital capabilities to enable our clients to transact independently and safely anytime anywhere. We recognise and value the trust that our clients place in us and remain vigilant in our efforts to protect our clients’ resources and data.
Accordingly, we continue to monitor developments and potential threats, engage with industry bodies and invest
through formal submissions and regular engagement with policymakers, law-makers and regulatory authorities. Our approach is guided by our aim to promote regulatory frameworks that are unambiguous, cohesive and practical, and that minimise unintended consequences.
ProspectsThe economic growth momentum that built towards the end of 2016, driven by China and the US, has continued into the start of 2017. The IMF is forecasting an uptick in global growth from 3.1% in 2016 to 3.4% and 3.6% in 2017 and 2018 respectively. Global trade activity should pick up on the back of policy stimulus and a gradual normalisation of large economies, such as Brazil and Russia. However, uncertainty surrounding US policy direction under the new administration, Brexit negotiations and the broader European macro outlook may pose downside risks to global growth prospects.
Sub-Saharan Africa’s GDP growth is expected to be 2.8%, buoyed by global trade, resource demand and improved economic prospects generally. Rains in late 2016 and early 2017 bode well for
in our defences to enhance our resilience. The businesses we operate are complex and we rely on our people across our network to navigate the challenges each business faces and make appropriate decisions in line with strategic priorities and our values. To this end, we continue to invest and equip our people with the skills required, empower them to make decisions, hold them accountable and celebrate their successes. Furthermore, we are seeking opportunities to use technology to leverage our data to inform decisions, deliver client-specific solutions and drive process efficiency and productivity gains.
AppreciationThe board and I would like to express our appreciation to our customers and other stakeholders, including the bank’s shareholders, for their continued support. We extend our appreciation to the entire staff of Standard Bank for their commitment to service and excellence in managing the business.
I wish to express my utmost appreciation to Martha Namundjebo- Tilahun who, after a period of ten (10) years on the Board, retired in July 2016. I also want to welcome Bryan Mandy
“The businesses we operate are complex and we rely on our people across our network to navigate the challenges each business faces and make appropriate decisions in line with strategic priorities and our values.”

SBN Holdings Limited Annual report 2016 23
(chief financial officer) to the board from December 2016 as an executive director.
As we look to the year ahead, we remain steadfast in our commitment to doing the right business the right way. In this context, we continue to embed a culture of responsible business practices. We remain committed to delivering through-the-cycle headline earnings growth and ROE within our target range of 20.88% to 25% over the medium term. In order to do so, we recognise the need to balance prudent capital management with appropriate return-based resource allocation and leverage.
I wish to highlight that banks play an important role in society which is
“We recognise the need to balance prudent capital management with appropriate return-based resource allocation and leverage.”
broader than creating shareholder value. We seek to create value for all our stakeholders – clients, employees, shareholders, government and communities alike. In doing so, we continue to contribute meaningfully to the social, economic and environmental prosperity and wellbeing in the markets in which we operate.
Finally, a well-earned word of thanks to my fellow board members for their valued input, productive participation, excellent teamwork and sound guidance throughout 2016. Our purpose as an organisation remains – Namibia is our home and we support her growth.
24
Chief executive’s review
“2016 was, therefore, a year of stagnation for business, and despite these challenges, Standard Bank posted satisfactory results and made great strides in transforming our operational environment, operational processes, products and operational structures.”
OverviewThe slowdown in the mining, agriculture and construction industries, compounded by the regional drought and government consolidation efforts constrained the performance of the domestic economic activities. It is estimated that the domestic economy grew at an overall GDP growth of 1%, which is significantly below the GDP of between 5% to 7% seen in the preceding three years.
The year was further characterised by heightened liquidity constraints and increasing costs of liquidity in the domestic market which negatively impacted interest margins.
2016 was, therefore, a year of stagnation for business, and despite these challenges, Standard Bank posted
satisfactory results and made great strides in transforming our operational environment, operational processes, products and operational structures.
Strategic prioritiesDuring 2016, we not only reaffirmed our commitment to understanding and meeting our customers’ needs, but we started to implement a revolutionary programme aimed at changing the culture and ways of work in the bank with the objective of improving our processes and products from a customer’s perspective. The programme has been implemented at three pilot Proofs of Concept and the early feedback is very encouraging.
The programme is expected to be extended to the rest of the bank’s operations by the end of 2017, and we
believe these will significantly revolutionise our processes and approach to servicing our customers.
Customer centricity We continued the review of our products, processes and structures to enhance customer service and deliver solutions efficiently and effectively. The results are visible in the key products such as Home Loans and Vehicle and Asset Finance which saw improvements as evidenced by the reduction in turnaround times for Home Loans from 170 days in 2014 to 51 days in 2016 and an increase in market share for Vehicle and Asset Finance to over 27% from below 25% in 2015.
Technology optimisationWe have seen a continual stabilisation of our Information Technology systems
CHIEF EXECUTIVE'S REVIEW

SBN Holdings Limited Annual report 2016 25
and channels during the course of the year following focused initiatives and actions implemented during the year.
In our quest to be relevant to the Namibian market and our drive to becoming the most preferred bank, technology optimisation and innovation remained a high priority which saw the launch of the BlueWallet, refreshed Online Banking platform, SmartApp and EMV debit cards.
Trusted & preferred bankWe are pleased that we have, during 2016, completed the review and refreshing of our Customer Value Propositions for key segments of our customer base. This process will be continued into 2017 with the continual review of these value propositions as informed by our customers’ needs and requirements.
We continued with investments in the expansions of our points of representation in our quest to bring our services closer to our customers. We opened four new points of representation across the country in Ruacana, Okuryangava, the Waterfront in Swakopmund and Okongo. We upgraded the Keetmanshoop, Nkurenkuru, Otjinene and Game Shopping Centre branches to enhance customer experience. We further relocated a number of our points of
representation into new refurbished facilities in Gobabis, Eenhana and Aussenkehr signifying our commitment and trust in the future of these towns.
We are honoured and pleased by the number of prestigious awards received during the year. Standard Bank was awarded as the best investment bank in the country for 2016, Best Emerging Markets Bank in Namibia and Best Sub-Custodian Bank in Namibia.
Vetumbuavi Mungunda
“In our quest to bring our services closer to our customers – we opened four new points of representation across the country.”
Vet
“The Standard Bank Employee Shares Ownership Scheme is unique in Namibia given the scale and number of beneficiaries, being over 1 300 staff members participating in the over N$300 million Shares Scheme.”

26
CHIEF EXECUTIVE'S REVIEW continued
Employer of choiceWe reviewed our staff value propositions, accompanied by transitions to a new medical aid provider and the conclusion of the final phase of the Employee Shares Ownership Scheme. The Standard Bank Employee Shares Ownership Scheme is unique in Namibia given the scale and number of beneficiaries, being over 1 300 staff members participating in the over N$300 million shares scheme. This is probably one of the most broad-based and inclusive shares schemes implemented in Namibia.
We continued our participation in the Deloitte Best Company to Work for Survey which saw the bank improve its overall score from 3.55 in 2015 to 3.62 in 2016. We are most pleased with the feedback we receive from our employees through this participation on how they experience Standard Bank and the levers available to us to improve our offerings and their experience.
The development of our people has remained a key focus during 2016, with the following people development initiatives executed during the year:
Intensive executive mentorship programme for 25 senior management personnel of the bank
Graduate development programme which exposes selected top graduates to all the functions of the bank
Learning Academy where entry staff members are exposed to the activities of the bank for three months before being deployed into the bank.
Sustainable growthOur profits for the year amounting to N$540 million and representing a growth of 3% above the prior year is satisfactory in the current macro-economic environment. The current year results were impacted by interest expense growth of 21%, which was significantly higher than the 12% growth in interest income. The increase in interest expense was driven by the increasing costs of funds and liquidity holdings, as well as divergence in the correlation between local prime interest rates and JIBAR rates from which most of the local liquidity costs are derived from.
The results were further impacted by once-off systems implementation- related costs amounting to N$54 million written-off during the current year. Normalised earnings, excluding these once-off written-off costs would show a growth of 14.3% on the 2015 earnings.
We are pleased to report that our results for 2016 were supported by growth in quality assets at 12% over the prior year. The growth in loans and advances to customers of 11% is pleasing when compared to the industry growth of 8.9% for the year.
Our capital position continues to exceed regulatory capital thresholds at 15.35% capital adequacy and 8.76% leverage ratios respectively.
LeadershipKey positions were filled during 2016, including the key position of head of Personal & Business Banking (Mercia Geises) following the departure of the previous incumbent.
Corporate & Investment Banking (CIB) highlightsCIB profits for the year at N$218 million represent a growth of 28% on the 2015 results. These results were supported by a number of landmark transactions concluded during the year. The business has shown significant resilience given the complexity and scale of regulatory projects it is tasked with, including PSD7 and the localisation of corporate accounts.
Personal & Business Banking (PBB) highlightsThe business launched a number of innovation products, including BlueWallet which has been well-embraced by the market. The regulatory environment has continued to impact the business profitability, firstly through the greater liquidity requirements and secondly the scale and complexity of regulatory projects hit the income statements as they impair the business ability to focus on business growth and the resultant higher costs of compliance which need to be absorbed by the business.
Credit managementStandard Bank continues to show improvements in credit impairments, seeing a reduction in our non-performing loans ratio to 1.94% from 2.68% in 2015. This is due to the robust and stringent application process which protects both the customer and our bank.
“We are pleased to report that our results for 2016 were supported by growth in quality assets at 12% over the prior year.”

SBN Holdings Limited Annual report 2016 27
We continue to review our credit processes and risk appetite with respect to our key products.
Corporate social investment highlightsStandard Bank considers it a business imperative to support and help uplift the communities and economies of the environments in which it operates. We therefore recognise the importance of Corporate social investment (CSI).
We pledge 1% of net profit generated to CSI initiatives. The strategic focus of our CSI programme is entrepreneurship development, the environment, education and health and wellness. In 2016, we committed N$5 million to corporate social investment programmes for 2017.
We are pleased with the contribution we have made through the launch of our flagship project, Buy-a-Brick, which is aimed at mobilising individual Namibians to buy token bricks where proceeds are handed over to the Shack Dwellers Federation of Namibia in April of every year.
Contributions collected in 2016 through the Buy-a-Brick Initiative of N$1.4 million realised the construction of 44 houses in Rehoboth. The other significant objective of this project, which we believe is being achieved, is to create awareness about the acute housing shortage in the country and establish the need for housing for the no-and-low-income communities and the quest for solutions in the national discourse.
New head officeThe board at its meeting in December 2016, approved the location and construction of a new head office for the bank. This move signifies not only our long-term commitment to Namibia, but also demonstrates our trust and belief in the long-term future of our country.
It is expected that the ground excavation work on the new head office should start in April 2017 and construction work is expected to commence in June 2017.
Outlook for 2017The macro-economic environment in the country started to deteriorate in 2016, notably as a result of a combination of several factors that have come together to diminish growth and drive imbalances within the local economy. These factors are the low level of government spending, weak commodity prices, drought, water supply constraints, inflation and lower retail tourists.
The challenging environment has continued into the early months of 2017 and has been compounded by increased liquidity constraints in the local market, reduction in economic activities such as motor vehicle and house sales and increasing inflation. The steep increase in inflation heightens the risk of an increase in interest rates which may add to the already increasing costs of funds in the local market and further erodes margins in the local banking sector.
The recent good rains, and the increase in water levels at major storage dams across the country should point to improvements in the outlook for the
agricultural sector, as well as other water-dependent sectors such as manufacturing. Marginal improvements in the fortunes of the mining sector driven by improving commodity prices should assist the economy to grow at 4% during 2017.
However, the high government debt at over 40% to GDP will see government continuing to cut down on spending. We are of the view that the deep spending cuts are necessary given the national debt levels and the significant reduction in the revenue outlook. We are, however, worried that the cuts, instead of targeting consumptive non-productive expenditures with limited multiplier effects, may impact infrastructure and capacity building priorities.
AcknowledgementsWe are grateful to have the continued support of Standard Bank Group to guide us on best practice and to allow us to leverage off their innovations in the banking world.
A great deal of our success relies on the interactions with our staff and our customers. We thank our customers for their support and promise to strive for excellence in customer service and to tailor our banking offering to meet the ever-changing requirements of the market through innovative products.

28
HEADING HEADING Sub heading heading continued
Financial review
The results
The SBN Holdings group profit after tax increased by 3% in 2016 to N$540 million. Loans and advances increased by 12%. The group’s return on equity decreased to 20.88% from 23.56%. The group experienced a negative JAWS ratio of 2%, partly due to significant investments in staff. This is also reflected in the cost-to-income ratio which increased from 58.34% to 59.53%.
Bryan Mandy
FINANCIAL RESULTS AND RATIOS
Change
% 2016 2015
ROE (%) (17) 20.88 23.56 Profit for the year
(N$000) 3 539 686 524 531 Tier I capital
adequacy ratio1 (6) 12.68 13.42 Total assets
(N$000) 13 27 213 048 23 992 115 Non-interest
revenue to total income 2 43.57 42.76
Credit loss ratio (4) 0.49 0.51 Cost-to-income
ratio 2 59.53 58.34
1 Excluding unappropriated profits.
SBN Holdings Limited Annual report 2016 29
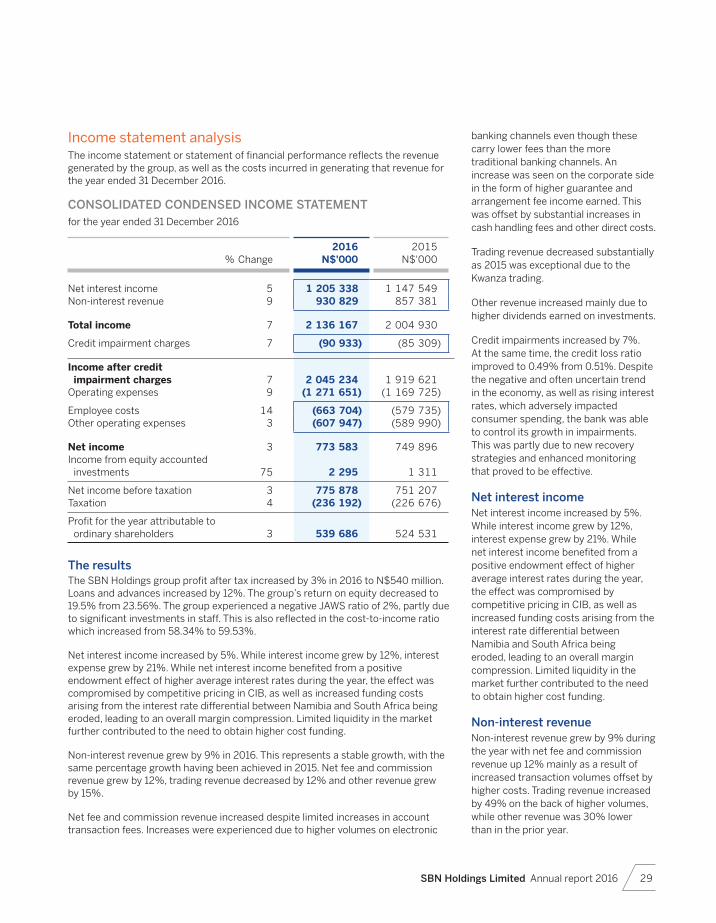
Income statement analysisThe income statement or statement of financial performance reflects the revenue generated by the group, as well as the costs incurred in generating that revenue for the year ended 31 December 2016.
CONSOLIDATED CONDENSED INCOME STATEMENT
for the year ended 31 December 2016
% Change2016
N$'0002015
N$'000
Net interest income 5 1 205 338 1 147 549Non-interest revenue 9 930 829 857 381
Total income 7 2 136 167 2 004 930
Credit impairment charges 7 (90 933) (85 309)
Income after credit impairment charges 7 2 045 234 1 919 621
Operating expenses 9 (1 271 651) (1 169 725)
Employee costs 14 (663 704) (579 735)Other operating expenses 3 (607 947) (589 990)
Net income 3 773 583 749 896Income from equity accounted
investments 75 2 295 1 311
Net income before taxation 3 775 878 751 207Taxation 4 (236 192) (226 676)
Profit for the year attributable to ordinary shareholders 3 539 686 524 531
The resultsThe SBN Holdings group profit after tax increased by 3% in 2016 to N$540 million. Loans and advances increased by 12%. The group’s return on equity decreased to 19.5% from 23.56%. The group experienced a negative JAWS ratio of 2%, partly due to significant investments in staff. This is also reflected in the cost-to-income ratio which increased from 58.34% to 59.53%.
Net interest income increased by 5%. While interest income grew by 12%, interest expense grew by 21%. While net interest income benefited from a positive endowment effect of higher average interest rates during the year, the effect was compromised by competitive pricing in CIB, as well as increased funding costs arising from the interest rate differential between Namibia and South Africa being eroded, leading to an overall margin compression. Limited liquidity in the market further contributed to the need to obtain higher cost funding.
Non-interest revenue grew by 9% in 2016. This represents a stable growth, with the same percentage growth having been achieved in 2015. Net fee and commission revenue grew by 12%, trading revenue decreased by 12% and other revenue grew by 15%.
Net fee and commission revenue increased despite limited increases in account transaction fees. Increases were experienced due to higher volumes on electronic
banking channels even though these carry lower fees than the more traditional banking channels. An increase was seen on the corporate side in the form of higher guarantee and arrangement fee income earned. This was offset by substantial increases in cash handling fees and other direct costs.
Trading revenue decreased substantially as 2015 was exceptional due to the Kwanza trading.
Other revenue increased mainly due to higher dividends earned on investments.
Credit impairments increased by 7%. At the same time, the credit loss ratio improved to 0.49% from 0.51%. Despite the negative and often uncertain trend in the economy, as well as rising interest rates, which adversely impacted consumer spending, the bank was able to control its growth in impairments. This was partly due to new recovery strategies and enhanced monitoring that proved to be effective.
Net interest incomeNet interest income increased by 5%. While interest income grew by 12%, interest expense grew by 21%. While net interest income benefited from a positive endowment effect of higher average interest rates during the year, the effect was compromised by competitive pricing in CIB, as well as increased funding costs arising from the interest rate differential between Namibia and South Africa being eroded, leading to an overall margin compression. Limited liquidity in the market further contributed to the need to obtain higher cost funding.
Non-interest revenueNon-interest revenue grew by 9% during the year with net fee and commission revenue up 12% mainly as a result of increased transaction volumes offset by higher costs. Trading revenue increased by 49% on the back of higher volumes, while other revenue was 30% lower than in the prior year.

30
Net fee and commission revenue increased despite limited increases in account transaction fees. Card-based commission grew as a result of higher turnover volumes and the acquisition of several large merchant accounts during the year. Electronic banking revenue increased due to higher business online banking activity. Higher structuring, commitment and guarantee fees received also assisted growth in net fee and commission fee.
Trading revenue increased mainly due to higher client flows reflective of volatile currency markets.
Other revenue decreased due to a reduction in investment portfolio during the year.
Credit impairments increased by 7%. At the same time, the credit loss ratio improved to 0.49% from 0.51%. Given the negative and often uncertain trend in the economy, as well as rising interest rates, which adversely impacted consumer spending, the bank was able to control its growth in impairments. This was partly due to new recovery strategies and enhanced monitoring that proved to be effective.
Operating expenses increased by 9%. The group continues to invest in both staff and infrastructure in order to provide excellent customer service and deliver on our strategic priorities. We maintained tight control on costs while investing for long-term growth.
Staff costs increased by 15% compared to 2015. This is partly due to four new branches opening, as well as general capacity investment in the branch network. Furthermore, Standard Bank continuously adjusts its salaries to remain competitive and retain top talent.
Other operating expenses only increased by 3%. By significantly investing into its localisation strategy and acquiring its core banking system, the bank was able to substantially reduce its royalty fees. This was partly offset by intensive marketing campaigns and improving the security to safeguard against future losses.
FINANCIAL REVIEW continued
Balance sheet analysisThe balance sheet or statement of financial position reflects what the group owns, owes and the equity that is attributable to shareholders at 31 December 2016.
STATEMENT OF FINANCIAL POSITION
at 31 December 2016
%
Change2016
N$'0002015
N$'000
Assets Cash and balances with central
banks 47 1 359 873 923 516 Derivative assets (67) 55 497 168 413 Trading assets (7) 291 426 313 679 Financial investments (8) 3 111 541 3 380 847 Loans and advances 12 19 398 770 17 392 431
Loans and advances to banks 37 511 114 373 097 Loans and advances to customers 11 18 887 656 17 019 334
Other assets 7 605 694 563 441 Assets in group companies and
joint ventures 98 1 606 097 812 074 Property and equipment 1 394 984 390 058 Intangible assets 100 347 115 Current tax receivable 7 213 42 051 575 Deferred taxation asset (100) 47 081
Total assets 13 27 213 048 23 992 115
Equity and liabilities Equity 12 2 789 962 2 498 652
Share capital – ordinary 0 1 000 1 000 Share premium on issue of shares 0 442 234 442 234 Reserves 14 2 346 728 2 055 418
Liabilities 14 24 423 086 21 493 463 Derivative liabilities (78) 50 412 231 473 Trading liabilities 100 151 127 Deposit and current accounts 17 21 271 720 18 185 518
Deposits from banks 74 244 117 140 155 Deposits from customers 17 21 027 603 18 045 363
Debt securities issued 62 1 215 249 749 700 Provisions and other liabilities (27) 498 688 684 246 Loans from group companies (25) 1 228 080 1 642 526 Deferred taxation liability 100 7 810
Total equity and liabilities 13 27 213 048 23 992 115
Total assets increased by 13% to N$27 billion. The main contributor to the increase was the growth in loans and advances.
Loans and advances were up 12% on the prior year. Growth was mainly seen across the mortgage (9%), instalment sale (11%) and term lending (19%) products. In PBB, faster turnaround times and improved service offerings contributed to the growth, while CIB was able to secure substantial deals due to competitive terms.

SBN Holdings Limited Annual report 2016 31
The bank acquired an intangible asset during the period under review. This is part of the localisation strategy of the bank and has resulted in significant savings in terms of royalty fees.
Total liabilities increased by 13% to N$24 billion. The increase is mostly as a result of increases in deposits from customers.
Deposits from customers increased by 17%. Significant growth was achieved on the cash management product, which grew by 75%. Due to its higher interest rates, this has had a negative impact on the bank’s endowment effect.
Trading liabilities came onto the balance sheet due to the bank trading in repurchase agreements.
The deferred tax asset changed into a deferred tax liability predominately due to the acquisition of the intangible asset.
Liquidity and capital managementThe group’s Tier I capital, was N$2 431 million at 31 December 2016 (2015: N$2 300 million) and total capital was N$2 819 million at 31 December 2016 (2015: N$2 674 million). The change in the group’s capital was primarily due to an increase in retained earnings offset by dividends paid.
CAPITAL ADEQUACY RATIOS
Minimum
regulatory requirement
%
Target
ratio %
Including unappropriated
profits
Excluding unappropriated
profits
2016%
2015%
2016%
2015%
GroupTotal capital
adequacy ratio 10 11 – 12 15.35 15.60 15.35 15.60 Tier I capital
adequacy ratio 7 7.7 – 8.2 12.68 13.42 12.68 13.42 Tier I leverage
ratio 6 6.6 – 7.2 8.76 9.47 8.76 9.47
Bank Total capital
adequacy ratio 10 11 – 12 14.00 14.04 14.00 14.04 Tier I capital
adequacy ratio 7 7.7 – 8.2 11.51 11.94 11.51 11.94 Tier I leverage
ratio 6 6.6 – 7.2 8.18 8.79 8.18 8.79
The group maintained a well-capitalised position based on Tier I, total capital adequacy and leverage ratios as set out below.
The group’s liquidity position remains strong with appropriate liquidity buffers of N$3.10 billion in excess of regulatory requirements at 31 December 2016. These significant levels of liquidity are appropriately conservative given the group’s liquidity stress-testing philosophy and in view of potential changes in regulatory requirements.
The group maintains adequate levels of highly marketable liquid securities to meet prudential, regulatory and internal stress-testing requirements as protection against unforeseen disruptions in cash flows. Eligible Basel III liquidity coverage ratio (LCR) high quality liquid assets (HQLA) are defined according to the Basel Committee on Banking Supervision (BCBS) January 2013 LCR and liquidity risk monitoring tools framework. In addition to this, management liquidity represents unencumbered marketable securities in addition to eligible Basel III HQLA which would be able to provide significant sources of liquidity in a stress scenario. The group is well-placed to meet the minimum phased-in Basel III LCR standards as indicated by the Bank of Namibia.
A detailed analysis of capital management is provided in the risk and capital management report on page 100.
32
Corporate governance report
Introduction
The board operates on the understanding that sound governance practices are fundamental to earning the trust of stakeholders, which is critical to sustaining performance and preserving shareholder value.
The group’s governance framework enables the board to balance its role of providing risk oversight and strategic counsel, and ensuring adherence to regulatory requirements and risk tolerance. The board is committed to upholding the fundamental tenets of governance, which include discipline, independence, responsibility, fairness, social responsibility, transparency and accountability of directors to all stakeholders.
The board’s approach to governance is to embrace relevant local and international best practice. The principles of the Namcode inform the governance framework and practices of the group and its subsidiaries.
33 Governance framework
33 Codes, regulations and compliance
33 Board and directors
38 Remuneration
39 Transformation
40 Board of directors
42 Executive committee

SBN Holdings Limited Annual report 2016 33
Codes, regulations and complianceComplying with all applicable legislation, regulations, standards and codes is integral to the bank’s culture. The board delegates responsibility for compliance to management and monitors this through the compliance function. Oversight of compliance risk management is delegated to the audit committee, which reviews and approves the compliance mandate submitted by the head of compliance, who reports on a quarterly basis on, among others, the status of compliance risk management in the bank, significant areas of non-compliance, as well as feedback on interactions with regulators. The compliance function, as well as the compliance policy and governance standards are subject to review and audit by the internal audit function of
the bank. Material regulatory issues are escalated to the board risk committee.
Board and directors
Board structure and compositionThe board of directors is the group’s highest decision-making body and is ultimately responsible for governance. The group has a unitary board structure and the roles of chairman and chief executive are separate. The chairman is an independent non-executive director, as are the majority of directors on the board. The balance of executive, non-executive and independent directors ensures a balance of power on the board, so that no individual or group can dominate board processes or decision making and ensures the appropriate level of challenge.
Director composition (%)
2016 2015
1 Non-executive independent directors 67% 67%
2 Non-executive directors 11% 22%
3 Executive directors 22% 11%
1
2
3
GOVERNANCE FRAMEWORK
Board committees
Exco
ALCO
ORCC
CRMC
CC
IFC
NPC
TBC
Board audit committee
Board risk committee
Board credit committee
Board HC subcommittee
Board CSI subcommittee
Board IT subcommittee
Exco: Executive committee
ALCO: Asset and liquidity management committee
ORCC: Operational risk management and credit committee
CRMC: Credit risk management committee
CC: Credit committee
IFC: Internal financial control committee
NPA: New product approval committee
TBC: Tender board committee
Management committees

34
CORPORATE GOVERNANCE REPORT continued
Independent non-executive directorsThe independence of board members is evaluated by the board HC committee, which classifies independence according to the definitions in the Namcode. Five non-executive directors of Standard Bank Namibia are independent.
Succession planningSuccession planning is a key focus and the board considers the composition of the board and its committees on an ongoing basis. The retention of board members with considerable experience is sought to ensure that appropriate levels of management oversight are maintained.
The board is satisfied that the current talent pool available within the group and the work being done to strengthen it provides adequate succession depth over the short and long term. The board is further satisfied that there is a clear articulated talent strategy which focuses on creating a strong talent pool for key roles. The board is also satisfied that the group is building capability on core areas to enable business strategy and ensuring regulatory compliance. The board is further pleased to note that the Employee Value Proposition (EVP) has now been implemented.
Skills, knowledge, experience and attributes of directorsThe board ensures that directors possess the skills, knowledge and experience to fulfill their duties. The directors bring a balanced mix of attributes to the board, including:
domestic and international experience
operational experience
understanding of macroeconomic and microeconomic factors affecting the group
financial, legal, entrepreneurial and banking skills
expertise in risk management and internal financial control.
The board regularly considers board members individually and collectively to ensure the board remains strategically, demographically and operationally appropriate.
Access to information and resourcesExecutive management and the board interact regularly. This is encouraged and the executive committee attends all board meetings. Directors have unrestricted access to management and company information, as well as the resources to carry out their roles and responsibilities. This includes external legal advice at the group’s expense.
StrategyThe board is responsible for determining the group strategic direction. Management presents the group’s strategy annually and discusses and agrees it with the board. The board ensures the strategy is aligned with the group values, performance and sustainability objectives, and addresses the associated risks.
Financial performance is monitored through quarterly management reports. In line with banking regulations, the board agrees the group’s corporate governance and risk management objectives for the year ahead. The board and the relevant risk committees monitor performance against governance and risk objectives respectively.
Board responsibilitiesThe general powers of the directors are set out in the group’s articles of association. They have further unspecified powers and authority, in respect of matters, which may be exercised and dealt with by the company, which are not expressly reserved to the members of the company in general meeting.
The main responsibilities of the board as set out in the board mandate are as follows:
Approval of the strategic plan and the annual business plan, the setting of objectives and the review of key risks and performance areas
Monitoring the implementation of board plans and strategies against a background of economic, environmental and social issues relevant to the company and international political and economic conditions, as well as the mitigation of risks by management
Appointment of the chief executive and maintenance of a succession plan
Appointment of directors, subject to election by the members in general meeting
Determination of overall policies and processes to ensure the integrity of the group’s management of risk and internal control.
Delegation of authorityThe board retains effective control through a well-developed governance structure that provides a framework for delegation. Board committees facilitate the discharge of board responsibilities and provide in-depth focus on specific areas. The board reviews the mandate of each committee at least annually.
The board delegates authority to the chief executive and executive directors to manage the business and affairs of the group. The executive committee assists the chief executive when the board is not in session, subject to statutory parameters and the board’s limits on the delegation of authority to the chief executive. The company secretary monitors board-delegated authorities.
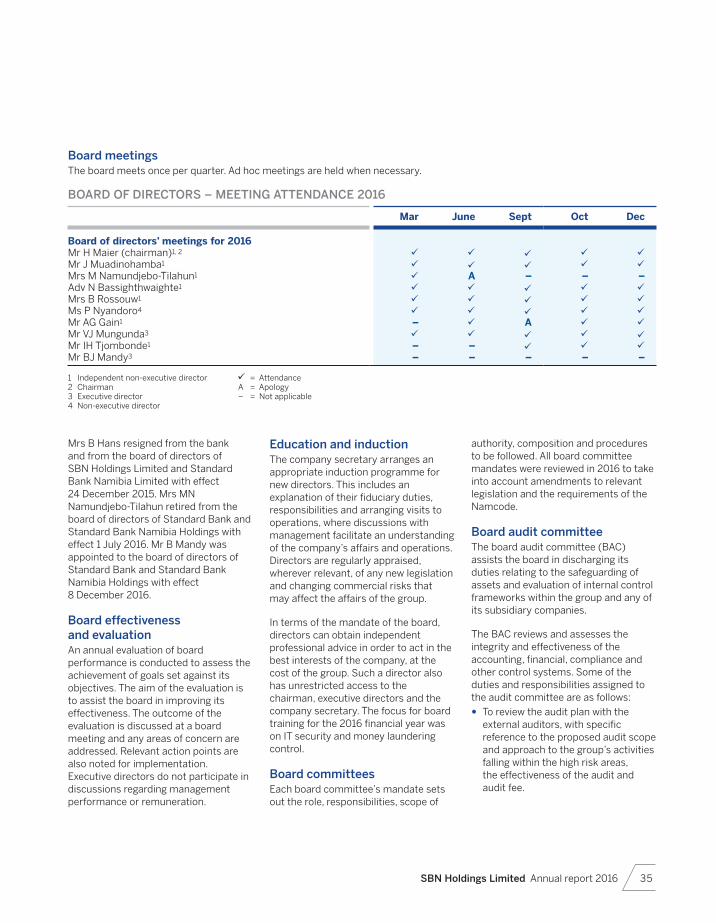
SBN Holdings Limited Annual report 2016 35
Board meetingsThe board meets once per quarter. Ad hoc meetings are held when necessary.
BOARD OF DIRECTORS – MEETING ATTENDANCE 2016
Mar June Sept Oct Dec
Board of directors’ meetings for 2016Mr H Maier (chairman)1, 2
Mr J Muadinohamba1
Mrs M Namundjebo-Tilahun1 A – – –Adv N Bassighthwaighte1
Mrs B Rossouw1
Ms P Nyandoro4
Mr AG Gain1 – AMr VJ Mungunda3
Mr IH Tjombonde1 – –Mr BJ Mandy3 – – – – –
1 Independent non-executive director = Attendance2 Chairman A = Apology3 Executive director – = Not applicable4 Non-executive director
Mrs B Hans resigned from the bank and from the board of directors of SBN Holdings Limited and Standard Bank Namibia Limited with effect 24 December 2015. Mrs MN Namundjebo-Tilahun retired from the board of directors of Standard Bank and Standard Bank Namibia Holdings with effect 1 July 2016. Mr B Mandy was appointed to the board of directors of Standard Bank and Standard Bank Namibia Holdings with effect 8 December 2016.
Board effectiveness and evaluationAn annual evaluation of board performance is conducted to assess the achievement of goals set against its objectives. The aim of the evaluation is to assist the board in improving its effectiveness. The outcome of the evaluation is discussed at a board meeting and any areas of concern are addressed. Relevant action points are also noted for implementation. Executive directors do not participate in discussions regarding management performance or remuneration.
Education and inductionThe company secretary arranges an appropriate induction programme for new directors. This includes an explanation of their fiduciary duties, responsibilities and arranging visits to operations, where discussions with management facilitate an understanding of the company’s affairs and operations. Directors are regularly appraised, wherever relevant, of any new legislation and changing commercial risks that may affect the affairs of the group.
In terms of the mandate of the board, directors can obtain independent professional advice in order to act in the best interests of the company, at the cost of the group. Such a director also has unrestricted access to the chairman, executive directors and the company secretary. The focus for board training for the 2016 financial year was on IT security and money laundering control.
Board committeesEach board committee’s mandate sets out the role, responsibilities, scope of
authority, composition and procedures to be followed. All board committee mandates were reviewed in 2016 to take into account amendments to relevant legislation and the requirements of the Namcode.
Board audit committeeThe board audit committee (BAC) assists the board in discharging its duties relating to the safeguarding of assets and evaluation of internal control frameworks within the group and any of its subsidiary companies.
The BAC reviews and assesses the integrity and effectiveness of the accounting, financial, compliance and other control systems. Some of the duties and responsibilities assigned to the audit committee are as follows:
To review the audit plan with the external auditors, with specific reference to the proposed audit scope and approach to the group’s activities falling within the high risk areas, the effectiveness of the audit and audit fee.

36
To review the accounting policies adopted by the group and all proposed changes in accounting policies and practices, and recommend such changes where these are considered appropriate in terms of International Financial Reporting Standards (IFRS).
To review the bank’s interim and audited annual financial statements and all financial information intended for distribution to the shareholders and the general public, prior to submission to the full board and to consider the adequacy of disclosures.
To assess the performance of financial management and review the quality of internal accounting control systems and reports produced by financial management.
To review the basis on which the company has been determined a going concern and make a recommendation to the board.
To review written reports furnished by the external auditors and by the internal audit department of the group detailing the adequacy and overall effectiveness of the bank’s internal audit function and its implementation by management, the scope and depth of coverage, reports on internal control and any recommendations and confirmation that appropriate action has been taken.
To review the bank’s compliance plan, and to consider reports and letters received from the banking supervisory authorities and other regulatory bodies, and management’s responses thereto where they concern matters of compliance and the duties and responsibilities of the board of directors of the bank.
To ensure compliance with all applicable legal, regulatory and accounting standards.
To monitor ethical conduct of the bank and executives and other senior officials and to review reports from management on violations of the code of ethics.
CORPORATE GOVERNANCE REPORT continued
Mar July Oct Nov
MemberMr J Muadinohamba (chairperson) AMrs B Rossouw AMs P Nyandoro A
= Attendance, A = Apology, – = Not applicable
Board credit committeeThe purpose of the board credit committee (BCC) is to ensure that effective credit governance is in place in order to provide for the adequate management, measurement, monitoring and control of credit risk, including country risk. The BCC has the right to recommend to the board the roles and responsibilities for the credit risk, management committee, with clearly defined mandates and delegated authorities as defined in the bank’s Credit Standards.
The board assigned the following duties and responsibilities to the committee:
adoption of Standard Bank’s credit standards
to ensure that all committees within the credit governance structure operate within clearly defined mandates and delegated authorities, as delegated to them by the board
that an appropriate credit framework and structure exists.
Mar Jun Sep Nov
MemberMr H Maier (chairman)Adv N BassingthwaighteMr AG Gain
= Attendance, A = Apology, – = Not applicable
Board risk committeeThe board risk committee has the responsibility of reviewing and recommending the risk philosophy, strategy and policies for approval and adoption by the board of directors. The committee assists the board in the discharge of its duties relating to the corporate accountability and associated risks in terms of management, assurance and reporting.
Feb Jun Sep Nov
MemberAdv N Bassingthwaighte
(chairperson)Mrs B RossouwMr IH Tjombonde A A
= Attendance, A = Apology, – = Not applicable
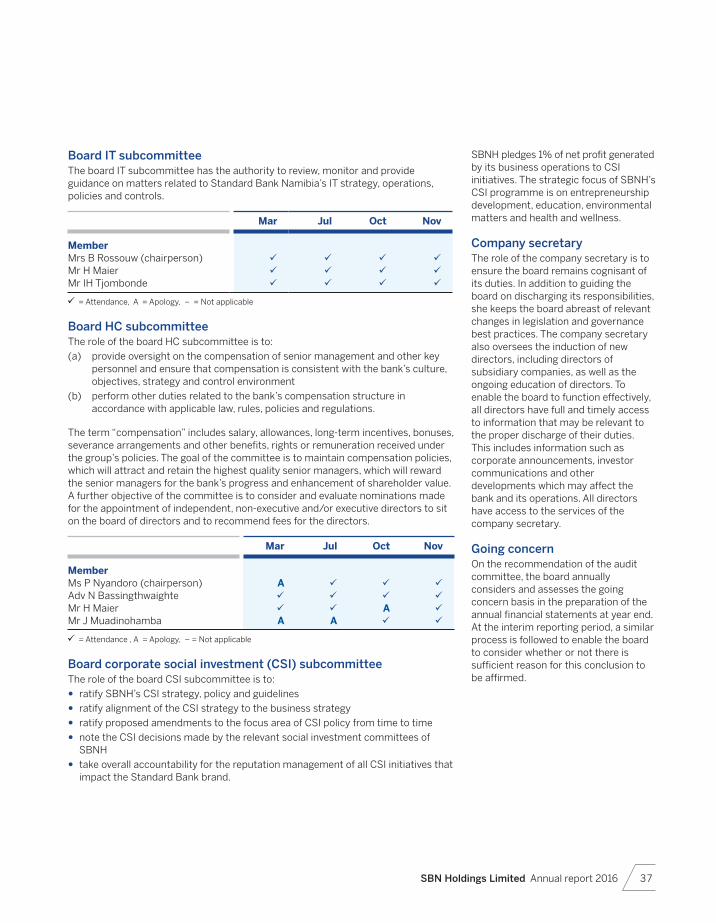
SBN Holdings Limited Annual report 2016 37
Board IT subcommitteeThe board IT subcommittee has the authority to review, monitor and provide guidance on matters related to Standard Bank Namibia’s IT strategy, operations, policies and controls.
Mar Jul Oct Nov
MemberMrs B Rossouw (chairperson)Mr H Maier Mr IH Tjombonde
= Attendance, A = Apology, – = Not applicable
Board HC subcommitteeThe role of the board HC subcommittee is to:
(a) provide oversight on the compensation of senior management and other key personnel and ensure that compensation is consistent with the bank’s culture, objectives, strategy and control environment
(b) perform other duties related to the bank’s compensation structure in accordance with applicable law, rules, policies and regulations.
The term “compensation” includes salary, allowances, long-term incentives, bonuses, severance arrangements and other benefits, rights or remuneration received under the group’s policies. The goal of the committee is to maintain compensation policies, which will attract and retain the highest quality senior managers, which will reward the senior managers for the bank’s progress and enhancement of shareholder value. A further objective of the committee is to consider and evaluate nominations made for the appointment of independent, non-executive and/or executive directors to sit on the board of directors and to recommend fees for the directors.
Mar Jul Oct Nov
MemberMs P Nyandoro (chairperson) AAdv N BassingthwaighteMr H Maier AMr J Muadinohamba A A
= Attendance , A = Apology, – = Not applicable
Board corporate social investment (CSI) subcommitteeThe role of the board CSI subcommittee is to:
ratify SBNH’s CSI strategy, policy and guidelines
ratify alignment of the CSI strategy to the business strategy
ratify proposed amendments to the focus area of CSI policy from time to time
note the CSI decisions made by the relevant social investment committees of SBNH
take overall accountability for the reputation management of all CSI initiatives that impact the Standard Bank brand.
SBNH pledges 1% of net profit generated by its business operations to CSI initiatives. The strategic focus of SBNH’s CSI programme is on entrepreneurship development, education, environmental matters and health and wellness.
Company secretaryThe role of the company secretary is to ensure the board remains cognisant of its duties. In addition to guiding the board on discharging its responsibilities, she keeps the board abreast of relevant changes in legislation and governance best practices. The company secretary also oversees the induction of new directors, including directors of subsidiary companies, as well as the ongoing education of directors. To enable the board to function effectively, all directors have full and timely access to information that may be relevant to the proper discharge of their duties. This includes information such as corporate announcements, investor communications and other developments which may affect the bank and its operations. All directors have access to the services of the company secretary.
Going concern On the recommendation of the audit committee, the board annually considers and assesses the going concern basis in the preparation of the annual financial statements at year end. At the interim reporting period, a similar process is followed to enable the board to consider whether or not there is sufficient reason for this conclusion to be affirmed.

38
Relationship with stakeholdersRegular, pertinent communication with stakeholders is part of the bank’s fundamental responsibility to create shareholder value and improve stakeholder relationships. In addition to the ongoing engagement facilitated by the investor relations department, the chairman encourages shareholders to attend the annual general meeting where interaction is welcomed. The chairman of the group’s board audit committee and the chairman of the board HC subcommittee are available at the meeting to respond to questions from shareholders. Voting at general meetings is conducted by ballot rather than a show of hands. The bank proposes separate resolutions on each issue put forward to shareholders.
Connecting with our stakeholders Standard Bank Namibia Holdings’ relevance to the markets and society in which it operates depends on continued and meaningful engagement with all stakeholders.
Stakeholder management at Standard Bank Holdings involves the optimal employment of the organisation’s resources to build and maintain good relationships with stakeholders. This helps the group to manage the expectations of society, minimise reputational risk and form strong partnerships, which all underpin business sustainability.
Dealing in securities In line with its commitment to conducting business professionally and ethically, the bank has policies in place that restrict dealing in securities by directors and employees. These policies are updated regularly. A personal account trading policy and directors’ dealing policy are in place to prohibit employees and directors from trading in securities during closed periods, which are in effect from 1 June until the publication of the interim results, and
from 1 December until the publication of final results. Compliance with the policies is monitored on an ongoing basis.
Certain nominated employees are prohibited from trading in designated securities due to the price sensitive information they may obtain by virtue of their positions.
Sustainability The Namcode recommends that a company integrates financial and non-financial reporting. This means that the annual report to stakeholders must reflect how economic, social and environmental issues impact on the company’s business strategy and, in turn, how these are considered when making business decisions. This evolution in reporting stems from the growing realisation that environmental and social issues have material costs and impacts and could directly impact a company’s long-term viability. Building on the bank’s previous non-financial disclosure in its annual reports, this year the bank has improved its reporting to include more information on the issues that are material to stakeholders and the bank’s long-term sustainability. SBNH launched its first comprehensive sustainability report during 2016.
Ethics and organisational integrity The group’s code of ethics is designed to empower employees and enable effective decision making at all levels of the business according to defined ethical principles. It also aims to ensure that, as a significant organisation in the financial services industry, the group adheres to the highest standards of responsible business practice. The code interprets and defines Standard Bank Holdings’ values in greater detail and provides value-based decision-making principles to guide its conduct. It is aligned with other Standard Bank Holdings policies and procedures, and supports the relevant industry regulations and laws.
The code specifies acceptable and unacceptable practices and assists in making ethical infringements easy to identify. It also promotes awareness of, and sensitivity to, ethical issues.
The chief executive and ethics officer are the formal custodians of Standard Bank’s code of ethics and ultimately responsible for its implementation.
Ethics incidents are reported via the ethics and fraud hotline, human resources department, risk department, financial crime control department and the ethics officers. Reported incidents include fraud, harassment, ethical dilemmas in procurement and abuse of authority. Quarterly ethics reports are presented to the board audit committee.
RemunerationRemuneration philosophyThe Standard Bank Holdings remuneration philosophy aligns with its core values, including growing our people and delivering value to our shareholders. The philosophy continues to emphasise the fundamental value of our people and their role in ensuring sustainable growth. This approach is crucial in an environment where skills remain scarce.
The group’s board of directors sets the principles for the remuneration philosophy in line with approved business strategy and objectives. The philosophy aims to maintain an appropriate balance between employee and shareholder interests.
A key success factor for the bank is its ability to attract, retain and motivate the talent it requires to achieve its strategic and operational objectives in Namibia.
Remuneration governanceThe remuneration of board members is reviewed by the board of directors and approved by the Standard Bank board HC subcommittee and ratified at the AGM. The following key factors have informed the implementation of reward
CORPORATE GOVERNANCE REPORT continued
SBN Holdings Limited Annual report 2016 39
policies and procedures that support the achievement of business goals:
the provision of rewards that enable the attraction, retention and motivation of employees and the development of a high-performance culture
maintaining competitive remuneration in line with our markets, trends and required statutory obligations
rewarding people according to their contribution
allowing a reasonable degree of flexibility in remuneration processes and choice of benefits by employees
moving to a cost-to-company remuneration structure
educating employees on the full employee value proposition.
Board remuneration structureNon-executive directorsTerms of serviceAll non-executive directors are provided with a letter of appointment setting out the terms of their engagement. Directors are appointed by the shareholders at the annual general meeting (AGM) and interim board appointments are allowed between AGMs. One third of the longest serving, non-executive directors are required to retire at each AGM and may offer themselves for re-election. If recommended by the directors and supported by the board, the board then proposes their re-election to shareholders. There is no limitation to the number of times a non-executive director may stand for re-election.
FeesNon-executive directors receive fixed fees for service on boards and board committees. This includes a retainer that has been calculated in line with market practices. There are no contractual arrangements for compensation for loss of office. Non-executive directors do not receive short-term incentives, nor do they participate in any long-term incentive
schemes. The fees for non-executive directors are reviewed on an annual basis to ensure that such fees at all times remain market-related.
Executive directorsExecutive directors receive a remuneration package and qualify for long-term incentives on the same basis as other employees. The components of a remuneration package are as follows:
guaranteed remuneration – based on market value and the role they play
annual bonus and pension incentive – used to incentivise the achievement of bank/group objectives
share-based incentives – rewards the sustainable creation of shareholder value and aligns behaviour to this goal
pension – provides a competitive post-retirement benefit in line with group employees
executive directors are not subject to retention agreements.
Transformation SBN through the Namibian Bankers Association is a signatory to the Namibia Financial Services Charter (the Charter). SBN is committed to achieving full compliance with the minimum targets for 2014 and 2019 as set out in the Charter. This is tracked by the board and management at the highest level.
SBN has committed to a 25 % BBEE equity which is in in accordance with the recommendation of the Charter. On 6 December 2010, the Standard Bank Namibia board of directors approved a decision to sell 10% of its current 100% stake in the Standard Bank Namibia group to its staff members who qualify as broad-based economic empowerment beneficiaries in terms of the Financial Sector Charter (BBEE beneficiaries) and various community trusts formed to benefit BBEE beneficiaries, as a first step in respect of the ownership category of the Financial Sector Charter. This scheme was formally launched on 6 November 2014.
The group has completed all the necessary arrangements relating to the transfer of 10% of the bank’s shareholding from Standard Bank Group to Purros Investments, with 8% of the shares to be allocated to qualifying bank staff and the remaining 2% to a community trust to be set up with the objective of contributing to vulnerable communities with a focus on education, health and small enterprise development.
The second step towards SBNH achieving its localisation objectives will consist of SBG selling down a further 15% shareholding in SBNH. This transaction still has to be approved by the SBG board.

40
GOVERNANCE REPORT
1 2 3
4 5
8 99 6 7
Board of directors

SBN Holdings Limited Annual report 2016 41
1. Herbert Maier Chairman – non-executive director
BCom (UCT), CTA (UCT), CA(SA), CA(Nam) Appointed 2010
During July 2011, Herbert joined IJG Holdings’ corporate advisory and private equity operations. Since June 2012, Herbert has taken control of and has been buildings the private equity management business.
He was appointed to the Standard Bank Namibia board of directors on 1 October 2010 as an independent non-executive director and appointed to the position of chairman to the board during 2011.
Directorships • Standard Bank Namibia Ltd • SBN Holdings Ltd • IJG Holdings (Pty) Ltd • IJG Capital (Pty) Ltd • MobiCash Payment Solutions (Pty) Ltd • NEC Power & Pumps (Pty) Ltd • Stahl Construction (Pty) Ltd • Omburu Sun Energy (Pty) Ltd • NEO Paints Holdings (Pty) Ltd • NEO Paints Factory (Pty) Ltd
C HC IT
2. Vetumbuavi Mungunda Chief executive director
BCom (UNAM), HDipAcc (Rhodes), CA(Nam), CA(SA)
Appointed 2014
Vetumbuavi was appointed as chief executive of Standard Bank Namibia in April 2014. He previously worked for Deloitte for 18 years, where he was admitted as partner in 2001 and was appointed as managing partner of Deloitte Namibia in 2007. He was later appointed as regional managing partner for Deloitte Southern Corridor (Malawi, Botswana, Namibia, Zambia and Zimbabwe) in 2012, a position held before he joined Standard Bank Namibia.
Directorships • Standard Insurance Brokers (Namibia)
(Pty) Ltd • Stanfin & United Funerals Insurance
(Pty) Ltd • SBN Holdings Ltd • Standard Bank Namibia Ltd • Betula Nigra Investments (Pty) Ltd
3. Bryan Mandy Chief financial officer – Executive director
BCom (UCT), BCompt Hons (Unisa), CA (NAM), CA (SA)
Appointed December 2016
Directorships • Standard Bank Namibia Ltd
SBN Holdings Ltd • Standard Bank Namibia Pension Fund
(chairperson) • Namibian Institute of Bankers • Standard Bank Nominees (Pty) Ltd
4. Pindie Nyandoro Executive director
BSc Honours, MBA, LLB Appointed 2011
Directorships • SBN Holdings Ltd • Standard Bank Namibia Ltd • Stanbic Bank Botswana Ltd • Standard Lesotho Bank Ltd • Standard Bank S.A.R.L Mozambique • Standard Bank Swaziland Ltd • Stanbic Bank Zimbabwe Ltd
HC A
5. Isac Hiriua Tjombonde Non-executive director
Master of Science (MSc) Information Systems, The American University, Washington, DC, USA Bachelor of Business Administration (BBA) Computer & Information Sciences, Temple University, Philadelphia, PA, USA Certificate in Corporate Governance, University of Johannesburg, RSA Executive Development Programme, University of Stellenbosch, RSA
Appointed 2015
Chief officer of Corporate Services and a member of the executive committee at NamPower, responsible for information & communication technology, Human Resources, and Fleet Management. He is a trustee of the NamPower Provident Fund.
Directorships • SBN Holdings Ltd • Standard Bank Namibia Ltd • Trustee NamPower Provident Fund
IT R
6. Jeremia Muadinohamba Non-executive director
Masters Degree in Developmental Finance, Masters Degree in Administration and Masters Degree in Intercultural Management Appointed 2007
Directorships • SBN Holdings Ltd • Standard Bank Namibia Ltd
A HC
7. Arnold Gore Gain Non-executive director
Bachelor of Commerce (Honours) in Financial Accounting and in Business Data Processing
Appointed 2015
Head of strategic clients, Standard Bank Group,
Directorships • Stanbic Bank Botswana Ltd • Stanbic IBTC Bank Plc, Nigeria • SBN Holdings Ltd • Standard Bank Namibia Ltd • Standard Bank Sarl-Mozambique
C
8. Adv Natasha Bassingthwaighte Non-executive director
BJuris, LLB (University of Namibia) Appointed 2011
Natasha was admitted as a legal practitioner of the High Court of Namibia during 2002 and has been practising as an advocate since 2006. Natasha was the chairperson of the Black Distributors Trust, a BEE initiative of Old Mutual Life Assurance Co (Namibia) Ltd. She is a past president and vice-president of the Law Society of Namibia and has also served on the Bar Council of the Society of Advocates.
Directorships • SBN Holdings Ltd • Standard Bank Namibia Ltd • Standard Insurance Brokers (Namibia)
(Pty) Ltd • PPS Insurance Company (Namibia) Ltd
R C IT
9. Birgit Rossouw Non-executive director
BPhil (University of Stellenbosch), CA(NAM), CIA
Appointed 2012
Birgit currently serves as independent Non-executive director of Namibia Asset Management Limited, an asset manager listed on the Namibian Stock Exchange. In the past, she chaired the audit committee of The Namibia Water Corporation Limited (NamWater), where she was also appointed as non-executive independent director to the board, and also served as the company secretary of the National Fishing Corporation of Namibia Ltd (Fishcor).
Directorships • SBN Holdings Ltd • Standard Bank Namibia Ltd • Stanfin (Namibia) (Pty) Ltd • Namibia Asset Management Ltd
C R IT
C Credit committee IT Information technology committee HC Human capital
committee A Audit committeeR Risk committee

42
4. Bryan Mandy Chief financial officer
BCom (UCT), BCompt (Hons) (Unisa), CA(Nam) CA(SA)
Joined the Standard Bank Group: 2011 Appointed to SBN exco: 2011
5. Minullie Daniels Head – PBB Credit
Diploma in Human Resource Management, Advanced Diploma in Bank Credit Management; MDP (USB)
Joined the Standard Bank Group: 2012 Appointed to SBN exco: 2015
6. Neville Beckmann Head – Treasury
BCom (Unisa), CAIB(SA), MDP/SMP(USB) Joined the Standard Bank Group: 2015
Appointed to SBN exco: 2015
1. Vetumbuavi Mungunda Chief executive
BCom (UNAM), HDipAcc (Rhodes), CA(Nam), CA(SA)
Joined the Standard Bank Group: 2014 Appointed to SBN exco: 2014
2. Amit Mohan Head – Corporate & Investment Banking
BCompt (Unisa), BCom (Hons) (Natal), CA(Nam), CA(SA), SMP(USB)
Joined the Standard Bank Group: 2009 Appointed to SBN exco: 2014
3. Mercia Geises Head – Personal & Business Banking
BJuris (UNAM), LLB (UFS), LLM (UFS), MBA (USB)
Joined the Standard Bank Group: 2016 Appointed to SBN exco: 2016
Executive committee
1 2 3 4
5 6
GOVERNANCE REPORT continued

SBN Holdings Limited Annual report 2016 43
10. Johann van Rensburg Head – Internal Audit
BCom (Hons) (Unisa), SMP (USB) CIA Joined the Standard Bank Group: 2014
Appointed to SBN exco: 2014
11. Pieter Kruger Chief information officer
BSc (Hons), MSc Computer Science University of Stellenbosch
Joined the Standard Bank Group: 2015 Appointed to SBN exco: 2015
12. Andrew Maske Head – Operations and Strategy
BBusSc Actuarial Science (UCT), MBA Finance (University of Chicago Booth School of Business)
Joined the Standard Bank Group: 2015 Appointed to SBN exco: 2015
13. Roxzaan Witbooi Head – Compliance
BJuris (UNAM), LLB (UNAM) Joined the Standard Bank Group: 2012
Appointed to SBN exco: 2014
14. Sigrid Tjijorokisa Head – Legal and Governance
LLB (UWC), MDP (Damelin College), Advanced Diploma in Banking Law and Practice (UP), Diploma in Compliance Risk Management (UP), IODSA and the Compliance Institute of South Africa
Joined the Standard Bank Group: 2012 Appointed to SBN exco: 2012
7. Dirk Smit Head – CIB Credit
BCom (USB), MDP (USB), SMP (USB) Joined the Standard Bank Group: 1993
Appointed to SBN exco: 2013
8. Ehrenfried Meroro Head – Risk Management
MSc Economics, BSc Economics (A&T State University, NC, USA), EDP (Wits), MDP (USB), Market Risk Management (Brit Training)
Joined the Standard Bank Group: 2003 Appointed to SBN exco: 2003
9. Isdor Angula Head – Human Capital
BTech (Human Resource Management) (Namibia University of Science & Technology), NDPA & Post Graduate Diploma in Law: Con & Arb (UNAM), MSc (Leeds Metropolitan University)
Joined the Standard Bank group: 2011 Appointed to SBN exco: 2012
9 10 11 12
13 14
7 8

44
Annual financial statements
The reports and statements set out below comprise the annual financial statements presented to the shareholder
ANNUAL FINANCIAL STATEMENTS

SBN Holdings Limited Annual report 2016 45
46 Directors’ responsibilities and approval
47 Independent auditor’s report
49 Directors’ report
50 Statements of financial position
51 Statements of profit or loss
52 Statements of other comprehensive income
53 Consolidated statement of changes in equity
54 Statements of changes in equity
55 Statements of cash flows
56 Accounting policy elections
57 Key management assumptions
59 Notes to the annual financial statements
98 Annexure A – Subsidiaries
99 Annexure B – Joint ventures
100 Annexure C – Risk and capital management
136 Annexure D – Emoluments of directors
137 Annexure E – Detailed group accounting policies

46
ANNUAL FINANCIAL STATEMENTS
minutes of all meetings of shareholders, the board of directors and committees of the board. The directors believe that all representations made to the independent auditors during their audit are valid and appropriate.
The audit report of the independent auditor is presented on page 47.
The annual report set out on pages 44 to 155, which have been prepared on the going concern basis, were approved by the board on 23 March 2017 and were signed on its behalf by:
Mr H Maier Mr VJ MungundaChairman Chief executive
The directors are responsible for the preparation, integrity and fair presentation of the consolidated and separate financial statements of SBN Holdings Limited. The financial statements presented on pages 44 to 155 have been prepared in accordance with International Financial Reporting Standards, and include amounts based on judgements and estimates made by management.
The going concern basis has been adopted in preparing the consolidated and separate financial statements. The directors have a reasonable expectation that the group will have adequate resources to continue in operational existence and as a going concern for the foreseeable future. These financial statements support the viability of the group.
The consolidated and separate financial statements have been audited by the independent auditors, PricewaterhouseCoopers who were given unrestricted access to all financial records and related data, including
Directors’ responsibilities and approval

SBN Holdings Limited Annual report 2016 47
Independent auditor’s report
To the Members of SBN Holdings LimitedReport on the audit of the consolidated and separate financial statements
Our opinionIn our opinion, the consolidated and separate financial statements present fairly, in all material respects, the consolidated and separate financial position of SBN Holdings Limited (the Company) and its subsidiaries (together the Group) as at 31 December 2016, and its consolidated and separate financial performance and its consolidated and separate cash flows for the year then ended in accordance with International Financial Reporting Standards and the requirements of the Companies Act of Namibia.
What we have auditedSBN Holdings Limited’s consolidated and separate financial statements set out on pages 49 to 155 comprise:
the consolidated and separate statements of financial position as at 31 December 2016;
the consolidated and separate statements of comprehensive income for the year then ended;
the consolidated and separate statements of changes in equity for the year then ended;
the consolidated and separate statements of cash flows for the year then ended;
the notes to the financial statements, which include a summary of significant accounting policies; and
the directors’ report. Certain required disclosures have been presented
elsewhere in the Annual Report, rather than in the notes to the financial statements. These are cross-referenced from the financial statements and are identified as audited.
Basis for opinionWe conducted our audit in accordance with International Standards on Auditing (ISAs). Our responsibilities under those standards are further described in the Auditor’s responsibilities for the audit of the consolidated and separate financial statements section of our report.
We believe that the audit evidence we have obtained is sufficient and appropriate to provide a basis for our opinion.
IndependenceWe are independent of the Group in accordance with the International Ethics Standards Board for Accountants Code of Ethics for Professional Accountants (Parts A & B) and other independence requirements applicable to performing audits of financial statements in Namibia. We have fulfilled our other ethical responsibilities in accordance with this and in accordance with other ethical requirements applicable to performing audits in Namibia.
Other informationThe directors are responsible for the other information. The other information comprises the details about Standard Bank, the Chairman’s statement, the Chief Executive’s Review, the Financial Review, the Corporate Governance Report, the Board of Directors information, the Executive Committee Information, the Directors’ responsibility and approval and the information in annexure C that is marked unaudited, which we obtained prior to the date of this auditor’s report. Other information does not include the consolidated and separate financial statements and our auditor’s report thereon.
Our opinion on the consolidated and separate financial statements does not cover the other information and we do not and will not express an audit opinion or any form of assurance conclusion thereon.
In connection with our audit of the consolidated and separate financial statements, our responsibility is to read the other information identified above and, in doing so, consider whether the other information is materially inconsistent with the consolidated and separate financial statements or our knowledge obtained in the audit, or otherwise appears to be materially misstated.
If, based on the work we have performed on the other information that we obtained prior to the date of this auditor’s report, we conclude that there is a material misstatement of this other information, we are required to report that fact. We have nothing to report in this regard.
Responsibilities of the directors for the consolidated and separate financial statementsThe directors are responsible for the preparation and fair presentation of the consolidated and separate financial statements in accordance with International Financial Reporting Standards and the requirements of the Companies Act of Namibia, and for such internal control as the directors determine is necessary to enable the preparation of consolidated and separate financial statements that are free from material misstatement, whether due to fraud or error.
In preparing the consolidated and separate financial statements, the directors are responsible for assessing the Group and the Company’s ability to continue as a going concern, disclosing, as applicable, matters related to going concern and using the going concern basis of accounting unless the directors either intend to liquidate the Group and/or the Company or to cease operations, or have no realistic alternative but to do so.

48
Auditor’s responsibilities for the audit of the consolidated and separate financial statementsOur objectives are to obtain reasonable assurance about whether the consolidated and separate financial statements as a whole are free from material misstatement, whether due to fraud or error, and to issue an auditor’s report that includes our opinion. Reasonable assurance is a high level of assurance, but is not a guarantee that an audit conducted in accordance with ISAs will always detect a material misstatement when it exists. Misstatements can arise from fraud or error and are considered material if, individually or in the aggregate, they could reasonably be expected to influence the economic decisions of users taken on the basis of these consolidated and separate financial statements.
As part of an audit in accordance with ISAs, we exercise professional judgement and maintain professional scepticism throughout the audit. We also:
Identify and assess the risks of material misstatement of the consolidated and separate financial statements, whether due to fraud or error, design and perform audit procedures responsive to those risks, and obtain audit evidence that is sufficient and appropriate to provide a basis for our opinion. The risk of not detecting a material misstatement resulting from fraud is higher than for one resulting from error, as fraud may involve collusion, forgery, intentional omissions, misrepresentations, or the override of internal control.
Obtain an understanding of internal control relevant to the audit in order to design audit procedures that are appropriate in the circumstances, but not for the purpose of expressing an opinion on the effectiveness of the Group’s and the Company’s internal control.
Evaluate the appropriateness of accounting policies used and the reasonableness of accounting estimates and related disclosures made by the directors.
Conclude on the appropriateness of the directors’ use of the going concern basis of accounting and, based on the audit evidence obtained, whether a material uncertainty
exists related to events or conditions that may cast significant doubt on the Group’s and the Company’s ability to continue as a going concern. If we conclude that a material uncertainty exists, we are required to draw attention in our auditor’s report to the related disclosures in the consolidated and separate financial statements or, if such disclosures are inadequate, to modify our opinion. Our conclusions are based on the audit evidence obtained up to the date of our auditor’s report. However, future events or conditions may cause the Group and/or Company to cease to continue as a going concern.
Evaluate the overall presentation, structure and content of the consolidated and separate financial statements, including the disclosures, and whether the consolidated and separate financial statements represent the underlying transactions and events in a manner that achieves fair presentation.
Obtain sufficient appropriate audit evidence regarding the financial information of the entities or business activities within the group to express an opinion on the consolidated financial statements. We are responsible for the direction, supervision and performance of the group audit. We remain solely responsible for our audit opinion.
We communicate with the directors regarding, among other matters, the planned scope and timing of the audit and significant audit findings, including any significant deficiencies in internal control that we identify during our audit.
PricewaterhouseCoopersChartered Accountants (Namibia)Registered Accountants and Auditors
Per: Nangula UaandjaPartnerWindhoek, 23 March 2017
ANNUAL FINANCIAL STATEMENTS Independent auditor’s report continued

SBN Holdings Limited Annual report 2016 49
Directors’ reportfor the year ended 31 December 2016
Review of activitiesMain business and operationsSBN Holdings is the holding company for Standard Bank Namibia. It conducts its operations through the following businesses:
Banking services through Standard Bank Namibia Limited, a registered Namibian commercial bank.
Insurance broking services through subsidiary companies Stanfin (Namibia) (Pty) Limited and Standard Insurance Brokers (Namibia) (Pty) Limited.
Safe custodianship through its 100%-owned subsidiary company Standard Bank Namibia Nominees (Pty) Limited.
Asset management and unit trust services through a related company, Liberty Life Namibia Limited.
The group operates in all main areas within Namibia and its head office is located in Windhoek.
The group also offers an international banking service through its association with Standard Bank Group Limited, a company registered in the Republic of South Africa and dual listed on the Johannesburg Stock Exchange and Namibian Stock Exchange, with representation throughout Africa.
Registered and business address5th Floor, Standard Bank Centre, Corner of Werner List Street and Post Street Mall, PO Box 3327, Windhoek, Namibia
Registration number2006/306
Country of incorporationRepublic of Namibia
Results for the periodNet profit of the group was N$540 million (2015: N$525 million profit), after taxation of N$211 million (2015: N$209 million).
Events after the reporting periodThere were no events after the reporting date to report.
Authorised and issued share capitalThe group’s authorised share capital consisted of 100 000 000 ordinary shares of 1 cent each of which 100 000 000 have been issued. The authorised and issued share capital remained unchanged for the year.
BorrowingsThe group’s borrowings consist mainly of deposit and current accounts originated through banking operations and long-term financing.
Property and equipmentThe group’s property and equipment are disclosed in note 8 to the annual financial statements.
DividendsA dividend of N$263 million was declared and paid in the year under review (2015: nil).
OwnershipAt 31 December 2016, Standard Bank Group Limited owned 89.9% of the issued share capital. The Purros Trust owned 10% and the following directors each hold 100 shares:
Mr H Maier Mr A Gain Mr VJ Mungunda Mr JL MuadinohambaAdv N Bassingthwaighte Ms PM NyandoroMrs B Rossouw Mr IH Tjombonde
The directors have no beneficial interest in the ordinary shares which are held on behalf of Standard Bank Group Limited.
DirectorsThe directors of the company during the year and to the date of this report are as follows:
SBN HOLDINGS LIMITED
Mr H MaierMr VJ MungundaAdv N BassingthwaighteMrs B Rossouw Mr AG GainMr BJ Mandy (appointed 8 December 2016)Mr JL MuadinohambaMs PM Nyandoro Mr IH Tjombonde
NamibianNamibianNamibianNamibianSouth AfricanNamibianNamibianZimbabweanNamibian
Company secretaryAdv S Tjijorokisa
INTEREST IN SUBSIDIARIES
Name of subsidiary
Amount of issued share
capital
Net income after tax (N$’000)
Standard Insurance Brokers (Namibia) (Pty) Ltd 1 18 140
Stanfin (Namibia) (Pty) Ltd 2 2 716
Standard Bank Namibia Ltd 200 001 500 477 692
Interest in subsidiariesThe company owns 100% of the share capital of Standard Bank Namibia Limited, Standard Insurance Brokers (Namibia) (Pty) Limited and Stanfin (Namibia) (Pty) Limited.
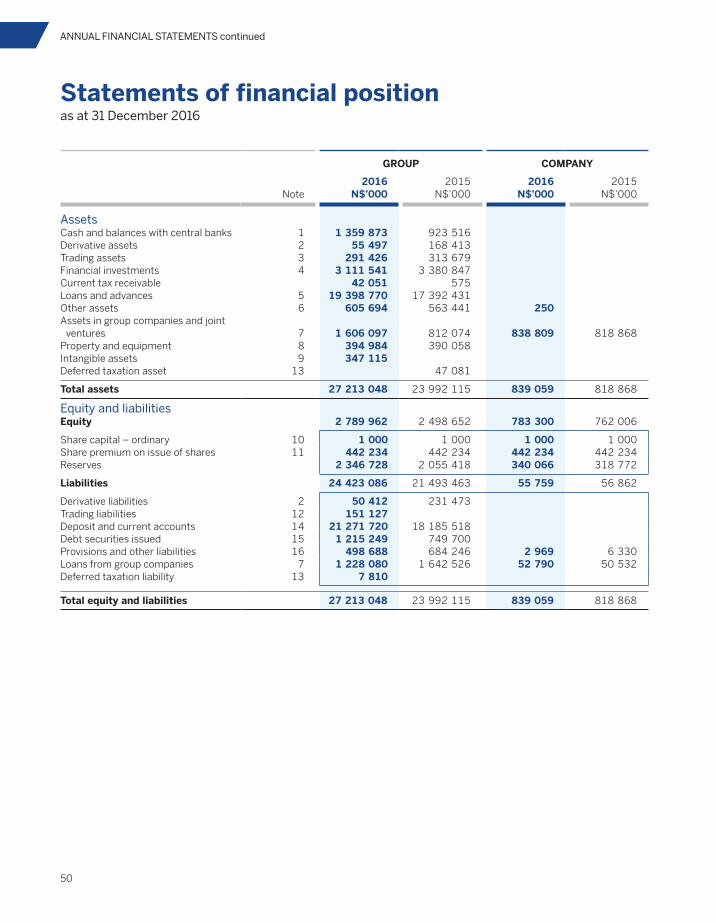
50
ANNUAL FINANCIAL STATEMENTS continued
Statements of financial positionas at 31 December 2016
Note
GROUP COMPANY
2016N$’000
2015N$’000
2016N$’000
2015N$’000
AssetsCash and balances with central banks 1 1 359 873 923 516Derivative assets 2 55 497 168 413Trading assets 3 291 426 313 679Financial investments 4 3 111 541 3 380 847Current tax receivable 42 051 575Loans and advances 5 19 398 770 17 392 431Other assets 6 605 694 563 441 250Assets in group companies and joint
ventures 7 1 606 097 812 074 838 809 818 868Property and equipment 8 394 984 390 058Intangible assets 9 347 115Deferred taxation asset 13 47 081
Total assets 27 213 048 23 992 115 839 059 818 868
Equity and liabilitiesEquity 2 789 962 2 498 652 783 300 762 006
Share capital – ordinary 10 1 000 1 000 1 000 1 000Share premium on issue of shares 11 442 234 442 234 442 234 442 234Reserves 2 346 728 2 055 418 340 066 318 772
Liabilities 24 423 086 21 493 463 55 759 56 862
Derivative liabilities 2 50 412 231 473Trading liabilities 12 151 127Deposit and current accounts 14 21 271 720 18 185 518Debt securities issued 15 1 215 249 749 700Provisions and other liabilities 16 498 688 684 246 2 969 6 330Loans from group companies 7 1 228 080 1 642 526 52 790 50 532Deferred taxation liability 13 7 810
Total equity and liabilities 27 213 048 23 992 115 839 059 818 868

SBN Holdings Limited Annual report 2016 51
Statements of profit or lossfor the year ended 31 December 2016
Note
GROUP COMPANY
2016N$’000
2015N$’000
2016N$’000
2015N$’000
Net interest income 1 205 338 1 147 549
Interest income 23 2 268 283 2 025 992
Interest expense 24 (1 062 945) (878 443)
Non-interest revenue 930 829 857 381 283 971 243 673
Net fee and commission revenue 716 026 638 849
Fee and commission revenue 25 874 174 763 524
Fee and commission expense 26 (158 148) (124 675)
Trading revenue 27 121 056 137 046
Other revenue 28 93 747 81 486 283 971 243 673
Total income 2 136 167 2 004 930 283 971 243 673
Credit impairment charges 29 (90 933) (85 309)
Income after credit impairment charges 2 045 234 1 919 621 283 971 243 673
Operating expenses 30 (1 271 651) (1 169 725) (177) (177)
Net income 773 583 749 896 283 794 243 496 Share of profit from equity accounted
investments 7 2 295 1 311
Net income before indirect taxation 775 878 751 207 283 794 243 496
Indirect taxation 31 (24 780) (17 866)
Profit before direct taxation 751 098 733 341 283 794 243 496
Direct taxation 32 (211 412) (208 810)
Profit for the year 539 686 524 531 283 794 243 496

52
Statements of other comprehensive incomefor the year ended 31 December 2016
GROUP COMPANY
2016N$’000
2015N$’000
2016N$’000
2015N$’000
Profit for the year 539 686 524 531 283 794 243 496 Other comprehensive income:Items that may be subsequently
reclassified to profit or lossNet change in fair value of available-for-sale
financial assets 11 502 (16 906)
Other comprehensive income for the year net of taxation1 11 502 (16 906)
Total comprehensive income 551 188 507 625 283 794 243 496
1 The income tax relating to components of OCI is disclosed in note 30.3.
ANNUAL FINANCIAL STATEMENTS continued

SBN Holdings Limited Annual report 2016 53
Consolidated statement of changes in equityfor the year ended 31 December 2016
Total share
capital1
N$’000
Available-for-sale
revaluationreserve2
N$’000
Share-based
paymentreserve3
N$’000
Statutorycredit risk
reserve4
N$’000
Post-employment
benefitreserve5
N$’000
Retainedearnings
N$’000Total
N$’000
GroupBalance as at
1 January 2015 443 234 (916) 9 718 122 578 6 420 1 395 712 1 976 746
Profit for the year 524 531 524 531 Other comprehensive income (16 906) (16 906)
Total comprehensive income for the year (16 906) 524 531 507 625
Equity-settled share-based payment transactions 14 281 14 281
Transfer between reserves 15 000 (15 000)
Total contributions by and distributions to owners of company recognised directly in equity 14 281 15 000 (15 000) 14 281
Balance as at 31 December 2015 443 234 (17 822) 23 999 137 578 6 420 1 905 243 2 498 652
Profit for the year 539 686 539 686 Other comprehensive income 11 502 11 502
Total comprehensive income for the year 11 502 539 686 551 188
Equity-settled share-based payment transactions 2 622 2 622
Transfer between reserves 10 300 (10 300)Dividends (262 500) (262 500)
Total contributions by and distributions to owners of company recognised directly in equity 2 622 10 300 (272 800) (259 878)
Balance as at 31 December 2016 443 234 (6 320) 26 621 147 878 6 420 2 172 129 2 789 962
1 Please refer to notes 10 and 11 for further information.2 Available-for-sale reserve: refer to the available-for-sale financial assets section in accounting policy: Financial instruments.3 Share-based payment reserve: refer to accounting policy: Equity-linked transactions.4 The statutory credit risk reserve relates to the Bank of Namibia reserve requirements.5 The post-employment benefit reserve relates to medical scheme benefits to certain qualifying employees, retired employees and their registered dependants
(refer to note 32 for detailed disclosure).

54
Statements of changes in equityfor the year ended 31 December 2016
Total share
capital1
N$’000
Available-for-sale
revaluationreserve2
N$’000
Share-based
paymentreserve3
N$’000
Statutorycredit risk
reserve4
N$’000
Post-employment
benefit reserve5
N$’000
Retainedearnings
N$’000Total
N$’000
CompanyBalance as at
1 January 2015 443 234 75 276 518 510
Profit for the year 243 496 243 496 Other comprehensive
incomeTotal comprehensive
income for the year 243 496 243 496
Equity-settled share-based payment transactions
Transfer between reserves
Total contributions by and distributions to owners of company recognised directly in equity
Balance as at 31 December 2015 443 234 318 772 762 006
Profit for the year 283 794 283 794 Other comprehensive
income
Total comprehensive income for the year 283 794 283 794
Equity-settled share-based payment transactions
Dividends (262 500) (262 500)
Total contributions by and distributions to owners of company recognised directly in equity (262 500) (262 500)
Balance as at 31 December 2016 443 234 340 066 783 300
1 Please refer to notes 10 and 11 for further information.2 Available-for-sale reserve: refer to the available-for-sale financial assets section in accounting policy: Financial instruments.3 Share-based payment reserve: refer to accounting policy: Equity-linked transactions.4 The statutory credit risk reserve relates to the Bank of Namibia reserve requirements.5 The post-employment benefit reserve relates to medical scheme benefits to certain qualifying employees, retired employees and their registered dependants
(refer to note 32 for detailed disclosure).
ANNUAL FINANCIAL STATEMENTS continued

SBN Holdings Limited Annual report 2016 55
Statements of cash flowsfor the year ended 31 December 2016
Note
GROUP COMPANY
2016N$’000
2015N$’000
2016N$’000
2015N$’000
Net cash flow from operations 664 319 (655 515) 262 500
Cash flow from operations (411 341) (1 622 134) (16 131) (243 673)
Net income before indirect taxation 775 878 751 207 283 794 243 496Adjusted for: (1 126 115) (1 044 245) (278 631) (243 673)
Credit impairment charges 29 90 933 85 309Depreciation and amortisation 30 83 752 73 931Equity-settled share-based payments 35 8 162 15 976Fair value adjustments financial
instruments 28 (4 198) (4 123)Fair value adjustments trading assets 27 (27 604) (17 825)Indirect taxation 31 (24 780) (17 866)Interest expense 24 1 062 945 878 443Interest received 23 (2 268 283) (2 025 992)Net movement in post-employment
benefits 4 048 10 571Profit on sale of property and equipment 30 (4 332) (1 211)Dividends received 28 (44 463) (40 147) (278 631) (243 673)Income from equity accounted
investments 7 (2 295) (1 311)
Increase in income earning assets 32.1 (2 469 897) (2 935 393) (20 191) (242 873)Increase in deposits and other liabilities 32.2 2 408 793 1 606 297 (1 103) (623)
Interest received 2 260 121 1 989 503Dividends received 28 44 463 40 147 278 631 243 673Interest paid (1 025 513) (864 320)Tax paid 32.3 (203 411) (198 711)
Net cash flows from investing activities (431 462) (137 297)
Purchase of property and equipment 8 (107 337) (176 016)Purchase of intangible assets 9 (361 160)Sale of property and equipment 32.4 37 035 38 719
Net cash flows from financing activities 203 500 15 000
Senior debt redeemed (133 800) (292 000)Senior debt issued 599 800 307 000Dividends paid 32.5 (262 500) (262 500)
Total cash and balances with central banks movement for the year 436 357 (777 812)
Cash and balances with central banks at beginning of the year 1 923 516 1 701 328
Total cash and balances with central banks at end of the year 1 1 359 873 923 516

56
Accounting policy elections
The principal accounting policies applied in the presentation of the group and company’s annual financial statements are set out below.
1. Basis of preparation The group’s consolidated and company’s separate annual financial statements (annual financial statements) are prepared
in accordance with IFRS as issued by the IASB, its interpretations adopted by the IASB and the Namibian Companies Act. The annual financial statements have been prepared on the historical cost basis except for the following material items in the statement of financial position:
available-for-sale financial assets, financial assets and liabilities classified at fair value through profit or loss and liabilities for cash-settled share-based payment arrangements
post-employment benefit obligations that are measured in terms of the projected unit credit method.
The following principal accounting policy elections in terms of IFRS have been made, with reference to the detailed accounting policies shown in brackets:
purchases and sales of financial assets under a contract whose terms require delivery of the asset within the timeframe established generally by regulation or convention in the marketplace concerned are recognised and derecognised using trade date accounting (accounting policy 3)
intangible assets and property and equipment are accounted for at cost less accumulated amortisation and impairment (accounting policies 6)
inter-company transactions between the group’s continuing and discontinued operation are not eliminated but presented as part of the group’s respective continuing and discontinued operations’ results (accounting policy 9)
the portfolio exception to measure the fair value of certain groups of financial assets and financial liabilities on a net basis (accounting policy 4).
2. Functional and presentation currency The annual financial statements are presented in Namibian dollar, which is the functional and presentation currency of
the group and the company. All amounts are stated in thousands of dollar (N$’000), unless indicated otherwise.
3. Changes in accounting policies The accounting policies are consistent with those reported in the previous year except as required in terms of the adoption
of the following:
Adoption of new and amended standards effective for the current financial period The accounting policies are consistent with those reported in the previous year except as required in terms of the adoption
of the following amendments effective for the current period:
Amendment to IFRS 11 Joint Arrangements (IFRS 11)
IAS 27 Separate Financial Statements (IAS 27): amendment which allows entities preparing separate financial statements to utilise the equity method to account for investments in subsidiaries, joint ventures and associates.
Early adoption of revised standards: Amendment to IAS 7 Statement of Cash Flows (IAS 7)
Amendment to IAS 12 Income Taxes (IAS 12).
The abovementioned amendments to the IFRS standards and circular, adopted on 1 January 2016, did not have any effect on the group’s previously reported financial results or disclosures and had no material impact on the group’s accounting policies.
ANNUAL FINANCIAL STATEMENTS continued

SBN Holdings Limited Annual report 2016 57
Key management assumptions
In preparing the financial statements, estimates and assumptions are made that could affect the reported amounts of assets and liabilities within the next financial year. Estimates and judgements are continually evaluated and are based on factors such as historical experience and current best estimates of uncertain future events that are believed to be reasonable under the circumstances. No material changes to assumptions have occurred during the year.
1. Impairment of available-for-sale equity investments The bank determines that available-for-sale equity investments are impaired and recognised as such in profit or loss
when there has been a significant or prolonged decline in the fair value below its cost. This determination of what is significant or prolonged requires judgement. In making this judgement, the bank evaluates, among other factors, the normal volatility in the share price. In addition, impairment may be appropriate when there is evidence of deterioration in the financial health of the investee, industry and sector performance, changes in technology, and operational and financing cash flows.
Had the declines of financial instruments’ fair values below cost been considered significant or prolonged, the company would have suffered an additional loss of N$6 320 thousand (2015: N$17 822 thousand) in its financial statements, being the transfer of negative revaluations within available-for-sale reserves to profit or loss.
2. Income taxation The bank is subject to direct and indirect taxation in Namibia. There are many transactions and calculations for which
the ultimate taxation determination has an element of uncertainty during the ordinary course of business. The bank recognises liabilities based on objective estimates of the quantum of taxes that may be due. Where the final taxation determination is different from the amounts that were initially recorded, such differences will impact the income taxation and deferred taxation expense in the period in which such determination is made.
3. Credit impairment charge Portfolio loan impairments The bank assesses its loan portfolios for impairment at each reporting date. In determining whether an impairment loss
should be recorded in profit or loss, the bank makes judgements as to whether there is observable data indicating a measurable decrease in the estimated future cash flows from a portfolio of loans before the decrease can be allocated to an individual loan in that portfolio. Estimates are made of the duration between the occurrence of a loss event and the identification of a loss on an individual basis. The impairment for performing and non-performing but not specifically impaired loans is calculated on a portfolio basis, based on historical loss ratios, adjusted for national and industry-specific economic conditions and other indicators present at the reporting date that correlate with defaults on the portfolio. These annual loss ratios are applied to loan balances in the portfolio and scaled to the estimated loss emergence period. The average loss emergence period applied to all customers is three months (2015: three months).
Specific loan impairments Non-performing loans include those loans for which the bank has identified objective evidence of default, such as a breach
of a material loan covenant or condition, as well as those loans for which instalments are due and unpaid for 90 days or more. Management’s estimates of future cash flows on individual impaired loans are based on historical loss experience for assets with similar credit risk characteristics. The methodology and assumptions used for estimating both the amount and timing of future cash flows are reviewed regularly to reduce any differences between loss estimates and actual loss experience. Expected time to recover security and recoveries of individual loans as a percentage of the outstanding balance is estimated to be between three and six months for all customers.

58
ANNUAL FINANCIAL STATEMENTS Key management assumptions continued
4. Fair value of financial instruments The fair value of financial instruments, such as unlisted equity investments and equity derivatives that are not quoted in
active markets is determined by using valuation techniques. Wherever possible, models use only observable market data. Where required, these models incorporate assumptions that are not supported by prices from observable current market transactions in the same instrument and are not based on available observable market data. Such assumptions include risk premiums, liquidity discount rates, credit risk, volatilities and correlations. Changes in these assumptions could affect the reported fair values of financial instruments.
The total amount of the change in fair value estimated using a valuation technique not based on observable market data that was recognised in profit or loss for the year ended 31 December 2016 was a profit of nil million (2015: nil million profit).
The additional disclosures with regards to fair value measurements of financial instruments are set out in note 18.
5. Financial risk management The company’s risk management policies and procedures are disclosed in the risk and capital management section
(Annexure C) of the annual report.
6. Share-based payments The company has both cash and equity-settled share incentive schemes which are issued to qualifying employees based
on the rules of the scheme. The company uses the Black-Scholes option pricing model to determine the fair value of awards at grant date for its equity-settled share incentive schemes. The valuation of the company’s obligations with respect to cash-settled share incentive scheme obligations is determined with reference to the group’s parent company’s share price, which is an observable market input. In determining the expense to be recognised for both cash- and equity-settled share schemes the group estimates the expected future vesting of the awards by considering staff attrition levels. The group also makes estimates of the future vesting of awards that are subject to non-market vesting conditions by taking into account the probability of such conditions being met.
7. Other The nature of other assumptions or other estimation uncertainty for pensions and other post-employment benefits
are disclosed in note 33.

SBN Holdings Limited Annual report 2016 59
Notes to the annual financial statements
1. Cash and balances with central banks
GROUP COMPANY
2016N$’000
2015N$’000
2016N$’000
2015N$’000
Coins and bank notes 444 343 461 601 Balances with the Bank of Namibia 915 530 461 915
Reserve requirement balance1 243 571 229 381 Temporary excess balance 671 959 232 534
1 359 873 923 516
1 Deposits are placed with the Bank of Namibia for the purpose of reserve requirements and are therefore not available for use.
2. Derivative instruments2.1 Use and measurement of derivative instruments In the normal course of business, the group enters into a variety of derivative transactions for trading and hedging
purposes. Derivative instruments used by the group include swaps, options, forwards, futures and other similar types of instruments based on foreign exchange rates and interest rates.
The risks associated with derivative instruments are monitored in the same manner as for the underlying instruments. Risks are also measured across the product range in order to take into account possible correlations.
2.2 Derivatives held-for-trading The group transacts derivative contracts to address client demand, both as a market maker in the wholesale markets
and in structuring tailored derivatives for clients. The group also takes proprietary positions for its own account. Trading derivative products include the following:
Net fair value
N$’000
Fair value of assets
N$’000
Fair value of liabilities
N$’000
Contract/notionalamountN$’000
Group31 December 2016Foreign exchange derivatives– with third parties (21 341) 14 526 (35 867) 1 161 394 – inter-group 22 156 36 701 (14 545) 1 161 394 Interest rate derivatives– inter-group 4 270 4 270 36 751
Total derivative assets/(liabilities) 5 085 55 497 (50 412)
31 December 2015Foreign exchange derivatives– with third parties 42 181 105 109 (62 928) 1 359 575 – inter-group (105 241) 63 304 (168 545) 1 626 247
Total derivative assets/(liabilities) (63 060) 168 413 (231 473)

60
ANNUAL FINANCIAL STATEMENTS Notes to the annual financial statements continued
3. Trading assets
GROUP COMPANY
2016N$’000
2015N$’000
2016N$’000
2015N$’000
Government, municipality and utility bonds 163 403 14 990 Treasury bills 128 023 298 689
291 426 313 679
4. Financial investmentsShort-term negotiable securities 1 740 701 1 960 278 Other financial investments 1 370 840 1 420 569
3 111 541 3 380 847
Comprising:Government, municipality and utility bonds 154 134 310 585 Treasury bills 1 740 701 1 960 278 Mutual funds 1 216 706 1 109 984
3 111 541 3 380 847
Financial investments with a value of N$160 million (2015: N$150 million) are pledged to the Bank of Namibia as security. The pledged assets are used as collateral should Standard Bank not have sufficient funds available for the settlement balance on the Bank of Namibia.
5. Loans and advances
GROUP COMPANY
2016N$’000
2015N$’000
2016N$’000
2015N$’000
5.1 Loans and advances net of impairmentsLoans and advances to banks 511 114 373 097 Loans and advances to customers 18 887 656 17 019 334
Gross loans and advances to customers 19 020 866 17 216 644
Mortgage loans 7 705 766 7 063 798 Instalment sale and finance leases 3 579 044 3 216 421 Card debtors 217 025 229 422 Overdrafts and other demand loans 2 167 456 2 201 567 Term lending 5 351 575 4 505 436
Credit impairments for loans and advances (note 5.3) (133 210) (197 310)
Specific credit impairments (92 291) (161 250)Portfolio credit impairments (40 919) (36 060)
Net loans and advances 19 398 770 17 392 431

SBN Holdings Limited Annual report 2016 61
5. Loans and advances continued5.2 Instalment sale and finance leases
GROUP COMPANY
2016N$’000
2015N$’000
2016N$’000
2015N$’000
Gross investment in instalment sale and finance leases 4 298 107 3 831 754
Receivable within one year 168 409 127 521Receivable after one year but within five years 4 129 698 3 704 233
Unearned finance charges (719 063) (615 333)
Net investment in instalment sale and finance leases 3 579 044 3 216 421
Receivable within one year 161 250 122 511Receivable after one year but within five years 3 417 794 3 093 910
The instalment sale and finance leases are entered into on market-related terms.
5.3 Credit impairments for loans and advances A reconciliation of the allowance for impairment losses for loans and advances to customers, by class:
MortgagelendingN$’000
Instalmentsale andfinance
leasesN$’000
CarddebtorsN$’000
Otherloans andadvances
N$’000
CorporatelendingN$’000 Total
31 December 2016Specific impairmentsBalance at beginning of the year (10 272) (45 349) (8 418) (97 211) (161 250)Impaired accounts written off 1 895 32 793 4 669 115 282 154 639Net impairments raised and released (4 430) (24 704) (2 698) (53 848) (85 680)
Balance at end of the year (12 807) (37 260) (6 447) (35 777) (92 291)
Portfolio impairmentsBalance at beginning of the year (8 053) (4 474) (2 494) (21 039) (36 060)Net impairments raised and released 682 (1 788) 432 (4 578) (5 252)Exchange differences 8 384 392
Balance at end of the year (7 371) (6 254) (2 062) (25 233) (40 920)
Total (20 178) (43 514) (8 509) (61 010) (133 211)

62
5. Loans and advances continued5.3 Credit impairments for loans and advances continued
Mortgagelending
N$’000
Instalmentsale and
financeleases
N$’000
CarddebtorsN$’000
Otherloans andadvances
N$’000
Corporatelending
N$’000 Total
31 December 2015Specific impairmentsBalance at beginning of the year (8 269) (35 013) (9 226) (78 883) (1) (131 392)Impaired accounts written off 1 824 7 878 4 667 43 170 1 57 540Net impairments raised and released (3 827) (18 214) (3 859) (61 498) (87 398)
Balance at end of the year (10 272) (45 349) (8 418) (97 211) (161 250)
Portfolio impairmentsBalance at beginning of the year (11 302) (4 156) (2 269) (19 767) (37 494)Net impairments raised and released 3 249 (317) (225) (618) 2 089Exchange differences (1) (654) (655)
Balance at end of the year (8 053) (4 474) (2 494) (21 039) (36 060)
Total (18 325) (49 823) (10 912) (118 250) (197 310)
Net provisions (raised)/released less recoveries of amounts written off in previous years equals income statement impairment charges (note 29).
6. Other assets
GROUP COMPANY
2016N$’000
2015N$’000
2016N$’000
2015N$’000
Trading settlement assets 494 409 432 234 Other debtors 109 980 118 299 250 Items in the course of collection 1 305 12 908
605 694 563 441 250
ANNUAL FINANCIAL STATEMENTS Notes to the annual financial statements continued

SBN Holdings Limited Annual report 2016 63
7. Group companies and joint ventures
GROUP COMPANY
2016N$’000
2015N$’000
2016N$’000
2015N$’000
Assets in group companies (note 7.1) 1 599 372 807 643 838 809 818 868Liabilities to group companies (note 7.2) (1 228 080) (1 642 526) (52 790) (50 532)Interest in joint ventures (note 7.3) 6 725 4 431
378 017 (830 452) 786 019 768 336
7.1 Assets in group companiesComprising:Trading assets 150 522 277 022 Other assets 6 655 8 675 240 533 220 592Loans and advances 1 442 195 521 946 Investment in subsidiaries 598 276 598 276
Subtotal as above 1 599 372 807 643 838 809 818 868
Other inter-group assets included under other balancesDerivative assets (note 2) 40 971 168 413
Total inter-company asset balances 1 640 343 976 056 838 809 818 868
7.2 Liabilities to group companiesComprising:Subordinated debt (101 844) (101 694)Deposit and current accounts (1 053 267) (1 428 074)Other liabilities (72 969) (112 758) (52 790) (50 532)
Subtotal as above (1 228 080) (1 642 526) (52 790) (50 532)
Other inter-group liabilities included under other balancesDerivative liabilities (note 2) (14 545) (231 473)
Total inter-company liability balances (1 242 625) (1 873 999) (52 790) (50 532)
7.3 Interest in joint venturesCarrying value at beginning of the year 4 431 3 120 Share of profits/(losses) 2 295 1 311
Carrying value at end of the year 6 726 4 431
Reconciliation of interest in joint venturesCost of investment 1 154 1 154 Share of reserves 5 572 3 277
Carrying value at end of the year 6 726 4 431
See Annexure B for further disclosure on the joint venture.
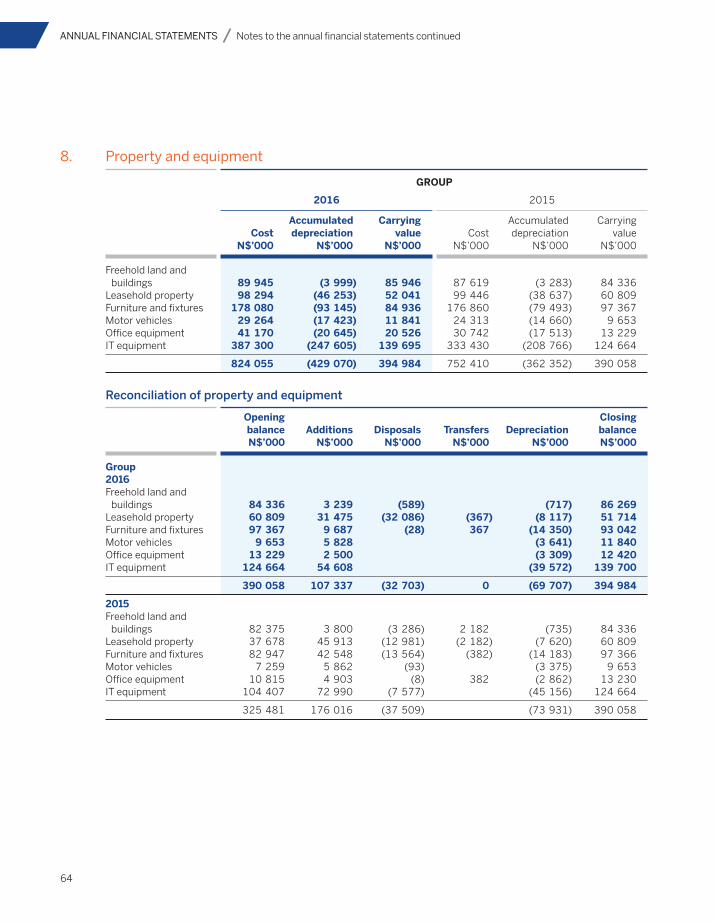
64
8. Property and equipment
GROUP
2016 2015
CostN$’000
Accumulateddepreciation
N$’000
Carryingvalue
N$’000Cost
N$’000
Accumulateddepreciation
N$’000
Carryingvalue
N$’000
Freehold land and buildings 89 945 (3 999) 85 946 87 619 (3 283) 84 336
Leasehold property 98 294 (46 253) 52 041 99 446 (38 637) 60 809Furniture and fixtures 178 080 (93 145) 84 936 176 860 (79 493) 97 367Motor vehicles 29 264 (17 423) 11 841 24 313 (14 660) 9 653Office equipment 41 170 (20 645) 20 526 30 742 (17 513) 13 229IT equipment 387 300 (247 605) 139 695 333 430 (208 766) 124 664
824 055 (429 070) 394 984 752 410 (362 352) 390 058
Reconciliation of property and equipment
OpeningbalanceN$’000
AdditionsN$’000
DisposalsN$’000
TransfersN$’000
DepreciationN$’000
Closing balanceN$’000
Group2016 Freehold land and
buildings 84 336 3 239 (589) (717) 86 269Leasehold property 60 809 31 475 (32 086) (367) (8 117) 51 714Furniture and fixtures 97 367 9 687 (28) 367 (14 350) 93 042Motor vehicles 9 653 5 828 (3 641) 11 840Office equipment 13 229 2 500 (3 309) 12 420IT equipment 124 664 54 608 (39 572) 139 700
390 058 107 337 (32 703) 0 (69 707) 394 984
2015 Freehold land and
buildings 82 375 3 800 (3 286) 2 182 (735) 84 336Leasehold property 37 678 45 913 (12 981) (2 182) (7 620) 60 809Furniture and fixtures 82 947 42 548 (13 564) (382) (14 183) 97 366Motor vehicles 7 259 5 862 (93) (3 375) 9 653Office equipment 10 815 4 903 (8) 382 (2 862) 13 230IT equipment 104 407 72 990 (7 577) (45 156) 124 664
325 481 176 016 (37 509) (73 931) 390 058
ANNUAL FINANCIAL STATEMENTS Notes to the annual financial statements continued

SBN Holdings Limited Annual report 2016 65
8. Property and equipment continued
GROUP COMPANY
2016N$’000
2015N$’000
2016N$’000
2015N$’000
RevaluationsThe fair value of freehold property, based on
valuations undertaken during 2014 by registered valuers was estimated as follows:
Fair value of freehold land and buildings 248 547 248 547
A register of freehold land and buildings is available for inspection at the registered office of the group.
There are no significant properties or equipment to which title is restricted or which are pledged as security for liabilities.
9. Intangible assets
GROUP
31 December 2016 31 December 2015
CostAccumulated amortisation
Carrying value Cost
Accumulatedamortisation
Carryingvalue
Computer software 361 160 (14 045) 347 115
Total 361 160 (14 045) 347 115
Reconciliation of intangible assets
Opening balance Additions Disposals Transfers Amortisation
Closing balance
Group2016Computer software 361 160 (14 045) 347 115
Total 361 160 (14 045) 347 115
10. Ordinary share capital
GROUP COMPANY
2016N$’000
2015N$’000
2016N$’000
2015N$’000
10.1 Authorised100 000 000 (2014: 100 000 000)
ordinary shares of 1 cent each 1 000 1 000 1 000 1 000 10.2 Issued
100 000 000 (2014: 100 000 000) ordinary shares of 1 cent each 1 000 1 000 1 000 1 000

66
11. Ordinary share premium
GROUP COMPANY
2016N$’000
2015N$’000
2016N$’000
2015N$’000
Share premium on issue of shares 442 234 442 234 442 234 442 234
12. Trading liabilitiesRepurchase and other collateralised agreements 151 127
151 127
13. Deferred taxation assets13.1 Deferred tax analysis
Property, equipment and intangible assets (92 772) (55 435)Assets on lease (9 701) (9 594)Fair value adjustments included in available-for-
sale reserves under equity 2 974 8 387Impairment charges on loans and advances 31 970 47 354Post-employment benefits 36 041 34 745Provisions and other differences 23 678 21 624
Net deferred tax closing balance (7 810) 47 081
Deferred tax asset 91 930 102 621Deferred tax liabilities (99 740) (55 540)
13.2 Deferred tax reconciliationNet deferred tax balance at beginning of the year 47 081 46 769Various categories of originating/(reversing)
temporary differences for the year (54 891) 312
Property, equipment and intangible assets (37 337) (7 262)Assets on lease (107) 1 351Fair value adjustments included in available-for-
sale reserves under equity (5 413) 7 956Impairment charges on loans and advances (15 384) 6 821Post-employment benefits 1 296 3 382Provisions and other differences 2 054 (11 936)
Net deferred tax balance at end of the year (7 810) 47 081
Temporary differences for the year comprise:Recognised in profit or loss (49 477) (7 644)
Recognised in other comprehensive income (5 413) 7 956
Deferred tax gain/(loss) (54 891) 312
ANNUAL FINANCIAL STATEMENTS Notes to the annual financial statements continued

SBN Holdings Limited Annual report 2016 67
14. Deposit and current accounts
GROUP COMPANY
2016N$’000
2015N$’000
2016N$’000
2015N$’000
Deposits from banks 244 117 140 155 Deposits from customers 21 027 603 18 045 363
Current accounts 3 812 644 3 510 234 Cash management deposits 5 974 501 3 409 721 Card creditors 31 104 31 310 Call deposits 4 686 373 4 594 668 Savings accounts 563 027 939 765 Term deposits 1 761 682 1 316 776 Negotiable certificates of deposit 4 198 272 4 242 889
21 271 720 18 185 518
15. Debt securities issued
Maturity date
Carrying value
Notional value
Carrying value
Notional value
2016N$’000
2016N$’000
2015N$’000
2015N$’000
GroupSBKN16 2016/07/07 104 590 99 500SBKN17 2017/10/23 198 099 194 900 202 879 200 000SBKN18 2018/07/11 310 270 303 780 340 505 333 000SBNA22 2021/05/24 504 555 499 800SBNA23 2019/05/24 100 599 100 000SBKN24 2024/10/23 101 726 100 000 101 726 100 000
1 215 249 1 198 480 749 700 732 500
The difference between the carrying amount and notional value represents transaction costs in the initial carrying amount and accrued interest.
16. Provisions and other liabilities
GROUP COMPANY
2016N$’000
2015N$’000
2016N$’000
2015N$’000
Staff-related accruals 91 744 75 280 Obligation toward post-employment benefits 112 627 108 579 Other liabilities and accruals 294 317 500 387 2 969 6 330
498 688 684 246 2 969 6 330

68
17. Classification of assets and liabilities Accounting classifications and fair values of assets and liabilities The table below sets out the bank’s classification of financial assets and liabilities, and their fair values.
Note
Held-for-tradingN$’000
Designatedat fair value
N$’000
Group2016AssetsCash and balances with central banks 1Derivative assets 2 55 497Trading assets 3 291 426Financial investments 4 1 370 840Loans and advances to banks 5Loans and advances to customers 5Assets in group companies and joint ventures 7Other non-financial assetsOther financial assets
346 923 1 370 840
LiabilitiesDerivative liabilities 2 50 412Trading liabilities 12 151 127Deposit and current accounts from banks 14Deposit and current accounts from customers 14Debt securities issued 15Loans from group companies 7Other non-financial liabilitiesOther financial liabilities
201 539
2015AssetsCash and balances with central banks 1Derivative assets 2 168 413Trading assets 3 313 679Financial investments 4 1 109 984Loans and advances to banks 5Loans and advances to customers 5Assets in group companies and joint ventures 7Other non-financial assetsOther financial assets
482 092 1 109 984
LiabilitiesDerivative liabilities 2 231 473Deposit and current accounts from banks 14Deposit and current accounts from customers 14Debt securities issued 15Loans from group companies 7Other financial liabilities
231 473
ANNUAL FINANCIAL STATEMENTS Notes to the annual financial statements continued

SBN Holdings Limited Annual report 2016 69
Loans andreceivables
N$’000
Available-for-saleN$’000
Otheramortised
costN$’000
Other non-financial
assets/liabilities N$’000
TotalcarryingamountN$’000
Fairvalue
N$’000
1 359 873 1 359 873 1 359 87355 497 55 497
291 426 291 4261 740 701 3 111 541 3 111 541
511 114 511 114 511 11418 887 656 18 887 656 18 949 892
1 599 372 6 725 1 606 097 1 606 097784 150 784 150 946 752
605 694 605 694 605 694
22 963 709 1 740 701 790 875 27 213 048 27 832 869
50 412 50 412151 127 151 127
244 117 244 117 244 11721 027 603 21 027 603 21 027 603
1 215 249 1 215 249 1 256 4571 228 080 1 228 080 1 228 080
7 810 7 810 7 810498 688 498 688 498 688
24 213 737 7 810 24 423 086 24 464 294
923 516 923 516 923 516168 413 168 413313 679 313 679
2 270 863 3 380 847 3 380 847373 097 373 097 373 097
17 019 334 17 019 334 16 911 926807 643 4 431 812 074 812 074
437 714 437 714 601 925563 441 563 441 563 441
19 687 031 2 270 863 442 145 23 992 115 24 048 918
231 473 231 473140 155 140 155 140 155
18 045 363 18 045 363 18 045 363749 700 749 700 760 992
1 642 526 1 642 526 1 642 526684 246 684 246 684 246
21 261 990 21 493 463 21 504 755

70
17. Classification of assets and liabilities continued Accounting classifications and fair values of assets and liabilities continued
Note
Held-for-tradingN$’000
Designatedat fair value
N$’000
Company2016AssetsAssets in group companies and joint ventures 7Other financial assets
LiabilitiesLoans from group companies 7Other financial liabilities
2015AssetsAssets in group companies and joint ventures 7
LiabilitiesLoans from group companies 7Other financial liabilities
ANNUAL FINANCIAL STATEMENTS Notes to the annual financial statements continued

SBN Holdings Limited Annual report 2016 71
Loans andreceivables
N$’000
Available-for-saleN$’000
Otheramortised
costN$’000
Other non-financial
assets/liabilities N$’000
TotalcarryingamountN$’000
Fairvalue
N$’000
838 809 838 809 838 809250 250 250
52 790 52 790 52 7902 969 2 969 2 969
55 759 55 759 55 759
818 868 818 868 575 995
50 532 50 532 50 5326 330 6 330 6 330
56 862 56 862 56 862

72
18. Financial assets and liabilities at fair value18.1 Financial assets and liabilities measured at fair value The table below sets out the financial assets and liabilities measured at fair value for the bank.
NoteLevel 1N$’000
Level 2N$’000
Level 3N$’000
TotalN$’000
Group2016AssetsDerivative assets 2 55 497 55 497Trading assets 3 291 426 291 426Financial investments 4 154 134 2 957 407 3 111 541
445 560 3 012 904 3 458 464
LiabilitiesDerivative liabilities 2 50 412 50 412Trading liabilities 12 151 127 151 127
151 127 50 412 201 539
2015AssetsDerivative assets 2 168 413 168 413Trading assets 3 313 679 313 679Financial investments 4 310 585 3 070 262 3 380 847
624 264 3 238 675 3 862 939
LiabilitiesDerivative liabilities 2 231 473 231 473
231 473 231 473
Valuation technique Inputs Valuation level
DerivativesOptions The Black-Scholes model and
discounted cash flow model or a combination of both
Market discount rate and curves
Spot prices of the underlying and correlation factors
Standard derivative contracts are valued using
Level 2
Swaps Discounted cash flow model Market discount rate and curves
Spot prices of the underlying
used to calculate Level 2
Forward agreements
Discounted cash flow model Market discount rate and curves
Spot prices of the underlying
used to calculate Level 2
Financial investments and trading securitiesTreasury bills
Discounted cash flow model Market discount rate and curves
Interest rate curve cash flows are Level 2
Money market funds
Discounted cash flow model Market discount rate and curves
JIBAR rate + spread
cash flows are Level 2
LiabilitiesNCDs Discounted cash flow model Market discount
rate and curvesJIBAR rate + spread
cash flows are Level 2
Promissory notes
Discounted cash flow model Market discount rate and curves
JIBAR rate + spread
cash flows are Level 2
ANNUAL FINANCIAL STATEMENTS Notes to the annual financial statements continued

SBN Holdings Limited Annual report 2016 73
18. Financial assets and liabilities at fair value continued18.2 Assets and liabilities not measured at fair value for which the fair value is disclosed Fair value hierarchy of items for which fair value is disclosed
NoteLevel 1N$’000
Level 2N$’000
Level 3N$’000
TotalN$’000
Group2016AssetsCash and balances with central banks 1 1 359 873 1 359 873Loans and advances to banks 5 511 114 511 114Loans and advances to customers 5 18 949 891 18 949 891Assets in group companies 7 1 606 097 1 606 097Property, plant and equipment 8 248 547 146 437 394 984Intangible assets 9 347 115 347 115
1 359 873 21 315 649 493 552 23 169 074
LiabilitiesDeposits from banks 14 244 117 244 117Deposits from customers 14 21 027 603 21 027 603Debt securities issued 15 1 256 457 1 256 457Loans from group companies 7 1 228 080 1 228 080
1 500 574 22 255 683 23 756 257
2015AssetsCash and balances with central banks 1 923 516 923 516Loans and advances to banks 5 373 097 373 097Loans and advances to customers 5 16 911 926 16 911 926Assets in group companies 7 812 074 812 074Property, plant and equipment 8 248 547 314 894 563 441
923 516 18 345 644 314 894 19 584 054
LiabilitiesDeposits from banks 14 140 155 140 155Deposits from customers 14 18 045 363 18 045 363Debt securities issued 15 760 992 760 992Loans from group companies 7 1 642 526 1 642 526
901 147 19 687 889 20 589 036
Company2016AssetsAssets in group companies 7 838 809 838 809
838 809 838 809
LiabilitiesLoans from group companies 7 52 790 52 790
52 790 52 790
2015AssetsAssets in group companies 7 575 995 575 995
575 995 575 995
LiabilitiesLoans from group companies 7 50 355 50 355
50 355 50 355

74
18. Financial assets and liabilities at fair value continued18.2 Assets and liabilities not measured at fair value for which the fair value is disclosed continued
The hierarchy of levels is explained below:
Level 1: Quoted unadjusted prices in active markets for identical assets or liabilities that the company can access at measurement date.
Level 2: Inputs other than quoted prices included in level 1 that are observable for the asset or liability either directly or indirectly.
Level 3: Unobservable inputs for the asset or liability.
InstrumentValuation technique
Observable inputs
Description of valuation and main assumption Level
Derivatives
Options The Black-Scholes model and discounted cash flow model or a combination of both
Market discount rate and curves
Spot prices of the underlying and correlation factors
Standard derivative contracts are valued using market accepted models and quoted parameter inputs
Level 1
Swaps Discounted cash flow model
Market discount rate and curves
Spot prices of the underlying
A forward curve is used to calculate future cash flows and then discounted using a discount curve over the contractual period
Level 1
Forward agreements
Discounted cash flow model
Market discount rate and curves
Spot prices of the underlying
A forward curve is used to calculate future cash flows and then discounted using a discount curve over the contractual period
Level 1
Financial investments and trading securities
Bonds Discounted cash flow model
Market discount rate and curves
Interest rate curve
Future cash flows are discounted using a market-related interest rate
Level 1
Treasury bills Discounted cash flow model
Market discount rate and curves
Interest rate curve
Future cash flows are discounted using a market-related interest rate
Level 2
Money market funds
Discounted cash flow model
Market discount rate and curves
JIBAR rate + spread
Future cash flows are discounted using a market-related interest rate
Level 2
Liabilities
NCDs Discounted cash flow model
Market discount rate and curves
JIBAR rate + spread
Future cash flows are discounted using a market-related interest rate
Level 2
Bonds Discounted cash flow model
Market discount rate and curves
JIBAR rate + spread
Future cash flows are discounted using a market-related interest rate
Level 1
Promissory notes
Discounted cash flow model
Market discount rate and curves
JIBAR rate + spread
Future cash flows are discounted using a market-related interest rate
Level 2
Short Bonds Discounted cash flow model
Market discount rate and curves
Interest rate curve
Future cash flows are discounted using a market-related interest rate
Level 1
ANNUAL FINANCIAL STATEMENTS Notes to the annual financial statements continued

SBN Holdings Limited Annual report 2016 75
19. Financial instruments subject to offsetting, enforceable master netting arrangements or similar agreements
IFRS requires a financial asset and a financial liability to be offset and the net amount presented in the statement of financial position when, and only when, the group and company has a current legally enforceable right to set off recognised amounts, as well as the intention to settle on a net basis or to realise the asset and settle the liability simultaneously. There are no instances in 2016 where the group and company have a current legally enforceable right to offset without the intention to settle on a net basis or to realise the asset and settle the liability simultaneously.
The following table sets out the impact of offset, as well as the required disclosures where financial assets and financial liabilities that are subject to enforceable master netting arrangements or similar agreements, irrespective of whether they have been offset in accordance with IFRS.
It should be noted that the information below is not intended to represent the group and company’s actual credit exposure, nor will it agree to that presented in the statement of financial position.
Grossamount ofrecognised
financialassets1
N$'000
Grossamount ofrecognised
financialliabilities
set off in thestatement
of financialposition2
N$'000
Net amountof financial
assetssubject to
offsetN$'000
Financialcollateraland cash collateralreceived3
N$'000
Net amountN$'000
GroupAssets4
2016Derivative assets 55 497 55 497 (55 497)Loans and advances 20 521 779 (1 123 009) 19 398 770 (17 285 070) 2 113 700
2015Derivative assets 168 413 168 413 (168 413)Loans and advances 18 080 028 (687 597) 17 392 431 (15 301 871) 2 090 560
1 Gross amounts are disclosed for recognised financial assets and financial liabilities that are either offset in the statement of financial position or subject to a master netting arrangement or a similar agreement, irrespective of whether the IFRS offsetting criteria is met.
2 The amounts that qualify for offset in accordance with the criteria per IFRS. 3 Related amounts not offset in the statement of financial position, that are subject to a master netting arrangement or similar agreement, including
financial collateral (whether recognised or unrecognised) and cash collateral. In most cases, the group and company is allowed to sell or repledge collateral received.
4 The most material amounts offset in the statement of financial position pertain to cash management accounts. The cash management accounts allow holding companies (or central treasury functions) to manage the cash flows of its group by linking the current accounts of multiple legal entities within a group. This allows for cash balances of the different legal entities to be offset against each other to arrive at a net balance for those groups. The cash management accounts are offset in the statement of financial position in terms of IFRS.
5 Related amounts not offset in the statement of financial position that are subject to a master netting arrangement or similar agreement, including financial (whether recognised or unrecognised) and cash collateral. In most instances, the counterparty may not sell or repledge collateral pledged by the group and company.
* All items in the tables’ respective line items have been measured on a consistent basis.

76
19. Financial instruments subject to offsetting, enforceable master netting arrangements or similar agreements continued
Gross amount of recognised
financialliabilities1
N$'000
Grossamount ofrecognised
financialassets
set off in thestatement of
financialposition2
N$'000
Net amountof financial
liabilitiessubject to
offsetN$'000
Financialcollateraland cashcollateral
pledged5
N$'000
NetamountN$'000
GroupLiabilities4
2016Deposits and current accounts (22 394 729) 1 123 009 (21 271 720) (21 271 720)Derivative liabilities (50 412) (50 412) 50 412
2015Deposits and current accounts (18 873 115) 687 597 (18 185 518) (18 185 518)Derivative liabilities (231 473) (231 473) 231 473
1 Gross amounts are disclosed for recognised financial assets and financial liabilities that are either offset in the statement of financial position or subject to a master netting arrangement or a similar agreement, irrespective of whether the IFRS offsetting criteria is met.
2 The amounts that qualify for offset in accordance with the criteria per IFRS. 3 Related amounts not offset in the statement of financial position, that are subject to a master netting arrangement or similar agreement, including
financial collateral (whether recognised or unrecognised) and cash collateral. In most cases, the group and company is allowed to sell or repledge collateral received.
4 The most material amounts offset in the statement of financial position pertain to cash management accounts. The cash management accounts allow holding companies (or central treasury functions) to manage the cash flows of its group by linking the current accounts of multiple legal entities within a group. This allows for cash balances of the different legal entities to be offset against each other to arrive at a net balance for those groups. The cash management accounts are offset in the statement of financial position in terms of IFRS.
5 Related amounts not offset in the statement of financial position that are subject to a master netting arrangement or similar agreement, including financial (whether recognised or unrecognised) and cash collateral. In most instances, the counterparty may not sell or repledge collateral pledged by the group and company.
* All items in the tables’ respective line items have been measured on a consistent basis.
The table below sets out the nature of the agreements and the types of rights relating to items which do not qualify for offset but that are subject to a master netting agreement or similar agreement.
NATURE OF AGREEMENT RELATED RIGHTS
Derivative assets and liabilities
ISDAs The agreement allows for offset in the event of default
Loans and advances to banks
Customer agreement and Banks Act
In the event of liquidation or bankruptcy, offset shall be enforceable subject to the Banks Act requirements being met
Deposit and current accounts
Customer agreement and Banks Act
In the event of liquidation or bankruptcy, offset shall be enforceable subject to the Banks Act requirements being met
ANNUAL FINANCIAL STATEMENTS Notes to the annual financial statements continued

SBN Holdings Limited Annual report 2016 77
20. Maturity analysis of assets The table below sets out the maturity analysis of financial assets.
Note
Overnight balances
N$’000
Maturingwithin 1 year
N$’000
Maturingafter 1 year
N$’000UndatedN$’000
TotalN$’000
Group2016Cash and balances
with central banks 1 1 359 873 1 359 873Derivative assets 2 55 497 55 497Trading assets 3 132 475 158 951 291 426Financial investments 4 1 779 349 115 486 1 216 706 3 111 541Loans and advances to banks 5 511 114 511 114Loans and advances to
customers 5 2 851 351 4 582 611 10 547 808 905 886 18 887 656Assets in group companies
and joint ventures 7 1 599 372 6 725 1 606 097Other non-financial assets 42 051 742 099 784 150Other financial assets 605 694 605 694
8 839 228 4 954 596 11 296 632 2 122 592 27 213 048
2015Cash and balances with central
banks 1 694 135 229 381 923 516Derivative assets 2 168 413 168 413Trading assets 3 25 298 566 15 088 313 679Financial investments 4 1 966 868 303 994 1 109 985 3 380 847Loans and advances to banks 5 373 097 373 097Loans and advances to
customers 5 2 211 057 3 666 629 11 338 958 (197 310) 17 019 334Assets in group companies
and joint ventures 7 807 643 4 431 812 074Other non-financial assets 575 437 139 437 714Other financial assets 563 441 563 441
4 649 398 6 101 051 12 328 991 912 675 23 992 115
Company2016Assets in group companies
and joint ventures 7 838 809 838 809Other financial assets 250 250
839 059 839 059
2015Assets in group companies
and joint ventures 7 818 868 818 868
818 868 818 868

78
21. Maturity analysis of liabilities
Redeemableon demand
N$’000
Maturing within
1 monthN$’000
Maturingbetween
1 – 6 months N$’000”
Maturingbetween
6 – 12 monthsN$’000
Maturing after
12 months N$’000
Total N$’000
2016LiabilitiesDerivative liabilities 17 541 25 322 7 549 50 412Trading liabilities 151 127 151 127Deposits and current
accounts 13 981 351 755 925 3 899 021 1 450 692 1 184 730 21 271 720Loans from group
companies 61 454 1 166 676 1 228 080Debt issued securities 198 099 1 017 150 1 215 249Others liabilities 498 688 498 688
15 708 119 773 467 3 924 343 1 656 340 2 353 007 24 415 276
Unrecognised financial instruments
Letter of credit and bankers’ acceptances 322 1 578 1 900
Financial guarantees 28 462 13 308 48 136 90 361 1 956 218 2 136 486Unutilised borrowing
facilities 3 528 852 3 528 852
3 557 314 13 630 49 714 90 361 1 956 218 5 667 237
2015LiabilitiesDerivative liabilities 42 316 179 370 9 787 231 473Deposits and current
accounts 12 635 233 364 224 2 394 006 1 612 209 1 179 847 18 185 518Loans from group
companies 1 642 526 1 642 526Debt issued securities 104 590 645 110 749 700Others liabilities 684 246 684 246
14 962 005 406 540 2 573 375 1 726 586 1 824 957 21 493 463
Unrecognised financial instruments
Letter of credit and bankers’ acceptances 6 684 36 813 43 498
Financial guarantees 673 949 41 739 142 643 438 586 869 054 2 165 971Unutilised borrowing
facilities 3 189 833 3 189 833
3 863 782 48 423 179 457 438 586 869 054 5 399 302
ANNUAL FINANCIAL STATEMENTS Notes to the annual financial statements continued

SBN Holdings Limited Annual report 2016 79
22. Contingent liabilities and commitments
GROUP COMPANY
2016N$'000
2015N$'000
2016N$'000
2015N$'000
22.1 Contingent liabilitiesLetters of credit 1 900 43 498Guarantees 2 136 486 2 165 971Unutilised borrowing facilities1 3 528 852 3 189 833
5 667 237 5 399 302
1 Undrawn facilities are conditionally cancellable.
22.2 Capital commitmentsContracted capital expenditure 11 802 2 973
The expenditure will be funded from internal resources.
22.3 Operating lease commitmentsOperating leases are:Properties:Within one year 44 844 37 723After one year but within five years 60 190 62 577
105 035 100 300
EquipmentWithin one year 998 444After one year but within five years 709 695
1 707 1 139
These commitments comprise a number of separate operating leases in relation to property and equipment, none of which is individually significant to the group. .
22.4 Legal proceedings In the conduct of its ordinary course of business, the group is involved in litigation, lawsuits and other proceedings
relating to alleged errors and omissions, or receives claims arising from the conduct of its business which can require the group to engage in legal proceedings in order to enforce and/or defend its rights.
While recognising the inherent difficulty of predicting the outcome of defended legal proceedings, management believes, based upon current knowledge and after consulting with legal counsel, that the legal proceedings currently pending against it should not have a material adverse effect on the consolidated financial position. The directors are satisfied, based on present information and the assessed probability of claims eventuating, that the group has adequate insurance programmes and provisions in place to meet such claims.

80
23. Interest income
GROUP COMPANY
2016N$’000
2015N$’000
2016N$’000
2015N$’000
Interest on loans and advances and investments 2 268 283 2 025 992
2 268 283 2 025 992
Comprising:Interest income on financial assets not carried
at fair value through profit and loss 2 268 283 2 025 992
2 268 283 2 025 992
24. Interest expenseCurrent accounts 2 423 1 776 Savings and deposit accounts 61 434 75 990 Other interest-bearing liabilities 999 088 800 677
1 062 945 878 443
Comprising:Interest expense on financial liabilities valued at
fair value through profit and loss 137 343 117 309 Interest expense on financial liabilities not valued
at fair value through profit and loss 925 602 761 134
Total interest expense 1 062 945 878 443
25. Fee and commission revenueAccount transaction fees 379 936 470 495 Card-based commission 129 240 104 081 Electronic banking fees 193 038 30 913 Foreign currency service fees 10 569 15 361 Documentation and administration fees 72 511 66 131 Other 88 880 76 543
874 174 763 524
All fee and commission revenue reported above relates to financial assets or liabilities not carried at fair value through profit or loss for the bank.
26. Fee and commission expensesAccount transaction fees 83 762 64 299 Card-based commission 69 160 54 690 Electronic banking fees 5 226 5 686
158 148 124 675
All fee and commission expenses reported above relate to financial assets or liabilities not carried at fair value through profit or loss for the bank.
ANNUAL FINANCIAL STATEMENTS Notes to the annual financial statements continued

SBN Holdings Limited Annual report 2016 81
27. Trading revenue
GROUP COMPANY
2016N$’000
2015N$’000
2016N$’000
2015N$’000
Foreign exchange 93 452 119 221 Net fair value adjustments on held-for-trading
financial assets 27 604 17 825
121 056 137 046
28. Other revenueFair value adjustments on designated at fair value
financial assets 4 198 4 123 Property-related revenue 411 239 Other non-banking-related revenue 44 675 36 977 5 340 Dividends on unlisted financial investments 44 463 40 147 278 631 243 673
93 747 81 486 283 971 243 673
29. Credit impairment chargesNet credit impairments raised for loans
and advances 130 487 117 311 Recoveries on loans and advances previously
written off (39 554) (32 002)
90 933 85 309
Comprising:Net specific credit impairment charges 85 680 87 398
Specific credit impairment charges 125 234 119 400 Recoveries on loans and advances
previously written off (39 554) (32 002)
Portfolio credit impairment (reversals)/charges (note 5) 5 252 (2 089)
90 933 85 309

82
30. Operating expenses
GROUP COMPANY
2016N$’000
2015N$’000
2016N$’000
2015N$’000
Auditors’ remuneration 3 991 4 032
Audit fees 3 330 3 494 Other services 661 538
Amortisation 14 045 Communication expenses 22 125 21 264 Depreciation 69 707 73 931 IT expenses 104 773 160 990 Lease rentals on operating lease 47 598 50 349 Professional fees 104 931 89 596 Profit on sale of property and equipment (4 332) (1 211)Premises costs 40 390 35 391 Staff costs 663 704 579 735
Salaries and allowances 601 742 517 656 Equity-settled share-based payments 2 673 6 481 Post-employment benefits – pension – defined
contribution plan 52 464 42 851 Post-employment benefits – medical expenses 6 825 12 747
Other expenses 204 719 155 648 177 177
1 271 651 1 169 725 177 177
31. Taxation31.1 Indirect taxation
Value added tax 19 487 16 624 Duties and other 5 293 1 242
24 780 17 866
31.2 Direct taxationNormal taxation 161 935 201 166
Current year charge 161 935 203 783 Prior year charge (2 617)
Deferred taxation 49 477 7 644
211 412 208 810
ANNUAL FINANCIAL STATEMENTS Notes to the annual financial statements continued

SBN Holdings Limited Annual report 2016 83
31. Taxation continued31.3 Tax attributable to components of other comprehensive income The tax (charge)/credit relating to components of other comprehensive income is as follows:
Before taxN$’000
Tax (charge)/credit
N$’000After tax
N$’000
2016Change in fair value of available-for-sale financial assets 16 915 (5 413) 11 502
16 915 (5 413) 11 502
2015Change in fair value of available-for-sale financial assets (24 860) 7 954 (16 906)
(24 860) 7 954 (16 906)
2016%
2015%
2016%
2015%
31.4 Namibian tax rate reconciliationThe total tax charge for the year as a percentage
of net income before indirect tax 30.4 30.2 Indirect taxation (3.2) (2.4)
Direct taxation charge for the year as a percentage of profit before indirect taxation 27.2 27.8
The charge for the year has been reduced as a consequence of:Dividends received 2.1 1.7 32.0 32.0 Other non-taxable income 2.1 1.3 Other non-deductible expenses 0.7 0.8 Prior year adjustment 0.4
Standard rate of Namibian tax 32.0 32.0 32.0 32.0
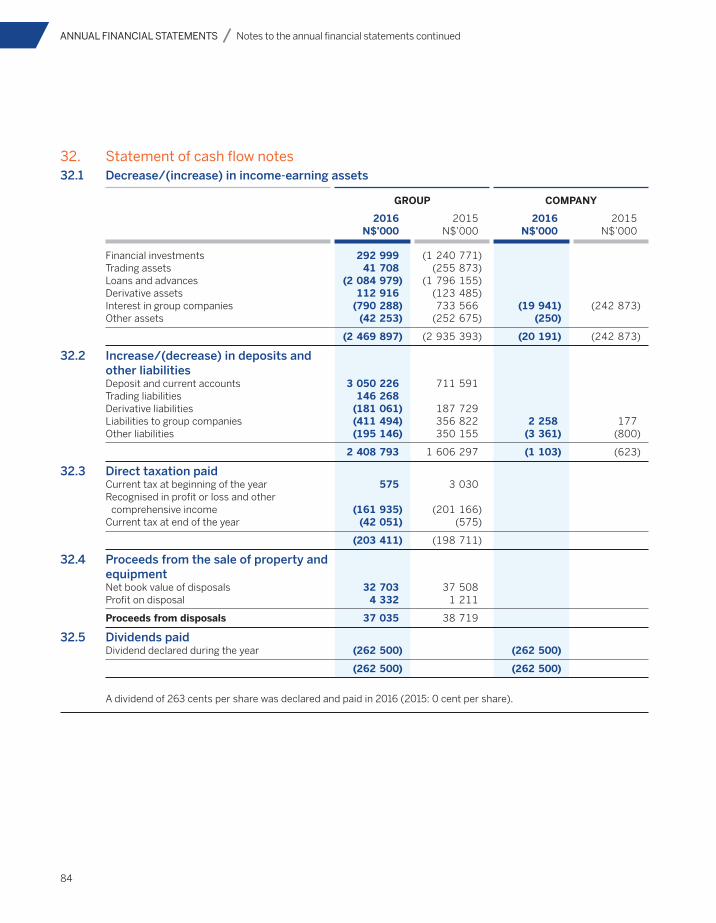
84
32. Statement of cash flow notes32.1 Decrease/(increase) in income-earning assets
GROUP COMPANY
2016N$’000
2015N$’000
2016N$’000
2015N$’000
Financial investments 292 999 (1 240 771)Trading assets 41 708 (255 873)Loans and advances (2 084 979) (1 796 155)Derivative assets 112 916 (123 485)Interest in group companies (790 288) 733 566 (19 941) (242 873)Other assets (42 253) (252 675) (250)
(2 469 897) (2 935 393) (20 191) (242 873)
32.2 Increase/(decrease) in deposits and other liabilitiesDeposit and current accounts 3 050 226 711 591Trading liabilities 146 268Derivative liabilities (181 061) 187 729Liabilities to group companies (411 494) 356 822 2 258 177Other liabilities (195 146) 350 155 (3 361) (800)
2 408 793 1 606 297 (1 103) (623)
32.3 Direct taxation paidCurrent tax at beginning of the year 575 3 030Recognised in profit or loss and other
comprehensive income (161 935) (201 166)Current tax at end of the year (42 051) (575)
(203 411) (198 711)
32.4 Proceeds from the sale of property and equipmentNet book value of disposals 32 703 37 508Profit on disposal 4 332 1 211
Proceeds from disposals 37 035 38 719
32.5 Dividends paidDividend declared during the year (262 500) (262 500)
(262 500) (262 500)
A dividend of 263 cents per share was declared and paid in 2016 (2015: 0 cent per share).
ANNUAL FINANCIAL STATEMENTS Notes to the annual financial statements continued

SBN Holdings Limited Annual report 2016 85
33. Post-employment benefits
GROUP COMPANY
2016N$’000
2015N$’000
2016N$’000
2015N$’000
Amounts recognised as liabilities in the statement of financial positionPost-employment healthcare benefit medical aid 112 627 108 579
Amounts recognised as expenses in profit and loss for the yearRetirement fund 11 475 42 851 Post-employment healthcare benefit – medical aid 6 825 12 747
18 300 42 851
33.1 Retirement fundAll eligible full-time employees are members of the Standard Bank Namibia Pension Fund, which has been registered in Namibia in accordance with the requirements of the Pension Funds Act. The fund is a defined contribution fund and is governed by the Pension Funds Act of 1956, and is actuarially valued every three years. An actuarial valuation was conducted as at 31 December 2016 and the actuary certified the fund as being financially sound as at that date. Members of the fund comprise 99% of the full-time staff. The contribution to the pension fund is based on a percentage of pensionable earnings and charged to income as incurred.
Employer’s contribution for the year 11 475 42 851
33.2 Post-employment healthcare benefitsPost-employment medical scheme The liability represents a post-employment healthcare benefit scheme that covers all employees who joined before 1 March 2009. The liability is unfunded and is valued every year using the projected unit credit method. The latest full statutory actuarial valuation was performed on 31 December 2016. The next actuarial valuation is to be performed on 31 December 2018.Movement in the present value of defined medical scheme benefit obligationBalance at beginning of the year 108 579 98 008 Current service cost 4 165 3 855 Interest cost 9 856 8 892 Remeasurement of post-employment benefit
obligations relating to change in financial and demographic assumptions (7 196)
Benefits paid (2 777) (2 176)
Balance at end of the year 112 627 108 579

86
33. Post-employment benefits continued33.2 Post-employment healthcare benefits continued
GROUP COMPANY
2016N$’000
2015N$’000
2016N$’000
2015N$’000
Consisting of:Present value of unfunded obligations 112 627 108 579 Unrecognised actuarial gains/losses
Obligation recognised in the statement of financial position 112 627 108 579
The amounts recognised in profit or loss are determined as follows:Current service cost 4 165 3 855 Interest cost 9 856 8 892 Remeasurement of post-employment benefit
obligations relating to change in financial and demographic assumptions (7 196)
Included in staff costs 6 825 12 747
The principal actuarial assumptions used for accounting purposes were:Discount rate 11.10% 9.18%Medical inflation 10.27% 8.82%Remaining service life of employees 19.5 years 20.9 yearsRetirement age 60 years 60 years
Mortality rates used: During employment: SA85-90 (Light) ultimate table Post-employment: PA (90) ultimate table rated down two years plus 1% improvement per annum (from a base year of 2006).
Current active employee members: Particulars in respect of the current employee members belonging to the medical scheme for which there is a post-retirement medical aid liability as at the investigation date are as follows:Number of employees 369 454Average age 40.5 years 39 years
Current pensioner members Details of the current pensioner members belonging to the medical aid fund are as follows:Number of employees 79 71Average age 65.9 years 67.8 years
ANNUAL FINANCIAL STATEMENTS Notes to the annual financial statements continued

SBN Holdings Limited Annual report 2016 87
33. Post-employment benefits continued33.2 Post-employment healthcare benefits continued Sensitivity analysis
Assumption Change in assumption
% change in obligation
GROUP COMPANY
2016 2015 2016 2015
Healthcare cost inflation: 1% increase 19.5 22.0
1% decrease (15.4) (17.1)Mortality rate PA (90)-1 3.5 3.7
The above sensitivity analyses are based on a change in an assumption while holding all other assumptions constant. In practice, this is unlikely to occur, and changes in some of the assumptions may be correlated. When calculating the sensitivity of the defined benefit obligation to significant actuarial assumptions, the same method (present value of the defined benefit obligation calculated with the projected unit credit method at the end of the reporting year) has been applied as when calculating the pension liability recognised within the statement of financial position.
Through its defined post-employment medical plan, the group is exposed to a number of risks, the most significant of which are detailed below:
Changes in bond yields A decrease in corporate bond yields will increase plan liabilities.
Inflation risk The group post-employment medical obligation is linked to inflation, and higher inflation will lead to higher liabilities.
Life expectancy The group post-employment medical obligation is to provide benefits for the life of the member, so an increase in life expectancy will result in an increase in the plan’s liabilities.

88
34. Related party transactions34.1 Parent SBN Holdings Limited is a subsidiary of Standard Bank Group Limited, SBG is both the parent and the ultimate
parent of SBN Holdings Limited.
34.2 Joint ventures Refer to note 7.3 for the investment in joint venture balance.
34.3 Key management personnel Key management personnel has been defined as directors of the group companies and executive management of
Standard Bank Namibia Holdings Limited. Non-executive directors are included in the definition of key management personnel as required by IFRS. The definition of key management includes the close members of family of key management personnel and any entity over which key management exercises control or joint control. Close members of family are those family members who may be expected to influence, or be influenced by, that person in their dealings with Standard Bank Namibia Holdings Limited. They may include the individual’s domestic partner and children, the children of the person’s domestic partner, and dependants of the individual or the individual’s domestic partner.
GROUP COMPANY
2016N$’000
2015N$’000
2016N$’000
2015N$’000
Key management compensationSalaries and other short-term benefits 27 594 27 373Post-employment benefits 2 169 1 962IFRS 2 value of share options and
rights expensed 213
29 763 29 548
The transactions below are entered into in the normal course of business
Loans and advancesLoans outstanding at beginning of the year 20 885 47 490Change in key management structures (5 284)Net loans granted during the year 9 630 (26 605)
Loans outstanding at end of the year 25 231 20 885
ANNUAL FINANCIAL STATEMENTS Notes to the annual financial statements continued

SBN Holdings Limited Annual report 2016 89
34. Related party transactions continued34.3 Key management personnel continued
GROUP COMPANY
2016N$’000
2015N$’000
2016N$’000
2015N$’000
Loans include mortgage loans, vehicle and asset finance and credit cards. No specific impairments have been recognised in respect of loans granted to key management in the current or prior year. The mortgage loans and vehicle and asset finance are secured by the underlying assets.
All other loans are unsecured
Deposits outstanding at beginning of the yearChange in key management structures 3 876 3 279Net deposits received during the year (1 339)Deposits outstanding at end of the year 553 597
Deposits outstanding at end of the year 3 090 3 876
Interest paidDeposits include cheque, current and savings accounts.
34.4 InvestmentsMutual funds 653 784 542 248
The Mutual funds are administered by Stanlib, a fellow subsidiary of the Standard Bank Group.
Relationship Type
GROUP
2016N$’000
2015N$’000
34.5 Purchase of servicesStanbic Africa Holdings Fellow subsidiary Royalty fees 62 607 60 402Stanbic Africa Holdings Fellow subsidiary Information technology 17 549 27 160Stanbic Africa Holdings Fellow subsidiary Licence fees 20 014 65 954Stanbic Africa Holdings Fellow subsidiary Other services (427) 405Standard Bank of South Africa Ltd Fellow subsidiary Training 10 16Namclear (Pty) Ltd Joint venture Interbank clearing costs 13 673 11 041
113 426 164 978

90
34. Related party transactions continued
Relationship Type
GROUP
2016N$’000
2015N$’000
34.6 Commissions and dividends received/(paid)Standard Bank of South Africa Ltd Fellow subsidiary Commission paid (14 988) (15 576)Standard Bank of South Africa Ltd Fellow subsidiary Commission received 19 384 13 976Standard Bank Group Parent company Dividends paid (236 250)Purros Investments Sister company Dividends paid (26 250)
(258 104) (1 600)
34.7 Interest income/(expense)Standard Bank of South Africa Ltd Fellow subsidiary Interest income 56 737 (59 822)Standard Bank of South Africa Ltd Fellow subsidiary Interest expense (58 654) 68 273
(1 917) 8 451
Contributions to fundsStandard Bank Namibia
Pension FundDefined contribution plan Contributions 11 475 42 851
Liberty Life Namibia Defined benefit plan Contributions 35 109 38 315
46 584 81 166
34.8 Related party year end balancesReceivables from related partiesStandard Bank of South Africa Ltd Fellow subsidiary Trading assets 150 522 277 022Standard Bank of South Africa Ltd Fellow subsidiary Loans and advances 1 441 833 520 996Stanbic Bank Botswana Ltd Fellow subsidiary Loans and advances 243 442Stanbic Bank Zambia Ltd Fellow subsidiary Loans and advances 45 362CfC Stanbic Bank Limited (Kenya) Fellow subsidiary Loans and advances 74 146Standard Bank of South Africa Ltd Fellow subsidiary Derivatives 40 971 63 304Standard Bank of South Africa Ltd Fellow subsidiary Other assets 7 519 9 511Stanlib (Pty) Ltd Fellow subsidiary Other liabilities (831) (831)Stanlib (Namibia) (Pty) Ltd Fellow subsidiary Other liabilities (33) (5)
1 640 343 870 947
The loans issued to subsidiaries and fellow subsidiaries are repayable on demand. Interest is charged based on the prevailing market rate. The loans are unsecured and the loans are fully performing.
Derivatives are carried at fair value.
Sundry receivables with subsidiaries and fellow subsidiaries are repayable on demand and attracts no interest.
ANNUAL FINANCIAL STATEMENTS Notes to the annual financial statements continued

SBN Holdings Limited Annual report 2016 91
34. Related party transactions continued 34.8 Related party year end balances continued
Relationship Type2016
N$’0002015
N$’000
Payables to related parties
Standard Bank of South Africa Ltd Fellow subsidiaryDeposit and current accounts 1 053 203 1 428 082
Stanbic Bank Botswana Ltd Fellow subsidiaryDeposit and current accounts 39 (8)
Stanbic Bank Zambia Ltd Fellow subsidiaryDeposit and current accounts 25
Standard Bank of South Africa Ltd Fellow subsidiary Derivatives 14 545 168 545Standard Bank of South Africa Ltd Fellow subsidiary Other liabilities 72 969 112 758Standard Bank of South Africa Ltd Fellow subsidiary Subordinated debt 101 844 101 694
1 242 625 1 811 071
Deposit and current accounts held with subsidiaries and fellow subsidiaries are repayable on demand. Interest is charged based on the prevailing market rate. Sundry payables with subsidiaries and fellow subsidiaries are repayable on demand and attracts no interest.
35. Equity-linked transactions35.1 Share-based payments The group’s share incentive schemes enable key management personnel and senior employees to benefit from the
performance of Standard Bank Group Limited and Liberty Holdings Limited shares.
GROUP COMPANY
2016N$’000
2015N$’000
2016N$’000
2015N$’000
Summary of the group and company’s share incentive schemes and expenses recognised in staff costs:Equity-settled share-based payments
(GSIS and Purros) 2 673 6 475 Cash-settled share-based payments (EGS) 6 Deferred bonus scheme 2012 (DBS 2012) 5 540 1 695
Total expense recognised in staff costs 8 213 8 176
Summary of the group and company’s share incentive schemes and expenses recognised in other expenses:Equity-settled share-based payments (GSIS and Purros) 7 800
Total expense recognised in other expenses 7 800
Summary of the liability recognised in other liabilities:Deferred bonus scheme 2012 (DBS 2012) 7 697 3 183
Total liability recognised in other liabilities 7 697 3 183

92
35. Equity-linked transactions continued35.2 Equity compensation plans The group has three equity compensation plans, namely the Group Share Incentive Scheme (GSIS), the Equity
Growth Scheme (EGS) and the Purros Share Scheme. The Group Share Incentive Scheme, which is equity-settled, confers rights to employees to acquire ordinary shares at the value of the SBG share price at the date the option is granted. The Equity Growth Scheme, which is cash-settled, was implemented in 2005 and represents appreciation rights allocated to employees. The eventual value of the right is effectively settled by the issue of shares equivalent in value to the value of the rights. The Purros Share Scheme, which is equity-settled, confers the right to employees to acquire ordinary shares in SBN Holdings at the date the option is granted.
The three schemes have five different sub-types of vesting categories as illustrated by the table below:
VESTING CATEGORIES YEAR % VESTING EXPIRY
Type A 3, 4, 5 50, 75, 100 10 Years
Type B 5, 6, 7 50, 75, 100 10 Years
Type C 2, 3, 4 50, 75, 100 10 Years
Type D 2, 3, 4 33, 67, 100 10 Years
Type E 3, 4, 5 33, 67, 100 10 Years
Purros 1.5, 2.5, 3.5 33, 67, 100
35.2.1 Equity-settled share-based payments Group Share Incentive Scheme A reconciliation of the movement of share options is detailed below:
Option pricerange (N$) Number of options
2016 2016 2015
Options outstanding at beginning of the year 126 488 191 538Exercised 62.39 – 111.94 (4 500) (62 625)Lapsed 62.39 – 111.94 (16 563) (12 425)Transferred In/(out) 62.39 – 92 (66 275) 10 000
Options outstanding at end of the year 39 150 126 488
Share options were exercised regularly throughout the year. The weighted average share price for the year was N$151.63 (2015: N$147.88).
ANNUAL FINANCIAL STATEMENTS Notes to the annual financial statements continued

SBN Holdings Limited Annual report 2016 93
35. Equity-linked transactions continued35.2 Equity compensation plans continued35.2.1 Equity-settled share-based payments continued The following options granted to employees, including executive directors, had not been exercised at 31 December 2016:
Number of ordinary shares
Option price range
N$
Weighted average price
N$ Option expiry year
2 000 98,00 98,00 Year to 31 December 201710 300 92,00 92,00 Year to 31 December 201815 600 62,39 62,39 Year to 31 December 2019
5 000 111,94 111,94 Year to 31 December 20206 250 98,80 98,80 Year to 31 December 2021
39 150
The following options granted to employees, including executive directors, had not been exercised at 31 December 2015:
Number of ordinary shares
Option price range
N$
Weighted average price
N$ Option expiry year
8 500 98,00 98,00 Year to 31 December 201727 500 92,00 92,00 Year to 31 December 201823 125 62,39 – 81,00 64,70 Year to 31 December 201921 250 111,94 111,94 Year to 31 December 202044 813 93,74 – 98,80 96,54 Year to 31 December 2021
125 188
Purros Share Scheme No options have vested as at 31 December 2016.
35.2.2 Cash-settled share-based payments Equity Growth Scheme A reconciliation of the movement of appreciation rights is detailed below:
Average pricerange (N$) Number of rights
2016 2016 2015
ReconciliationRights outstanding at beginning of the year 3 000 Exercised1 (3 000)Transferred out
Rights outstanding at end of the year2
1 During the year, 0 (2015: 0) SBG shares were issued to settle the appreciated rights value.2 At the end of the year, the group would need to issue 1 393 (2015: 1 393) SBG shares to settle the outstanding appreciated rights value.

94
35. Equity-linked transactions continued35.2 Equity compensation plans continued 35.2.2 Cash-settled share-based payments continued The Equity Growth Scheme rights are only awarded to individuals in employment of a group entity domiciled within
Namibia at the time that the award is made. The group is required to ensure that employees’ tax arising from benefits due in terms of the scheme is paid in accordance with the Income Tax Act of Namibia. Where employees have elected not to fund the tax from their own resources, the tax due is treated as a diminution of the gross benefits due under the scheme.
As at 31 December 2015 and 2016, there were no outstanding options.
35.3 Deferred bonus scheme (DBS) It is essential for the group to retain key skills over the longer term. This is done particularly through share-based
incentive plans. The purpose of these plans is to align the interests of the group, its subsidiaries and employees, as well as to attract and retain skilled, competent people.
The group has implemented a scheme to defer a portion of incentive bonuses over a minimum threshold for key management and executives. This improves the alignment of shareholder and management interests by creating a closer linkage between risk and reward, and also facilitates retention of key employees.
The purpose of the Deferred Bonus Scheme 2012 is to encourage a longer-term outlook in business decision making and closer alignment of performance with long-term value creation.
All employees granted an annual performance award over a threshold have part of their award deferred. The award is indexed to the group’s share price and accrues notional dividends during the vesting year, which are payable on vesting. The awards vest in three equal amounts at 18 months, 30 months and 42 months from the date of award. The final pay-out is determined with reference to the group’s share price on vesting date.
The provision in respect of liabilities under the scheme amounts to N$7 697 thousand at 31 December 2016 (2015: N$3 183 thousand) and the amount charged for the year was N$5 540 thousand (2015: N$1 695 thousand). The change in liability is due to the change in the group share price.
Units
2016 2015
Reconciliation Units outstanding at beginning of the year 25 686 20 624Granted 80 116 18 289Exercised (6 573) (9 693)Lapsed (9 492) (3 534)Transfers (57 940)
Units outstanding at end of the year 31 797 25 686
Weighted average fair value at grant date (N$) 127,59 156,96Expected life (years) 2,51 2,51
ANNUAL FINANCIAL STATEMENTS Notes to the annual financial statements continued
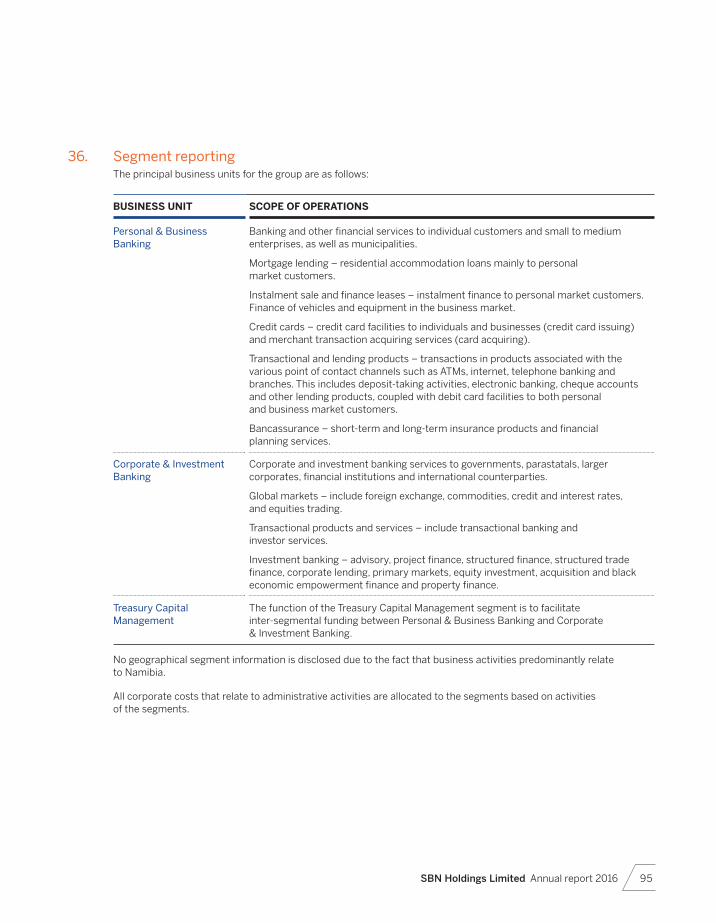
SBN Holdings Limited Annual report 2016 95
36. Segment reporting The principal business units for the group are as follows:
BUSINESS UNIT SCOPE OF OPERATIONS
Personal & Business Banking
Banking and other financial services to individual customers and small to medium enterprises, as well as municipalities.
Mortgage lending – residential accommodation loans mainly to personal market customers.
Instalment sale and finance leases – instalment finance to personal market customers. Finance of vehicles and equipment in the business market.
Credit cards – credit card facilities to individuals and businesses (credit card issuing) and merchant transaction acquiring services (card acquiring).
Transactional and lending products – transactions in products associated with the various point of contact channels such as ATMs, internet, telephone banking and branches. This includes deposit-taking activities, electronic banking, cheque accounts and other lending products, coupled with debit card facilities to both personal and business market customers.
Bancassurance – short-term and long-term insurance products and financial planning services.
Corporate & Investment Banking
Corporate and investment banking services to governments, parastatals, larger corporates, financial institutions and international counterparties.
Global markets – include foreign exchange, commodities, credit and interest rates, and equities trading.
Transactional products and services – include transactional banking and investor services.
Investment banking – advisory, project finance, structured finance, structured trade finance, corporate lending, primary markets, equity investment, acquisition and black economic empowerment finance and property finance.
Treasury Capital Management
The function of the Treasury Capital Management segment is to facilitate inter-segmental funding between Personal & Business Banking and Corporate & Investment Banking.
No geographical segment information is disclosed due to the fact that business activities predominantly relate to Namibia.
All corporate costs that relate to administrative activities are allocated to the segments based on activities of the segments.

96
36. Segment reporting continued
Personal & BusinessBanking
2016N$’000
2015N$’000
Net interest income 1 497 194 1 371 708 Inter-segment revenue (605 290) (456 374)Non-interest revenue 647 248 573 861
Total income 1 539 152 1 489 195 Credit impairments (84 569) (82 936)
Income after credit impairment charges 1 454 583 1 406 258 Operating expenses (999 929) (887 799)
Net income 454 654 518 460
Share of profits/(losses) from associates and joint ventures
Net income before indirect taxation 454 654 518 460 Indirect taxation (15 808) (14 594)
Profit before direct taxation 438 846 503 866 Direct taxation (128 096) (147 841)
Profit for the year 310 750 356 025
Operating informationTotal assets 16 682 688 14 903 952 Total liabilities 7 461 824 7 156 548
Other informationInvestment in associateDepreciation 34 375 35 253 Amortisation 1 567
ANNUAL FINANCIAL STATEMENTS Notes to the annual financial statements continued

SBN Holdings Limited Annual report 2016 97
Corporate & Investment Banking
Other services Total
2016N$’000
2015N$’000
2016N$’000
2015N$’000
2016N$’000
2015N$’000
(228 042) (160 320) (63 814) (63 838) 1 205 338 1 147 549 603 600 453 194 1 690 3 180 224 690 229 502 58 891 54 018 930 829 857 381
600 248 522 376 (3 233) (6 640) 2 136 167 2 004 930 (6 371) (2 373) 8 (0) (90 933) (85 309)
593 877 520 002 (3 225) (6 640) 2 045 234 1 919 621 (295 181) (282 040) 23 459 114 (1 271 651) (1 169 725)
298 695 237 962 20 233 (6 527) 773 583 749 896
2 295 1 311 2 295 1 311
298 695 237 962 22 528 (5 215) 775 878 751 207 (942) (3 271) (8 030) 0 (24 780) (17 865)
297 754 234 691 14 498 (5 215) 751 099 733 342 (80 110) (63 966) (3 206) 2 997 (211 412) (208 811)
217 644 170 725 11 292 (2 219) 539 687 524 531
10 265 196 9 314 186 265 354 (225 905) 27 213 052 23 992 117 17 100 848 14 529 635 (139 405) (192 839) 24 423 085 21 493 458
6 726 4 431 6 726 4 431 639 599 33 667 36 782 69 707 73 931 522 11 956 14 045

98
Annexure A – Subsidiaries
Nature of operation
Issued share capital
N$
Effective holding Net indebtedness
2016%
2015%
2016N$’000
2015N$’000
Standard Bank Namibia Limited Banking services 2 000 015 100 100 160 312 166 990
Standard Insurance Brokers (Namibia) (Pty) Limited
Insurance broking services 1 100 100
Stanfin (Namibia) (Pty) Limited
Insurance broking services 2 100 100
All subsidiaries are incorporated within Namibia. All subsidiary undertakings are included in the consolidation. The proportion of voting rights in the subsidiary undertakings held directly by the company does not differ from the proportion of ordinary shares held.
ANNUAL FINANCIAL STATEMENTS continued

SBN Holdings Limited Annual report 2016 99
Annexure B – Joint ventures
NAMCLEAR (PTY) LIMITED
Ownership structure Joint venture
Nature of business Clearing of interbank transactions
Principal place of business and country of incorporation Namibia
Year end December
Accounting treatment Equity accounted
Date to which equity accounted 30 November 2016
2016 2015
Effective holding (%) 25 25
N$’000 N$’000
Income statementTotal income 44 825 32 405 Total profit for the year 9 179 5 244 Total comprehensive income attributed to equity holders of the joint venture 9 179 5 244
Statement of financial positionCash and cash equivalents 22 482 12 003 Non-current assets 38 013 35 868 Current assets 28 178 3 925 Non-current liabilities (23 440) (25 276)Current liabilities (15 852) (8 797)Net asset value attributed to the equity holders of the associate 26 899 17 723
Proportion of net asset value based on effective holding 6 725 4 431 GoodwillCumulative impairment
Carrying value 6 725 4 431
Share of total comprehensive income from associates 2 294 1 311
Namclear has no quoted market price available for its shares.
There are no contingent liabilities relating to the bank’s interest in the joint venture. There are also no significant restrictions on the ability of joint ventures to transfer funds to Standard Bank Namibia in the form of cash dividends or repayments of loans or advances.

100
ANNUAL FINANCIAL STATEMENTS continued
business activities of the group have been managed within the board-approved risk appetite.
The board is satisfied that the group’s risk management processes operated effectively in the period under review.
REPORTING FRAMEWORK
All tables, diagrams, quantitative information and commentary in this risk and capital management report are unaudited unless stated as audited.
Sections forming part of the audited annual financial statementsSpecific information on risk and capital management integral to the audited annual financial statements can be found under the following sections of this risk and capital management report:
capital management, starting on page 108
credit risk, starting on page 111
liquidity risk, starting on page 123
market risk, starting on page 129.
Basel II disclosures apply at a Standard Bank Namibia level only and not at a banking group level. The capital and risk management information disclosed in these sections fulfils IFRS requirements together with Basel II pillar 3 requirements, as stated in Determination on Public Disclosures for Banking Institutions (BID-18) issued under the Banking Institutions Act of 1998.
Annexure CRisk and capital management
INTRODUCTION
Effective risk and capital management continues to be fundamental to the business activities of the group.
Risks are controlled at individual exposure level, as well as in aggregate within and across both business lines, legal entities and risk types.
Capital is managed using regulatory and economic capital metrics at both business line and legal entity level.
The group’s two business lines are PBB and CIB.
BOARD RESPONSIBILITY
The board has ultimate responsibility for risk and capital management. Various committees within the governance structure enable the board to evaluate the risks faced by the group and the effectiveness of the group’s management of these risks.
The board relies on quarterly reports from these committees, as well as periodic attestations by senior risk managers and internal audit, to satisfy itself that the group’s risk management processes are fit-for-purpose and are operating effectively. During the year under review, the
100 Introduction
100 Board responsibility
100 Reporting framework
101 Risk types
102 Risk management framework
102 Risk governance process
104 The group’s approach to risk appetite
105 The group’s approach to stress testing
Overview

SBN Holdings Limited Annual report 2016 101
such as expropriation, nationalisation and asset confiscation. Transfer and convertibility risk is an important element of cross-border country risk. Examples of transfer and convertibility events are exchange controls and foreign debt moratoria.
LIQUIDITY RISK
Liquidity risk arises when the group is unable to maintain or generate sufficient cash resources to meet its payment obligations as they fall due, or can only do so on materially disadvantageous terms.
This inability to maintain or generate sufficient cash resources occurs when counterparties who provide the group with funding withdraw or do not roll over that funding, or as a result of a general disruption in asset markets that renders normally liquid assets illiquid.
MARKET RISK
Market risk is the risk of a change in the market value, earnings (actual or effective) or future cash flows of a portfolio of financial instruments, including commodities, caused by movements in market variables such as equity, bond and commodity prices, currency exchange rates and interest rates, credit spreads, recovery rates, correlations and implied volatilities in all of these variables.
OPERATIONAL RISK
Operational risk is the risk of loss resulting from inadequate or failed internal processes, people and systems, or from external events. Reputational risk and strategic risk are, in line with general market convention, excluded from the definition of operational risk. Reputational risk is defined separately below. Strategic risk is included in the definition of business risk below.
BUSINESS RISK
Business risk is the risk of loss due to operating revenues not covering operating costs and is usually caused by the following:
inflexible cost structure
market-driven pressures, such as decreased demand, increased competition or cost increases
group-specific causes, such as a poor choice of strategy, reputational damage or the decision to absorb costs or losses to preserve reputation.
It includes strategic risk and post-retirement obligation risk.
RISK TYPES
The risk types that the group is exposed to are defined below. The definitions are consistent with those used in the risk taxonomy, a key component of the risk framework.
CREDIT RISK
Credit risk is the risk of loss arising out of the failure of counterparties to meet their financial or contractual obligations when due.
Credit risk comprises counterparty risk, settlement risk and concentration risk. These risk types are defined as follows:
Counterparty risk: The risk of credit loss to the group as a result of the failure by a counterparty to meet its financial and/or contractual obligations to the group. This risk type has three components:
• Primary credit risk: The exposure at default (EAD) arising from lending and related banking product activities, including their underwriting.
• Pre-settlement credit risk: The EAD arising from unsettled forward and derivative transactions where the group is acting in a principal capacity or as a clearer. This risk arises from the default of the counterparty to the transaction and is measured as the cost of replacing the transaction at current market rates.
• Issuer risk: The EAD arising from traded credit and equity products, including underwriting the issue of these products in the primary market.
Settlement risk: The risk of loss to the group from settling a transaction where value is exchanged, but where the group may not receive all or part of the countervalue.
Credit concentration risk: The risk of loss to the group as a result of excessive build-up of exposure to a specific counterparty or counterparty group, an industry, market, product, financial instrument or type of security, a country or geography, or a maturity. This concentration typically exists where a number of counterparties are engaged in similar activities and have similar characteristics, which could result in their ability to meet contractual obligations being similarly affected by changes in economic or other conditions.
COUNTRY RISK
Country risk is the risk of loss arising when political or economic conditions or events in a particular country inhibit the ability of counterparties in that country to meet their financial obligations to the group. Country risk events may include sovereign defaults, banking or currency crises, social instability and governmental policy changes or interventions

102
ANNUAL FINANCIAL STATEMENTS Annexure C Risk and capital management continued
issues to the BAC and BRC, as are decisions requiring board approval. The BAC and BRC accounts to the board in the same manner. The primary communication up the hierarchy is undertaken by the relevant committee chairman. Wherever regulations require noting or approval by the board committee, the regulations overrule any internal processes.
A similar process is adopted in relation to the SBN Holdings audit committee (BAC) where the reporting process commences at the level of the head: internal audit.
Board committeesBoard subcommittees responsible for effective risk management comprise the board audit committee (BAC), the board risk committee (BRC) and board credit committee (BCC). Key roles and responsibilities of these committees, as they relate to risk and capital management, are detailed in the sections that follow.
Board audit committeeThe BAC reviews the group’s financial position and makes recommendations to the board on all financial matters, risks, internal financial controls, fraud and IT risks relevant to financial reporting. In relation to risk and capital management, the BAC plays a crucial role in ensuring that the group’s internal financial controls are adequate to effectively and efficiently mitigate risks.
Board risk management committeeThe BRC provides independent and objective oversight of risk and capital management across the group by:
reviewing and providing oversight in respect of the adequacy and effectiveness of the group’s risk management framework
approving risk and capital management governance standards and policies
approving the group’s risk appetite statements and monitoring the group’s risk profile
monitoring and evaluating significant IT investment and expenditure.
Management committeesExcoExecutive management oversight for all risk types has been delegated by the board to exco which, in turn, assists the board to fulfil its mandate. Exco considers and, to the extent required, recommends for approval by the relevant board committees:
risk appetite statements
approval of macroeconomic scenarios for stress testing, stress testing results and scenario analyses
risk governance standards for each risk type
actions on the risk profile and/or risk tendency
risk strategy and key risk controls across the group ICAAP.
STRATEGIC RISK
Strategic risk is the risk that the group’s future business plans and strategies may be inadequate to prevent financial loss or protect the group’s competitive position and shareholder returns.
POST-RETIREMENT OBLIGATION RISK
The risk arises because the estimated value of the pension or medical liabilities might increase, the market value of the fund’s assets might decline or their investment returns might reduce.
REPUTATIONAL RISK
Reputational risk results from damage to the group’s image which may impair its ability to retain and generate business. Such damage may result from a breakdown of trust, confidence or business relationships.
RISK MANAGEMENT FRAMEWORK
The group’s risk management framework comprises the following components:
Risk governance committees at a board and management level
Management organisation structure to support the three lines of defence model as described on page 103
Risk governance standards as described on page 104
Policies to support the risk governance standards.
RISK GOVERNANCE PROCESS
The group’s risk governance process relies on both individual responsibility and collective oversight, supported by comprehensive and independent reporting. This approach balances strong corporate oversight at group level with participation by the senior executives of the group in all significant risk matters.
The governance committees are a key component of the risk management framework. They have clearly defined mandates and delegated authorities, which are reviewed regularly. Board subcommittees responsible for effective risk management comprise the board audit committee (BAC), the board risk committee (BRC) and board credit committee (BCC).
Material issues are escalated to exco, as are decisions requiring exco approval. Exco evaluates reports provided to it by its subcommittees and the head: risk, together with specific deep drill reports. Exco, in turn, escalates material

SBN Holdings Limited Annual report 2016 103
Three lines of defence modelThe group adopts the three lines of defence model which reinforces segregation of duties between and independence of various control functions.
The three lines of defence are described below.
FIRST LINE OF DEFENCE SECOND LINE OF DEFENCE THIRD LINE OF DEFENCE
CONSISTS OF
management of business lines and legal entities.
finance function
risk management function
legal function
governance and assurance function, excluding internal audit.
internal audit function (administratively part of governance and assurance).
RESPONSIBILITIES
measures, assesses and controls risks through the day-to-day activities of the business within the governance framework.
supports the governance framework
provides independent oversight of the first line of defence
reports to management and board governance committees.
supports the governance framework
provides independent assessment of first and second lines of defence
reports to BAC.
Second line of defence functionsThe second line of defence functions comprise various specialist functions which are set out below.
FINANCE FUNCTION
RISK MANAGEMENT FUNCTION
LEGAL FUNCTION
GOVERNANCE AND ASSURANCE FUNCTION
CONSISTS OF
treasury and capital management (TCM) function:
• capital management• liquidity risk• banking book interest
rate risk• business risk• portfolio management• group tax function• group financial control
function.
credit risk
country risk
market risk
operational risk, including business continuity and resilience
information risk management
integrated risk.
prudential, by geographic region
transactional, by product type.
governance office
financial crime control
sustainability management
compliance
occupational health and safety
physical security.
Each of these four functions has resources at both the centre and embedded within the business lines in Namibia. The central resources provide a groupwide governance framework for the specific function. The resources dedicated to the business lines support business line management in ensuring that business line-specific risks are effectively managed as close to the source as possible. Centre and embedded resources jointly address risk management at a legal entity level.

104
Risk tolerance: The maximum amount or type of risk the group is prepared to tolerate above risk appetite for short periods of time on the understanding that management action is taken to get back within risk appetite.
Risk capacity: The maximum amount of risk the group is able to support within its available financial resources.
Risk profile: The amount or type of risk the group holds at a specified point in time.
Risk tendency: The forward-looking view of how the group’s risk profile may change as a result of portfolio effects and/or changes in economic conditions. The changes in economic conditions may either be in the form of formally approved macroeconomic stress scenarios as part of the budgeting process or ad hoc stress scenarios.
The board establishes parameters for risk appetite by:
providing strategic leadership and guidance
reviewing and approving annual budgets and forecasts, under normal and stressed conditions, for the group, each business line and material legal entity
regularly reviewing and monitoring performance in relation to risk through quarterly board reports
analysing risk tendency against risk appetite.
The board delegates the determination of risk appetite to the BRC, which in turn ensures that risk appetite is in line with group strategy and the desired balance between risk and return.
Risk appetite at a group level is described by the following metrics which are supplemented by qualitative criteria:
changes in headline earnings
liquidity
regulatory capital
unacceptable risk.
These metrics are converted into:
portfolio limits, for example, concentrations, credit loss ratios and value-at-risk (VaR)
operational limits, for example, facilities by name
desk-specific limits across the relevant risk types.
Third line of defenceThe internal audit function, under the stewardship of the SBG chief audit officer and the SBNH head of internal audit, reports to and operates under a mandate from the BAC. In terms of this mandate, internal audit’s role is to provide independent and objective assurance, designed to add value and improve group operations. Internal audit has the authority to independently determine the scope and extent of work to be performed. All internal audit employees in the group report operationally to the chief audit officer and administratively to management in their country of residence.
Risk governance standardsThe specialist second line of defence functions maintain risk governance standards for each major risk type to which the group is exposed. The risk governance standards set out minimum control requirements and ensure alignment and consistency in the manner in which the major risk types and capital management metrics across the group are dealt with.
All governance standards are applied consistently across the group and are approved by the BAC. Supporting policies and procedures are implemented by the management team and monitored by the embedded risk resources.
Compliance with risk governance standards is controlled through annual self-assessments by the second line of defence and reviews by internal audit.
THE GROUP’S APPROACH TO RISK APPETITE
The following terms have specific meanings within the group.
Risk appetite: An expression of the amount or type of risk an entity is generally willing to take in pursuit of its financial and strategic objectives, reflecting its capacity to sustain losses and continue to meet its obligations as they fall due, under both normal and a range of stress conditions. Risk appetite could be exceeded either as a result of an adverse economic event more severe than that envisaged under the range of stress conditions (passive), or as a result of a decision to increase the risk profile to accommodate market, client or portfolio requirements (active).
ANNUAL FINANCIAL STATEMENTS Annexure C Risk and capital management continued

SBN Holdings Limited Annual report 2016 105
THE GROUP’S APPROACH TO STRESS TESTING
Stress testing is a key management tool within the group and facilitates a forward-looking perspective of the organisation’s risk profile or risk tendency. Stress tests are conducted at group, business line and material legal entity level.
Stress testing supports a number of business processes, including:
strategic planning and budgeting
capital planning and management, and the setting of capital buffers
liquidity planning and management
informing the setting of risk tolerance
providing a forward-looking assessment of the impact of stress conditions on the risk profile
identifying and proactively mitigating risks through actions such as reviewing and changing risk limits, limiting exposures and hedging
facilitating the development of risk mitigation or contingency plans across a range of stressed conditions
communicating with internal and external stakeholders.
Stress testing results inform decision making at the appropriate management levels, including strategic business decisions of the board and senior management.
Groupwide macroeconomic stress testing is conducted regularly across all major risk types for a range of common scenarios. This allows the group to monitor its risk profile and risk tendency against its risk appetite. This groupwide stress testing is augmented by portfolio-specific stress testing and sensitivity analyses to identify the drivers of risk tendency and necessary actions to constrain risk.
The appropriateness of the macroeconomic stress scenarios and the severity of the relevant scenarios used for capital planning are approved by the BRC.

106
These functions work collectively to achieve the objectives of capital management, which are to:
maintain sufficient capital resources to support:
• the group’s risk appetite and economic capital requirements
• the group’s internal target capital adequacy ratios• the BON’s minimum ratios set in accordance
with Basel II.
allocate capital to businesses using risk-based capital allocation to support the group strategic objectives, including optimising returns on economic and regulatory capital
maintain the group’s dividend policy and dividend declarations while taking into consideration shareholder and regulatory expectations
develop, review and approve short- to medium-term capital planning and stress testing.
REGULATORY CAPITAL
The group manages its capital base to achieve a prudent balance between maintaining capital levels to support business growth, maintaining depositor and creditor confidence, and providing competitive returns to shareholders.
Regulatory capital adequacy is measured through three risk-based ratios, namely:
tier I capital
total capital adequacy
tier I leverage ratio.
OBJECTIVES
The group’s capital management framework is designed to ensure that regulatory requirements are met at all times and that the group and Standard Bank Namibia are capitalised in line with the risk profile, economic capital standards and target ratios approved by the board.
The capital management functional pillar of TCM is structured into the following key functions:
Strategic capital management function: Key responsibilities are capital raising, advising on the dividend policy, facilitating capital allocation, risk-adjusted performance measurement (RAPM) and capital planning.
Portfolio analysis and reporting function: Key responsibilities are to own and manage the regulatory and economic capital results (and the systems used to produce the results), capital budgeting, reporting and analysis, and standardising data management processes across functions within TCM.
CIB and PBB capital management functions: Key responsibilities are to provide support on capital management matters such as deal pricing, key return measures and management of capital consumption against budgets.
ANNUAL FINANCIAL STATEMENTS Annexure C
106 Objectives
106 Regulatory capital
108 Economic capital
Capital management

SBN Holdings Limited Annual report 2016 107
During the year ended 31 December 2016 and the comparative year ended 31 December 2015, the group complied with all externally imposed capital requirements.
The main requirements are those specified in the determinations issued under the Banking Institutions Act of 1998 and related regulations which are broadly consistent with the Basel II guidelines issued by the Bank for International Settlements.
The group’s tier I capital was N$2 300 million at 31 December 2016 (2015: N$2 300 million) and total capital, including unappropriated profit was N$2 674 million at 31 December 2016 (2015: N$200 million). The change in the group’s capital was primarily due to an increase in retained earnings. The group maintained a well-capitalised position based on tier I capital, total capital adequacy and leverage ratios as set out below.
Tier I capital represents ordinary share capital, share premium and appropriated retained earnings. Total capital includes other items such as subordinated debt and the general allowance for credit impairments and unappropriated retained earnings. Tier I leverage ratio is defined as the ratio of total assets to tier I capital.
These ratios represent a measure of the capital supply relative to the total risk-weighted assets and are measured against internal targets and regulatory minimum requirements.
Risk-weighted assets are determined on a granular basis by using risk weights calculated from internally derived risk parameters. A portion of the group’s risk-weighted assets are calculated using the standardised regulatory approach.
Risk-weighted assets take the following into consideration:
both on- and off-balance sheet exposures are included in the group’s overall credit risk-weighted assets
risk-weighted assets for equity risk are modelled on the market-based and probability of default (PD)/loss given default (LGD) approaches
capital requirements for market risk and operational risk are converted into risk-weighted assets for the purpose of determining total risk-weighted assets
other assets are risk weighted in accordance with prescribed regulatory requirements.
BASEL II REGULATORY CAPITAL
GROUP BANK
2016N$’000
2015N$’000
2016N$’000
2015N$’000
Tier IOrdinary share capital and premium 443 234 443 234 593 230 593 230 Ordinary shareholders’ reserves 1 857 215 1 857 215 1 538 439 1 538 439
2 300 449 2 300 449 2 131 669 2 131 669
Tier IISubordinated debt 200 000 200 000 200 000 200 000 Current unappropriated profitsGeneral allowance for credit impairments 173 637 173 637 173 637 173 637
373 637 373 637 373 637 373 637
Total eligible capital (including unappropriated profits) 2 674 086 2 674 086 2 505 306 2 505 306
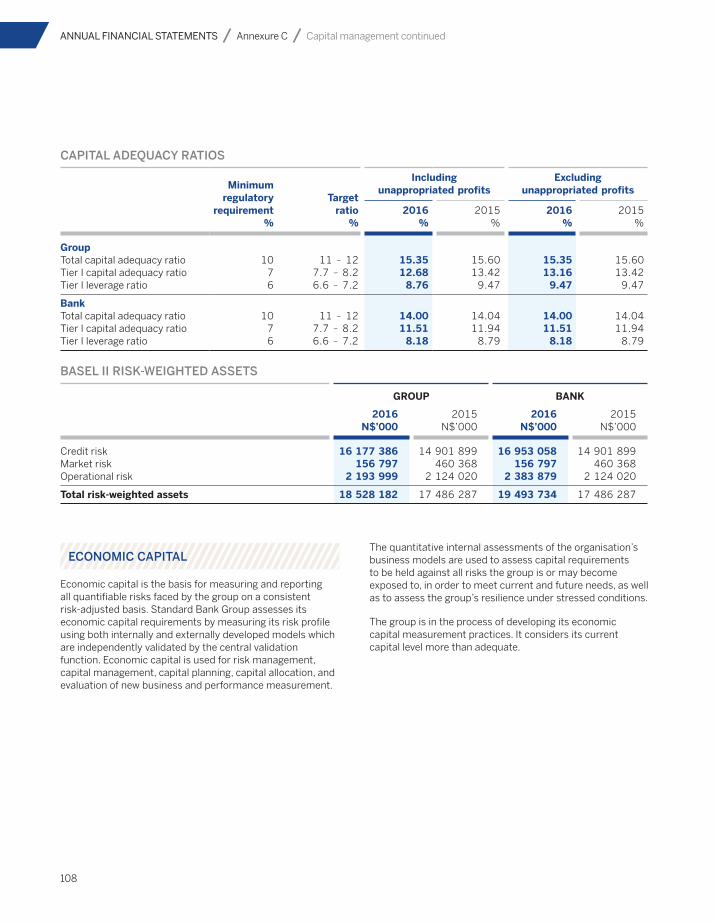
108
CAPITAL ADEQUACY RATIOS
Minimum regulatory
requirement%
Target ratio
%
Includingunappropriated profits
Excludingunappropriated profits
2016%
2015%
2016%
2015%
GroupTotal capital adequacy ratio 10 11 – 12 15.35 15.60 15.35 15.60 Tier I capital adequacy ratio 7 7.7 – 8.2 12.68 13.42 13.16 13.42 Tier I leverage ratio 6 6.6 – 7.2 8.76 9.47 9.47 9.47
BankTotal capital adequacy ratio 10 11 – 12 14.00 14.04 14.00 14.04 Tier I capital adequacy ratio 7 7.7 – 8.2 11.51 11.94 11.51 11.94 Tier I leverage ratio 6 6.6 – 7.2 8.18 8.79 8.18 8.79
BASEL II RISK-WEIGHTED ASSETS
GROUP BANK
2016N$’000
2015N$’000
2016N$’000
2015N$’000
Credit risk 16 177 386 14 901 899 16 953 058 14 901 899Market risk 156 797 460 368 156 797 460 368Operational risk 2 193 999 2 124 020 2 383 879 2 124 020
Total risk-weighted assets 18 528 182 17 486 287 19 493 734 17 486 287
ECONOMIC CAPITAL
Economic capital is the basis for measuring and reporting all quantifiable risks faced by the group on a consistent risk-adjusted basis. Standard Bank Group assesses its economic capital requirements by measuring its risk profile using both internally and externally developed models which are independently validated by the central validation function. Economic capital is used for risk management, capital management, capital planning, capital allocation, and evaluation of new business and performance measurement.
The quantitative internal assessments of the organisation’s business models are used to assess capital requirements to be held against all risks the group is or may become exposed to, in order to meet current and future needs, as well as to assess the group’s resilience under stressed conditions.
The group is in the process of developing its economic capital measurement practices. It considers its current capital level more than adequate.
ANNUAL FINANCIAL STATEMENTS Annexure C Capital management continued

SBN Holdings Limited Annual report 2016 109
The principal management committee responsible for the oversight of credit risk is CRMC. This committee is responsible for credit risk and credit concentration risk decision making, and delegation thereof to credit officers and forums within defined parameters. Key aspects of rating systems and credit risk models are approved by the BRC, which are mandated by the board as a designated committee. Regular model validation and reporting to these SBNH committees is undertaken by the independent central validation function.
The group dedicates considerable resources to gaining a clear and accurate understanding of credit risk across the business and ensuring that its balance sheet correctly reflects the value of the assets in accordance with International Financial Reporting Standards (IFRS).
BASEL II AND IFRS
Approaches adoptedThere are three approaches under Basel II for credit risk; namely the standardised approach, the FIRB approach and the AIRB approach. The FIRB and AIRB approaches are collectively referred to as the internal ratings-based (IRB) approaches. The version of Basel II adopted by the Bank of Namibia requires commercial banks to use the standardised approach.
Standardised approachThe calculation of regulatory capital for the standardised approach is based on net counterparty exposures after recognising a limited set of qualifying collateral. A prescribed percentage, being the risk weighting which is based on the
INTRODUCTION
The group’s credit risk comprises mainly wholesale and retail loans and advances together with the counterparty credit risk arising from derivative contracts entered into with our clients and market counterparties.
Other sources of credit risk arise from settlement balances with market counterparties, available-for-sale assets and reverse repurchase lending arrangements.
Credit risk management objectives are to:
maintain a strong culture of responsible lending and a robust risk policy and control framework
identify, assess and measure credit risk clearly and accurately across the group, from the level of individual facilities up to the total portfolio
define, implement and continually re-evaluate our risk appetite under actual and scenario conditions
monitor credit risk and adherence to agreed controls
ensure that there is independent, expert scrutiny of credit risks, and their mitigation.
Primary responsibility for credit risk management resides within the group’s business lines, supported by an independent group credit risk function operationally embedded in business units. The BRC is the principal board committee responsible for the oversight of credit risk, with the BAC having oversight responsibility for reviewing credit impairment adequacy.
109 Introduction
109 Basel II and IFRS
111 Basel II: Credit risk mitigation
111 Basel II: Management of concentration risk
112 Basel II: Counterparty credit risk
112 IFRS: Analysis of loans and advances
113 IFRS: Maximum exposure to credit risk
118 IFRS: Renegotiated loans and advances
118 IFRS: Collateral
Credit risk
110
Fair value instruments IAS 39 permits any financial asset or financial liability, on meeting specific criteria, to be designated at fair value with all changes in fair value being recognised in profit or loss. For liabilities that are designated to be measured at fair value, any deterioration in the credit risk of the issuer will result in a decrease in its fair value and a resultant profit being recognised in profit or loss which would ultimately be recognised within other comprehensive income. IFRS requires the amount of change in fair value attributable to changes in credit risk on such liabilities, both for the period and cumulatively to date, to be disclosed in the financial statements. From a pillar 3 perspective, recognising gains as a result of deterioration in creditworthiness would undermine the quality of capital measures and performance ratios. Those fair value gains and losses attributable to credit risk, if it would occur, are excluded when calculating regulatory capital.
Available-for-sale instruments IAS 39 permits certain financial assets, such as non-trading debt and equity instruments, to be classified as available-for sale. All financial assets classified in this manner are required to be measured at fair value with all unrealised gains and losses, with the exception of impairment losses, dividends and interest income, recognised in other comprehensive income.
Banking supervisors agree that the resulting unrealised profits and losses cannot be included in regulatory capital as there is no inflow of capital and it is not permanently available. Such fair value gains are eliminated in determining the company’s regulatory capital.
Impairments In accordance with IAS 39, it is necessary to determine whether there is objective evidence that a financial asset or group of financial assets are impaired. A financial asset or group of financial assets is impaired and impairment losses are recognised only if there is objective evidence of impairment, resulting from one or more events that have occurred after the initial recognition of the asset (a loss event) and that loss event has an impact on the estimated future cash flows of the financial asset or group of financial assets that can be reliably measured (incurred loss approach). An impairment loss is determined as the difference between the financial assets’ carrying value and the present value of its estimated future cash flows, including
perceived credit rating of the counterparty, is then applied to the net exposure. For corporate exposures that are rated by approved credit assessment institutions a Bank of Namibia prescribed risk weighting would be used. For counterparties for which there are no credit ratings available exposures are classified as unrated for determining regulatory capital requirements. Currently, all (corporate) exposures are unrated, the company does not use external credit assessment institutions and no exposures are deducted from capital funds.
Equity exposures The group has no equity exposures.
Basel II exposures and accounting principlesThe risk management report addresses the disclosure requirements of Basel II pillar 3 and IFRS. These two reporting frameworks have many differences, which are important to understand in order to correctly interpret the disclosures in this report. The company’s financial statements are prepared in accordance with and comply with IFRS. This framework is different from Basel II but shares the overall objective of increasing transparency by allowing users of market information, including regulators, to be more informed in their decision making. Pillar 3 disclosures, which aim to enable the market to assess an institution’s capital adequacy, are intended to complement the minimum capital requirements and supervisory review process of Basel II. While the accounting and regulatory disclosure requirements differ in scope and objectives, they are not considered to be conflicting or inconsistent. This is because the source of all risk and financial disclosures emanates from a centralised set of reconciled data. A difference between IFRS and pillar 3 is that the analysis of credit risk exposures under IFRS is presented by class of financial instrument while pillar 3 requires classification by Basel II counterparty type. Classes are determined for IFRS purposes by taking into account the nature of the information to be disclosed, as well as the characteristics of the underlying financial instruments. Basel II counterparty types are assumed to have homogeneous risk characteristics which supports the standardised risk weightings assigned to the different counterparty types. The Basel II exposure classes are therefore the basis for the preparation of regulatory reporting with the exception of the credit risk return which is still based on product types. The principles in IFRS complement the principles for recognising, measuring and presenting financial assets and financial liabilities in terms of IAS 32 and IAS 39.
ANNUAL FINANCIAL STATEMENTS Annexure C Credit risk continued

SBN Holdings Limited Annual report 2016 111
a credit support annexure, where collateral support is considered necessary. Other credit protection terms may be stipulated, such as limitations on the amount of unsecured credit exposure acceptable, collateralisation if mark-to-market credit exposure exceeds acceptable limits, and/or termination of the contract if certain credit events occur, for example, the downgrade of the counterparty’s public credit rating.
Wrong-way risk arises where there is a positive correlation between counterparty default and transaction exposure, and a negative correlation between transaction exposure and the value of collateral at the point of counterparty default. This risk is addressed by taking into consideration the high correlation between the default event and exposure to the counterparty when calculating the potential exposure and security margin requirements on these transactions.
To manage actual or potential portfolio risk concentrations in areas of higher credit risk and credit portfolio growth, the group implements hedging and other strategies from time to time. This is done at individual counterparty, sub-portfolio and portfolio levels through the use of syndication, distribution and sale of assets, asset and portfolio limit management, credit derivatives and credit protection.
BASEL II: MANAGEMENT OF CONCENTRATION RISK
Credit concentration risk is the risk of loss to the group arising from an excessive concentration of exposure to a single counterparty, industry, market, product, financial instrument or type of security, country or region, or maturity. This concentration typically exists when a number of counterparties are engaged in similar activities and have similar characteristics that would cause their ability to meet contractual obligations to be similarly affected by changes in economic or other conditions.
The group maintains a portfolio of credit risk that is adequately diversified and avoids unnecessarily excessive concentration risks. Diversification is achieved through setting maximum exposure guidelines to individual counterparties. The group constantly reviews its concentration levels and sets maximum exposure guidelines to these. Excesses are reported to GROC and the GRCMC.
any recoverable collateral, discounted at the original effective interest rate. To provide for latent losses in a portfolio of loans where the loans have not yet been individually identified as impaired, impairment for incurred but not reported losses is recognised based on historic loss patterns and estimated emergence periods. While IFRS clearly states that it is based on an incurred loss approach, Basel II focuses on expected and unexpected losses. Basel II seeks to ensure that expected losses are addressed through the level of impairments held against the underlying exposure, while unexpected losses are addressed through holding regulatory capital in relation to the size and nature of the exposure held, known as capital adequacy.
BASEL II: CREDIT RISK MITIGATION
Collateral, guarantees, derivatives and on- and off-balance sheet netting are widely used to mitigate credit risk. Credit risk mitigation policies and procedures ensure that credit risk mitigation techniques are acceptable, used consistently, valued appropriately and regularly, and meet the risk requirements of operational management for legal, practical and timely enforcement. Detailed processes and procedures are in place to guide each type of mitigation used.
The main types of collateral taken are:
mortgage bonds over residential, commercial and industrial properties
cession of book debts
bonds over plant and equipment
the underlying moveable assets financed under leases and instalment sales.
Reverse repurchase agreements are underpinned by the assets being financed, which are mostly liquid and tradable financial instruments.
Guarantees and related legal contracts are often required, particularly in support of credit extension to groups of companies and weaker counterparties. Guarantor counterparties include banks, parent companies, shareholders and associated counterparties. Creditworthiness is established for the guarantor as for other counterparty credit approvals.
For derivative transactions, the group typically uses internationally recognised and enforceable International Swaps and Derivatives Association (ISDA) agreements, with

112
The tables below set out the exposure to industry and geographic concentration.
SEGMENTAL ANALYSIS OF GROSS LOANS AND ADVANCES
2016N$’000
2015N$’000
Agriculture 626 904 552 753Construction 457 612 371 068Electricity 552 329 641 987Finance, real estate and other business services 1 963 720 1 727 906Individuals 13 506 787 11 631 632Manufacturing 569 809 619 107Mining 438 951 646 165Other services 1 113 894 1 139 965Transport 121 708 97 691Wholesale 180 266 161 467
19 531 980 17 589 741
All loans are recorded in Namibia.
SEGMENTAL ANALYSIS OF SPECIFIC IMPAIRMENTS
2016N$’000
2015N$’000
Agriculture (4 986) (6 075)Construction (1 217) (1 270)Electricity (2 263) (3 783)Finance, real estate and other business services (4 810) (10 982)Individuals (73 105) (129 498)Manufacturing (742) (3 228)Mining (101) (114)Other services (1 949) (3 610)Transport (711) (938)Wholesale (2 407) (1 752)
(92 291) (161 250)
All impairments relate to loans that are recorded in Namibia.
ANNUAL FINANCIAL STATEMENTS Annexure C Credit risk continued
BASEL II: COUNTERPARTY CREDIT RISK
Counterparty credit risk is managed according to the group credit risk governance standard, which also covers any other type of credit risk. All such credit risk limits are subject to annual review. Counterparty exposures are monitored against limits by the risk functions on a daily basis, and included in the calculation of economic capital demand.
The group’s exposure to counterparty risk is affected by the nature of the trades, the creditworthiness of the counterparty, and netting and collateral arrangements. Counterparty credit risk is measured in potential future exposure terms and recognised in risk systems on a net
basis where netting agreements are in place and are legally recognised, or on a gross basis otherwise. Exposures are generally marked to market daily. Cash or near cash collateral is posted where contractually provided for.
Counterparty credit risk is subjected to explicit credit limits which are formulated and approved for each counterparty and economic group, with specific reference to its credit rating and other credit exposures.
IFRS: ANALYSIS OF LOANS AND ADVANCES
The tables on the pages that follow analyse the credit quality of loans and advances measured in terms of IFRS.

SBN Holdings Limited Annual report 2016 113
IFRS: MAXIMUM EXPOSURE TO CREDIT RISK
Loans and advances are analysed and categorised based on credit quality using the following definitions.
Performing loansNeither past due nor specifically impaired loans are loans that are current and fully compliant with all contractual terms and conditions.
Early arrears but not specifically impaired loans include those loans where the counterparty has failed to make contractual payments and payments are less than 90 days past due, but it is expected that the full carrying value will be recovered when considering future cash flows, including collateral. Ultimate loss is not expected but could occur if the adverse conditions persist.
Non-performing loansNon-performing loans are those loans for which:
the group has identified objective evidence of default, such as a breach of a material loan covenant or condition, or
instalments are due and unpaid for 90 days or more.
Non-performing but not specifically impaired loans are not specifically impaired due to the expected recoverability of the full carrying value when considering the recoverability of discontinued future cash flows, including collateral.
Non-performing specifically impaired loans are those loans that are regarded as non-performing and for which there has been a measurable decrease in estimated future cash flows. Specifically impaired loans are further analysed into the following categories:
Substandard items that show underlying well-defined weaknesses and are considered to be specifically impaired.
Doubtful items that are not yet considered final losses due to some pending factors that may strengthen the quality of the items.
Loss items that are considered to be uncollectible in whole or in part. The group provides fully for its anticipated loss, after taking collateral into account
LOANS
Performing loans
Neither past due nor specifically impaired loans
(N$’000)
201619 096
201517 110
Close monitoring(N$’000)
2016597
20151 041
Loss(N$’000)
2016280
2015298
Doubtful(N$’000)
201684
2015102
Sub-standard(N$’000)
201670
201580
Non-performing loans
Specifically impaired loans
(N$’000)
2016435
2015480
Normal monitoring(N$’000)
201618 500
201516 069
Portfolio credit impairments Specific credit impairments

114
MAXIMUM EXPOSURE TO CREDIT RISK BY CREDIT QUALITY
N$’000
Performing loans
Neither past due nor specifically impaired
Normalmonitoring
N$’000
EarlyarrearsN$’000
SubstandardN$’000
DoubtfulN$’000
2016Mortgage loans 7 705 766 7 025 343 400 062 43 110 49 553Instalment sale and finance leases 3 579 044 3 396 242 122 352 7 724 7 610Card debtors 217 025 194 214 16 363 2 928 2 250Other loans and advances 8 030 145 7 883 880 58 099 17 204 24 663
Gross loans and advances 19 531 980 18 499 679 596 876 70 966 84 076
Less: Impairments for loans and advances (133 210)
Net loans and advances 19 398 770Add the following other banking
activities exposures:Cash and balances with central banks 1 359 873 1 359 873Derivatives 55 497 55 497Financial investments 3 111 541 3 111 541Trading assets 291 426 291 426Assets in group companies and joint ventures 1 606 097 1 606 097Other financial assets 605 694 605 694
Total on-balance sheet exposure 26 428 898Unrecognised financial assetsLetters of credit and bankers’ acceptances 1 900Financial guarantees 2 136 486Unutilised borrowing facilities 3 528 852
Total exposure to credit risk 26 428 898
ANNUAL FINANCIAL STATEMENTS Annexure C Credit risk continued

SBN Holdings Limited Annual report 2016 115
Total non-performing loans
Non-performing
loansN$’000
Non-performing
loans%
Specifically impaired loans
LossN$’000
TotalN$’000
Securitiesand expectedrecoveries on
specificallyimpaired
loansN$’000
Net aftersecurities
and expectedrecoveries on
specificallyimpaired
loansN$’000
Balance sheetimpairment
for non-performingspecifically
impairedloans
N$’000
Grossspecific
impairmentcoverage
%
187 698 280 361 267 554 12 807 12 807 4.57 280 361 3.6445 116 60 450 23 190 37 260 37 260 61.64 60 450 1.69
1 270 6 448 1 6 447 6 447 99.98 6 448 2.9746 299 88 166 52 389 35 777 35 777 40.58 88 166 1.10
280 383 435 425 343 134 92 291 92 291 21.20 435 425 2.23

116
MAXIMUM EXPOSURE TO CREDIT RISK BY CREDIT QUALITY CONTINUED
N$’000
Performing loans
Neither past due nor specifically impaired
Normalmonitoring
N$’000
Earlyarrears
N$’000Substandard
N$’000DoubtfulN$’000
2015Mortgage loans 7 063 798 6 044 477 762 141 46 623 59 063Instalment sale and finance leases 3 216 421 3 004 361 138 563 10 659 15 172Card debtors 229 422 200 813 20 191 3 738 3 935Other loans and advances 7 080 100 6 819 129 120 125 18 754 23 523
Gross loans and advances 17 589 741 16 068 780 1 041 020 79 774 101 693
Less: Impairments for loans and advances (197 310)Net loans and advances 17 392 431Add the following other banking activities exposures:Cash and balances with central banks 923 516 923 516Derivatives 168 413 168 413Financial investments 3 380 847 3 380 847Trading assets 313 679 313 679Assets in group companies and joint ventures 812 074 812 074Other financial assets 563 441 563 441
Total on-balance sheet exposure 23 554 401Unrecognised financial assetsLetters of credit and bankers’ acceptances 43 498Financial guarantees 2 165 971Unutilised borrowing facilities 3 189 833
Total exposure to credit risk 28 953 703
ANNUAL FINANCIAL STATEMENTS Annexure C Credit risk continued

SBN Holdings Limited Annual report 2016 117
Total non-performing loans
Non-performing
loansN$’000
Non-performing
loans%
Specifically impaired loans
LossN$’000
TotalN$’000
Securitiesand expectedrecoveries on
specificallyimpaired
loansN$’000
Net aftersecurities
and expectedrecoveries on
specificallyimpaired
loansN$’000
Balance sheetimpairment
for non-performingspecifically
impairedloans
N$’000
Grossspecific
impairmentcoverage
%
151 494 257 180 246 907 10 273 10 273 3.99 257 180 3.6447 666 73 497 28 148 45 349 45 349 61.70 73 497 2.29
745 8 418 0 8 418 8 418 100.00 8 418 3.6798 569 140 846 43 636 97 210 97 210 69.02 140 846 1.99
298 474 479 941 318 691 161 250 161 250 33.60 479 941 2.73

118
AGEING OF LOANS AND ADVANCES PAST DUE BUT NOT IMPAIRED
Less than31 daysN$’000
31 – 60days
N$’000
61 – 90days
N$’000 Total
N$’000
2016Mortgage loans 172 261 186 737 41 064 400 062Instalment sale and finance leases 98 688 17 312 6 352 122 352Card debtors 7 726 5 095 3 542 16 363Other loans and advances 21 898 23 091 13 110 58 099
Total 300 573 232 235 64 068 596 876
2015Mortgage loans 354 407 337 988 69 746 762 141Instalment sale and finance leases 128 200 9 818 545 138 563Card debtors 9 266 6 219 4 706 20 191Other loans and advances 56 226 42 250 21 649 120 125
Total 548 099 396 275 96 646 1 041 020
IFRS: RENEGOTIATED LOANS AND ADVANCES
Renegotiated loans and advances are exposures which have been refinanced, rescheduled, rolled over or otherwise modified following weaknesses in the counterparty’s financial position, and where it has been judged that normal repayment will likely continue after the restructure.
2016 2015
Loans renegotiated (million) 320.4 71.3
Mortgage lending (percentage) 42 47
Loans renegotiated in 2016 that would otherwise be past due or impaired comprised N$320 million (2015: N$71.3 thousand). Renegotiated loans that have arisen from secured lending predominantly comprise mortgage loans amounting to 42% (2015: 47%) of this amount.
IFRS: COLLATERAL
The table that follows shows the financial effect that collateral has on the group’s maximum exposure to credit risk. The table is presented according to Basel II asset categories and includes collateral that may not be eligible for recognition under Basel II but that management takes into consideration in the management of the group’s exposures to credit risk. All on- and off-balance sheet exposures which are exposed to credit risk, including non-performing assets, have been included.
Collateral includes:
financial securities that have a tradable market, such as shares and other securities
physical items, such as property, plant and equipment
financial guarantees, suretyships and intangible assets.
Netting agreements, which do not qualify for offset under IFRS but which are nevertheless enforceable, are included as part of the group’s collateral. All exposures are presented before the effect of any impairment provisions.
Of the group’s total exposure, 11% (2015: 10%) is unsecured and mainly reflects short-term exposures to individuals.
ANNUAL FINANCIAL STATEMENTS Annexure C Credit risk continued

SBN Holdings Limited Annual report 2016 119
COLLATERAL
Totalexposure
N$’000Unsecured
N$’000
Securedexposure
N$’000
Collateralcoverage
51 – 100%N$’000
2016Mortgage loans 7 705 766 7 705 766 7 705 766Instalment sale and finance leases 3 579 044 3 579 044 3 579 044Card debtors 217 025 217 025Other loans and advances 8 030 145 2 029 885 6 000 260 6 000 260Derivative assets 55 497 55 497 55 497Unrecognised financial assets – – –
Letters of credit and bankers’ acceptances – – –Financial guarantees – – –Unutilised borrowing facilities – – –
Total 19 587 477 2 246 910 17 340 567 17 340 567
Add: Financial assets not exposed to credit risk 5 368 534Add: Interest in financial instruments of group companies 1 606 097Less: Impairments for loans and advances (133 210)Less: Unrecognised off-balance sheet items 0
Total exposure 26 428 898
Reconciliation to balance sheetCash and balances with central banks 1 359 873Derivative assets 55 497Trading assets 291 426Financial investments 3 111 541Loans and advances 19 398 770Assets in group companies and joint ventures 1 606 097Other financial assets 605 694
Total exposure 26 428 898

120
COLLATERAL CONTINUED
Totalexposure
N$’000Unsecured
N$’000
Securedexposure
N$’000
Collateralcoverage
51 – 100%N$’000
2015Mortgage loans 7 063 798 7 063 798 7 063 798Instalment sale and finance leases 3 216 421 3 216 421 3 216 421Card debtors 229 422 229 422Other loans and advances 7 080 100 2 058 448 5 021 652 5 021 652Derivative assets 168 413 168 413 168 413Unrecognised financial assets 5 399 302 5 399 302 5 399 302
Letters of credit and bankers’ acceptances 43 498 43 498 43 498Financial guarantees 2 165 971 2 165 971 2 165 971Unutilised borrowing facilities 3 189 833 3 189 833 3 189 833
Total 23 157 456 2 287 870 20 869 586 20 869 586
Add: Financial assets not exposed to credit risk 5 181 483Add: Interest in financial instruments of group companies 812 074Less: Impairments for loans and advances (197 310)Less: Unrecognised off-balance sheet items (5 399 302)
Total exposure 23 554 401
Reconciliation to balance sheetCash and balances with central banks 923 516Derivative assets 168 413Trading assets 313 679Financial investments 3 380 847Loans and advances 17 392 431Assets in group companies and joint ventures 812 074Other financial assets 563 441
Total exposure 23 554 401
ANNUAL FINANCIAL STATEMENTS Annexure C Credit risk continued

SBN Holdings Limited Annual report 2016 121
ORGANISATIONAL STRUCTURE AND GOVERNANCE
Exco and the board review and set the liquidity risk governance standard annually in accordance with regulatory requirements, international best practice and the group’s stated risk appetite. This ensures that a comprehensive and consistent governance framework for liquidity risk management is followed across the group. The group has an asset and liability committee (ALCO) responsible for ensuring compliance with liquidity risk policies.
LIQUIDITY AND FUNDING MANAGEMENT
The group manages liquidity in accordance with applicable regulations within the group’s risk appetite for liquidity risk.
As part of a comprehensive liquidity management process, the group distinguishes between tactical, structural and contingent liquidity risk. These three risk management categories are governed by a comprehensive internal governance framework to identify, measure and manage exposure to liquidity risk. Combining each of these risk management categories allows for effective liquidity risk monitoring.
INTRODUCTION
The nature of banking and trading gives rise to continuous exposure to liquidity risk. The group’s liquidity risk management framework is designed to measure and manage liquidity positions across both the corporate and retail sectors to ensure that payment obligations can be met by the group’s legal entities, under both normal and stressed conditions.
Banking liquidity risk can be distinguished by two risk categories which are strictly managed by the group:
Market liquidity risk: The risk that the group cannot easily offset or eliminate a position without significantly affecting market prices because of inadequate market depth or market disruption.
Funding liquidity risk: The risk that the group will not be able to effectively meet both expected and unexpected current and future cash flow and collateral requirements without negatively affecting the group’s daily operations or financial condition.
121 Introduction
121 Organisational structure and governance
121 Liquidity and funding management
Liquidity risk

122
LIQUIDITY MANAGEMENT CATEGORIES
TACTICAL (SHORTER-TERM)LIQUIDITY RISK MANAGEMENT
STRUCTURAL (LONG-TERM) LIQUIDITY RISK MANAGEMENT
CONTINGENCY LIQUIDITYRISK MANAGEMENT
manage intra-day liquidity positions
monitor interbank and repurchase shortage levels
monitor daily cash flow requirements
manage short-term cash flows
manage daily foreign currency liquidity
set deposit rates in accordance with structural and contingent liquidity requirements as informed by the ALCO.
ensure a structurally sound balance sheet
identify and manage structural liquidity mismatches
determine and apply behavioural profiling
manage long-term cash flows
preserve a diversified funding base
inform term funding requirements
assess foreign currency liquidity exposures
establish liquidity risk appetite
ensure appropriate transfer pricing of liquidity costs.
monitor and manage early warning liquidity indicators
establish and maintain contingency funding plans
undertake regular liquidity stress testing and scenario analysis
convene liquidity crisis management committees, if needed
set liquidity buffer levels in accordance with anticipated stress events
advise diversification of liquidity buffer portfolios.
TOOLS USED TO MANAGE LIQUIDITY ACROSS ALL RISK MANAGEMENT CATEGORIES:
liquidity ratios
market ratios.
ANNUAL FINANCIAL STATEMENTS Annexure C Liquidity risk continued
The liquidity management process is independently reviewed on a regular basis. In periods of stable market conditions, the group’s consolidated liquidity risk position is monitored on at least a quarterly basis by ALCO. In periods of increased volatility, the frequency of meetings is increased as required to facilitate appropriate and timely management action.
Tactical liquidity risk managementActive liquidity and funding management is an integrated effort across a number of functional areas. Short-term cash flow projections are used to plan for and meet the day-to-day requirements of the business, including adherence to prudential and internal requirements.
The group’s wholesale funding strategy is assessed for each legal entity and is derived from projected net asset growth which includes consideration of PBB and CIB asset growth, capital requirements, the maturity profile of existing wholesale funding and anticipated changes in the retail deposit base. Funding requirements and initiatives are assessed in accordance with ALCO requirements for diversification, tenor and currency exposure, as well as the availability and pricing of alternative liquidity sources.
An active presence is maintained in professional markets, supported by relationship management efforts among corporate and institutional clients.
Structural liquidity risk managementStructural requirementsWith actual cash flows typically varying significantly from the contractual position, behavioural profiling is applied to assets, liabilities and off-balance sheet commitments with an indeterminable maturity or drawdown period, as well as to certain liquid assets. Behavioural profiling assigns probable maturities based on historical customer behaviour. This is used to identify significant additional sources of structural liquidity in the form of liquid assets and core deposits, such as current and savings accounts, which exhibit stable behaviour despite being repayable on demand or at short notice.
Structural liquidity mismatch analyses are performed regularly to anticipate the mismatch between payment profiles of balance sheet items, in order to highlight potential risks within the group’s defined liquidity risk thresholds.
The graph that follows shows the group’s cumulative maturity mismatch between assets and liabilities for the 0 to 12 months bucket, after applying behavioural profiling. Limits are set internally to restrict the cumulative liquidity mismatch between expected inflows and outflows of funds in different time buckets. These mismatches are monitored on a regular basis with active management intervention if

SBN Holdings Limited Annual report 2016 123
potential limit breaches are evidenced. The behaviourally adjusted cumulative liquidity mismatch remains within the group’s liquidity risk appetite. In order to ensure ongoing compliance with statutory and internal risk management guidelines, certain short-term assets are profiled as long dated.
20
15
10
5
0
(5)
(10)
(15)
(20)
2016 2015 Internal limit
Behaviourally adjusted cumulative liquidity mismatch(%)
0 – 1month
0 – 7days
0 – 12months
0 – 3months
0 – 6months
Maturity analysis of financial liabilities by contractual maturityThe tables that follow analyse cash flows on a contractual, undiscounted basis based on the earliest date on which the group can be required to pay (except for trading liabilities and trading derivatives) and will, therefore, not agree directly to the balances disclosed in the consolidated statement of financial position.
Derivative liabilities are included in the maturity analysis on a contractual, undiscounted basis when contractual maturities are essential for an understanding of the derivatives’ future cash flows. Management considers only contractual maturities to be essential for understanding the future cash flows of derivative liabilities that are designated as hedging instruments in effective hedge accounting relationships. All other derivative liabilities are treated as trading and are included at fair value in the redeemable on demand bucket since these positions are typically held for short periods of time.
The following tables also include contractual cash flows with respect to off-balance sheet items which have not yet been recorded on-balance sheet. Where cash flows are exchanged simultaneously, the net amounts have been reflected.
MATURITY ANALYSIS OF LIABILITIES
Redeemableon demand
N$’000
Maturingwithin
1 monthN$’000
Maturingbetween
1 – 6 monthsN$’000
Maturingbetween
6 – 12 monthsN$’000
Maturingafter
12 monthsN$’000
TotalN$’000
2016LiabilitiesDerivative liabilities 17 541 25 322 7 549 50 412Trading liabilities 194 871 194 871Deposits and current
accounts 13 981 351 757 300 3 925 110 1 542 096 1 800 167 22 006 025Loans from group
companies 78 112 1 360 323 1 438 435Debt issued securities 406 976 2 326 194 2 733 170Other liabilities 498 688 498 688
14 480 039 774 842 3 950 432 2 034 733 5 681 555 26 921 601
Unrecognised financial instruments
Letter of credit and bankers’ acceptances 322 1 578 1 900
Financial guarantees 28 462 13 308 48 136 90 361 1 956 218 2 136 486Unutilised borrowing
facilities 3 528 852 3 528 852
3 557 314 13 630 49 714 90 361 1 956 218 5 667 237

124
Redeemableon demand
N$’000
Maturingwithin
1 monthN$’000
Maturingbetween
1 – 6 monthsN$’000
Maturingbetween
6 – 12 monthsN$’000
Maturing after
12 monthsN$’000
Total N$’000
2015LiabilitiesDerivative liabilities 42 316 179 370 9 787 231 473Deposits and current
accounts 12 635 233 364 224 2 394 006 1 612 209 1 179 847 18 185 518Loans from group
companies 1 642 526 1 642 526Debt issued securities 104 590 645 110 749 700Other liabilities 684 246 684 246
14 962 005 406 540 2 573 375 1 726 586 1 824 957 21 493 463
Unrecognised financial instruments
Letter of credit and bankers’ acceptances 6 684 36 813 43 498
Financial guarantees 673 949 41 739 142 643 438 586 869 054 2 165 971Unutilised borrowing
facilities 3 189 833 3 189 833
3 863 782 48 423 179 457 438 586 869 054 5 399 302
ANNUAL FINANCIAL STATEMENTS Annexure C Liquidity risk continued
Foreign currency liquidity managementA number of indicators are observed to monitor changes in either market liquidity or exchange rates. Foreign currency loans and advances are restricted to the availability of foreign currency deposits.
Funding strategyFunding markets are evaluated on an ongoing basis to ensure appropriate group funding strategies are executed depending on the market, competitive and regulatory environment. The group employs a diversified funding strategy, sourcing liquidity in both domestic and offshore markets, and incorporates a coordinated approach to accessing capital and loan markets across the group.
Concentration risk limits are used within the group to ensure that funding diversification is maintained across products, sectors, geographic regions and counterparties.
Primary funding sources are in the form of deposits across a spectrum of retail and wholesale clients, as well as long-term capital and loan markets. The group remains committed to increasing its core deposits and accessing domestic and foreign capital markets when appropriate to meet its anticipated funding requirements.
DEPOSITOR CONCENTRATIONS – NAMIBIA
2016%
2015%
Top 10 depositors 19.48 15.95Single depositor 3.49 3.64
FUNDING-RELATED LIABILITIES COMPOSITION
2016N$bn
2015N$bn
Corporate and financial institutions’ funding 12.4 10.3
Government and parastatals 1.9 0.5
Interbank funding 1.1 1.4Retail deposits 6.8 6.4Senior and
subordinated debt 1.3 0.8
Total funding-related liabilities 23.5 19.4

SBN Holdings Limited Annual report 2016 125
60
50
40
30
20
10
2016 2015
Funding-related liabilities composition (%)
Corporate andfinancial institutions
Governmentand parastatals
Interbank Retaildeposits
Senior andsubordinated debt
Structural mismatch limits and guidelinesThe long-term funding ratio is defined as those funding-related liabilities with a remaining maturity of greater than six months as a percentage of total funding-related liabilities. This definition is derived from the SARB filings in the South African market, not to be confused with NSFR which is greater than one year.
The graph below illustrates the group’s long-term funding ratio for the period 1 January 2010 to 31 December 2016. The group’s long-term funding ratio was 23.34% (2015: 23.47%).
35
30
25
20
15
10
5
Long-term funding ratio (%)
January 2010 December 2016
Contingency liquidity risk managementContingency funding plansContingency funding plans are designed to protect stakeholder interests and maintain market confidence to ensure a positive outcome in the event of a liquidity crisis. The plans incorporate an early warning indicator methodology supported by clear crisis response strategies. Early warning indicators cover bank-specific and systemic crises and are monitored according to assigned frequencies and tolerance levels.
Crisis response strategies are formulated for the relevant crisis management structures and address internal and external communications, liquidity generation management actions and operations, heightened and supplementary information requirements, as well as various management actions available to address the crisis event.
Liquidity stress testing and scenario analysisStress testing and scenario analysis are based on hypothetical, as well as historical events. These are conducted on the group’s funding profiles and liquidity positions.
Anticipated on- and off-balance sheet cash flows are subjected to a variety of bank-specific and systemic stresses and scenarios to evaluate the impact of unlikely but plausible events on liquidity positions. Under each scenario, loan portfolios are assumed to roll over. However, the rollover of liabilities will be partially impaired resulting in a funding shortfall.

126
The results are assessed against the liquidity buffer and contingency funding plans to provide assurance as to the group’s ability to maintain sufficient liquidity under adverse conditions. The results also inform target liquidity buffer positions. The bank’s internal stress tests continue to be updated to reflect new reporting requirements and annual review amendments.
Liquidity bufferPortfolios of highly marketable securities over and above prudential, regulatory and internal stress testing requirements are maintained as protection against unforeseen disruptions in cash flows. These portfolios are managed within ALCO-defined limits on the basis of diversification and liquidity.
The table below provides a breakdown of the group’s liquid marketable securities and foreign currency placements as at 31 December 2016 compared to the 31 December 2015 closing position. These portfolios are highly liquid and can be readily sold to meet liquidity requirements.
TOTAL LIQUIDITY
2016N$bn
2015N$bn
Total marketable assets 6.08 4.46Prudential requirements 2.53 2.36
Total liquidity (in excess of prudential requirements) 3.55 2.10
In addition to minimum requirements, total contingent liquidity holdings are informed by the results from liquidity stress testing as per Basel principles. The total amount of liquidity held remains adequate to meet all internal stress tests, as well as various legal entity and group regulatory and prudential requirements.
ANNUAL FINANCIAL STATEMENTS Annexure C Liquidity risk continued

SBN Holdings Limited Annual report 2016 127
INTRODUCTION
The group’s key market risks are categorised as follows:
Market risk in the trading book: These risks result from the trading activities of the group where the primary focus is client facilitation in chosen markets. All trading activities are carried out within the group’s CIB division. Trading activities comprise market making, arbitrage and proprietary trading, with the latter constituting a small proportion of trading revenues.
Interest rate risk in the banking book: These risks result from the different repricing characteristics of banking book assets and liabilities. They include endowment risk associated with a downturn in the economic cycle, repricing risk, basis risk, optionality risk and yield curve risk.
Foreign currency risk: The group’s primary exposures to foreign currency risk arise as a result of the translation effect on the group’s net assets in foreign-denominated cash exposures and accruals.
ORGANISATIONAL STRUCTURE AND GOVERNANCE
ALCO and the board review and set the market risk governance standard annually in accordance with the group’s stated risk appetite.
The market risk functions embedded in the business lines are independent of trading operations and accountable to ALCO. They are responsible for identifying, measuring, managing, controlling and reporting market risk as outlined in the market risk governance standard, with support from the central market risk function. The market risk functions also have the ability to set individual trader mandates. All VaR limits require prior approval from ALCO. The central market risk function is accountable to ALCO.
Exposures and excesses are monitored and reported daily to business line and group management, and quarterly to ALCO and the BRC. Where breaches in limits and triggers occur, actions are taken by market risk functions to move exposures back in line with approved market risk appetite, with such breaches being reported to management and ALCO.
127 Introduction
127 Organisational structure and governance
128 Trading book market risk management
129 Interest rate risk in the banking book
129 Foreign currency risk
Market risk

128
VaR is calculated on the basis of exposures outstanding at the close of business and, therefore, does not necessarily reflect intra-day exposures.
VaR is unlikely to reflect loss potential on exposures that only arise under significant market moves.
The Basel consultative paper on “Fundamental trading book review” proposes further changes to counteract these limitations in addition to regulatory stress VaR which was implemented at the beginning of 2013.
Stop-loss triggersStop-loss triggers are used to protect the profitability of the global markets trading desks, and refer to cumulative or daily trading losses that prompt a review or close-out of positions in the trading book. These are monitored by market risk on a daily basis.
Stress testsIn recognition of the limitations of VaR, stress testing provides an indication of the potential losses that could occur under extreme market conditions and where longer holding periods may be required to exit positions. The stress tests carried out by the group include individual market risk factor testing, combinations of market factors per trading desk and combinations of trading desks. Stress tests include a combination of historical, hypothetical and Monte Carlo-type simulations and provide senior management with an assessment of the financial impact that such events would have on the group’s profit. The daily losses experienced during the year ended 31 December 2016 were within the stress loss scenarios.
BacktestingThe group backtests its VaR models to verify the predictive ability of the VaR calculations and ensure the appropriateness of the models within the inherent limitations previously referred to. Backtesting compares the daily hypothetical profit and losses under the one-day buy and hold assumption to the prior day’s VaR. In addition, VaR is tested by changing various parameters, such as confidence intervals and observation periods used in the model.
In this manner, characteristics of the VaR model are captured to ensure the accuracy of the VaR measurement and the effectiveness of hedges and risk-mitigation instruments, again within the limitations previously referred to. Regulators categorise a VaR model as green, amber or red and assign regulatory capital multipliers based on this categorisation.
A green model is consistent with a satisfactory VaR model and is achieved for models that have four or less backtesting exceptions in a 12-month period. All the group’s approved models were assigned green status for the year ended 31 December 2016.
TRADING BOOK MARKET RISK MANAGEMENT
MeasurementThe techniques used to measure and control trading book market risk and trading volatility include:
VaR
stop-loss triggers
stress tests
backtesting.
VaRThe group uses the historical VaR simulation approach to derive quantitative measures, specifically for market risk under normal conditions.
VaR is based on 251 days of unweighted historical data, a holding period of one day and a confidence level of 95%. The historical VaR results are calculated in four steps:
Calculate 250 daily market price movements based on 251 days’ historical data.
Calculate hypothetical daily profit or loss for each day using these daily market price movements.
Aggregate all hypothetical profits or losses for day one across all positions, giving daily hypothetical profit or loss. Repeat for all other days.
VaR is the 95th percentile selected from the 250 days of daily hypothetical total profit or loss.
Daily losses exceeding the VaR are unlikely to occur.
VaR models have been approved by the regulators for all Namibian trading units except for the structured product desk and specific risk on interest rates. Where the group has received internal model approval, a VaR using a confidence level of 99% and a 10-day holding period for both recent market conditions and a stress period is used to determine market risk regulatory capital.
Limitations of historical VaR are acknowledged globally and include:
The use of historical data as a proxy for estimating future events may not encompass all potential events, particularly those which are extreme in nature.
The use of a one-day holding period assumes that all positions can be liquidated or the risk offset in one day. This may not fully reflect the market risk arising at times of severe illiquidity, when a one-day holding period may be insufficient to liquidate or hedge all positions fully.
The use of a 95% confidence level, by definition, does not take into account losses that might occur beyond this level of confidence.
ANNUAL FINANCIAL STATEMENTS Annexure C Market risk continued

SBN Holdings Limited Annual report 2016 129
INTEREST RATE RISK IN THE BANKING BOOK
Banking book-related market risk exposure principally involves managing the potential adverse effect of interest rate movements on banking book earnings (net interest income and banking book mark-to-market profit or loss) and the economic value of equity.
The group’s approach to managing interest rate risk is governed by applicable laws and regulations, and is guided by the competitive environment in which the group operates. Banking book interest rate risk is monitored centrally by SBG’s TCM team with oversight by ALCO.
Interest rate risk measurementThe analytical techniques used to quantify banking book interest rate risk include both earnings and valuation-based measures. Results are monitored on at least a monthly basis by ALCO. The analysis takes cognisance of embedded optionality such as loan prepayments and accounts where the account behaviour differs from the contractual position.
The results obtained from forward-looking dynamic scenario analyses, as well as Monte Carlo simulations, assist in developing optimal hedging strategies on a risk-adjusted return basis. Desired changes to a particular interest rate risk profile are achieved through the restructuring of on-balance sheet repricing and/or maturity profiles and, where appropriate, the use of derivative instruments.
Interest rate risk limits Interest rate risk limits are set with respect to changes in forecast banking book earnings (net interest income and banking book mark-to-market profit or loss) and the economic value of equity. Economic value of equity sensitivity is calculated as the net present value of aggregate asset cash flows less the net present value of aggregate liability cash flows.
All assets, liabilities and derivative instruments are allocated to gap intervals based on either their repricing or maturity characteristics. Assets and liabilities for which no identifiable contractual repricing or maturity dates exist are allocated to gap intervals based on behavioural profiling (obtained through statistical analysis and, if required, expert judgement).
Analysis of banking book interest rate sensitivityThe paragraph below indicates the N$ equivalent sensitivity of the group’s banking book earnings (net interest income and banking book mark-to-market profit or loss) and other comprehensive income (OCI) in response to a parallel yield curve shock, before tax. Hedging transactions are taken into account while other variables are kept constant.
Assuming no management intervention, a downward 200 basis point parallel interest rate shock across all foreign currency yield curves and a 200 basis point parallel interest rate shock across N$ yield curves, would decrease the forecast 12-month net interest income on 31 December 2016 by N$113.3 million (2015: N$117.6 million).
FOREIGN CURRENCY RISK
The foreign currency risk sensitivity analysis below reflects the expected financial impact, in N$ equivalent, resulting from a 5% shock to foreign currency risk exposures, with respect to other derivative financial instruments and foreign-denominated cash balances and accruals.
As indicated below, the impact of a 5% depreciation in foreign currency rates on the OCI and/or profit or loss of the group before taxation is N$9.7 million (2015: (N$887) thousand). Offsets to this sensitivity include changes in foreign currency rates as applied to the group’s net assets in foreign countries.
FOREIGN CURRENCY RISK SENSITIVITY IN N$ EQUIVALENTS
USD Eur GBP Other Total
2016Total net long position N$’000 111 175 64 379 516 19 264Sensitivity % 5 5 5 5
Impact on profit or loss N$’000 5 559 3 219 26 963 9 767
2015Total net long/(short) position N$’000 (16 963) (124) (54) (607)Sensitivity % 5 5 5 5
Impact on profit or loss N$’000 (848) (6) (3) (30) 887

130
The framework is based on the following core components:
Risk identification and control methodology: Facilitates the identification of risks and the management thereof across each business and operational function. It comprises two key elements:
• Risk and control self-assessments: Each business unit and group enabling function is required to analyse its business activities and critical processes to identify the key operational risks to which it is exposed, and assess the adequacy and effectiveness of its controls. For any area where management concludes that the level of residual risk is beyond an acceptable level, it is required to define action plans to reduce the level of risk. The assessments are facilitated, monitored and challenged by the relevant operational risk function aligned to each business unit and group enabling function.
• Indicators: Based on the key risks and controls identified above, relevant indicators are used to monitor key business environment and internal control factors that may influence the group’s operational risk profile. Each indicator has trigger thresholds to provide an early-warning indicator of potential risk exposures and/or a potential breakdown of controls.
• Operational risk incidents: All areas are required to report operational risk incidents to their relevant operational risk function. The definition of operational risk incidents includes not only events resulting in actual loss, but those resulting in non-financial impacts and near misses. This process is intended to enable the root cause of individual incidents, or trends of incidents, to be analysed and actions taken to reduce the exposure or to enhance controls.
INTRODUCTION
Operational risk is the risk of loss resulting from inadequate or failed internal processes, people and systems or from external events. Reputational risk and strategic risk are, in line with general market convention, excluded from the definition of operational risk.
Operational risk exists in the natural course of business activity. It is not an objective to eliminate all exposure to operational risk as this would be neither commercially viable nor indeed possible. The group’s approach to managing operational risk is to adopt fit-for-purpose operational risk practices that assist business line management in understanding their inherent risk and reducing their risk profile in line with the group’s risk tolerance, while maximising their operational performance and efficiency.
FRAMEWORK
The group has set minimum requirements for managing operational risk through the group operational risk governance standard. These requirements have been fully implemented and embedded across the group.
The framework sets out a structured and consistent approach for managing operational risk across the group. The risk management approach involves identifying, assessing, measuring, managing, mitigating, and monitoring the risks associated with operations, enabling comprehensive analysis and reporting of the group’s operational risk profile.
130 Introduction
130 Framework
131 Managing operational risk
131 Measuring operational risk
131 Specialist operational risk types
Operational risk
ANNUAL FINANCIAL STATEMENTS continued

SBN Holdings Limited Annual report 2016 131
MEASURING OPERATIONAL RISK
The group continues to calculate capital based on the standardised approach in accordance with BON requirements.
SPECIALIST OPERATIONAL RISK TYPES
The definition of operational risk is very broad. Operational risk contains specific sub-risks that are subject to management and oversight by dedicated specialist functions.
Model riskThe term model refers to a quantitative method, system or approach that applies statistical, economic, financial, or mathematical principles and processes to translate input data into quantitative estimates. The group uses models to measure risk across the various risk types. Examples include credit grading, pricing, valuation and risk appetite metrics.
Model risk is the potential for adverse consequences from measurement, pricing and management decisions based on incorrect or inappropriate use of models. Incorrect or inappropriate use of models may arise from incorrect assumptions, incomplete information, inaccurate implementation and limited model understanding leading to incorrect conclusions by the user.
The group’s approach to managing model risk is based on the following principles:
All new models, both internal and external, are subject to validation and independent review in which the various components of a model and its overall functioning are evaluated to determine whether the model is performing as intended.
The three lines of defence governance model is adopted, being model development, independent model validation and internal audit oversight functions.
Appropriateness and fit-for-purpose use of models in technical forums is challenged.
Model validation summaries that highlight model limitations and recommend improvements.
Implementation of approved models into production systems is controlled.
Model performance, including requirements for an annual review process, is monitored on an ongoing basis.
Data that is used as model inputs, which includes independent price testing of mark-to-market positions is reviewed and governed. Where this is not available, industry consensus services are used.
All incidents relating to the group are consolidated within a central group database, which is also integrated with risk and control self-assessments and indicators.
Reporting: Operational risk reports are produced on both a regular and an event-driven basis. The reports include a profile of the key risks to business units’ achievement of their business objectives, relevant control issues and operational risk incidents. Specific reports are prepared on a regular basis for the relevant business unit committees and for the board risk committee.
MANAGING OPERATIONAL RISK
The primary responsibility for managing operational risk forms part of the day-to-day responsibilities of management and employees at all levels. Business line management is ultimately responsible for owning and managing risks resulting from their activities. The risks are managed where they arise.
The operational risk management function is independent from business line management and is part of the second line of defence. It is organised as follows:
Individual teams are dedicated to each business unit and group enabling functions. These teams are based alongside their business areas and facilitate the business’s adoption of the operational risk framework. As part of the second line of defence, they also monitor and challenge the business units’ and group enabling functions’ management of their operational risk profile.
A central function, based at a group level, provides groupwide oversight and reporting. It is also responsible for developing and maintaining the operational risk management framework.
The primary oversight body for operational risk is ORCC, which reports to exco, the BRC and ultimately the board. ORCC is chaired by the group head of risk and includes representation from group specialist functions and business units. ORCC is also responsible for approving groupwide operational risk policies and methodologies.
In addition to the operational risk management function, there are individual focus areas on particular aspects of operational risk, including:
• specialist functions that are responsible for oversight of specific components of operational risk, including compliance, legal, financial crime, information security and business continuity management
• an internal financial controls framework has been established to ensure the robust control over balance sheet substantiation and other key financial controls
• within the group’s IT and operations functions, there are dedicated areas focused on the day-to-day management of operations control and IT risk.

132
ANNUAL FINANCIAL STATEMENTS Annexure C Operational risk continued
Legal risk arises where:
the group’s businesses or functions may not be conducted in accordance with, or benefit from, applicable laws in the countries in which it operates
regulatory requirements are incorrectly applied
the group may be liable for damages to third parties
contractual obligations may be enforced against the group in an adverse way, resulting from legal proceedings being instituted against it.
The following sub-categories of legal risk are recognised:
Contract non-conclusion risk
Contract unenforceability risk
Security interest failure risk
Netting and set-off disallowance risk
Adverse tax and regulatory treatment risk
Contract breach, damages and fines risk
Copyright loss or contravention risk
Litigation risk
Anti-competitive behaviour risk.
The group has processes and controls in place to manage its legal risk. Failure to manage these risks effectively could result in legal proceedings impacting the group adversely, both financially and reputationally.
Compliance riskCompliance risk is the risk of legal or regulatory sanctions, financial loss or damage to reputation that the group may suffer as a result of its failure to comply with laws, regulations, codes of conduct and standards of good practice that are applicable to its financial services activities.
Approach to compliance risk managementThe group’s approach to managing compliance risk is proactive and premised on internationally accepted principles of risk management, including those recommended by Basel. It is aligned with other group risk type methodologies. Group compliance supports business in complying with current and emerging regulatory developments, including money laundering and terrorist financing control, sanctions management, identifying and managing conflicts of interest and market abuse, TCF and mitigating reputational risk.
Framework and governanceCompliance risk management is a core risk management activity overseen by the BRC. The head of risk has unrestricted access to the chief executive and to the chairman of the BAC, thereby ensuring the function’s independence.
Governance is achieved through committees with appropriate board and executive management members for material models, and through policies which deal with minimum standards, materiality, validation criteria, approval criteria, roles and responsibilities.
Auditable, skilled and experienced pool of technically competent staff is maintained.
Taxation riskIn terms of the group tax policy, the group fulfils its responsibilities under tax law in each jurisdiction in which it operates, both in terms of domestic and international taxes with specific reference to transfer pricing principles across jurisdictions, whether in relation to compliance, planning or client service matters. Tax law includes all responsibilities which the group may have in relation to company taxes, personal taxes, indirect taxes and tax administration.
Compliance with this policy is aimed at ensuring that the group pays neither more nor less tax than tax law requires. The group continually reviews its existing and planned operations in this regard and ensures that, where clients participate in group products, these clients are either aware of the probable tax implications or are advised to consult with independent professionals to assess these implications, or both.
The framework to achieve compliance with the group tax policy comprises four elements:
Identification and management of tax risk
Human resources policies, including an optimal mix of staffing and outsourcing
Skills development, including methods to maintain and improve managerial and technical competency
Communication of information affecting tax within the group.
Good corporate governance in the tax context requires that each of these elements is in place, as the absence of any one would seriously undermine the others.
Legal riskLegal risk is defined as exposure to the adverse consequences of non-compliance with legal or statutory responsibilities and/or inaccurately drafted contracts and their execution, as well as the absence of written agreements or inadequate agreements. This includes exposure to new laws, as well as changes in interpretations of existing law by appropriate authorities. This applies to the full scope of group activities and may also include others acting on behalf of the group.

SBN Holdings Limited Annual report 2016 133
Environmental and social riskEnvironmental and social risk assessment and management deals with two aspects, being those over which:
we do not have control but which have potential to impact on our operations and those of our clients
we have direct control such as waste management and the use of energy and water.
The SBG sustainability management unit develops the strategy, policy and management frameworks which enable the identification, management, monitoring and reporting of both of these aspects.
The uncontrolled aspects include threats to the global environment result from changing global climate and its impact on weather patterns, fresh water, infrastructure, economic growth and social resilience. The group uses two approaches to screen and process projects, namely the Equator Principles for project finance loans and an internally developed appraisal system for other financial product types. These tools are designed to identify the risks associated with a transaction and the customer’s ability to manage environmental and social issues, as well as the risks associated with the transaction itself such as the nature and value of the loan, and the industry sector involved.
All project finance deals will in future be screened for climate change risk and human rights impacts. This is in addition to the more traditional environmental and social risks which include those associated with occupational health and safety, relocation of communities and the impact on livelihoods of individuals.
In relation to the controllable aspects, energy use, water use, waste production and carbon emissions resulting from our operations are recorded within an environmental management system. This is used both for improving efficiency and reporting to key stakeholders. Environmental efficiency targets have been set at a SBN level.
From a governance perspective, the group’s material issues are grouped into six broad categories which form the basis of engagement on sustainability issues with the group executive committee and the board. These are:
sustainable long-term financial performance
governance, regulation and stakeholder engagement
sustainable and responsible financial services
socioeconomic development
a positive and consistent employee experience
the environment.
The group’s compliance framework is based on the principles of effective compliance risk management, as outlined in the Banking Institutions Act, and recommendations from international policy-making bodies. Our business compliance model includes dedicated compliance support and advisory services to business which is supplemented by training.
A robust risk management reporting and escalation procedure requires both business unit and functional area heads to report monthly and quarterly on the status of compliance risk management in the group.
Money laundering and terrorist financing controlLegislation across SBN pertaining to money laundering and terrorist financing control imposes significant requirements in terms of:
customer identification
record keeping
staff training
obligations to detect, prevent and report money laundering and terrorist financing.
SBG minimum standards are implemented throughout the group. The group also subscribes to the principles of the Financial Action Task Force, an inter-governmental body developing and promoting policies to combat money laundering and terrorist financing, of which Namibia is a member country.
Compliance trainingEmployees are made aware of their responsibilities in terms of current and emerging legislative and regulatory requirements through ongoing training and awareness initiatives. Employees, including senior management, are made aware of their legislative responsibilities either through e-learning, face-to-face interventions or through targeted awareness campaigns. Training is key to embedding a culture of compliance in the group.
Regulatory changeThe group aims to embed regulatory best practice in our operations in a way that balances the interests of various stakeholders, while supporting the long-term stability and growth in the markets where we have a presence.
The group operates in a highly regulated industry across multiple jurisdictions, including the need to comply with legislation with extra-territorial reach. The group’s regulator is the Bank of Namibia (BON). BON supervises both the group and SBN, the banking entity, on a consolidated basis.

134
ANNUAL FINANCIAL STATEMENTS Annexure C Operational risk continued
Financial crime controlFinancial crime includes fraud, money laundering, violent crime and misconduct by staff, customers, suppliers, business partners, stakeholders and third parties. The group will not condone any instance of financial crime and where these instances arise, the group takes timely and appropriate remedial action.
Financial crime control is defined as the prevention and detection of, and response to, all financial crime in order to mitigate economic loss, reputational risk and regulatory sanction.
The group’s financial crime control unit is mandated by the BAC to provide capabilities which minimise the overall impact of financial crime on the group. This ensures the safety of our people and assets, and builds trust with our stakeholders.
The group’s financial crime control function reports to the group head of governance and assurance. This function enables a holistic view of the status and landscape of financial crime prevention, detection and response, including emerging threats. The group head of financial crime control has unrestricted access to executives and the chairperson of the BAC, thereby supporting the function’s independence.
Occupational health and safetyThe health and safety of all employees remains a priority. Training of health and safety officers and employee awareness is an ongoing endeavour. Group policies are being rolled out to all operations and the number of incidents being reported is reducing.
Other riskBusiness riskBusiness risk is the risk of loss due to operating revenue not covering operating costs and is usually caused by the following:
Inflexible cost structures
Market-driven pressures, such as decreased demand, increased competition or cost increases
Group-specific causes, such as a poor choice of strategy, reputational damage or the decision to absorb costs or losses to preserve reputation.
It includes strategic risk and post-retirement obligation risk.
Business continuity management and resilienceBusiness continuity management is defined as a holistic management process that identifies potential impacts that threaten the group and provides a basis for planning in mitigation to these operational impacts. It further provides a framework for building resilience and the capability for an effective response that safeguards the interests of key stakeholders, reputation, brand and value-creating activities.
The group has business resiliency and continuity plans in place to ensure its ability to operate on an ongoing basis and limit losses in the event of severe business disruptions.
Crisis management is based on a command and control process for managing the business through a crisis to full recovery. These processes may also be deployed to manage non-operational crises, including business crises, at the discretion of senior management.
Contingency and recovery plans for core services, key systems and priority business activities have been developed and are revisited as part of existing management processes to ensure that continuity strategies and plans remain relevant.
Information risk managementInformation risk is defined as the risk of accidental or intentional unauthorised use, modification, disclosure or destruction of the group’s information resources, which compromises confidentiality, integrity or availability. Information risk management deals with all aspects of information in its physical and electronic forms. It focuses on the creation, use, transmission, storage, disposal and destruction of information.
Information risk management is responsible for establishing an information security management system inclusive of an information risk management framework, and promotes information risk management policies and practices across the group.
The execution of these policies and standards is driven through a network of information security officers embedded within the business lines. This network is functionally overseen by the group chief information security officer.

SBN Holdings Limited Annual report 2016 135
Business risk is governed by exco which is ultimately responsible for managing the costs and revenues of the group.
The group mitigates business risk in a number of ways:
Extensive due diligence during the investment appraisal process is performed, in particular for new acquisitions.
New product processes per business line through which the risks and mitigating controls for new and amended products and services are tabled and discussed.
Stakeholder management ensures favourable outcomes from external factors beyond the group’s control.
The profitability of product lines and customer segments is consistently monitored.
Tight control is maintained over the group’s cost base, including the management of its cost-to-income ratio. This allows for early intervention and management action to reduce costs where necessary.
Being alert and responsive to changes in market forces.
There is a strong focus in the budgeting process on achieving headline earnings growth while containing cost growth. In addition, contingency plans are built into the budget that allow for costs to be significantly reduced in the event that expected revenue generation does not materialise.
The group continually aims to increase the ratio of variable costs to fixed costs, allowing for more flexibility to proactively reduce costs during economic downturn conditions.
Strategic riskStrategic risk is the risk that the group’s future business plans and strategies may be inadequate to prevent financial loss or protect the group’s competitive position and shareholder returns.
The group’s business plans and strategies are discussed and debated by members of management and non-executive board members.
Post-retirement obligation riskPost-retirement obligation risk is the risk to the group’s earnings that arises from the requirement to contribute as an employer to an under-funded defined benefit plan. The risk arises due to either an increase in the estimated value of medical liabilities or a decline in the market value of the fund’s assets or reduction in their investment returns.
The group operates a defined contribution plan. The group maintains a number of defined benefit pension and medical aid provider schemes for past and certain current employees, collectively termed post-retirement obligations. Refer to note 33 starting on page 87.
Reputational riskReputational risk results from damage to the group’s image which may impair its ability to retain and generate business. Such damage may result in a breakdown of trust, confidence or business relationships.
Safeguarding the group’s reputation is of paramount importance. Each business line, legal entity or support function executive is responsible for identifying, assessing and determining all reputational risks that may arise within their respective areas of business. The impact of such risks is considered alongside financial or other impacts.
Matters identified as a reputational risk to the group will be reported to the group head of governance and assurance who, if required, will escalate these matters to exco.
Should a risk event occur, the group’s crisis management processes are designed to minimise the reputational impact of the event. Crisis management teams are in place both at executive and business line level to ensure the effective management of any such events. This includes ensuring that the group’s perspective is fairly represented in the media.

136
Annexure DEmoluments of directors
GROUP
2016N$’000
2015N$’000
Executive directors 5 822 7 336Non-executive directors 2 901 2 560
8 723 9 896
ANNUAL FINANCIAL STATEMENTS continued

SBN Holdings Limited Annual report 2016 137
The accounting policies of SBN Holdings conform to the policies adopted by the Standard Bank Group (“group”).
The principal accounting policies applied by the group1 in the presentation of the annual financial statements are set out below.
1 All references to group hereafter include the separate annual financial statements, where applicable.
1. Basis of consolidationSubsidiariesThe group consolidates the annual financial statements of investees which it controls. The group controls an investee when:
it has power over the investee
has exposure or rights to variable returns from its involvement with the investee
has the ability to use its power to affect the returns from its involvement with the investee.
Annexure E Detailed group accounting policies
137 Basis of consolidation
139 Foreign currency translations
139 Cash and cash equivalents
139 Financial instruments
144 Interest in joint ventures
144 Property and equipment
144 Intangible assets
145 Property developments and properties in possession
145 Capitalisation of borrowing costs
145 Impairment of non-financial assets
145 Leases
146 Provisions, contingent assets and contingent liabilities
146 Employee benefits
147 Taxation
148 Fair value
148 Equity
148 Equity-linked transactions
149 Revenue and expenditure
150 Segment reporting
150 Fiduciary activities
150 Comparative figures
151 New standards and interpretations not yet adopted
Overview

138
existed at the acquisition date and affected the measurement of the provisional amounts.
The group elects on each acquisition to initially measure non-controlling interests on the acquisition date at either fair value or at the non-controlling interest’s proportionate share of the subsidiary’s identifiable net assets.
Identifiable assets acquired, liabilities and contingent liabilities assumed in a business combination are measured initially at their fair values at the acquisition date, irrespective of the extent of any non-controlling interest. The excess of the sum of the consideration transferred (including contingent consideration), the value of non-controlling interest recognised and the acquisition date fair value of any previously held equity interest in the subsidiary over the fair value of identifiable net assets acquired is recorded as goodwill and accounted for in terms of accounting policy 7 – Intangible assets.
If the sum of the consideration transferred, including contingent consideration, the value of non-controlling interest recognised and the acquisition date fair value of any previously held equity interest in the subsidiary is less than the fair value of the identifiable net assets acquired, the difference, referred to as a gain from a bargain purchase, is recognised directly in profit or loss.
When a business combination occurs in stages, the previously held equity interest is remeasured to fair value at the acquisition date and any resulting gain or loss is recognised in profit or loss.
Transactions with non-controlling interestsTransactions with non-controlling interests that do not result in the gain or loss of control, are accounted for as transactions with equity holders of the group. For purchases of additional interests from non-controlling interests, the difference between the purchase consideration and the group’s proportionate share of the subsidiary’s additional net asset value acquired is accounted for directly in equity. Gains or losses on the partial disposal (where control is not lost) of the group’s interest in a subsidiary to non-controlling interests are computed as the difference between the sales consideration and the group’s proportionate share of the subsidiary’s net asset value disposed of, is also accounted for directly in equity.
Common control transactionsCommon control transactions, in which the company is the ultimate parent entity both before and after the transaction, are accounted for at book value.
The annual financial statements of the investee are consolidated from the date on which the group acquires control up to the date that control is lost. Control is assessed on a continuous basis.
Intragroup transactions, balances and unrealised gains and losses are eliminated on consolidation. Unrealised losses are eliminated in the same manner as unrealised gains, but only to the extent that there is no evidence of impairment.
The proportion of comprehensive income and changes in equity allocated to the group and non-controlling interests are determined on the basis of the group’s present ownership interest in the subsidiary.
The accounting policies of subsidiaries that are consolidated by the group conform to these policies.
Investments in subsidiaries are accounted for at cost less accumulated impairment losses (where applicable) in the separate financial statements. The carrying amounts of these investments are reviewed annually for impairment indicators and, where an indicator of impairment exists, are impaired to the higher of the investment’s fair value less costs to sell and value in use.
Business combinationsThe acquisition method of accounting is used to account for the acquisition of subsidiaries by the group. The consideration transferred is measured as the sum of the fair value of the assets given, equity instruments issued and liabilities incurred or assumed at the acquisition date.
The consideration includes any asset, liability or equity resulting from a contingent consideration arrangement.
The obligation to pay contingent consideration is classified as either a liability or equity based on the terms of the arrangement. The right to a return of previously transferred consideration is classified as an asset. Transaction costs for business combinations prior to 1 January 2010 were capitalised as part of the consideration transferred. Transaction costs for business combinations on or after January 2010 are recognised within profit or loss as and when they are incurred.
Where the initial accounting for a business combination is incomplete by the end of the reporting period in which the business combination occurs, the group reports provisional amounts. Where applicable, the group adjusts retrospectively the provisional amounts to reflect new information obtained about facts and circumstances that
ANNUAL FINANCIAL STATEMENTS Annexure E Detailed group accounting policies continued

SBN Holdings Limited Annual report 2016 139
4. Financial instrumentsInitial recognition and measurementFinancial instruments include all financial assets and liabilities. These instruments are typically held for liquidity, investment, trading or hedging purposes. All financial instruments are initially recognised at fair value plus directly attributable transaction costs, except those carried at fair value through profit or loss where transaction costs are recognised immediately in profit or loss. Financial instruments are recognised (derecognised) on the date the group commits to purchase (sell) the instruments (trade date accounting). The legal enforceable right is not contingent of a future event and is enforceable in the normal course of business even in the event of default, bankruptcy and insolvency.
Subsequent measurementSubsequent to initial measurement, financial instruments are measured either at fair value or amortised cost, depending on their classifications as follows:
Held-for-trading assets and liabilitiesHeld-for-trading assets and liabilities include those financial assets and liabilities acquired or incurred principally for the purpose of selling or repurchasing in the near term, those forming part of a portfolio of identified financial instruments that are managed together and for which there is evidence of a recent actual pattern of short-term profit-taking, and commodities that are acquired principally by the group for the purpose of selling in the near future and generating a profit from fluctuations in price or broker-traders’ margin. Derivatives are always categorised as held-for-trading.
Subsequent to initial recognition, the financial instruments’ fair values are remeasured at each reporting date. All gains and losses, including interest and dividends arising from changes in fair value are recognised in profit or loss as trading revenue within non-interest revenue with the exception of derivatives that are designated and effective as hedging instruments (refer to Derivative financial instruments and hedge accounting).
Financial assets and liabilities designated at fair value through profit or lossThe group designates certain financial assets and liabilities, other than those classified as held-for-trading, as at fair value through profit or loss when:
this designation eliminates or significantly reduces an accounting mismatch that would otherwise arise. Under this criterion, the main classes of financial instruments
2. Foreign currency translationsFunctional and presentation currencyItems included in the annual financial statements of each of the group’s entities are measured using the currency of the primary economic environment in which the entity operates (functional currency).
The annual financial statements are presented in Namibian dollar, which is the functional and presentation currency of the group.
Transactions and balancesForeign currency transactions are translated into the respective functional currencies of group entities at exchange rates prevailing at the date of the transactions. Foreign exchange gains and losses resulting from the settlement of such transactions and from the translation of monetary assets and liabilities denominated in foreign currencies at year end exchange rates, are recognised in profit or loss (except when recognised in OCI as part of qualifying cash flow hedges and net investment hedges).
Non-monetary assets and liabilities denominated in foreign currencies that are measured at historical cost are translated using the exchange rate at the transaction date, and those measured at fair value are translated at the exchange rate at the date that the fair value was determined. Exchange rate differences on non-monetary items are accounted for based on the classification of the underlying items. Foreign exchange gains and losses on equities (debt) classified as available-for-sale financial assets are recognised in the available-for-sale reserve in OCI (profit or loss) whereas the exchange differences on equities and debt that are classified as held at fair value through profit or loss are reported as part of the fair value gain or loss in profit or loss.
Foreign currency gains and losses on intragroup loans are recognised in profit or loss except where the settlement of the loan is neither planned nor likely to occur in the foreseeable future. In these cases the foreign currency gains and losses are recognised in the group’s foreign currency translation reserve. These gains and losses are accounted for similarly to the exchange gains and losses as described in this accounting policy for group companies.
3. Cash and cash equivalentsCash and cash equivalents presented in the statement of cash flows consist of cash and balances with central banks. Cash and balances with central banks comprise coins and bank notes, and balances with central banks. Cash and cash equivalents include short-term highly liquid items.

140
Interest income, calculated using the effective interest method, is recognised in profit or loss. Dividends received on debt (equity) available-for-sale instruments are recognised in interest income (other revenue) within profit or loss when the group’s right to receive payment has been established.
Loans and receivablesLoans and receivables are non-derivative financial assets with fixed or determinable payments that are not quoted in an active market, other than those classified by the group as at fair value through profit or loss or available-for-sale.
Loans and receivables are measured at amortised cost using the effective interest method, less any impairment losses. Origination transaction costs and origination fees received that are integral to the effective rate are capitalised to the value of the loan and amortised through interest income as part of the effective interest rate. The majority of the group’s loans and advances are included in the loans and receivables category.
Financial liabilities at amortised costFinancial liabilities that are neither held for trading nor designated at fair value are measured at amortised cost.
Reclassification of financial assetsThe group may choose to reclassify non-derivative trading assets out of the held-for-trading category if the financial asset is no longer held for the purpose of selling it in the near term. Financial assets that would not otherwise have met the definition of loans and receivables are permitted to be reclassified out of the held-for-trading category only in rare circumstances. In addition, the group may choose to reclassify financial assets that would meet the definition of loans and receivables out of the held-for-trading or available-for-sale categories if the group, at the date of reclassification, has the intention and ability to hold these financial assets for the foreseeable future or until maturity.
Derivatives or any financial instrument designated at fair value through profit or loss shall not be reclassified out of their respective categories.
Reclassifications are made at fair value as of the reclassification date. Effective interest rates for financial assets reclassified to loans and receivables, held-to-maturity and available-for-sale categories are determined at the reclassification date. Subsequent increases in estimates of cash flows adjust the financial asset’s effective interest rates prospectively.
designated by the group are loans and advances to banks and customers and financial investments. The designation significantly reduces measurement inconsistencies that would have otherwise arisen. For example, where the related derivatives were treated as held-for-trading and the underlying financial instruments were carried at amortised cost. This category also includes financial assets used to match investment contracts or insurance contract liabilities
groups of financial assets, financial liabilities or both are managed, and their performance evaluated, on a fair value basis in accordance with a documented risk management or investment strategy, and reported to the group’s key management personnel on a fair-value basis. Under this criterion, certain private equity, short-term insurance and other investment portfolios have been designated at fair value through profit or loss, or
financial instruments containing one or more embedded derivatives that significantly modify the instruments’ cash flows.
The fair value designation is made on initial recognition and is irrevocable. Subsequent to initial recognition, the fair values are remeasured at each reporting date. Gains and losses arising from changes in fair value are recognised in interest income (interest expense) for all debt financial assets (financial liabilities) and in other revenue within non-interest revenue for all equity instruments.
Available-for-saleFinancial assets classified by the group as available-for-sale are generally strategic capital investments held for an indefinite period of time, which may be sold in response to needs for liquidity or changes in interest rates, exchange rates or equity prices, or non-derivative financial assets that are not classified within another category of financial assets.
Available-for-sale financial assets are subsequently measured at fair value. Unrealised gains or losses are recognised directly in the available-for-sale reserve until the financial asset is derecognised or impaired. When debt (equity) available-for-sale financial assets are disposed of, the cumulative fair value adjustments in OCI are reclassified to interest income (other revenue).
Available-for-sale financial assets are impaired when there has been a significant or prolonged decline in the fair value of the financial asset below its cost. The cumulative fair value adjustments previously recognised in OCI on the impaired financial assets are reclassified to profit or loss. Reversal of impairments on equity available-for-sale financial assets are recognised in OCI.
ANNUAL FINANCIAL STATEMENTS Annexure E Detailed group accounting policies continued

SBN Holdings Limited Annual report 2016 141
The calculation of the present value of the estimated future cash flows of collateralised financial assets recognised on an amortised cost basis includes cash flows that may result from foreclosure less costs of obtaining and selling the collateral, whether or not foreclosure is probable.
If the group determines that no objective evidence of impairment exists for an individually assessed loan, whether significant or not, it includes the loan in a group of financial loans with similar credit risk characteristics and collectively assesses for impairment. Loans that are individually assessed for impairment and for which an impairment loss is recognised are not included in a collective assessment for impairment.
Impairment of groups of loans that are assessed collectively is recognised where there is objective evidence that a loss event has occurred after the initial recognition of the group of loans but before the reporting date. In order to provide for latent losses in a group of loans that have not yet been identified as specifically impaired, a credit impairment for incurred but not reported losses is recognised based on historic loss patterns and estimated emergence periods (time period between the loss trigger events and the date on which the group identifies the losses). Groups of loans are also impaired when adverse economic conditions develop after initial recognition, which may impact future cash flows. The carrying amount of groups of loans is reduced through the use of a portfolio credit impairment account and the loss is recognised as a credit impairment charge in profit or loss.
Increases in loan impairments and any subsequent reversals thereof, or recoveries of amounts previously impaired (including loans that have been written off), are reflected within credit impairment charges in profit or loss. Previously impaired loans are written off once all reasonable attempts at collection have been made and there is no realistic prospect of recovering outstanding amounts. Any subsequent reductions in amounts previously impaired are reversed by adjusting the allowance account with the amount of the reversal recognised as a reduction in impairment for credit losses in profit or loss.
Subsequent to impairment, the effects of discounting unwind over time as interest income.
Renegotiated loansLoans that would otherwise be past due or impaired and whose terms have been renegotiated and exhibit the characteristics of a performing loan are reset to performing loan status. Loans whose terms have been renegotiated
On reclassification of a trading asset, all embedded derivatives are reassessed and, if necessary, accounted for separately.
Impairment of financial assetsAssets carried at amortised costThe group assesses at each reporting date whether there is objective evidence that a loan or group of loans is impaired. A loan or group of loans is impaired if objective evidence indicates that a loss event has occurred after initial recognition and that loss event has a negative effect on the estimated future cash flows of the loan or group of loans that can be estimated reliably.
Criteria that are used by the group in determining whether there is objective evidence of impairment include:
known cash flow difficulties experienced by the borrower
a breach of contract, such as default or delinquency in interest and/or principal payments
breaches of loan covenants or conditions
it becoming probable that the borrower will enter bankruptcy or other financial reorganisation
where the group, for economic or legal reasons relating to the borrower’s financial difficulty, grants the borrower a concession that the group would not otherwise consider.
The group first assesses whether there is objective evidence of impairment individually for loans that are individually significant, and individually or collectively for loans that are not individually significant. Non-performing loans include those loans for which the group has identified objective evidence of default, such as a breach of a material loan covenant or condition as well as those loans for which instalments are due and unpaid for 90 days or more. The impairment of non-performing loans takes into account past loss experience adjusted for changes in economic conditions and the nature and level of risk exposure since the recording of the historic losses.
When a loan carried at amortised cost has been identified as specifically impaired, the carrying amount of the loan is reduced to an amount equal to the present value of its estimated future cash flows, including the recoverable amount of any collateral, discounted at the financial asset’s original effective interest rate. The carrying amount of the loan is reduced through the use of a specific credit impairment account and the loss is recognised as a credit impairment charge in profit or loss.

142
and is settled at a future date. Derivatives are initially recognised at fair value on the date on which the derivatives are entered into and subsequently remeasured at fair value as described under the fair value policy above.
All derivative instruments are carried as financial assets when the fair value is positive and as financial liabilities when the fair value is negative, subject to offsetting principles as described under the heading “Offsetting financial instruments” above.
Embedded derivatives included in hybrid instruments are treated and disclosed as separate derivatives when their economic characteristics and risks are not closely related to those of the host contract, the terms of the embedded derivative are the same as those of a stand-alone derivative and the combined contract is not measured at fair value through profit or loss. The financial host contracts are accounted for and measured applying the rules of the relevant financial instrument category.
The method of recognising fair value gains and losses depends on whether the derivatives are designated as hedging instruments, and if so, the nature of the hedge relationship, or if they are classified as held-for-trading.
Derivatives that qualify for hedge accountingWhen derivatives are designated in a hedge relationship, the group designates them as:
hedges of the fair value of recognised financial assets or liabilities or firm commitments (fair value hedges).
Hedge accounting is applied to derivatives designated in this way provided certain criteria are met. The group documents, at the inception of the hedge relationship, the relationship between hedged items and hedging instruments, as well as its risk management objective and strategy for undertaking various hedging relationships. The group also documents its assessment, both at the inception of the hedge and on an ongoing basis, of whether the hedging instruments are highly effective in offsetting changes in fair values or cash flows of hedged items.
Fair value hedgesWhere a hedging relationship is designated as a fair value hedge, the hedged item is adjusted for the change in fair value in respect of the risk being hedged. Gains or losses on the remeasurement of both the derivative and the hedged
are subject to ongoing review to determine whether they are considered to be impaired or past due.
The effective interest rate of renegotiated loans that have not been derecognised (described under the heading Derecognition of financial instruments), is redetermined based on the loan’s renegotiated terms.
Available-for-sale financial assetsAvailable-for-sale financial assets are impaired if there is objective evidence of impairment, resulting from one or more loss events that occurred after initial recognition but before the reporting date, that have a negative impact on the future cash flows of the asset. In addition, an available-for-sale equity instrument is considered to be impaired if a significant or prolonged decline in the fair value of the instrument below its cost has occurred. In that instance, the cumulative loss, measured as the difference between the acquisition price and the current fair value, less any previously recognised impairment losses on that financial asset, is reclassified from OCI to profit or loss.
If, in a subsequent period, the amount relating to an impairment loss decreases and the decrease can be linked objectively to an event occurring after the impairment loss was recognised in profit or loss, the impairment loss is reversed through profit or loss for available-for-sale debt instruments. Any reversal of an impairment loss in respect of an available-for-sale equity instrument is recognised directly in OCI.
Offsetting financial instrumentsFinancial assets and liabilities are offset and the net amount reported in the statement of financial position when there is a legally enforceable right to set-off the recognised amounts and there is an intention to settle the asset and the liability on a net basis, or to realise the asset and settle the liability simultaneously.
Income and expenses are presented on a net basis only when permitted by the accounting standards, or for gains and losses arising from a group of similar transactions.
Derivative financial instruments and hedge accountingA derivative is a financial instrument whose fair value changes in response to an underlying variable, requires no initial net investment or an initial net investment that is smaller than would be required for other types of contracts that would be expected to have a similar response to changes in market factors
ANNUAL FINANCIAL STATEMENTS Annexure E Detailed group accounting policies continued

SBN Holdings Limited Annual report 2016 143
Subsequent to initial recognition, the financial guarantee liability is measured at the higher of the present value of any expected payment, when a payment under the guarantee has become probable, and the unamortised premium.
Derecognition of financial instrumentsFinancial assets are derecognised when the contractual rights to receive cash flows from the financial assets have expired, or where the group has transferred its contractual rights to receive cash flows on the financial asset such that it has transferred substantially all the risks and rewards of ownership of the financial asset. Any interest in transferred financial assets that is created or retained by the group is recognised as a separate asset or liability.
The group enters into transactions whereby it transfers assets recognised in its statement of financial position, but retains either all or a portion of the risks or rewards of the transferred assets. If all or substantially all risks and rewards are retained, then the transferred assets are not derecognised. Transfers of assets with the retention of all or substantially all risks and rewards include securities lending and repurchase agreements.
When assets are sold to a third party with a concurrent total rate of return swap on the transferred assets, the transaction is accounted for as a secured financing transaction, similar to repurchase transactions. In transactions where the group neither retains nor transfers substantially all the risks and rewards of ownership of a financial asset, the asset is derecognised if control over the asset is lost. The rights and obligations retained in the transfer are recognised separately as assets and liabilities as appropriate.
In transfers where control over the asset is retained, the group continues to recognise the asset to the extent of its continuing involvement, determined by the extent to which it is exposed to changes in the value of the transferred asset.
Financial liabilities are derecognised when they are extinguished, that is, when the obligation is discharged, cancelled or expires.
Where an existing financial asset or liability is replaced by another with the same counterparty on substantially different terms, or the terms of an existing financial asset or liability are substantially modified, such an exchange or modification is treated as a derecognition of the original asset or liability and the recognition of a new asset or liability, with the difference in the respective carrying amounts being recognised in profit or loss.
item are recognised in profit or loss. Fair value adjustments relating to the hedging instrument are allocated to the same line item in profit or loss as the related hedged item. Any hedge ineffectiveness is recognised in profit or loss as trading revenue.
If the derivative expires, is sold, terminated, exercised, no longer meets the criteria for fair value hedge accounting, or the designation is revoked, then hedge accounting is discontinued. The adjustment to the carrying amount of a hedged item measured at amortised cost, for which the effective interest method is used, is amortised to profit or loss as part of the hedged item’s recalculated effective interest rate over the period to maturity.
Derivatives that do not qualify for hedge accountingAll gains and losses from changes in the fair values of derivatives that do not qualify for hedge accounting are recognised immediately in profit or loss as trading revenue.
BorrowingsBorrowings are recognised initially at fair value, generally being their issue proceeds, net of directly attributable transaction costs incurred. Borrowings are subsequently measured at amortised cost and interest is recognised using the effective interest method.
Preference shares, which carry a mandatory coupon and redemption, or are redeemable on a specific date, at the occurrence of a contingent future event, or at the option of the shareholder are classified as financial liabilities or compound financial instruments (instruments with debt and equity components). All other preference shares are classified as equity instruments. Dividends on preference shares classified as financial liabilities are accounted for as interest on an amortised cost basis using the effective interest method. Dividends on preference shares classified as equity instruments are recognised within equity as a dividend payment when dividends are declared.
Financial guarantee contractsA financial guarantee contract is a contract that requires the group (issuer) to make specified payments to reimburse the holder for a loss it incurs because a specified debtor fails to make payment when due in accordance with the original or modified terms of a debt instrument.
Financial guarantee contracts are initially recognised at fair value, which is generally equal to the premium received, and then amortised over the life of the financial guarantee.

144
Costs that are subsequently incurred are included in the asset’s related carrying amount or are recognised as a separate asset, as appropriate, only when it is probable that future economic benefits will flow to the group and the cost of the item can be measured reliably. Expenditure, which does not meet these criteria, is recognised in profit or loss as incurred. Depreciation, impairment losses and gains and losses on disposal of assets are included in profit or loss.
Owner-occupied properties are held for use in the supply of services or for administrative purposes.
Property and equipment are depreciated on the straight-line basis over the estimated useful lives of the assets to their residual values. Land is not depreciated. Leasehold buildings are depreciated over the period of the lease or over a lesser period, as is considered appropriate.
The assets’ residual values, useful lives and the depreciation method applied are reviewed, and adjusted if appropriate, at each financial year end.
The estimated useful lives of tangible assets are typically as follows:
Buildings 40 years
Computer equipment 3 to 5 years
Motor vehicles 4 to 5 years
Office equipment 5 to 10 years
Furniture and fittings 5 to 13 years
Capitalised leased assets over the shorter of the lease term or its useful life
7. Intangible assetsThe intangible assets consist of the cost incurred on Finacle, one of the group’s core banking systems. Intangible assets are carried at cost less accumulated amortisation and accumulated impairment losses from the date that the assets are available for use. Expenditure subsequently incurred on the software is capitalised only when it increases the future economic benefits embodied in the specific asset to which it relates.
Amortisation is recognised in operating expenses on a straight-line basis.
Finacle 15 years
In all other instances, the renegotiated asset or liability’s effective interest rate is redetermined taking into account the renegotiated terms.
5. Interest in joint venturesJoint venturesA joint venture is a joint arrangement whereby the parties that have joint control of the arrangement have rights to the net assets of the arrangement. Joint control is the contractually agreed sharing of control of an arrangement which only exists when decisions about the relevant activities of the joint arrangement require unanimous consent of the parties sharing control.
Interests in joint ventures are accounted for using the equity method and are measured in the statement of financial position at an amount that reflects the group’s share of the net assets of the joint venture (including goodwill).
Equity accounting involves recognising the investment initially at cost, including goodwill, and subsequently adjusting the carrying value for the group’s share of the joint ventures income and expenses and OCI. Equity accounting of losses in joint ventures is restricted to the interests in these entities, including unsecured receivables or other commitments, unless the group has an obligation or has made payments on behalf of the joint ventures. Unrealised profits from “upstream” and “downstream” transactions are eliminated in determining the group’s share of equity accounted profits. Unrealised losses are eliminated in the same way as unrealised gains, but only to the extent that there is no evidence of impairment.
Equity accounting is applied from the date on which the entity becomes a joint venture up to the date on which it ceases to be a joint venture. The accounting policies of joint ventures have been changed where necessary to ensure consistency with the policies of the group.
Investments in associates and joint ventures are accounted for at cost less impairment losses in the company’s annual financial statements.
6. Property and equipmentEquipment and owner-occupied propertiesEquipment, furniture, vehicles and other tangible assets are measured at cost less accumulated depreciation and accumulated impairment losses. Cost includes expenditure that is directly attributable to the acquisition of the asset. Where significant parts of an item of property or equipment have different useful lives, they are accounted for as separate items (major components) of property and equipment.
ANNUAL FINANCIAL STATEMENTS Annexure E Detailed group accounting policies continued

SBN Holdings Limited Annual report 2016 145
impairment, assets that cannot be tested individually are grouped at the lowest levels for which there are separately identifiable cash inflows from continuing use (CGUs). Impairment losses recognised in respect of cash-generating units are allocated first to reduce the carrying amount of any goodwill allocated to the units, and then to reduce the carrying amounts of the other assets in the unit on a pro rata basis.
An impairment loss in respect of goodwill is not reversed. In respect of other non-financial assets, impairment losses recognised in prior periods are assessed at each reporting date for any indications that the loss has decreased or no longer exists. An impairment loss is reversed if there has been a change in the estimates used to determine the recoverable amount. An impairment loss is reversed through profit or loss only to the extent that the asset’s carrying amount does not exceed the carrying amount that would have been determined, net of depreciation or amortisation, if no impairment loss had been recognised.
11. LeasesA lease is an agreement whereby the lessor conveys to the lessee in return for a payment or series of payments the right to use an asset for an agreed period of time. A lease of assets is either classified as a finance lease or operating lease.
Group as lesseeLeases, where the group assumes substantially all the risks and rewards incidental to ownership, are classified as finance leases. All other leases are classified as operating leases.
Finance leases are capitalised at the inception of the lease at the lower of the fair value of the leased asset and the present value of the minimum lease payments. Lease payments are calculated using the interest rate implicit in the lease, or the group’s incremental borrowing rate to identify the finance cost, which is recognised in profit or loss over the lease period, and the capital repayment, which reduces the liability to the lessor.
Payments made under operating leases, net of any incentives received from the lessor, are recognised in profit or loss on a straight-line basis over the term of the lease. Contingent rentals are expensed as they are incurred. When an operating lease is terminated before the lease period has expired, any payment required to be made to the lessor by way of penalty is recognised as an expense in the period in which termination takes place.
8. Property developments and properties in possession
Property developments are stated at the lower of cost or net realisable value. Cost is assigned by specific identification and includes the cost of acquisition and where applicable, development and borrowing costs during development. When development is completed borrowing costs and other charges are expensed as incurred.
Properties in possession are properties acquired by the group which were previously held as collateral for underlying lending arrangements that, subsequent to origination, have defaulted. The property is recognised at the time at which the risks and rewards of the properties are transferred to the group. The properties are initially recognised at cost and are subsequently measured at the lower of cost and its net realisable value. Any subsequent write-down in the value of the acquired properties is recognised as an operating expense. Any subsequent increases in the net realisable value, to the extent that it does not exceed its original cost, are also recognised within operating expenses.
9. Capitalisation of borrowing costsBorrowing costs that relate to qualifying assets, that is, assets that necessarily take a substantial period of time to get ready for their intended use or sale and which are not measured at fair value, are capitalised. All other borrowing costs are recognised in profit or loss.
10. Impairment of non-financial assetsIntangible assets that have an indefinite useful life and goodwill are tested annually for impairment and additionally when an indicator of impairment exists. Intangible assets that are subject to amortisation and other non-financial assets are reviewed for impairment at each reporting date and tested for impairment whenever events or changes in circumstances indicate that the carrying amount may not be recoverable.
An impairment loss is recognised in profit or loss for the amount by which the asset’s carrying amount exceeds its recoverable amount. The recoverable amount is the higher of an asset’s fair value less costs to sell and value in use. Fair value less costs to sell is determined by ascertaining the current market value of an asset and deducting any costs related to the realisation of the asset. In assessing value in use, the estimated future cash flows are discounted to their present value using a pre-tax discount rate that reflects current market assessments of the time value of money and the risks specific to the asset. For the purposes of assessing

146
Group as lessorLeases, where the group transfers substantially all the risks and rewards incidental to ownership, are classified as finance leases. All other leases are classified as operating leases.
Lease and instalment sale contracts are primarily financing transactions in banking activities, with rentals and instalments receivable, less unearned finance charges, being included in loans and advances in the statement of financial position.
Finance charges earned are computed using the effective interest method, which reflects a constant periodic rate of return on the investment in the finance lease. Initial direct costs and fees are capitalised to the value of the lease receivable and accounted for over the lease term as an adjustment to the effective rate of return. The tax benefits arising from investment allowances on assets leased to clients are accounted for in the direct taxation line.
Operating lease income from properties held as investment properties, net of any incentives given to lessees, is recognised on the straight-line basis or a more representative basis where applicable over the lease term. When an operating lease is terminated before the lease period has expired, any payment required by the group by way of a penalty is recognised as income in the period in which termination takes place.
12. Provisions, contingent assets and contingent liabilities
Provisions are recognised when the group has a present legal or constructive obligation as a result of past events, it is probable that an outflow of resources embodying economic benefits will be required to settle the obligation and a reliable estimate of the amount of the obligation can be made. Provisions are determined by discounting the expected future cash flows using a pre-tax discount rate that reflects current market assessments of the time value of money and the risks specific to the liability.
A provision for restructuring is recognised when the group has approved a detailed formal plan, and the restructuring either has commenced or has been announced publicly. Future operating costs or losses are not provided for.
A provision for onerous contracts is recognised when the expected benefits to be derived by the group from a contract are lower than the unavoidable cost of meeting its obligations under the contract. The provision is measured at the present value of the lower of the expected cost of terminating the contract and the expected net cost of continuing with
the contract. Before a provision is established, the group recognises any impairment loss on the assets associated with that contract.
Contingent assets are not recognised in the annual financial statements but are disclosed when, as a result of past events, it is probable that economic benefits will flow to the group, but this will only be confirmed by the occurrence or non-occurrence of one or more uncertain future events which are not wholly within the group’s control.
Contingent liabilities include certain guarantees, other than financial guarantees, and letters of credit. Contingent liabilities are not recognised in the annual financial statements but are disclosed in the notes to the annual financial statements unless they are remote.
13. Employee benefitsPost-employment benefitsDefined contribution plansThe group operates a number of defined contribution plans, based on a percentage of pensionable earnings funded by both employer companies and employees, the assets of which are generally held in separate trustee-administered funds.
Contributions to these plans are recognised as an expense in profit or loss in the periods during which services are rendered by employees.
Defined benefit plansDefined benefit plansThe group also operates a number of defined benefit plans, with membership generally limited to employees who were in the employment of the various companies at specified dates. Employer companies contribute to the cost of benefits taking account of the recommendations of the actuaries. Statutory actuarial valuations are required every three years using the projected unit credit method. Interim valuations are also performed annually at the financial year end. Within the defined benefit plans, the group operates a number of funded and unfunded post-employment medical aid schemes, with membership limited to employees who were retired or in the employment of the various companies at specified dates and complying with specific criteria.
The assets or liabilities recognised in the statement of financial position in respect of defined benefit plans are measured at the present value of the estimated future cash outflows, using interest rates of government bonds denominated in the same currency as the defined benefit
ANNUAL FINANCIAL STATEMENTS Annexure E Detailed group accounting policies continued

SBN Holdings Limited Annual report 2016 147
plan (corporate bonds are used for currencies for which there is a deep market of high quality corporate bonds), with maturity dates that approximate the expected maturity of the obligations, less the fair value of plan assets. A defined benefit asset is only recognised to the extent that economic benefits are available to the group from reductions in future contributions or future refunds from the plan.
Net interest income/(expense) is determined on the defined benefit asset/(liability) by applying the discount rate used to measure the defined benefit obligation at the beginning of the annual period to the net defined benefit asset/(liability). The net interest income/(expense) is recognised in profit or loss. Other expenses related to the defined benefit plans are also recognised in profit or loss.
Remeasurements of the net defined benefit obligation, including actuarial gains and losses, the return on plan assets (excluding interest calculated) and the effect of any asset ceiling are recognised within OCI.
When the benefits of a plan are changed or when a plan is curtailed, the resulting change in benefit that relates to past service or the gain or loss on curtailment is recognised immediately in profit or loss. The group recognises gains and losses on the settlement of a defined benefit plan when the settlement occurs.
For the significant judgements and estimates applied refer to note 30.
Termination benefitsTermination benefits are recognised as an expense when the group is committed, without realistic possibility of withdrawal, to a formal detailed plan to terminate employment before the normal retirement date, or to provide termination benefits as a result of an offer made to encourage voluntary redundancy. Termination benefits for voluntary redundancies are recognised as an expense if the group has made an offer encouraging voluntary redundancy, it is probable that the offer will be accepted, and the number of acceptances can be estimated reliably.
Short-term benefitsShort-term benefits consist of salaries, accumulated leave payments, profit share, bonuses and any non-monetary benefits such as medical aid contributions.
Short-term employee benefit obligations are measured on an undiscounted basis and are expensed as the related service is provided.
A liability is recognised for the amount expected to be paid under short-term cash bonus plans or accumulated leave if the group has a present legal or constructive obligation to pay this amount as a result of past service provided by the employee and the obligation can be estimated reliably.
14. TaxationDirect taxation Direct taxation includes current and deferred tax. Current tax and deferred tax are recognised in profit or loss except to the extent that it relates to a business combination or items recognised directly in equity.
Current tax represents the expected tax payable on taxable income for the year, using tax rates enacted or substantively enacted at the reporting date, and any adjustments to tax payable in respect of previous years.
Deferred tax is recognised in respect of temporary differences arising between the tax bases of assets and liabilities and their carrying values for financial reporting purposes. Deferred tax is measured at the tax rates that are expected to be applied to the temporary differences when they reverse, based on the laws that have been enacted or substantively enacted at the reporting date. Deferred tax is not recognised for the following temporary differences:
The initial recognition of goodwill
• The initial recognition of assets and liabilities in a transaction that is not a business combination, which affects neither accounting nor taxable profits or losses
• Investments in subsidiaries, associates and jointly controlled arrangements (excluding mutual funds) where the group controls the timing of the reversal of temporary differences and it is probable that these differences will not reverse in the foreseeable future.
The amount of deferred tax provided is based on the expected manner of realisation or settlement of the carrying amount of the asset or liability and is not discounted.
Deferred tax assets are recognised to the extent that it is probable that future taxable income will be available against which the unused tax losses can be utilised. Deferred tax assets are reviewed at each reporting date and are reduced to the extent that it is no longer probable that the related tax benefit will be realised.
Current and deferred tax assets and liabilities are offset if there is a legally enforceable right to offset current tax

148
liabilities and assets, and they relate to income taxes levied by the same tax authority on the same taxable entity, or on different tax entities, but they intend to settle current tax liabilities and assets on a net basis or their tax assets and liabilities will be realised simultaneously.
Indirect taxationIndirect taxes, including non-recoverable value added tax (VAT) and other duties for banking activities, are recognised in profit or loss and disclosed separately in the income statement.
15. Fair valueFair value is the price that would be received to sell an asset or paid to transfer a liability in an orderly transaction in the principal (or most advantageous) market between market participants at the measurement date under current market conditions.
When a price for an identical asset or liability is not observable, fair value is measured using another valuation technique that maximises the use of relevant observable inputs and minimises the use of unobservable inputs.
In estimating the fair value of an asset or a liability, the group takes into account the characteristics of the asset or liability that market participants would take into account when pricing the asset or liability at measurement date.
Subsequent to initial recognition, fair value is measured based on quoted market prices or dealer price quotations for the assets and liabilities that are traded in active markets and where those quoted prices represent fair value at the measurement date. If the market for an asset or liability is not active or the instrument is unlisted, the fair value is determined using other applicable valuation techniques. These include the use of recent arm’s length transactions, discounted cash flow analyses, pricing models and other valuation techniques commonly used by market participants.
Where discounted cash flow analyses are used, estimated future cash flows are based on management’s best estimates and a market-related discount rate at the reporting date for an asset or liability with similar terms and conditions.
If an asset or a liability measured at fair value has both a bid and an ask price, the price within the bid-ask spread that is most representative of fair value is used to measure fair value.
The group has elected the portfolio exception to measure the fair value of certain groups of financial assets and financial liabilities. This exception permits the group of financial assets and financial liabilities to be measured at fair value on a net basis. This election is applied where the group:
manages the group of financial assets and financial liabilities on the basis of the group’s net exposure to a particular market risk (or risks) or to the credit risk of a particular counterparty in accordance with the group’s documented risk management or investment strategy
provides information on that basis about the group of financial assets and financial liabilities to the group’s key management personnel
is required to or has elected to measure those financial assets and financial liabilities at fair value at the end of each reporting period.
Where the fair value of investments in equity instruments or identical instruments do not have a quoted price in an active market, and derivatives that are linked to and must be settled by delivery of such equity instruments, are unable to be reliably determined, those instruments are measured at cost less impairment losses. Impairment losses on these financial assets are not reversed.
Fair value measurements are categorised into level 1, 2 or 3 based on the degree to which the inputs to the fair value measurements are observable and the significance of the inputs to the fair value measurement.
16. EquityShare issue costsIncremental external costs directly attributable to a transaction that increases or decreases equity are deducted from equity, net of related tax. All other share issue costs are expensed.
Distributions on ordinary sharesDistributions are recognised in equity in the period in which they are declared. Distributions declared after the reporting date are disclosed in the distributions note.
17. Equity-linked transactionsEquity compensation plansThe group operates both equity-settled and cash-settled share-based compensation plans. All share options issued after 7 November 2002 that had not vested by 31 December 2004 are accounted for as share-based payment transactions.
ANNUAL FINANCIAL STATEMENTS Annexure E Detailed group accounting policies continued

SBN Holdings Limited Annual report 2016 149
The fair value of equity-settled share options is determined on the grant date and accounted for as staff costs over the vesting period of the share options, with a corresponding increase in the share-based payment reserve. Non-market vesting conditions, such as the resignation of employees and retrenchment of staff, are not considered in the valuation but are included in the estimate of the number of options expected to vest. At each reporting date, the estimate of the number of options expected to vest is reassessed and adjusted against profit or loss and equity over the remaining vesting period.
On vesting of share options, amounts previously credited to the share-based payment reserve are transferred to retained earnings through an equity transfer. On exercise of equity-settled share options, proceeds received are credited to share capital and premium.
Share-based payments settled in cash are accounted for as liabilities at fair value until settled. The liability is recognised over the vesting period and is revalued at every reporting date and on settlement. Any changes in the liability are recognised in profit or loss.
18. Revenue and expenditureBanking activitiesRevenue is derived substantially from the business of banking and related activities and comprises interest income, fee and commission revenue, trading revenue and other non-interest revenue.
Net interest incomeInterest income and expense (with the exception of those borrowing costs that are capitalised – refer to accounting policy 8 – Capitalisation of borrowing costs) are recognised in profit or loss on an accrual basis using the effective interest method for all interest-bearing financial instruments, except for those classified at fair value through profit or loss. In terms of the effective interest method, interest is recognised at a rate that exactly discounts estimated future cash payments or receipts through the expected life of the financial instrument or, where appropriate, a shorter period, to the net carrying amount of the financial asset or financial liability. Direct incremental transaction costs incurred and origination fees received, including loan commitment fees, as a result of bringing margin-yielding assets or liabilities into the statement of financial position, are capitalised to the carrying amount of financial instruments that are not at fair value through profit or loss and amortised as interest income or expense over the life of the asset or liability as part of the effective interest rate.
Where the estimates of payments or receipts on financial assets (except those that have been reclassified – refer to accounting policy 4 – Financial instruments) or financial liabilities are subsequently revised, the carrying amount of the financial asset or financial liability is adjusted to reflect actual and revised estimated cash flows. The carrying amount is calculated by computing the present value of the estimated cash flows at the financial asset or financial liability’s original effective interest rate. Any adjustment to the carrying value is recognised in net interest income.
Where financial assets have been impaired, interest income continues to be recognised on the impaired value based on the original effective interest rate.
Fair value gains and losses on realised debt financial instruments, including amounts reclassified from OCI in respect of available-for-sale debt financial assets, and excluding those classified as held-for-trading, are included in net interest income.
Dividends received on preference share investments classified as debt form part of the group’s lending activities and are included in interest income.
Non-interest revenueFee and commission revenue, including transactional fees, account servicing fees, investment management fees, sales commissions and placement fees are recognised as the related services are performed. Loan commitment fees for loans that are not expected to be drawn down are recognised on a straight-line basis over the commitment period. Loan syndication fees, where the group does not participate in the syndication or participates at the same effective interest rate for comparable risk as other participants, are recognised as revenue when the syndication has been completed. Syndication fees that do not meet these criteria are capitalised as origination fees and amortised as interest income.
Fee and commission expense included in net fee and commission revenue are mainly transaction and service fees relating to financial instruments, which are expensed as the services are received. Expenditure is recognised as fee and commission expenses where the expenditure is linked to the production of fee and commission revenue.
Trading revenueTrading revenue comprises all gains and losses from changes in the fair value of trading assets and liabilities, together with related interest income, expense and dividends.

150
Other revenueOther revenue includes gains and losses on equity instruments designated at fair value through profit or loss, dividends relating to those financial instruments, underwriting profit from the group’s short-term insurance operations and related insurance activities and remeasurement gains and losses from contingent consideration on disposals and purchases.
Gains and losses on equity available-for-sale financial assets are reclassified from OCI to profit or loss on derecognition or impairment of the investments. Dividends on these instruments are recognised in profit or loss.
Dividend incomeDividends are recognised in profit or loss when the right to receipt is established. Scrip dividends are recognised as dividends received where the dividend declaration allows for a cash alternative.
Short-term insurance income
Short-term insurance income includes premium income, commission and policy fees earned, as well as net incurred claim losses and broker commission paid. Annual business income is accounted for on the accrual basis and comprises the cash value of commission and fees earned when premiums or fees are payable directly to the group. Direct commission income is accounted for as and when cash is received and comprises the cash value of commission earned when premiums are payable directly to the underwriters.
Management fees on assets under managementFee income includes management fees on assets under management and administration fees. Management fees on assets under management are recognised over the period for which the services are rendered, in accordance with the substance of the relevant agreements.
Administration fees received for the administration of medical schemes are recognised when the services are rendered.
19. Segment reportingAn operating segment is a component of the group engaged in business activities, whose operating results are reviewed regularly by management in order to make decisions about resources to be allocated to segments and assessing segment performance. The group’s identification of segments and the measurement of segment results is based on the group’s internal reporting to the chief operating decision maker.
Transactions between segments are priced at market-related rates.
20. Fiduciary activitiesThe group commonly engages in trust or other fiduciary activities that result in the holding or placing of assets on behalf of individuals, trusts, post-employment benefit plans and other institutions. These assets and the income arising directly thereon are excluded from these annual financial statements as they are not assets of the group. However, fee income earned and fee expenses incurred by the group relating to the group’s responsibilities from fiduciary activities are recognised in profit or loss.
21. Comparative figuresWhere necessary, comparative figures within notes have been restated to conform to changes in presentation in the current year.
ANNUAL FINANCIAL STATEMENTS Annexure E Detailed group accounting policies continued

SBN Holdings Limited Annual report 2016 151
NEW STANDARDS AND INTERPRETATIONS NOT YET ADOPTED
The following new or revised standards, amendments and interpretations are not yet effective for the year ended 31 December 2015 and have not been applied in preparing these annual financial statements.
PRONOUNCEMENT TITLE EFFECTIVE DATE
IFRS 9 Financial InstrumentsThis standard will replace the existing standard on the recognition and measurement of financial instruments and requires all financial assets to be classified and measured on the basis of the entity’s business model for managing the financial assets and the contractual cash flow characteristics of the financial assets.
The accounting for financial assets differs in various other areas to existing requirements such as embedded derivatives and the recognition of fair value adjustments in OCI.
All changes in the fair value of financial liabilities that are designated at fair value through profit or loss due to changes in own credit risk will be required to be recognised within OCI.
The standard has introduced a new expected-loss impairment model that will require more timely recognition of expected credit losses. This new model will apply to financial assets measured at either amortised cost or fair value through OCI, as well as loan commitments when there is present commitment to extend credit (unless these are measured at fair value through profit or loss).
With the exception of purchased or originated credit impaired financial assets, expected credit losses are required to be measured through a loss allowance at an amount equal to either 12-month expected credit losses or full lifetime expected credit losses.
A loss allowance for full lifetime expected credit losses is required for a financial instrument if the credit risk of that financial instrument has increased significantly since initial recognition, as well as for certain contract assets or trade receivables. For all other financial instruments, expected credit losses are measured at an amount equal to 12-month expected credit losses.
The revised general hedge accounting requirements are better aligned with an entity’s risk management activities, provide additional opportunities to apply hedge accounting and various simplifications in achieving hedge accounting.
The standard will be applied retrospectively. The impact on the annual financial statements has not yet been fully determined.
Annual periods beginning on or after 1 January 2018

152
PRONOUNCEMENT TITLE EFFECTIVE DATE
IFRS 10 and IAS 28 (amendments)
Sale or Contribution of Assets between an Investor and its Associate or Joint VentureThe amendments address an inconsistency between the requirements in IFRS 10 and those in IAS 28, in dealing with the sale or contribution of assets between an investor and its associate or joint venture.
The main consequence of the amendments is that a full gain or loss is recognised when a transaction involves a business (whether it is housed in a subsidiary or not). A partial gain or loss is recognised when a transaction involves assets that do not constitute a business, even if these assets are housed in a subsidiary.
The amendments will be applied prospectively and are not expected to have a material impact on the group’s financial statements.
Still to be determined
IFRS 15 Revenue from Contracts with CustomersThis standard will replace the existing revenue standards and their related interpretations. The standard sets out the requirements for recognising revenue that applies to all contracts with customers (except for contracts that are within the scope of the standards on leases, insurance contracts or financial instruments).
The core principle of the standard is that revenue recognised reflects the consideration to which the company expects to be entitled in exchange for the transfer of promised goods or services to the customer.
The standard incorporates a five-step analysis to determine the amount and timing of revenue recognition.
The standard will be applied retrospectively. The impact on the annual financial statements has not yet been fully determined.
Annual periods beginning on or after 1 January 2018
ANNUAL FINANCIAL STATEMENTS Annexure E Detailed group accounting policies continued

SBN Holdings Limited Annual report 2016 153
PRONOUNCEMENT TITLE EFFECTIVE DATE
IFRS 16 Leases
This standard will replace the existing standard IAS 17 Leases, as well as the related interpretations and sets out the principles for the recognition, measurement, presentation and disclosure of leases for both parties to a contract, being the lessee (customer) and the lessor (supplier).
The core principle of this standard is that the lessee and lessor should recognise all rights and obligations arising from leasing arrangements on balance sheet.
The most significant change pertaining to the accounting treatment of operating leases is from the lessees’ perspective. IFRS 16 eliminates the classification of leases as either operating leases or finance leases as is required by IAS 17 and introduces a single lessee accounting model, where a right of use (ROU) asset together with a liability for the future payments is to be recognised for all leases with a term of more than 12 months, unless the underlying asset is of low value.
The lessor accounting requirements in IAS 17 has not changed substantially in terms of this standard; as a result a lessor continues to classify its leases as operating leases or finance leases and accounts for these as is currently done in terms of IAS 17.
In addition, the standard requires a lessor to provide enhanced disclosures about its leasing activities and in particular about its exposure to residual value risk and how it is managed.
The standard will be applied retrospectively. The impact on the annual financial statements has not yet been fully determined.
Annual periods beginning on or after 1 January 2019

154
ANNUAL FINANCIAL STATEMENTS Annexure E Detailed group accounting policies continued
INTERNATIONAL FINANCIAL REPORTING STANDARDS
PRONOUNCEMENT EXECUTIVE SUMMARY EFFECTIVE DATE
Amendments to IFRS 10, “Consolidated financial statements” and IAS 28, “Investments in associates and joint ventures” on applying the consolidation exemption
The amendments clarify the application of the consolidation exception for investment entities and their subsidiaries.
1 January 2016
Amendments to IAS 1, “Presentation of financial statements” disclosure initiative
In December 2014, the IASB issued amendments to clarify guidance in IAS 1 on materiality and aggregation, the presentation of subtotals, the structure of financial statements and the disclosure of accounting policies.
1 January 2016
Amendment to IAS 16, “Property, plant and equipment” and IAS 38, “Intangible assets”, on depreciation and amortisation
In this amendment the IASB has clarified that the use of revenue-based methods to calculate the depreciation of an asset is not appropriate because revenue generated by an activity that includes the use of an asset generally reflects factors other than the consumption of the economic benefits embodied in the asset. The IASB has also clarified that revenue is generally presumed to be an inappropriate basis for measuring the consumption of the economic benefits embodied in an intangible asset.
1 January 2016
Amendments to IAS 27, “Separate financial statements” on equity accounting
In this amendment, the IASB has restored the option to use the equity method to account for investments in subsidiaries, joint ventures and associates in an entity’s separate financial statements.
1 January 2016
Amendment to IAS 12 – Income taxes
Recognition of deferred tax assets for unrealised losses
The amendment was issued to clarify the requirements for recognising deferred tax assets on unrealised losses. The amendment clarifies the accounting for deferred tax where an asset is measured at fair value and that fair value is below the asset’s tax base. It also clarifies certain other aspects of accounting for deferred tax assets.
The amendment clarifies the existing guidance under IAS 12. It does not change the underlying principles for the recognition of deferred tax assets.
Annual periods beginning on or after 1 January 2017
(published February 2016)

SBN Holdings Limited Annual report 2016 155
PRONOUNCEMENT EXECUTIVE SUMMARY EFFECTIVE DATE
Amendment to IAS 7 – Cash flow statements
Statement of cash flows on disclosure initiative
In January 2016, the International Accounting Standards Board (IASB) issued an amendment to IAS 7 introducing an additional disclosure that will enable users of financial statements to evaluate changes in liabilities arising from financing activities.
The amendment responds to requests from investors for information that helps them better understand changes in an entity’s debt. The amendment will affect every entity preparing IFRS financial statements. However, the information required should be readily available. Preparers should consider how best to present the additional information to explain the changes in liabilities arising from financing activities.
Annual periods beginning on or after 1 January 2017
(published February 2016)
Amendments to IFRS 2 – “Share-based payments”
Clarifying how to account for certain types of share-based payment transactions
This amendment clarifies the measurement basis for cash-settled, share-based payments and the accounting for modifications that change an award from cash-settled to equity-settled. It also introduces an exception to the principles in IFRS 2 that will require an award to be treated as if it was wholly equity-settled, where an employer is obliged to withhold an amount for the employee’s tax obligation associated with a share-based payment and pay that amount to the tax authority.
Annual periods beginning on or after 1 January 2018
(published June 2016)

156

Contact details
Company secretaryAdv S TjijorokisaTel: +264 61 294 2036
Chief financial officerBryan MandyTel: +264 61 294 2237
Registered address5th Floor, Standard Bank CentreCorner of Werner List Street and Post Street MallPO Box 3327WindhoekNamibia
Head office switchboardTel: +26 461 294 2000
Website: www.standardbank.com.na
Please direct all annual report queries and comments to: [email protected] direct all customer related queries and comments to: [email protected] direct all investor relations queries and comments to: [email protected]
DisclaimerThis document contains certain statements that are ’forward-looking’ with respect to certain of the group’s plans, goals and expectations relating to its future performance, results, strategies and objectives. Words such as “may”, “could”, “will”, “expect”, “intend”, “estimate”, “anticipate”, “aim”, “outlook”, “believe”, “plan”, “seek”, “predict” or similar expressions typically identify forward-looking statements. These forward-looking statements are not statements of fact or guarantees of future performance, results, strategies and objectives, and by their nature, involve risk and uncertainty because they relate to future events and circumstances which are difficult to predict and are beyond the group’s control, including but not limited to, domestic and global economic business conditions, market-related risks such as fluctuations in interest rates and exchange rates, the policies and actions of regulatory authorities (including changes related to capital and solvency requirements), the impact of competition, inflation, deflation, the timing impact and other uncertainties of future acquisitions or combinations within relevant industries, as well as the impact of changes in domestic and global legislation and regulations in the jurisdictions in which the group and its affiliates operate. The group’s actual future performance, results, strategies and objectives may differ materially from the plans, goals and expectations expressed or implied in the forward-looking statements. The group makes no representations or warranty, express or implied, that these forward-looking statements will be achieved and undue reliance should not be placed on such statements. The group undertakes no obligation to update the historical information or forward-looking statements in this document and does not assume responsibility for any loss or damage arising as a result of the reliance by any party thereon.

standardbank.com.na