sc risk assessment meeting 062321b
TRANSCRIPT

6/30/2021
1
Welcome!
• If you are attending the webinar on your computer, please add your name, title, and organization(s) to the chat box.
Bring your mouse to the lower part of the screen until a set of buttons appears. They may also be at the top of your screen.
Click “Show Conversation.”
1
Gloucester County, New JerseyHazard Mitigation Plan – 2022 UpdateSteering Committee Risk Assessment Meeting | June 23, 2021
1
2

6/30/2021
2
Agenda
• Welcome and Opening Remarks
• Project Status – where we are in the process
• Risk Assessment Overview – draft results to date
• SWOO (Strengths, Weaknesses, Obstacles and Opportunities)
• Development of Problem Statements
• In-Kind Tracking
• Next Steps
3
In-Kind Tracking Reminder
• Document your time working on the HMP (e.g., attend meetings, complete worksheets and surveys, emails, etc.)
• Use the Word tracker or online tracker https://www.surveymonkey.com/r/GCHMPInKindTracker
4
3
4

6/30/2021
3
Project Schedule Review
5
✓ April/May 2021 Kick-Off Meetings
✓ April-June 2021 Data Collection
✓ June 23, 2021 Risk Assessment Presentation to Steering Committee – TODAY!
❏ June 30, 2021 Risk Assessment Presentation to Planning Partnership
❏ April-June 2021 Update Hazard Profiles – in progress
❏ June-July 2021 Develop Problem Statements with Municipalities and County
❏ July/August 2021 Mitigation Strategy Workshop (date TBD)
❏ July-September 2021 Plan Development
❏ September 2021 Review Draft Plan
❏ October 2021 Plan Submitted to FEMA and NJOEM
Municipal Participation Status• To date, we have received Letters of
Intent to Participate (LOIP) from 14 out of 25 (see list to the right)
• Next Step for Annex Completion includes confirmation of Risk Ranking Assessment, status updates on previous mitigation projects from the 2016 HMP, identifying new projects for the 2021 Update and filling in the annexes.
• Upcoming steps include problem statement brainstorming and mitigation project identification.
6
Status (6/18/2021)
Gloucester County Following up with individual departments as needed
Clayton (B) Received all worksheets; annex in progress
Deptford (Twp) Received nearly all worksheets; annex in progress
East Greenwich (Twp) Received all worksheets; annex in progress
Elk (Twp) Received all worksheets; annex in progress
Franklin (Twp) No LOIP; no worksheets
Glassboro (B) No worksheets to date but Tetra Tech spoke to the Borough on 6/9
Greenwich (Twp) No LOIP; no worksheets
Harrison (Twp) Only received one worksheet to date
Logan (Twp) No worksheets to date
Mantua (Twp) No LOIP; no worksheets
Monroe (Twp) Received all worksheets; annex in progress
National Park (B) No LOIP; no worksheets
Newfield (B) No LOIP; no worksheets
Paulsboro (B) No LOIP; no worksheets
Pitman (B) Received all worksheets; annex in progress
South Harrison (Twp) No LOIP; no worksheets
Swedesboro (B) No worksheets to date
Washington (Twp) No LOIP; no worksheets
Wenonah (B) Received all worksheets; annex in progress
West Deptford (Twp) Received all worksheets; annex in progress
Westville (B) Received all worksheets; annex in progress
Woodbury (C) No LOIP; no worksheets
Woodbury Heights (B) No LOIP; no worksheets
Woolwich (Twp) No worksheets to date
Rowan University No LOIP; no worksheets
5
6
6/30/2021
4
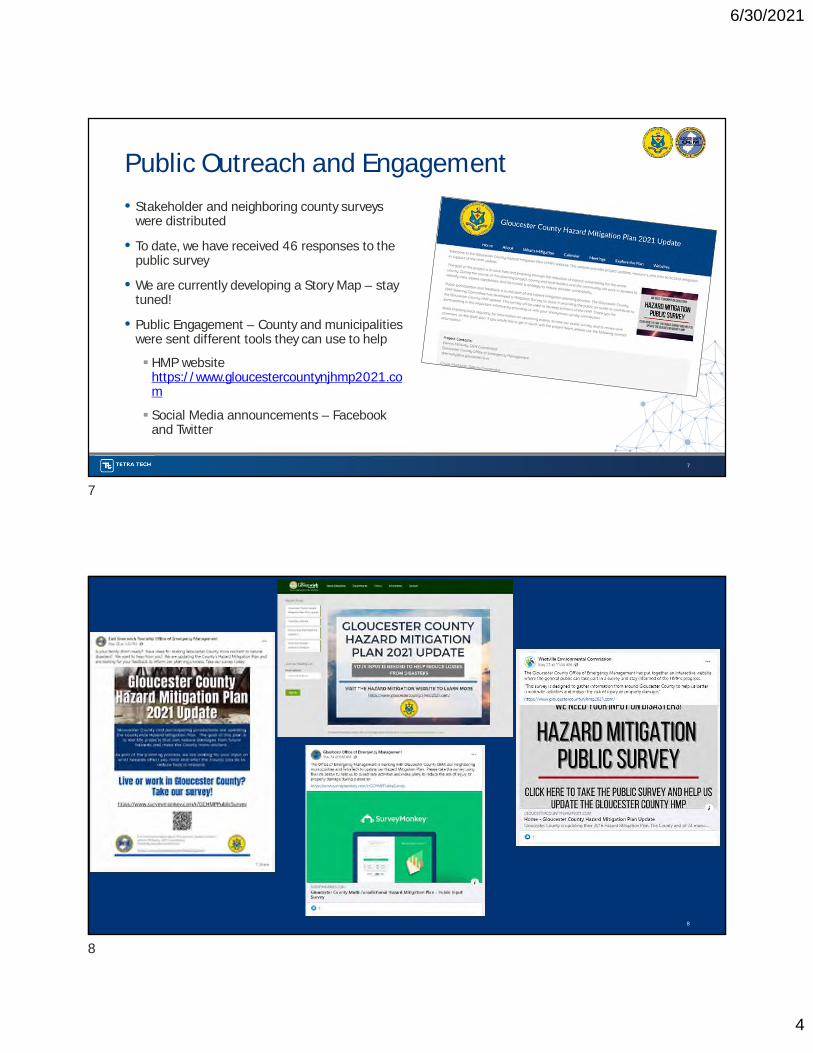
Public Outreach and Engagement
• Stakeholder and neighboring county surveys were distributed
• To date, we have received 46 responses to the public survey
• We are currently developing a Story Map – stay tuned!
• Public Engagement – County and municipalities were sent different tools they can use to help
HMP website https://www.gloucestercountynjhmp2021.com
Social Media announcements – Facebook and Twitter
7
8
7
8
6/30/2021
5
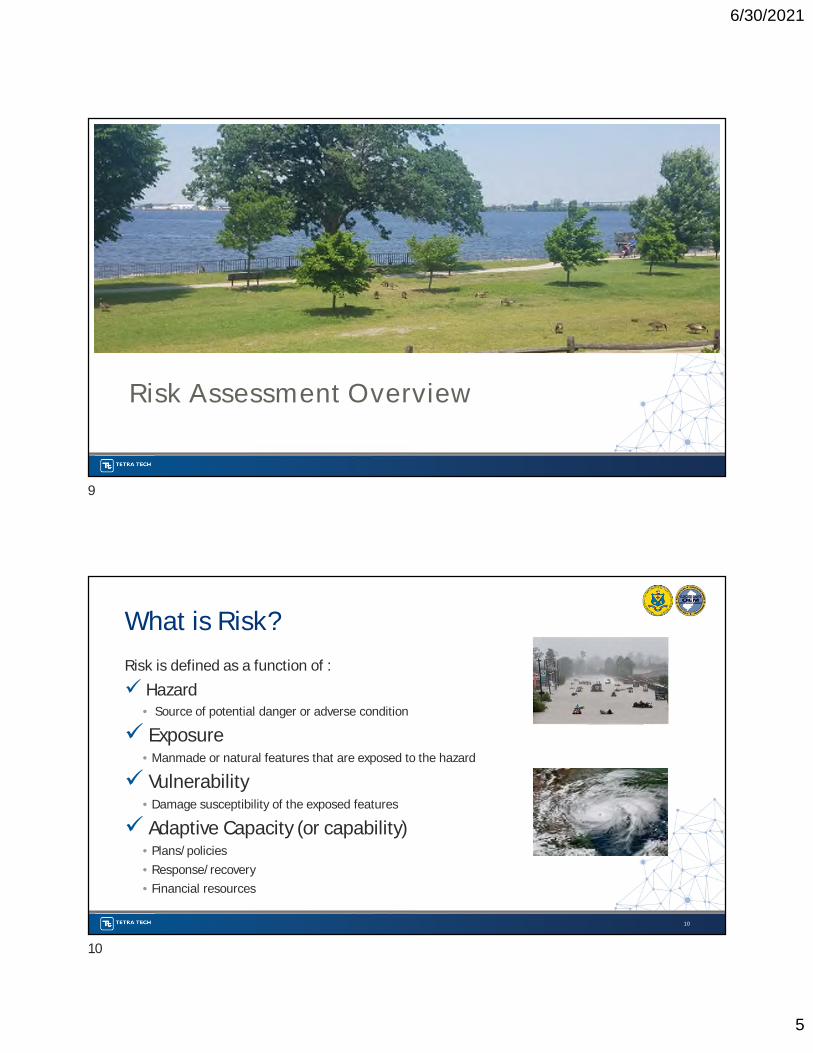
Risk Assessment Overview
What is Risk?
Risk is defined as a function of :
Hazard• Source of potential danger or adverse condition
Exposure•Manmade or natural features that are exposed to the hazard
Vulnerability•Damage susceptibility of the exposed features
Adaptive Capacity (or capability)•Plans/policies
•Response/recovery
•Financial resources
10
9
10

6/30/2021
6
Purpose of the Risk Assessment
• To get a better understanding of the risks you face
• Initial results based on available data
• Quantitative data (population/structures exposed, structural damages within hazard zones) used when available
• Qualitative community input (such as unmapped flood areas) integrated to adjust results
• Local community input to adjust relative rankings
11
Spatial Hazard Data
County Specific Building
Data
Scientific Modeling
(HAZUS v5& ArcGIS)
Historic Data
Comprehensive List of Expected Damages ($$$)
How are the rankings calculated?
Preliminary Hazard Ranking
11
12

6/30/2021
7
Preliminary Hazard Ranking Methodology
• The calculated probability of a hazard occurring based on historical data
• Impacts to people, property, and the economy based on GIS data and analysis of exposure.
• The degree to which climate change will affect future occurrences based on best available data.
• Capability- the ability of your community to respond to the hazard based on ordinances, mitigation strategies and procedures, and readiness.
13
Preliminary Hazard Ranking Formula
14
Probability of
Occurrence (30%)
Impacts
(30%)
Adaptive Capacity
(30%)
Climate Change
(10%)
Preliminary Hazard Ranking
Impact to Economy
Impact to Population
Impact to Property
Local community input to adjust
preliminary rankings
Local community input to adjust
preliminary rankings
13
14

6/30/2021
8
What information plays a role in determining the hazard rankings?
Ranking the Hazards of Concern
Hazard Ranking Input
16
Impact on Population – Function of population exposed Low – 14% or less population exposed Medium – 15%-29% population exposed High – 30%+ population exposed
Impact on property – Function of structures exposed Low – 14% or less structures exposed Medium – 15%-29% structures exposed High – 30%+ structures exposed
Impact on economy – Function of damages to building stock Low – 9% or less loss estimate of total replacement cost Medium – 10%-19% loss estimate of total replacement cost High – 19%+ loss estimate of total replacement cost
Capability – Function of level of planning, policies, enforcement Low – outdated policies; limited to no deployable resources; limited capabilities to respond; long recovery Medium – minimum requirements; mitigation strategies identified but not implemented; moderate county capabilities High – exceed requirements; mitigation/protective measures in place; county/jurisdiction has ability to recover quickly because resources are readily available,
and capabilities are high
Climate Change – Function of climate predictions
Low - No local data is available; modeling projects are uncertain on whether there is increased future risk; confidence level is low (inconclusive evidence) Medium - Studies and modeling projections indicate a potential for exacerbated conditions due to climate change High - Studies and modeling projections indicate exacerbated conditions/increased future risk due to climate change
15
16
6/30/2021
9
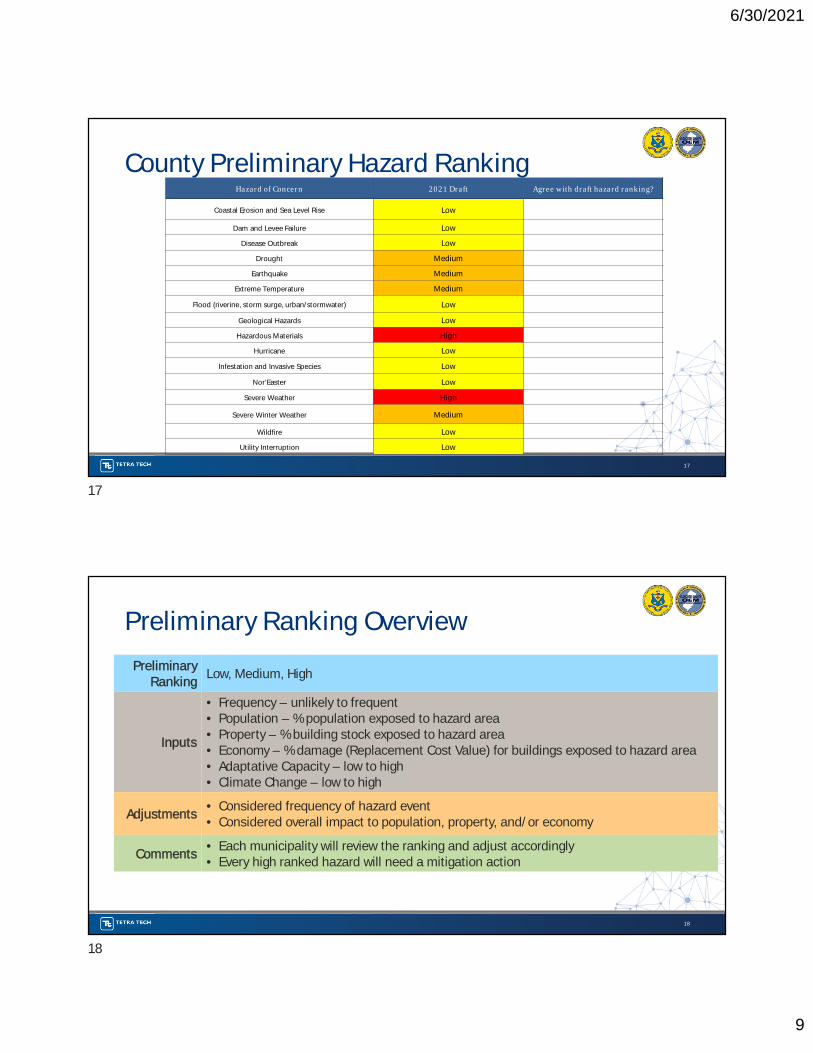
County Preliminary Hazard Ranking
17
Hazard of Concern 2021 Draft Agree with draft hazard ranking?
Coastal Erosion and Sea Level Rise Low
Dam and Levee Failure Low
Disease Outbreak Low
Drought Medium
Earthquake Medium
Extreme Temperature Medium
Flood (riverine, storm surge, urban/stormwater) Low
Geological Hazards Low
Hazardous Materials High
Hurricane Low
Infestation and Invasive Species Low
Nor’Easter Low
Severe Weather High
Severe Winter Weather Medium
Wildfire Low
Utility Interruption Low
Preliminary Ranking Overview
18
Preliminary Ranking
Low, Medium, High
Inputs
• Frequency – unlikely to frequent• Population – % population exposed to hazard area• Property – % building stock exposed to hazard area• Economy – % damage (Replacement Cost Value) for buildings exposed to hazard area• Adaptative Capacity – low to high• Climate Change – low to high
Adjustments• Considered frequency of hazard event• Considered overall impact to population, property, and/or economy
Comments• Each municipality will review the ranking and adjust accordingly• Every high ranked hazard will need a mitigation action
17
18

6/30/2021
10
Hazard Ranking Input Categories
19
CategoryLevel /
Category Degree of Risk / Benchmark Values
Probability of Occurrence
Unlikely A hazard event is not likely to occur or is unlikely to occur with less than a 1% annual chance probability.Rare Between 1 and 10% annual probability of a hazard event occurring.Occasional Between 10 and 100% annual probability of a hazard event occurring.Frequent 100% annual probability; a hazard event may occur multiple times per year.
Impact
Population
Low 14% or less of your population is exposed to a hazard with potential for measurable life safety impact, due to its extent and location.
Medium 15% to 29% of your population is exposed to a hazard with potential for measurable life safety impact, due to its extent and location.
High 30% or more of your population is exposed to a hazard with potential for measurable life safety impact, due to its extent and location.
Property
Low Property exposure is 14% or less of the total number of structures for your community.
Medium Property exposure is 15% to 29% of the total number of structures for your community.
High Property exposure is 30% or more of the total number of structures for your community.
Economy
Low Loss estimate is 9% or less of the total replacement cost for your community.
Medium Loss estimate is 10% to 19% of the total replacement cost for your community.
High Loss estimate is 20% or more of the total replacement cost for your community.
Capabilities
WeakWeak/outdated/inconsistent plans, policies, codes/ordinances in place; no redundancies; limited to no deployable resources; limited capabilities to respond; long recovery.
ModeratePlans, policies, codes/ordinances in place and meet minimum requirements; mitigation strategies identified but not implemented on a widespread scale; county/jurisdiction can recover but needs outside resources; moderate county/Jurisdiction capabilities.
StrongPlans, policies, codes/ordinances in place and exceed minimum requirements; mitigation/protective measures in place; county/jurisdiction has ability to recover quickly because resources are readily available, and capabilities are high.
Climate Change
Low No local data is available; modeling projections are uncertain on whether there is increased future risk; confidence level is low (inconclusive evidence).
MediumStudies and modeling projections indicate a potential for exacerbated conditions due to climate change; confidence level is medium to high (suggestive to moderate evidence).
HighStudies and modeling projections indicate exacerbated conditions/increased future risk due to climate change; very high confidence level (strong evidence, well documented and acceptable methods).
Coastal Erosion and Sea Level Rise
Buildings Exposed to the Coastal Erosion
Hazard Area
13
Overall increase in
temperature across NJ
3.5°F
People Exposed to 3-
foot SLR
21
20
• Limited to coastal influenced waters along or flowing into the Delaware
• 3-foot of sea level rise likely before end of the century
• Increased sea levels lead to greater rates of coastal erosion
19
20
6/30/2021
11
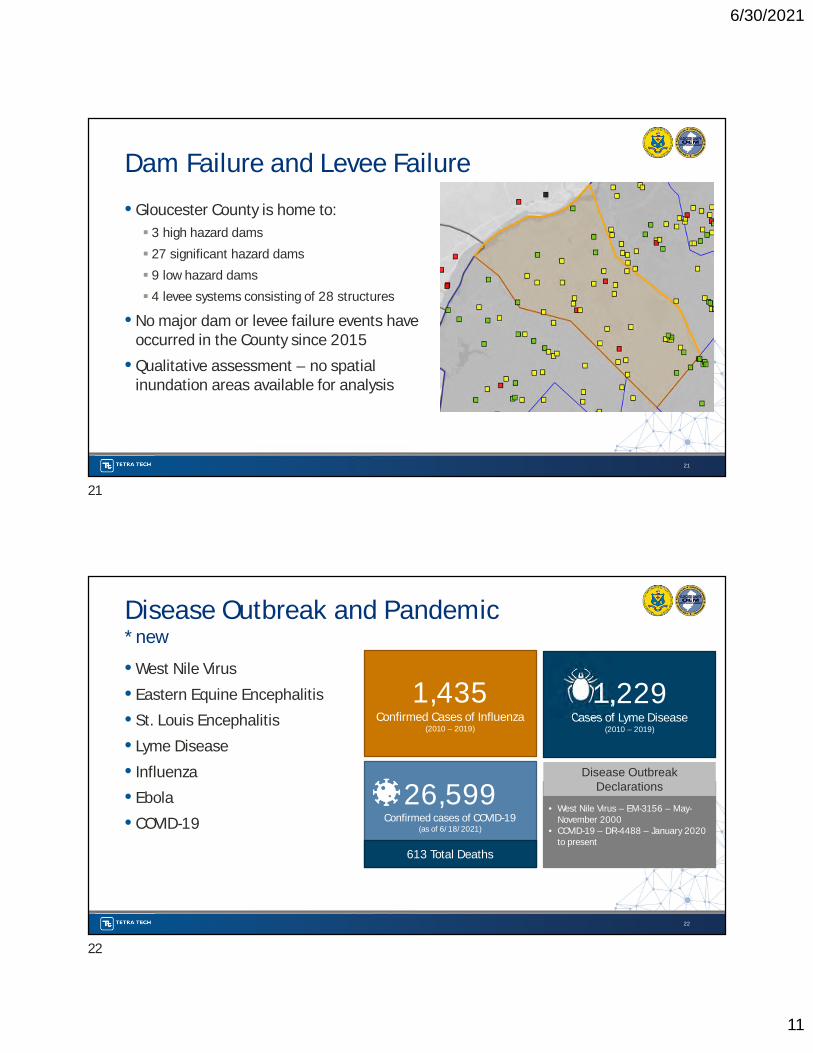
Dam Failure and Levee Failure
• Gloucester County is home to:
3 high hazard dams
27 significant hazard dams
9 low hazard dams
4 levee systems consisting of 28 structures
• No major dam or levee failure events have occurred in the County since 2015
• Qualitative assessment – no spatial inundation areas available for analysis
21
Disease Outbreak and Pandemic *new
• West Nile Virus
• Eastern Equine Encephalitis
• St. Louis Encephalitis
• Lyme Disease
• Influenza
• Ebola
• COVID-19
22
1,435 Confirmed Cases of Influenza
(2010 – 2019)
1,229 Cases of Lyme Disease
(2010 – 2019)
26,599 Confirmed cases of COVID-19
(as of 6/18/2021)
613 Total Deaths
• West Nile Virus – EM-3156 – May-November 2000
• COVID-19 – DR-4488 – January 2020 to present
Disease Outbreak Declarations
21
22

6/30/2021
12
Drought
Number of farms
580
$102.4 million
Acres of farmland
49,381
e
Since 2012, the County has experienced 6 droughts as a
combination of excessive heat and drought conditions
Potential impacts:1. Increased wildfire risk2. Impacts to agriculture/farms3. Drinking water supply
(groundwater and surface water)
From 2017 Census of Agriculture
Total market value of products sold (2017)
23
Earthquake
• Conducted assessment of 100-year and 500-year probabilistic events
16Individuals injured as a result of a 500-year MRP event (no causalities expected)
13,706Tons of structural debrisfrom a 500-year MRP event
Replacement Cost Value (RCV) of building damages from a 500-year MRP event
$29+ million 11Estimated displaced households for 500-year MRP event
24
• Low frequency event but could have large impacts
• Low impact to life, high impact to property
23
24

6/30/2021
13
Extreme Temperatures (heat and cold)
Vulnerable Population Exposed
(<5 & 65+)
60,167(20.7% of total
population)
Reported events
(1950 –2020)
54
FEMA Disaster Declarations
(1954 –2020)
5
USDA Disaster Declarations
(2015 –2020)
6
25
Flood
SFHA = Special Flood Hazard Area (1% Annual Chance Flood Event), Hazus flood model estimates
NFIP Statistics (Jan 2021)
104 events(1950-2021)
FEMA flood-related declarations
(1954 – 2020)
Flood History
Residents Living in the SFHA:
1.5 % of total population
Replacement Value of Buildings in the SFHA:
$2.77 billion
1.9% of total buildings / 2.8% total replacement cost value
Debris Generated by the 1% Event
13.1 tons (structural debris)
Critical Facilities Exposed:
81
Policies
Claims
925
685
Number of Buildings Exposed:2,106
Municipalities with Highest # Residents Living in the SFHA:
Greenwich – 1,330
West Deptford – 813
Paulsboro - 526
74RL Properties
4,305
25
26

6/30/2021
14
Hurricane and Tropical Storm
Hurricane Tracks through August 2020
19,640Hurricane History
$11.1 billion
9.9% total population
Estimated Potential General Building Stock Loss / Replacement Cost Value for all
buildings (Category 3 Storm)
Reported Tropical Storm Events
NOAA, since 1996
6 3
Population exposed to storm surge of Category 3 Storm
Federally Declared Hurricane Disaster
Events
FEMA, since 1953
27
Geological Hazards
• Landslides
Historic landslides have occurred in the State with one FEMA disaster declarations involving a mudslide (2011), but Gloucester was not affected
6,620 residents, or 2.3% of the County population live within the Steep Slope Hazard Area
• Subsidence/sinkholes
Typically occur in areas within bands of carbonate bedrock
32,985 residents, or 11.3% of the County population live in Carbonate Rock Hazard Area
27
28

6/30/2021
15
Invasive and Nuisance Species
• Emerald Ash Borer
Infests and kills North American ash trees
Trees die within 2-4 years of becoming infested
• Spotted Lanternfly
The insect is rapidly spreading throughout the northeast after first identified in 2014.
Could devastate agricultural areas
29
Invasive and Nuisance Species
• Harmful Algal Blooms
Impacts natural systems, recreation, drinking water supply
Impacted local waterbodies
• White-Tailed Deer
Deer populations have reached problematic numbers in numerous areas of the state.
Impacts on human health and safety include the spread of tick-borne diseases (Lyme Disease) and deer-vehicle collisions
From 2011-2012, more than 31,192 deer-vehicle collisions occurred in New Jersey
30
29
30
6/30/2021
16
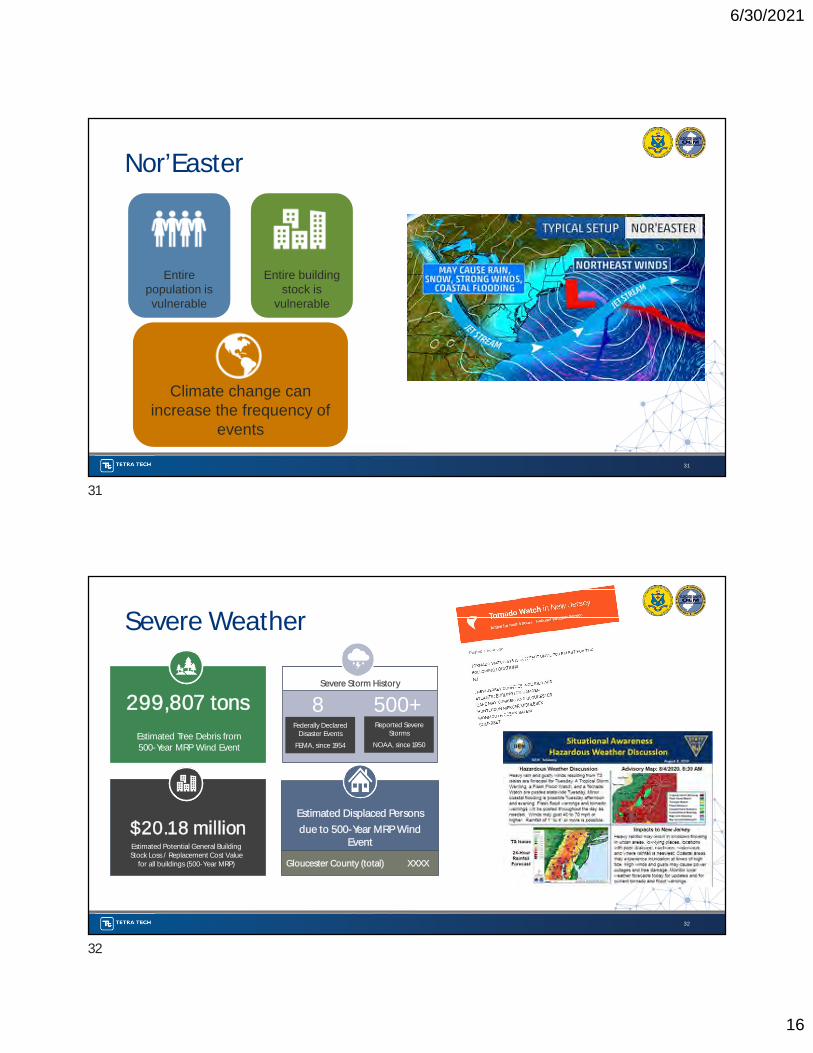
Nor’Easter
Entire population is vulnerable
Entire building stock is
vulnerable
Climate change can increase the frequency of
events
31
Severe Weather
32
Severe Storm History
$20.18 millionEstimated Potential General Building Stock Loss / Replacement Cost Value
for all buildings (500-Year MRP)
Reported Severe Storms
NOAA, since 1950
8 500+Federally Declared
Disaster Events
FEMA, since 1954
299,807 tons
Estimated Tree Debris from 500-Year MRP Wind Event
Estimated Displaced Persons
due to 500-Year MRP Wind Event
Gloucester County (total) XXXX
31
32
6/30/2021
17
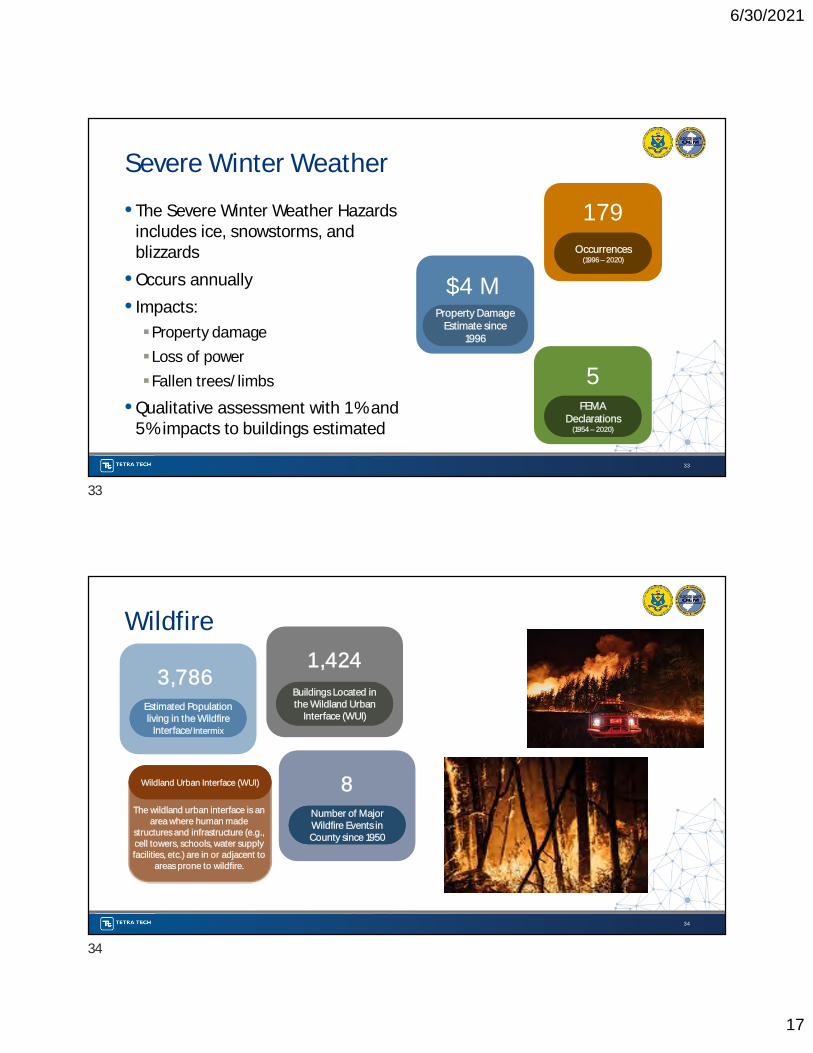
Severe Winter Weather
• The Severe Winter Weather Hazards includes ice, snowstorms, and blizzards
• Occurs annually
• Impacts:
Property damage
Loss of power
Fallen trees/limbs
• Qualitative assessment with 1% and 5% impacts to buildings estimated
5FEMA
Declarations(1954 – 2020)
$4 MProperty Damage
Estimate since 1996
179
Occurrences(1996 – 2020)
33
Wildfire
3,786Estimated Population living in the Wildfire
Interface/Intermix
Estimated Population living in the Wildfire
Interface/Intermix
8Number of Major Wildfire Events in County since 1950
Number of Major Wildfire Events in County since 1950
1,424
Buildings Located in the Wildland Urban
Interface (WUI)
Buildings Located in the Wildland Urban
Interface (WUI)
Wildland Urban Interface (WUI)Wildland Urban Interface (WUI)
The wildland urban interface is an area where human made
structures and infrastructure (e.g., cell towers, schools, water supply facilities, etc.) are in or adjacent to
areas prone to wildfire.
34
33
34

6/30/2021
18
Utility Failure
• HistoryPrimarily caused by other hazards
Power failure events common
• ImpactsHVAC failure
Communications failure
Food spoilage
Basement flooding
Carbon monoxide exposure from generators
Individuals' dependent on medical equipment
Access to potable water
High cost to government and community services
Strengths, Weaknesses, Opportunities + Obstacles(SWOO) Exercise
35
36

6/30/2021
19
Hazard
Strengths Weaknesses
What does the county and its communities do
well in terms of:
Plans and Regulations
Codes, Ordinances, Planning Studies,
Comprehensive Plans, Adaptation
and Resiliency Plans
Structure and Infrastructure Projects
Natural Systems Protection
Education and Awareness Programs
Preparedness
Others?
What can the county and its communities do better or
what are the gaps in terms of:
Plans and Regulations
Codes, Ordinances, Planning Studies,
Comprehensive Plans, Adaptation and
Resiliency Plans
Structure and Infrastructure Projects
Natural Systems Protection
Education and Awareness Programs
Preparedness
Others?
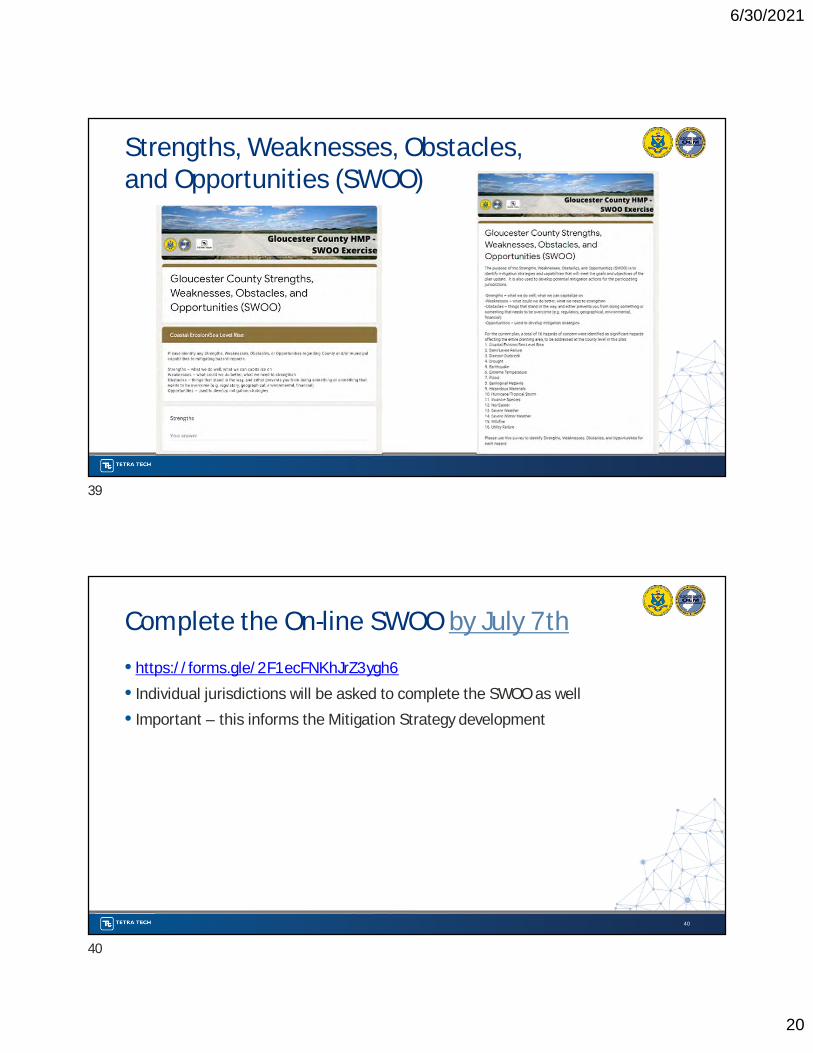
Strengths, Weaknesses, Obstacles, and Opportunities (SWOO)
Strengths, Weaknesses, Obstacles, and Opportunities (SWOO)
Hazard
Obstacles Opportunities
What is preventing the county and its
communities to implement in terms of:
Plans and Regulations
Codes, Ordinances, Planning Studies,
Comprehensive Plans, Adaptation
and Resiliency Plans
Structure and Infrastructure Projects
Natural Systems Protection
Education and Awareness Programs
Preparedness
Others?
What can the county and its communities implement
terms of:
Plans and Regulations
Codes, Ordinances, Planning Studies,
Comprehensive Plans, Adaptation and
Resiliency Plans
Structure and Infrastructure Projects
Natural Systems Protection
Education and Awareness Programs
Preparedness
Others?
37
38
6/30/2021
20
Strengths, Weaknesses, Obstacles, and Opportunities (SWOO)
Complete the On-line SWOO by July 7th
• https://forms.gle/2F1ecFNKhJrZ3ygh6
• Individual jurisdictions will be asked to complete the SWOO as well
• Important – this informs the Mitigation Strategy development
40
39
40

6/30/2021
21
2021 HMP Mission Statement and Goals and Objectives
Mission Statement
• Per FEMA guidance (386-1), a mission statement or guiding principle describes the overall duty and purpose of the planning process and serves to identify the principal message of the plan. It focuses or constrains the range of goals and objectives identified. This is not a goal because it does not describe outcomes.
• Should a mission statement be included in this update?
42
41
42

6/30/2021
22
Goals and Objectives
• Based on the input we received, the goals for the 2021 HMP are:
Goal 1 – Protect Life
Goal 2 – Protect Property
Goal 3 - Improve education and outreach efforts regarding potential risk of natural hazards and appropriate mitigation measures that can be used to reduce risk
Goal 4 - Improve data collection, use, and sharing to reduce the risk of natural hazards
Goal 5 - Improve capabilities and coordination at municipal, county, and state levels to plan and implement hazard mitigation measures
Goal 6 - Support Continuity of Operations Pre-, During, and Post-Hazard Events
Goal 7 - Address Long-Term Vulnerabilities from High Hazard Dams
43
Looking Ahead
43
44

6/30/2021
23
Your Task – Review Results and Adjust as Necessary
45
Probability of
Occurrence (30%)
Impacts
(30%)
Adaptive Capacity
(30%)
Climate Change
(10%)
Preliminary Hazard Ranking
Impact to Economy
Impact to Population
Impact to Property
Local community input to adjust
preliminary rankings
Local community input to adjust
preliminary rankings
Next Steps – Problem Statements
• Municipalities will be presented their hazard rankings on June 30th and will be asked to review and adjust as needed
• Problem statements – start thinking about problems and the best solutions
• Quality not quantity
• We will work with you to prepare problem statements and solutions before the Mitigation Strategy Workshop (July or August)
46
Identify Hazards Based on Risk
Develop Problem Statements
Develop Potential Project Solutions
1122
33
45
46

6/30/2021
24
Questions?
Gloucester County Project Contacts
Dennis McNulty, Coordinator(856) 307-7100 | [email protected]
Chuck Murtaugh, Deputy Coordinator(856) 307-7100 | [email protected]
Tetra Tech Project Contacts
Heather Apgar, CFM, Project Manager (973) 630-8046 | [email protected]
Chris Huch, CFM, Lead Planner(973) 630-8357 | [email protected]
Thank You!
47
48