scalabale graph analytics with gradoop · 2015-06-05 · graph storage in scalable distributed...
TRANSCRIPT

www.scads.de
SCALABALE GRAPH ANALYTICS WITH GRADOOP
ERHARD RAHM, MARTIN JUNGHANNS, ANDRE PETERMANN, KEVIN GOMEZ, ERIC PEUKERT
Two Centers of Excellence for Big Data in Germany
ScaDS Dresden/Leipzig
Berlin Big Data Center (BBDC)
ScaDS Dresden/Leipzig (Competence Center forScalable Data Services and Solutions Dresden/Leipzig)
scientific coordinators: Nagel (TUD), Rahm (UL)
start: Oct. 2014
duration: 4 years (option for 3 more years)
initial funding: ca. 5.6 Mio. Euro
GERMAN CENTERS FOR BIG DATA
2

Bundling and advancement of existing expertise on Big Data
Development of Big Data Services and Solutions
Big Data Innovations
GOALS
3
FUNDED INSTITUTES
TU DresdenUniv. Leipzig
Max-Planck Institute forMolecular Cell Biology and Genetics
Leibniz Institute of Ecological Urban and Regional
Development
4

Hochschule für Telekommunikation Leipzig
Institut für Angewandte Informatik e. V.
Landesamt für Umwelt, Landwirtschaft und Geologie
Netzwerk Logistik Leipzig-Halle e. V.
Sächsische Landesbibliothek – Staats-und Universitätsbibliothek Dresden
Scionics Computer Innovation GmbH
Technische Universität Chemnitz
Universitätsklinikum Carl Gustav Carus
Avantgarde-Labs GmbH
Data Virtuality GmbH
E-Commerce Genossenschaft e. G.
European Centre for Emerging Materials and Processes Dresden
Fraunhofer-Institut für Verkehrs- und Infrastruktursysteme
Fraunhofer-Institut für Werkstoff- und Strahltechnik
GISA GmbH
Helmholtz-Zentrum Dresden -Rossendorf
ASSOCIATED PARTNERS
5
STRUCTURE OF THE CENTER
Big Data Life Cycle Management and Workflows
Efficient Big Data Architectures
Data Quality /Data Integration
VisualAnalytics
KnowledgeExtraktion
Life sciences
Material and Engineering sciences
Digital Humanities
Environmental / Geo sciences
Business Data
Servicecenter
6

Data-intensive computing W.E. Nagel
Data quality / Data integration E. Rahm
Databases W. Lehner, E. Rahm
Knowledge extraction/Data miningC. Rother, P. Stadler, G. Heyer
Visualization S. Gumhold, G. Scheuermann
Service Engineering, Infrastructure K.-P. Fähnrich, W.E. Nagel, M. Bogdan
RESEARCH PARTNERS
7
Life sciences G. Myers
Material / Engineering sciences M. Gude
Environmental / Geo sciences J. Schanze
Digital Humanities G. Heyer
Business Data B. Franczyk
APPLICATION COORDINATORS
8

ScaDS Dresden/Leipzig
Big Graph Data
Graph-based Business Intelligence with BIIIG
basic approaches for graph data management/analysis
GraDoop: Hadoop-based graph data management and analysis
Gradoop characteristics and architecture
Extended Property Graph Data Model (EPGM) / Graph operators
Distributed graph store
Sample workflows
Summary and outlook
AGENDA
9
„GRAPHS ARE EVERYWHERE“
10
Facebookca. 1.3 billion usersca. 340 friends per user
Twitterca. 300 million usersca. 500 million tweets per day
Internetca. 2.9 billion users
Gene (human)20,000-25,000ca. 4 million individuals
Patients> 18 millions (Germany)
Illnesses> 30.000
World Wide Webca. 1 billion Websites
LOD-Cloudca. 31 billion triples
Social science Engineering Life science Information science

Business intelligence usually based on relational data warehouses
enterprise data is integrated within dimensional schema
analysis limited to predefined relationships
no support for relationship-oriented data mining
Graph-based approach (BIIIG)
integrate data sources within an instance graph by preserving original relationships between data objects (transactional and master data)
determine subgraphs (business transaction graphs) related to business activities
analyze subgraphs or entire graphs with aggregation queries, mining relationship patterns, etc.
USE CASE: GRAPH-BASED BUSINESS INTELLIGENCE
11
SAMPLE GRAPH
12

BIIIG DATA INTEGRATION AND ANALYSIS WORKFLOW
13
„Business Intelligence on Integrated Instance Graphs“ (PVLDB 2014)
SCREENSHOT FOR NEO4J IMPLEMENTATION
14

Relational database systems
store vertices and edges in tables
utilize indexes, column stores, etc.
could be used as a basis (graph store) to implement graph operators
Graph database system, e.g. Neo4J
use of property graph data model: vertices and edges have arbitrary set of properties ( represented as key-value pairs )
focus on simple transactions and queries
insufficient scalability
insufficient support for graph mining
GRAPH DATA MANAGEMENT
15
Parallel graph processing systems, e.g., Google Pregel, Apache Giraph, GraphX, etc.
in-memory storage of graphs in Shared Nothing cluster
parallel processing of general graph algorithms, e.g. page rank, connected components, …
newer approaches (Spark, Flink): analysis workflow with graph operators
little support for semantically expressive graphs
no end-to-end approach with data integration and persistent graph storage
GRAPH DATA MANAGEMENT (2)
16
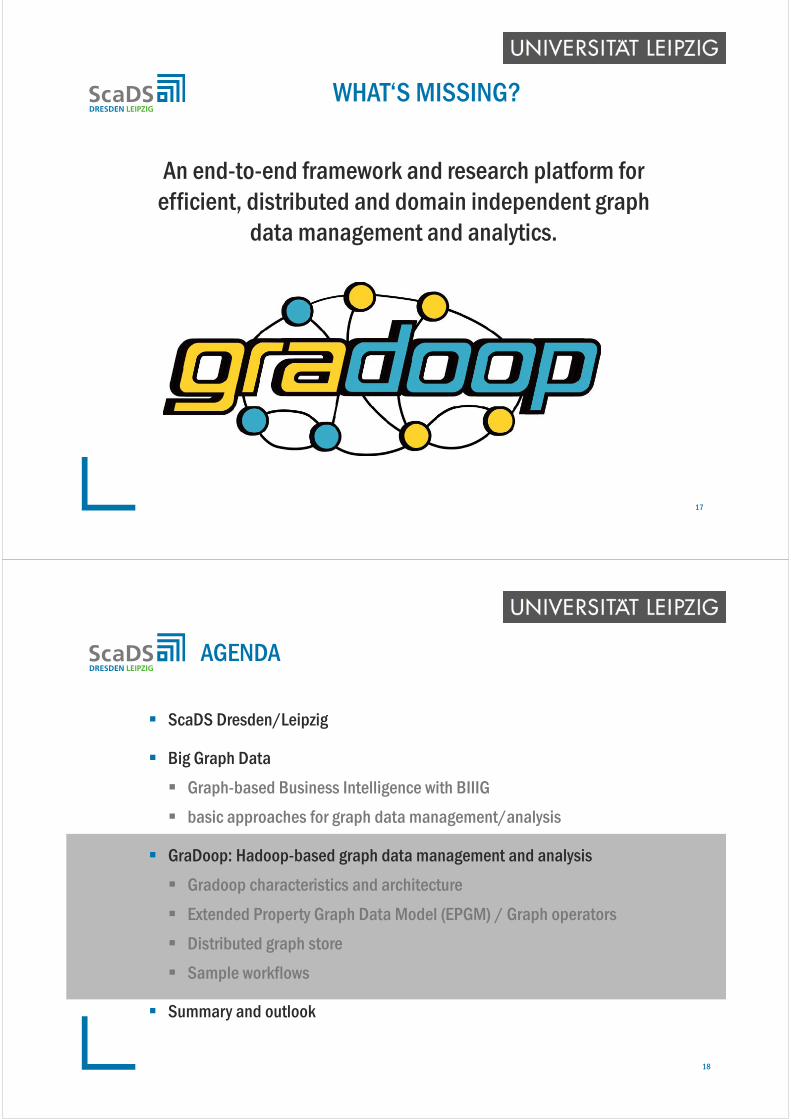
An end-to-end framework and research platform forefficient, distributed and domain independent graph
data management and analytics.
WHAT‘S MISSING?
17
ScaDS Dresden/Leipzig
Big Graph Data
Graph-based Business Intelligence with BIIIG
basic approaches for graph data management/analysis
GraDoop: Hadoop-based graph data management and analysis
Gradoop characteristics and architecture
Extended Property Graph Data Model (EPGM) / Graph operators
Distributed graph store
Sample workflows
Summary and outlook
AGENDA
18

Hadoop-based framework for graph data management and analysis
Graph storage in scalable distributed store, e.g., HBase
Extended property graph data model
operators on graphs and sets of (sub) graphs
support for semantic graph queries and mining
Leverages powerful components of Hadoop ecosystem
MapReduce, Giraph, Spark, Pig, Drill …
New functionality for graph-based processing workflows and graph mining
GRADOOP CHARACTERISTICS
19
Integrate data from one or more sources into a dedicated graphstorage with common graph data model
Definition of analytical workflows from operator algebra
Result representation in meaningful way
END-TO-END GRAPH ANALYTICS
Data Integration Graph Analytics Representation

HIGH LEVEL ARCHITECTURE
HDFSCluster
HBase Distributed Graph Store
Extended Property Graph Model
Operator Implementations
Data Integration
Workflow Execution
Workflow Declaration
Visual
GrALa DSLRepresentationData flow
Control flow
Graph Analytics Representation
1. Simple but powerful
• intuitive graphs are flat structures of vertices and binary edges
2. Logical graphs
• support of multiple, possibly overlapping graphs in onedatabase is advantageous for analytical applications
3. Attributes and type labels
• type labels and custom propertiesfor vertices, edges and graphs
4. Parallel edges and loops
• allow multiple relations between two vertices and self-connected relations
DATA MODEL - REQUIREMENTS

EXTENDED PROPERTY GRAPH MODEL
, , , Τ, , , ,
EXTENDED PROPERTY GRAPH MODEL
Vertex space , . . ,
Properties∶ ∪ ∪ → A
, , , , , , ,
Logical graphs , , . . ,
, ⊆ ∧ ⊆
Edge space , . . , , , ∈
Type labels∶ ∪ ∪ → T

Operator Definition GrALa notation
unary
Pattern Matching
∗, ∶ → graph.match(patternGraph,predicate) : Collection
Aggregation ∶ → graph.aggregate(propertyKey,aggregateFunction) : Graph
Projection , ∶ → graph.project(vertexFunction,edgeFunction) : Graph
Summarization , ∶ → graph.summarize(vertexGroupKeys, vertexAggregateFunction,
edgeGroupKeys,edgeAggregateFunction) : Graph
binary
Combination ⊔∶ → graph.combine(otherGraph) : Graph
Overlap ⊓∶ → graph.overlap(otherGraph) : Graph
Exclusion ∶ → graph.exclude(otherGraph) : Graph
GRAPH OPERATORS
PATTERN MATCHING
1: pattern = new Graph(“(a)<‐d‐(b)‐e‐>(c)”)2: predicate = (Graph g => g.V[$a][:type] == “Person” &&
g.V[$b][:type] == “Forum” &&g.V[$c][:type] == “Person” &&g.E[$d][:type] == “hasMember” &&g.E[$e][:type] == “hasMember”)
3: result = db.match(pattern, predicate)

PATTERN MATCHING
1: pattern = new Graph(“(a)<‐d‐(b)‐e‐>(c)”)2: predicate = (Graph g => g.V[$a][:type] == “Person” &&
g.V[$b][:type] == “Forum” &&g.V[$c][:type] == “Person” &&g.E[$d][:type] == “hasMember” &&g.E[$e][:type] == “hasMember”)
3: result = db.match(pattern, predicate)
SUMMARIZATION
1: personGraph = db.G[0].combine(db.G[1]).combine(db.G[2])2: vertexGroupingKeys = {:type, “city”}3: edgeGroupingKeys = {:type}4: vertexAggFunc = (Vertex vSum, Set vertices => vSum[“count”] = |vertices|)5: edgeAggFunc = (Edge eSum, Set edges => eSum[“count”] = |edges|)6: sumGraph = personGraph.summarize(vertexGroupingKeys, edgeGroupingKeys,
vertexAggFunc, edgeAggFunc)
Operator Definition GrALa notation
collection
Selection ∶ → collection.select(predicate) : Collection
Distinct δ ∶ → collection.distinct() : Collection
Sort by ξ , ∶ → collection.sortBy(key, [:asc|:desc]) : Collection
Top ∶ → collection.top(limit) : Collection
Union ∪∶ → collection.union(otherCollection) : Collection
Intersection ∩∶ → collection.intersect(otherCollection) : Collection
Difference \ ∶ → collection.difference(otherCollection) : Collection
auxiliary
Apply ∶ → collection.apply(unaryGraphOperator) : Collection
Reduce ∶ → collection.reduce(binaryGraphOperator) : Graph
Call , ∶ → [graph|collection].callFor[Graph|Collection](algorithm,parameters) : [Graph|Collection]
COLLECTION OPERATORS

SELECTION
1: collection = <db.G[0],db.G[1],db.G[2]>2: predicate = (Graph g => |g.V| > 33: result = collection.select(predicate)
SELECTION
1: collection = <db.G[0],db.G[1],db.G[2]>2: predicate = (Graph g => |g.V| > 33: result = collection.select(predicate)

1. Large-scale graphs
• Support for real-world graphs with millions of vertices andbillions of edges
2. Graph partitioning
• Efficient data distribution to balance load and minimizecommunication during computation
3. Data versioning
• Enable time-based graph analytics on properties and graphstructure
4. Fault tolerance
• Prevent data loss in case of cluster failures
DISTRIBUTED GRAPH STORE
33
Open Source implementation of Google BigTable
Distributed, persistent, sparse, multidimensional sorted map based on HDFS
Data distribution based on row key (i.e., horizontal partitioning)
Flexible storage layout (handles only byte[], no types, no schema)
Fault tolerancy through data replication (HDFS)
Data versioning on cell level
DISTRIBUTED GRAPH STORE – HBASE
34
row key 1
Column family 1 Column family 2
Column identifier C. identifier C. identifier
versioned value v. value v. value
row key 2
Colum family 1 Colum family 2
C. Identifier C. identifier Column identifier
v. value v. value versioned value
sorted
HTable
Cell: <rowkey>.<column_family>.<column_identifier>[.<version>]
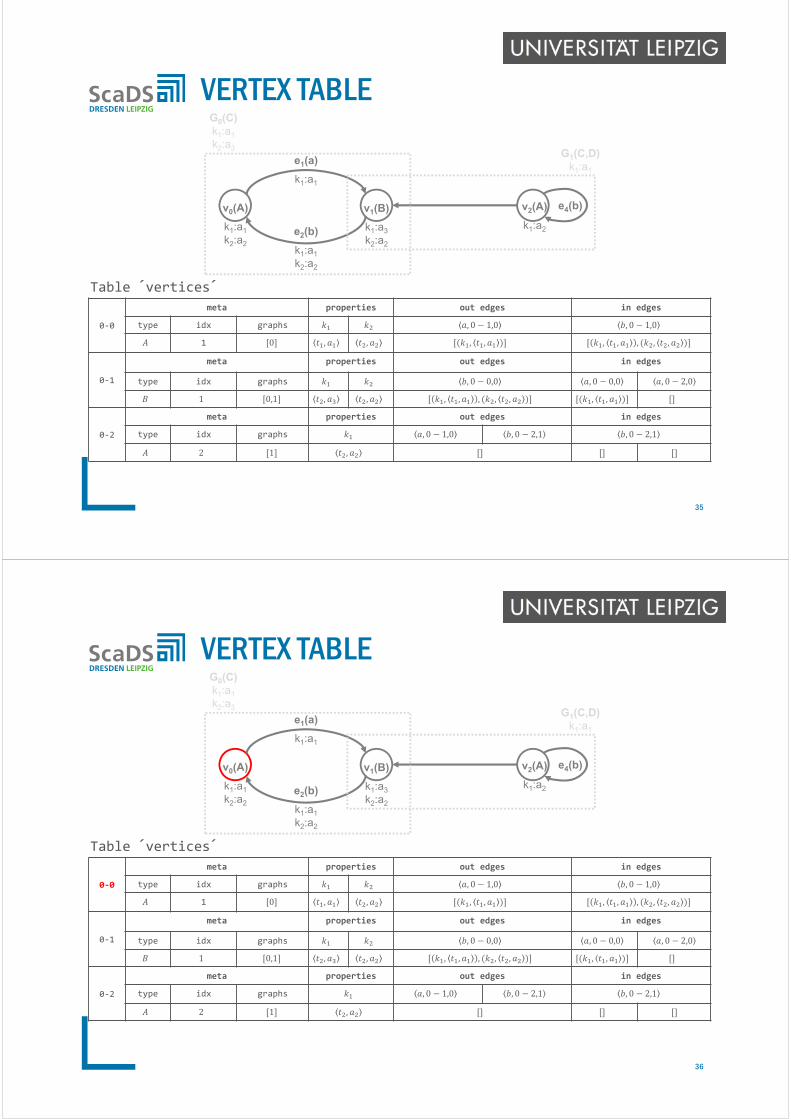
VERTEX TABLE
35
0‐0
meta properties out edges in edges
type idx graphs , 0 1,0 , 0 1,0
1 0 , , , , , , , , ,
0‐1
meta properties out edges in edges
type idx graphs , 0 0,0 , 0 0,0 , 0 2,0
1 0,1 , , , , , , , , ,
0‐2
meta properties out edges in edges
type idx graphs , 0 1,0 , 0 2,1 , 0 2,1
2 1 ,
Table ´vertices´
G0(C)k1:a1
k2:a3
v1(B)
k1:a3
k2:a2
v2(A)
k1:a2
e1(a)
k1:a1
e2(b)
k1:a1
k2:a2
e4(b)
G1(C,D)k1:a1
v0(A)
k1:a1
k2:a2
VERTEX TABLE
36
0‐0
meta properties out edges in edges
type idx graphs , 0 1,0 , 0 1,0
1 0 , , , , , , , , ,
0‐1
meta properties out edges in edges
type idx graphs , 0 0,0 , 0 0,0 , 0 2,0
1 0,1 , , , , , , , , ,
0‐2
meta properties out edges in edges
type idx graphs , 0 1,0 , 0 2,1 , 0 2,1
2 1 ,
Table ´vertices´
G0(C)k1:a1
k2:a3
v1(B)
k1:a3
k2:a2
v2(A)
k1:a2
e1(a)
k1:a1
e2(b)
k1:a1
k2:a2
e4(b)
G1(C,D)k1:a1
v0(A)
k1:a1
k2:a2

VERTEX TABLE
37
0‐0
meta properties out edges in edges
type idx graphs , 0 1,0 , 0 1,0
1 0 , , , , , , , , ,
0‐1
meta properties out edges in edges
type idx graphs , 0 0,0 , 0 0,0 , 0 2,0
1 0,1 , , , , , , , , ,
0‐2
meta properties out edges in edges
type idx graphs , 0 1,0 , 0 2,1 , 0 2,1
2 1 ,
Table ´vertices´
G0(C)k1:a1
k2:a3
v1(B)
k1:a3
k2:a2
v2(A)
k1:a2
e1(a)
k1:a1
e2(b)
k1:a1
k2:a2
e4(b)
G1(C,D)k1:a1
v0(A)
k1:a1
k2:a2
VERTEX TABLE
38
0‐0
meta properties out edges in edges
type idx graphs , , , 0 1,0
1 0 , , , , , , , , ,
0‐1
meta properties out edges in edges
type idx graphs , 0 0,0 , , , 0 2,0
1 0,1 , , , , , , , , ,
0‐2
meta properties out edges in edges
type idx graphs , 0 1,0 , 0 2,1 , 0 2,1
2 1 ,
Table ´vertices´
G0(C)k1:a1
k2:a3
v1(B)
k1:a3
k2:a2
v2(A)
k1:a2
e1(a)
k1:a1
e2(b)
k1:a1
k2:a2
e4(b)
G1(C,D)k1:a1
v0(A)
k1:a1
k2:a2

VERTEX TABLE
39
0‐0
meta properties out edges in edges
type idx graphs , 0 1,0 , ,
1 0 , , , , , , , , ,
0‐1
meta properties out edges in edges
type idx graphs , , , 0 0,0 , 0 2,0
1 0,1 , , , , , , , , ,
0‐2
meta properties out edges in edges
type idx graphs , 0 1,0 , 0 2,1 , 0 2,1
2 1 ,
Table ´vertices´
G0(C)k1:a1
k2:a3
v1(B)
k1:a3
k2:a2
v2(A)
k1:a2
e1(a)
k1:a1
e2(b)
k1:a1
k2:a2
e4(b)
G1(C,D)k1:a1
v0(A)
k1:a1
k2:a2
PARTITIONED VERTEX TABLE
40
0 1
2 3
8 94 5
6 7 10 11
0‐0
0‐1
0‐2
0‐3
0‐4
0‐5
0‐6
0‐7
0‐8
0‐9
0‐10
0‐11
Reg
ion
1

PARTITIONED VERTEX TABLE
41
0 1
2 3
8 94 5
6 7 10 11
0‐0
0‐3
0‐6
0‐9
1‐1
1‐4
1‐7
1‐10
2‐2
2‐5
2‐8
2‐11
Reg
ion
1R
egio
n 2
Reg
ion
3
PARTITIONED VERTEX TABLE
42
0 1
2 3
8 94 5
6 7 10 11
0‐0
0‐1
0‐2
0‐3
1‐4
1‐5
1‐6
1‐7
2‐8
2‐9
2‐10
2‐11
Reg
ion
1R
egio
n 2
Reg
ion
3

GRAPH TABLE
43
0
meta properties edges
type vertices 0 0 0 1
0 0,0 1 , , , 0 1,0 , 0 0,0
1
meta properties edges
type graphs 0 1 0 2
0 1,0 2 , , 0 1,0 . , 0 2,1
Table ´graphs´
G0(C)k1:a1
k2:a3
v1(B)
k1:a3
k2:a2
v2(A)
k1:a2
e1(a)
k1:a1
e2(b)
k1:a1
k2:a2
e4(b)
G1(D)k1:a1
v0(A)
k1:a1
k2:a2
GRAPH TABLE
44
0
meta properties edges
type vertices 0 0 0 1
0 0,0 1 , , , 0 1,0 , 0 0,0
1
meta properties edges
type graphs 0 1 0 2
0 1,0 2 , , 0 1,0 . , 0 2,1
Table ´graphs´
G0(C)k1:a1
k2:a3
v1(B)
k1:a3
k2:a2
v2(A)
k1:a2
e1(a)
k1:a1
e2(b)
k1:a1
k2:a2
e4(b)
G1(D)k1:a1
v0(A)
k1:a1
k2:a2

GRAPH STORE
45
0
meta properties edges
type vertices
, , , , 0 1,0 , 0 0,0
1
meta properties edges
type graphs 0 1 0 2
0 1,0 2 , , 0 1,0 . , 0 2,1
Table ´graphs´
G0(C)k1:a1
k2:a3
v1(B)
k1:a3
k2:a2
v2(A)
k1:a2
e1(a)
k1:a1
e2(b)
k1:a1
k2:a2
e4(b)
G1(D)k1:a1
v0(A)
k1:a1
k2:a2
GRAPH TABLE
46
0
meta properties edges
type vertices 0 0 0 1
0 0,0 1 , , , , , ,
1
meta properties edges
type graphs 0 1 0 2
0 1,0 2 , , 0 1,0 . , 0 2,1
Table ´graphs´
G0(C)k1:a1
k2:a3
v1(B)
k1:a3
k2:a2
v2(A)
k1:a2
e1(a)
k1:a1
e2(b)
k1:a1
k2:a2
e4(b)
G1(D)k1:a1
v0(A)
k1:a1
k2:a2

1. Social Network Analysis
• “Summarized Communities”
• Find communities by label propagation
• Summarize vertices per communityand edges between community members
2. Business Intelligence
• Top Revenue Subgraph
• Find the common subgraph of the top 100 revenue business transaction graphs
EXAMPLE GRALA WORKFLOWS
// define pattern to extract persons and their “knows” relations1: pattern = new Graph( "(a)‐c‐>(b)“ )2: predicate = ( Graph g =>
g.V[$a][:type] == "Person" &&g.V[$b][:type] == "Person" &&g.E[$c][:type] == "knows“)
// find all matches inside the database3: friendships = db.match( pattern , predicate )// combine all matches to a single graph4: knowsGraph = friendships.reduce( Graph g, Graph f => g.combine(f) )// remove properties5: knowsGraph = knowsGraph.project( Vertex v =>
new Vertex(v[:type], {}), new Edge(e[:type], {}))// extract communities, store community at vertex property “community”6: knowsGraph = knowsGraph.callForGraph(
:CommunityDetectionAlgorithm , {"propertyKey":"community"})// summarize vertices based on their community// count edges inside and between communities7: summarizedCommunities = knowsGraph.summarize(
{“community"},((Vertex vSum, Set vertices) => vSum["count"] = |vertices|),{},((Edge eSum, Set edges) => eSum["count"] = |edges|))
GRALA EXAMPLE : SUMMARIZED COMMUNITIES

// compute logical graphs1: btgs = db.callForCollection( :BusinessTransactionGraphs , {} )
2: aggFuncInvoiceCount = ( Graph g =>|g.V.filter( Vertex v => v[:type] == "Invoice")|)
3: btgs = btgs.apply(Graph g => g.aggregate( "invoiceCount",aggFuncInvoiceCount) )
// select logical graphs with at least one invoice4: invBtgs = btgs.select(
Graph g => g["invoiceCount"] > 0)// define and apply aggregate function (revenue per graph)5: aggFuncRevenue = ( Graph g =>
g.V.values("revenue").sum())6: invBtgs = invBtgs.apply(
Graph g => g.aggregate( "revenue",aggFuncRevenue) )// sort graphs by revenue and return top 1007: topBtgs = invBtgs.sortBy( “revenue“ , :desc ).top( 100 )// compute overlap to find master data objects (e.g., Employees)8: topBtgOverlap = invBtgs.reduce(
Graph g, Graph h => g.overlap(h))
GRALA EXAMPLE : TOP REVENUE SUBGRAPH
ScaDS Dresden/Leipzig
Big Graph Data
Graph-based Business Intelligence with BIIIG
basic approaches for graph data management/analysis
GraDoop: Hadoop-based graph data management and analysis
Gradoop characteristics and architecture
Extended Property Graph Data Model (EPGM) / Graph operators
Distributed graph store
Sample workflows
Summary and outlook
AGENDA
50
ScaDS Dresden/Leipzig
Research focus on data integration, knowledge extraction, visual analytics
broad application areas (scientific + business-related)
Big Graph Data
high potential of graph analytics even for business data (BIIIG)
GraDoop
end-to-end framework for graph data management and analytics
leverages Hadoop ecosystem including graph processing systems
extended property graph model (EPGM) with powerful operators
Gradoop store based on Hbase
initial implementation running
SUMMARY
51
complete processing framework
implementation for all operators
implement more mining algorithms on EPGM
workflow execution layer
visualization
automatic optimization of analysis workflows
optimized graph partitioning approaches
graph-based data integration
…
GRADOOP OUTLOOK
52

Graph Store / Workflow Execution / Graph Pattern Matching: Martin Junghanns (wiss. MA)
BIIIG / Workflow Execution / Frequent Subgraph Mining: Andre Petermann (wiss. MA)
RDF Graph Analytics: Markus Nentwig (wiss. MA)
Gradoop + Flink: Niklas Teichmann (SHK)
Graph Partitioning: Kevin Gómez (SHK/BA)
Visual Workflow Definition: Simon Chill (MA)
Graph Pattern Matching: Andreas Krause (MA)
Frequent Subgraph Mining: Thomas Döring (MA)
Graph Visualization: Ngoc Ha Tran (MA)
GRADOOP TEAM
Junghanns, M., Petermann, A., Gomez, K., Rahm, E.: GRADOOP - Scalable Graph Data Management and Analytics with Hadoop. Tech. report, Univ. of Leipzig, June 2015
L. Kolb, E. Rahm: Parallel Entity Resolution with Dedoop. Datenbank-Spektrum 13(1): 23-32 (2013)
L. Kolb, A. Thor, E. Rahm: Dedoop: Efficient Deduplication with Hadoop. PVLDB 5(12), 2012
L. Kolb, A. Thor, E. Rahm: Load Balancing for MapReduce-based Entity Resolution. ICDE 2012: 618-629
L. Kolb, Z. Sehili, E. Rahm: Iterative Computation of Connected Graph Components with MapReduce. Datenbank-Spektrum 14(2): 107-117 (2014)
A. Petermann, M. Junghanns, R. Müller, E. Rahm: BIIIG : Enabling Business Intelligence with Integrated Instance Graphs. Proc. 5th Int. Workshop on Graph Data Management (GDM 2014)
A. Petermann, M. Junghanns, R. Müller, E. Rahm: Graph-based Data Integration and Business Intelligence with BIIIG. Proc. VLDB Conf., 2014
Petermann, A.; Junghanns, M.; Müller, R.; Rahm, E.: FoodBroker - Generating Synthetic Datasets for Graph-Based Business Analytics. Proc. 5th Int. Workshop on Big Data Benchmarking (WBDB), 2014
E. Rahm, W.E. Nagel: ScaDS Dresden/Leipzig: Ein serviceorientiertes Kompetenzzentrum für Big Data. Proc. GI-Jahrestagung 2014: 717
REFERENCES
54