scalability and performance of a large linux …/67531/metadc708885/...s7$vw?mo=cy$kkj--scalability...
TRANSCRIPT
,
s7$vw?mo=cy$KKj--
Scalability and Performance of a Large Linux Cluster 1
Ron Brightwell and Steve PlimptonSandia National Labomtories, P.O. Boz 5800, Albuquerque, NM, 87185-1110,
(505)8~5-7397, FAX (505)8J5-7#2
Emaik brightfks.sandia.gov~jplimpt%x+andia.gov
In th~ paper we present performance results from sevem”parallel bench-
marks and applications on a 400-node Lkmx cluster at Sandia NationalLaboratories. We compare the results on the Lmux cluster to performance
obtained on a traditional distributed-memory massively parallel process-ing machiie, the Intel TeraFLOPS. We discuss the characteristics of thesemachhes that influence the performance results and identify the key com-ponents of the system software that we feel are important to allow forscalabili~ of commodity-based PC clusters to hundreds and possibly thou-sands of processors.
.
Key Words: massively parallel, workstation cluster, me5sagepassing
1. INTRODUCTION
The commodity-based personal computer (PC) cluster machine has become anattractive alternative to traditional supercomputing platforms. The performanceof clusters of PC’s is being compared to distributed-memory messagepassing su-percomputers, such as the Intel Paragon, SGI/Cray T3E, and IBM 5P-2, as well asshared-memory supercomputers, such as the SGI/Cray Origin 2000, SUN E1OOOO,and DEC 8400. For many applications, small-scale PC clusters are able to competeand even surpass the performance of these traditional supercomputing platforms.For example, in September of 1999, the Forecast Systems Laboratory division ofthe National Oceanographic and Atmospheric Administration awarded a five-yearmulti-million dollar contract for a macbe with a peak performance of four trillionfloating point operations per second (FLOPS) to a vendor that supplies Linux-basedPC clusters. The vendor, High Performance Technologies, Inc., outbid several tradi-tional supercomputing vendors and platforms by offering a PC cluster that providedcomparable performance on a set of FSL-supplied benchmarks for significantly lesscost.
lThis work was supported by the United States Department of Energy under Contract DEAC04-94AL85000.
1
.—— —Y- ,, ,., .,. . . . . . . . . . . . . . . . . . . . .. , ., . . . , ,“,.... ,..........,.->.,.,=< —.-—- .-.......

DISCLAIMER
This repoti was prepared as an account of work sponsoredby an agency of the United States Government. Neither theUnited States Government nor any agency thereof, nor anyof their employees, make any warranty, express or implied,or assumes any legal liability or responsibility for theaccuracy, completeness, or usefulness of any information,apparatus, product, or process disclosed, or represents thatits use would not infringe privately owned rights. Referenceherein to any specific commercial product, process, orservice by trade name, trademark, manufacturer, orotherwise does not necessarily constitute or imply itsendorsement, recommendation, or favoring by the UnitedStates Government or any agency thereof. The views andopinions of authors expressed herein do not necessarilystate or reflect those of the United States Government orany agency thereof.
..=-4 ,,3 , ,, ..,,, ,.. ..y.-=m. > (. .>.. r !, ,- .,, ., . . . ...-’ ....7.. >!, &=J, .. . .. .. .. . .. .... . . .... . 77.wm7<7v. .:, , ,:.$- . . . .
. . ..—
DISCLAIMER
Portions of this document may be illegiblein electronic image products. Images areproduced from the best availabie originaldocument.
I
1
I
,- .,=T, . . . . . . .. ~.-,:>~m.:,a.,.. , , ..-,mw . , .,. . .. .. .. .. , ......... ..—-- ...._’
2’ BR.IGHTWELLAND PLIMPTON
The ability of a small-scale dedicated cluster of standard desktop PC’s to competewith and sometimes outperform small-scale supercomputers has been demonstrated[25].However, very few performance redts have been published on clusters with hun-
dreds of processors. Thus, it is unknown whether PC clusters will be able to scaleup to a comparable level of compute performance on several hundred or thousands
of processors to compete with large-scale massively parallel processing (MPP) ma-chines and clusters of large shared-memory processing (SMP) machines. ‘Ihditional
massively parallel computing platforms have benefited from many years of research,development, and experience dedicated to improving their scalabtity and perfor-
mance. The Computational Plant (Cpkmt) project at Sandia National Laboratories
is a continuation of our research into system software for massively parallel com-puting on distributed-memory messag~pass”mg machines. We are transitioning ourscalable system software artiltecture horn large-scale MPP machines to clusters ofPC’S. In this paper, we hope to show that large-scale PC clusters can compete with
largwxile MPP machiies, provided that proper attention is given to scalabfity inboth hardware and system software.
The following section describes the hardware and software components of a tradi-tional MPP machine, the Intel TeraFLOPS. In Section 3, we describe the hardwareand software components of the 400-node Cplant cluster. Section 4 presents a com-parison of the performance of several benchmarks on the two platforms, and Section
5 continues with a performance comparison of several applications. We conclude inSection 6 with a summary of relevant results and outline our plans for future workin Section 7.
2. SANDIA/INTEL TERA.PLOPS MACHINE
The Sandia/Intel TeraFLOPS macldie (TFLOPS)[20] is the Department of En-ergy’s Accelerated Strategic Computing tiltiative (ASCI) Option Red machiie.Installed at Sandia in the Spring of 1997, it is the culmination of more than tenyears of research and development in massively parallel distributed-memory com-puting by both Intel and Sandia. The following describes the hardware and softwarecomponents of TFLOPS.
2.1. HardwareTFLOPS[20] is made up of more than nine thousand 300 MHz Pentium II Xeon
processors connected by a network capable of delivering 400 MB/s unidirectionalcommunication bandwidth. Each compute node contains two processors and 256MB of main memory, and the nodes are arranged in a 38x32x2 mesh topologyprovidhg 51.2 GB/s of bisection bandwidth. Each compute node has a networkinterface chip (NIC) that resides on the memory bus, allowing for low-latency accessto all of physical memory.
The theoretical peak compute performance of this machine is 3.2 TFLOPS. Itachieved 2.37 TFLOPS on the LINPACK[8] benchmark, placing it at number oneon the November 1999 list of the Top 500[16] fastest computers in the world.
2.2. SoftwareThe compute nodes of TFLOPS run a variant of a lightweight kernel, called
Puma[23], that was designed and developed by Sandia and the University of New
—F> . . . . . . . ,-

SCALABILITYAND PERFORMANCEOF A LARGELINUXCLUSTER 3
Mexico. The d=ign of this kernel evolved horn earlier experiences in providinga high-performance operating system optimized for dlstnbuted-memory message-passing MPP’s[13]. The Puma operating system was originally developed on a1024-procesor nCUBE2 and later ported to an 1800-node Intel Paragon. Intel
and Sandla worked together to port Puma to the x86 processor artiltecture for
TFLOPS, at which point it was productized and renamed Cougar by Intel. Cougarconsumes approximately one percent of the total main memory on a node.
A key component of the design of Puma is a high-performance data movement
layer called Portals[22]. Portals are data structures in an application’s address space
that determine how the kernel should respond to message-passing events. Portalsallow messages to be delivered directly to the application without any intervention
by the application process. In particular, the application process need not be thecurrently running process or perform any message selection operations to processincoming messages. Commodity networking technology has recently begun to real-
ize the benefits of such strategies, with emerging technologies such as the VirtualInterface Architecture[’i’l, Scheduled Thnsfer[24], and the newly formed Ir&niBand
Tkade Association. In addition to providing high-performance message passing, theruntime components of TFLOPS work together to provide a scalable job launch
capability that can allocate processors and start processes on thousands of nodesin a matter of several seconds.
3. COMPUTATIONAL PLANT
The Computational Plant (Cplant)[21] project at Sandia is a commodity hard-ware based Lhmx cluster that combines the benefits of commodky cluster comput-ing with our experience and expertise in designing, developing, using, and main-taining massively parallel distributed-memory machines. The goal is to providea large-scale computing resource that not only meets the level of compute per-formance required by Sandia’s key applications, but that also meets the levels ofusability and reliability of past machiies such as TFLOPS. The following sectionsdescribe the initial approach, and the hardware and software components of Cpkmt.
3.1. ApproachThe focus of Cplant is on scalability - in every aspect of the macline. Scalability
in terms of application performance is critical, but scalability in other areas is alsocritical. For example, just as TFLOPS does, application launch should happenin seconds on several thousand nodes. The mtilne should be able to distributesystem software and boot in tens of minutes. The machhe ;hould remain stableand performance of the runtime environment should not degrade as the number ofinteractive users increases.
Our approach to Cplant was to leverage as much as possible from the design ofTFLOPS. We designed a support and diagnostic infrastructure for Cplant analogousto the Reliability, Availability, and Supportability (RAS) system that Intel devel-oped. We followed the partition model (service, compute, 1/0, etc.) of resourceprovision[lO] that Intel developed. We decided to leverage the code developmentthat we had done for Puma to create a scalable runtime environment.
Our experience with the poor performance and scalability of fidl-featured UNIXkernels on MPP’s, such as OSF on the Paragon, motivated much of the research that
4’ BRIGHTWBLLAND PLIMPTON
. ..-. ..y. ..-. -Y
.A
. .- $.’--+..- . ..-,; ; ,4.... . -,
-..,
I!!i!.,,..>”; -- ~.-.
?. . .:“ :
;;.4
;< .’.;-, * .}
. ,,.-’”. .Y :. .
, .“, . . .; .<-!:,,. .,.-
.,
z.:~h ,~:;”:-’ --- ~ : ;.;...”. . . . . . . . .
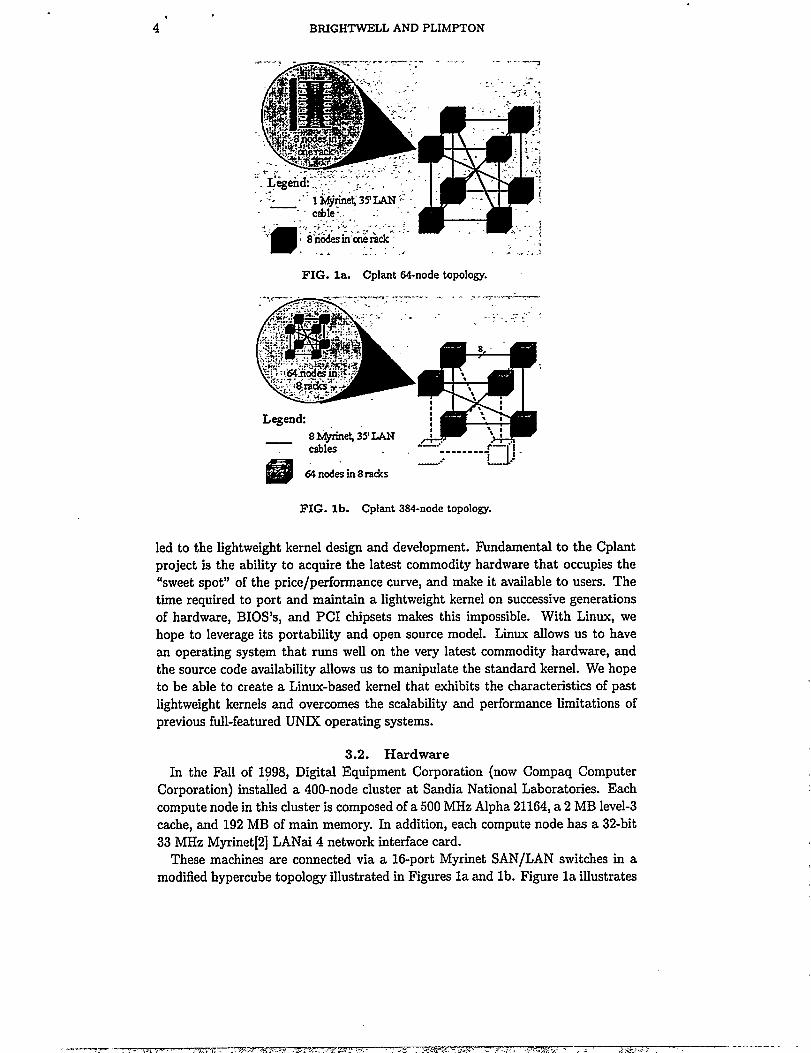
FIG. la. Cplant 84-nodetopology.
8Legend
Ifiii9”-. !-1.:—..
64nodesin8mks
FIG. lb. Cplant 384-nodetopology.
led to the lightweight kernel design and development. Fundamental to the Cplantproject is the ability to acquire the latest commodity hardware that occupies the“sweet spot” of the price/performance curve, and make it available to users. Thetime required to port and maintain a lightweight kernel on successive generationsof hardware, BIOS’s, and PCI chipsets makes thk impossible. With Lhmx, wehope to leverage its portabfity and open source model. Lmux allows us to havean operating system that runs well on the very latest commodity hardware, andthe source code availability allows us to manipulate the standard kernel. We hopeto be able to create a Lhw-based kernel that exlibits the characteristics of pastlightweight kernels and overcomes the scalability and performance Mltations ofprevious full-featured UiWX operating systems.
3.2. Hardware
In the Fall of 1998, Digital Equipment Corporation (now Compaq ComputerCorporation) installed a 400-node cluster at Sandia National Laboratories. Eachcompute node in this cluster is composed of a 500 MHz Alpha 21164, a 2 MB level-3cache, and 192 MB of main memory. In addition, each compute node has a 32-bit
33 MHz Myrinet[2] LANai 4 network interface card.These machines are connected via a 16-port Myrinet SAN/LAN switches in a
modified hypercube topology illustrated in Figures la and lb. Figure la illustrates
--— - -. -+Y-.,,., .-. .,1, . .,. ,Y. . . . . .. . . . . . .. . . . . . . . . . . . ,.-s . ...-...4 . Y . ..., .> ..,. :.,- . , . .. . ,..s.. . .
.
SCALABILHYAND PERFORMANCEOF A LARGELINUXCLUSTER 5
the 64-node topology that is used to construct the 384-node topology illustratedin Figure lb. We extend this topology to 400 nodes by partially Hling one of theempty cubes.
The theoretical peak performance of the 32-bit 33 MHz PCI bus interface is thelimiting factor in Myrinet bandwidth capabfity. The PCI bus limits the possible
performance to 132 MB/s, but in practice most PCI chipset implementations can
only deliver about 100 MB/s.
This machine has a theoretical compute performance peak of 400 gigaFLOPS
(GFLOPS). It achieved 125.2 GFLOPS on the LINPACK[8] benchmark runningon 350 nodes, which would place it at number 71 on the November 1999 list of the
Top 500[16] fastest computers in the world had the results been submitted.
3.3. Software-..
The Cplant runtime environment is based on the Portals data movement layer
from the Puma operating system. All of the system software in the runtime en-vironment uses Portals for message passing. See Brightwell[3J for a description ofthe components of the scalable runtime environment. By implementing Portals in .
Lhmx, we were able to m-use much of the code that had been developed for theParagon and TFLOPS. For example, the high-performance implementation[5J ofthe Message Passing Interface (MPI) standard[14] that had been tildated by Intelas a product for TFLOPS ported to Cplant with virtually no changes.
Portals in Linux are currently implemented via two kernel modules that workwith a Sandia-developed Myrinet Control Program (MCP) that runs on the LANaiprocessor on the Myrinet interface card. The Portals module is responsible fordetermining how incoming messages are processed. It reads the application pro-cess’ memory and interprets the Portal data structures. The Portals module com-municates information about message delivery to the RTS/CTS module, WYhkhisresponsible for packetization and flow control. The RTS/CTS module communi-cates packet delivery information to the MCP, which is essentially a packet deliverydevice.
4. PERFORMANCE BENCHMARKS
The following sections present a comparison of the communication and compu-tation performance of the Cplant cluster versus TFLOPS. We describe the networkperformance of the two machhes with a standard ping-pong message-passing bench-mark. Results of the NAS Parallel Benchmark suite version 2.3 Class B are alsopresented to characterize the compute and communication performance of the twoplatforms.
4.1. Message-Passing BenchmarksFigure 2 shows the MPI oneway messag~passing bandwidth for Portals in Llnux
and Portals in Puma. The asymptotic MPI bandwidth is 311 MB/s for Puma Por-tals and 54 MB/s for Portals in Linux. The high-performance network on TFLOPSsignificantly outperforms the Myrinet.
Figure 3 shows the MPI one-way latency performance. The zero-length MPI la-tency is 13psec for Puma Portals and 106psec for Lmux Portals. Not surprisingly,the highly optimized MPP network with the tightly integrated interface outperforms
d
. ---- ,.’, . ., ...,,,.,, ~.>’;- -WY?. 7 .s--%., -y%, x y., ‘. *:? . ? ..xi’w -“T’7r~P’5 ‘ .. . ..:! ,,—--- . . . ..-. — ___

BRIGHTWELLAND PLIMPTON
.A--+------”-- *—*.. e*.--*””**””**”-*-”-K
%’-”-””,%-””
/!
x{Portals4Jnux —f—Portals.Puma ---x—
0 20000 mMooo SOooolm 1200001400w 160molSOooo20woo ZooooMessage Size (bytes)
FIG. 2. MPI one-way bandw”dthon TFLOPS and Cplant.
1 1 I , ,
Poflals-Unux ——4—Portals-Puma ---x---
**X*X-X* X-X*X-X-X*X+*X-X*X-X*X-X* X-X*%-X*X-X**X*X-X* *X**X-X*X**X+I*X-X* X-”* X-)
~
--- --! n-’--- ./, ,,r,,m ,, ,4X’, 4, ; , .?: .,,,4,,/},).> . i%.,.. .,..* .>.. .,. -,. ....~’w-=., :,..> , :-:+ ?%.*J .. .. . . . .+. ..— -~,,.
o 2CQ 400 600 800 1000Message Size (bytes)
FIG. 3. MPI on~way latency on TFLOPS and Cplant.
.

SCALABILITY AND PERFORMANCE OF A LARGE LINUX CLUSTER 7
the Myrinet network with the PCI bus interface. However, the latency performanceof Portals in Lhmx is significantly less than what other Myrinet software implemen-tations have been able to achieve[15, 12, 19]. The programmabfity of Myrinet hasallowed for the development of MCP’S and support libraries that can aclieve less
than 10p.sec for MPI one-way latency. The reasons for such high latency numbersfor Portals can be attributed to several factors.
First, Portals was designed for platforms where the network interface resides onthe memory bus and has access to all of the physical memory on a node. For exam-
ple, the Portals implementation in Puma uses data structures in an application’s
address space to describe to the kernel how to respond to incoming messages. Thislack of an explicit API does not allow important data structures to be placed any-where but in user space. ThM placement severely limits the performance possiblefor the Portals implementation in Linux. Because the Lmux kernel does not have
access to all of physical memory, data structures in user space must be copied intokernel space to be inspected by the Portals module. After inspection, these data
structures are manipulated and then copied back into user space. Crossing theseprotection boundaries and moving data back and forth between user and kernelspace is expensive in Lhmx.
In addition to excessive memory copying, interrupts are used to process incomingmessages. Rather than wasting host processor cycles polling the network or usinga dedicated message co-processor, the MCP generates an interrupt to service thenetwork. Some Myrinet implementations have even been able to achieve extremelylow latencies by dedicating the host processor to polling the network. Wide lowlatency is desirable, we feel that a message passing implementation that maximizesthe amount of compute cycles delivered to the application, rather than to thenetwork, is more desirable.
The Iiiitations with’ respect to latency of the Portals implementation in Linuxwere dhcovered early in the porting effort. However, we also knew horn experiencethat a critical component of a scalable massively parallel distributed memory ma-chine is bandwidth performance. The bandwidth performance of Portals is greaterthan many other Myrinet implementations, especially those optimized for shortmessage performance.
Since the entire scalable runtime environment was being layered on Portals,we continued to develop our code on top of this interface while searching for anew messag~passing layer. We developed a new messag~passing interface, Portals3.0[4], designed specifically to support massively parallel clusters. We expect thisnew interface to allow us to overcome the latency performance limitations of thecurrent generation of Portals in Llnux.
4.2. Application BenchmarksWe now describe the performance of several of the NAS Parallel Benchmarks[l]
version 2.3 Class B on Cplant and TFLOPS. The suite is widely used to comparethe performance of all types of parallel computing platforms, since it contains com-putational kernels that are representative of several different algorithms used inmany real-world applications. The individual codes in the suite are limited in thenumber of processors on which they can run, either by requiring a power of two or
t
-TV-T-. ,- . . .. ..-. , ,, <* ,,. :L&. , , ,,,:<.,: +,.,+>’,), ,; .: . . . . ... -’ . . .,-; ,. !. ,.- <=S. ,- ,,>. .;yi,~, -. —.- ----- . . . .,.r ,.
8 BRIGHTWELLAND PLIMPTON
-in 01 1 I t 1 I I 1 1 I Ilu
1248 16 32 64 128 256
Processors
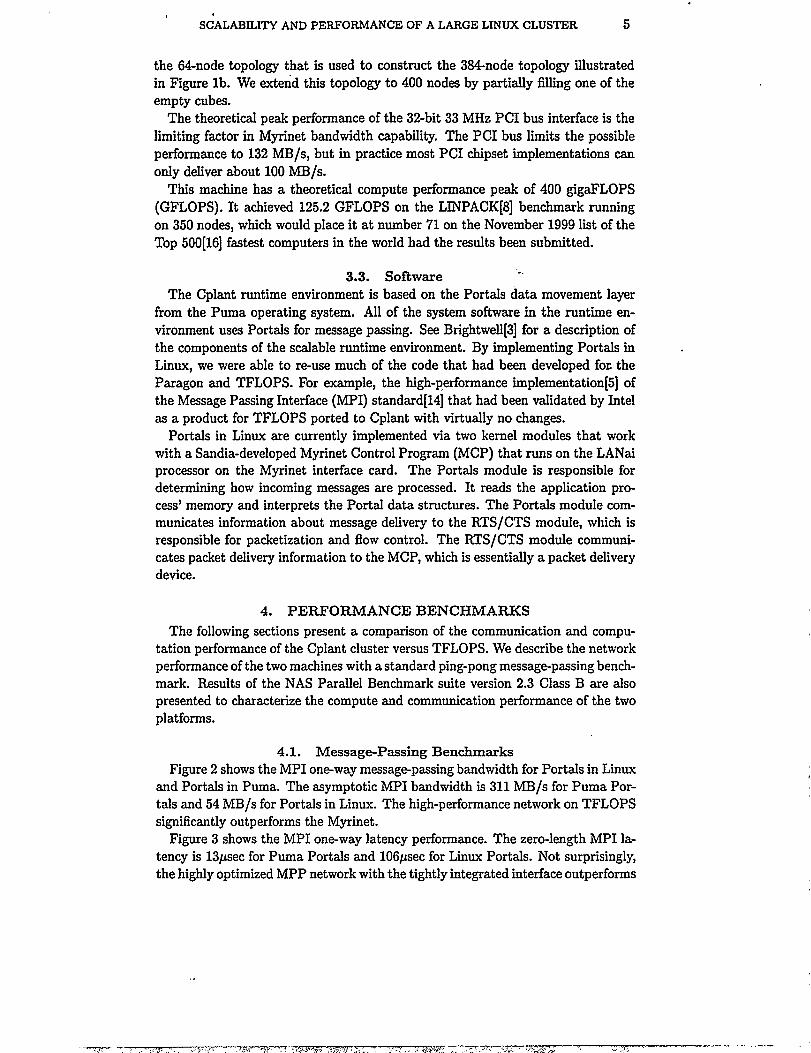
FIG. 4. TotaI runtime for the EP benchmarkon TFLOPS (squares) and Cplant (circles).
a square number of processors, and the size of the problem for each benchmark isfixed as the number of processors is increased.
Figure 4 shows the total runtime results of the EP benchmark on Cplant andTFLOPS out to 256 processors. ThB benchmark is totally computation bound andperforms no message passing. Since there are no communication effects on scalhg,this benchmark only characterizes the difference in compute performance betweenthe two platforms.
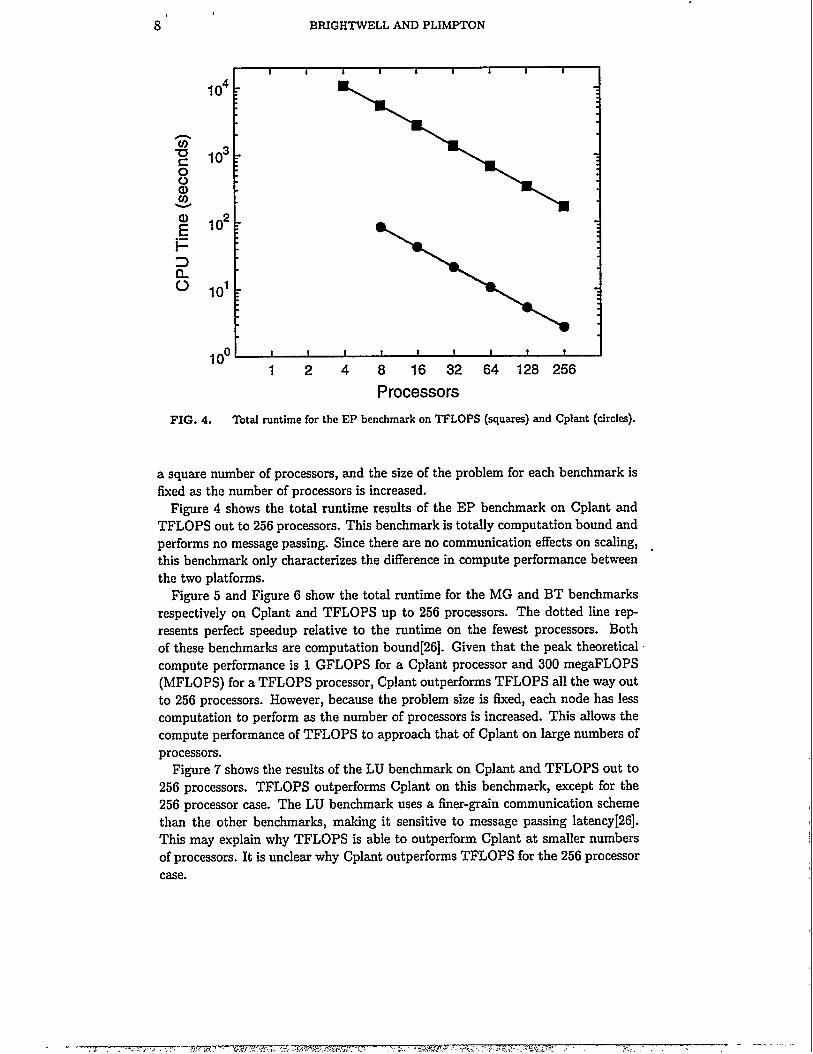
Figure 5 and Figure 6 show the total runtime for the MG and BT benchmarksrespectively on Cplant and TFLOPS up to 256 processors. The dotted line rep-resents perfect speedup relative to the runtime on the fewest processors. Bothof these benchmarks are computation bound[26]. Given that the peak theoreticalcompute performance is 1 GFLOPS for a Cpkmt processor and 300 megaFLOPS(MFLOPS) for a TFLOPS processor, Cplant outperforms TFLOPS all the way outto 256 processors. However, because the problem size is fixed, each node has lesscomputation to perform as the number of processors is increased. Thk allows thecompute performance of TFLOPS to approach that of Cplant on large numbers ofprocessors.
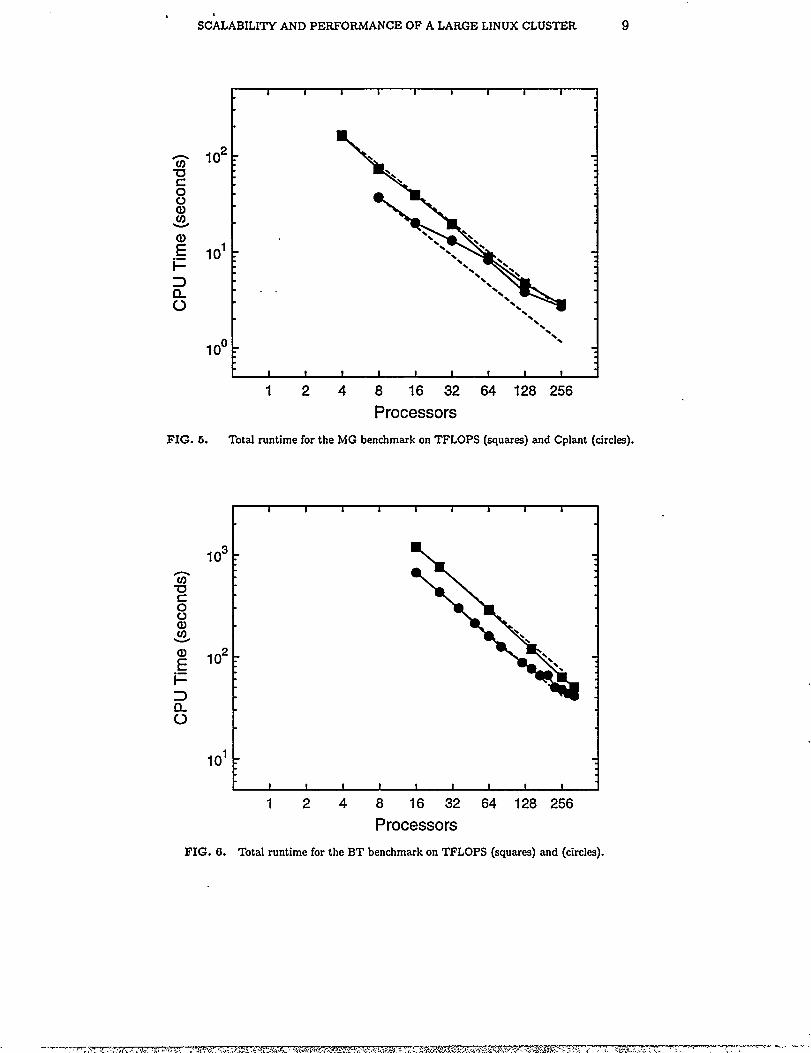
Figure 7 shows the results of the LU benchmark on Cplant and TFLOPS out to256 processors. TFLOPS outperforms Cplant on this benchmark, except for the256 processor case. The LU benchmark uses a finer-grain communication schemethan the other benchmds, making it sensitive to message passing latency[26].This may explain why TFLOPS is able to outperform Cplant at smaller numbersof processors. It is unclear why Cplant outperforms TFLOPS for the 256 processorcase.
SCALABILITY AND PERFORMANCE OF A LARGE LINUX CLUSTER 9
c I I I I I I I I I .I
1.
1248 16 32 64 128 256
Processors
FIG. 5. Total runtime for the MG benchmark on TFLOPS (squares) and Cplant (circles).
102 :
10’ :
10° ~
t I I I 1 I 1 1 I 1
103
102
10’
FIG. 6.
I I I I 1 1 I I I
●
L 4
1248 16 32 64 128 256
Processors
Total runtime for the BT benchmarkon TFLOPS (squares) and (circles).
10’ ‘
103
102
BRIGHTWELL AND PLIMPTON
I 1 I 1 1 I I I I I
1248 16 32 64 128 256
Processors
FIG. 7. Total runtime for the LU benchmark on TFLOPS (squares) and Cpkmt (circles).
an 4Iu
103
102
10’
t I I i I I i I I I 4
I I I I I I 1 1 I
L
-\\.
1248 16 32 64 128 256
Processors
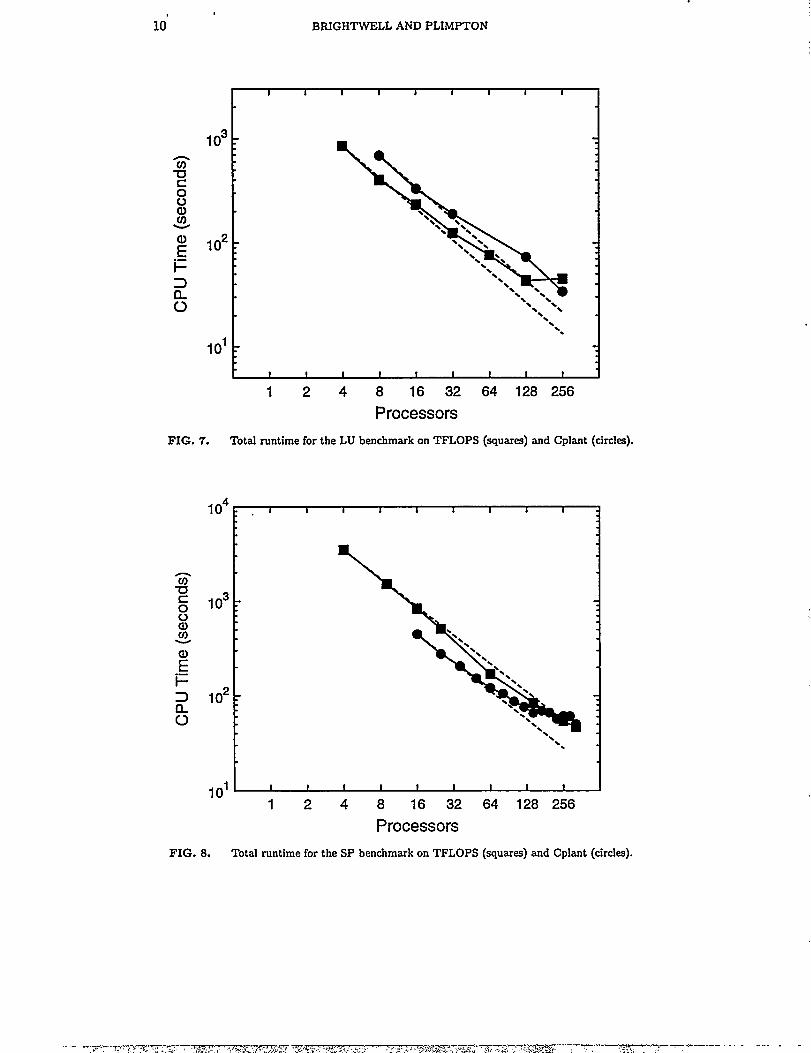
FIG. 8. Total runtime for the SP benchmark on TFLOPS (squares) and Cplant (circles).
SCALABILITY AND PERFORMANCE OF A LARGE LINUX CLUSTER 11
I I I I I I i 1 I I I
103
102
10’
k I 1 t I I I 1 I 1 11248 16 32 64 128 256
Processors
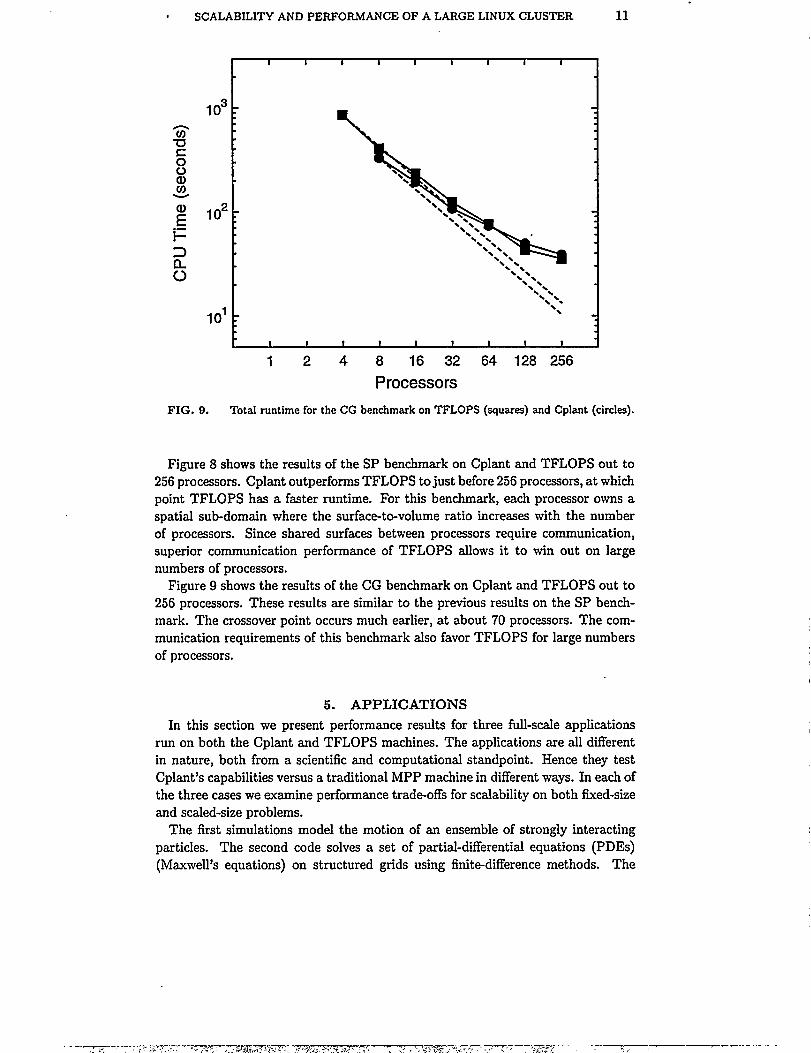
FIG. 9. Total runtime for the CG benchmark on TFLOPS (squares) and Cplant (circles).
Figure 8 shows the results of the SP benchmark on Cplant and TFLOPS out to256 processors. Cplant outperforms TFLOPS to just before 256 processors, at whichpoint TFLOPS has a faster runtime. For this benchmark, each processor owns aspatial sub-domain where the surface-to-volume ratio increases with the numberof processors. Since shared surfaces between processors require communication,superior communication performance of TFLOPS allows it to win out on largenumbers of processors.
Figure 9 shows the results of the CG benchmark on Cplant and TFLOPS out to256 processors. These results are similar to the previous results on the SP bench-mark. The crossover point occurs much earlier, at about 70 processors. The com-munication requirements of this benchmark also favor TFLOPS for large numbersof processors.
5. APPLICATIONS
In this section we present performance results for three fill-scale applicationsrun on both the Cplant and TFLOPS machhws. The applications are all differentin nature, both from a scientific and computational standpoint. Hence they test
Cplant’s capabilities versus a traditional MPP machhe in different ways. In each ofthe three cases we examine performance trade-offs for scalability on both fixed-sizeamd scaled-size problems.
The first simulations model the motion of an ensemble of strongly interactingparticles. The second code solves a set of partial-differential equations (PDEs)(Maxwell’s equations) on structured grids using finite-difference methods. The

12 “ BRIGHTWELL AND PLIMPTON
final application is for a PDE (Boltzmann radiation transport equation) solved viadirectional sweeps on an unstructured grid.
5.1. Particle Simulation
The &at application is a molecular dynamics (MD) model of a Lennard-Jones
(LJ) liquid. IrI an MD simulation, Newton’s equations of motion are integrated for
a collection of interacting particlw. In a LJ system, on a given timestep a particle
interacts in a pairwise fashion with every other particle that is nearby (within some
cutoff distance).The simulations we d~cuss here are for a 3-d box of particles, decomposed spa-
tially across processors so that each owns a small 3-d “brick” or subsection of theglobal simulation domain. Each processor computes the forces on its atoms and
advances their positions and velocities. This requires each processor to communi-
cate every timestep with neighboring processors to exchange particle information(coordinates, forces). Periodically, particles are also migrated to new processors asthey dfise through the simulation box.
In these simulations the fluid density and cutoff distance were set so that eachparticle interacts with approximately 55 neighbors every tinmtep. More detailsabout the benchmark itself and the algorithms used to efficiently model such a
system, both from a parallel and serial standpoint, are discussed in Plimpton[17].ThM is a model of a simple monotomic fluid, but the same parallel methodologyand communication routines are used in a variety of more soph~ticated codes wehave developed at Sandia for modeling polymeric, biological, and metallic systemsciteStevens,LAMMPS, Kelchner. These simulations are a good test for our purposehere in that they area good ‘stress-test” of interprocessor communication.
The first set of results in Figure 10 are for ilxed-size simulations of an IV = 32000particle system. This is a modest system size that one might typically wish to simu-
late for very long timescales, e.g. m~lons of timesteps. A single TFLOPS PentiumII processor runs this simulation in 0.659 sees/timestep. An Alpha processor onCplant is about 2 times faster at 0.344 sees/timestep. In the figure, on~processortimings on both machhes are shown as 100% efficient. Timings on multiple pro-cessors were scaled to the on~processor time for the respective machine. Thus aparallel efficiency of 60% on 16 Cplant processors means the simulation ran 9.6times faster than it did on one Cplant processor.
As expected, the results show that parallel efficiency falls off more quickly onCpkmt than on TFLOPS, due to Cplant’s faster processors and slower commu-nication. Still, in terms of absolute CPU time, Cplant remains competitive withTFLOPS out to 64 processors, where the CPU time/timestep is 0.0132 and 0.0128sees for Cplant and TFLOPS respectively.
In Figure 11, we show timing results for a scaled version of the same physicalmodel. On one processor we run the same 32000-particle simulation as in theprevious figure. On P processors we simulate a system that is P times larger. Thuson 300 Cpkmt processors (rightmost data point in figure), we are simulating 9.6million atoms. Perfect efficiency (1OOYO)now represents a simulation that runs in
the same CPU time/timestep as the one-processor timing (0.344 sees/timestep onCpkmt, 0.659 sees/timestep on TFLOPS).
. ..- ,, ., <, ~~$fl , ,.<.,., ,; ~. ,- ,<, , ._..,, . ,..XX. ,..,- / . .-. , . . ,- . . . . .. . . .(.:.?=aw:’m -,. :,,.. .,, ...,?. , .,, ,. . . .. —-—— —_-
, d ... .. .-?-y-i-T&A -* .::,.
10t
- 100
- 90
- 80
- 70
- 60
- 50
- 40
- 30
- 20
- 10
.
SCALABILITY AND PERFORMANCE OF A LARGE LINUX CLUSTER 13
I i I I I I I I I i I I--------------------- ----------
90 -
80 -
70 -
60 -
50 -
40 -
30 -
20 -
o] 1 I I I 1 1 1 I 1 I ‘o124 8 16 32 64 128 256 512
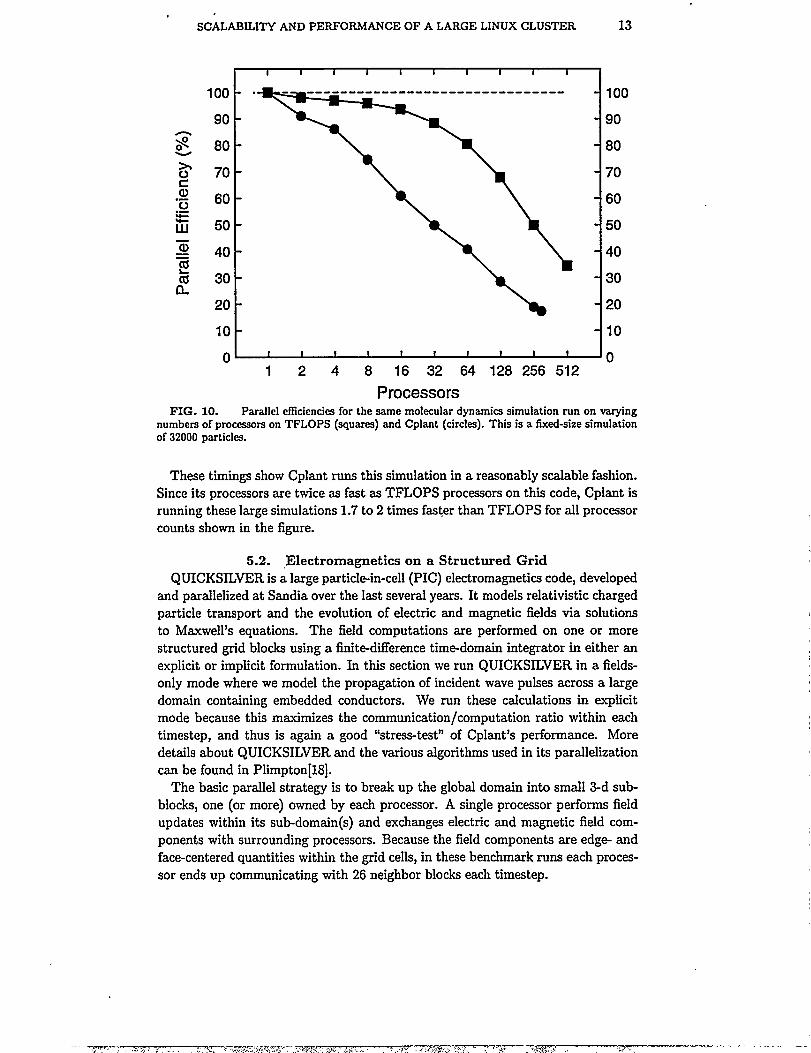
ProcessorsFIG. 10. Parallel efficiencies for the same molecular dynamics simulation run on varying
numbers of processcm on TFLOPS (squares) and Cplant (circles). This is a fixed-size simulationof 32000 particles.
These timings show Cplant runs this simulation in a reasonably scalable fashion.Since its processors are twice as fast as TFLOPS processors on th~ code, Cplant isrunning these large simulations 1.7 to 2 times faster than TFLOPS for all processorcounts shown in the figure.
5.2. ,Electromagnetics on a Structured GridQUICKSILVER is a large p=ticle-in-cell (PIC) electromagnetic-s code, developed
and parallelized at Sandia over the last several years. It models relativistic chargedparticle transport and the evolution of electric and magnetic fields via solutionsto Maxwell’s equations. The field computations are performed on one or morestructured grid blocks using a finitedifference time-domain integrator in either anexplicit or implicit formulation. In this section we run QUICKSILVER in a fields-only mode where we model the propagation of incident wave pulses across a largedomain containing embedded conductors. We run these calculations in explicitmode because this maximizes the communication/computation ratio within eachtimestep, and thus is again a good ‘stress-test” of Cpkmt’s performance. Moredetails about QUICKSILVER and the various algorithms used in its parallelizationcan be found in Plimpton[18].
The basic parallel strategy is to breakup the global domain into small 3-d sub-blocks, one (or more) owned by each processor. A single processor performs fieldupdates within its sub-domain(s) and exchanges electric and magnetic field com-ponents with surrounding processors. Because the field components are edge- andface-centered quantities within the grid cells, in these benchmark runs each proces-sor ends up communicating with 26 neighbor blocks each timestep.
14’ BRIGHTWELLAND PLIMPTON
I I I i I I I i I I
~ ‘: :“~> 80
70
60
50
40
30
20
10
0
(
,
/
!
. . .——frrr —,. .-.. >. !,..,,. ,., ,. .4. . :,-C,* Z.?’37.T- Z’kfw< ,, .,&, /.. f. ,.-. - ,... ?,.- ,.. ?*:W. .,?. % (. .. . . ...! ., . ..!%>,:.? ,.:. . —— .—. . .
100
90
80
70
60
50 .
40
30
20
10
0124 8 16 32 64 128 256 512
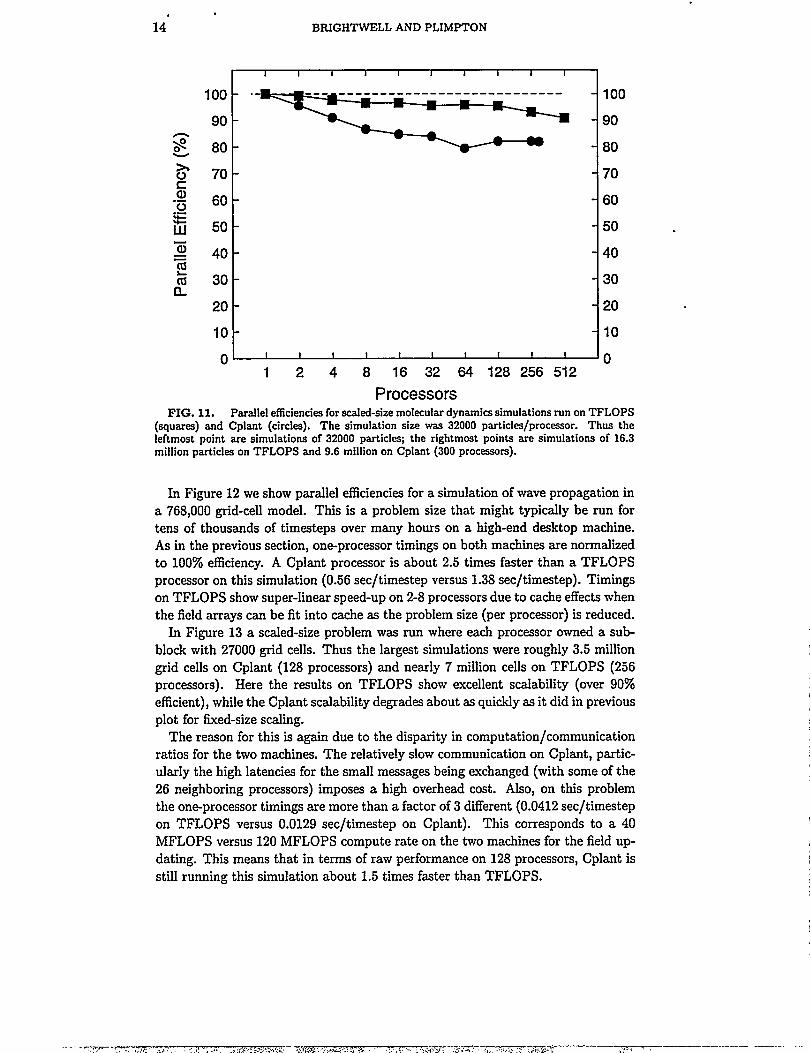
ProcessorsFIG. 11. Parallel efficiencies for scaled-size molecular dynamics simulations run on TFLOPS
(squares) and Cplant (circles). The simulation size was 32000 particles/processor. Thus theleftmost point are simulations of 32000 particl~ the rightmost points are simulations of 16.3million particles on TFLOPS and 9.6 million on Cplant (300 processors).
In Figure 12 we show parallel efficiencies for a simulation of wave propagation ina 768,000 grid-cell model. Thk is a problem size that might typically be run fortens of thousands of timesteps over many hours on a high-end desktop machiie.As in the previous section, one-processor timings on both machiies are normalizedto 100% efficiency. A Cplant processor is about 2.5 times faster than a TFLOPSprocessor on this simulation (0.56 sec/timestep versus 1.38 sec/timestep). Timingson TFLOPS show super-linear speed-up on 2-8 processors due to cache effects whenthe field arrays can be fit into cache as the problem size (per processor) is reduced.
In Figure 13 a scaled-size problem was run where each processor owned a sub-block with 27000 grid cells. Thus the largest simulations were roughly 3.5 milliongrid cells on Cplant (128 processors) and nearly 7 million cells on TFLOPS (256processors). Here the results on TFLOPS show excellent scalabfity (over 90%efficient), while the Cplant scalability degrades about as quickly as it did in previousplot for fixed-size scahg.
The reason for this is again due to the disparity in computation/communicationratios for the two machiies. The relatively slow communication on Cplant, partic-ularly the high Iatencies for the small messages being exchanged (with some of the26 neighboring processors) imposes a high overhead cost. Also, on this problemthe one-processor timings are more than a factor of 3 different (0.0412 sec/timestepon TFLOPS versus 0.0129 sec/timestep on Cpkmt). This corresponds to a 40MFLOPS versus 120 MFLOPS compute rate on the two machines for the field up-dating. This means that in terms of raw performance on 128 processors, Cplant isstill running this simulation about 1.5 times faster than TFLOPS.

SCALABILITY AND PERFORMANCE OF A LARGE LIIWX CLUSTER 15
L
60 -
\
L
50 -
40 -
30 -
20 -
10 -
0 I I I I 1 I I t
100
90
80
70
I I
--------------------- 100
- 60
- 50
- 40
- 30
- 20
- 10
- 01248163264 128 256 -
ProcessorsFIG. 12. Parallel efficiencies for the same electromagnetic simulation run on TFLOPS
(squares) and Cplant (circles). This calculation was a production-scale model of a wave pulsepropagating through a structured grid of 768,000 cells for 2000 timesteps.
I t I 1 1 I I I 1 I 1100
90
80
70
60
50
401~-1--------------------___-100
90
80
70
60
50
40
30 - - 30
20 - - 20
10 - - 10
0 I 1 I I 1 I I I I o1 2 4 8 16 32 64 128 256
ProcessorsFIG. 13. Parallel efficiencies for scaled-size electromagnetic simulations run on TFLOPS
(squares) and Cplant (circles). The model ran for 10000 timesteps on a grid size of 27000 gridcells/processor. The 128-processor data points are for simulations on a grid of 3.5 million cells.
16 BRIGH’IWELL AND PLIMPTON
5.3. Radiation Transport on an Unstructured Grid
The ilnal application we discuss is a radiation transport simulator which computesthe solution to Bolztmann’s equation for radiative flux on an unstructured grid. The
code computes the energy distribution of the flux in six dimensions (3 spatial, 2angular, and 1 energy) via the method of discrete ordinates which partitions theangular dependence of the solution over a fhite number of (ordinate) directions[9, 6].
The solution in anyone direction can be computed by a sweep across the grid whereeach finite element (grid cell) solves for its contribution only when neighboringcells that are “upwind” from it (relative to the sweeping direction) have alreadycompleted their solution. A finished cell then passes flux along to its ‘downwind”
neighbors.
Our parallel implementation of this algorithm employs a spatial decomposition ofthe 3-d unstructured grid across processors (via the CHACO partitioning tool[ll]).As a procesor computes the solution in one of its grid cells it sends flux informs=
tion to any downwind cells that may be owned by neighboring processors. Thismeans that a processor owning a sub-region of the global grid that is far downwind
must wait for all upwind processors to complete their computations. This naturalload-imbalance is (partially) alleviated by working on many dozens or hundreds ofdirectional solutions simultaneously. As a sweep is computed, the net effect is thata very large number of small messages are sent asynchronously in a point-t-pointfashion between all diRerent pairs of neighboring processors. This code is thus anexcellent test of a cluster’s ability to do small-message unstructured communication.
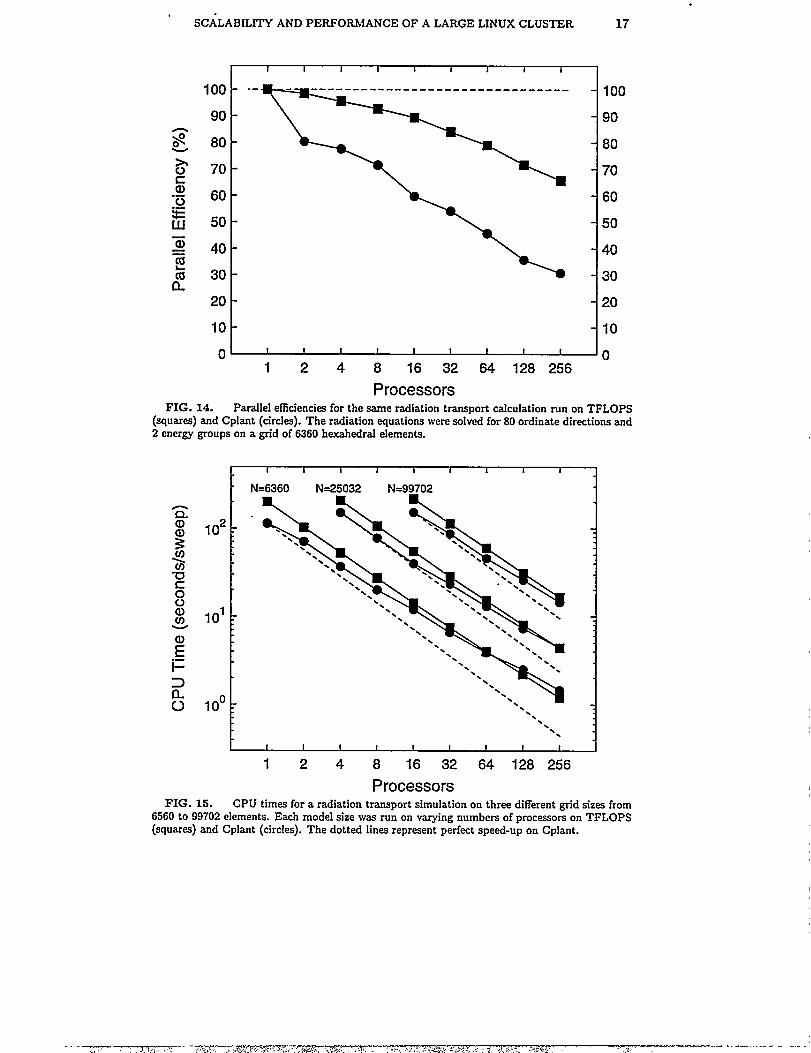
In Figure 14 we show the results for a fixed-size simulation with 6360 hexahedralfinite elements, 80 ordinate duections, and 2 energy groups. Despite the small gridsize, due to the 6-dlmensionaMy of the data structures, this is actually a fairly largeone-processor problem. As before, we normal:ne the one-processor timings on bothplatforms as 100% efficient to compute the efficiency results for multiple processors. “In absolute CPU time, a Cpkmt procesor is a little less than two times faster than aTFLOPS processor on this calculation (113.7 seconds for a sweep of all 80 ordinatesversus 201.7 seconds). Both machines show reasonable scalability out to largenumbers of processors, especially considering the fact there are only 25 grid/cellsper processor in the 256-processor runs. Note that Cplant takes an immediateefficiency hit on two processors as inter-processor communication is required, butperformance degrades more slowly thereafter.
It is difficult to construct scaled-size problems of ideal size on unstructuredmeshes. Instead, in F@re 15, we show CPU timings for both machines running 3different sized problems, where IV is the number of iinite element grid cells, rangingfrom 6360 to nearly 100,000. Because these data are actual timings, the dtierencein processor speeds between the two machines is now evident. In contrast to theprevious 5 figures, perfect scalability would now be a sloped lime (offset for eachmachine), going through the one-processor data point for that machhe. Dottedreference lines are shown for Cplant on the figure.
These data again show that Cplant is not scahg as well as TFLOPS. Howeverthe crossover point in raw performance is at about 64128 processors on the smaller
problems and looks like it will be pushed even further out on larger problems. Thiswill enable some truly large radiation transport calculations to be done effectivelyon the Cplant platform.
..
SCALABILITY AND PERFORMANCE OF A LARGE LINUX CLUSTER 17
100 - “-
90 -
80 -
70 -
60 -
50 -
40 -
30 -
----- ----- ----- ----- ----- ----- _I i i I I I I I I I T
- 100
- 90
- 80
- 70
- 60
- 50
- 40
- 30
- 20
- 10
01 I 1 I I I I 1 1 t o1248 16 32 64 128 256 -
ProcessorsFIG. 14. Parallel efficiencies for the same radiation transpoti calculation run on TFLOPS
(s@arss) and Cplant (circles). The radiation equations were solved for 80 ordinate directions and2 energy groups on a ~“d of 6360 hexahedrai elements.
1’I I I I I I 1 I I
4
\
E.-t-3nL)
I
. ..-.—,, , J ,1.,.. .->: -—7zr---w=$”=$”, .. ,,.. ,:. ..,:+ ,..-.., ,...<’,, ,. ...,.; .. >. . $.2&~:.~f._. . $ ,$< ~ .<.- .7, .~., . . . . . .>- Gw.1.-
-.—. .. —-.. .--’%
I I I I t I I I t t
1248 16 32 64 128 256
ProcessorsFIG. 15. CPU times for a radiation transport simulation on three different grid sizes from
6560 to 99702 elements. Each model size was run on varying numbers of processors on TFLOPS(squares) and Cplant (circles). The dotted lines represent perfect speed-upon Cplant.
.
18’
Fkom a system software
BR.IGHTWELL AND PLIMPTON
6. CONCLUSIONS
point of view, our experiences in porting the TFLOPS
environment to a large Lhmx cluster have allowed us to better understand the Linuxoperating system and its interaction with a high-performance network interface. We
have identified some Imitations in hardware, software, and topolog that preventus from achieving the communication performance that will allow Cplant to scale
out to thousands of nodes. The design of Portals 3.0 will allow us to better utilizethe programmable Myrinet cards. We hope to make modifications to the memory
management structures in Lmux to allow for physically contiguous regions of rnem-
Oryj whkh should simplify and increase the performance of our implementation of
Portals 3.0.lhom an application standpoint, we have shown that despite a significant dtier-
ence in the ratio of compute-to-communication performance, a large Lhmx cluster
can often meet and sometimes exceed the performance of a large MPP up to a fewhundred processors. Our experience with the applications d~cussed here is typi-
cal of other Cplant users at Sandia who have tested a variety of applications onthe machine over the last six months. These applications include shock hydrody-namics codes, fluid dynamics and reacting flow simulators, and quantum electronicstructure models, to name a few.
In many cases on our cluster, the key feature that appears to be limiting appli-cation scalability is messag~passing latency. This can sometimes be overcome by
increasing the problem sizes that are simulated, but this is often not a good solu-tion from the analyst’s point of view. Our hope is that the redesign of Portals 3.0will provide a significant decrease in latency times and thus alleviate many of theseproblems. However, we note that our next-generation cluster, which we describe inthe next section, has faster processors. Thus we are again changing the macline’scompute-to-communication ratio in a direction that will degrade overall scalability.It remains to be seen whether we can achieve scalable performance at the near-1000processor level that this new machhe will offer.
7. FUTURE WORK
In October of 1999, Compaq Computer Corporation installed a 592-node clusterat Sandia. Each compute node in this new cluster is composed of a 500 MHz Alpha21264 processor, 2 MB of level-3 cache, 256 MB of main memory, and a 64bit33 MHz Myrinet LANai 7 network interface card. This machhe acldeved 247.6GFLOPS on the LINPACK[8] benchmark, which would place it at number 40 onthe November 1999 list of the Top 500[16] fastest computers in the world had theresults been submitted. Previous results that were submitted placed it at number44 in the list.
Compared to the 400-node Alpha 21164 cluster, this new machine has increasedcompute performance, increased peak memory bandwidth, increased network linkbandwidth, a different topology, and more processors. Our tilti~ experience withthese machines has shown a significant increase in computation performance over
the Cplant cluster discussed here. We expect to gather results for the benchmarksand applications presented in this paper on this platform in early 2000 when themachhe is deployed into the Sandia production computing environment. We will
—~..m; ‘ ... ’.$-. t .. .s..”,. < ........ ..
.— -—
SCALABILITY AND PERFORMANCE OF A LARGE LINUX CLUSTER 19
add these results to the final version of this paper as it goes through the review
process.
REFERENCES
1. D. H. Bailey et aL The NAS Parallel Benchmarks. haternatiormlJournal of SupercomputerAppficotions, 5(3):63-73, 1991.
2. N. Boden, D. Cohen, R. E. Felderman, A. E. Kulawik, C. L. Seitz, J. N. Seizov=ic,and W. Su.Myrinet-a gigabit-per-second local-area network. IEEE Micro, 15(1):29-36, February 1995.
3. R. B. Brightwell, L. A. Fisk, D. S. Greenberg, T. B. Hudson, M. J. Levenhagen, A. B. Maccabe,and R. E. Riesen. Massively Paraflel Computing Using Commodity Components. PamklComputing, To appear.
4. R. B. Brightwell, T. B. Hudson, A. B. Maccabe, and R. E. Riesen. The Portals 3.0 MessagePassing Interface. Technical Report SAND99-2959, Sandia National Laboratories, December1999.
5. R. B. Brightwell and P. L. Shuler. Design and implementation of MPI on Puma portsfs. InPmcesdings of the Second MPI Developer’s Conference, pages 18-25, July 1996.
6. S. P. Burns. Spatiaf domain-based parallelism in large scafe, participating-media, radiativetransport applications. Technical Report SAND96-2485, Sandia National Laboratories, Albu-querque, NM, 1996.
7. Compaq, Microsoft, and Intel. Virtuaf Interface Architecture Specification Version 1.0. Tech-nical report, Compaq, Microsoft, and Intel, December 1997.
8. J. J. Dongarra. Performance of Various Computecs Using Standard Linear Equations Software.Technical Report CS-89-85, Department of Computer Science, University of Tennessee, 1994.
9. W. A. Fiveland. Three-dimensional radiative heat-transfer solutions by the d~rete ordinatesmethod. J. Themnophysics and Heot 2Yonsfer, 2:309-316, 1988.
10. D. S. Greenberg, R. B. Brightwell, L. A. Fisk, A. B. Maccabe, and R. E. Riesen. A SystemSoftware Architecture for High-End Computing. In Proceedings O! SC’97, 1997.
11. B. Hendrickson and R. Lekand. The Chaco user’s guid~ Version 2.0. Technical ReportSAND94-2692, Sandia National Labs, Albuquerque, NM, June 1995.
12. M. Lauria, S. Pakin, and A. Chien. Efficient Layering for High Speed Communication: FastMessages 2.x. In Proceedings oj the IEEE International Symposium on High PerformanceDistribukd Computing, 1998.
13. A. B. Maccabe, K. S. McCurley, R. E. Riesen, and S. R. Wheat. SUNMOS for the IntelParagon: A brief user’s guide. In Proceedings of the Intel Supemomputer Users’ Group. 1994Annual North Americn Users’ Conference., pages 245-251, June 1994.
14. Message Passing Interface Forum. MPE A Messag&Passing Interface standard. The Intemo-tional Joumol of Super-computer Applications and High Performance Computing, 8, 1994.
15. Myricom, Inc. The GM Message Passing System. Technical report, Myricom, Inc., 1997.
16. Netlib. Top 500 Supemomputers, 1998. http: //www.top500.0rg.
17. S. J. Plimpton. Fsst paraflel algorithms for short-range molecular dynamics. J. Comp. Phys.,117:1-19, 1995.
18. S. J. Plimpton, D. B. Seidel, M. F. Pasik, and R. S. Coats. Novel load-balancing techniques foran electromagnetic particle-in-cell code. Technical Report SAND2000-0035, Sandia NationalLaboratories, Albuquerque, NM, 2000.
19. L. Prylli. BIP Messages User Manual for BIP 0.94. Technical report, LHPC, June 1998.
20. Sandia National Laboratories. ASCI Red, 1996. http://www.sandia.gov/ASCI/TFLOP/HomeRage.htmL
21. Sandia National Laboratories. Computational Plant, 1997. http://www.cs.sandia.gov/cplant.
22. Sandia National Laboratories. Puma Portals, 1997. http//wmv.cs.sandia.gov/puma/portals.
23. P. L. Shuler, C. Jong, R. E. Riesen, D. van Dresser, A. B. Maccabe, L. A. Fisk, and T. M.Stallcup. The Puma operating system for massively paraflel computers. In Proceedings of the1995 Intel Super-computer User’s Gruup Confenmce. Intel Supercomputer User’s Group, 1995.
,-
20” ‘ BRIGHTWELL AND PLIMPTON
24. Task Group of Technical Committee Tn. Information Technology - ScheduIed TYansfer Pro-tocol - Working Draft 2.0. Technical report, Accredhed Standards Committee NCITS, July1998.
25. M. S. Warren, M. P. Goda, D. J. Becker, J. K. Salmon, and T. Sterling. Parallel Supercomput-ing with Commodity Components. In Pmcedings of the International Con~erenm on ParaUeland Diskibutrzt Processing Techniques and Applications, 1997.
26. F. C. Wong, R. P. Martin, R. H. Arpaci-Dusseau, and D. E. CuHer. Architectural Requirementsand Scalability of the NAS Parallel Benchmarks. In Ptuceedings of SC’99, November 1999.