scalable resilient overlay networks
TRANSCRIPT
Scalable Resilient Overlay Networks
Sameer Hashmat QAZI
A dissertation submitted in fulfilment of the requirements for the degree of
Doctor of Philosophy
The School of Electrical Engineering and Telecommunications The University of New South Wales
October 2009

2
3
ABSTRACT
The Internet has scaled massively over the past 15 years to extend to billions of users. These
users increasingly require extensive applications and capabilities from the Internet, such as Quality
of Service (QoS) optimized paths between end hosts. When default Internet paths may not meet
their requirements adequately, there is a need to facilitate the discovery of such QoS optimized
paths. Fortunately, even though the route offered by the Internet may not work (to the required level
of performance), often there exist alternate routes that do work. When the direct Internet path
between two Internet hosts for instance is sub-optimal (according to specific user defined criterion),
there is a possibility that the direct paths of both to a third host may not be suffering from the same
problem owing to path disjointness. Overlay Networks facilitate the discovery of such composite
alternate paths through third party hosts.
To discover such alternate paths, overlay hosts regularly monitor both Internet path quality and
choose better alternate paths via other hosts. Such measurements are costly and pose scalability
problems for large overlay networks. This thesis asserts and shows that these overheads could be
lowered substantially if the network layer path information between overlay hosts could be
obtained, which facilitates selection of disjoint paths. This thesis further demonstrates that obtaining
such network layer path information is very challenging. As opposed to the path monitoring which
only requires cooperation of overlay hosts, disjoint path selection depends on the accuracy of
information about the underlay, which is out of the domain of control of the overlay and so may
contain inaccuracies. This thesis investigates how such information could be gleaned at different
granularities for optimal tradeoffs between spatial and/or temporal methods for selection of
alternate paths.
The main contributions of this thesis are: (i) investigation of scalable techniques to facilitate
alternate path computation using network layer path information; (ii) a review of the realistic
performance gains achievable using such alternate paths; and (iii) investigation of techniques for
revealing the presence of incorrect network layer path information, proposal of new techniques for
its removal.
Keywords:
Quality of Service, Overlay Networks, Peer-to-Peer Systems, Service-oriented Networks

4

5
ACKNOWLEDGEMENTS First, I would like to thank the All-Mighty. After that I am very profoundly grateful to my advisor
Dr. Timothy Moors for his trust in me throughout the last four years, his unconditional support,
patience and guidance without which I could not have accomplished this long research journey. I
would also like to thank my Co-Adviser Dr. Aruna Seneviratne for guiding me in the initial stages
of my PhD.
I would also like to thank National University of Science and Technology (NUST), Pakistan for
extending their generous financial support for 3 years of my PhD candidature. I thank my
supervisor and the Head of Electrical Engineering School (UNSW), Dr. Timothy Hesketh to
provide me with PhD completion scholarship for partial financial support during the fourth year of
my candidature. My thanks are also to the Graduate Research School (UNSW) for awarding post
graduate students with travel grants to help fund my conference travels.
I would also like thank all the fellow Networks Group members (present and former): Arun,
Arvind, Bo, Jack, John, Nick, Nixian, Mohammad, Nick, Shuo, Zawar; and other friends, Mark,
Phu and Adeel for their companionship and help throughout the PhD journey. I would especially
like to thank Dr. Eric. D. Kolaczyk (Boston University) for his helpful comments on the work on
the removal of Routing Matrix Inconsistencies to improve statistical path estimation. I would also
like to acknowledge the help extended to me by Theirry Rakotoarivelo from NICTA, with whom I
shared fruitful discussions on the availability and use of Internet Datasets. I would thank also Ido
Nevat for helpful discussions on robust regression techniques. I profoundly thank Jack Tsai and
Arun Vishwanath for proofreading this dissertation. I would also like to thank Phil Allen who
looked after the welfare of our research tools namely our PCs and software applications, whenever
we had any issues.
Finally, I would like to express my profound gratitude to my parents for their hard work and
sacrifices; my sister, and my late grandmother. They all encouraged and inspired me in many ways.
I would have never made it through this journey without their love and their continuous prayers.

6

7
LIST OF ABBREVIATIONS
AMP Active Measurement Project
AS Autonomous System
ASN Autonomous System Number
BGP Border Gateway Protocol
BLP Best Linear Predictor
CAIDA The Cooperative Association for Internet Data Analysis
CDN Content Distribution Network
CO Convex Optimization
CORR Correlation
COV Covariance
DHT Distributed Hash Table
EDR Earliest Divergence Rule
EID Endpoint Identifier
FEC Forward Error Correction
GPS Global Positioning System
HLP Hybrid Link-state Path-vector
IP Internet Protocol
ISP Internet Service Provider
KBR Key Based Routing
MIRO Multipath Interdomain Routing

8
MST Minimum Spanning Tree
NCC Network Coordination Center
NLANR The National Laboratory for Applied Network Research
NIRA New Internet Routing Architecture
NP Non-polynomial time solvable
QoS Quality of Service
RD Rank Deficiency
RIPE Réseaux IP Européens
RMI Routing Matrix Inconsistencies
RON Resilient Overlay Networks
RPE Relative Prediction Error
RTT Round Trip Time
SVD Singular Value Decomposition
TCP Transmission Control Protocol
ToR Type Of Relationship
TTM Test Traffic Measurement
UDP User Datagram Protocol
VAR Variance
VoIP Voice over IP

9
ORIGINALITY STATEMENT
‘I hereby declare that this submission is my own work and to the best of my knowledge it
contains no materials previously published or written by another person, or substantial proportions
of material which have been accepted for the award of any other degree or diploma at UNSW or
any other educational institution, except where due acknowledgement is made in the thesis. Any
contribution made to the research by others, with whom I have worked at UNSW or elsewhere, is
explicitly acknowledged in the thesis. I also declare that the intellectual content of this thesis is the
product of my own work, except to the extent that assistance from others in the project's design and
conception or in style, presentation and linguistic expression is acknowledged.’
Signed …………SAMEER QAZI…………..………….
Date …………16 October 2009.…………………….

10
11
OUTLINE
Part I –Introduction and Background
1 Introduction 2 Literature Review 3 Description of Internet Datasets used in this dissertation
Part II –Scalable Heuristics for Selecting Disjoint Paths in Overlay Network
4 An Architecture for Selecting Disjoint Paths- Globally Scalable RON Service 5 Disjoint Path Selection in Overlay Networks using ToR Graphs
Part III-Path Monitoring in Overlay Networks 6 Issues of Statistical Path Monitoring in Overlay Networks 7 Conclusions and Proposals for Future Directions of Research

12
13
TABLE OF CONTENTS Abstract..............................................................................................................................................................3 Acknowledgements............................................................................................................................................5 List of Abbreviations ........................................................................................................................................7 Originality Statement .......................................................................................................................................9 Outline..............................................................................................................................................................11 Table Of Contents ...........................................................................................................................................13 List of Figures..................................................................................................................................................15 List of Tables ...................................................................................................................................................17 List of Publications..........................................................................................................................................19 Part I ................................................................................................................................................................21 Introduction and Background .......................................................................................................................21 1 Introduction ...........................................................................................................................................23
1.1 Why Overlay Networks? .............................................................................................................23 1.2 Dissertation Overview..................................................................................................................27
2 Literature Review..................................................................................................................................29 2.1 Introduction..................................................................................................................................29 2.2 Exploiting Path Diversity in the Internet through Overlay Networks ....................................30
2.2.1 Overlay Topology ...............................................................................................................36 2.2.2 Monitoring Overlay Links .................................................................................................39 2.2.3 Selecting Overlay Paths .....................................................................................................43 2.2.4 Detouring Packets...............................................................................................................47 2.2.5 (In-)Feasibility of Selfish-Routing on Overlay-Networks ...............................................49 2.2.6 Open Research-issues with Overlay-Networks ................................................................50
2.3 Proposals To Modify Underlay Routing Mechanisms ..............................................................51 2.3.1 Re-Engineering BGP-4.......................................................................................................51 2.3.2 Enhancing network level packet forwarding decisions to exploit path diversity..........54 2.3.3 Fast Re-Route (FRR) construction to reduce failover times...........................................56 2.3.4 Open Research-issues with proposals to modify underlay routing mechanisms ..........58
2.4 Multi-Homing Solutions ..............................................................................................................59 2.4.1 Open Research-issues with Multi-homing........................................................................61
2.5 Chapter Summary .......................................................................................................................62 3 Description of Internet Datasets Used in This Dissertation ...............................................................63
3.1 Datasets considered and methodology for obtaining the datasets ...........................................63 3.2 Network Layer Characteristics of Overlay Paths Vs Direct Paths..........................................66 3.3 When is the Direct Internet path degraded? .............................................................................70
Part II...............................................................................................................................................................73 Scalable Heuristics for Selecting Disjoint Paths In Overlay Networks ......................................................73 4 An Architecture for Selecting Disjoint Paths- Globally Scalable RON Service...............................75
4.1 Introduction..................................................................................................................................75 4.2 Relationship between Overlay Network size and path diversity it offers................................75 4.3 Are some overlay paths preferred more often than others?.....................................................77 4.4 DG-RON Clients and Services ....................................................................................................80 4.5 Overlay Infrastructure ................................................................................................................80 4.6 Online Path Selection-Dynamic Path Monitoring.....................................................................82
14
4.7 Offline Path Selection- Landmark Based Heuristics ................................................................ 83 4.8 Performance Evaluation ............................................................................................................. 85
4.8.1 Impact of Detour Set Size .................................................................................................. 86 4.8.2 Evaluation of Offline Path Heuristics............................................................................... 88 4.8.3 Comparison with SPAD..................................................................................................... 89
4.9 Discussion ..................................................................................................................................... 91 4.10 Conclusion.................................................................................................................................... 91
5 Disjoint Path Selection In Overlay Networks using ToR Graphs..................................................... 93 5.1 Introduction ................................................................................................................................. 93 5.2 ToR (Type-of-Relationship) Graphs .......................................................................................... 93 5.3 Maximally-Disjoint Path Computation Using a Greedy approach ......................................... 95
5.3.1 Finding Valley-Free Edge-Disjoint Paths ........................................................................ 95 5.3.2 Finding Maximally-Disjoint Valley-Free Paths............................................................... 98 5.3.3 Comparison with Earliest Divergence Rule (EDR)....................................................... 100
5.4 Performance Evaluation ........................................................................................................... 101 5.4.1 Methodology used to construct ToR-graph ................................................................... 101 5.4.2 Network layer path characteristics inferred from ToR-graph .................................... 102 5.4.3 Performance-Evaluation of the Greedy-Approach ....................................................... 104
5.5 Chapter Summary ..................................................................................................................... 110 Part III........................................................................................................................................................... 113 PATH MONITORING IN OVERLAY NETWORKS.............................................................................. 113 6 Issues of Statistical Path Monitoring In Overlay Networks ............................................................ 115
6.1 Introduction ............................................................................................................................... 115 6.2 Algebraic Notation..................................................................................................................... 117 6.3 Routing matrices and Eigen Spectra of AMP and RIPE data sets........................................ 120
6.3.1 Extent of rank-deficiency ................................................................................................ 120 6.4 Selecting a Subset of Paths for Monitoring and Predicting the Unmonitored Paths Using Best Linear Predictor .............................................................................................................................. 123 6.5 Routing Matrix Inconsistencies ................................................................................................ 129
6.5.1 How RMI occurs? ............................................................................................................ 129 6.5.2 Can RMI be eliminated? ................................................................................................. 138 6.5.3 Quantification of RMI ..................................................................................................... 140
6.6 Statistical Techniques to Mitigate the Effects of RMI............................................................ 144 6.7 Improvement in Path Prediction and Anomaly Detection for AMP and RIPE networks after application of Robust Statistical Techniques......................................................................................... 146 6.8 Discussion ................................................................................................................................... 150 6.9 Conclusion.................................................................................................................................. 151
7 Conclusions And Proposals For Future Directions Of Research.................................................... 153 7.1 Reviewing the Goal.................................................................................................................... 153
7.1.1 Architecture...................................................................................................................... 153 7.1.2 Path Selection ................................................................................................................... 153 7.1.3 Path Monitoring ............................................................................................................... 154
7.2 Future Research Directions ...................................................................................................... 154 7.2.1 More accurate overlay topology ‘modeling’ .................................................................. 154 7.2.2 Accurate depiction of Internet failure models ............................................................... 154 7.2.3 Investigation of synergy between competing overlays .................................................. 155
APPENDIX ................................................................................................................................................... 157 References: .................................................................................................................................................... 159
15
LIST OF FIGURES Figure 1.1 Resilient Overlay Networks. Establishing Alternate paths via an overlay host when the path
between two Internet hosts fail. .............................................................................................................24 Figure 1.2. Logical Overlay topology (top) and Network Layer Overlay topology inferred from
traceroutes. ..............................................................................................................................................25 Figure 2.1 Direct path between UNSW and example.com and a one-hop overlay path via CMU...........31 Figure 2.2 (a) (top) Possible one-hop overlay path between end-hosts when the direct Internet path
suffers from outage/service degradations. (b) Overlay tunnel establishment....................................33 Figure 2.3 (a) (top) Full-Mesh Overlay topology and corresponding network layer topology. (b)
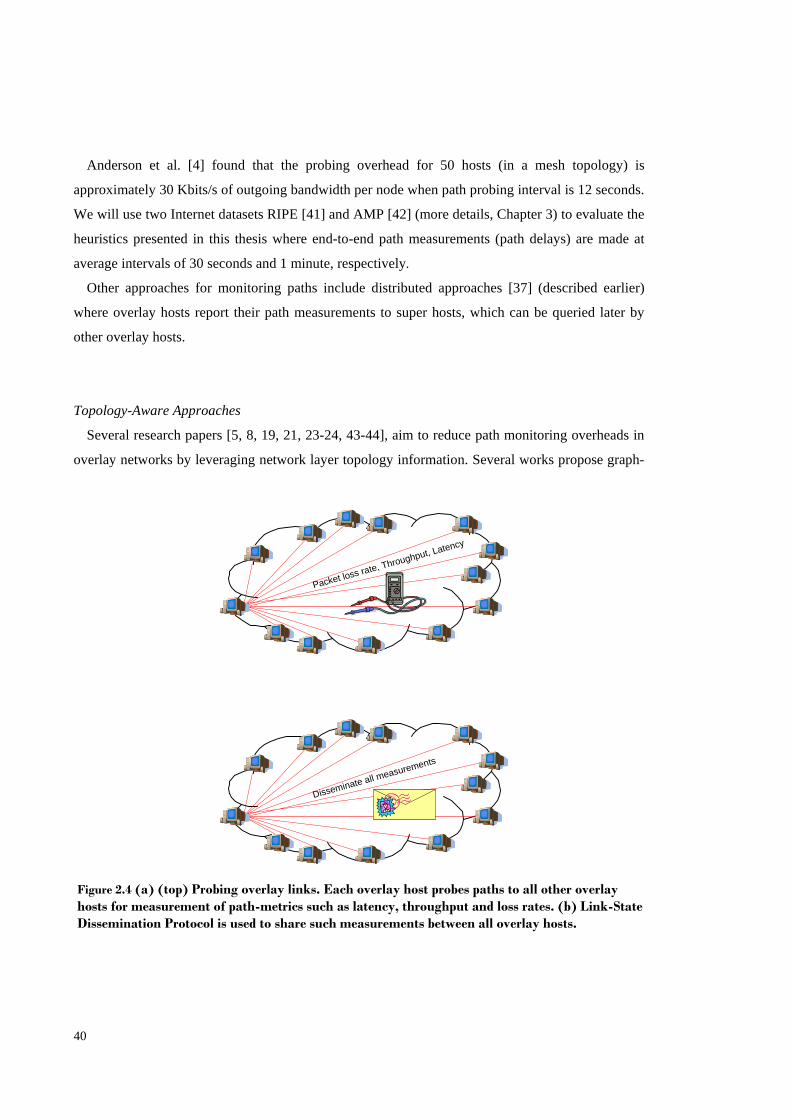
Constructing Minimum-Weight spanning tree to prune overlay topology by removing edges. ......37 Figure 2.4 (a) (top) Probing overlay links. Each overlay host probes paths to all other overlay hosts for
measurement of path-metrics such as latency, throughput and loss rates. (b) Link-State Dissemination Protocol is used to share such measurements between all overlay hosts...................40
Figure 2.5 Algebraic method of path monitoring (assuming path symmetry)...........................................42 Figure 2.6 Earliest-Divergence Heuristic to select disjoint alternate paths ...............................................44 Figure 2.7 Using Key-Based Routing (KBR) to find paths between two end-hosts [36]. ..........................46 Figure 2.8 ‘Drafting’ behind Akamai servers. One-hop indirection through an overlay node. The
overlay node is selected based on preference of Akamai-to serve content from one of its severs. ...48 Figure 2.9 Contention for same set of underlay links. Three overlay networks decide to use same set of
underlay links to improve QoS on end-to-end paths increasing network load (congestion) on links and also towards possible oscillations in quest for better paths..........................................................50
Figure 2.10 (a) (top) A single link-failure invalidates several valid routes (shown by bold arrows). (b) Appending path-withdrawal messages with ‘cause-of-failure’ tags help eliminate all invalid routes quickly and converge to valid route quickly .........................................................................................52
Figure 2.11 MIRO routing example[76]........................................................................................................54 Figure 2.12 Path deflection decision made at router level can exploit the path diversity in the underlay
network ....................................................................................................................................................55 Figure 2.13. Inter-domain MPLS path construction....................................................................................57 Figure 2.14 Single-homing Vs Multi-homing................................................................................................60 Figure 3.1 Location of AMP monitors in North America [100]. .................................................................64 Figure 3.2 Location of RIPE monitors in Europe and the rest of the world[101]. ....................................65 Figure 3.3 Network layer path length at IP level and AS level. (AMP-146-30/Jun/2006(top) and RIPE-
40-05/Sep/2007)........................................................................................................................................66 Figure 3.4 Percentage of one-hop overlay paths which diverge from the direct path at or before nth AS-hop
(AMP-146-30/Jun/2006)..........................................................................................................................68 Figure 3.5 Percentage of one-hop overlay paths which diverge from the direct path at or before nth IP-hop
(AMP-146-30/Jun/2006)..........................................................................................................................68 Figure 3.6 CDF of the difference between the mean path delay on direct Internet path and the mean
delay on the best one-hop overlay path. ................................................................................................69
16
Figure 3.7 Probability plots for paths to show incidence of path outages and performance failures. (RIPE (top) and AMP). .......................................................................................................................... 71
Figure 4.1 Relationship between size of an overlay network and AS degree distributions. X-axis depicts ASes sorted according to their degree-(descending order) normalized by total number of ASes. .. 77
Figure 4.2 Overlay hosts sorted in descending order ‘z’ (x-axis) according to percentage of failures masked, and failures masked as Cumulative function ‘F[z]’ (y-axis) ................................................ 79
Figure 4.3 Finding Topologically diverse detours for underlay destinations. ........................................... 81 Figure 4.4 Offline Detour Selection based on Maximum Divergence Principle. ....................................... 84 Figure 4.5 Delay Gain Comparison between DGRON and RON with variation in detour set size......... 87 Figure 4.6 Delay Gain Comparison between DGRON and SPAD (|T|=12). .............................................. 90 Figure 5.1 Network layer paths between source-destination at AS level topology.................................... 94 Figure 5.2 Example of valid and invalid valley-free paths in ToR-graphs [61, 118]................................. 96 Figure 5.3 (Top) Example of valid valley-free path in the original ToR-graph (G). Dotted lines show
concatenation of a set of C-P (forward) and P-C (backward) edges forming a valley free s-t path. (Bottom) Relaxation using the 2 layer model consisting only of forward edges................................ 97
Figure 5.4 Optimal solution to the Edge-Disjoint Path problem in the Two-Layer ToR-graph.............. 98 Figure 5.5 Path inflation between (a) AMP and (b) RIPE hosts (AS-hops)............................................. 103 Figure 5.6 Number of disjoint paths between (a) AMP (top) and (b) RIPE hosts using ToR-graph. ... 104 Figure 5.7 Number of candidate paths selected by greedy-approach for path outages and performance
failures in the AMP-datasets: (a) AMP-146-30/Jun/06 (top) and (b) AMP-133-31/Aug/06. .......... 107 Figure 5.8 Delay gain of best path selected for path outages and performance failures in the AMP-
datasets: (a)AMP-146-30/Jun/06 (top) and (b) AMP-133-31/Aug/06. .............................................. 108 Figure 5.9 Correlation of path-delay characteristics between direct-path and best-alternate-path
selected using Greedy Path Selection (Path Outages for AMP-146-30/Jun/2006 and AMP-133-31/Aug/2006).......................................................................................................................................... 110
Figure 6.1 (a) (left)How overlay resilience depends on topology of the underlay network. (b) Inferring maximum information about all virtual overlay links....................................................................... 116
Figure 6.2 Additive Network Metrics. ........................................................................................................ 118 Figure 6.3 Algebraic method of path monitoring ...................................................................................... 119 Figure 6.4 Eigen Spectra of AMP and RIPE Networks............................................................................. 122 Figure 6.5 AS degree for RIPE and AMP networks.................................................................................. 123 Figure 6.6 Problems in estimating of second order link metrics from traceroutes; link correlation
matrices for AMP-30-30/Jun/2006. (a)(top) intra AS links; (b) interAS links ................................ 126 Figure 6.7. L1 error for RIPE and AMP networks as a function of monitored paths............................ 128 Figure 6.8 Load balancing inside an AS. .................................................................................................... 129 Figure 6.9 Incorrect path inference: some links are missed while other false links are added.............. 130 Figure 6.10 Frequency of path variation in AMP networks over 24 hr period....................................... 131 Figure 6.11 Adjusting path inside AS11537 causes significant delay reduction on path between amp-
upenn and amp-hawaii ......................................................................................................................... 132 Figure 6.12 Load balancing inside AS11096 causes anomalous delay measurements at 6th and last hop
on path between amp-fiu and amp-emory.......................................................................................... 132 Figure 6.13 Dynamic Load balancing inside AS11537 for paths to amp-hawaii seems to affect some
paths at different times but not others................................................................................................ 134 Figure 6.14 Comparison of performance of CO estimator for AMP networks....................................... 137 Figure 6.15 Removal of Routing Matrix Inconsistencies (RMI) using the DWI and DWR Heuristic for
removal of false links ............................................................................................................................ 139 Figure 6.16 Comparison of performance of CO estimator before and after removal of RMI for AMP
networks. ............................................................................................................................................... 140 Figure 6.17 Computed value of c as the number of sampled paths increase for AMP50 and RIPE-40 143 Figure 6.18 Comparison of the L1-error metric of BL and Robust predictor. ....................................... 147 Figure 6.19 Comparison of performance of BL and Robust estimator AMP networks......................... 148 Figure 6.20 Improvement in Variance of Relative Prediction Error using BL-ridge and Robust
estimator for AMP networks ............................................................................................................... 149 Figure 6.21 Actual, BL, BL-ridge and Robust predictor delay profile for a selected (unmonitored) path
in AMP-50-30/Jun/2006........................................................................................................................ 150
17
LIST OF TABLES Table 2-1 Factors affecting resilience and performance of overlay networks. ..........................................35 Table 3-1 NLANR-AMP and RIPE-NCC Datasets......................................................................................65 Table 4-1. Path stretch incurred by selecting overlay paths based on offline path heuristics (|T|=12).......89 Table 4-2. Average Performance of offline path heuristics in masking failures (|T|=12). Path outages for
AMP-146-30/June/2006 and Performance Failures for AMP-133-31/Aug/2006. ..............................89 Table 6-1 Dimensions and rank of AMP and RIPE routing matrices. .....................................................120

18

19
LIST OF PUBLICATIONS
Journals S. Qazi and T. Moors, “On the impact of Routing Matrix Inconsistencies on Statistical Path Monitoring in Overlay Networks”, submitted for 2nd round of reviews to Elsevier Computer Networks (ComNet) journal. S. Qazi and T. Moors, “Finding Alternate Paths in the Internet: A Survey of Techniques for End-to-End Path Discovery”, submitted for 2nd round of reviews to IEEE Communications Surveys and Tutorials journal. Conferences S. Qazi and T. Moors, “Practical Issues of Statistical Path Monitoring in Overlay Networks with Large, Rank-Deficient Path Matrices” In Proceedings of IEEE BROADNETS, 2008.
S. Qazi and T. Moors. “Disjoint-Path Selection in Overlays Networks using Type-of-Relationship (ToR) graphs”, In Proceedings of IEEE GLOBECOM, 2007. S. Qazi and T. Moors, “A Robust Wide Area Routing Overlay Using Destination-Guided Detouring”, In Proceedings of IEEE ICC 2007. J. Risson, S. Qazi, T. Moors, A. Harwood, “A Dependable Global Location Service using Rendezvous on Hierarchic Distributed Hash Tables”, In Proceedings of IEEE ICN 2006.

20

21
PART I
INTRODUCTION AND BACKGROUND

22
23
1 INTRODUCTION
1.1 Why Overlay Networks?
The Internet has expanded to a massive scale, incorporating millions of devices belonging to tens
of thousands of networks [1]. One feature that has enabled this scaling has been its use of
hierarchical routing, in which separately administrated Autonomous Systems (ASes) can
independently choose their own interior routing protocol (e.g. OSPF or IGRP) and are
interconnected by a single exterior routing protocol, the Border Gateway Protocol (BGP). Whereas
interior routing protocols can choose paths based on performance metrics chosen by the
administrator, BGP neglects such performance metrics, and only considers routing policies in trying
to find a route. This design of BGP is partially a response to the difficulty of reaching consensus
across all ASes as to what performance metrics should be used and optimized, partly because
merely accounting for service provider policies is sufficiently challenging in itself, and partly
because link and device performance are dynamic, and accounting for their variations would limit
the scalability of BGP. Consequently, routes across the Internet are often not optimized for
performance. Yet many applications are sensitive to route performance. At one extreme, if a route
simply does not work, in that it fails to deliver packets, then that will clearly impinge on
applications that communicate across that route. BGP will eventually detect and recover from such
faults, but to permit it to scale, BGP does not frequently disseminate path availability information,
e.g. it may sometimes take several minutes to learn and apply path updates [2]. As a result,
applications may experience lengthy network outages. A less extreme example of sensitivity to
performance is real-time applications such as Voice over IP (VoIP) that are sensitive to the delay
with which information is transferred across the network. For these applications, the connectivity
that BGP provides may be insufficient, since they seek a certain Quality of Service (QoS) in terms
of the performance of the route.
Fortunately, even though the route offered by BGP may not work (to the level of performance
required by an application), often there exist alternate routes in the Internet that do work. The
question then is how can applications tap into the existing path diversity in the Internet which goes
unexploited by BGP? This is complicated by the fact that source applications have little control of
the route – source routing is often blocked since it poses a security threat and is also incompatible
with the Internet routing model in which ISPs set routing polices based on destination addresses [3].
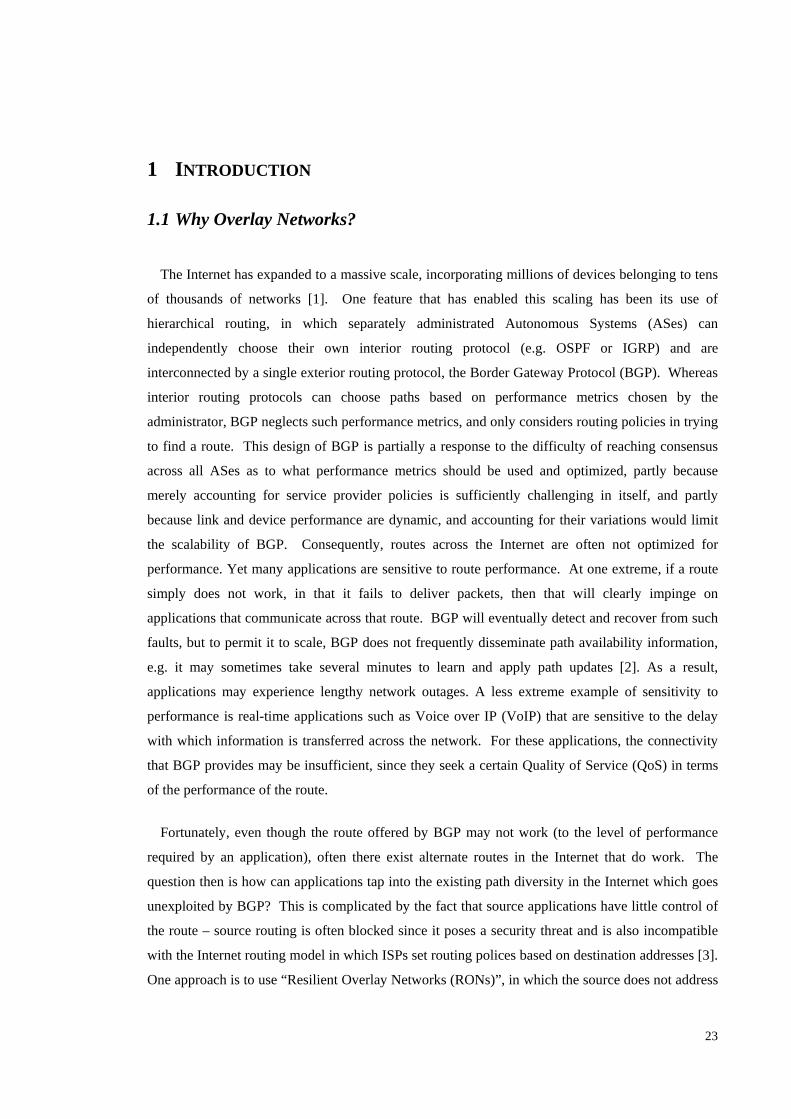
One approach is to use “Resilient Overlay Networks (RONs)”, in which the source does not address
24
its packets directly to the destination, but initially addresses them to a third party (Figure 1.1), in the
expectation that the path between it and the third party, and then from the third party to the
destination, gives better performance than the direct path. Clearly this can be extended to multiple
intermediate parties. The question then becomes how does the source determine which
intermediate parties to send its packets through?
The first pioneering study [4] demonstrated the application of resilient overlay networks to
improve the reliability with which the Internet can meet application performance metrics. It
involved participating hosts periodically probing the performance of the underlay paths between
each other, and so identifying which alternate path provides the best performance between any two
hosts via a third host. Such a path between two overlay hosts using a third overlay host as an
intermediary is often referred to as an one-hop overlay path. Note that the direct Internet (underlay)
path between two overlay hosts is also referred to as an overlay link [5]. Also note the distinction of
an overlay link from one-hop overlay path described earlier. A one-hop overlay path is formed by
the concatenation of two overlay links (underlay paths). Throughout this thesis, we interchangeably
use the terms overlay links, underlay paths or just paths to denote the end-to-end paths between any
two overlay hosts. The mention of an overlay path or simply an alternate path strictly means a one-
hop overlay path even when it is not mentioned explicitly for the sake of brevity.
While such path probing can ensure that the alternate path does not suffer the same degradation
that may affect the primary path chosen by Internet routing protocols, it does require participating
hosts to frequently probe performance (so that they can rapidly detect and respond to degradations),
and this ultimately limited the scalability of RONs to tens of hosts.
Direct path between overlay hosts A and B fails
Overlay link A,C
Overlay link C,B
One hop overlay path using an intermediate overlay host C
C
A B
Figure 1.1 Resilient Overlay Networks. Establishing Alternate paths via an overlay host when the path between two Internet hosts fail.

25
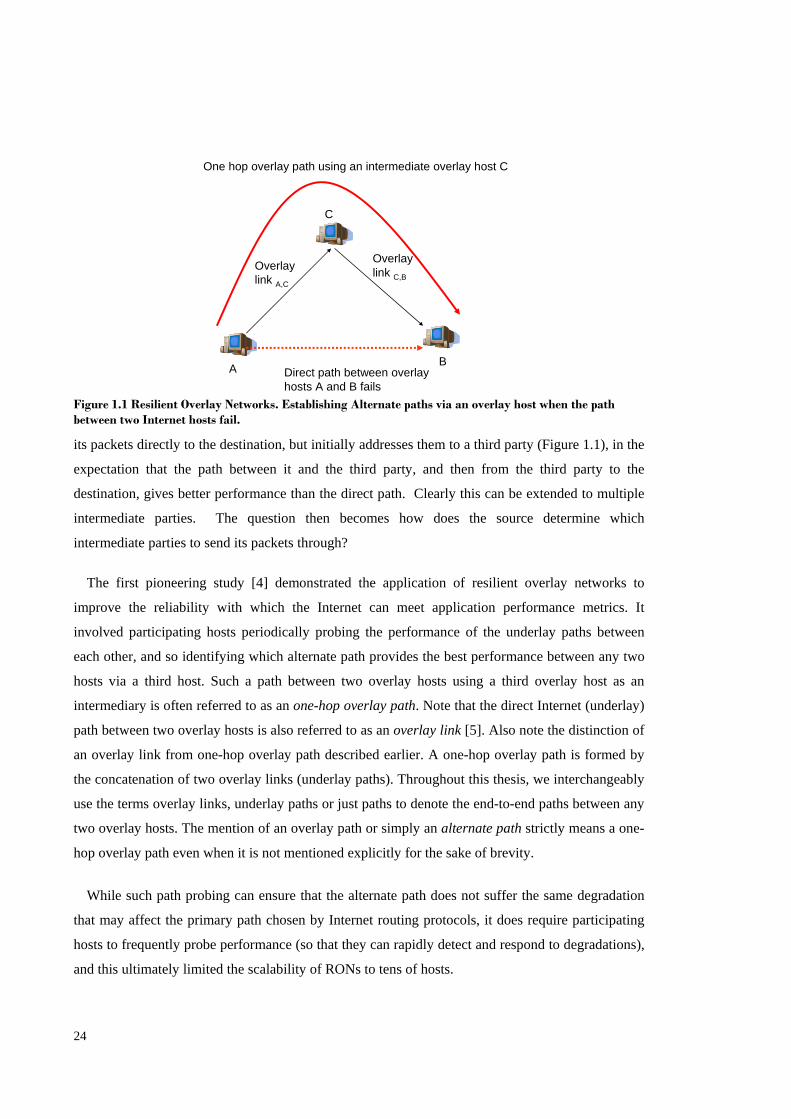
To reduce path probing overheads, an alternate mechanism would be to select paths based on
their network layer disjointness. For example, two overlay links may seem disjoint when we view
the logical topology of the overlay network (Figure 1.2) but in reality may share many links in the
underlay network with other overlay links. The logical topology of the overlay network consists of
the set of all overlay hosts and end-to-end paths between them. To be able to see the extent of
underlay link sharing amongst overlay links, one would need to know the network layer (underlay)
topology of the overlay network. A snap shot of the full underlay topology is impossible to get, as
ISPs rarely make such information publicly available. More feasible is to map all routing
information of paths between overlay hosts and piece this information together, to obtain a routing
graph (routing topology). In this dissertation, any references made to network layer overlay
topology would strictly refer to an overlay routing graph, ),( EVG = , where the vertex set
),...,,( ,21 rvvvV = refers to IP routers and overlay hosts, and the set of links
>=<= nbmas vveeeeE ,,21 ,);,...,,( represent the set of directed underlay links used on paths between
overlay hosts as determined by some path measurement techniques, such as traceroute (where mav ,
refers to the thm interface of router a ). The overlay routing graph can sometimes also be
represented in a matrix notation as a routing matrix (Chapters 2 & 6). Note that inferring the
network layer overlay topology in this manner is sometimes challenging as this requires
A
C
B
D
A
C
B
D
TracerouteA,B= [a b c d e]
b c
d e
a
Overlay Link A,B= underlay path [a b c d e]
Overlay link A,B
Figure 1.2. Logical Overlay topology (top) and Network Layer Overlay topology inferred from traceroutes.
26
information about the underlay, which is out of the domain of control of the overlay and so may
contain inaccuracies. These issues will be described in more detail in Chapter 6. In this
dissertation, references made to just the overlay topology (e.g. Chapter 2, Section 2.2) would
pertain to the logical overlay topology while references made to the network layer overlay topology
will be made explicit through the terms underlay topology, routing graph or routing matrix.
The first contribution of this thesis is the implementation of a scalable RON service,
DGRON, using a distributed architecture. In classical RON [4], all N overlay hosts need to
maintain overlay links with each other RON host, thus generating )( 2NO overheads which poses
scalability issues. In DGRON, an overlay host typically needs to establish overlay links with a
small (fixed) number of overlay hosts independent of the size of the overlay network. These hosts
are chosen with special consideration to their geographical diversity in the network and their past
performance in providing good alternate paths. Thus, the path monitoring overheads for an overlay
network with N participating hosts can be reduced from )( 2NO to )(NO . We evaluate the
tradeoffs in performance vis a vis topology maintenance and path monitoring overheads. Our results
using real world Internet datasets show that even with a huge reduction in path monitoring
overheads, DGRON’s performance matches closely that of classical RON in finding alternate paths;
matching performance of the best possible alternate path for a majority (90%) of path degradations
encountered.
The second contribution of this thesis is to propose heuristics with which disjoint alternate
paths can be discovered, so reducing the candidate alternate paths to be considered. This thesis
takes the approach of examining the topology of the underlying network at the AS level so as to
estimate viable alternate paths that are likely to be unaffected by a degradation in a direct path.
Because the network topology does not vary as frequently as link and device performance, this
technique enables RONs to scale to larger populations of participating hosts by lowering path
monitoring overheads. Previously proposed techniques such as the Earliest Divergence Rule (EDR)
[6] aim to select AS disjoint paths which separate earliest from the direct path. This can still yield a
large number of candidate paths from which a selection needs to be made. We propose more
elegant graph based algorithms based on ToR (Type-Of-Relationship) graphs, which lowers the
candidate path list over EDR by a factor of half to an order of magnitude in up to 60-70% of cases
while yielding alternate paths with similar delay benefits to EDR.
The third contribution of this thesis is to establish methods to detect and reduce the effects
of topology estimation errors. While, path measurement only requires the services of overlay
27
hosts, routing matrix estimation requires the information about the underlay network, which is out
of the domain of control of the overlay and so may contain inaccuracies; e.g. routers may reveal
inaccurate or false traceroute information. We first propose a light weight algorithm to detect false
routing information from trace routes. We also propose heuristics aimed at perfecting statistical
path measurement techniques based on the accuracy of such routing matrix estimation. Such
techniques leverage topology information inferred from the routing matrix to select a few paths for
monitoring that can lead to path quality estimation for unmonitored paths [7-8]. However, if the
routing matrix cannot be determined accurately, these techniques can yield large path estimation
errors. Our work shows that removal or mitigation of such routing matrix inconsistencies (RMI)
using robust statistical methods alone can improve such path metric prediction by 10-20% and non-
negligible benefits for anomaly detection on unmonitored paths.
1.2 Dissertation Overview
The remainder of this thesis dissertation is organized as follows. Chapter 2 presents an in depth
overview of techniques for alternate path exploration in the Internet including a rigorous analysis of
design criterion for Overlay Networks. Chapter 3 describes the Internet datasets used for trace-
based simulations used throughout this thesis. The next three chapters of this thesis are divided into
two separate parts addressing the issues of scalable architectures for alternate path selection
(Chapters 4 and 5) and path monitoring in Resilient Overlay Networks (Chapter 6). Finally,
Chapter 7 concludes this dissertation and outlines some future research directions.

28

29
2 LITERATURE REVIEW
2.1 Introduction The Internet seems to work most of the time but sometimes recovery from failures is painfully
slow. For many of the user perceived performance failures/faults, e.g. delay in loading a web page
or patchy audio in a VoIP session, there exists a possibility that using an alternate path may offer
better QoS.
Often, such alternate routes remain unexploited due to the scalability objectives of the Border-
Gateway Protocol (BGP), the de facto Internet inter-domain routing protocol that connects all
networks into one giant Internet. BGP is primarily designed for scalable dissemination of network
reachability information according to shortest paths compliant with the commercial traffic transit
policies of ISPs. Incorporating QoS based routing decisions in BGP route selection would defeat its
primary purpose of scalability, as QoS checks on paths need to be made more frequently and
individually than mere reachability checks on aggregate IP blocks. There are also no inter-ISP
benchmarks for acceptable levels of QoS which are defined by individual user applications that may
be sensitive in different ways to the levels of delay, throughput and packet loss. Moreover, if such
QoS based routing decisions could be incorporated into BGP it could cause route flapping; a
phenomenon in which many path updates are triggered when one of the advertised routes repeatedly
updates itself due to the distributed nature of BGP for learning global paths. This problem is bad
enough in BGP when exchanging network reachability information alone; and to prevent this
problem BGP inhibits frequent path updates; this can sometimes cause BGP to take several minutes
to learn and apply path updates [2].
Internet applications e.g. VoIP applications need to meet their QoS demands, so they could
benefit by tapping into the existing path diversity in the Internet for better paths which go
unexploited by BGP as explained earlier. Research focuses on several interesting solutions for
scalable end-to-end path discovery on the Internet without modifying the underlay framework;
these techniques include deployment of overlay networks [4, 9], providing redundant network
connections to end users through multi-homing to several ISPs [10] or a combination of the two
[11]. Other proposals call for changes to the underlay network routing mechanisms [12-14]. We
consider each of these proposals in Section 2.2. These proposals have already been experimentally
deployed over the Internet but it will still be some time before their use becomes widespread. We
then review proposals that call for changes to underlay routing mechanisms (Section 2.3). These
proposals are still in the early stages with no experimental deployments. Finally, we review the
30
benefit of multi-homing (Section 2.4) which although it emerged as the first solution to create path
diversity in the Internet faces stagnation now.
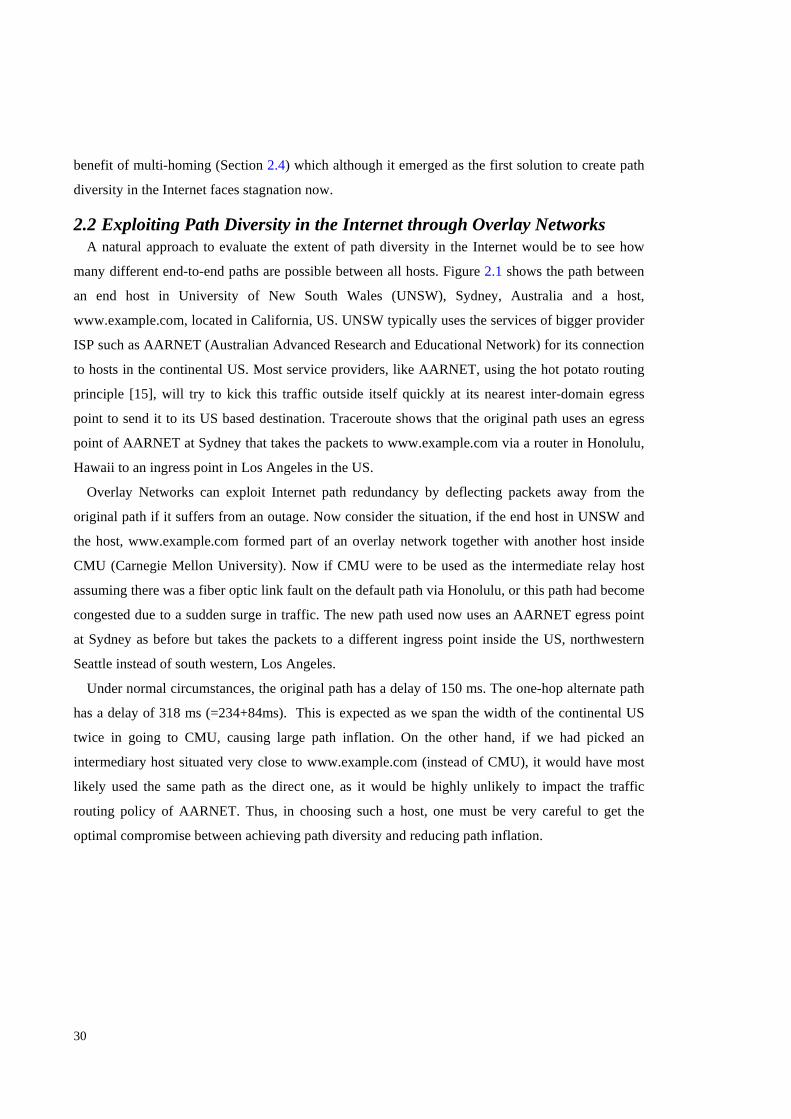
2.2 Exploiting Path Diversity in the Internet through Overlay Networks A natural approach to evaluate the extent of path diversity in the Internet would be to see how
many different end-to-end paths are possible between all hosts. Figure 2.1 shows the path between
an end host in University of New South Wales (UNSW), Sydney, Australia and a host,
www.example.com, located in California, US. UNSW typically uses the services of bigger provider
ISP such as AARNET (Australian Advanced Research and Educational Network) for its connection
to hosts in the continental US. Most service providers, like AARNET, using the hot potato routing
principle [15], will try to kick this traffic outside itself quickly at its nearest inter-domain egress
point to send it to its US based destination. Traceroute shows that the original path uses an egress
point of AARNET at Sydney that takes the packets to www.example.com via a router in Honolulu,
Hawaii to an ingress point in Los Angeles in the US.
Overlay Networks can exploit Internet path redundancy by deflecting packets away from the
original path if it suffers from an outage. Now consider the situation, if the end host in UNSW and
the host, www.example.com formed part of an overlay network together with another host inside
CMU (Carnegie Mellon University). Now if CMU were to be used as the intermediate relay host
assuming there was a fiber optic link fault on the default path via Honolulu, or this path had become
congested due to a sudden surge in traffic. The new path used now uses an AARNET egress point
at Sydney as before but takes the packets to a different ingress point inside the US, northwestern
Seattle instead of south western, Los Angeles.
Under normal circumstances, the original path has a delay of 150 ms. The one-hop alternate path
has a delay of 318 ms (=234+84ms). This is expected as we span the width of the continental US
twice in going to CMU, causing large path inflation. On the other hand, if we had picked an
intermediary host situated very close to www.example.com (instead of CMU), it would have most
likely used the same path as the direct one, as it would be highly unlikely to impact the traffic
routing policy of AARNET. Thus, in choosing such a host, one must be very careful to get the
optimal compromise between achieving path diversity and reducing path inflation.

31
This simple example demonstrates how alternate path selection via overlay networks can help in
tapping into the Internet path diversity. Furthermore, it also makes it clear that overlay networks
help in exploiting the path diversity by changing ingress or egress points through ASes and thus
routing through other ASes disjoint from the original path. This will become more clear in the
following sections. It also highlights the importance of choosing the intermediate host to act as a
detour, wisely.
Several independent research findings [16-17] have shown evidence of path diversity in the
Internet. Savage et al. [17] showed that for almost 80% of the paths used in the Internet there is an
alternate route with a lower probability of packet loss, and for 15% of the paths, there is an
alternative that offers an improvement in latency better than 25%. Similarly, Gummadi et al. [16]
•Sydney
•www.example.com
•Seattle
•Pittsburgh
•Honolulu
(Hawaii)
Direct path to example.com from Sydney
Alternate path via CMU
•Los Angeles150ms
234ms
84ms
UNSW
CMU
Figure 2.1 Direct path between UNSW and example.com and a one-hop overlay path via CMU.
32
showed that 54% of random path and performance failures could be masked by detouring packets to
an intended destination via an intermediate host.
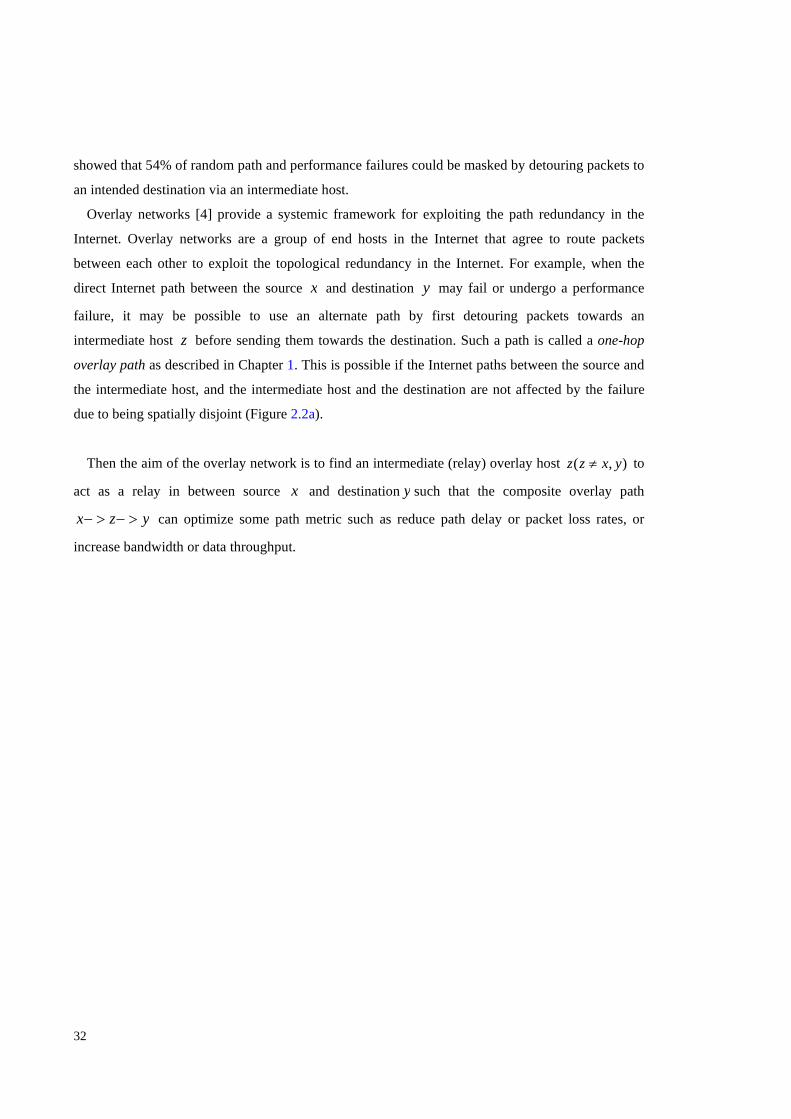
Overlay networks [4] provide a systemic framework for exploiting the path redundancy in the
Internet. Overlay networks are a group of end hosts in the Internet that agree to route packets
between each other to exploit the topological redundancy in the Internet. For example, when the
direct Internet path between the source x and destination y may fail or undergo a performance
failure, it may be possible to use an alternate path by first detouring packets towards an
intermediate host z before sending them towards the destination. Such a path is called a one-hop
overlay path as described in Chapter 1. This is possible if the Internet paths between the source and
the intermediate host, and the intermediate host and the destination are not affected by the failure
due to being spatially disjoint (Figure 2.2a).
Then the aim of the overlay network is to find an intermediate (relay) overlay host ),( yxzz ≠ to
act as a relay in between source x and destination y such that the composite overlay path
yzx >−>− can optimize some path metric such as reduce path delay or packet loss rates, or
increase bandwidth or data throughput.
33
Direct Internet Path suffers from outage/ service degradation
Possible one-hop overlay paths between any two edge-hosts
End-hosts at edge of network
INTERNET
z1
z2
Source x
Destination y
Direct Internet Path suffers from outage/ service degradation
Alternate Tunnel
Non-overlay hosts at edge of network
RON host
INTERNET
z1
z2
Non-overlay Source
x
Non-overlay
Destination y
Figure 2.2 (a) (top) Possible one-hop overlay path between end-hosts when the direct Internet path suffers from outage/service degradations. (b) Overlay tunnel establishment
34
Overlay networks may be used to find and use such one-hop alternate paths to route around path
failures. Several factors (Table 2.1) affect the resilience and performance of an overlay network as
described in following subsections. The degree to which such alternate paths can be spatially
disjoint from original paths between hosts is a function of the physical geometry (spatial
characteristics) of the overlay network relative to the underlay network (Internet). For example an
one-hop overlay path via an intermediate host may be seemingly disjoint from the direct Internet
path but may share several underlay links in the underlay network. Similarly, the efficacy with
which one of several alternate paths is selected depends on the ability to monitor the metrics of all
one-hop overlay paths in the network.
Note that the architecture just described assumes that selecting alternate paths to avoid path
degradation is limited to the intra overlay paths. This poses an obvious question, “Can non overlay
based source-destination pairs benefit from such path diversity?” For non-overlay sources and/or
destinations, the alternate path computation described earlier could take the form of alternate tunnel
computation between overlay hosts closest to source/destination (Figure 2.2b). Such non-overlay
hosts intending to optimize their path selection would then have to subscribe to such a RON service
where the packet forwarding along an alternate tunnel would be handled by them.
The first decision in designing an overlay network is in where to place overlay hosts. Often
hosts cannot control their location, so the next decision is which hosts to select to use for a one-hop
overlay path. After overlay construction, comes the main (and inter-twined) task of overlay link
monitoring and path selection. Sometimes the path monitoring and path selection decisions are
application centric, as different Internet applications may have different QoS needs for which
specialized packet detouring techniques need to be addressed.
35
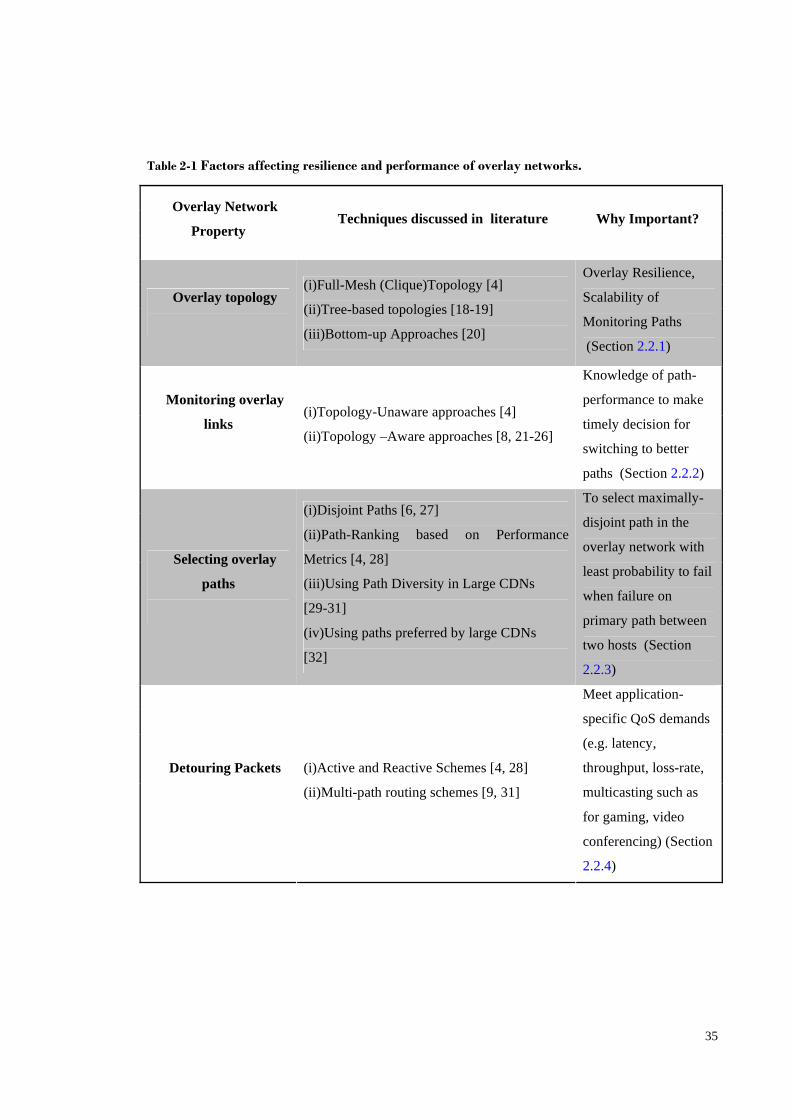
Table 2-1 Factors affecting resilience and performance of overlay networks.
Overlay Network
Property Techniques discussed in literature Why Important?
Overlay topology
(i)Full-Mesh (Clique)Topology [4]
(ii)Tree-based topologies [18-19]
(iii)Bottom-up Approaches [20]
Overlay Resilience,
Scalability of
Monitoring Paths
(Section 2.2.1)
Monitoring overlay
links
(i)Topology-Unaware approaches [4]
(ii)Topology –Aware approaches [8, 21-26]
Knowledge of path-
performance to make
timely decision for
switching to better
paths (Section 2.2.2)
Selecting overlay
paths
(i)Disjoint Paths [6, 27]
(ii)Path-Ranking based on Performance
Metrics [4, 28]
(iii)Using Path Diversity in Large CDNs
[29-31]
(iv)Using paths preferred by large CDNs
[32]
To select maximally-
disjoint path in the
overlay network with
least probability to fail
when failure on
primary path between
two hosts (Section
2.2.3)
Detouring Packets
(i)Active and Reactive Schemes [4, 28]
(ii)Multi-path routing schemes [9, 31]
Meet application-
specific QoS demands
(e.g. latency,
throughput, loss-rate,
multicasting such as
for gaming, video
conferencing) (Section
2.2.4)

36
2.2.1 Overlay Topology The topology of an overlay plays an essential role in the scalability of path monitoring and the
accuracy in predicting alternate paths. An overlay network basically starts out as a group of
participating hosts willing to route traffic for each other. A logical topology is formed based on
decisions of establishing links between some or all hosts. Such links, often described as overlay-
links, may traverse several underlay links and two overlay links may share underlay links. This
section surveys several proposals that have been made in this regard including the full-mesh
topology; i.e. to establish a link between all overlay hosts, to more scalable tree-based and
distributed approaches.
Full-Mesh (Clique) Topology
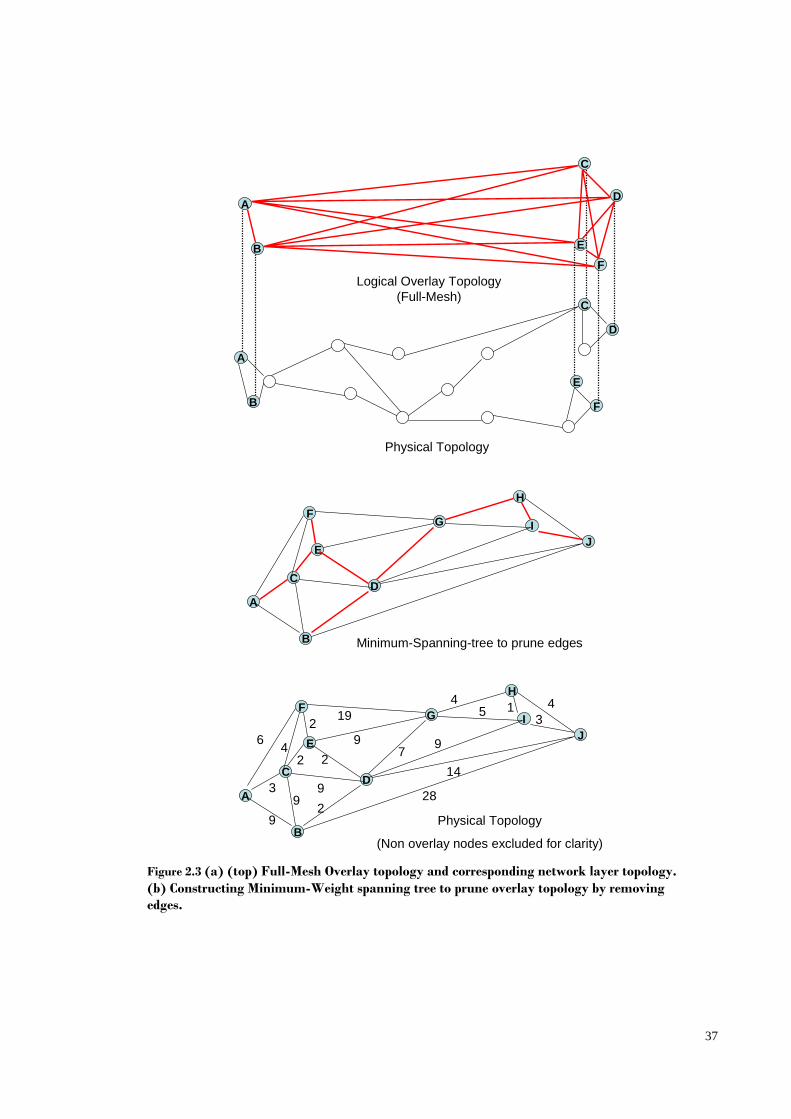
RON [4] used a full-mesh architecture, in which individual overlay hosts are connected with all
other hosts in a logical mesh. Each peer probes overlay links connecting it with all other hosts, and
the measured path characteristics are disseminated in the network through link-state flooding
(Figure 2.3(a)). This architecture is ‘ideal’ in the sense that each individual peer can find an
alternate path with high probability by knowing the current performance of all overlay links.
However, the associated overheads in such an architecture are )( 2NO for N overlay-hosts, which
limits the scale of such an overlay networks to 50 hosts [4].
Tree-based topologies
Alternate overlay topologies have been proposed [18-19, 23], for achieving scalable overlay link
monitoring. Monitoring overlay links between all pairs of overlay hosts is clearly inefficient when
we observe that a large number of links may actually be shared amongst overlay links due to the
power law topology of the Internet [33], which suggests that a few links are used by many paths.
Tang and Nakao [19, 24] showed that it is possible to prune the overlay topology to remove
redundant links. For example, one of two overlay links can be removed that have in common a
large number of underlay links or removing an overlay link which is unlikely to be selected by the
overlay routing algorithm. For example several overlay links between hosts in North America and
Europe may traverse the same intercontinental fiber optic link. Monitoring only one such path could
yield bounded performance estimation on all paths, since the major portion of the path delays on all
such paths would be encountered on the intercontinental fiber optic link. Using the same argument,
Li [18] and Nakao [19] proposed that mesh topologies can be reduced to a single tree or multiple
sub-trees by pruning redundant overlay links. Overlay links are redundant when they overlap with
each other at the network layer, as outlined by our previous example.
37
B
A
C
D
E
F
A
B
C
D
E
F
Physical Topology
Logical Overlay Topology (Full-Mesh)
A
F
J
Physical Topology
(Non overlay nodes excluded for clarity)
Minimum-Spanning-tree to prune edges
B
C
E
D
G
H
I
A
F
J
B
C
E
D
G
H
I
6
9
39
914
28
24 9
19
9
5 3
7
4 1 42
2
2
Figure 2.3 (a) (top) Full-Mesh Overlay topology and corresponding network layer topology. (b) Constructing Minimum-Weight spanning tree to prune overlay topology by removing edges.
38
Li and Mohapatra [18] used a minimum-weight spanning tree (MST) algorithm to connect all
overlay hosts which minimizes overall connection cost, i.e.
∑∈Ee
ecMinimize (2-1)
where
nodesoverlay ofset theis ),...,,(, ,
linksoverlay ofset theis ),...,,(
21
21
n
jiji
k
vvvVVvvandvve
eeeE
=∈⟩⟨=
=
metric, desirableany ngrepresenti edges of weightsof sum is ec e.g. latency, as shown in Figure
2.3(b).
However, removing overlay edges may achieve desired scalability at the cost of resilience, as
some crucial overlay link information is lost while pruning edges. Topology-aware heuristics can
play a crucial role in the decision to remove or retain an overlay link when constructing such trees.
For example, Eriksson et al. [34] provided evidence that it is possible to cluster hosts that share
network paths which can help towards constructing sparser spanning trees. Another problem with
MST construction is its dependence on accurate link costs, which may again vary due to differing
levels of network congestion. This would require path probing on all overlay links, even if not
frequently to update link costs for recomputing the MST.
Distributed topologies
Both mesh and tree based topologies are aimed at connecting all or the majority of overlay hosts
together. This may sometimes be not feasible for very large networks. A more scalable approach
here would be to adopt a distributed architecture like CDNs [35-36], where each overlay node has a
degree which is low, of the order of lg N for a network with N overlay hosts. Another architecture
is proposed by Lee et al. [37] and Rakotoarivelo et al. [38], where overlay hosts record their path
measurements to a few super-hosts in the network and the super-hosts maintain a database of
network path measurements. This database can be later queried by all hosts seeking to optimize
QoS between them and other hosts. Load balancing concerns may also warrant careful choice of
super nodes. An obvious caveat with such an architecture as proposed by [37] is its shift from the
aggressive path monitoring approach of RON to a more passive one. For example, querying a
database may waste valuable time and then there is also the issue of staleness of the path
information fetched. For example, a database having recorded a path as good may not have
registered it going bad when such path queries are made. We present a distributed architecture in
Chapter 4 where super nodes and detour sets are selected using a combination of landmark based
approach and data mining. We show that it is possible to tactically choose a small set of detouring
39
nodes in order to find a reasonably good QoS optimized path with high probability, reducing
)( 2NO path monitoring overheads for N overlay-hosts to just )(NO .
Topology based on Evolutionary Approach
Early works (e.g. [4]) chose arbitrary locations/sites for overlay hosts which already gave them
remarkable performance gains. Anderson et al. [4] were already able to recover from around 60% of
Internet failures successfully. The authors of some studies, (e.g. [39-40]) focused on optimizing
overlay node selection and proposed bottom-up strategies. Chun [39] considered overlay
construction as a ‘non-cooperative game’ played by selfish hosts where each tries to minimize the
number of overlay links it establishes by utilizing links established by other hosts. Slight
modifications to the rules of the game result in wide ranging overlay topologies, from complete
meshes to trees and node-degree distributions that range from exponential to power-law. Han et al.
[40] also considered a bottom-up approach, and consider the problem of picking overlay hosts for
maximum path diversity in the overlay network. They found that for minimal sharing amongst
overlay links, overlay hosts should be in diverse ISPs that have no peering relationships with each
other.
2.2.2 Monitoring Overlay Links Dynamic overlay link monitoring is essential in order to quickly recover from a failure in the
underlay network through the use of an alternate one-hop overlay path. Literature [4, 28] suggests
that monitoring path quality is best when using dynamic-online algorithms. However, the overheads
of such techniques are large and are not scalable beyond a modest overlay size. There are a few
proposals [18-19, 23-24] to reduce such overheads using topology-aware approaches.
Topology-Unaware Approaches
The pioneering work in RON [4] connected overlay hosts in a full-mesh topology. Path quality is
monitored by probing all overlay links between hosts in the network (Figure 2.4a); and distributing
such measurements between hosts using link-state protocols (Figure 2.4b). Probing all overlay
links aggressively and subsequent link-state flooding generates a large overhead. The routing
overhead in an overlay topology with n hosts and average node degree d is [18]:
messages statelink ofnumber )1( messages probing ofnumber ×−×+×× nndn (2-2)
40
Anderson et al. [4] found that the probing overhead for 50 hosts (in a mesh topology) is
approximately 30 Kbits/s of outgoing bandwidth per node when path probing interval is 12 seconds.
We will use two Internet datasets RIPE [41] and AMP [42] (more details, Chapter 3) to evaluate the
heuristics presented in this thesis where end-to-end path measurements (path delays) are made at
average intervals of 30 seconds and 1 minute, respectively.
Other approaches for monitoring paths include distributed approaches [37] (described earlier)
where overlay hosts report their path measurements to super hosts, which can be queried later by
other overlay hosts.
Topology-Aware Approaches
Several research papers [5, 8, 19, 21, 23-24, 43-44], aim to reduce path monitoring overheads in
overlay networks by leveraging network layer topology information. Several works propose graph-
Packet loss rate, Throughput, Latency
Disseminate all measurements
Figure 2.4 (a) (top) Probing overlay links. Each overlay host probes paths to all other overlay hosts for measurement of path-metrics such as latency, throughput and loss rates. (b) Link-State Dissemination Protocol is used to share such measurements between all overlay hosts.
41
based approaches to reduce the mesh topology to a tree-based overlay topology with fewer overlay
links to monitor. Tang and McKinley [23] proposed monitoring overlay links based on the
application of normal and weighted variants of the set-cover algorithm, i.e. selecting overlay links
which include as many unshared underlay links as possible. Finding the set cover is a known NP-
hard problem [23]. In this approach, they used a greedy algorithm for an approximate solution. This
leads to performance estimation for a large number of overlay links while actually monitoring a
small subset. A similar approach as been used by Madhyastha et al. in the iPlane project [45-47], to
develop a distributed path monitoring system that can be used to predict path metrics based on
shared components between paths and clustering endhosts based on BGP atoms [48] and
developing a compact library of Internet measurements for peer-to-peer applications. Such
techniques can yield good upper-bounds on path estimation while reducing overall path-monitoring
overheads.
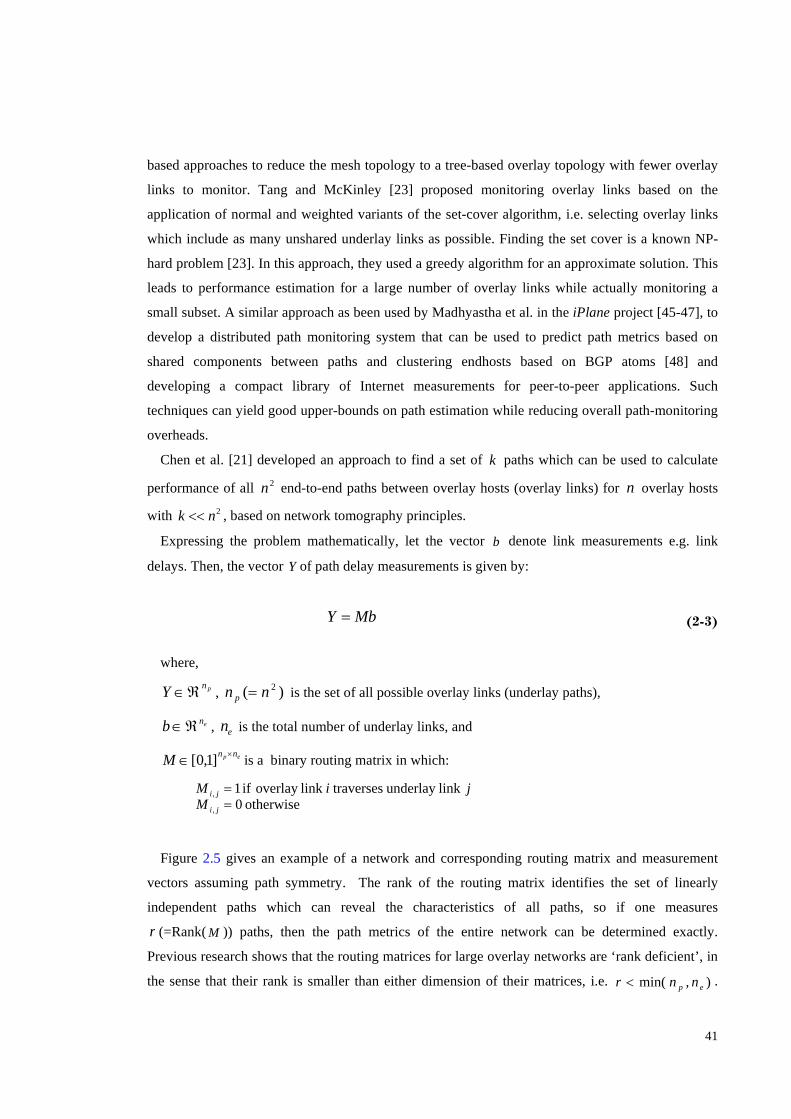
Chen et al. [21] developed an approach to find a set of k paths which can be used to calculate
performance of all 2n end-to-end paths between overlay hosts (overlay links) for n overlay hosts
with 2nk << , based on network tomography principles.
Expressing the problem mathematically, let the vector b denote link measurements e.g. link
delays. Then, the vector Y of path delay measurements is given by:
MbY = (2-3)
where,
pnY ℜ∈ , )( 2nn p = is the set of all possible overlay links (underlay paths),
enb ℜ∈ , en is the total number of underlay links, and
ep nnM ×∈ ]1,0[ is a binary routing matrix in which:
otherwise 0link underlay traverseslink overlay if 1
,
,==
ji
jiM
jiM
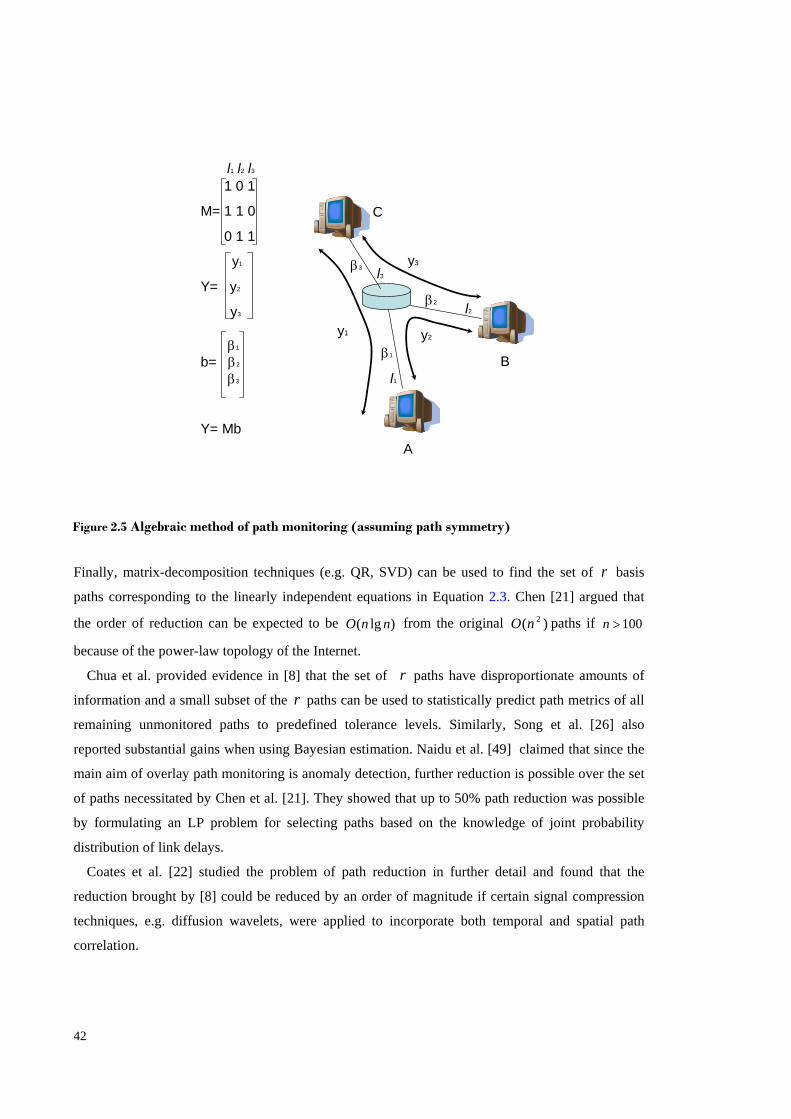
Figure 2.5 gives an example of a network and corresponding routing matrix and measurement
vectors assuming path symmetry. The rank of the routing matrix identifies the set of linearly
independent paths which can reveal the characteristics of all paths, so if one measures
r (=Rank( M )) paths, then the path metrics of the entire network can be determined exactly.
Previous research shows that the routing matrices for large overlay networks are ‘rank deficient’, in
the sense that their rank is smaller than either dimension of their matrices, i.e. ),min( ep nnr < .
42
Finally, matrix-decomposition techniques (e.g. QR, SVD) can be used to find the set of r basis
paths corresponding to the linearly independent equations in Equation 2.3. Chen [21] argued that
the order of reduction can be expected to be )lg( nnO from the original )( 2nO paths if 100>n
because of the power-law topology of the Internet.
Chua et al. provided evidence in [8] that the set of r paths have disproportionate amounts of
information and a small subset of the r paths can be used to statistically predict path metrics of all
remaining unmonitored paths to predefined tolerance levels. Similarly, Song et al. [26] also
reported substantial gains when using Bayesian estimation. Naidu et al. [49] claimed that since the
main aim of overlay path monitoring is anomaly detection, further reduction is possible over the set
of paths necessitated by Chen et al. [21]. They showed that up to 50% path reduction was possible
by formulating an LP problem for selecting paths based on the knowledge of joint probability
distribution of link delays.
Coates et al. [22] studied the problem of path reduction in further detail and found that the
reduction brought by [8] could be reduced by an order of magnitude if certain signal compression
techniques, e.g. diffusion wavelets, were applied to incorporate both temporal and spatial path
correlation.
β1
A
B
C
1 0 1
M= 1 1 0
0 1 1
y1
Y= y2
y3
β1
b= β2
β3
Y= Mb
y1 y2
y3
β2
β3
l2
l1
l3
l1 l2 l3
Figure 2.5 Algebraic method of path monitoring (assuming path symmetry)
43
One shortcoming of many of the above approaches is that while routing matrices, link and path
characteristics may be easy to accurately obtain for some individual large ISPs and overlay test
beds used in their case studies, they are not very easy to obtain for overlay networks with hosts
deployed across different ISPs [50]. As we mentioned earlier, while path measurements require
coordination between participation between overlay hosts only, topology estimation requires
participation by non-overlay based elements e.g. routers. As a consequence, topology estimation is
often inaccurate or incomplete. We review the impact of incorrect topology estimation using
evidence from real world Internet datasets in Chapter 6 on such techniques [8, 21] and propose
ways to identify and alleviate such errors.
2.2.3 Selecting Overlay Paths As discussed in the previous section, monitoring overlay links can help in alternate path
selection. In worst cases, path decisions may need to be made in the presence of stale or no link
performance information. Here we highlight a few key ideas used for end-to-end path selection
using overlay-based techniques.
Disjoint Overlay Paths
Several researchers [6, 27] have argued that since Internet paths are often stable on time-scales
of days [51], maintaining complete topology information of the overlay network allows one to
select the most disjoint alternate path without the need for path monitoring. This latter approach
may work for path outages but sometimes may not be very efficient for ensuring strict application
specific metrics, like delay, throughput etc. For example, path delays may not always be a simple
function of fiber delays but a combination of fiber delays, congestion on individual links and packet
queuing delays in routers. This makes path monitoring to meet application-specific QoS demands
more difficult than merely ensuring spatial diversity. Nevertheless, the bulk of the thrust of new
research is centered on improving design heuristics to choose disjoint overlay paths, which is a key
factor in reducing the overheads and improving resilience at the same time. However, such
disjointness needs to be established at the network layer of the network; two overlay links that are
seemingly disjoint at the overlay layer could still share a link in the underlying IP layer. The shared
IP link renders both useless in the event of path failure.
A previous study [6], showed that an Earliest Divergence Rule (EDR) (Figure 2.6) can work well
by selecting the alternate path which diverges at the earliest point from the default-path near the
source. This technique assumes availability of AS level paths (from source overlay hosts to
detouring overlay hosts). In Chapter 6, we show that traceroutes and other tools used for mapping
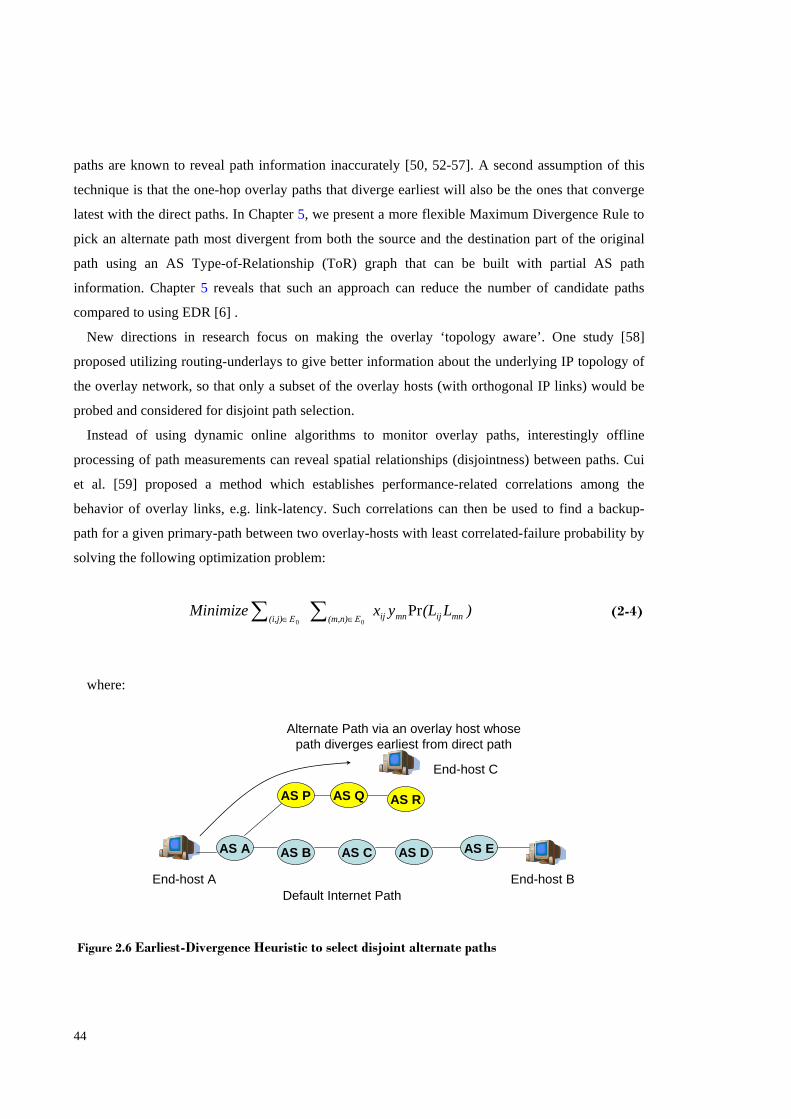
44
paths are known to reveal path information inaccurately [50, 52-57]. A second assumption of this
technique is that the one-hop overlay paths that diverge earliest will also be the ones that converge
latest with the direct paths. In Chapter 5, we present a more flexible Maximum Divergence Rule to
pick an alternate path most divergent from both the source and the destination part of the original
path using an AS Type-of-Relationship (ToR) graph that can be built with partial AS path
information. Chapter 5 reveals that such an approach can reduce the number of candidate paths
compared to using EDR [6] .
New directions in research focus on making the overlay ‘topology aware’. One study [58]
proposed utilizing routing-underlays to give better information about the underlying IP topology of
the overlay network, so that only a subset of the overlay hosts (with orthogonal IP links) would be
probed and considered for disjoint path selection.
Instead of using dynamic online algorithms to monitor overlay paths, interestingly offline
processing of path measurements can reveal spatial relationships (disjointness) between paths. Cui
et al. [59] proposed a method which establishes performance-related correlations among the
behavior of overlay links, e.g. link-latency. Such correlations can then be used to find a backup-
path for a given primary-path between two overlay-hosts with least correlated-failure probability by
solving the following optimization problem:
∑∑ ∈∈ 00 Pr
Ε(m,n) mnijmnijΕ(i,j))L(LyxMinimize (2-4)
where:
AS A AS B AS C AS D AS E
AS P AS Q AS R
Default Internet Path
Alternate Path via an overlay host whose path diverges earliest from direct path
End-host A End-host B
End-host C
Figure 2.6 Earliest-Divergence Heuristic to select disjoint alternate paths
45
paths backup andprimary on linksoverlay ofy probabilit failurejoint theis ),Pr(
0 else ly,respective paths backup andprimary by used are and linksoverlay
if set to1 arely which respective paths, backup andprimary on flows are and linksoverlay all ofset theis
0
mnij
mnij
mnij
LL
LL
yxE
The above minimization problem can be coupled with other constraints such as delay bounds on
the backup path. Such optimization problems become NP-hard for a large number of variables and
constraints and are suitable for small networks. Moreover, the technique requires synchronization of
participating hosts which may be somewhat difficult to achieve in large networks. A similar idea
with a slightly different objective has been pursued by Antonova et al. [44], with the aim of finding
the optimal way to split a video stream over multiple paths with bounded delay requirements.
Path-Ranking based on Performance Metrics
A large amount of research discusses choices of an appropriate performance metric such as
latency, throughput and loss rates for selecting backup paths in the overlay. Paths are ranked on the
basis of these metrics using scoring functions; these range from weighted-moving averages over
finite temporal windows to statistical approaches [4, 28, 59]. RON [4] distinguished between
different paths on the basis of latency, throughput and loss rates, making the choice of ranking paths
application-specific. Similarly, Kawahara et al. [60] and Uchida et al. [61] proposed selection of
alternate paths by ranking the overlay nodes in order of frequency with which they provide an
optimal path by acting as a relay node.
Zhu [28] used available-bandwidth for alternate path selection claiming latency, loss rates and
throughput metrics could be ‘misleading’ as they often depend on the protocol implementations,
network heterogeneity or temporal effects. It argues that throughput is a function of TCP
parameters and thresholds set for detection of allowable loss rate and latency could be misleading
because of the dynamism and heterogeneity experienced by the network. Similarly, Lee et al. [37]
measured capacity of overlay paths and selected paths based on available bandwidth criteria.
Hu and Steenkiste [62] showed that in comparison to delay estimation on end to end paths,
bandwidth is often bounded by the (bandwidth of) bottleneck links. Identification of such
bottleneck links is often easy as they are often within a radius of within three to four IP hops from
end hosts as the links in the core of the Internet tend to be over provisioned. Measuring the
performance of only the bottleneck links combined with certain rules used in Internet path decisions
such as shortest, valley-free paths (Chapter 5) [27, 63] can reduce the )( 2NO overheads for a N
host overlay network to linear overheads of )(NO .
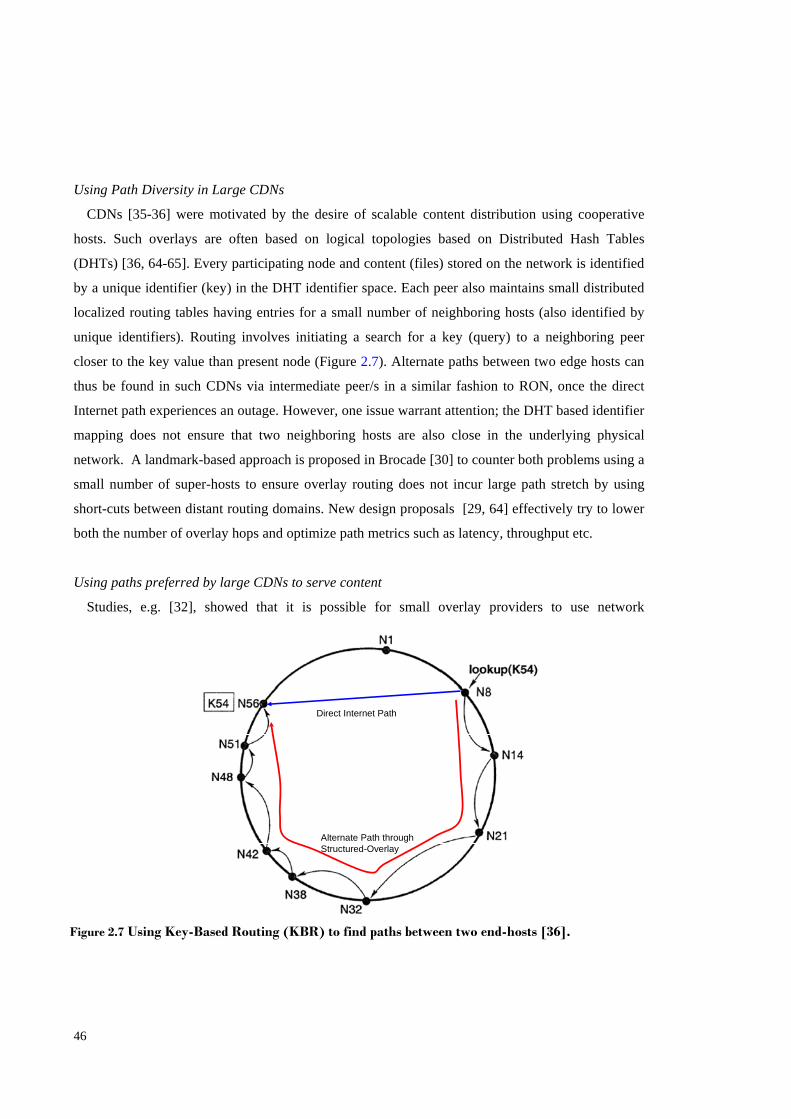
46
Using Path Diversity in Large CDNs
CDNs [35-36] were motivated by the desire of scalable content distribution using cooperative
hosts. Such overlays are often based on logical topologies based on Distributed Hash Tables
(DHTs) [36, 64-65]. Every participating node and content (files) stored on the network is identified
by a unique identifier (key) in the DHT identifier space. Each peer also maintains small distributed
localized routing tables having entries for a small number of neighboring hosts (also identified by
unique identifiers). Routing involves initiating a search for a key (query) to a neighboring peer
closer to the key value than present node (Figure 2.7). Alternate paths between two edge hosts can
thus be found in such CDNs via intermediate peer/s in a similar fashion to RON, once the direct
Internet path experiences an outage. However, one issue warrant attention; the DHT based identifier
mapping does not ensure that two neighboring hosts are also close in the underlying physical
network. A landmark-based approach is proposed in Brocade [30] to counter both problems using a
small number of super-hosts to ensure overlay routing does not incur large path stretch by using
short-cuts between distant routing domains. New design proposals [29, 64] effectively try to lower
both the number of overlay hops and optimize path metrics such as latency, throughput etc.
Using paths preferred by large CDNs to serve content
Studies, e.g. [32], showed that it is possible for small overlay providers to use network
Direct Internet Path
Alternate Path through Structured-Overlay
Figure 2.7 Using Key-Based Routing (KBR) to find paths between two end-hosts [36].
47
observations from large CDNs, e.g. Akamai [7, 66]. It shows that a single-hop indirection through
an overlay node close to the ‘preferred’ Akamai server to serve content can be effective in
establishing an end-to-end path between hosts with desirable end-to-end path performance (Figure
2.8). Large CDNs already optimize the path selection problem and this can be leveraged by
overlays. Some motivating facts found by the same study show that in some instances up to 200
CDN mirror sites were used to serve content over a 48 hr period and that sometimes CDN content
was served by a mirror outside even when an Akamai server as close to the source due to time of
day effects [32]. However, the two major issues are: (i) the surety that an adequate level of service
from the CDN is available near all overlay hosts; (ii) large CDNs may use techniques to hide
locality information about the servers and served-content to prevent exploitation.
2.2.4 Detouring Packets While the previous section addressed generic alternate path selection problems, path selection
decisions could be more driven by more application specific objectives. Different flows in the
Internet may have different application-specific QoS demands [67-69]. A real-time application,
such as a VoIP packet can tolerate some loss but no delay and requires a different packet-detouring
strategy than a packet in a ftp session which can tolerate delay. Similarly, applications using
different transport mechanisms (UDP or TCP) may require application-specific, packet-detouring
strategies. Following are the two main schemes which we identified from published literature.
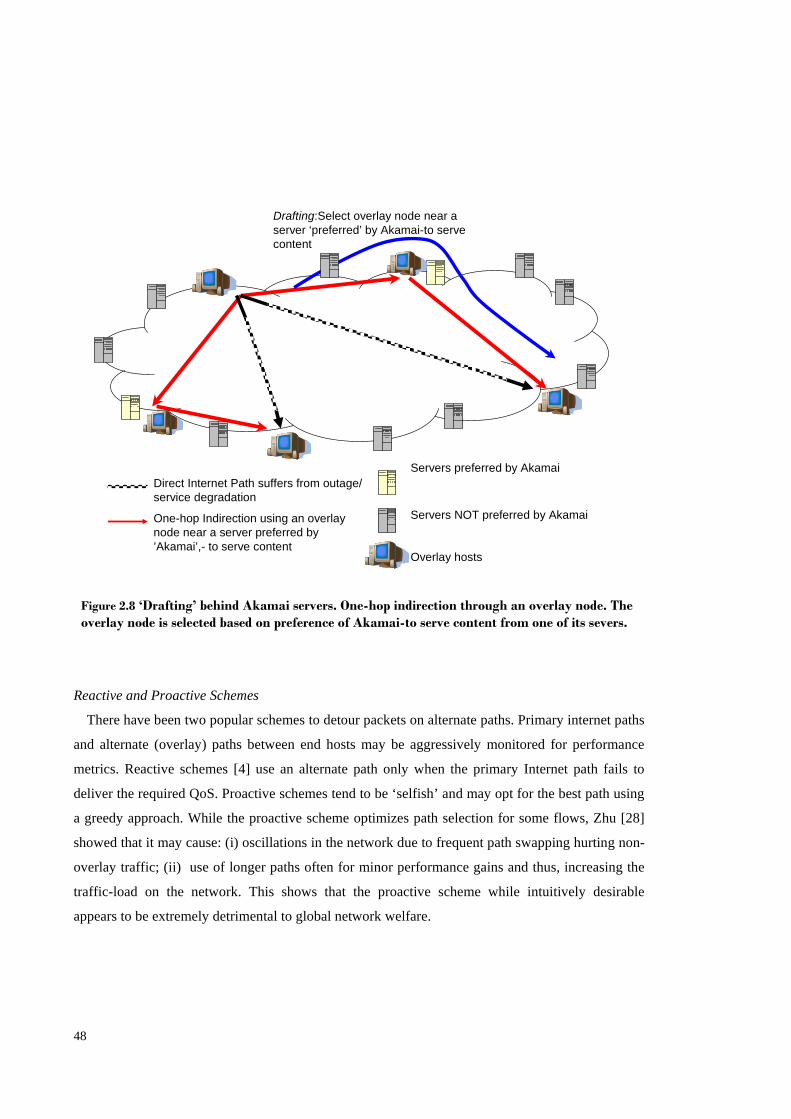
48
Reactive and Proactive Schemes
There have been two popular schemes to detour packets on alternate paths. Primary internet paths
and alternate (overlay) paths between end hosts may be aggressively monitored for performance
metrics. Reactive schemes [4] use an alternate path only when the primary Internet path fails to
deliver the required QoS. Proactive schemes tend to be ‘selfish’ and may opt for the best path using
a greedy approach. While the proactive scheme optimizes path selection for some flows, Zhu [28]
showed that it may cause: (i) oscillations in the network due to frequent path swapping hurting non-
overlay traffic; (ii) use of longer paths often for minor performance gains and thus, increasing the
traffic-load on the network. This shows that the proactive scheme while intuitively desirable
appears to be extremely detrimental to global network welfare.
Direct Internet Path suffers from outage/ service degradation
One-hop Indirection using an overlay node near a server preferred by ’Akamai’,- to serve content
Servers preferred by Akamai
Servers NOT preferred by Akamai
Overlay hosts
Drafting:Select overlay node near a server ‘preferred’ by Akamai-to serve content
Figure 2.8 ‘Drafting’ behind Akamai servers. One-hop indirection through an overlay node. The overlay node is selected based on preference of Akamai-to serve content from one of its severs.
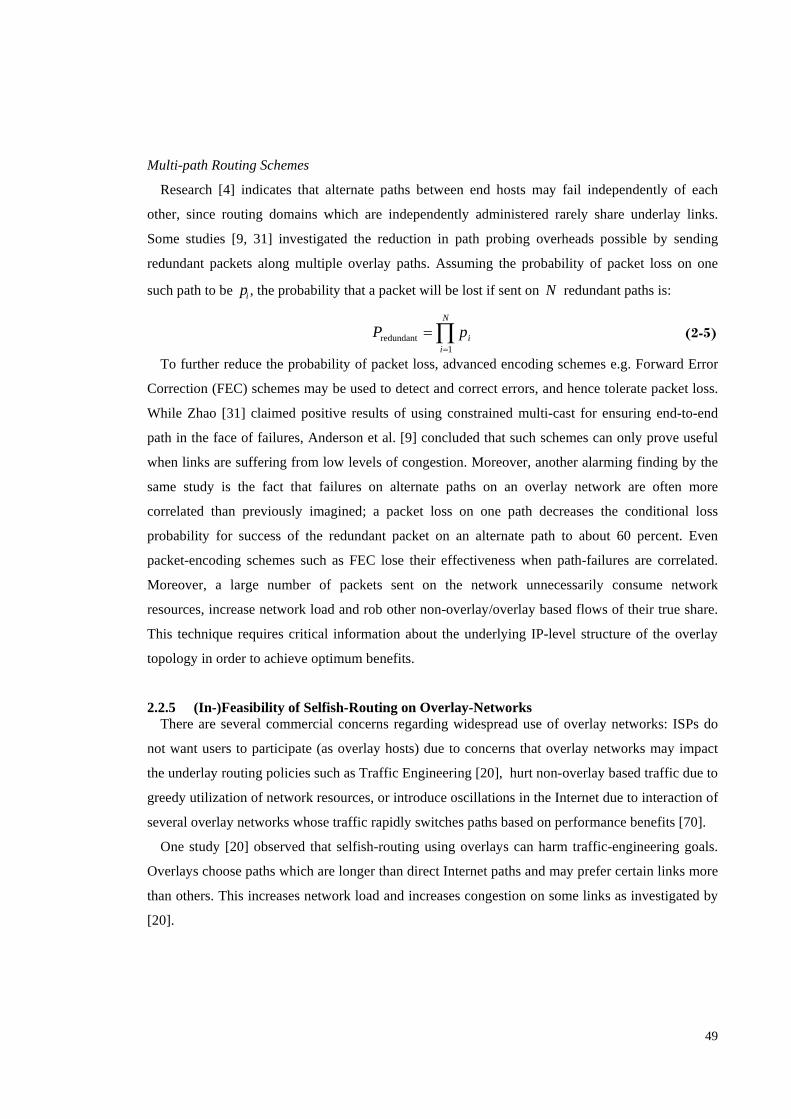
49
Multi-path Routing Schemes
Research [4] indicates that alternate paths between end hosts may fail independently of each
other, since routing domains which are independently administered rarely share underlay links.
Some studies [9, 31] investigated the reduction in path probing overheads possible by sending
redundant packets along multiple overlay paths. Assuming the probability of packet loss on one
such path to be ip , the probability that a packet will be lost if sent on N redundant paths is:
∏=
=N
iipP
1redundant (2-5)
To further reduce the probability of packet loss, advanced encoding schemes e.g. Forward Error
Correction (FEC) schemes may be used to detect and correct errors, and hence tolerate packet loss.
While Zhao [31] claimed positive results of using constrained multi-cast for ensuring end-to-end
path in the face of failures, Anderson et al. [9] concluded that such schemes can only prove useful
when links are suffering from low levels of congestion. Moreover, another alarming finding by the
same study is the fact that failures on alternate paths on an overlay network are often more
correlated than previously imagined; a packet loss on one path decreases the conditional loss
probability for success of the redundant packet on an alternate path to about 60 percent. Even
packet-encoding schemes such as FEC lose their effectiveness when path-failures are correlated.
Moreover, a large number of packets sent on the network unnecessarily consume network
resources, increase network load and rob other non-overlay/overlay based flows of their true share.
This technique requires critical information about the underlying IP-level structure of the overlay
topology in order to achieve optimum benefits.
2.2.5 (In-)Feasibility of Selfish-Routing on Overlay-Networks There are several commercial concerns regarding widespread use of overlay networks: ISPs do
not want users to participate (as overlay hosts) due to concerns that overlay networks may impact
the underlay routing policies such as Traffic Engineering [20], hurt non-overlay based traffic due to
greedy utilization of network resources, or introduce oscillations in the Internet due to interaction of
several overlay networks whose traffic rapidly switches paths based on performance benefits [70].
One study [20] observed that selfish-routing using overlays can harm traffic-engineering goals.
Overlays choose paths which are longer than direct Internet paths and may prefer certain links more
than others. This increases network load and increases congestion on some links as investigated by
[20].
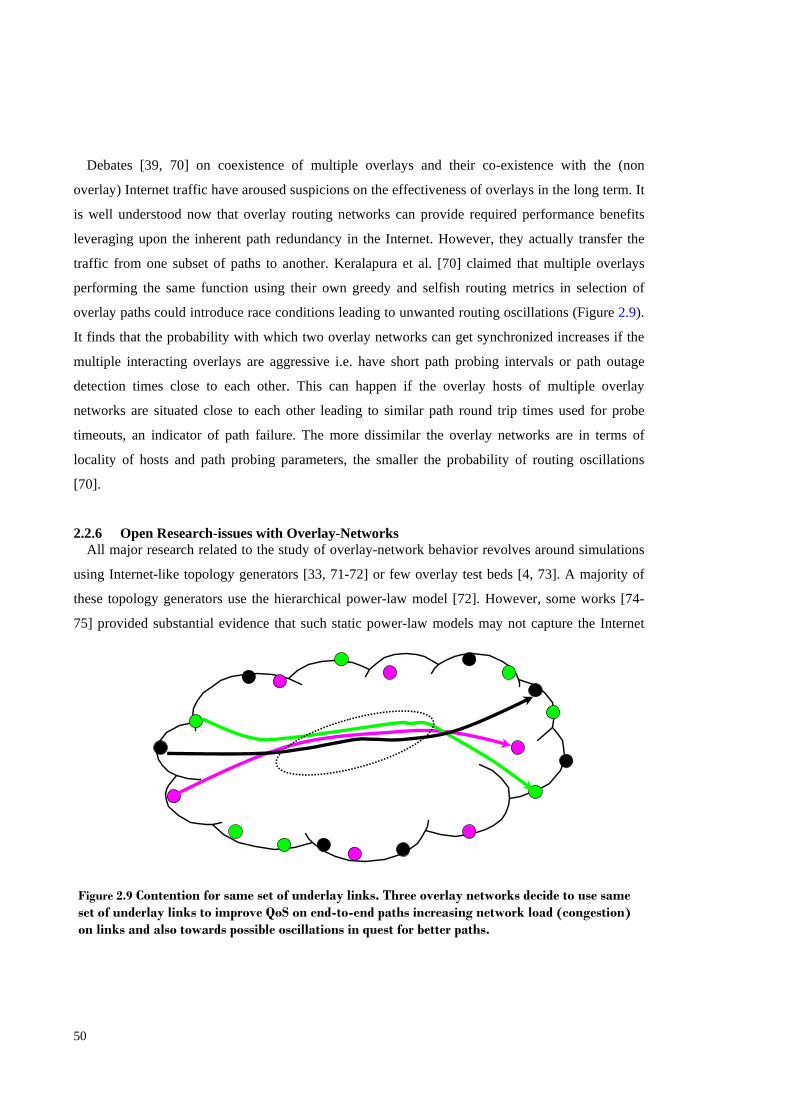
50
Debates [39, 70] on coexistence of multiple overlays and their co-existence with the (non
overlay) Internet traffic have aroused suspicions on the effectiveness of overlays in the long term. It
is well understood now that overlay routing networks can provide required performance benefits
leveraging upon the inherent path redundancy in the Internet. However, they actually transfer the
traffic from one subset of paths to another. Keralapura et al. [70] claimed that multiple overlays
performing the same function using their own greedy and selfish routing metrics in selection of
overlay paths could introduce race conditions leading to unwanted routing oscillations (Figure 2.9).
It finds that the probability with which two overlay networks can get synchronized increases if the
multiple interacting overlays are aggressive i.e. have short path probing intervals or path outage
detection times close to each other. This can happen if the overlay hosts of multiple overlay
networks are situated close to each other leading to similar path round trip times used for probe
timeouts, an indicator of path failure. The more dissimilar the overlay networks are in terms of
locality of hosts and path probing parameters, the smaller the probability of routing oscillations
[70].
2.2.6 Open Research-issues with Overlay-Networks All major research related to the study of overlay-network behavior revolves around simulations
using Internet-like topology generators [33, 71-72] or few overlay test beds [4, 73]. A majority of
these topology generators use the hierarchical power-law model [72]. However, some works [74-
75] provided substantial evidence that such static power-law models may not capture the Internet
Figure 2.9 Contention for same set of underlay links. Three overlay networks decide to use same set of underlay links to improve QoS on end-to-end paths increasing network load (congestion) on links and also towards possible oscillations in quest for better paths.
51
topology accurately enough because the Internet evolution is dynamic process shaped by a several
interconnected variables; and thus the results derived from them could potentially be inaccurate and
misleading. For example, Chang et al. [74] showed that Internet-topology arises as a multi-
parameter optimization problem that incorporates AS-geography, AS-specific business-models and
AS evolution-history. Similarly Jaiswal et al. [75] dispel the notion that ASes ranked higher in the
tier-structure always have high connectivity than those in the lower tiers. This thesis uses datasets to
avoid problems from artificial simulated topologies or from testbeds that are too small.
2.3 Proposals To Modify Underlay Routing Mechanisms
2.3.1 Re-Engineering BGP-4 Overlay networks aim to overcome the shortcomings of BGP, leveraging the native path
redundancy present in the Internet. Some studies [76-82] argue that instead of turning to new
avenues for solving problems associated with the shortcomings of the Internet in handling failures
efficiently, BGP-4 could be modified to meet the requirements. Some concerns [2] about delayed
BGP routing-convergence after failures mainly stem from: (i) complicated path exploration through
several paths which already may have been invalidated by a single failure (Figure 2.10a); (ii)
suppression of new route updates [12, 83] to prevent routing oscillations, or “route flapping”. The
authors of a few papers [81, 84], suggest that path-withdrawal or other route-update messages
should be appended with cause-of-failure tags (Figure 2.10b), to simplify path exploration by
invalidating all defunct routes; Similarly Bremler-Barr et al. [77] proposed that in the event of
failure, path-withdrawal messages can be expedited in the whole network to rid the network of
unreachable routes to speed up convergence.

52
Subramanium et al. [12] proposed a Hybrid Link-state Path-vector (HLP) protocol by proposing
several architectural design changes to BGP to counter its churning issues. HLP uses a hierarchical-
approach instead of the flat-architecture of BGP; the network is divided into several domains and
sub-domains; each sub-domain uses a link-state protocol which has much better convergence
properties than path-vector protocols. The sub-domains then use a path-vector protocol to
disseminate the routing information amongst themselves. HLP also specifies a routing granularity
based on AS-level rather than the IP-prefix level used by BGP. The paper shows that by adopting
BGP speakers
Destination
Source
On detecting failure try alternate paths one by one
BGP speakers
Destination
Source
Routes invalidated by failure (dashed)
Route Withdrawal messages,
appended with cause-of-failure tags
Figure 2.10 (a) (top) A single link-failure invalidates several valid routes (shown by bold arrows). (b) Appending path-withdrawal messages with ‘cause-of-failure’ tags help eliminate all invalid routes quickly and converge to valid route quickly
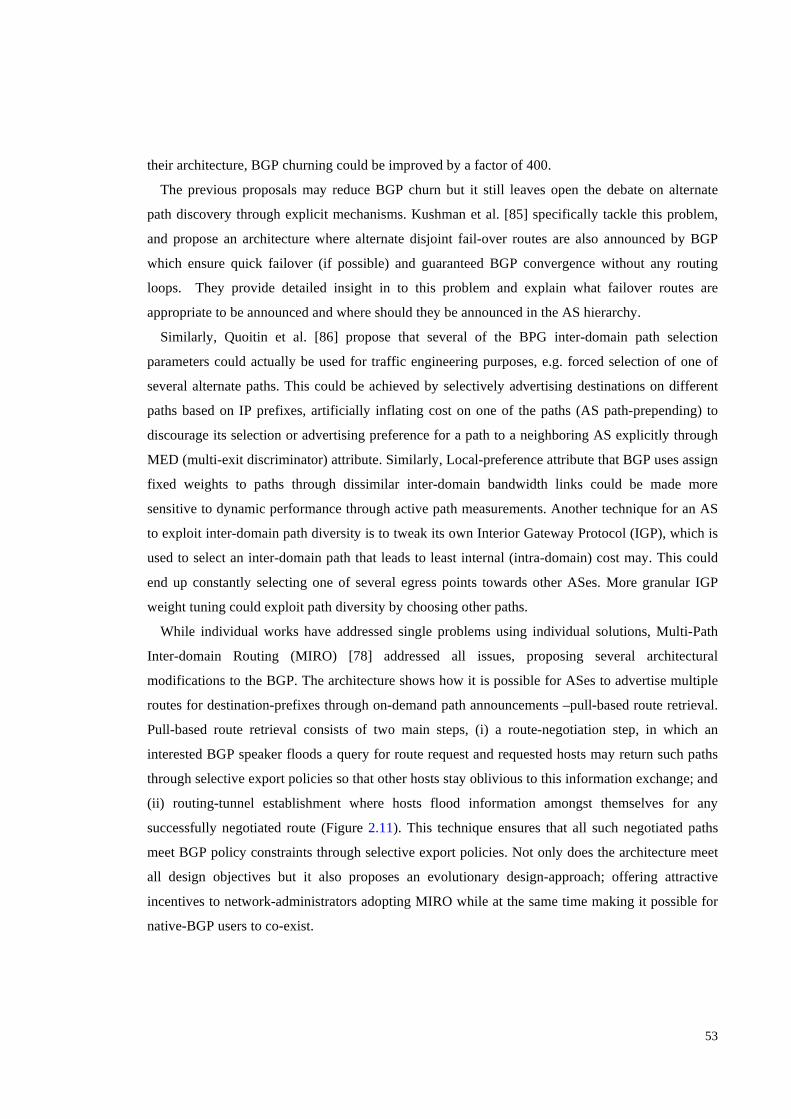
53
their architecture, BGP churning could be improved by a factor of 400.
The previous proposals may reduce BGP churn but it still leaves open the debate on alternate
path discovery through explicit mechanisms. Kushman et al. [85] specifically tackle this problem,
and propose an architecture where alternate disjoint fail-over routes are also announced by BGP
which ensure quick failover (if possible) and guaranteed BGP convergence without any routing
loops. They provide detailed insight in to this problem and explain what failover routes are
appropriate to be announced and where should they be announced in the AS hierarchy.
Similarly, Quoitin et al. [86] propose that several of the BPG inter-domain path selection
parameters could actually be used for traffic engineering purposes, e.g. forced selection of one of
several alternate paths. This could be achieved by selectively advertising destinations on different
paths based on IP prefixes, artificially inflating cost on one of the paths (AS path-prepending) to
discourage its selection or advertising preference for a path to a neighboring AS explicitly through
MED (multi-exit discriminator) attribute. Similarly, Local-preference attribute that BGP uses assign
fixed weights to paths through dissimilar inter-domain bandwidth links could be made more
sensitive to dynamic performance through active path measurements. Another technique for an AS
to exploit inter-domain path diversity is to tweak its own Interior Gateway Protocol (IGP), which is
used to select an inter-domain path that leads to least internal (intra-domain) cost may. This could
end up constantly selecting one of several egress points towards other ASes. More granular IGP
weight tuning could exploit path diversity by choosing other paths.
While individual works have addressed single problems using individual solutions, Multi-Path
Inter-domain Routing (MIRO) [78] addressed all issues, proposing several architectural
modifications to the BGP. The architecture shows how it is possible for ASes to advertise multiple
routes for destination-prefixes through on-demand path announcements –pull-based route retrieval.
Pull-based route retrieval consists of two main steps, (i) a route-negotiation step, in which an
interested BGP speaker floods a query for route request and requested hosts may return such paths
through selective export policies so that other hosts stay oblivious to this information exchange; and
(ii) routing-tunnel establishment where hosts flood information amongst themselves for any
successfully negotiated route (Figure 2.11). This technique ensures that all such negotiated paths
meet BGP policy constraints through selective export policies. Not only does the architecture meet
all design objectives but it also proposes an evolutionary design-approach; offering attractive
incentives to network-administrators adopting MIRO while at the same time making it possible for
native-BGP users to co-exist.
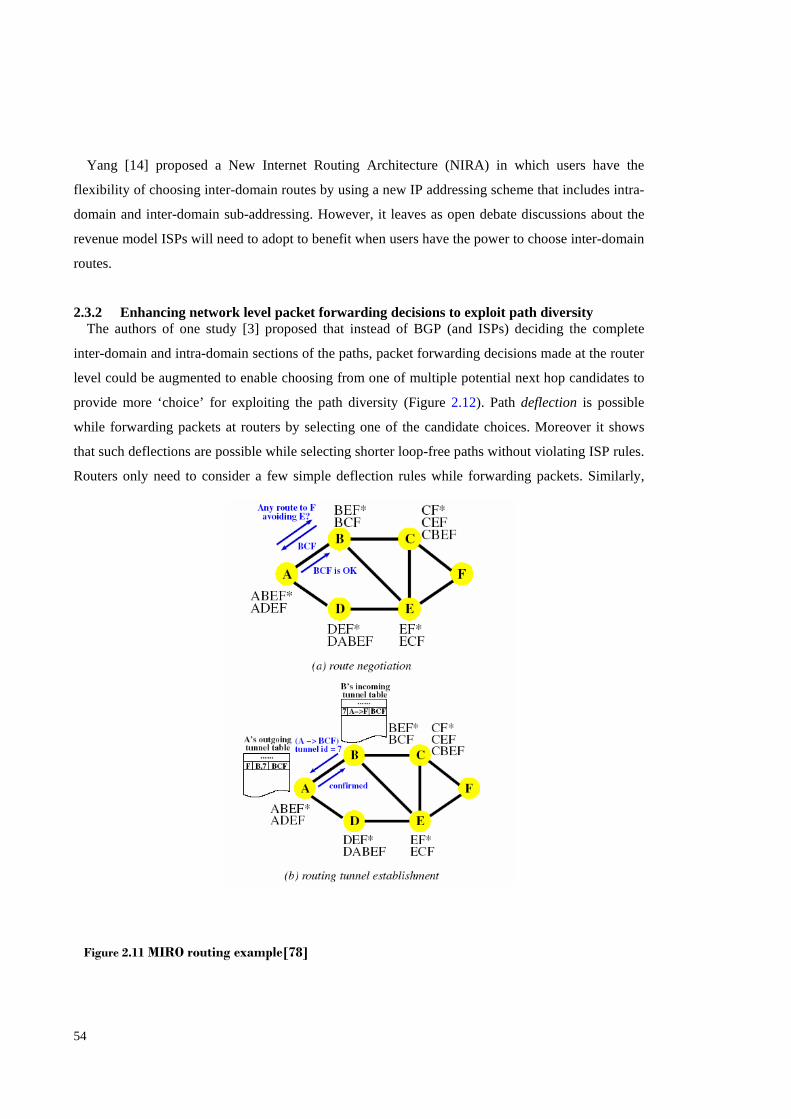
54
Yang [14] proposed a New Internet Routing Architecture (NIRA) in which users have the
flexibility of choosing inter-domain routes by using a new IP addressing scheme that includes intra-
domain and inter-domain sub-addressing. However, it leaves as open debate discussions about the
revenue model ISPs will need to adopt to benefit when users have the power to choose inter-domain
routes.
2.3.2 Enhancing network level packet forwarding decisions to exploit path diversity The authors of one study [3] proposed that instead of BGP (and ISPs) deciding the complete
inter-domain and intra-domain sections of the paths, packet forwarding decisions made at the router
level could be augmented to enable choosing from one of multiple potential next hop candidates to
provide more ‘choice’ for exploiting the path diversity (Figure 2.12). Path deflection is possible
while forwarding packets at routers by selecting one of the candidate choices. Moreover it shows
that such deflections are possible while selecting shorter loop-free paths without violating ISP rules.
Routers only need to consider a few simple deflection rules while forwarding packets. Similarly,
Figure 2.11 MIRO routing example[78]
55
Motiwala et al. [87] proposed path splicing where the main underlying idea is that instead of
deciding upon packet deflection hop wise, a more scalable approach would be to do it at the
granularity of path segments and allow traffic to switch paths at intermediate hops. Such (alternate)
path segments are often known but not used, e.g. BGP records multiple paths between two points
but selects only one based on routing policies. For other protocols, e.g. OSPF, IGRP etc, which
recompute new paths after a failure, multiple paths could be recorded by running multiple instances
of the routing protocol after altering network parameters used for path computation, e.g. by slightly
perturbing link costs. Both of these techniques require packets to be encoded by a shim-header (in
between the network and transport header) in order to inform path deflection decisions which
potentially incurs non-negligible packet processing overhead. These questions are left as an open
debate by these studies [3, 87], and hence scalability of such techniques needs to be investigated.
Also, such studies so far have only investigated the feasibility of exploiting path diversity in few
large ISPs, e.g. Sprint and Abilene, where their results for path diversity might be exaggerated. Its
practical benefits and deployment issues over the wide area Internet are still a challenge when we
consider that due to the power-law structure, there is a large degree of link sharing amongst paths
[8, 21, 33, 72] indicating that there may not be as many path deflection choices as the studies
indicate.
ISP AISP B
ISP CISP D
src
dst
Figure 2.12 Path deflection decision made at router level can exploit the path diversity in the underlay network
56
2.3.3 Fast Re-Route (FRR) construction to reduce failover times The previous section dealt with exploiting path diversity by adding flexibility to routers in
forwarding packets; e.g. by adding randomization in selecting a next hop neighbor to forward the
packet to. This may help in exploring alternate paths but still it does not address the issue if those
alternate paths would be disjoint from the native route thus effectively bypassing the failed element
(link/router). This issue can be addressed by knowing the topological diversity of the paths and pre-
computing all possible alternate paths that allow bypassing of the failed elements. This technique is
known as FRR (Fast Re-Route) construction [88]. This method is aimed for quick recovery from
faults through pre-computed failover paths.
Shand and Bryant [88] highlight several key challenges in FRR construction for purely IP
networks. The first is how to choose such failover paths which can be utilized by the router first
detecting the fault without consulting its neighbors or waiting for the protocol (e.g. IGP) to
converge towards newer paths based on the topology change reflecting the fault and the
computational complexity of computing such paths without overloading routers. The question is
then, how to achieve an optimal tradeoffs between the two.
Such FRR techniques can be implemented at both intra-domain level (IP-FRR for IGP) as well as
inter-domain level (MPLS-FRR) (Francois and Bonaventure [89]).
IP-FRR for IGP
Link state protocols (e.g. OSPF/ IS-IS) used as IGPs (Interior Gateway Protocols) converge much
faster than BGP – a path vector based protocol owing to the small scale of network. Recovery times
of sub 200ms are not uncommon [89]. Such small delays often go unnoticed even by VoIP
customers demanding quick failover times. Interestingly, a majority of this hundreds of
milliseconds time period is not spend on detection of failure, flooding new routing information
(updates) and recomputing routing information but in loading the revised forwarding tables into the
router’s Forwarding Information Base (FIB) [88]. Having pre-computed alternate path information,
which avoid failed components can definitely help in quick recovery.
Failover paths inside a domain are considered so that individual routers can try to try alternate
paths instead of waiting to send/received routing updates to/from neighboring routers. For example,
routers could identify Shared Risk Link Groups (SRLGs) , i.e. a set of links that fail together owing
to a physical commonality between them e.g. adjacent to the same router. Various proposals have
been made for selecting such paths which include: Equal Cost Multi-Paths (ECMP), loop-free
alternate paths or multi-hop repair paths [88]. ECMPs are paths that do not traverse the failure
while loop-free alternate paths are established through a direct neighbor of a router adjacent to the
failure. Multi-hop paths are more complex to compute. Such paths cannot be often
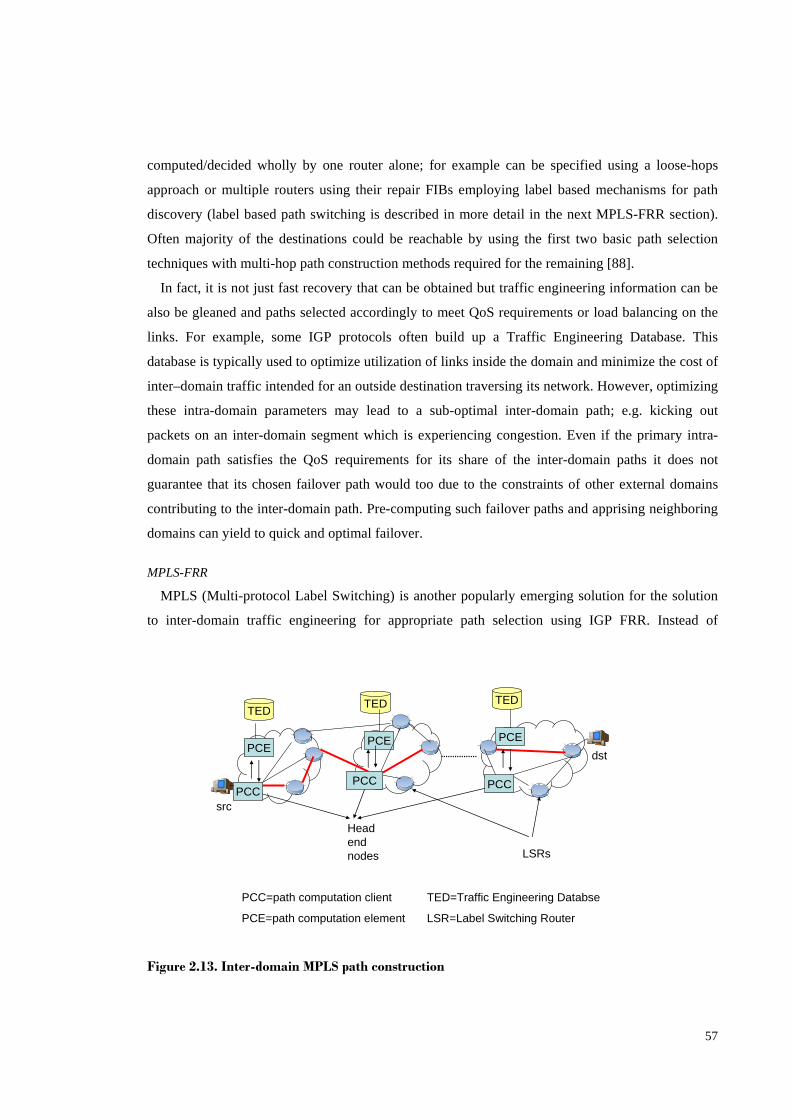
57
computed/decided wholly by one router alone; for example can be specified using a loose-hops
approach or multiple routers using their repair FIBs employing label based mechanisms for path
discovery (label based path switching is described in more detail in the next MPLS-FRR section).
Often majority of the destinations could be reachable by using the first two basic path selection
techniques with multi-hop path construction methods required for the remaining [88].
In fact, it is not just fast recovery that can be obtained but traffic engineering information can be
also be gleaned and paths selected accordingly to meet QoS requirements or load balancing on the
links. For example, some IGP protocols often build up a Traffic Engineering Database. This
database is typically used to optimize utilization of links inside the domain and minimize the cost of
inter–domain traffic intended for an outside destination traversing its network. However, optimizing
these intra-domain parameters may lead to a sub-optimal inter-domain path; e.g. kicking out
packets on an inter-domain segment which is experiencing congestion. Even if the primary intra-
domain path satisfies the QoS requirements for its share of the inter-domain paths it does not
guarantee that its chosen failover path would too due to the constraints of other external domains
contributing to the inter-domain path. Pre-computing such failover paths and apprising neighboring
domains can yield to quick and optimal failover.
MPLS-FRR
MPLS (Multi-protocol Label Switching) is another popularly emerging solution for the solution
to inter-domain traffic engineering for appropriate path selection using IGP FRR. Instead of
PCE PCE PCE
Head end nodes
TED TEDTED
src
dst
PCCPCC PCC
LSRs
PCC=path computation client TED=Traffic Engineering Databse
PCE=path computation element LSR=Label Switching Router Figure 2.13. Inter-domain MPLS path construction
58
switching (routing) packets at network layer based on the inspection of destination addresses, the
routes should be negotiated in the beginning according to the demands of the application. Once
such a path has been found, the negotiated path segments and all packets belonging to the
application are assigned specific labels, and routing takes place on the basis of these labels.
Although, this proposal is nothing new and is similar in concept to previous solutions like ATM
[90], current efforts are now more dedicated towards improving its scalability and extending MPLS
solutions to an inter-domain level.
The proposed technique [91] uses an infra-structure based approach to exploiting path diversity in
accordance with user specified path performance demands (Figure 2.13). A separate entity known
as a Path Computation Element (PCE) [91-92] handles this task. The head end node, also called as
Path Computation Client (PCC) puts a request for a primary (and possible back-up) Label Switched
Path/s (LSP) to the PCE satisfying the user specified path constraints. The PCE responds with the
criteria, the LSRs (Label Switching Routers) should apply to search for the paths. Searching for
paths is somewhat similar to tweaking protocol parameters such as IGP weight tuning (as explained
in the previous section) for exploitation of path diversity inside a domain. Note that not all
implementations of IGP/ISIS may have provision of tuning and PCE may help in such
circumstances. The primary novelty of MPLS-TE is in these three areas: (a) extending these
concepts to an inter-domain level; (b) its approach to consider more dynamic path properties than
just exploiting path diversity and (c) computation of back-up LSPs when primary LSPs fail.
To cater for the extension to inter-domain LSP computation, it incorporates a special crankback
mechanism [91-92]. Put simply, each domain (AS) is responsible for computing a segment of the
LSP using the services of a PCE which would pass though it without revealing its internal structure
or routing policies. Large domains may have more than one PCE. When one of the the Next Hop
(NH) domains (ASes) are unable to find such a path they may refer a failure message to the
adjacent predecessor domain (AS). This message will then be conveyed to the PCE (of this
predecessor domain) which will re-compute path selection criteria so as to exploit different egress
point/s to different NH domain/s (AS). To select path conforming to the required QoS requirement
of the LSP request, the PCE uses TED (traffic engineering database) maintained by IGP/IS-IS
protocols with TE extensions. PCE may also return primary and backup LSPs for failover if
requested.
2.3.4 Open Research-issues with proposals to modify underlay routing mechanisms Proposals to modify underlay routing mechanisms seem attractive at the outset, however, they
pose some challenges. For example, are path deflection decisions as proposed by [3, 87] able to
59
scale well enough at individual packet levels? Other core issues relate to the feasibility of
implementation of the proposed changes to routers to support path deflection decisions. Also, these
studies solve the issue to exploitation of the path diversity of the Internet but a core problem is
monitoring path quality, which has hampered the deployment of large overlay networks due to
scalability concerns. Another area of practical concern is that redesigning underlay routing
mechanisms such as those suggested by [3, 87] including changes to BGP [77, 79-81] exposes
underlay routing to several security vulnerabilities [3]. At present, end systems do not exercise any
control over the paths, their packets would take which are determined solely by the network routers.
Equipping end systems with the power to influence paths may open the network to be comprised by
an adversary or cause breach of commercial traffic transit policies between ISPs causing conflicts
over revenue.
The primary motivation of the MPLS-TE solutions is only to exploit inter-domain path diversity
but also to find paths that fulfill specific QoS requirements. It is based on the premise that
neighboring domains can establish trust for finding such QoS optimized paths. Since, each
individual domain does not have to reveal its internal structure it means that this trust will be weak
unless there is some monetary incentive attached for it to do so. Another related issue is if the
primary LSP fails, each domain may have its own priority to compute a restoration paths that may
not be acceptable to other participating domains [92].
2.4 Multi-Homing Solutions
Multi-homing refers to solutions which allow hosts at the edge or transit providers in the core of
the Internet to maintain redundant connections to the Internet which can be exploited for the
purposes of finding fault tolerance, traffic engineering or optimizing QoS. Thus, multi-homing can
be categorized as of two types: site multi-homing and ISP multi-homing. Figure 2.14 shows an
example of site multi-homing. End-host A which is multi-homed via three distinct ISPs stands a
higher chance of reachability in the event of failures on one of the access links, compared with end-
host B which is single-homed. Site multi-homing is more challenging than ISP multi-homing due
to the scalability issues arising from huge number of Internet hosts when compared with transit
providers. Another challenging issue is to be able to switch paths of longer packet flows so that path
changeover remains transparent to the flow without resetting the connection, i.e. to maintain
transport-layer survivability.

60
Site domain multi-homing can take one of several forms. Host (stub) domains may announce
single/multiple connections to single/multiple ISPs over single/multiple IP addresses [93].
Previously, the approach towards multi-homing was more liberal. Stub domains could acquire
special Provider Independent (PI) addresses from the Regional Internet Registry (RIR). PI
addresses are globally unique IP addresses which are not assigned by transit providers for their
assigned address blocks. For example, if a stub domain multi-homed to two provider network is
assigned a PI address, than it can advertise this to both of its transit providers which will propagate
it to their own upstream providers, where it will reach other parts of the Internet for the dual
connectivity of the host domain.
Using PI addresses was a simple approach to multi-homing. However, this led to scalability
issues together with the problem of depleting IP address space in IPv4. Presently, stub domains are
only allowed to use Provider Aggregatable (PA) address. Stub domains thus consider one of their
immediate provider networks to be their primary ISP and the remaining as secondary. This address
is then advertised to its secondary ISPs. However, this using PA addresses becomes less useful
since, due to scalability issues BGP routers do not accept destination prefixes smaller than /24.
This means although the secondary ISPs would advertise the PA address of the multi-homed site
separately in addition to its own (as it cannot be merged with its own aggregate), the address block
advertised by the primary ISP would be a stronger match for the destination since Internet uses
longest prefix matching when routing to destinations. Thus the primary ISP will be used to connect
to the stub network for inbound packets until there is something wrong with its connection to the
primary ISP when the secondary ISPs will be used to connect to the stub domain. Thus, the
redundant paths cannot be used simultaneously to meet Traffic Engineering (TE) objectives or to
achieve quick failover as dictated by the stub domain as this traditional approach to multi-homing
will again depend on BGP reaction time to provide a failover path. Also, note that even using PI
addresses, introduces one additional routing entry per multi-homed hosts. Huston [94] and Bu et al.
ISP A ISP B ISP C
Core
(Tier-1 ISPs)
A B
Figure 2.14 Single-homing Vs Multi-homing.

61
[95] note that the number of BGP routing entries in the Internet increased by an order of magnitude
between 1995 and 2005.
Many new proposals have been considered by the research community for multi-homing in IPv6
as surveyed by De Launois and Bagnulo [96], learning from the mistakes and shortcomings of
multi-homing approaches in IPv4, namely to provide fault tolerance, traffic engineering, router
aggregation and multi-homing independence. These include: middle box tunneling approaches
through use of NAT or MHTP (Multi-homing Translation Protocol) boxes which convert PA
addresses to PI addresses and newer transport protocols like SCTP, TCP-MH and DCCP [97] that
enable using multiple IP addresses associated with multi-homed hosts to ensure transport layer
survivability.
2.4.1 Open Research-issues with Multi-homing
While multi-homing can improve availability at the edge of the Internet, overlay networks can
also improve availability within the core as well as improving the performance of end-to-end paths.
Effective multi-homing only requires that the customer network be reachable through two or more
topologically diverse ISPs so that it can connect to the outside ‘world’ with reasonable assurance.
Akella et al. [10] and Tao et al. [98] considered performance using key path metrics, delay (RTT),
loss-rate and throughput when edge hosts are multi-homed via multiple providers and also have
choice a of overlay paths when the direct-path undergoes degradation. The results from such studies
may be somewhat biased as they report the results from ISPs which gave best results across all
destinations considered. Akella et al. [10] reported that the performance-advantage is 20-40% for
delay and 15-25% for throughput, when the edge host is multi-homed via three providers;
increasing the number of providers beyond three results in marginal benefits. The same study [10]
however, also concluded that multi-homing has only limited benefits compared to when end-hosts
have a choice of overlay paths between them. This is because end-to-end path diversity in the core
of the Internet can be leveraged effectively through use of overlay networks.
Another paper [99], stated similar results when considering the number of shared routers and
underlay links on alternate paths provided by multi-homing solutions, but interestingly also proves
that overlay paths may not offer as much path diversity as previously thought. It reveals that even if
the edge ASes were removed from consideration where overlay links most-likely merge; there are
still many overlay links which share physical routers and links with other overlay links. Randomly
selecting overlay hosts for disjoint backup paths has little probability of success.
Multi-homing provides physical redundancy while working within the BGP framework.
However, multi-homed hosts announce their multiple routes within the BGP framework through
announcements of routes using different upstream-provider ISPs. Multi-homing has been blamed as
62
one of the leading factors for the exponential increase in the size of BGP routing tables since 1999
[95, 100]. Multi-homing creates ‘holes’ in the routing table [95] because certain subsets of IP sub-
blocks already contained within the prefix set of one of its providers of a multi-homed AS are
announced again by one of the multi-homed AS’s providers for the purpose of fault tolerance.
2.5 Chapter Summary In this chapter we provided a rigorous literature review discussing the three main approaches for
providing QoS to end users; namely overlay network approaches, proposals to modify the underlay
routing mechanism and multi-homing. Although the main aim of all three is identification of a path
anomaly and switching over to better alternate paths, their implementation methods differ. Multi-
homing has limited benefits and proposals to modify underlay routing mechanisms are still in
infancy requiring the efforts of the broader community. This leaves overlay networks as the
promising area to tap into the path diversity of the Internet. This thesis also looks into two core
issues, namely the selection of disjoint paths and reducing path monitoring overheads by exploiting
overlay topology information and overcoming challenges posed when such information is not
available or is inaccurate.
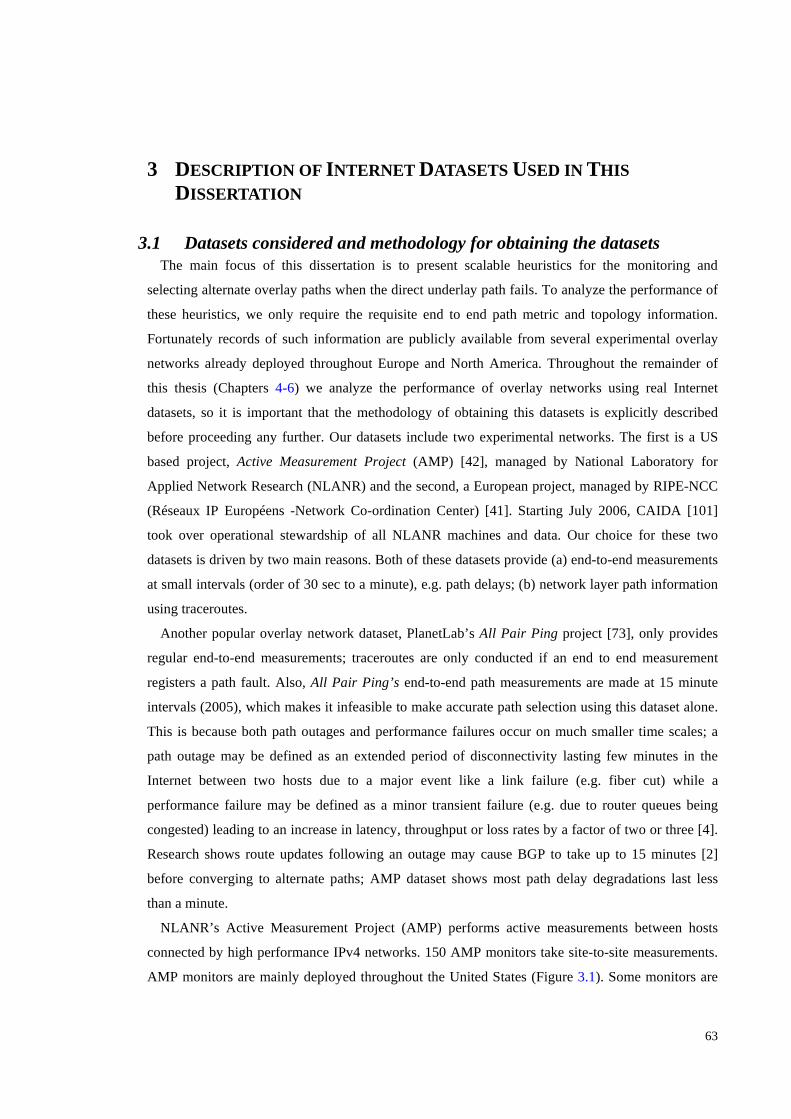
63
3 DESCRIPTION OF INTERNET DATASETS USED IN THIS DISSERTATION
3.1 Datasets considered and methodology for obtaining the datasets The main focus of this dissertation is to present scalable heuristics for the monitoring and
selecting alternate overlay paths when the direct underlay path fails. To analyze the performance of
these heuristics, we only require the requisite end to end path metric and topology information.
Fortunately records of such information are publicly available from several experimental overlay
networks already deployed throughout Europe and North America. Throughout the remainder of
this thesis (Chapters 4-6) we analyze the performance of overlay networks using real Internet
datasets, so it is important that the methodology of obtaining this datasets is explicitly described
before proceeding any further. Our datasets include two experimental networks. The first is a US
based project, Active Measurement Project (AMP) [42], managed by National Laboratory for
Applied Network Research (NLANR) and the second, a European project, managed by RIPE-NCC
(Réseaux IP Européens -Network Co-ordination Center) [41]. Starting July 2006, CAIDA [101]
took over operational stewardship of all NLANR machines and data. Our choice for these two
datasets is driven by two main reasons. Both of these datasets provide (a) end-to-end measurements
at small intervals (order of 30 sec to a minute), e.g. path delays; (b) network layer path information
using traceroutes.
Another popular overlay network dataset, PlanetLab’s All Pair Ping project [73], only provides
regular end-to-end measurements; traceroutes are only conducted if an end to end measurement
registers a path fault. Also, All Pair Ping’s end-to-end path measurements are made at 15 minute
intervals (2005), which makes it infeasible to make accurate path selection using this dataset alone.
This is because both path outages and performance failures occur on much smaller time scales; a
path outage may be defined as an extended period of disconnectivity lasting few minutes in the
Internet between two hosts due to a major event like a link failure (e.g. fiber cut) while a
performance failure may be defined as a minor transient failure (e.g. due to router queues being
congested) leading to an increase in latency, throughput or loss rates by a factor of two or three [4].
Research shows route updates following an outage may cause BGP to take up to 15 minutes [2]
before converging to alternate paths; AMP dataset shows most path delay degradations last less
than a minute.
NLANR’s Active Measurement Project (AMP) performs active measurements between hosts
connected by high performance IPv4 networks. 150 AMP monitors take site-to-site measurements.
AMP monitors are mainly deployed throughout the United States (Figure 3.1). Some monitors are
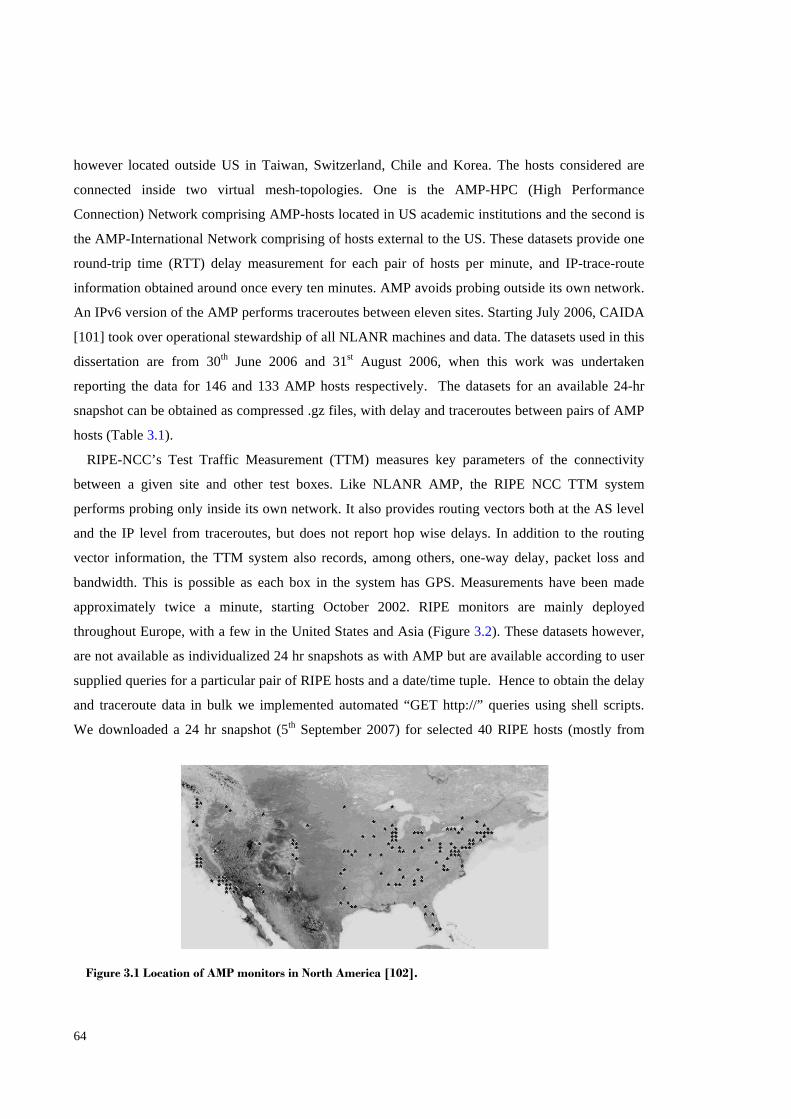
64
however located outside US in Taiwan, Switzerland, Chile and Korea. The hosts considered are
connected inside two virtual mesh-topologies. One is the AMP-HPC (High Performance
Connection) Network comprising AMP-hosts located in US academic institutions and the second is
the AMP-International Network comprising of hosts external to the US. These datasets provide one
round-trip time (RTT) delay measurement for each pair of hosts per minute, and IP-trace-route
information obtained around once every ten minutes. AMP avoids probing outside its own network.
An IPv6 version of the AMP performs traceroutes between eleven sites. Starting July 2006, CAIDA
[101] took over operational stewardship of all NLANR machines and data. The datasets used in this
dissertation are from 30th June 2006 and 31st August 2006, when this work was undertaken
reporting the data for 146 and 133 AMP hosts respectively. The datasets for an available 24-hr
snapshot can be obtained as compressed .gz files, with delay and traceroutes between pairs of AMP
hosts (Table 3.1).
RIPE-NCC’s Test Traffic Measurement (TTM) measures key parameters of the connectivity
between a given site and other test boxes. Like NLANR AMP, the RIPE NCC TTM system
performs probing only inside its own network. It also provides routing vectors both at the AS level
and the IP level from traceroutes, but does not report hop wise delays. In addition to the routing
vector information, the TTM system also records, among others, one-way delay, packet loss and
bandwidth. This is possible as each box in the system has GPS. Measurements have been made
approximately twice a minute, starting October 2002. RIPE monitors are mainly deployed
throughout Europe, with a few in the United States and Asia (Figure 3.2). These datasets however,
are not available as individualized 24 hr snapshots as with AMP but are available according to user
supplied queries for a particular pair of RIPE hosts and a date/time tuple. Hence to obtain the delay
and traceroute data in bulk we implemented automated “GET http://” queries using shell scripts.
We downloaded a 24 hr snapshot (5th September 2007) for selected 40 RIPE hosts (mostly from
Figure 3.1 Location of AMP monitors in North America [102].
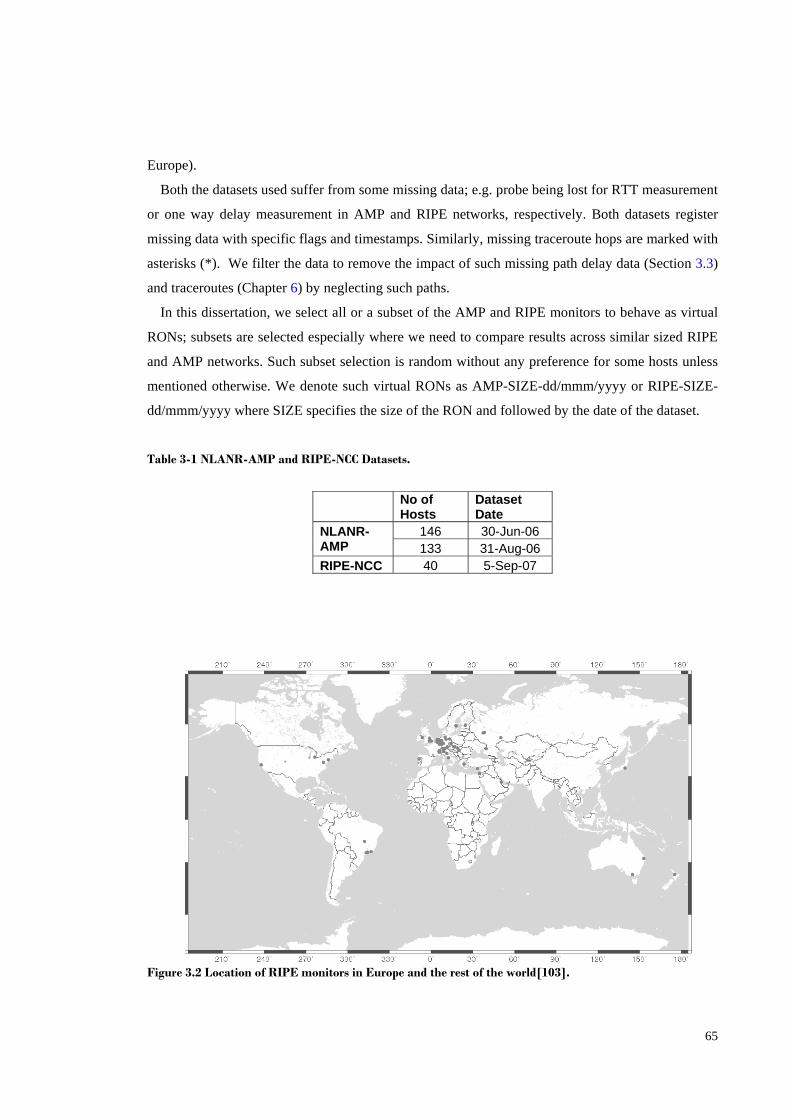
65
Europe).
Both the datasets used suffer from some missing data; e.g. probe being lost for RTT measurement
or one way delay measurement in AMP and RIPE networks, respectively. Both datasets register
missing data with specific flags and timestamps. Similarly, missing traceroute hops are marked with
asterisks (*). We filter the data to remove the impact of such missing path delay data (Section 3.3)
and traceroutes (Chapter 6) by neglecting such paths.
In this dissertation, we select all or a subset of the AMP and RIPE monitors to behave as virtual
RONs; subsets are selected especially where we need to compare results across similar sized RIPE
and AMP networks. Such subset selection is random without any preference for some hosts unless
mentioned otherwise. We denote such virtual RONs as AMP-SIZE-dd/mmm/yyyy or RIPE-SIZE-
dd/mmm/yyyy where SIZE specifies the size of the RON and followed by the date of the dataset.
Table 3-1 NLANR-AMP and RIPE-NCC Datasets.
No of Hosts
Dataset Date
146 30-Jun-06 NLANR-AMP 133 31-Aug-06 RIPE-NCC 40 5-Sep-07
Figure 3.2 Location of RIPE monitors in Europe and the rest of the world[103].
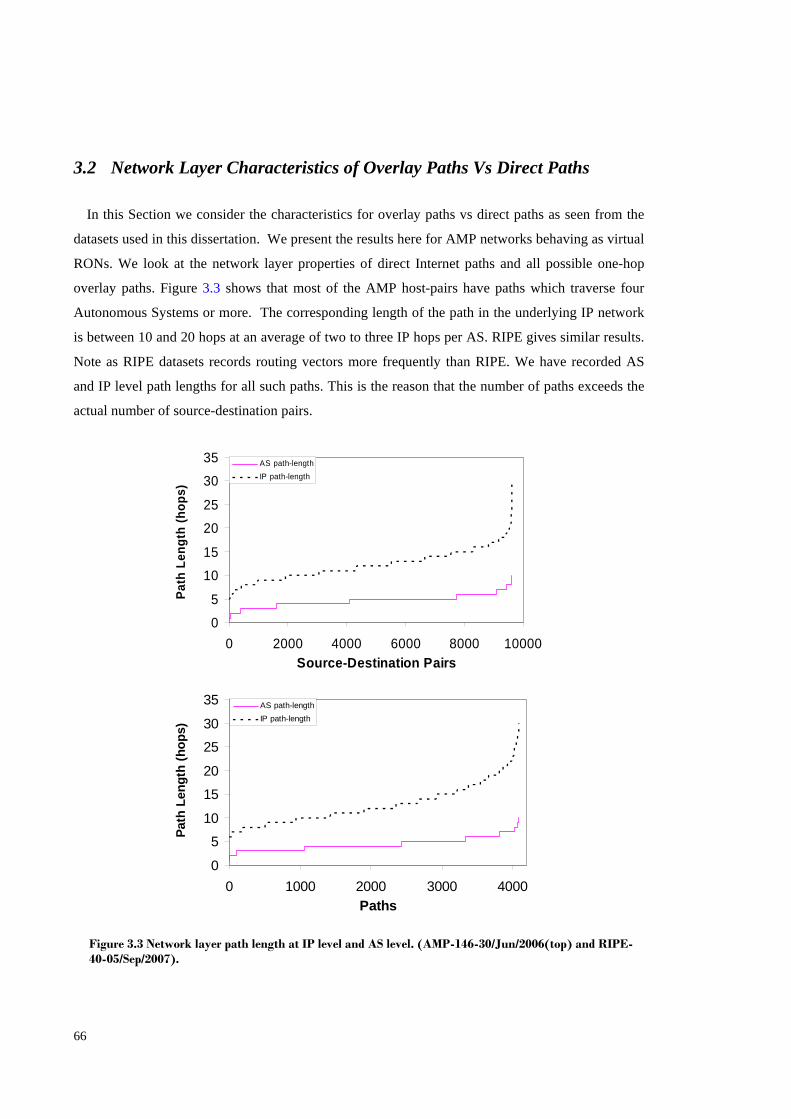
66
3.2 Network Layer Characteristics of Overlay Paths Vs Direct Paths
In this Section we consider the characteristics for overlay paths vs direct paths as seen from the
datasets used in this dissertation. We present the results here for AMP networks behaving as virtual
RONs. We look at the network layer properties of direct Internet paths and all possible one-hop
overlay paths. Figure 3.3 shows that most of the AMP host-pairs have paths which traverse four
Autonomous Systems or more. The corresponding length of the path in the underlying IP network
is between 10 and 20 hops at an average of two to three IP hops per AS. RIPE gives similar results.
Note as RIPE datasets records routing vectors more frequently than RIPE. We have recorded AS
and IP level path lengths for all such paths. This is the reason that the number of paths exceeds the
actual number of source-destination pairs.
0
5
10
15
20
25
30
35
0 2000 4000 6000 8000 10000Source-Destination Pairs
Path
Len
gth
(hop
s)
AS path-lengthIP path-length
0
5
10
15
20
25
30
35
0 1000 2000 3000 4000Paths
Path
Len
gth
(hop
s)
AS path-lengthIP path-length
Figure 3.3 Network layer path length at IP level and AS level. (AMP-146-30/Jun/2006(top) and RIPE-40-05/Sep/2007).
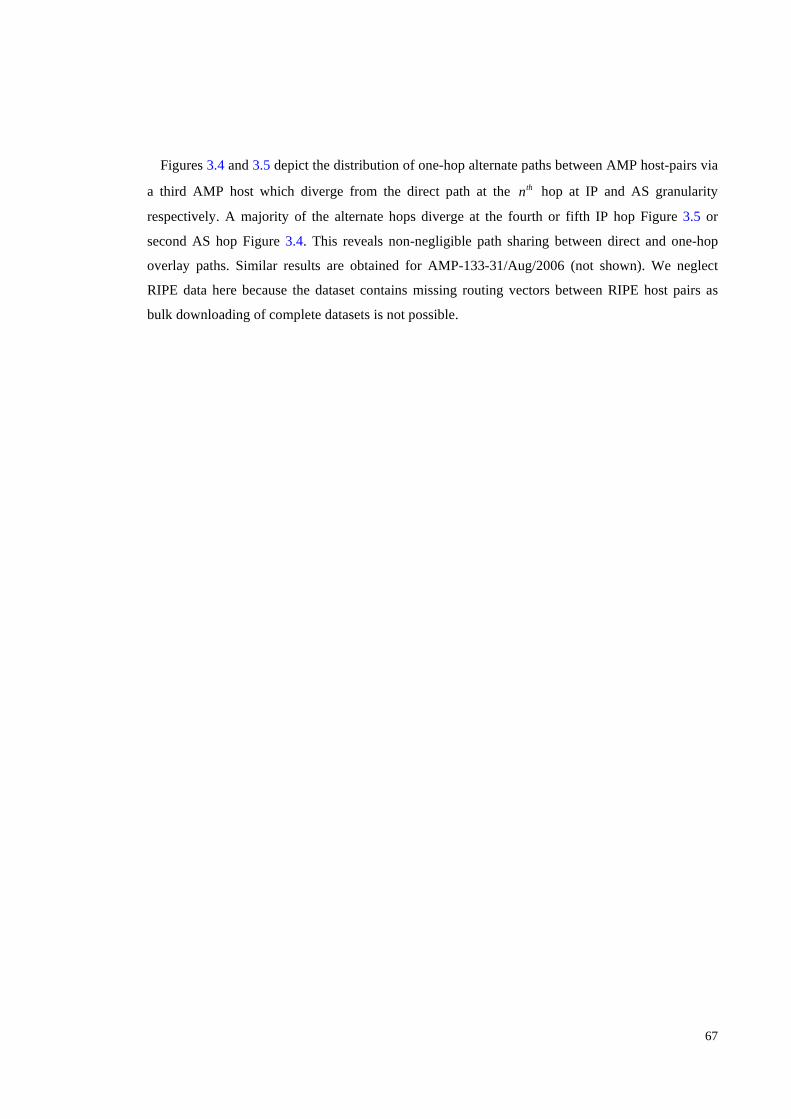
67
Figures 3.4 and 3.5 depict the distribution of one-hop alternate paths between AMP host-pairs via
a third AMP host which diverge from the direct path at the thn hop at IP and AS granularity
respectively. A majority of the alternate hops diverge at the fourth or fifth IP hop Figure 3.5 or
second AS hop Figure 3.4. This reveals non-negligible path sharing between direct and one-hop
overlay paths. Similar results are obtained for AMP-133-31/Aug/2006 (not shown). We neglect
RIPE data here because the dataset contains missing routing vectors between RIPE host pairs as
bulk downloading of complete datasets is not possible.
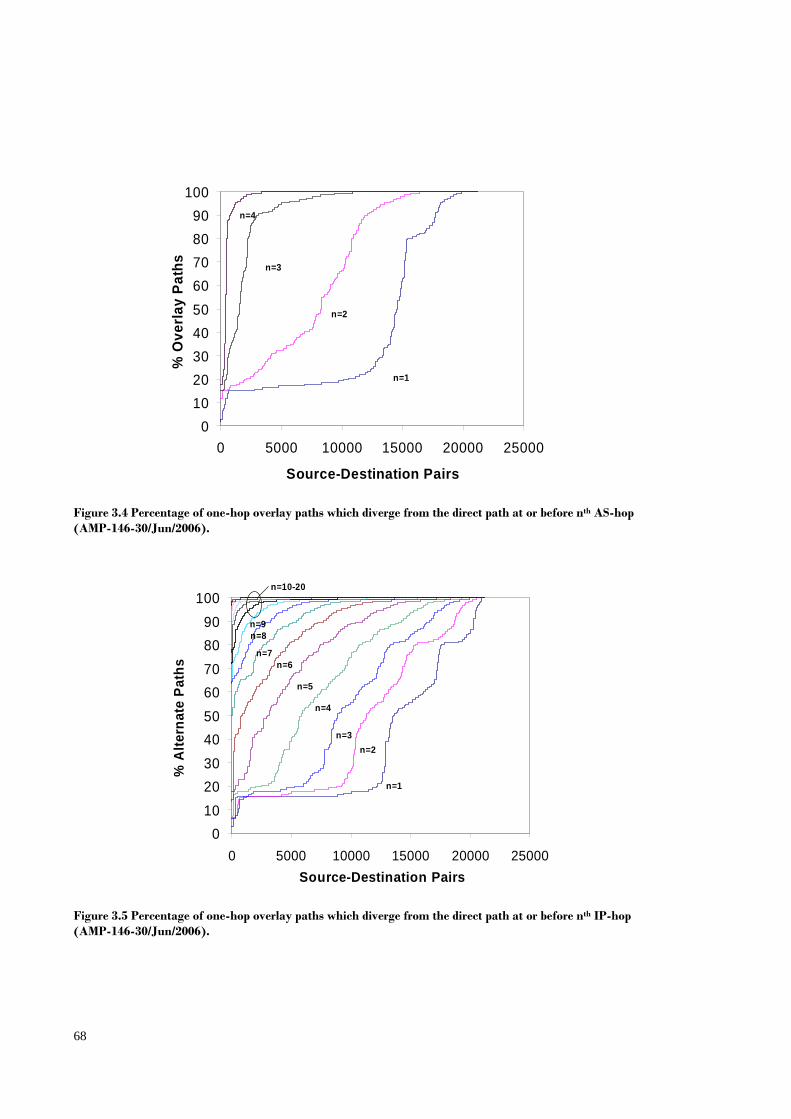
68
0102030405060708090
100
0 5000 10000 15000 20000 25000
Source-Destination Pairs
% O
verla
y Pa
ths
n=1
n=2
n=3
n=4
Figure 3.4 Percentage of one-hop overlay paths which diverge from the direct path at or before nth AS-hop (AMP-146-30/Jun/2006).
0102030405060708090
100
0 5000 10000 15000 20000 25000Source-Destination Pairs
% A
ltern
ate
Path
s
n=1
n=2n=3
n=4
n=5
n=6n=7
n=8n=9
n=10-20
Figure 3.5 Percentage of one-hop overlay paths which diverge from the direct path at or before nth IP-hop (AMP-146-30/Jun/2006).
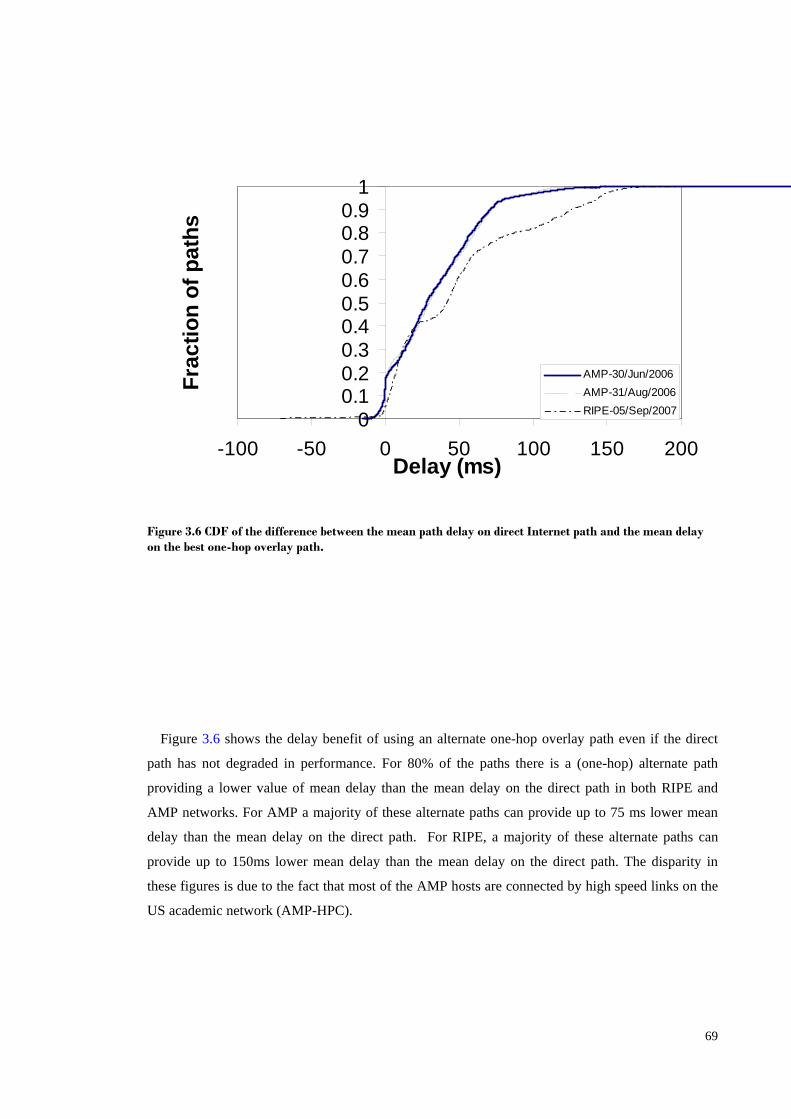
69
Figure 3.6 shows the delay benefit of using an alternate one-hop overlay path even if the direct
path has not degraded in performance. For 80% of the paths there is a (one-hop) alternate path
providing a lower value of mean delay than the mean delay on the direct path in both RIPE and
AMP networks. For AMP a majority of these alternate paths can provide up to 75 ms lower mean
delay than the mean delay on the direct path. For RIPE, a majority of these alternate paths can
provide up to 150ms lower mean delay than the mean delay on the direct path. The disparity in
these figures is due to the fact that most of the AMP hosts are connected by high speed links on the
US academic network (AMP-HPC).
00.10.20.30.40.50.60.70.80.9
1
-100 -50 0 50 100 150 200Delay (ms)
Frac
tion
of p
aths
AMP-30/Jun/2006AMP-31/Aug/2006RIPE-05/Sep/2007
Figure 3.6 CDF of the difference between the mean path delay on direct Internet path and the mean delay on the best one-hop overlay path.
70
3.3 When is the Direct Internet path degraded? The direct path between hosts in the Internet is usually chosen to minimize the number of hops
(both AS and IP), which also often leads to minimizing delay. Hence, using a one-hop overlay path
will usually increase delay, and so only makes sense if the current delay on the direct path is much
more than the expected delay on the overlay paths. However, in some instances the Internet path
itself may be inflated as shown by a previous study [104]. In such cases, a one-hop overlay path
may be likely to provide a lower delay path when the direct Internet path is not actually degraded.
However, using one-hop overlay paths in such manner whenever available can lead to
oscillations/instability as explained in Chapter 2. Hence, we might want to add some hysteresis to
reduce the switching frequency as we explain later.
We use the same definition of a path anomaly as used by [6]. We define an anomaly as occurring
when path metric (delay) exceeds its average value by a factor ( k ) of the standard deviation (σ ) of
the delay values in the previous 60 epochs, one hour for AMP and 30 minutes for RIPE:
σkDelayPathDelayPath average +> (3-1)
where k =1,2,3.. is a tunable parameter to trigger an anomaly for small to large delay variations
with increasing values of k , respectively. These values for k and one-hour window in determining
a path anomaly are typical of those used by Chua et al. [8] and Fei et al. [6]. Chua et al. [8] worked
with the Abilene network; the authors collected their network path delay measurements using
NLANR AMP project measurements since a subset of AMP hosts are from the Abilene network.
Similarly, Fei et al. [6] worked with RIPE dataset. Note that the criteria for flagging a path anomaly
on direct paths does not affect the relative goodness or badness of one-hop overlay paths that will
be chosen to improve performance. Fei et al in [6] conjectured, “…which paths are good alternates
to avoid delay degradations is relatively insensitive to the exact definition of delay degradation”. In
the remainder of this thesis, we refer to particular degradation considered as σk degradations based
on the value of k used. We only select anomalies for which the immediately previous 60 epochs
window do not contain any missing data. We select 3=k to emulate performance failures and
10=k to emulate path outages.
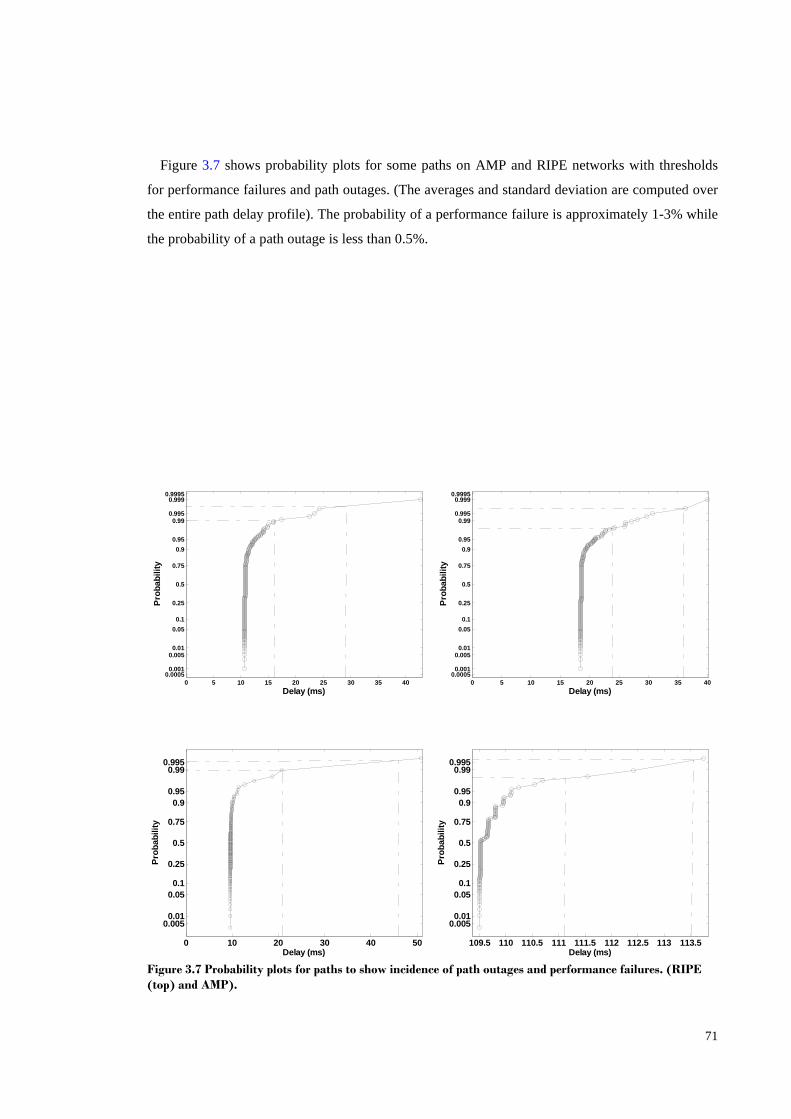
71
Figure 3.7 shows probability plots for some paths on AMP and RIPE networks with thresholds
for performance failures and path outages. (The averages and standard deviation are computed over
the entire path delay profile). The probability of a performance failure is approximately 1-3% while
the probability of a path outage is less than 0.5%.
0 5 10 15 20 25 30 35 400.0005
0.001
0.0050.01
0.050.1
0.25
0.5
0.75
0.90.95
0.990.995
0.9990.9995
Delay (ms)
Prob
abili
ty
0 5 10 15 20 25 30 35 400.0005
0.001
0.0050.01
0.050.1
0.25
0.5
0.75
0.90.95
0.990.995
0.9990.9995
Delay (ms)
Prob
abili
ty
0 10 20 30 40 50
0.0050.01
0.050.1
0.25
0.5
0.75
0.90.95
0.990.995
Delay (ms)
Prob
abili
ty
109.5 110 110.5 111 111.5 112 112.5 113 113.5
0.0050.01
0.050.1
0.25
0.5
0.75
0.90.95
0.990.995
Delay (ms)
Prob
abili
ty
Figure 3.7 Probability plots for paths to show incidence of path outages and performance failures. (RIPE (top) and AMP).

72
73
PART II
SCALABLE HEURISTICS FOR SELECTING DISJOINT PATHS IN OVERLAY NETWORKS

74
75
4 AN ARCHITECTURE FOR SELECTING DISJOINT PATHS- GLOBALLY SCALABLE RON SERVICE
4.1 Introduction In this Chapter, we first provide evidence of path diversity in the Internet at both the IP and AS
level but show that fully edge (or node) disjoint paths are often not possible between end hosts even
using overlay networks. This makes it necessary to choose wisely amongst the available partially
disjoint paths. We then proceed to describe an architecture for a best-effort RON service,
Destination Guided RON (DG-RON); which simplifies the path exploration problem by finding
topologically diverse detours, using small candidate detour sets. We also present three offline
heuristics which complement each other under different spatial distributions of failures in finding
available paths via DG-RON with a high probability. We show that landmark based heuristics can
work well for power-law networks like the Internet for finding topologically diverse alternate paths.
Our analysis using real Internet datasets, shows that it is possible to find alternate paths with a high
probability while incurring low measurement and maintenance overheads.
Before we proceed any further, we give a brief overview of this Chapter. The initial sections
describe some findings which lead to the motivation for developing a scalable architecture of DG-
RON. In Section 4.2, we look at the relationship between overlay network size and the path
diversity it offers. Section 4.3 discusses if some overlay hosts are better than others to mask Internet
path failures. Sections 4.4-4.6 describe the architecture of DG-RON based on these observations. In
Section 4.7 we present scalable landmark based heuristics in selecting an overlay host based on
disjointness criteria. In Section 4.8 we evaluate the performance of the proposed architecture using
trace based simulations using real Internet datasets. Section 4.9 concludes the section by discussing
the findings from this study. Section 4.10 concludes the chapter.
4.2 Relationship between Overlay Network size and path diversity it offers
The Internet topology evolves as a power-law network [72, 105]. In power-law networks, the
outdegree vd of a node v is proportional to the rank of the node vr , to the power of a constant R
i.e. Rvv rd α [105] where vr is the index of a node in a sequence when nodes are sorted in
decreasing outdegree sequence (ties in sorting are broken arbitrarily) and a typical value for R is
8.0− [105]. This means that there is a very small minority of well connected nodes which have a
76
huge outdegree while the majority of the nodes have a very small outdegree. This power law
topology phenomenon is visible in the AS level topology of the Internet; there are a few tier-1 ASes
which alone constitute the majority of the inter-AS links in the Internet [105]. Customer networks
are unit degree ASes (i.e. only connected to their immediate ISPs if not multi-homed) typically
located at the outward fringes of the network with sparse connectivity. We next see the impact of
selecting a small subset of Internet hosts for tapping into this path diversity as opposed to the
billions of hosts possible. Figure 4.1 shows the AS degree distribution of a large number (3828) of
ASes from [106] and the degree distribution of ASes sighted on overlay paths (using traceroutes) in
average sized overlay networks consisting of a few tens to hundreds of AMP hosts. Notice that
when even as few as 20 overlay hosts are selected to comprise an overlay network, the overlay
paths already pass through the largest tier-1 AT&T network (AS 7018 with a degree of 2351). This
shows that even small overlay networks can offer a substantial amount of path diversity provided
the overlay hosts are in diverse ISPs to enable as much connectivity to the tier-1 & 2 networks to
expose them to the AS level path redundancy in the Internet. Physically the ASes comprising the
overlay network contribute to a topology that resembles a micro model of the Internet with a
densely connected core and sparse connectivity at the edges. However, due to the power-law model
of the Internet only a few tier-1 ASes with high connectivity are present; a majority of the customer
networks are stub networks with degree of just one, i.e. only connected to their immediate ISPs
which in turn rely on the large tier-1 and tier-2 ASes for connectivity to different parts (IP blocks)
of the Internet. It is obvious to see as the number of hosts comprising the overlay network would
increase, the network layer topology of the overlay network would tend towards the crude Internet
model depicted in Figure 4.1. From AMP-20 to the crude Internet model, the percentage of ASes
with high degree grows smaller and smaller, a reduction of two orders of magnitude in ASes with
degree greater than 1000. This has the effect of stretching the graph towards the left. Due to the
larger number of hosts in AMP dataset we presented the results for AMP here; RIPE would produce
similar results.
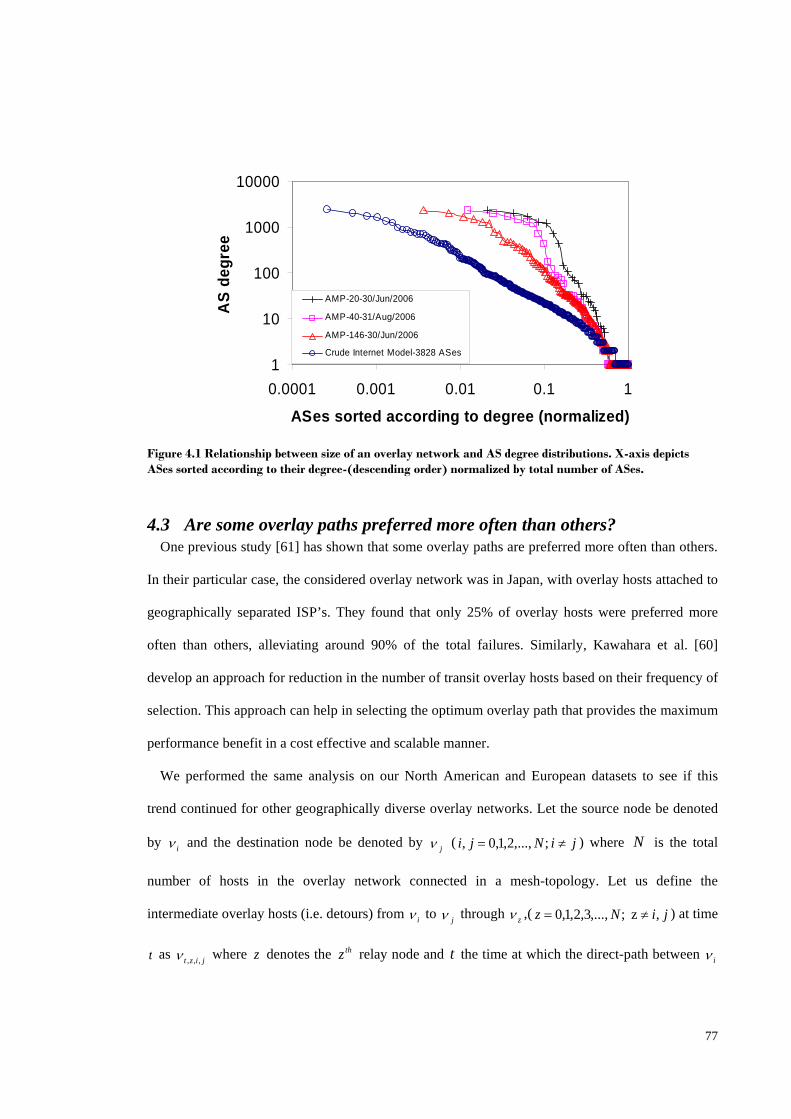
77
4.3 Are some overlay paths preferred more often than others? One previous study [61] has shown that some overlay paths are preferred more often than others.
In their particular case, the considered overlay network was in Japan, with overlay hosts attached to
geographically separated ISP’s. They found that only 25% of overlay hosts were preferred more
often than others, alleviating around 90% of the total failures. Similarly, Kawahara et al. [60]
develop an approach for reduction in the number of transit overlay hosts based on their frequency of
selection. This approach can help in selecting the optimum overlay path that provides the maximum
performance benefit in a cost effective and scalable manner.
We performed the same analysis on our North American and European datasets to see if this
trend continued for other geographically diverse overlay networks. Let the source node be denoted
by iν and the destination node be denoted by jν ( jiNji ≠= ;,...,2,1,0, ) where N is the total
number of hosts in the overlay network connected in a mesh-topology. Let us define the
intermediate overlay hosts (i.e. detours) from iν to jν through zν ,( jiNz ,z ;,...,3,2,1,0 ≠= ) at time
t as jizt ,,,ν where z denotes the thz relay node and t the time at which the direct-path between iν
1
10
100
1000
10000
0.0001 0.001 0.01 0.1 1
ASes sorted according to degree (normalized)
AS
degr
ee
AMP-20-30/Jun/2006
AMP-40-31/Aug/2006
AMP-146-30/Jun/2006
Crude Internet Model-3828 ASes
Figure 4.1 Relationship between size of an overlay network and AS degree distributions. X-axis depicts ASes sorted according to their degree-(descending order) normalized by total number of ASes.
78
and jν becomes degraded according to the criteria explained above. These paths are ranked by
descending order of their delay gain metric as shown below :
pathDirect
path OverlaynpathDirect
Delay
DelayDelayDelaygain
th
−
−− −= (4-1)
where pathDirectDelay − refers to the delay on the direct Internet path between iν and jν and
pathOverlaynthDelay−
refers to the delay on the thn one-hop overlay path between iν and jν through
an intermediate overlay host zν .
We computed the frequency with which a particular AMP or RIPE host in AMP-40 and RIPE-40
respectively, was the best relay node for a source-destination pair whose path was degraded. We
use σ3 degradations for AMP-40-31/Aug/2006 and σ10 degradations for RIPE-40-05/Sep/2007
to emulate performance failures and path outages, respectively, for the results presented next based
on the definition in Eq 3-1, Section 3.2. Similar, values have been used by the authors of [8], for the
Abilene Network. Most AMP hosts considered in this dissertation are from North America, and are
on networks with connection to the Abilene network [8]. Let us define by ),,( jitH = , the set of
those source-destination pairs ),( ji νν whose paths were degraded at time t according to our earlier
definition and denote the frequency of an overlay host node being selected as zf of
zν ),...,2,1,0( Nz = between iν and jν as shown below.
),(,)(
),,(
,,, jizPD
vvIf
Pjit
zjiztz ≠
== ∑
∈
(4-2)
where PD is the total number of path degradations observed during the 24-hr periods the datasets
were collected ( PDH =|| ), and
⎩⎨⎧ ≠=
==otherwise
jizvvifvvI zz,i,jt
zjizt 0
),( 1)( ,
,,, (4-3)
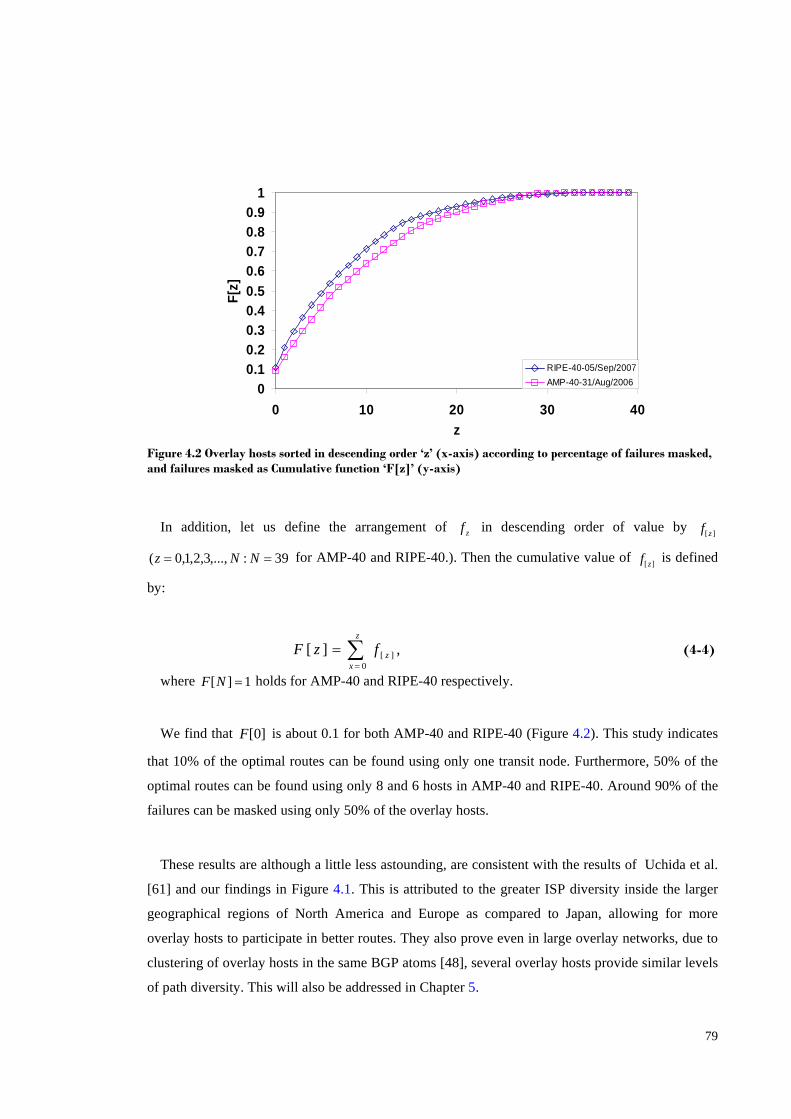
79
In addition, let us define the arrangement of zf in descending order of value by ][ zf
39:,...,3,2,1,0( == NNz for AMP-40 and RIPE-40.). Then the cumulative value of ][ zf is defined
by:
∑=
=z
xzfzF
0][ ,][ (4-4)
where 1][ =NF holds for AMP-40 and RIPE-40 respectively.
We find that ]0[F is about 0.1 for both AMP-40 and RIPE-40 (Figure 4.2). This study indicates
that 10% of the optimal routes can be found using only one transit node. Furthermore, 50% of the
optimal routes can be found using only 8 and 6 hosts in AMP-40 and RIPE-40. Around 90% of the
failures can be masked using only 50% of the overlay hosts.
These results are although a little less astounding, are consistent with the results of Uchida et al.
[61] and our findings in Figure 4.1. This is attributed to the greater ISP diversity inside the larger
geographical regions of North America and Europe as compared to Japan, allowing for more
overlay hosts to participate in better routes. They also prove even in large overlay networks, due to
clustering of overlay hosts in the same BGP atoms [48], several overlay hosts provide similar levels
of path diversity. This will also be addressed in Chapter 5.
00.10.20.30.40.50.60.70.80.9
1
0 10 20 30 40z
F[z]
RIPE-40-05/Sep/2007AMP-40-31/Aug/2006
Figure 4.2 Overlay hosts sorted in descending order ‘z’ (x-axis) according to percentage of failures masked, and failures masked as Cumulative function ‘F[z]’ (y-axis)
80
4.4 DG-RON Clients and Services We assume that DG-RON clients subscribe to the service from the nearest DG-RON edge node
stipulating services required e.g. connectivity to popular destinations but use the services on ‘pay
per use’ basis where packet detouring requests are only made once the default path suffers a
performance or path failure. This is to ensure that overlay based path switching does not affect non-
overlay traffic or cause oscillations by frequently swapping paths for minor performance gains
[107]. We assume that the packet to be routed enters the overlay via its nearest overlay proxy after
encapsulation and departs at another that is chosen by the path selection algorithm.
4.5 Overlay Infrastructure The purpose of a resilient routing overlay is to provide improved connectivity between any two
arbitrary hosts on the underlay network in the face of failures. Such a service should be scalable,
provide satisfactory performance guarantees, be able to handle overlay churn and provide good load
balancing on underlay links. Keeping these global objectives in mind we start with a bottom-up
approach in overlay construction.
BGP has demonstrated the importance of hierarchy for global scalability. We choose to use
architectural hierarchy to meet this objective. The architecture uses n landmarks to divide the
overlay network into n logical zones and at the same time into an n dimensional co-ordinate space
for inter-host distance estimation (Figure 4.3). Each of the landmarks is responsible for the
bootstrapping of new hosts in its own logical zone. Landmark hosts only play a role in forming the
infrastructure of the overlay but do not participate in routing. It must be ensured that the landmarks
are sufficiently spaced apart for accurate distance estimation and binning of hosts. We choose
landmarks based on based on topological diversity (Section 4.8). In our simulations we set n =7,
i.e. 7 landmarks, which results in optimum results for inter-host distance estimation [108-109]. The
landmarks could become a potential performance bottleneck in the system so a single landmark
could actually be a logical abstraction of a group of machines collocated together or in close
proximity of each other [110].
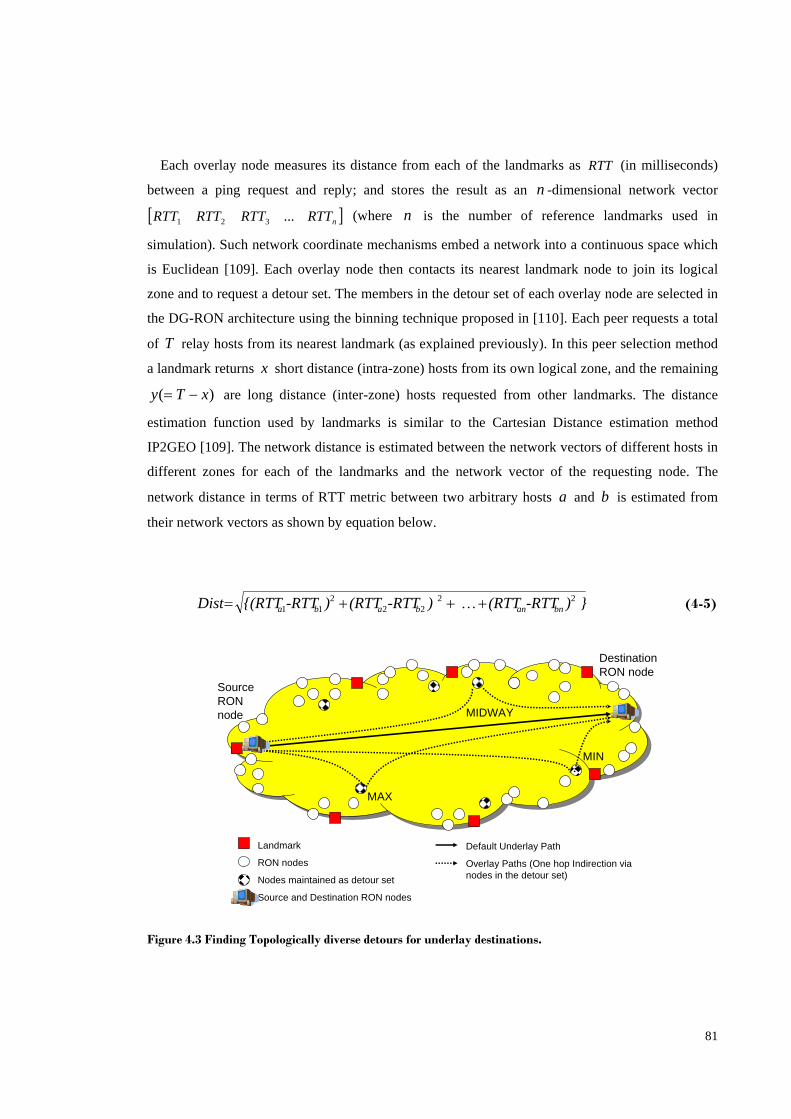
81
Each overlay node measures its distance from each of the landmarks as RTT (in milliseconds)
between a ping request and reply; and stores the result as an n -dimensional network vector
[ ]nRTTRTTRTTRTT ...321 (where n is the number of reference landmarks used in
simulation). Such network coordinate mechanisms embed a network into a continuous space which
is Euclidean [109]. Each overlay node then contacts its nearest landmark node to join its logical
zone and to request a detour set. The members in the detour set of each overlay node are selected in
the DG-RON architecture using the binning technique proposed in [110]. Each peer requests a total
of T relay hosts from its nearest landmark (as explained previously). In this peer selection method
a landmark returns x short distance (intra-zone) hosts from its own logical zone, and the remaining
)( xTy −= are long distance (inter-zone) hosts requested from other landmarks. The distance
estimation function used by landmarks is similar to the Cartesian Distance estimation method
IP2GEO [109]. The network distance is estimated between the network vectors of different hosts in
different zones for each of the landmarks and the network vector of the requesting node. The
network distance in terms of RTT metric between two arbitrary hosts a and b is estimated from
their network vectors as shown by equation below.
})-RTT(RTT ) -RTT(RTT)-RTT{(RTTDist bnanbaba22
222
11 +…++= (4-5)
MAX
MIN
MIDWAY
Landmark
RON nodes
Nodes maintained as detour set
Source and Destination RON nodes
Default Underlay Path
Overlay Paths (One hop Indirection via nodes in the detour set)
Source RON node
Destination RON node
Figure 4.3 Finding Topologically diverse detours for underlay destinations.
82
naRTT an landmark from dsmilliseconin node of time tripround theis where
Selecting relay hosts using the binning heuristic ensures that the overlay connectivity is
maintained and the average routing latency on the overlay is low [110].
4.6 Online Path Selection-Dynamic Path Monitoring To achieve scalability we propose using both online path probing and offline path selection
heuristics. By using a small detour set the path monitoring overheads are reduced from )( 2NO to
constant overheads )(NdO per overlay node where d is the average node degree (the size of the
detour set). Some additional overheads like churning of the overlay network (hosts joining and
departing) also need to be catered for, since this would require reformation of zones, redistribution
of hosts to landmarks and updating to detour sets. However, such events are not very common; the
associated overhead is very low and there are established scalable gossip protocols for this [36, 65].
We propose scalable offline mechanisms to find alternate paths where we do not need to address the
actual composition of the original underlay path suffering from a performance failure event. Once a
peer obtains its detour set from the landmark it probes this detour set only. Instead of probing
aggressively it may used a randomized probing scheme, e.g. monitoring paths that are more prone
to changes (degradations) than others. As we highlighted earlier, the motivation of our design is
scalability at Internet proportions. The randomized probing scheme does not require that overlay
hosts probe aggressively for detection of path outages and failover mechanisms like [4]. If a peer
from the detour set is deemed as failed for a considerable interval then a new peer can be eventually
requested from the landmark. However, in the simulations we do not implement any repairs to the
detour set of the overlay hosts and investigate only the static resilience of the overlay using only the
live members of the detour set. This assumption is reasonable in a real deployment of DG-RON
with non-aggressive probing epochs. The landmark based decentralized architecture eliminates the
need for any information flooding in the network as required in link-state protocols making the
design scalable for large overlay networks. Online link probing techniques such as those used by [4]
are still required for performance measurements to determine dynamic performance; however such
overheads are significantly reduced owing to the distributed architecture.
Overlay links between an overlay peer and hosts in its detour set are monitored for performance
characteristics such as latency, throughput and loss rates. Note that we only probe overlay links to
candidate detours; [32] shows that predicting good detouring nodes can yield acceptable upper-
bounds for end-to-end path metrics. We conjecture that the underlying reason for this is the small
83
probability for many Internet links on spatially diverse paths to undergo congestion at similar times.
Moreover, unlike [32] we can combine disjointness criteria (discussed next) with absolute
performance merits to optimize the selection of candidate detouring nodes. To improve scalability
further, we propose that probing could be replaced by passive monitoring of traffic traversing
overlay links between a peer and its detour set to improve dynamic estimation of path performance
without introducing any probing traffic and subsequent probing overheads. Techniques for both
active network probing and passive traffic monitoring have been studied in the past e.g. [4].
4.7 Offline Path Selection- Landmark Based Heuristics Several papers [4, 16, 32] showed that in most cases a performance failure can be bypassed using
single hop indirection using an overlay node. We use the Maximum Divergence Heuristic to find
such one hop detours, in which the peer chooses the next hop based on the Cartesian distance [108,
111-112] of the destination from the eligible next hop candidate relay hosts. The underlying idea is
similar to the Earliest Divergence Rule (EDR) [6], which aims to select a path which diverges from
the default path near the source and converges near the destination in order to avoid a failed or
congested link. However, EDR assumed the availability of complete AS path information between
the source-destination pair and candidate alternate paths. This is sometimes challenging as this
requires accurate information from non-overlay components e.g. routers. Our architectures only
relies on end to end path metrics which requires only the cooperation of the overlay hosts.
Our divergence criterion is to select with good probability an alternate path that diverges from the
defunct portion of the default path near the location of the failure, e.g. a congested link. Eligibility
of such overlay paths may further be based on underlying network characteristics, e.g. loss rates,
latency or throughput through monitoring (as explained in the next section). We need to capture the
entire spectrum of disjoint paths possible from amongst the detour set overlay hosts. The first
heuristic we use in searching for such divergent paths is MAX , in which we choose an overlay peer
which has the maximum network distance from the destination. The underlying reason for using
MAX is to select with high probability an overlay peer which leads to a topologically diverse
alternate path to reach the destination. We also search for alternate paths using MIN where we use
overlay hosts close to the destination as detours. The underlying heuristic for this rule in contrast to
the previously mentioned MAX rule is the observation of fact that many paths in the Internet
violate the triangle inequality due to routing policies [113]. Thus, it is also possible to find a disjoint
path using a peer in proximity to the destination. Instead of choosing the detours based on their
distance from the destination we could similarly use their distances from the source, since the
underlying idea is to exploit the whole spectrum of available disjoint paths. We refer to the heuristic
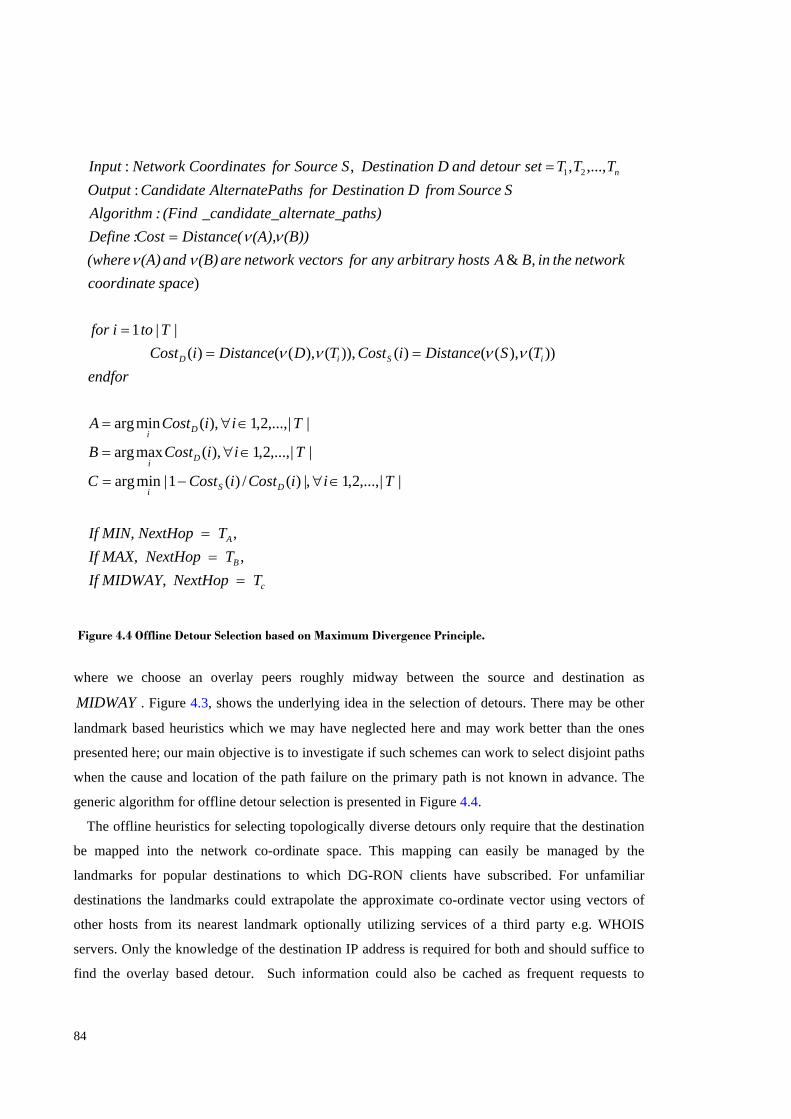
84
where we choose an overlay peers roughly midway between the source and destination as
MIDWAY . Figure 4.3, shows the underlying idea in the selection of detours. There may be other
landmark based heuristics which we may have neglected here and may work better than the ones
presented here; our main objective is to investigate if such schemes can work to select disjoint paths
when the cause and location of the path failure on the primary path is not known in advance. The
generic algorithm for offline detour selection is presented in Figure 4.4.
The offline heuristics for selecting topologically diverse detours only require that the destination
be mapped into the network co-ordinate space. This mapping can easily be managed by the
landmarks for popular destinations to which DG-RON clients have subscribed. For unfamiliar
destinations the landmarks could extrapolate the approximate co-ordinate vector using vectors of
other hosts from its nearest landmark optionally utilizing services of a third party e.g. WHOIS
servers. Only the knowledge of the destination IP address is required for both and should suffice to
find the overlay based detour. Such information could also be cached as frequent requests to
, ,
||,...,2,1 ,|)(/)(1|minarg
||,...,2,1 ,)(maxarg
||,...,2,1 ,)(minarg
))(),(()( )),(),(()( || 1
) , &
:,...,, , : 21
c
B
A
DSi
Di
Di
iSiD
n
T NextHop If MIDWAY, TextHop If MAX, N
TxtHop If MIN, Ne
TiiCostiCostC
TiiCostB
TiiCostA
endforTSDistanceiCostTDDistanceiCost
Ttoifor
spacecoordinatenetworktheinBAhostsarbitraryanyforvectorsnetworkare(B) and (A) (where
(B))(A),Distance(Cost:Define_paths)_alternate_candidate (Find:Algorithm
SSourcefromDnDestinatioforathsAlternatePCandidateOutputTTTsetdetourandDnDestinatioSource SforsCoordinateNetworkInput
===
∈∀−=
∈∀=
∈∀=
===
=
=
νννν
νννν
Figure 4.4 Offline Detour Selection based on Maximum Divergence Principle.
85
popular destinations are made so the peer can incrementally learn about these. Next we describe
three offline schemes for selection of an overlay ‘detour’ node once the position of the destination
has been determined in the co-ordinate space.
The offline methods based on network co-ordinates (discussed in the previous section) can embed
only latency but not failure or congestion information; and thus may not adapt well for dynamic
performance estimation on alternate paths. Thus, to supplement the offline path selection process
online path monitoring is necessary in DG-RON.
4.8 Performance Evaluation We use trace-based simulation driven by real-world Internet datasets to validate the DG-RON
architecture we present in this Chapter. We investigate the performance-benefits of DG-RON for
finding QoS enhanced paths. For this study, we use measurement data between 146 and 133 AMP
hosts (mainly from North and South America) from two, 24 hr datasets [114] which were obtained
in 2006: June 30 and August 31. The details of these datasets have been explained earlier in Chapter
3. We deliberately choose to avoid the RIPE measurement data here because of the small number of
hosts for which we collected data as downloading bulk dataset is not available and the purpose here
is to investigate the performance of a proposed architecture that aims to enable RONs to scale
beyond 50 hosts [4].
We let the AMP networks behave as a virtual RON. The selection of landmarks ( 7=n ) done by
selecting 7 AMP hosts which are topologically diverse to enable good network distance estimation
and have delay measurements to all other AMP hosts. Accurate distance estimation is not the goal
here, it is just to predict network distance with sufficient accuracy for selecting topologically
diverse detours. We cluster AMP-HPC hosts as belonging to 7 geographical regions: North, North
East, North West, South, South East, South West and Central US. Each of the 7 landmarks is
chosen randomly from these 7 clusters so that they are spread throughout the continental United
States. Hosts forming part of AMP-International network are not connected as a full mesh with all
other AMP hosts; these are deliberately neglected from being chosen as landmarks. Detour-set hosts
and computation of Cartesian-distance are done exactly as explained before (Section 4.5), but using
the RTT measurements from the trace files; the only differences are: (1) the size of the overlay
comprising of all the nodes in the AMP datasets; e.g. 7)-(146 139=N hosts (for AMP-146-
30/Jun/2006); (2) we pick a third of the detour set host from the short distance (intra-zone) overlay
hosts, another third from the long distance (inter-zone) overlay hosts and the remaining third are
chosen randomly from the set of overlay hosts which were responsible for alleviating the majority
of the total failures (as discussed in Section 4.3).
86
Path failures are defined as given in Equation 3-1 (Chapter 3). We pick 3=k to identify
performance failures and 10=k to identify path outages as before. Due to the way we define
failure, instead of observing only the fraction of underlay failures successfully masked by both
schemes; we use the delay gain metric (Section 4.3) to quantify the delay reduction when using the
alternate paths in the DG-RON architecture.
4.8.1 Impact of Detour Set Size
Figure 4.5 shows the results for the delay gain metric comparison between the best possible path
and the best possible path selected from amongst the detour set of a DGRON node as the detour set
size is varied. For both datasets, when there are path degradations (e.g. on 19321 (=139*139)
possible paths for AMP-146) there is at least one QoS optimized indirect (one-hop overlay) path in
the RON. Using only a carefully selected detour set, as we outlined earlier, each overlay node can
find a QoS optimized path for all path outages and performance failures encountered. The results
are more impressive for path outages than performance failures. As explained in Section 3.2, one-
hop overlay paths normally have delays much larger than direct Internet paths. If the magnitude of
path degradation is larger (path outage), it increases the number of one-hop overlay paths which
provide better delay. Consequently, even a small detour set of 6 overlay nodes can provide
exceptionally well delay gains (Figure 4.5a); delay gain of 40% or more for 90% path outages.
Figure 4.5b shows that at least 12 detouring options are required for being able to select a path
providing delay gains of 40% or more when direct Internet paths suffer from performance failures.
As the detour set size is further increased to 48, the performance gains are marginal.

87
0
10
20
30
40
50
60
70
80
90
100
0 20 40 60 80 100Path Outages (%)
Del
ay G
ain
(%)
RON
DGRON (|T|=6)
DGRON (|T|=12)
DGRON (|T|=48)
0
10
20
30
40
50
60
70
80
90
100
0 20 40 60 80 100Performance Failures (%)
Del
ay G
ain
(%)
RONDGRON (|T|=6)DGRON (|T|=12)DGRON (|T|=48)
Figure 4.5 Delay Gain Comparison between DGRON and RON with variation in detour set size. (AMP-146-30/Jun/2006 (top) and AMP-133-31/Aug/2006.)
88
4.8.2 Evaluation of Offline Path Heuristics We also evaluate the efficacy of our offline heuristics. We select three overlay relay hosts using
each heuristic; MIDWAYandMINMAX , . We compare the characteristics of the best-of-three
paths i.e. three paths selected using each of MIDWAYandMINMAX , after sorting based on
distances.
We first measure physical path stretch on the QoS enhanced one-hop overlay paths selected by
each of the offline path selection heuristics.
path)Internet (direct hops levelRouter heuristic)path offlineby selectedpath overlay hop-(one hops levelRouter =StretchPath
(4-6) We find that MAX may look for longer paths with average path stretch of 2.2 compared to 1.8
for MIN and MIDWAY for a detour set size of 12 (Table 4.1). Note that physically longer one-
hop overlay paths can still provide lower delay alternate paths if the direct path is suffering from
congestion -violation of triangle inequality [60]. We also evaluate the delay benefits obtained on
paths selected by the offline path heuristics using Equation. 4-1, where the delay of the one-hop
overlay path is through the overlay host selected by the offline heuristic. MAX accounts for finding
about 45-60% of QoS enhanced paths for performance failures and path outages, respectively
(Table 4.2). MIN and MIDWAY are most efficient in finding good QoS optimized paths with
substantially higher delay gains than MAX , accounting for finding approximately 75-99% of QoS
enhanced paths for performance failures and path outages, respectively. These QoS enhanced paths
provide delays gains of 40% or higher in all cases. This shows that landmark-based heuristics can
aid in selection of disjoint alternate paths and thus filter good paths from bad ones. In situations
where monitoring of all paths is not desirable or feasible due to scalability issues, such heuristics
can predict alternate path availability with a very high probability.
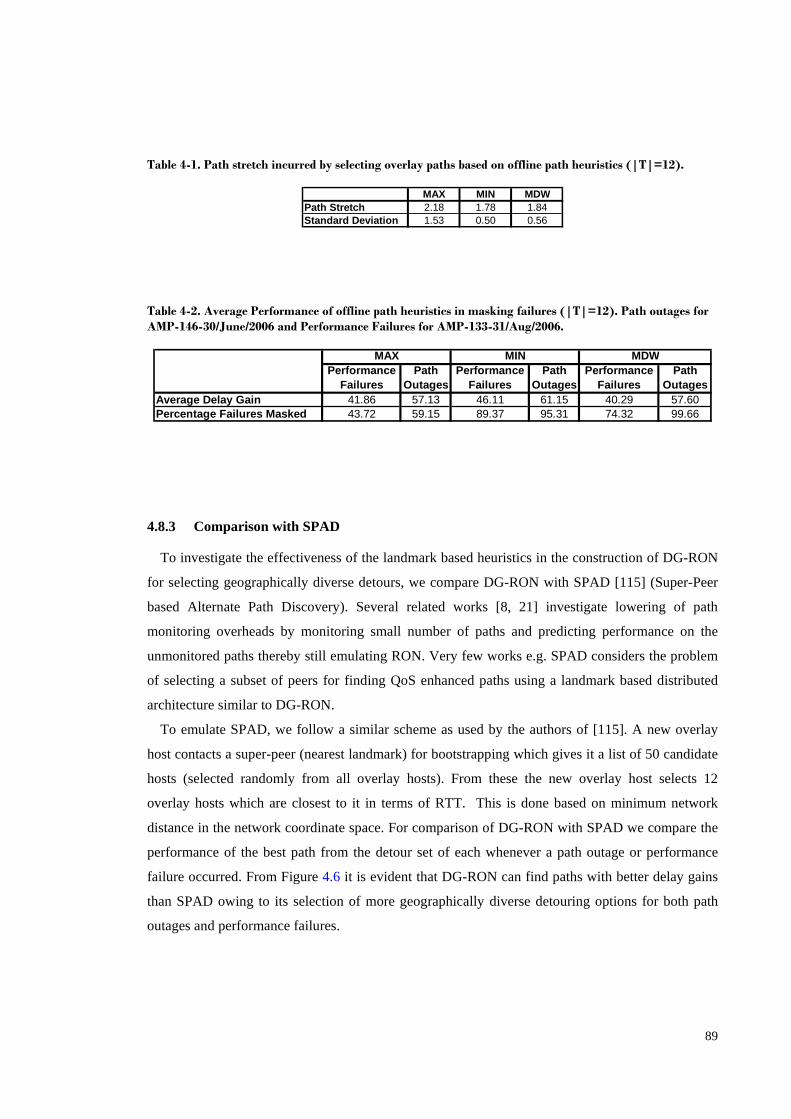
89
4.8.3 Comparison with SPAD
To investigate the effectiveness of the landmark based heuristics in the construction of DG-RON
for selecting geographically diverse detours, we compare DG-RON with SPAD [115] (Super-Peer
based Alternate Path Discovery). Several related works [8, 21] investigate lowering of path
monitoring overheads by monitoring small number of paths and predicting performance on the
unmonitored paths thereby still emulating RON. Very few works e.g. SPAD considers the problem
of selecting a subset of peers for finding QoS enhanced paths using a landmark based distributed
architecture similar to DG-RON.
To emulate SPAD, we follow a similar scheme as used by the authors of [115]. A new overlay
host contacts a super-peer (nearest landmark) for bootstrapping which gives it a list of 50 candidate
hosts (selected randomly from all overlay hosts). From these the new overlay host selects 12
overlay hosts which are closest to it in terms of RTT. This is done based on minimum network
distance in the network coordinate space. For comparison of DG-RON with SPAD we compare the
performance of the best path from the detour set of each whenever a path outage or performance
failure occurred. From Figure 4.6 it is evident that DG-RON can find paths with better delay gains
than SPAD owing to its selection of more geographically diverse detouring options for both path
outages and performance failures.
Table 4-1. Path stretch incurred by selecting overlay paths based on offline path heuristics (|T|=12).
MAX MIN MDWPath Stretch 2.18 1.78 1.84Standard Deviation 1.53 0.50 0.56
Table 4-2. Average Performance of offline path heuristics in masking failures (|T|=12). Path outages for AMP-146-30/June/2006 and Performance Failures for AMP-133-31/Aug/2006.
Average Delay Gain 41.86 57.13 46.11 61.15 40.29 57.60Percentage Failures Masked 43.72 59.15 89.37 95.31 74.32 99.66
MAX MIN MDWPerformance
FailuresPath
OutagesPerformance
FailuresPath
OutagesPerformance
FailuresPath
Outages
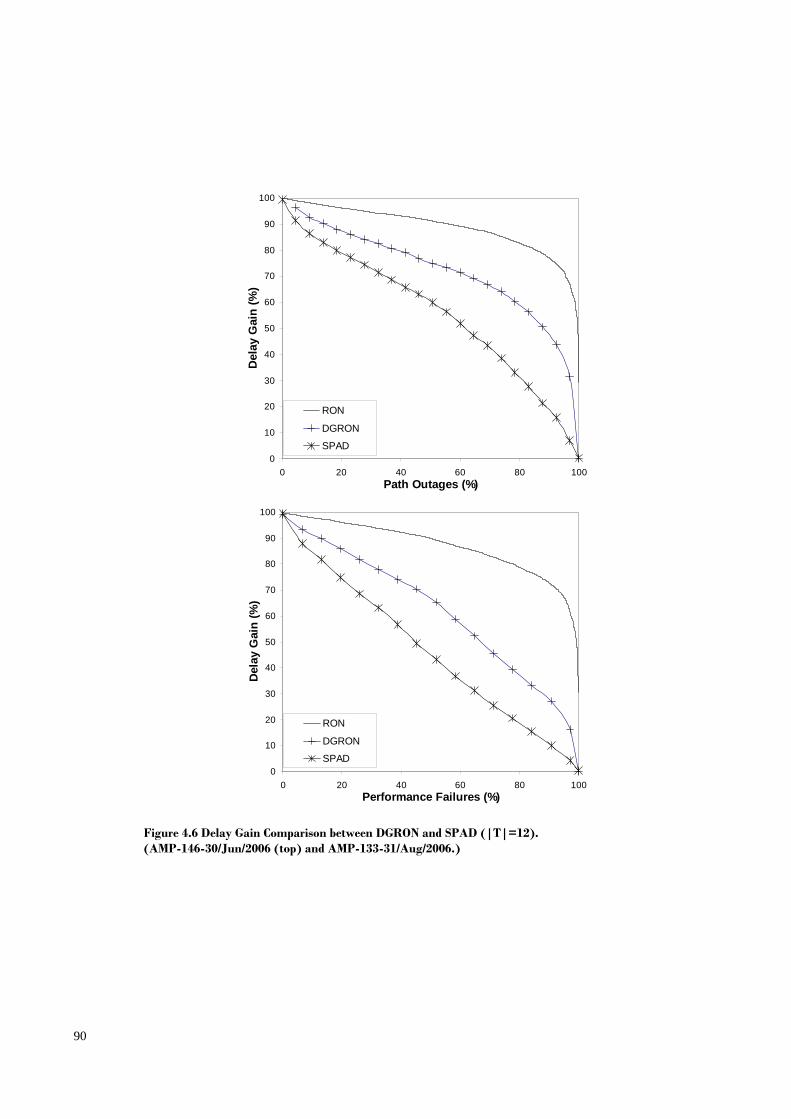
90
0
10
20
30
40
50
60
70
80
90
100
0 20 40 60 80 100Path Outages (%)
Del
ay G
ain
(%)
RON
DGRON
SPAD
0
10
20
30
40
50
60
70
80
90
100
0 20 40 60 80 100Performance Failures (%)
Del
ay G
ain
(%)
RON
DGRON
SPAD
Figure 4.6 Delay Gain Comparison between DGRON and SPAD (|T|=12). (AMP-146-30/Jun/2006 (top) and AMP-133-31/Aug/2006.)

91
4.9 Discussion
The simulation results presented in the previous section reveal that landmark based offline path
searching methods can work well in power-law topologies such as the Internet which can
supplement or reduce the overheads of aggressive online path selection algorithms. The results in
this section show there is ample opportunity for finding alternate paths even if overlay hosts are not
connected in a full mesh. Considering that performance failures are short duration events, making it
highly unlikely for a large fraction of links to undergo congestion or suffer from other performance
degradations at the same time, DG-RON can predict good alternate paths among candidate hosts in
the detour set.
The proposed design for offline path selection does have some obvious caveats; the most glaring
of all is the fact that the path exploration could incur some delay in alternate path discovery. We
argue that to achieve scalability, this problem is unavoidable. BGP has taught us that scalability
only results by marching through all possible alternate paths post-detection of a failure. The
landmark based architecture can effectively predict availability of good alternate paths.
4.10 Conclusion As the Internet continues to grow, so does the diversity of the connectivity between the hosts. In
this chapter we presented the first contribution of this thesis investigating the possibility of a
globally scalable RON service for discovering infrastructural redundancy and robustness potentially
present in the Internet. RON unnecessarily searches through a large path exploration space and the
subsequent overheads associated with aggressive path monitoring pose scalability issues. To
address this issue several previous works [6, 24] have focused on topology aware heuristics in
overlay construction and link monitoring which make it possible to both monitor and select
alternate paths using distributed approaches. Our work is similar to such approaches in that we aim
to lower both path monitoring overheads and reduce the candidate path exploration space. In
addition our work presents a platform for harnessing the findings of previous literature [6, 16] .

92
93
5 DISJOINT PATH SELECTION IN OVERLAY NETWORKS USING TOR GRAPHS
5.1 Introduction In Chapter 4 we highlighted the fact that path diversity in the Internet and overlay networks exists
at both the IP and AS levels. IP level paths inside ASes are totally under the domain of the AS.
However, tapping into AS level path diversity can also allow us to exploit the IP level path
diversity.
This chapter presents the second contribution of this thesis, namely the selection of maximally
disjoint alternate paths at the AS level by using Type-Of-Relationship (ToR) graphs [116]. We
again validate our findings using real-world Internet-data from the Active Measurement Project
(AMP) [2] to quantify the benefits of choosing paths that are disjoint in terms of the ASes they
traverse.
First, Section 5.2 briefly describes ToR-graphs. In Section 5.3 we present a greedy-approach for
finding maximal AS-disjoint overlay paths. In Section 5.4 we evaluate the performance of this
approach using real-world Internet data. Section 5.5 summarizes the key findings of the study.
5.2 ToR (Type-of-Relationship) Graphs The Internet is composed of a large number of autonomous networks (ASes). Each AS is
independently administered. To route a packet from one host to another it must pass via several
different ASes. ASes can be characterized into two broad categories, transit ASes and stub ASes
(Figure 5.1). Stub-ASes are located on the edges of the Internet and typically have few connections
to neighboring ASes (usually one, perhaps a few if multi-homed) whereas transit ASes usually have
more connections to neighboring ASes. Each sub-network learns about global reachability to
different hosts in the network by exchanging route advertisements with immediate neighbors.
Gao [63] first showed that within the ‘generic’ transit-stub architecture, three dominant types of
commercial-relationships occurred between ASes, namely customer-provider (C-P), peer-peer (P-
P) and sibling-sibling (S-S). Customers depend on their respective provider networks for
connectivity (the providers acting as a transit for them), usually in exchange for a fee. Peers (and
siblings) are networks which are similar in scope and can exchange traffic (destined for each other’s
customers) between each other without a fee, for mutual benefit. C-P, P-P and S-S relationships are
all relative in that a particular AS can have different relationships with different adjacent ASes. Gao
[63] found that the percentage of C-P, P-P and S-S relationships are roughly 90.5%, 8% and 1.5%
respectively.
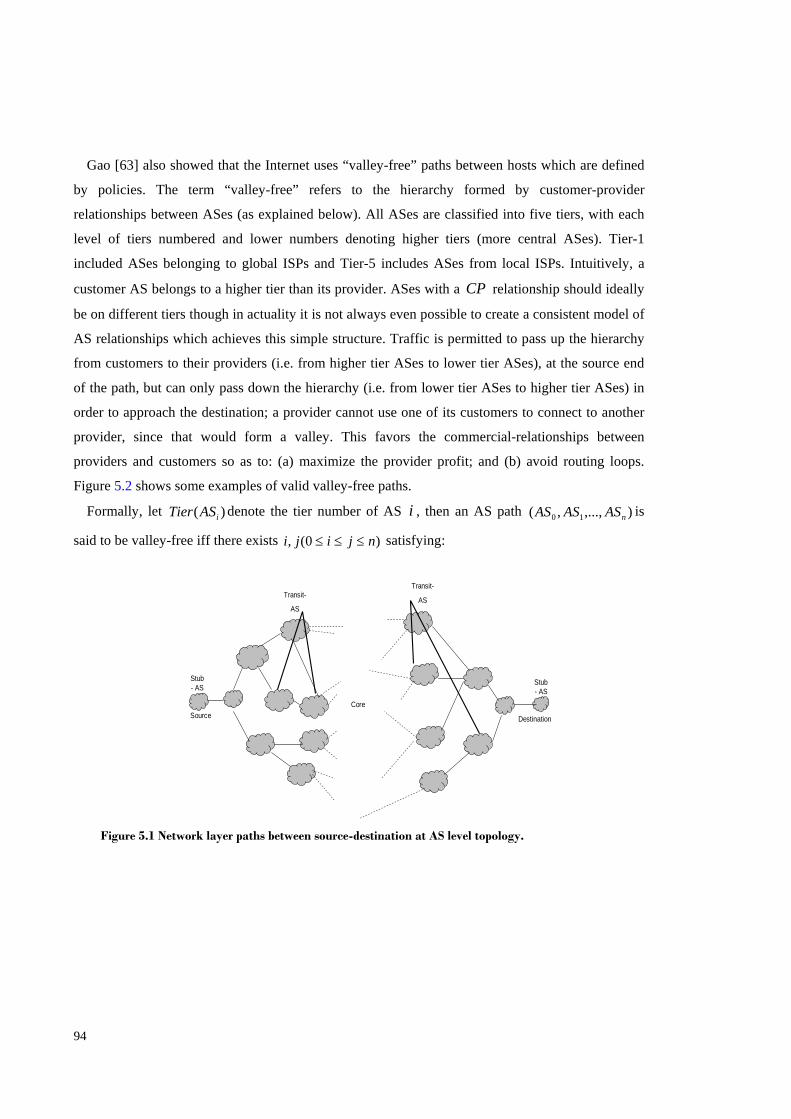
94
Gao [63] also showed that the Internet uses “valley-free” paths between hosts which are defined
by policies. The term “valley-free” refers to the hierarchy formed by customer-provider
relationships between ASes (as explained below). All ASes are classified into five tiers, with each
level of tiers numbered and lower numbers denoting higher tiers (more central ASes). Tier-1
included ASes belonging to global ISPs and Tier-5 includes ASes from local ISPs. Intuitively, a
customer AS belongs to a higher tier than its provider. ASes with a CP relationship should ideally
be on different tiers though in actuality it is not always even possible to create a consistent model of
AS relationships which achieves this simple structure. Traffic is permitted to pass up the hierarchy
from customers to their providers (i.e. from higher tier ASes to lower tier ASes), at the source end
of the path, but can only pass down the hierarchy (i.e. from lower tier ASes to higher tier ASes) in
order to approach the destination; a provider cannot use one of its customers to connect to another
provider, since that would form a valley. This favors the commercial-relationships between
providers and customers so as to: (a) maximize the provider profit; and (b) avoid routing loops.
Figure 5.2 shows some examples of valid valley-free paths.
Formally, let )( iASTier denote the tier number of AS i , then an AS path ),...,,( 10 nASASAS is
said to be valley-free iff there exists )0(, njiji ≤≤≤ satisfying:
CoreSource Destination
Stub- AS
Stub- AS
Transit-
AS
Transit-
AS
Figure 5.1 Network layer paths between source-destination at AS level topology.
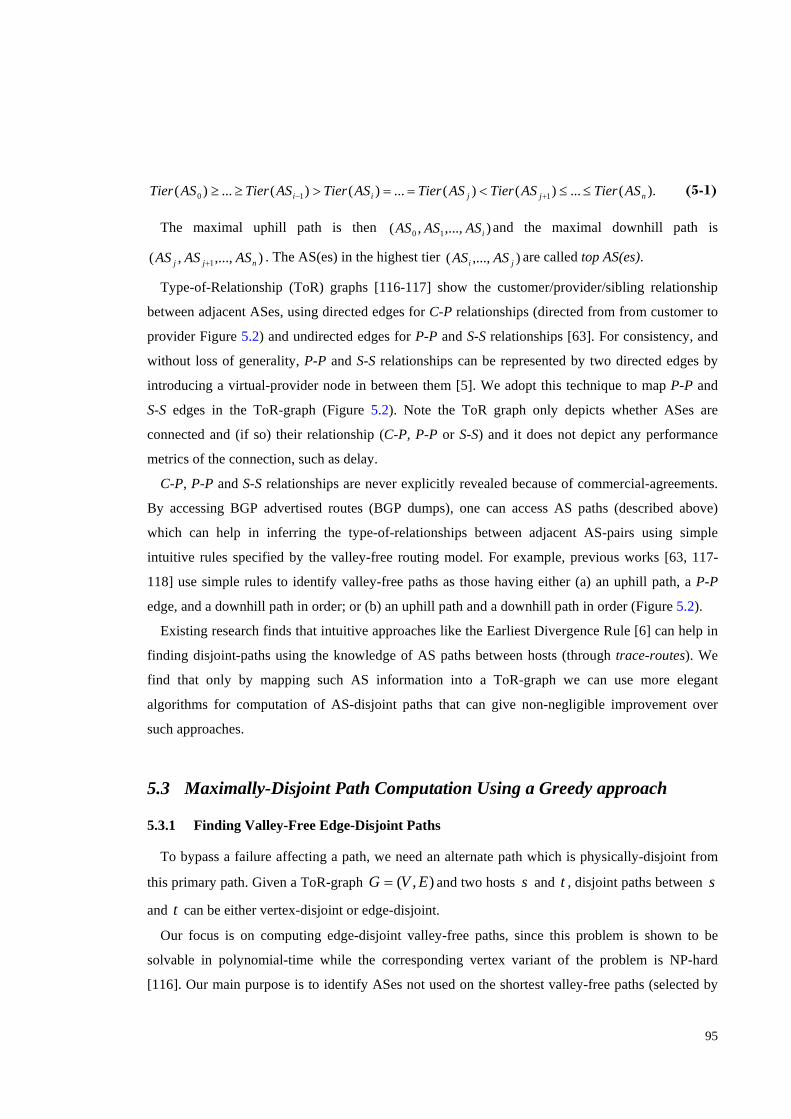
95
).(...)()(...)()(...)( 110 njjii ASTierASTierASTierASTierASTierASTier ≤≤<==>≥≥ +− (5-1)
The maximal uphill path is then ),...,,( 10 iASASAS and the maximal downhill path is
),...,,( 1 njj ASASAS + . The AS(es) in the highest tier ),...,( ji ASAS are called top AS(es).
Type-of-Relationship (ToR) graphs [116-117] show the customer/provider/sibling relationship
between adjacent ASes, using directed edges for C-P relationships (directed from from customer to
provider Figure 5.2) and undirected edges for P-P and S-S relationships [63]. For consistency, and
without loss of generality, P-P and S-S relationships can be represented by two directed edges by
introducing a virtual-provider node in between them [5]. We adopt this technique to map P-P and
S-S edges in the ToR-graph (Figure 5.2). Note the ToR graph only depicts whether ASes are
connected and (if so) their relationship (C-P, P-P or S-S) and it does not depict any performance
metrics of the connection, such as delay.
C-P, P-P and S-S relationships are never explicitly revealed because of commercial-agreements.
By accessing BGP advertised routes (BGP dumps), one can access AS paths (described above)
which can help in inferring the type-of-relationships between adjacent AS-pairs using simple
intuitive rules specified by the valley-free routing model. For example, previous works [63, 117-
118] use simple rules to identify valley-free paths as those having either (a) an uphill path, a P-P
edge, and a downhill path in order; or (b) an uphill path and a downhill path in order (Figure 5.2).
Existing research finds that intuitive approaches like the Earliest Divergence Rule [6] can help in
finding disjoint-paths using the knowledge of AS paths between hosts (through trace-routes). We
find that only by mapping such AS information into a ToR-graph we can use more elegant
algorithms for computation of AS-disjoint paths that can give non-negligible improvement over
such approaches.
5.3 Maximally-Disjoint Path Computation Using a Greedy approach 5.3.1 Finding Valley-Free Edge-Disjoint Paths
To bypass a failure affecting a path, we need an alternate path which is physically-disjoint from
this primary path. Given a ToR-graph ),( EVG = and two hosts s and t , disjoint paths between s
and t can be either vertex-disjoint or edge-disjoint.
Our focus is on computing edge-disjoint valley-free paths, since this problem is shown to be
solvable in polynomial-time while the corresponding vertex variant of the problem is NP-hard
[116]. Our main purpose is to identify ASes not used on the shortest valley-free paths (selected by
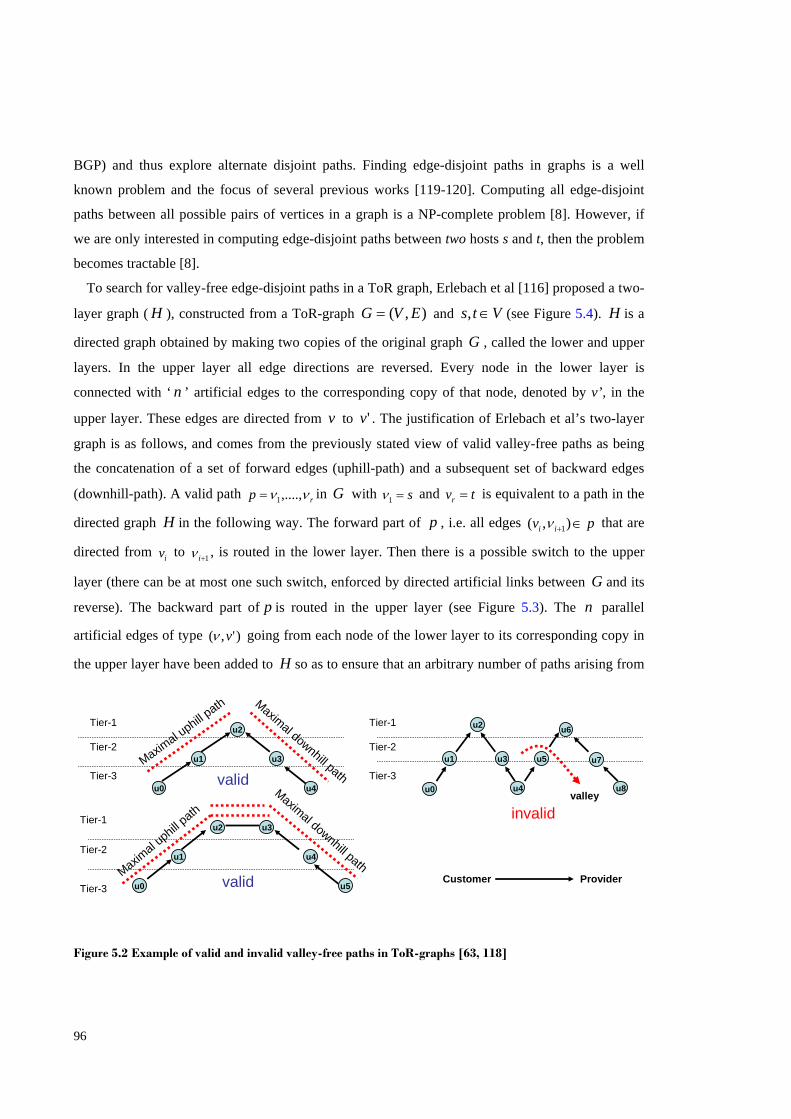
96
BGP) and thus explore alternate disjoint paths. Finding edge-disjoint paths in graphs is a well
known problem and the focus of several previous works [119-120]. Computing all edge-disjoint
paths between all possible pairs of vertices in a graph is a NP-complete problem [8]. However, if
we are only interested in computing edge-disjoint paths between two hosts s and t, then the problem
becomes tractable [8].
To search for valley-free edge-disjoint paths in a ToR graph, Erlebach et al [116] proposed a two-
layer graph ( H ), constructed from a ToR-graph ),( EVG = and Vts ∈, (see Figure 5.4). H is a
directed graph obtained by making two copies of the original graph G , called the lower and upper
layers. In the upper layer all edge directions are reversed. Every node in the lower layer is
connected with ‘ n ’ artificial edges to the corresponding copy of that node, denoted by v’, in the
upper layer. These edges are directed from v to 'v . The justification of Erlebach et al’s two-layer
graph is as follows, and comes from the previously stated view of valid valley-free paths as being
the concatenation of a set of forward edges (uphill-path) and a subsequent set of backward edges
(downhill-path). A valid path rp νν ,....,1= in G with s=1ν and tvr = is equivalent to a path in the
directed graph H in the following way. The forward part of p , i.e. all edges pv ii ∈+ ),( 1ν that are
directed from iv to 1+iν , is routed in the lower layer. Then there is a possible switch to the upper
layer (there can be at most one such switch, enforced by directed artificial links between G and its
reverse). The backward part of p is routed in the upper layer (see Figure 5.3). The n parallel
artificial edges of type )',( vν going from each node of the lower layer to its corresponding copy in
the upper layer have been added to H so as to ensure that an arbitrary number of paths arising from
valid
invalid
Customer Provider
valley
u1
u0
u2
u3
u4
u1
u0
u2 u3
u4
u5valid
Tier-1
Tier-1
Tier-1
Tier-2
Tier-3
Tier-2
Tier-3
Tier-2
Tier-3u0
u1
u2
u3
u4
u5
u6
u7
u8
Maximal u
phill path
Maximal uphill p
ath
Maximal downhill path
Maximal downhill path
Figure 5.2 Example of valid and invalid valley-free paths in ToR-graphs [63, 118]
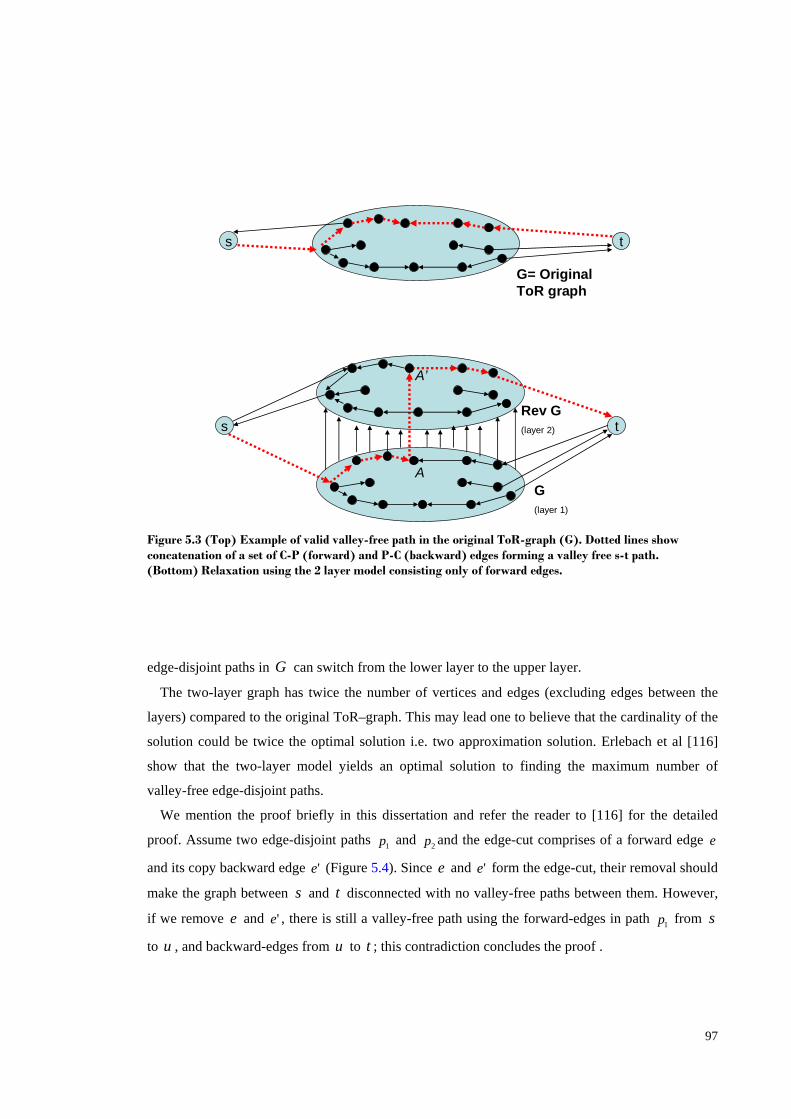
97
edge-disjoint paths in G can switch from the lower layer to the upper layer.
The two-layer graph has twice the number of vertices and edges (excluding edges between the
layers) compared to the original ToR–graph. This may lead one to believe that the cardinality of the
solution could be twice the optimal solution i.e. two approximation solution. Erlebach et al [116]
show that the two-layer model yields an optimal solution to finding the maximum number of
valley-free edge-disjoint paths.
We mention the proof briefly in this dissertation and refer the reader to [116] for the detailed
proof. Assume two edge-disjoint paths 1p and 2p and the edge-cut comprises of a forward edge e
and its copy backward edge 'e (Figure 5.4). Since e and 'e form the edge-cut, their removal should
make the graph between s and t disconnected with no valley-free paths between them. However,
if we remove e and 'e , there is still a valley-free path using the forward-edges in path 1p from s
to u , and backward-edges from u to t ; this contradiction concludes the proof .
G= Original ToR graph
Rev G(layer 2)s t
s t
A
A’
G(layer 1)
Figure 5.3 (Top) Example of valid valley-free path in the original ToR-graph (G). Dotted lines show concatenation of a set of C-P (forward) and P-C (backward) edges forming a valley free s-t path. (Bottom) Relaxation using the 2 layer model consisting only of forward edges.
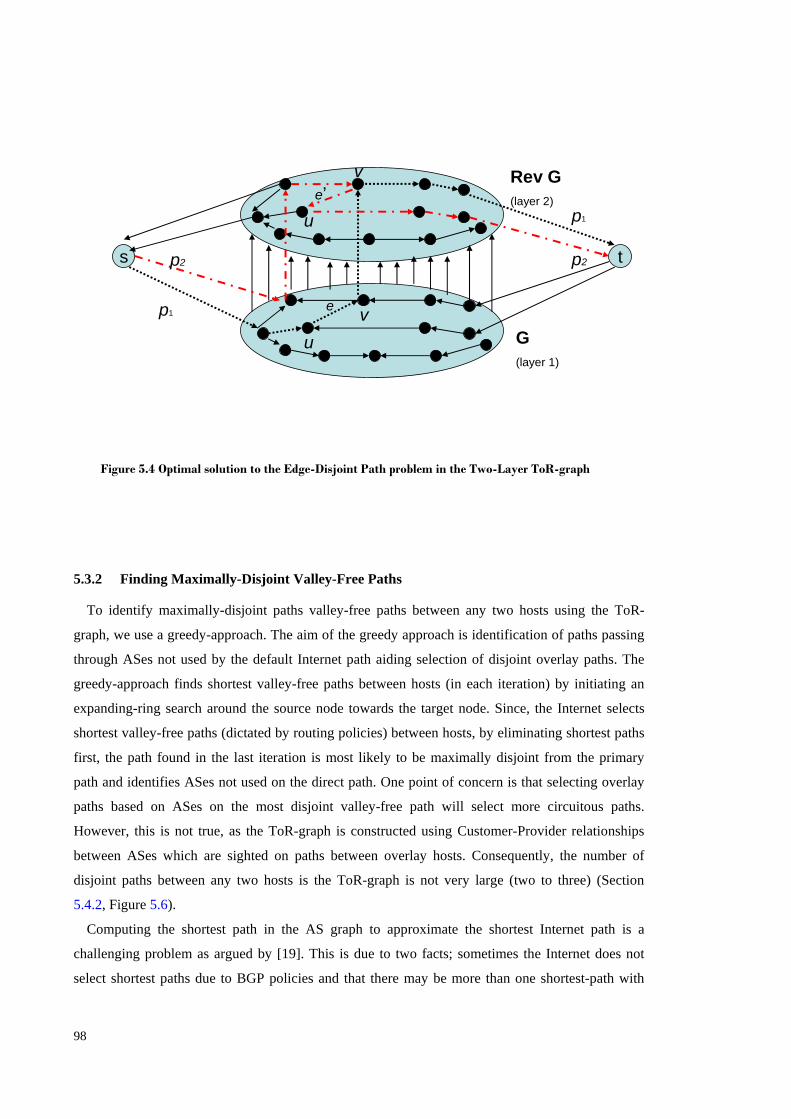
98
5.3.2 Finding Maximally-Disjoint Valley-Free Paths
To identify maximally-disjoint paths valley-free paths between any two hosts using the ToR-
graph, we use a greedy-approach. The aim of the greedy approach is identification of paths passing
through ASes not used by the default Internet path aiding selection of disjoint overlay paths. The
greedy-approach finds shortest valley-free paths between hosts (in each iteration) by initiating an
expanding-ring search around the source node towards the target node. Since, the Internet selects
shortest valley-free paths (dictated by routing policies) between hosts, by eliminating shortest paths
first, the path found in the last iteration is most likely to be maximally disjoint from the primary
path and identifies ASes not used on the direct path. One point of concern is that selecting overlay
paths based on ASes on the most disjoint valley-free path will select more circuitous paths.
However, this is not true, as the ToR-graph is constructed using Customer-Provider relationships
between ASes which are sighted on paths between overlay hosts. Consequently, the number of
disjoint paths between any two hosts is the ToR-graph is not very large (two to three) (Section
5.4.2, Figure 5.6).
Computing the shortest path in the AS graph to approximate the shortest Internet path is a
challenging problem as argued by [19]. This is due to two facts; sometimes the Internet does not
select shortest paths due to BGP policies and that there may be more than one shortest-path with
Rev G(layer 2)
s t
G(layer 1)
u
uv
v
p1
p1
p2p2
e
e’
Figure 5.4 Optimal solution to the Edge-Disjoint Path problem in the Two-Layer ToR-graph
99
same number of AS hops. However, these issues can be resolved as suggested in [19] by using
additional criteria such as making use of the fact that AS-paths are transitive and that 70% of AS-
paths are symmetric. Since, in this dissertation the ToR graph is constructed using only AS-paths
between overlay end-hosts instead of reading BGP dumps, the ToR-graph is sparse and hence the
number of paths between any pair of hosts is not large. Also, note the aim of the greedy-approach is
not to predict the shortest-path between hosts likely used by Internet but on the contrary to only
identify the ASs on the most-disjoint valley-free path.
We briefly formalize our technique for searching for edge-disjoint valley-free paths between
source-destination hosts. Given a directed ToR-graph ),( EVG = (where EeV ∈∈ ,ν ) and two
hosts s (the source) and t (the destination); the search-algorithm starts out with an empty solution
set S and in each subsequent iteration, the shortest available path is found between s and t . Once
a path xp is found, it is added to S and the edges used in the current path are deleted and the
process is repeated on the remaining graph until no further ts − path can be found. The path found
in the last iteration is taken as the candidate path which is maximally disjoint from the primary
(direct) path between hosts.
The time complexity of the implementation of this greedy-approach follows that of finding the
maximum number of edge-disjoint paths between any two given hosts s and t in a graph
),( EVG = through the Max- flow/Min-cut algorithm [17] and is |)||(| VEO × , where || E is the
total number of edges and || V the total number of vertices in a graph. To quantify || E and || V ,
we assume an overlay network with N hosts; the number P of AS-paths between hosts is 2N .
Also, assuming that the average number of ASs traversed on AS-paths between each overlay host is
n (equivalently 1−n AS hops); n is a small number typically three to seven, since most end-hosts
are within three to five AS-hops of the so-called Tier-1 ISPs in the core of the network (Figure 3.5).
The worst-case time-complexity would be when all such 2N AS paths between overlay hosts are
completely vertex-disjoint (excepting terminal hosts) and hence would be )()( 42 NOPO = . In
practice, it is much less because of the power-law model of the Internet [18] which shows sparse
connectivity for a large number of hosts in the Internet; only about 1-2% hosts are well connected at
the AS level. Chen et al. in [21] show that the number of paths k which can be used to monitor the
quality of all 2N paths in a N -host overlay network are )lg( NNO . Thus, the worst-case time-
complexity of the greedy-approach for finding a maximally-disjoint alternate-path between a
source-destination pair becomes, )( 2kO where NNk log= . We consider this topic further in
Chapter 6.
100
AS-path information can also be obtained by reading BGP dumps [20]; a strong motivation for
the approach we propose here since we do not want to trade one type of overhead (probing) with
another (trace-routes). As this information is already distributed by routers in the network it will not
introduce additional traffic in the network. Also, such AS-path information needs to be updated at
infrequent intervals since the majority of Internet paths are stable [51].
5.3.3 Comparison with Earliest Divergence Rule (EDR)
Fei et al. [6], showed that an Earliest Divergence Rule (EDR) (Chapter 2, Figure 2.5) can work
well by selecting from a list of potential alternate paths, an alternate path from the source to the
destination which diverges at the earliest point from the default-path near the source. This technique
assumes availability of AS level path information (from source overlay hosts to detouring overlay
hosts). To show how finding maximally disjoint paths by using ToR graphs can yield better
performance than EDR, we use anecdotal evidence from one of the datasets (AMP-146-
30/Jun/2006). The details of this Internet dataset have been described in detail in Chapter 3. Here
we consider the direct path and the possible 120 one-hop overlay paths between two AMP monitors
installed at the two extreme ends of the continental US; amp-ucb (at University of California,
Berkeley) and amp-uvm (at University of Vermont). The direct AS-level path between amp-ucb and
amp-uvm is:
1351 19094 19548 2914 2152 25-Dst---------------------Src
This path has an average delay of 123 ms. Using the ToR graph, we find two disjoint (at AS-
level) paths between amp-ucb and amp-uvm.
1351 10578 11537 2153 25 b.)1351 19094 3356 2152 25 .)a
Note that the two paths are of equal length in this case, i.e. five AS hops. Also the direct AS level
path is longer than both of the disjoint paths found by the greedy approach. We especially present
this case to show that even when the underlying assumption about the shorter Internet paths is not
met, a greedy strategy can still work. If we use the EDR in selecting an one-hop overlay path, we
would normally go for paths diverging at the second AS, i.e. paths using AS 2153 instead of AS
2152 which is used in the direct Internet path. However, this turns out to be bad as only 13 paths go
through AS 2152 at the second AS hop and the remaining 107 go through AS 2153 at the second
101
AS hop. However if we further distinguish amongst paths based on the second disjoint path shown
above and start filtering paths which go through ASes 11537 and 10578. This reduces our candidate
path set to 7 down from 107. Since these paths are disjoint there is a very high probability that the
percentage of good paths would be good comparing to EDR where we tend to choose almost all
one-hop overlay paths. For example, the one-hop overlay path between amp-ucb and amp-uvm via
amp-mit (in MIT) is one of these 7 paths. The average delay between amp-ucb and amp-uvm
through amp-mit is 127ms, just 4 ms greater than the (shorter) direct path delay! Thus, it can be
expected to provide a good backup path should the direct path become congested.
5.4 Performance Evaluation 5.4.1 Methodology used to construct ToR-graph
For this study, we use path and delay measurements collected between AMP [2] hosts. The
details of this Internet dataset has been described in detail in Chapter 3. While the aim of an overlay
network may only be to optimize the one-way delay, which may differ for different directions due
to asymmetric Internet paths, two-way delay-measurements, such as RTTs, have been shown [121]
to be strongly correlated (with a correlation-coefficient of 0.87) to one-way delays, and so form a
reasonable basis for inferring one-way delays.
To construct the ToR for AMP dataset graph, we first identify all ASes used by paths between all
possible AMP hosts in the AMP-146-30/Jun/2006 and AMP-133-31/Aug/2006 virtual RONs. Note
we used the trace-route information between hosts for the purpose of this study, but it is also
possible to obtain this information by reading BGP dumps as explained earlier; the only
requirement is to have reasonably good number of vantage points. AS-Paths not found by this
method can also be deduced indirectly using the fact that AS-paths are transitive [19]. We
identified a total of 4400 unique IP-addresses from the IP trace-route information. Only a small
fraction (7%) of total paths had incomplete or partially-complete trace-routes in the dataset. The
next step was to map these IP addresses to AS numbers for which we use the IP-to-ASN Whois
Service from Cymru [122], which can provide mappings for user-specified dates using the GNU
netcat utility [123]. Using the results from this service we identified a total of 275 unique ASNs.
RIPE dataset records path both at the IP and AS level. We identified a total of 118 unique ASNs for
the RIPE dataset. To find the relationships between these ASs (C-P, P-P, or S-S); we used the AS-
relationships data from CAIDA [106] which is based on RouteViews [124]. We obtained the AS
relationship from dates close enough to match the datasets. For AMP the AS relationship data used
102
was obtained on 5th June 2006; For RIPE the used AS relationship data was obtained 2nd August
2007.
To construct the ToR-graph, we identify all observed AS pairs in the AS-level paths between
AMP hosts, and mapped edges between them based on C-P, P-P and S-S relationships. We use
similar procedure when computing the ToR graphs for the RIPE dataset except for the extra AS to
IP mapping step because IP addresses are included within the dataset.
One important source of concern is the accuracy of Customer-Provider (and Peering)
relationships inferred from [106] as used in the ToR-graph. The methodology to obtain customer-
provider and peering relationships is based on collecting AS level paths through looking glass
servers recording BGP path advertisements and assigning customer, provider and peering/sibling
relationships to adjacent AS pairs so as to minimize anomalous paths (paths that violate the valley-
free routing principle) as shown by Gao et al. [63] and Battista et al. [117]. However, we note that
our ToR graphs are very sparse; they are constructed using customer-provider and peering
relationships between only 275 ASes for AMP and 118 ASes for RIPE. This minimizes the source
of such errors.
5.4.2 Network layer path characteristics inferred from ToR-graph
Since we use a heuristic approach for finding maximally-disjoint overlay paths, we first look at
AMP and RIPE data to evaluate the effectiveness of our proposed techniques. Chiefly, we are
interested in network layer path-characteristics between AMP and RIPE hosts such as the impact of
routing-policies on path- inflation and path-diversity using only the data that can be inferred from
the ToR-graph.
To see the impact of routing-polices on path-inflation; i.e. to see if shortest paths were selected
more often than not, we measured path-inflation on direct paths. We compute the shortest-paths
between AMP and RIPE hosts in the ToR-graph and compare them with the actual number of AS
hops on the direct-path using the trace-route information from the dataset. We find that the
majority of paths between AMP hosts (53%) and RIPE hosts (58%) were shortest-possible AS
paths. Only 27% of AMP paths and 31% of RIPE paths were inflated by one AS hop (Figure 5.5).
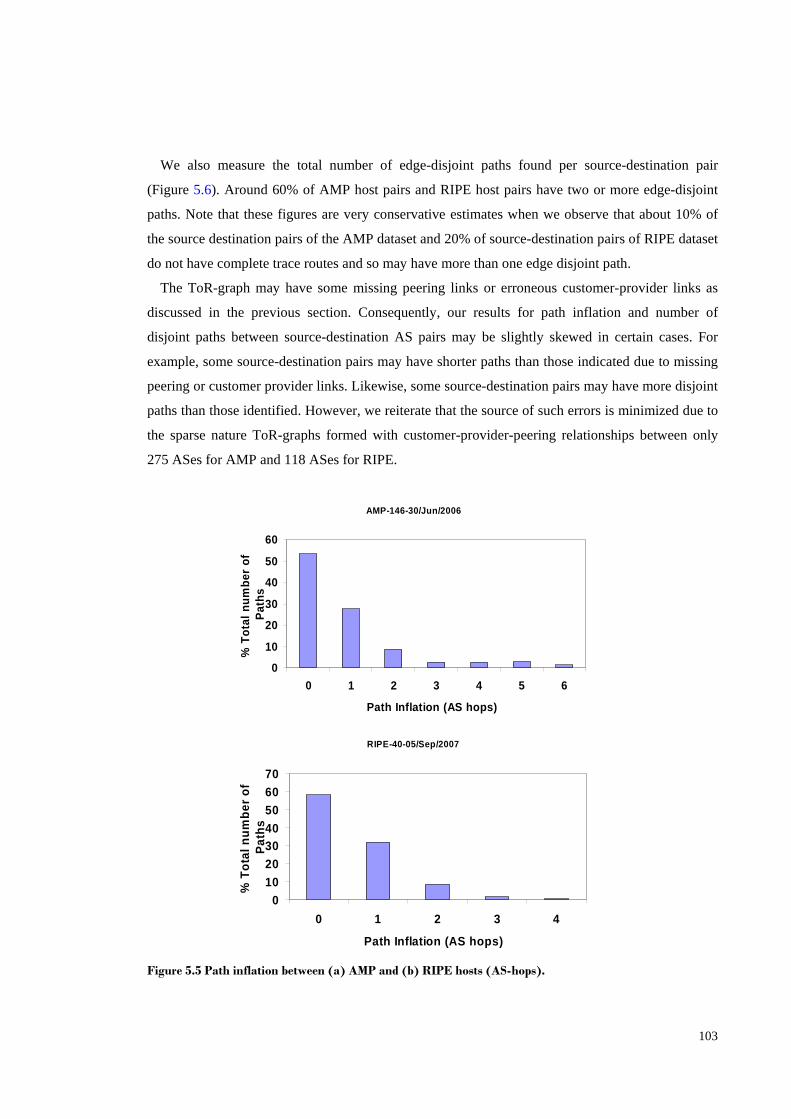
103
We also measure the total number of edge-disjoint paths found per source-destination pair
(Figure 5.6). Around 60% of AMP host pairs and RIPE host pairs have two or more edge-disjoint
paths. Note that these figures are very conservative estimates when we observe that about 10% of
the source destination pairs of the AMP dataset and 20% of source-destination pairs of RIPE dataset
do not have complete trace routes and so may have more than one edge disjoint path.
The ToR-graph may have some missing peering links or erroneous customer-provider links as
discussed in the previous section. Consequently, our results for path inflation and number of
disjoint paths between source-destination AS pairs may be slightly skewed in certain cases. For
example, some source-destination pairs may have shorter paths than those indicated due to missing
peering or customer provider links. Likewise, some source-destination pairs may have more disjoint
paths than those identified. However, we reiterate that the source of such errors is minimized due to
the sparse nature ToR-graphs formed with customer-provider-peering relationships between only
275 ASes for AMP and 118 ASes for RIPE.
AMP-146-30/Jun/2006
0
10
20
30
40
50
60
0 1 2 3 4 5 6
Path Inflation (AS hops)
% T
otal
num
ber
of
Path
s
RIPE-40-05/Sep/2007
010203040506070
0 1 2 3 4
Path Inflation (AS hops)
% T
otal
num
ber o
f Pa
ths
Figure 5.5 Path inflation between (a) AMP and (b) RIPE hosts (AS-hops).
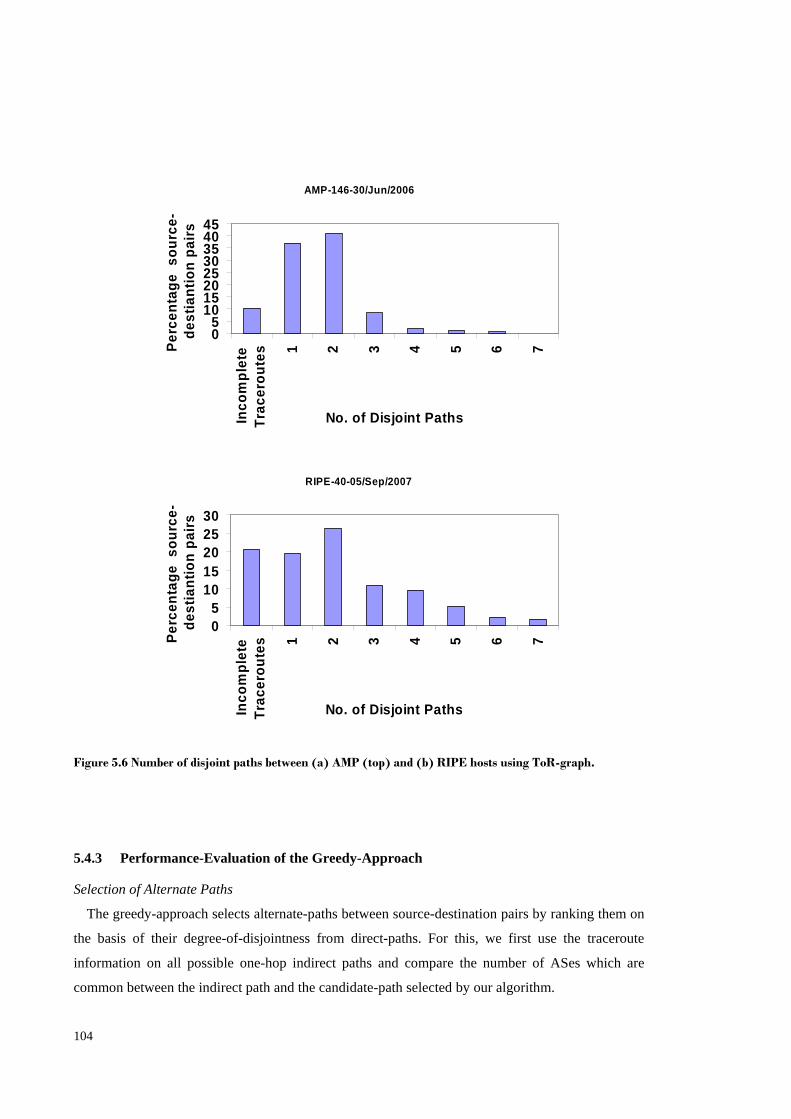
104
5.4.3 Performance-Evaluation of the Greedy-Approach Selection of Alternate Paths
The greedy-approach selects alternate-paths between source-destination pairs by ranking them on
the basis of their degree-of-disjointness from direct-paths. For this, we first use the traceroute
information on all possible one-hop indirect paths and compare the number of ASes which are
common between the indirect path and the candidate-path selected by our algorithm.
AMP-146-30/Jun/2006
05
1015202530354045
Inco
mpl
ete
Trac
erou
tes 1 2 3 4 5 6 7
No. of Disjoint Paths
Perc
enta
ge s
ourc
e-de
stia
ntio
n pa
irs
RIPE-40-05/Sep/2007
05
1015202530
Inco
mpl
ete
Trac
erou
tes 1 2 3 4 5 6 7
No. of Disjoint Paths
Perc
enta
ge s
ourc
e-de
stia
ntio
n pa
irs
Figure 5.6 Number of disjoint paths between (a) AMP (top) and (b) RIPE hosts using ToR-graph.
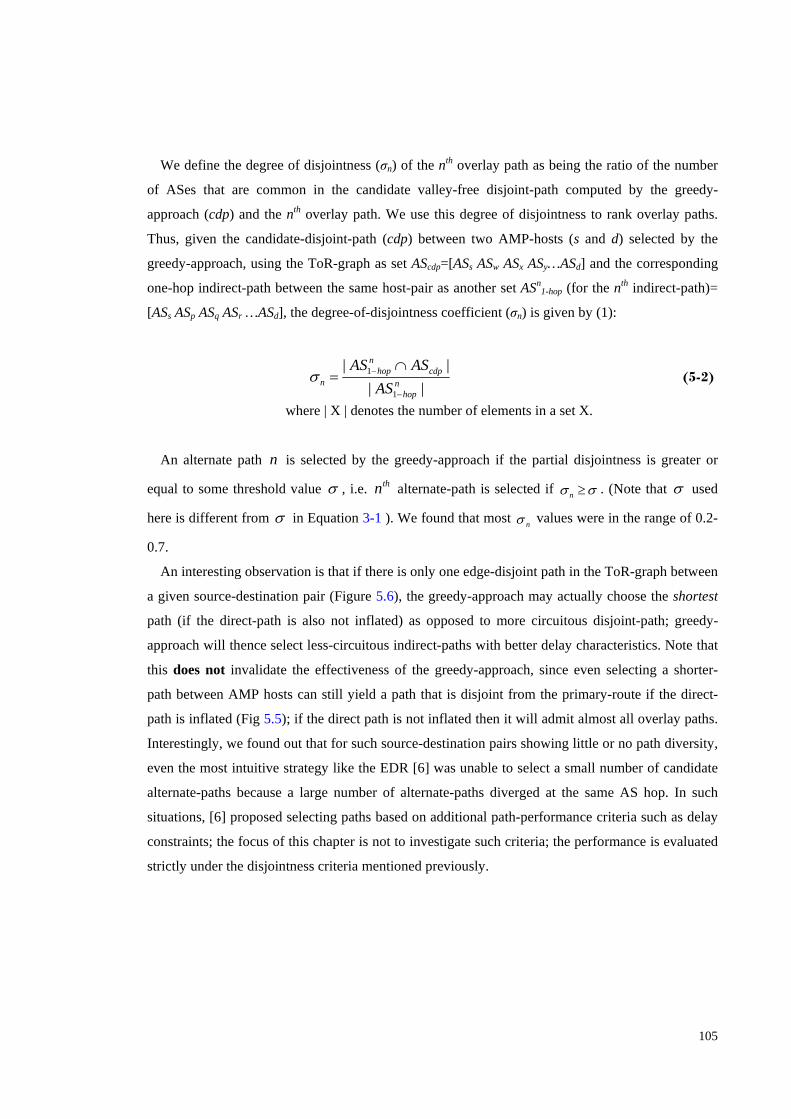
105
We define the degree of disjointness (σn) of the nth overlay path as being the ratio of the number
of ASes that are common in the candidate valley-free disjoint-path computed by the greedy-
approach (cdp) and the nth overlay path. We use this degree of disjointness to rank overlay paths.
Thus, given the candidate-disjoint-path (cdp) between two AMP-hosts (s and d) selected by the
greedy-approach, using the ToR-graph as set AScdp=[ASs ASw ASx ASy…ASd] and the corresponding
one-hop indirect-path between the same host-pair as another set ASn1-hop (for the nth indirect-path)=
[ASs ASp ASq ASr …ASd], the degree-of-disjointness coefficient (σn) is given by (1):
||
||
1
1n
hop
cdpn
hopn AS
ASAS
−
− ∩=σ (5-2)
where | X | denotes the number of elements in a set X.
An alternate path n is selected by the greedy-approach if the partial disjointness is greater or
equal to some threshold value σ , i.e. thn alternate-path is selected if σσ ≥n . (Note that σ used
here is different from σ in Equation 3-1 ). We found that most nσ values were in the range of 0.2-
0.7.
An interesting observation is that if there is only one edge-disjoint path in the ToR-graph between
a given source-destination pair (Figure 5.6), the greedy-approach may actually choose the shortest
path (if the direct-path is also not inflated) as opposed to more circuitous disjoint-path; greedy-
approach will thence select less-circuitous indirect-paths with better delay characteristics. Note that
this does not invalidate the effectiveness of the greedy-approach, since even selecting a shorter-
path between AMP hosts can still yield a path that is disjoint from the primary-route if the direct-
path is inflated (Fig 5.5); if the direct path is not inflated then it will admit almost all overlay paths.
Interestingly, we found out that for such source-destination pairs showing little or no path diversity,
even the most intuitive strategy like the EDR [6] was unable to select a small number of candidate
alternate-paths because a large number of alternate-paths diverged at the same AS hop. In such
situations, [6] proposed selecting paths based on additional path-performance criteria such as delay
constraints; the focus of this chapter is not to investigate such criteria; the performance is evaluated
strictly under the disjointness criteria mentioned previously.
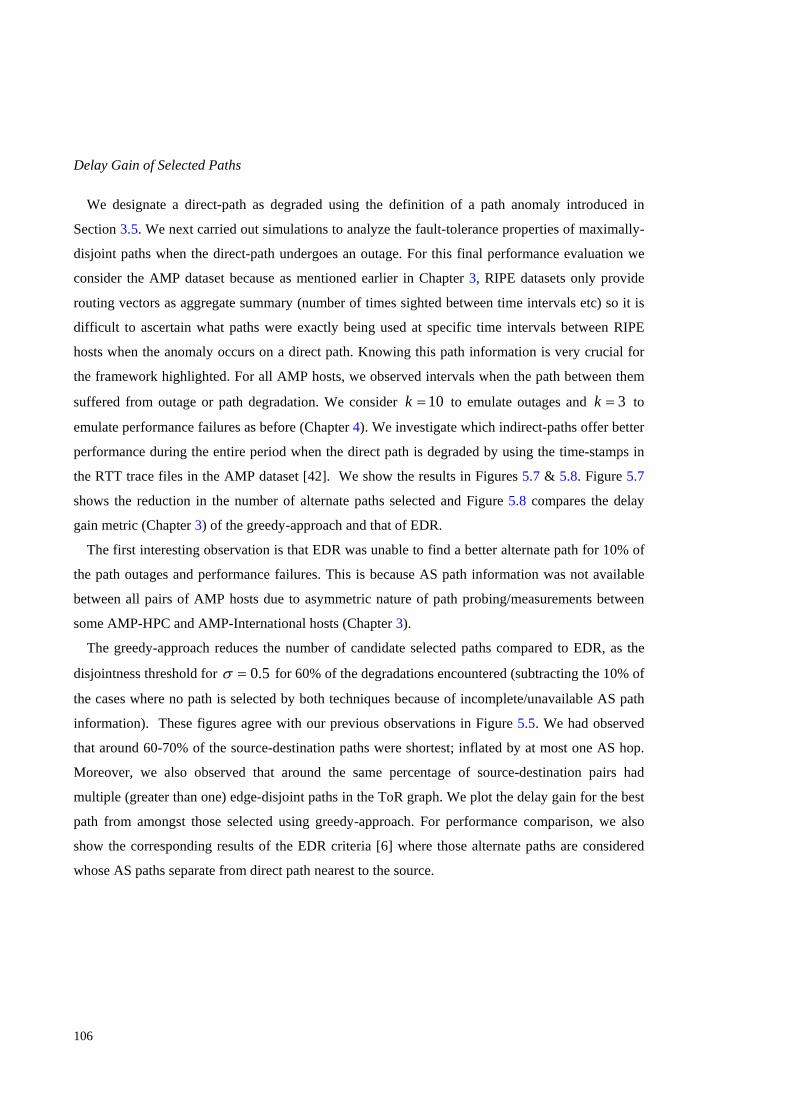
106
Delay Gain of Selected Paths
We designate a direct-path as degraded using the definition of a path anomaly introduced in
Section 3.5. We next carried out simulations to analyze the fault-tolerance properties of maximally-
disjoint paths when the direct-path undergoes an outage. For this final performance evaluation we
consider the AMP dataset because as mentioned earlier in Chapter 3, RIPE datasets only provide
routing vectors as aggregate summary (number of times sighted between time intervals etc) so it is
difficult to ascertain what paths were exactly being used at specific time intervals between RIPE
hosts when the anomaly occurs on a direct path. Knowing this path information is very crucial for
the framework highlighted. For all AMP hosts, we observed intervals when the path between them
suffered from outage or path degradation. We consider 10=k to emulate outages and 3=k to
emulate performance failures as before (Chapter 4). We investigate which indirect-paths offer better
performance during the entire period when the direct path is degraded by using the time-stamps in
the RTT trace files in the AMP dataset [42]. We show the results in Figures 5.7 & 5.8. Figure 5.7
shows the reduction in the number of alternate paths selected and Figure 5.8 compares the delay
gain metric (Chapter 3) of the greedy-approach and that of EDR.
The first interesting observation is that EDR was unable to find a better alternate path for 10% of
the path outages and performance failures. This is because AS path information was not available
between all pairs of AMP hosts due to asymmetric nature of path probing/measurements between
some AMP-HPC and AMP-International hosts (Chapter 3).
The greedy-approach reduces the number of candidate selected paths compared to EDR, as the
disjointness threshold for 5.0=σ for 60% of the degradations encountered (subtracting the 10% of
the cases where no path is selected by both techniques because of incomplete/unavailable AS path
information). These figures agree with our previous observations in Figure 5.5. We had observed
that around 60-70% of the source-destination paths were shortest; inflated by at most one AS hop.
Moreover, we also observed that around the same percentage of source-destination pairs had
multiple (greater than one) edge-disjoint paths in the ToR graph. We plot the delay gain for the best
path from amongst those selected using greedy-approach. For performance comparison, we also
show the corresponding results of the EDR criteria [6] where those alternate paths are considered
whose AS paths separate from direct path nearest to the source.
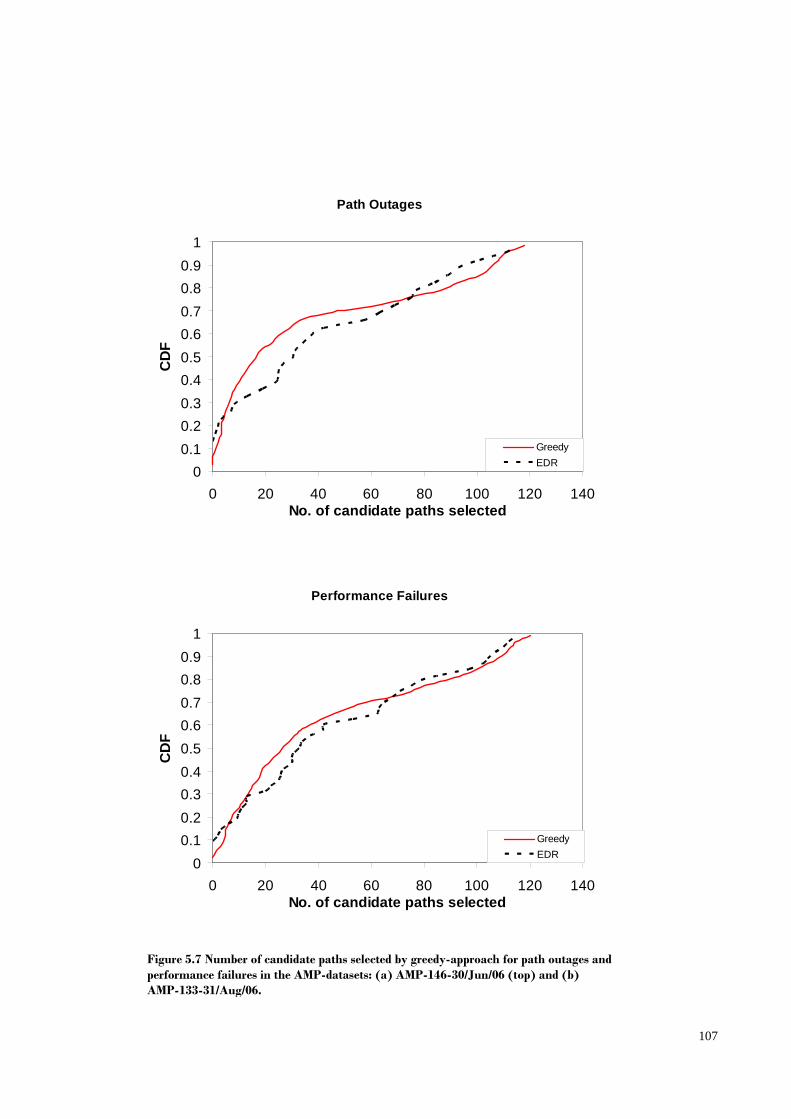
107
Path Outages
00.10.20.30.40.50.60.70.80.9
1
0 20 40 60 80 100 120 140No. of candidate paths selected
CD
F
GreedyEDR
Performance Failures
00.10.20.30.40.50.60.70.80.9
1
0 20 40 60 80 100 120 140No. of candidate paths selected
CD
F
GreedyEDR
Figure 5.7 Number of candidate paths selected by greedy-approach for path outages and performance failures in the AMP-datasets: (a) AMP-146-30/Jun/06 (top) and (b) AMP-133-31/Aug/06.
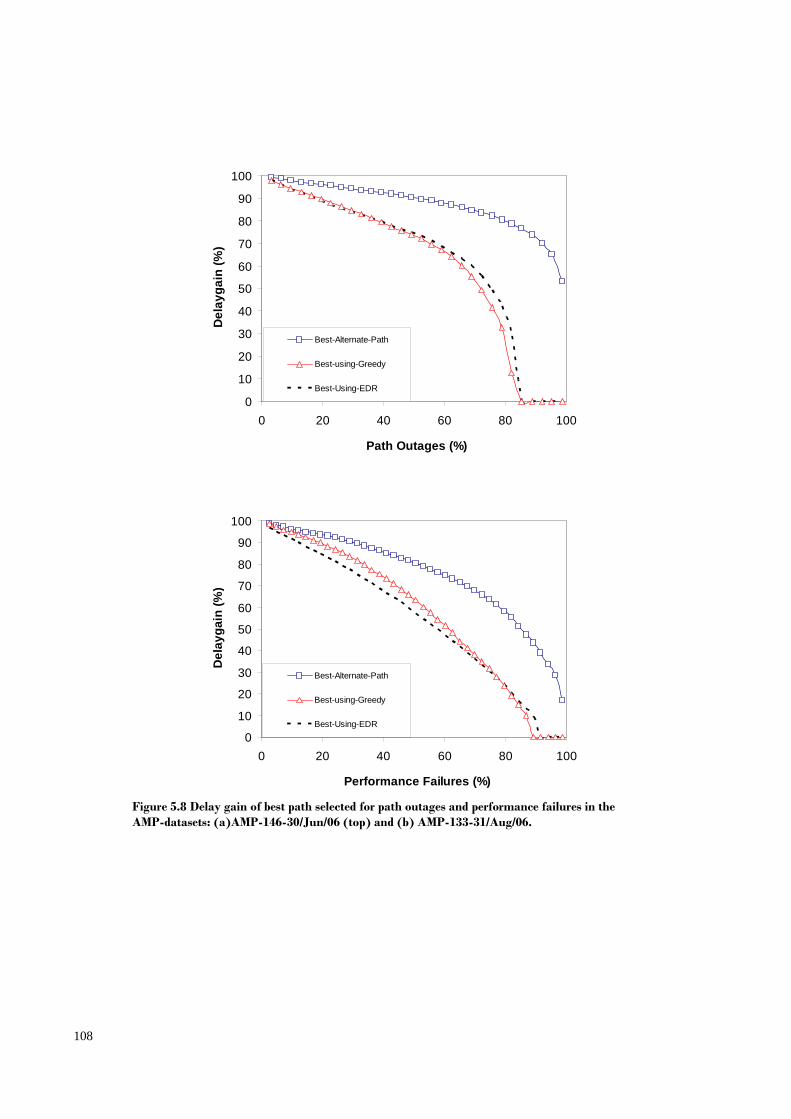
108
0
10
20
30
40
50
60
70
80
90
100
0 20 40 60 80 100
Path Outages (%)
Del
ayga
in (%
)
Best-Alternate-Path
Best-using-Greedy
Best-Using-EDR
0
10
20
30
40
50
60
70
80
90
100
0 20 40 60 80 100
Performance Failures (%)
Del
ayga
in (%
)
Best-Alternate-Path
Best-using-Greedy
Best-Using-EDR
Figure 5.8 Delay gain of best path selected for path outages and performance failures in the AMP-datasets: (a)AMP-146-30/Jun/06 (top) and (b) AMP-133-31/Aug/06.
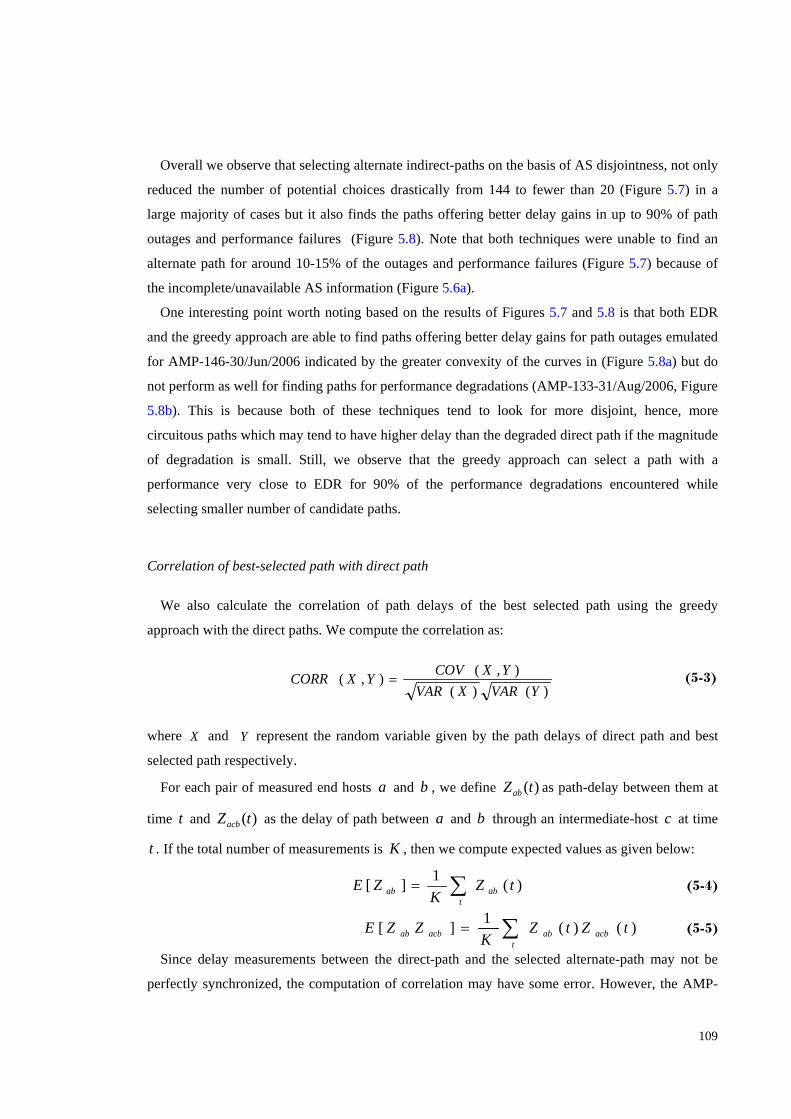
109
Overall we observe that selecting alternate indirect-paths on the basis of AS disjointness, not only
reduced the number of potential choices drastically from 144 to fewer than 20 (Figure 5.7) in a
large majority of cases but it also finds the paths offering better delay gains in up to 90% of path
outages and performance failures (Figure 5.8). Note that both techniques were unable to find an
alternate path for around 10-15% of the outages and performance failures (Figure 5.7) because of
the incomplete/unavailable AS information (Figure 5.6a).
One interesting point worth noting based on the results of Figures 5.7 and 5.8 is that both EDR
and the greedy approach are able to find paths offering better delay gains for path outages emulated
for AMP-146-30/Jun/2006 indicated by the greater convexity of the curves in (Figure 5.8a) but do
not perform as well for finding paths for performance degradations (AMP-133-31/Aug/2006, Figure
5.8b). This is because both of these techniques tend to look for more disjoint, hence, more
circuitous paths which may tend to have higher delay than the degraded direct path if the magnitude
of degradation is small. Still, we observe that the greedy approach can select a path with a
performance very close to EDR for 90% of the performance degradations encountered while
selecting smaller number of candidate paths.
Correlation of best-selected path with direct path
We also calculate the correlation of path delays of the best selected path using the greedy
approach with the direct paths. We compute the correlation as:
)()(),(),(
YVARXVARYXCOVYXCORR = (5-3)
where X and Y represent the random variable given by the path delays of direct path and best
selected path respectively.
For each pair of measured end hosts a and b , we define )(tZab as path-delay between them at
time t and )(tZacb as the delay of path between a and b through an intermediate-host c at time
t . If the total number of measurements is K , then we compute expected values as given below:
∑=t
abab tZK
ZE )(1][ (5-4)
∑=t
acbabacbab tZtZK
ZZE )()(1][ (5-5)
Since delay measurements between the direct-path and the selected alternate-path may not be
perfectly synchronized, the computation of correlation may have some error. However, the AMP-
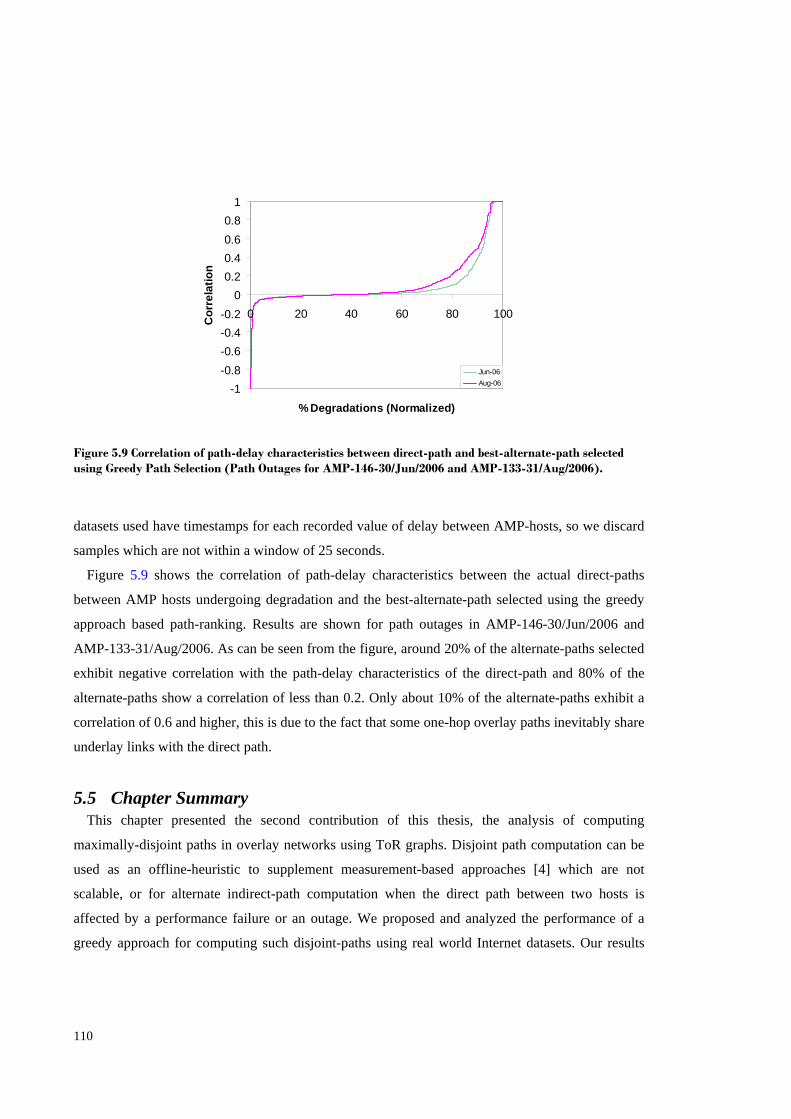
110
datasets used have timestamps for each recorded value of delay between AMP-hosts, so we discard
samples which are not within a window of 25 seconds.
Figure 5.9 shows the correlation of path-delay characteristics between the actual direct-paths
between AMP hosts undergoing degradation and the best-alternate-path selected using the greedy
approach based path-ranking. Results are shown for path outages in AMP-146-30/Jun/2006 and
AMP-133-31/Aug/2006. As can be seen from the figure, around 20% of the alternate-paths selected
exhibit negative correlation with the path-delay characteristics of the direct-path and 80% of the
alternate-paths show a correlation of less than 0.2. Only about 10% of the alternate-paths exhibit a
correlation of 0.6 and higher, this is due to the fact that some one-hop overlay paths inevitably share
underlay links with the direct path.
5.5 Chapter Summary This chapter presented the second contribution of this thesis, the analysis of computing
maximally-disjoint paths in overlay networks using ToR graphs. Disjoint path computation can be
used as an offline-heuristic to supplement measurement-based approaches [4] which are not
scalable, or for alternate indirect-path computation when the direct path between two hosts is
affected by a performance failure or an outage. We proposed and analyzed the performance of a
greedy approach for computing such disjoint-paths using real world Internet datasets. Our results
-1-0.8-0.6-0.4-0.2
00.20.40.60.8
1
0 20 40 60 80 100
% Degradations (Normalized)
Cor
rela
tion
Jun-06Aug-06
Figure 5.9 Correlation of path-delay characteristics between direct-path and best-alternate-path selected using Greedy Path Selection (Path Outages for AMP-146-30/Jun/2006 and AMP-133-31/Aug/2006).

111
show that such heuristics can be used to select alternate paths to bypass path outages or
degradations.

112

113
PART III
PATH MONITORING IN OVERLAY NETWORKS

114
115
6 ISSUES OF STATISTICAL PATH MONITORING IN OVERLAY NETWORKS
6.1 Introduction
The previous section of this dissertation discussed scalable architectures that exploit the network
layer overlay topology for disjoint path selection, thus reducing or eliminating path monitoring
overheads. However, disjoint path selection may not be possible in some cases because the
technique might not work in some cases. Recalling from the previous chapter, EDR and greedy
selection did not work for about 10-15% of outages and performance failures in selecting a better
alternate path when it was present. This is because the best path might not always be the maximally
disjoint path. Path monitoring could be used as a fall back in these cases. Even if alternate paths are
selected based on disjointness it normally leads to a smaller list of candidate possible paths
(Chapter 5), then path selection has to be made again on the basis of path monitoring methods.
Path monitoring can help in meeting dynamic QoS demands than merely ensuring path
disjointness. For example, selection of a longer and less congested disjoint overlay path between a
source and destination host may still give higher delay than a shorter congested direct Internet path.
Also, path disjointness may vary with time because the underlay network has a mechanism of its
own to rectify problems in the Internet by switching over to alternate paths (even if it does so
lazily!). Consequently, overlay paths selected based on physical disjointness criteria could have
already become congested due to underlay network switching traffic from the congested links to
uncongested links available on the selected disjoint overlay path.
Revisiting the problem, Andersen et al. [4] showed that when the direct-path between two
Internet hosts fails, an alternate path between them can be established using an overlay host whose
direct-paths to the source and destination host have not failed due to the spatial diversity of paths
(Figure 1.1).
We emphasized the importance of overlay path monitoring in the previous paragraphs. To recap,
we go through a simple example which highlights the importance and possibility of scalable path
monitoring in overlay networks as we will see later. An overlay can find good detours by
aggressive path monitoring. This is because an overlay link is a logical abstraction of multiple
underlay links. Two overlay links may seem disjoint at the application layer, yet share a link in the
underlying IP layer. The shared IP link renders both useless in the event of failure. For example,
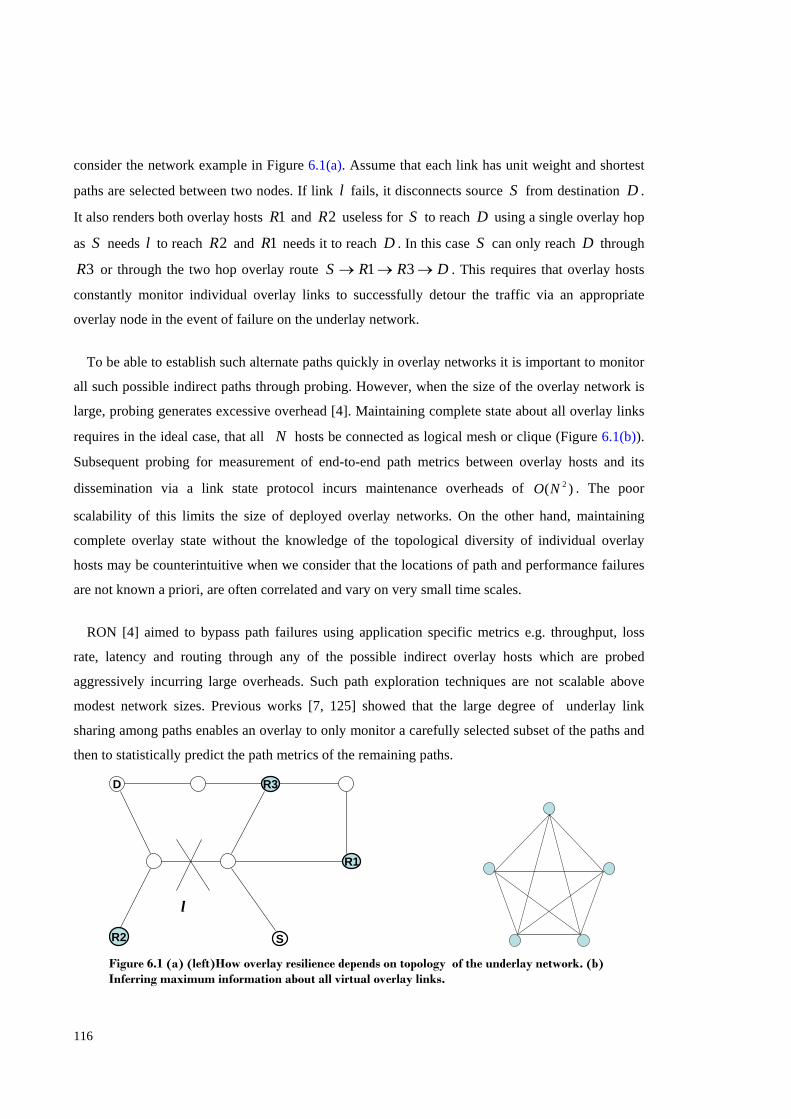
116
consider the network example in Figure 6.1(a). Assume that each link has unit weight and shortest
paths are selected between two nodes. If link l fails, it disconnects source S from destination D .
It also renders both overlay hosts 1R and 2R useless for S to reach D using a single overlay hop
as S needs l to reach 2R and 1R needs it to reach D . In this case S can only reach D through
3R or through the two hop overlay route DRRS →→→ 31 . This requires that overlay hosts
constantly monitor individual overlay links to successfully detour the traffic via an appropriate
overlay node in the event of failure on the underlay network.
To be able to establish such alternate paths quickly in overlay networks it is important to monitor
all such possible indirect paths through probing. However, when the size of the overlay network is
large, probing generates excessive overhead [4]. Maintaining complete state about all overlay links
requires in the ideal case, that all N hosts be connected as logical mesh or clique (Figure 6.1(b)).
Subsequent probing for measurement of end-to-end path metrics between overlay hosts and its
dissemination via a link state protocol incurs maintenance overheads of )( 2NO . The poor
scalability of this limits the size of deployed overlay networks. On the other hand, maintaining
complete overlay state without the knowledge of the topological diversity of individual overlay
hosts may be counterintuitive when we consider that the locations of path and performance failures
are not known a priori, are often correlated and vary on very small time scales.
RON [4] aimed to bypass path failures using application specific metrics e.g. throughput, loss
rate, latency and routing through any of the possible indirect overlay hosts which are probed
aggressively incurring large overheads. Such path exploration techniques are not scalable above
modest network sizes. Previous works [7, 125] showed that the large degree of underlay link
sharing among paths enables an overlay to only monitor a carefully selected subset of the paths and
then to statistically predict the path metrics of the remaining paths.
R2
R3
R1
S
D
l
Figure 6.1 (a) (left)How overlay resilience depends on topology of the underlay network. (b) Inferring maximum information about all virtual overlay links.
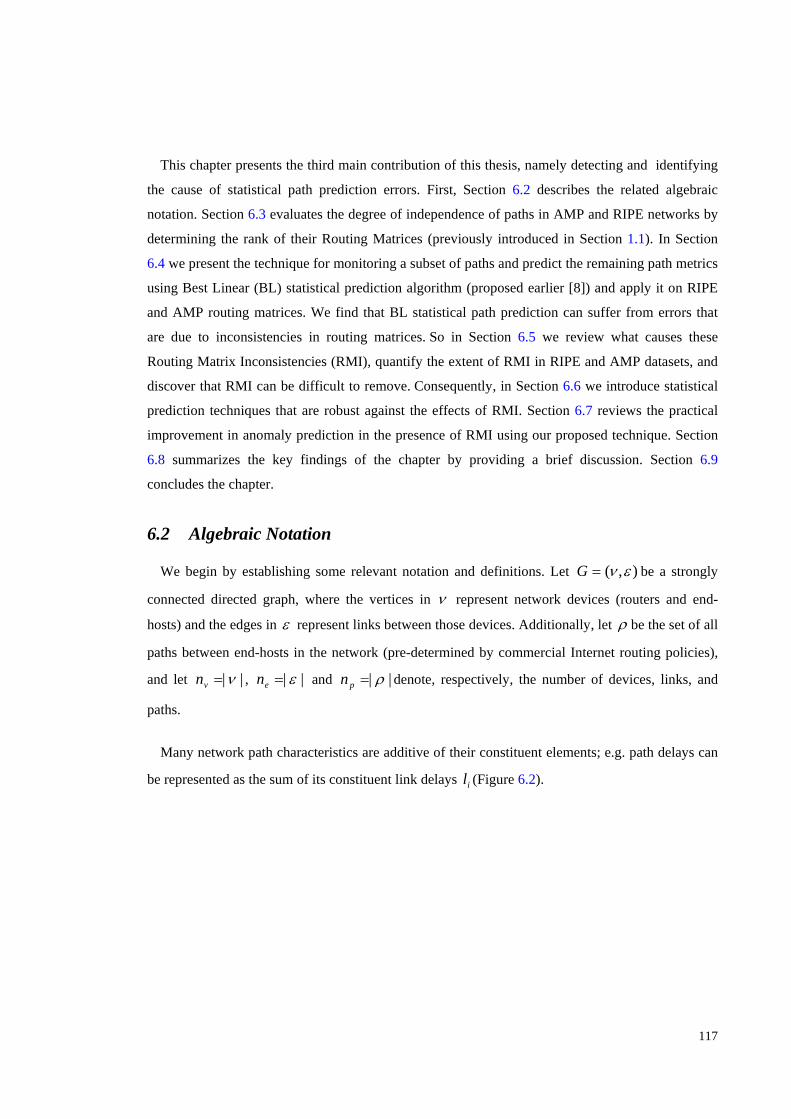
117
This chapter presents the third main contribution of this thesis, namely detecting and identifying
the cause of statistical path prediction errors. First, Section 6.2 describes the related algebraic
notation. Section 6.3 evaluates the degree of independence of paths in AMP and RIPE networks by
determining the rank of their Routing Matrices (previously introduced in Section 1.1). In Section
6.4 we present the technique for monitoring a subset of paths and predict the remaining path metrics
using Best Linear (BL) statistical prediction algorithm (proposed earlier [8]) and apply it on RIPE
and AMP routing matrices. We find that BL statistical path prediction can suffer from errors that
are due to inconsistencies in routing matrices. So in Section 6.5 we review what causes these
Routing Matrix Inconsistencies (RMI), quantify the extent of RMI in RIPE and AMP datasets, and
discover that RMI can be difficult to remove. Consequently, in Section 6.6 we introduce statistical
prediction techniques that are robust against the effects of RMI. Section 6.7 reviews the practical
improvement in anomaly prediction in the presence of RMI using our proposed technique. Section
6.8 summarizes the key findings of the chapter by providing a brief discussion. Section 6.9
concludes the chapter.
6.2 Algebraic Notation
We begin by establishing some relevant notation and definitions. Let ),( εν=G be a strongly
connected directed graph, where the vertices in ν represent network devices (routers and end-
hosts) and the edges in ε represent links between those devices. Additionally, let ρ be the set of all
paths between end-hosts in the network (pre-determined by commercial Internet routing policies),
and let ||ν=vn , || ε=en and || ρ=pn denote, respectively, the number of devices, links, and
paths.
Many network path characteristics are additive of their constituent elements; e.g. path delays can
be represented as the sum of its constituent link delays il (Figure 6.2).
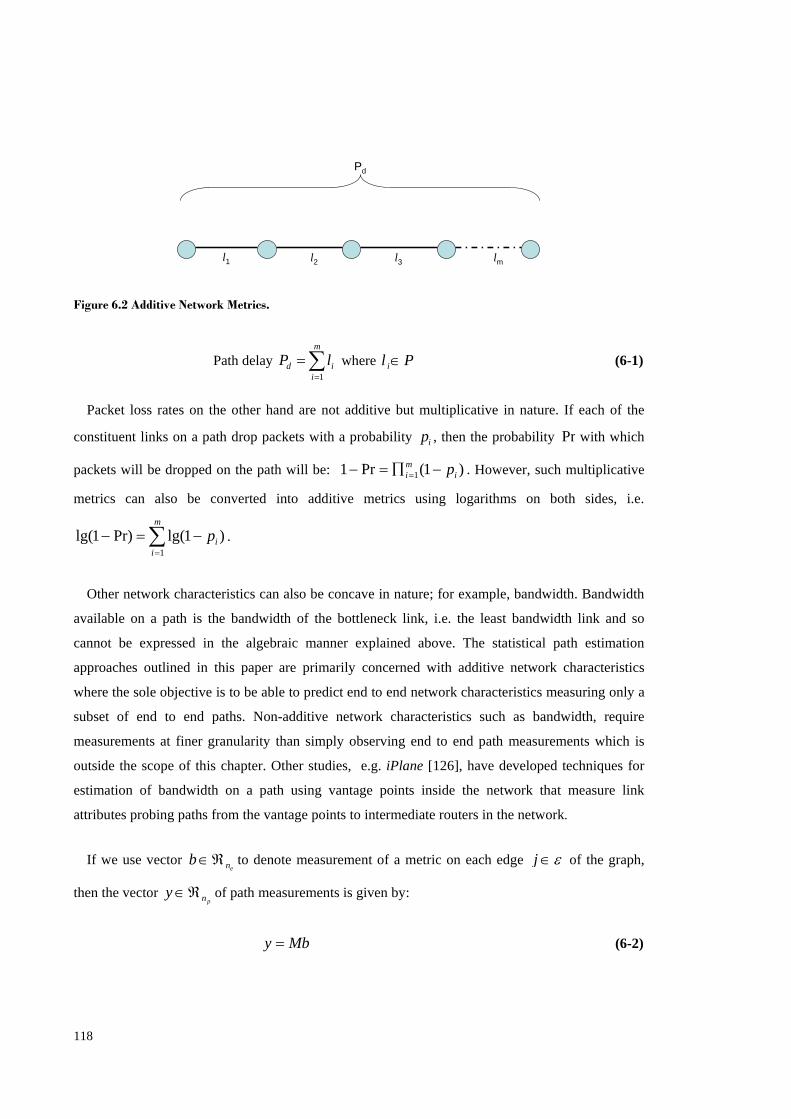
118
Path delay ∑=
=m
iid lP
1 where Pl i∈ (6-1)
Packet loss rates on the other hand are not additive but multiplicative in nature. If each of the
constituent links on a path drop packets with a probability ip , then the probability Pr with which
packets will be dropped on the path will be: )1(Pr1 1 imi p−∏=− = . However, such multiplicative
metrics can also be converted into additive metrics using logarithms on both sides, i.e.
∑=
−=−m
iip
1)1lg(Pr)1lg( .
Other network characteristics can also be concave in nature; for example, bandwidth. Bandwidth
available on a path is the bandwidth of the bottleneck link, i.e. the least bandwidth link and so
cannot be expressed in the algebraic manner explained above. The statistical path estimation
approaches outlined in this paper are primarily concerned with additive network characteristics
where the sole objective is to be able to predict end to end network characteristics measuring only a
subset of end to end paths. Non-additive network characteristics such as bandwidth, require
measurements at finer granularity than simply observing end to end path measurements which is
outside the scope of this chapter. Other studies, e.g. iPlane [126], have developed techniques for
estimation of bandwidth on a path using vantage points inside the network that measure link
attributes probing paths from the vantage points to intermediate routers in the network.
If we use vector enb ℜ∈ to denote measurement of a metric on each edge ε∈j of the graph,
then the vector pny ℜ∈ of path measurements is given by:
Mby = (6-2)
l1 l2 l3 lm
Pd
Figure 6.2 Additive Network Metrics.
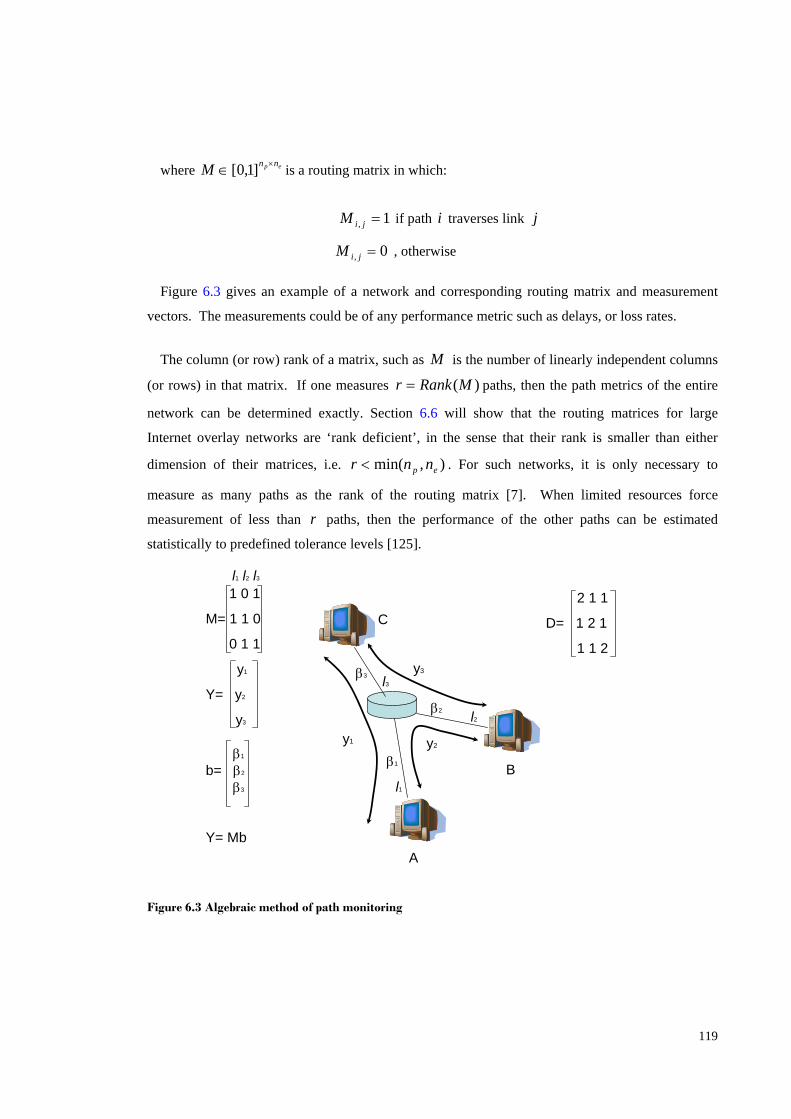
119
where ep nnM ×∈ ]1,0[ is a routing matrix in which:
1, =jiM if path i traverses link j
0, =jiM , otherwise
Figure 6.3 gives an example of a network and corresponding routing matrix and measurement
vectors. The measurements could be of any performance metric such as delays, or loss rates.
The column (or row) rank of a matrix, such as M is the number of linearly independent columns
(or rows) in that matrix. If one measures )(MRankr = paths, then the path metrics of the entire
network can be determined exactly. Section 6.6 will show that the routing matrices for large
Internet overlay networks are ‘rank deficient’, in the sense that their rank is smaller than either
dimension of their matrices, i.e. ),min( ep nnr < . For such networks, it is only necessary to
measure as many paths as the rank of the routing matrix [7]. When limited resources force
measurement of less than r paths, then the performance of the other paths can be estimated
statistically to predefined tolerance levels [125].
β1
A
B
C
1 0 1
M= 1 1 0
0 1 1
y1
Y= y2
y3
β1
b= β2
β3
Y= Mb
y1 y2
y3
β2
β3
l2
l1
l3
l1 l2 l32 1 1
D= 1 2 1
1 1 2
Figure 6.3 Algebraic method of path monitoring
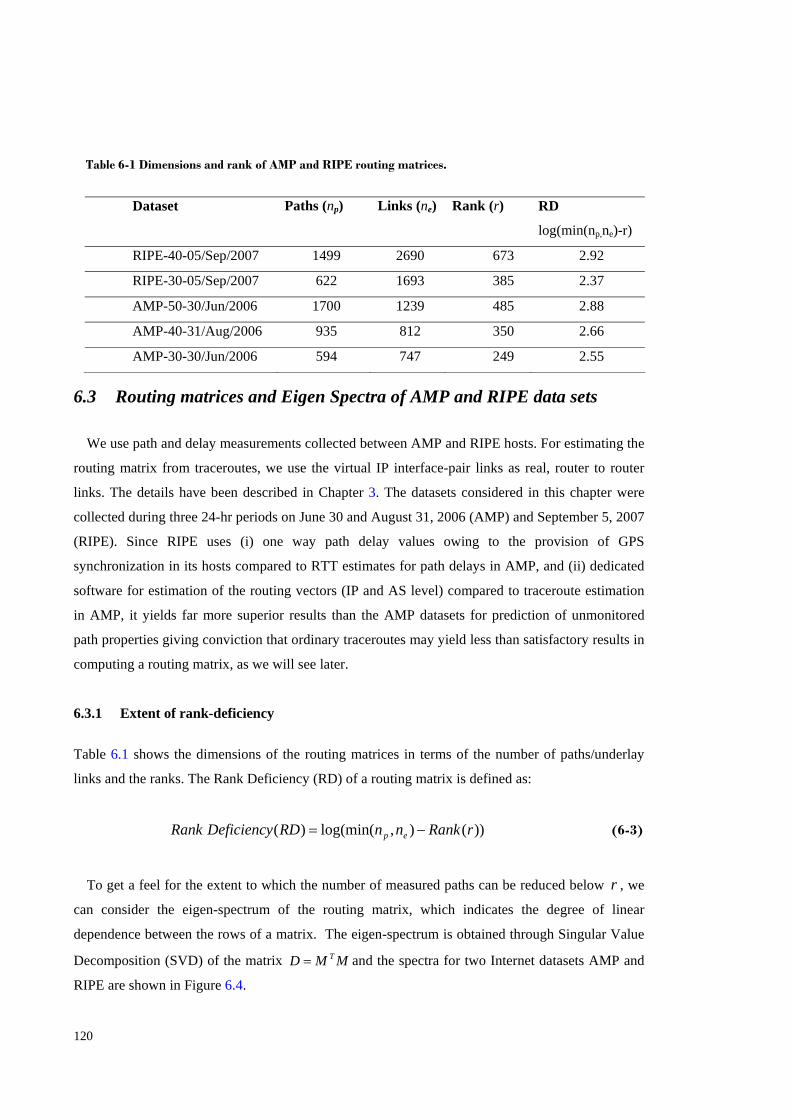
120
6.3 Routing matrices and Eigen Spectra of AMP and RIPE data sets
We use path and delay measurements collected between AMP and RIPE hosts. For estimating the
routing matrix from traceroutes, we use the virtual IP interface-pair links as real, router to router
links. The details have been described in Chapter 3. The datasets considered in this chapter were
collected during three 24-hr periods on June 30 and August 31, 2006 (AMP) and September 5, 2007
(RIPE). Since RIPE uses (i) one way path delay values owing to the provision of GPS
synchronization in its hosts compared to RTT estimates for path delays in AMP, and (ii) dedicated
software for estimation of the routing vectors (IP and AS level) compared to traceroute estimation
in AMP, it yields far more superior results than the AMP datasets for prediction of unmonitored
path properties giving conviction that ordinary traceroutes may yield less than satisfactory results in
computing a routing matrix, as we will see later.
6.3.1 Extent of rank-deficiency
Table 6.1 shows the dimensions of the routing matrices in terms of the number of paths/underlay
links and the ranks. The Rank Deficiency (RD) of a routing matrix is defined as:
))(),log(min()( rRanknnRDDeficiencyRank ep −= (6-3)
To get a feel for the extent to which the number of measured paths can be reduced below r , we
can consider the eigen-spectrum of the routing matrix, which indicates the degree of linear
dependence between the rows of a matrix. The eigen-spectrum is obtained through Singular Value
Decomposition (SVD) of the matrix MMD T= and the spectra for two Internet datasets AMP and
RIPE are shown in Figure 6.4.
Table 6-1 Dimensions and rank of AMP and RIPE routing matrices.
Dataset Paths (np) Links (ne) Rank (r) RD
log(min(np,ne)-r)
RIPE-40-05/Sep/2007 1499 2690 673 2.92
RIPE-30-05/Sep/2007 622 1693 385 2.37
AMP-50-30/Jun/2006 1700 1239 485 2.88
AMP-40-31/Aug/2006 935 812 350 2.66
AMP-30-30/Jun/2006 594 747 249 2.55
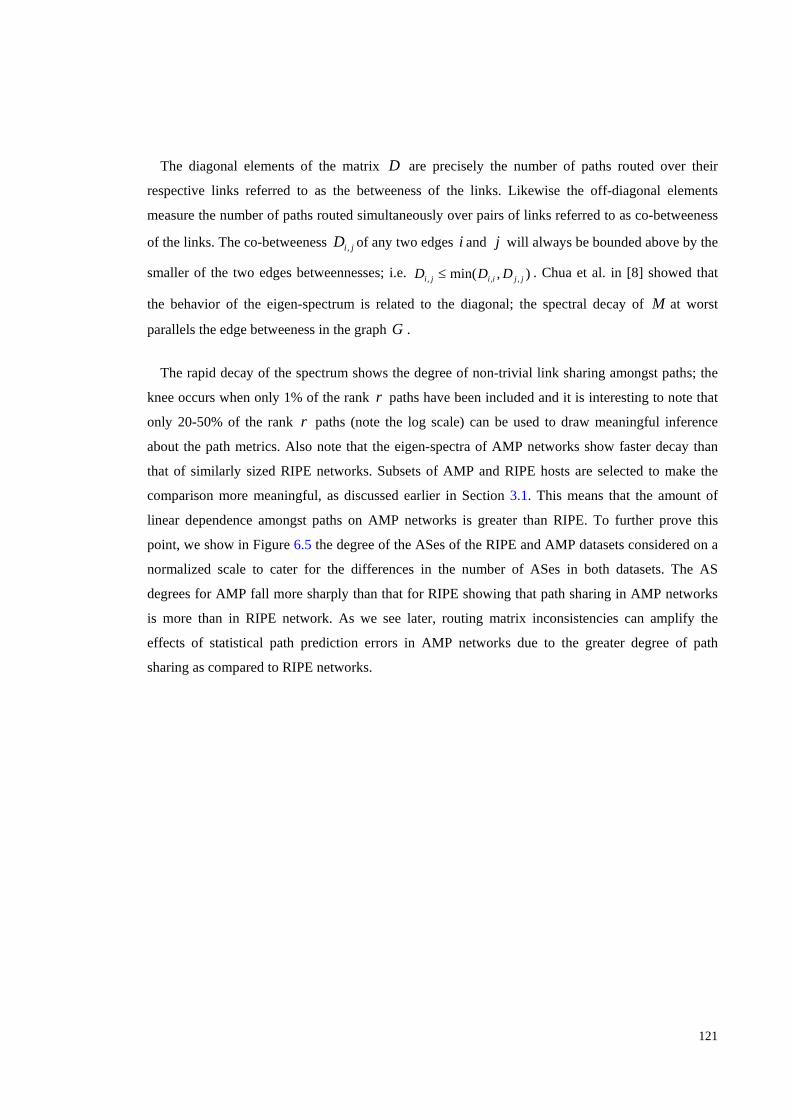
121
The diagonal elements of the matrix D are precisely the number of paths routed over their
respective links referred to as the betweeness of the links. Likewise the off-diagonal elements
measure the number of paths routed simultaneously over pairs of links referred to as co-betweeness
of the links. The co-betweeness jiD , of any two edges i and j will always be bounded above by the
smaller of the two edges betweennesses; i.e. ),min( ,,, jjiiji DDD ≤ . Chua et al. in [8] showed that
the behavior of the eigen-spectrum is related to the diagonal; the spectral decay of M at worst
parallels the edge betweeness in the graph G .
The rapid decay of the spectrum shows the degree of non-trivial link sharing amongst paths; the
knee occurs when only 1% of the rank r paths have been included and it is interesting to note that
only 20-50% of the rank r paths (note the log scale) can be used to draw meaningful inference
about the path metrics. Also note that the eigen-spectra of AMP networks show faster decay than
that of similarly sized RIPE networks. Subsets of AMP and RIPE hosts are selected to make the
comparison more meaningful, as discussed earlier in Section 3.1. This means that the amount of
linear dependence amongst paths on AMP networks is greater than RIPE. To further prove this
point, we show in Figure 6.5 the degree of the ASes of the RIPE and AMP datasets considered on a
normalized scale to cater for the differences in the number of ASes in both datasets. The AS
degrees for AMP fall more sharply than that for RIPE showing that path sharing in AMP networks
is more than in RIPE network. As we see later, routing matrix inconsistencies can amplify the
effects of statistical path prediction errors in AMP networks due to the greater degree of path
sharing as compared to RIPE networks.
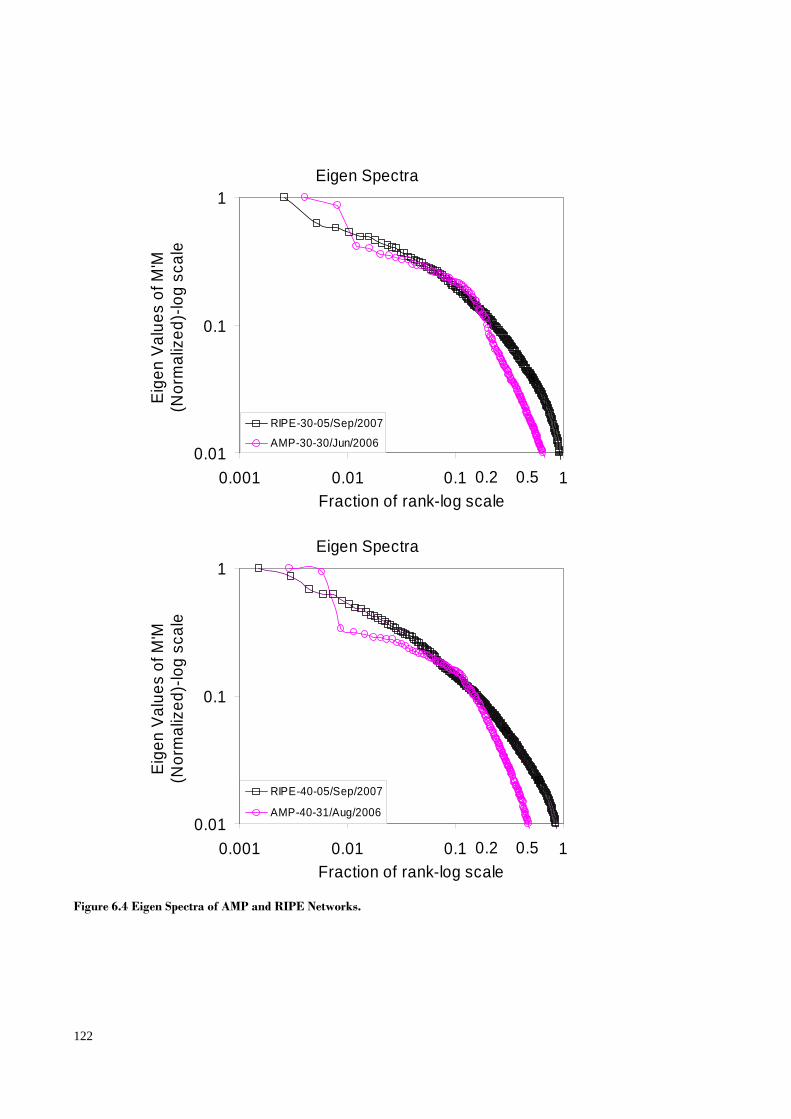
122
Eigen Spectra
0.01
0.1
1
0.001 0.01 0.1 1Fraction of rank-log scale
Eige
n Va
lues
of M
'M
(Nor
mal
ized
)-lo
g sc
ale
RIPE-30-05/Sep/2007
AMP-30-30/Jun/2006
0.50.2
Eigen Spectra
0.01
0.1
1
0.001 0.01 0.1 1Fraction of rank-log scale
Eige
n Va
lues
of M
'M
(Nor
mal
ized
)-lo
g sc
ale
RIPE-40-05/Sep/2007
AMP-40-31/Aug/2006
0.50.2
Figure 6.4 Eigen Spectra of AMP and RIPE Networks.
123
6.4 Selecting a Subset of Paths for Monitoring and Predicting the Unmonitored Paths Using Best Linear Predictor
As described in the previous section, in order to completely infer network performance one needs
to monitor paths corresponding to the r largest (or all non-zero) singular values (the square roots of
eigen-values). To save monitoring overheads, we can monitor a subset k of
rank r paths( rk ≤ ) paths, corresponding to the k largest singular values. From this subset of
paths we can estimate the link metrics vector, from which we can estimate the metrics for the
remaining paths. Finding such a subset of paths is an NP-complete problem, however
approximation algorithms [8, 127] exist for selecting paths approximating the k largest singular
dimensions.
Picking a subset of paths ( )(MRankrk =< ) involves selecting paths that have the highest
singular dimensions, as explained earlier. We use the same algorithm as [8] which is an adaptation
of the subset selection algorithm to select a subset of paths when the path metrics are a sum of link
metrics. Denoting the routing matrix by M and the link covariance matrix by C in order to assign
1
10
100
1000
10000
0.001 0.01 0.1 1ASes sorted according to degree (normalized)
AS
degr
ee
RIPE-40-05/Sep/2007AMP-40-31/Aug/2006
Figure 6.5 AS degree for RIPE and AMP networks.
124
higher weights to paths that are more variable. The algorithm first factorizes ep nnMC × using SVD
into two orthogonal matrices U and V . TUSVMCSVD =)( (6-4)
where Σ=TCC (Σ is the link covariance matrix.)
pp nnU ×ℜ∈ & ee nnV ×ℜ∈
such that,
ep nnp
T diagSVMCU ×ℜ∈== ),...,,()( 21 σσσ ,
),min( ep nnp = and
0...21 ≥≥≥≥ pσσσ
The left singular vectors (i.e. columns of ],...,,[ 21 pnuuuU = ) form an orthogonal basis for the
range of MC and the magnitude of their corresponding singular values indicates their relative
importance. Note that these singular values are the square root of the eigen values of MCMC T)( .
The algorithm makes heuristic use of QR-factorization with column pivoting to find )( rkk ≤ rows
of M that approximate the span of the first k left singular vectors of MC .
QRPU kTk = (6-5)
where knk
pU ×ℜ∈ formed by the first k columns of U ; and pp nnkP ×ℜ∈ is the permutation matrix.
sM is then the submatrix formed by the first k rows of MPTk . The complete algorithm is
described in Algorithm 1.
The GLS based estimation of the link metrics vector is used in the Best Linear (BL) prediction
for unmonitored path delay as in [8]. We use the following equation from [8] to obtain the
estimated delays on unmonitored paths, (see Appendix for its derivation from the estimated value
link-metrics vector (A-7)).
sssrsTrsrr yVVlyylE 1)()|( −= (6-6)
where rl is a column vector for selecting one particular unmonitored path, Tsrrs MMV Σ= and
Tssss MMV Σ= is the covariance between the unmonitored and monitored and between monitored
paths, respectively. ∑ is the link covariance matrix.
125
Using only path information obtained from traceroutes it is difficult to infer second order link
characteristics such as link covariance or link correlation. We present in Figure 6.6, the link
correlation matrices for AMP-30 for all links exhibiting a correlation of 0.25 or more. Figure 6.6a
shows the correlation matrix for intraAS links (with links inside one AS grouped together). Figure
6.6b shows the correlation between interAS links; besides the main diagonal where each element is
one, due to insufficient traceroute information links in different ASes and the interAS links (the off-
diagonal elements) seem to erroneously show sufficient correlation. There is more correlation
between intraAS links than between interAS links. RIPE datasets only reports routing vectors so a
Algorithm 1 (Based on Algorithm 12.2.1 [127] ). Given a path matrix ep nnM ×∈ ]1,0[ and
corresponding path delay matrix pny ℜ∈ where pn and en are the number of paths and links
respectively in the network; the following algorithm computes a subset sM of path matrix M to
select the k rows that approximate the span of the first k left singular values vectors.
Compute the Singular Value Decomposition (SVD) of MC :
where Σ=TCC (Σ is the link covariance matrix.) TUSVMCSVD =)(
(U and V are the left and right singular vectors and S is a diagonal matrix whose diagonal
elements hold the singular values in sorted order.)
for k=1:1:rank r
Apply QR factorization with column pivoting of TkU where ):1(:, kUUk = (i.e.
first k columns)
kTk PUQR =
MPM Tknew = and yPy T
knew =
:),:1( kMM news = and :),:1( pnewr nkMM += where sy and sM refer to the
monitored paths/path matrix rows
:),:1( kyy news = and :),:1( pnewr nkyy += where ry and rM refer to the
unmonitored paths/ path matrix rows
endfor
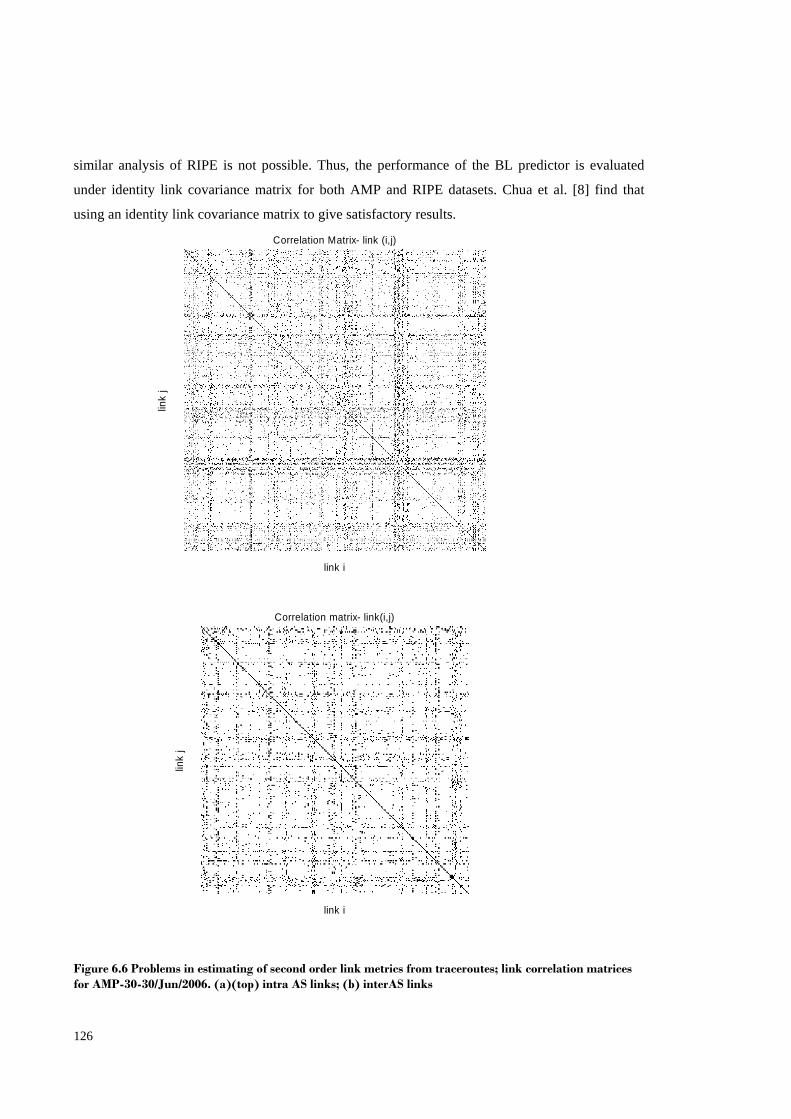
126
similar analysis of RIPE is not possible. Thus, the performance of the BL predictor is evaluated
under identity link covariance matrix for both AMP and RIPE datasets. Chua et al. [8] find that
using an identity link covariance matrix to give satisfactory results.
Correlation Matrix- link (i,j)
link i
link
j
Correlation matrix- link(i,j)
link i
link
j
Figure 6.6 Problems in estimating of second order link metrics from traceroutes; link correlation matrices for AMP-30-30/Jun/2006. (a)(top) intra AS links; (b) interAS links
127
To quantify the accuracy of BL path prediction (Equation 6-6)), we use the L1 error metric which
is defined as:
1
1
ordelay vect actualordelay vect predictedordelay vect actual
1−
=− errorL (6-7)
where 1
. represents the 1l -norm of a vector.
Figure 6.7 shows the L1 error for RIPE and AMP networks as the number of monitored paths are
increased. While L1 error for RIPE appears as a monotonically decreasing function, AMP shows
anomalous behavior in the form of erratic spikes as the number of monitored paths are increased
contrary to expectations. This is due to errors in the estimation of routing matrices for AMP
networks which we explain in detail in the next section.
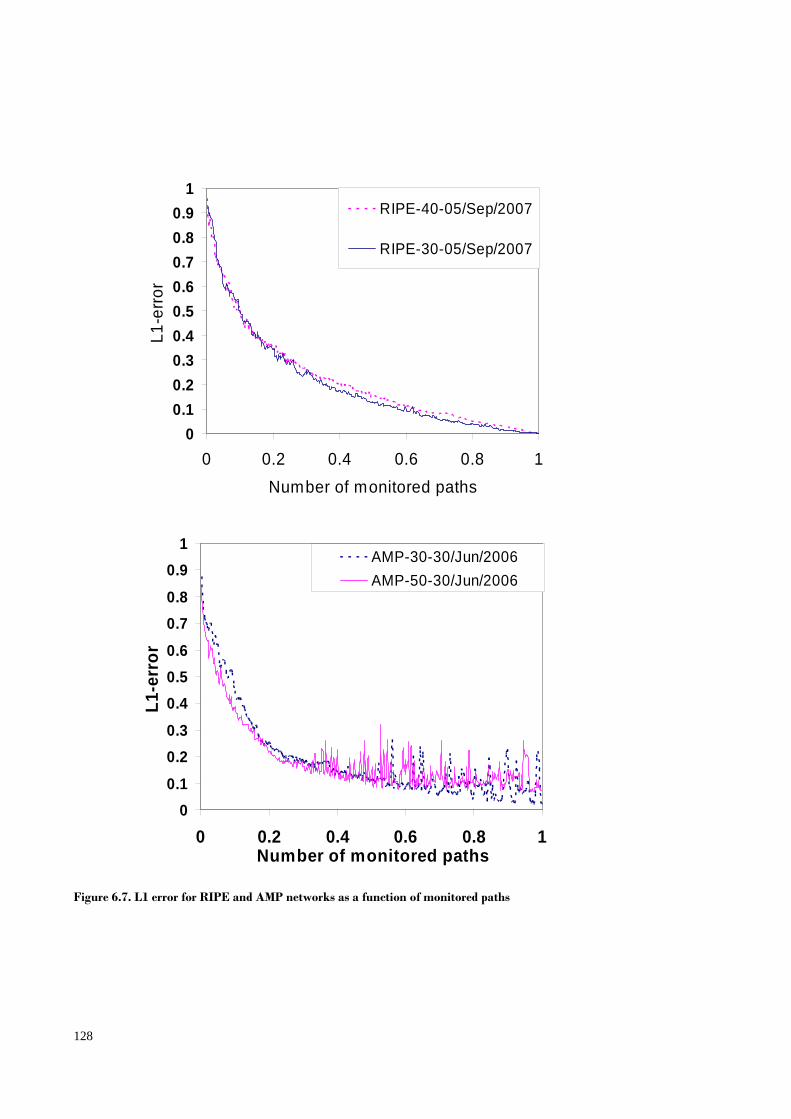
128
00.10.20.30.40.50.60.70.80.9
1
0 0.2 0.4 0.6 0.8 1Number of monitored paths
L1-e
rror
RIPE-40-05/Sep/2007
RIPE-30-05/Sep/2007
00.1
0.20.3
0.40.50.6
0.70.8
0.91
0 0.2 0.4 0.6 0.8 1Number of monitored paths
L1-e
rror
AMP-30-30/Jun/2006AMP-50-30/Jun/2006
Figure 6.7. L1 error for RIPE and AMP networks as a function of monitored paths
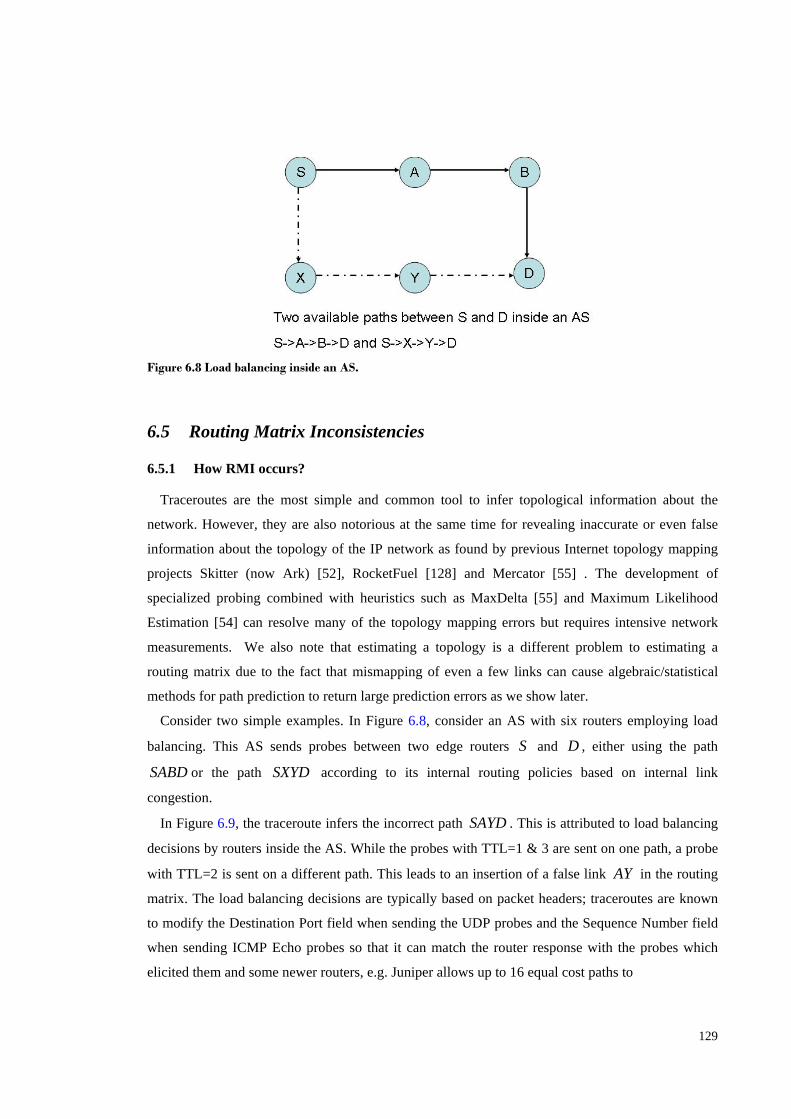
129
6.5 Routing Matrix Inconsistencies 6.5.1 How RMI occurs?
Traceroutes are the most simple and common tool to infer topological information about the
network. However, they are also notorious at the same time for revealing inaccurate or even false
information about the topology of the IP network as found by previous Internet topology mapping
projects Skitter (now Ark) [52], RocketFuel [128] and Mercator [55] . The development of
specialized probing combined with heuristics such as MaxDelta [55] and Maximum Likelihood
Estimation [54] can resolve many of the topology mapping errors but requires intensive network
measurements. We also note that estimating a topology is a different problem to estimating a
routing matrix due to the fact that mismapping of even a few links can cause algebraic/statistical
methods for path prediction to return large prediction errors as we show later.
Consider two simple examples. In Figure 6.8, consider an AS with six routers employing load
balancing. This AS sends probes between two edge routers S and D , either using the path
SABD or the path SXYD according to its internal routing policies based on internal link
congestion.
In Figure 6.9, the traceroute infers the incorrect path SAYD . This is attributed to load balancing
decisions by routers inside the AS. While the probes with TTL=1 & 3 are sent on one path, a probe
with TTL=2 is sent on a different path. This leads to an insertion of a false link AY in the routing
matrix. The load balancing decisions are typically based on packet headers; traceroutes are known
to modify the Destination Port field when sending the UDP probes and the Sequence Number field
when sending ICMP Echo probes so that it can match the router response with the probes which
elicited them and some newer routers, e.g. Juniper allows up to 16 equal cost paths to
Figure 6.8 Load balancing inside an AS.
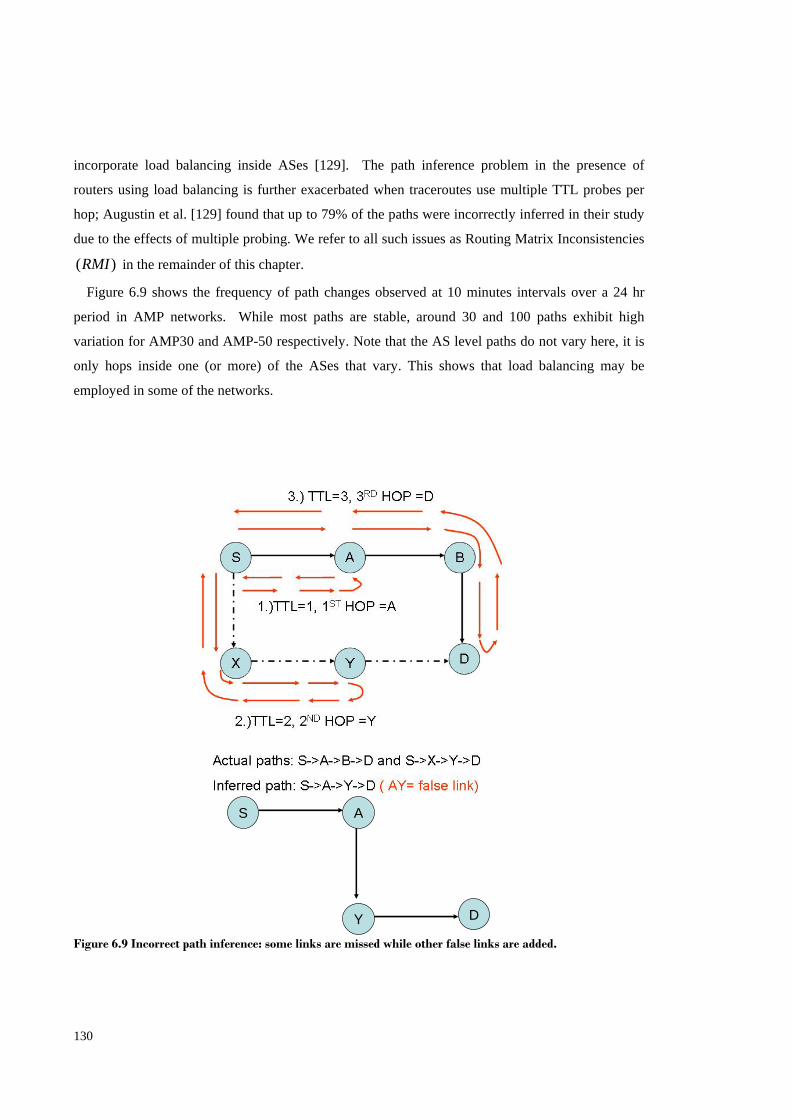
130
incorporate load balancing inside ASes [129]. The path inference problem in the presence of
routers using load balancing is further exacerbated when traceroutes use multiple TTL probes per
hop; Augustin et al. [129] found that up to 79% of the paths were incorrectly inferred in their study
due to the effects of multiple probing. We refer to all such issues as Routing Matrix Inconsistencies
)(RMI in the remainder of this chapter.
Figure 6.9 shows the frequency of path changes observed at 10 minutes intervals over a 24 hr
period in AMP networks. While most paths are stable, around 30 and 100 paths exhibit high
variation for AMP30 and AMP-50 respectively. Note that the AS level paths do not vary here, it is
only hops inside one (or more) of the ASes that vary. This shows that load balancing may be
employed in some of the networks.
S A
Y D
Figure 6.9 Incorrect path inference: some links are missed while other false links are added.

131
Figure 6.11 shows anecdotal evidence of RMI from the AMP June dataset. Consider the first
example where a RMI can occur on the path between amp-upenn and amp-hawaii. Possibly due to
some load balancing mechanism inside AS 11537, the total number of hops decreases from 17 to
16. At the same time, we notice the path delay decreasing from 154 ms to 122 ms. This 32ms
decrease could be attributed to selection of a better delay path inside AS11537 or a different egress
point from AS11537 towards AS7575. Note that we could not ascertain the AS number of the IP
hop 207.231.240.4 that may be a router inside either AS. This example illustrates that when using
path measurements to infer link measurements; if path changes, then delay can change, which may
lead to incorrect inference of link measurements until it is recognized that the path has changed (by
traceroute every 10 minutes). This further shows the case of a diamond anomaly [129] caused by
traceroute probes probing multiple paths between two routers inside a load balanced AS (Figure
6.9).
05
10152025303540
1 10 100 1000 10000Paths (log scale)
Num
ber o
f pat
h va
riatio
ns
AMP-30-30/Jun/2006AMP-50-30/Jun/2006
Figure 6.10 Frequency of path variation in AMP networks over 24 hr period
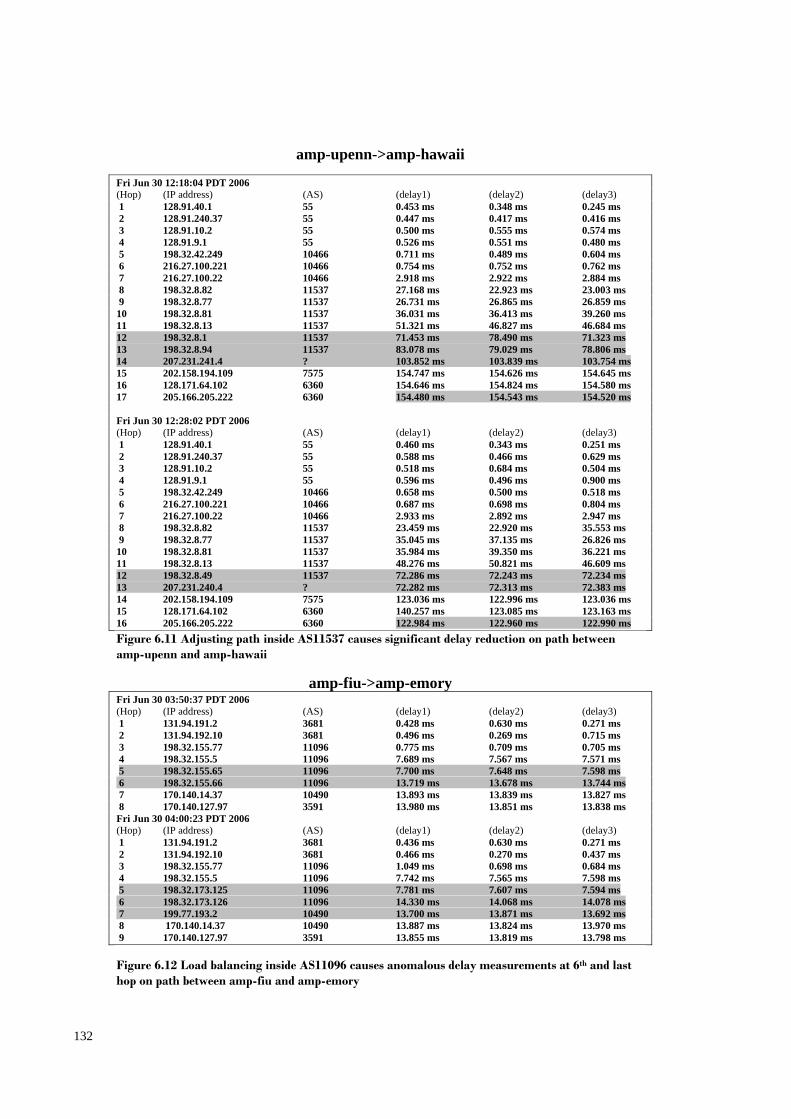
132
amp-upenn->amp-hawaii Fri Jun 30 12:18:04 PDT 2006 (Hop) (IP address) (AS) (delay1) (delay2) (delay3) 1 128.91.40.1 55 0.453 ms 0.348 ms 0.245 ms 2 128.91.240.37 55 0.447 ms 0.417 ms 0.416 ms 3 128.91.10.2 55 0.500 ms 0.555 ms 0.574 ms 4 128.91.9.1 55 0.526 ms 0.551 ms 0.480 ms 5 198.32.42.249 10466 0.711 ms 0.489 ms 0.604 ms 6 216.27.100.221 10466 0.754 ms 0.752 ms 0.762 ms 7 216.27.100.22 10466 2.918 ms 2.922 ms 2.884 ms 8 198.32.8.82 11537 27.168 ms 22.923 ms 23.003 ms 9 198.32.8.77 11537 26.731 ms 26.865 ms 26.859 ms 10 198.32.8.81 11537 36.031 ms 36.413 ms 39.260 ms 11 198.32.8.13 11537 51.321 ms 46.827 ms 46.684 ms 12 198.32.8.1 11537 71.453 ms 78.490 ms 71.323 ms 13 198.32.8.94 11537 83.078 ms 79.029 ms 78.806 ms 14 207.231.241.4 ? 103.852 ms 103.839 ms 103.754 ms 15 202.158.194.109 7575 154.747 ms 154.626 ms 154.645 ms 16 128.171.64.102 6360 154.646 ms 154.824 ms 154.580 ms 17 205.166.205.222 6360 154.480 ms 154.543 ms 154.520 ms Fri Jun 30 12:28:02 PDT 2006 (Hop) (IP address) (AS) (delay1) (delay2) (delay3) 1 128.91.40.1 55 0.460 ms 0.343 ms 0.251 ms 2 128.91.240.37 55 0.588 ms 0.466 ms 0.629 ms 3 128.91.10.2 55 0.518 ms 0.684 ms 0.504 ms 4 128.91.9.1 55 0.596 ms 0.496 ms 0.900 ms 5 198.32.42.249 10466 0.658 ms 0.500 ms 0.518 ms 6 216.27.100.221 10466 0.687 ms 0.698 ms 0.804 ms 7 216.27.100.22 10466 2.933 ms 2.892 ms 2.947 ms 8 198.32.8.82 11537 23.459 ms 22.920 ms 35.553 ms 9 198.32.8.77 11537 35.045 ms 37.135 ms 26.826 ms 10 198.32.8.81 11537 35.984 ms 39.350 ms 36.221 ms 11 198.32.8.13 11537 48.276 ms 50.821 ms 46.609 ms 12 198.32.8.49 11537 72.286 ms 72.243 ms 72.234 ms 13 207.231.240.4 ? 72.282 ms 72.313 ms 72.383 ms 14 202.158.194.109 7575 123.036 ms 122.996 ms 123.036 ms 15 128.171.64.102 6360 140.257 ms 123.085 ms 123.163 ms 16 205.166.205.222 6360 122.984 ms 122.960 ms 122.990 ms Figure 6.11 Adjusting path inside AS11537 causes significant delay reduction on path between amp-upenn and amp-hawaii
amp-fiu->amp-emory
Fri Jun 30 03:50:37 PDT 2006 (Hop) (IP address) (AS) (delay1) (delay2) (delay3) 1 131.94.191.2 3681 0.428 ms 0.630 ms 0.271 ms 2 131.94.192.10 3681 0.496 ms 0.269 ms 0.715 ms 3 198.32.155.77 11096 0.775 ms 0.709 ms 0.705 ms 4 198.32.155.5 11096 7.689 ms 7.567 ms 7.571 ms 5 198.32.155.65 11096 7.700 ms 7.648 ms 7.598 ms 6 198.32.155.66 11096 13.719 ms 13.678 ms 13.744 ms 7 170.140.14.37 10490 13.893 ms 13.839 ms 13.827 ms 8 170.140.127.97 3591 13.980 ms 13.851 ms 13.838 ms Fri Jun 30 04:00:23 PDT 2006 (Hop) (IP address) (AS) (delay1) (delay2) (delay3) 1 131.94.191.2 3681 0.436 ms 0.630 ms 0.271 ms 2 131.94.192.10 3681 0.466 ms 0.270 ms 0.437 ms 3 198.32.155.77 11096 1.049 ms 0.698 ms 0.684 ms 4 198.32.155.5 11096 7.742 ms 7.565 ms 7.598 ms 5 198.32.173.125 11096 7.781 ms 7.607 ms 7.594 ms 6 198.32.173.126 11096 14.330 ms 14.068 ms 14.078 ms 7 199.77.193.2 10490 13.700 ms 13.871 ms 13.692 ms 8 170.140.14.37 10490 13.887 ms 13.824 ms 13.970 ms 9 170.140.127.97 3591 13.855 ms 13.819 ms 13.798 ms Figure 6.12 Load balancing inside AS11096 causes anomalous delay measurements at 6th and last hop on path between amp-fiu and amp-emory
133
Our second example in Figure 6.12 shows the traceroute snippet on the path between amp-fiu and
am-emory. Here load balancing inside AS11096 introduces an anomalous measurement on the sixth
hop which is greater than the round-trip delay to the seventh hop. This could be due to the case
highlighted in Figure 6.9, Note the two IP addresses 198.32.173.125 and 198.32.173.126 represent
a contiguous set and may have belonged to the same router here, but the large difference in delay
measurements between the two suggests otherwise.
The third example (Figure 6.13) is a more classic case of dynamic load balancing inside
AS11537 where the path through this AS is different inside the same 10 minute window (12:20 to
12:30) used for conducting traceroute measurements. While several paths to amp-hawaii flipped
from amp-bu, amp-upenn, amp-princeton etc to the newer paths at differing times (inside AS11537)
and seemingly continued the same way for the remainder of the day based on traceroute data (at 10
min intervals), the path between amp-nyu and amp-hawaii seemed to be immune to this change.
Apparently here the load balancing decision incorporates some routing policy.
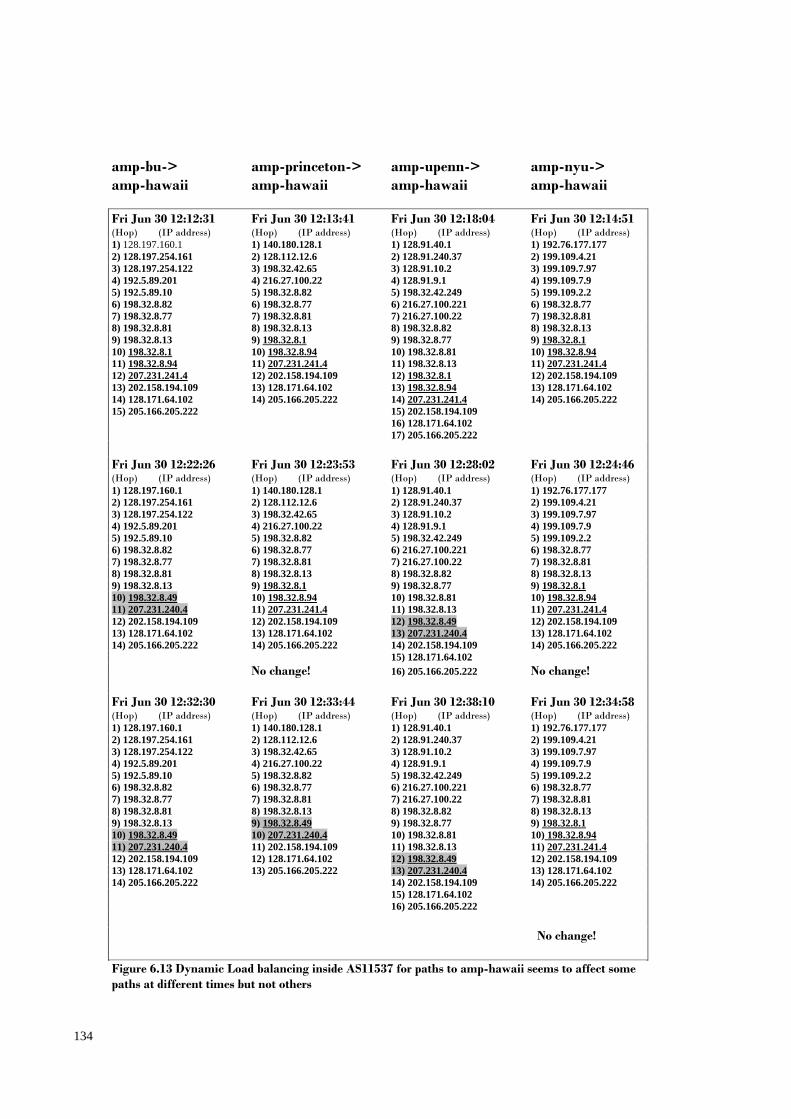
134
amp-bu-> amp-princeton-> amp-upenn-> amp-nyu-> amp-hawaii amp-hawaii amp-hawaii amp-hawaii Fri Jun 30 12:12:31 Fri Jun 30 12:13:41 Fri Jun 30 12:18:04 Fri Jun 30 12:14:51 (Hop) (IP address) (Hop) (IP address) (Hop) (IP address) (Hop) (IP address) 1) 128.197.160.1 1) 140.180.128.1 1) 128.91.40.1 1) 192.76.177.177 2) 128.197.254.161 2) 128.112.12.6 2) 128.91.240.37 2) 199.109.4.21 3) 128.197.254.122 3) 198.32.42.65 3) 128.91.10.2 3) 199.109.7.97 4) 192.5.89.201 4) 216.27.100.22 4) 128.91.9.1 4) 199.109.7.9 5) 192.5.89.10 5) 198.32.8.82 5) 198.32.42.249 5) 199.109.2.2 6) 198.32.8.82 6) 198.32.8.77 6) 216.27.100.221 6) 198.32.8.77 7) 198.32.8.77 7) 198.32.8.81 7) 216.27.100.22 7) 198.32.8.81 8) 198.32.8.81 8) 198.32.8.13 8) 198.32.8.82 8) 198.32.8.13 9) 198.32.8.13 9) 198.32.8.1 9) 198.32.8.77 9) 198.32.8.1 10) 198.32.8.1 10) 198.32.8.94 10) 198.32.8.81 10) 198.32.8.94 11) 198.32.8.94 11) 207.231.241.4 11) 198.32.8.13 11) 207.231.241.4 12) 207.231.241.4 12) 202.158.194.109 12) 198.32.8.1 12) 202.158.194.109 13) 202.158.194.109 13) 128.171.64.102 13) 198.32.8.94 13) 128.171.64.102 14) 128.171.64.102 14) 205.166.205.222 14) 207.231.241.4 14) 205.166.205.222 15) 205.166.205.222 15) 202.158.194.109 16) 128.171.64.102 17) 205.166.205.222 Fri Jun 30 12:22:26 Fri Jun 30 12:23:53 Fri Jun 30 12:28:02 Fri Jun 30 12:24:46 (Hop) (IP address) (Hop) (IP address) (Hop) (IP address) (Hop) (IP address) 1) 128.197.160.1 1) 140.180.128.1 1) 128.91.40.1 1) 192.76.177.177 2) 128.197.254.161 2) 128.112.12.6 2) 128.91.240.37 2) 199.109.4.21 3) 128.197.254.122 3) 198.32.42.65 3) 128.91.10.2 3) 199.109.7.97 4) 192.5.89.201 4) 216.27.100.22 4) 128.91.9.1 4) 199.109.7.9 5) 192.5.89.10 5) 198.32.8.82 5) 198.32.42.249 5) 199.109.2.2 6) 198.32.8.82 6) 198.32.8.77 6) 216.27.100.221 6) 198.32.8.77 7) 198.32.8.77 7) 198.32.8.81 7) 216.27.100.22 7) 198.32.8.81 8) 198.32.8.81 8) 198.32.8.13 8) 198.32.8.82 8) 198.32.8.13 9) 198.32.8.13 9) 198.32.8.1 9) 198.32.8.77 9) 198.32.8.1 10) 198.32.8.49 10) 198.32.8.94 10) 198.32.8.81 10) 198.32.8.94 11) 207.231.240.4 11) 207.231.241.4 11) 198.32.8.13 11) 207.231.241.4 12) 202.158.194.109 12) 202.158.194.109 12) 198.32.8.49 12) 202.158.194.109 13) 128.171.64.102 13) 128.171.64.102 13) 207.231.240.4 13) 128.171.64.102 14) 205.166.205.222 14) 205.166.205.222 14) 202.158.194.109 14) 205.166.205.222 15) 128.171.64.102 No change! 16) 205.166.205.222 No change! Fri Jun 30 12:32:30 Fri Jun 30 12:33:44 Fri Jun 30 12:38:10 Fri Jun 30 12:34:58 (Hop) (IP address) (Hop) (IP address) (Hop) (IP address) (Hop) (IP address) 1) 128.197.160.1 1) 140.180.128.1 1) 128.91.40.1 1) 192.76.177.177 2) 128.197.254.161 2) 128.112.12.6 2) 128.91.240.37 2) 199.109.4.21 3) 128.197.254.122 3) 198.32.42.65 3) 128.91.10.2 3) 199.109.7.97 4) 192.5.89.201 4) 216.27.100.22 4) 128.91.9.1 4) 199.109.7.9 5) 192.5.89.10 5) 198.32.8.82 5) 198.32.42.249 5) 199.109.2.2 6) 198.32.8.82 6) 198.32.8.77 6) 216.27.100.221 6) 198.32.8.77 7) 198.32.8.77 7) 198.32.8.81 7) 216.27.100.22 7) 198.32.8.81 8) 198.32.8.81 8) 198.32.8.13 8) 198.32.8.82 8) 198.32.8.13 9) 198.32.8.13 9) 198.32.8.49 9) 198.32.8.77 9) 198.32.8.1 10) 198.32.8.49 10) 207.231.240.4 10) 198.32.8.81 10) 198.32.8.94 11) 207.231.240.4 11) 202.158.194.109 11) 198.32.8.13 11) 207.231.241.4 12) 202.158.194.109 12) 128.171.64.102 12) 198.32.8.49 12) 202.158.194.109 13) 128.171.64.102 13) 205.166.205.222 13) 207.231.240.4 13) 128.171.64.102 14) 205.166.205.222 14) 202.158.194.109 14) 205.166.205.222 15) 128.171.64.102 16) 205.166.205.222 No change! Figure 6.13 Dynamic Load balancing inside AS11537 for paths to amp-hawaii seems to affect some paths at different times but not others
135
To demonstrate the effects of routing matrix inconsistencies we formulated the problem as a
linear optimization problem to estimate the link metric vector as explained below.
Link-Metric Vector Estimation based on the 1l -norm minimization (Least Norm / Sparse Solution)
Coates et al. [22] showed that estimating the link-metrics vector can be based on the underlying
idea that only a few links in the network have significant delays and the remaining links have very
insignificant delays close to zero. Previous works e.g. [130] showed that such combinatorial
problems can be relaxed to an optimization problem and one approach to obtaining a sparse (least
norm) estimate of β is to solve an 0l optimization problem of the form,
ββββ ss My == subject to minargˆ
0 (6-8)
where sy and sM respectively denote the rows of y and M to be monitored and β counts the
number of the non-zero entries of β .
It is well known that this problem is NP-hard, requiring one to enumerate all possible subsets of
non-zero coefficients. Candes et al. [131] showed that if certain conditions on sM and β are met,
the 0l optimization problem is equivalent to the following simpler 1l optimization problem.
ββββ ss My == subject to minargˆ
1 (6-9)
where ∑=
=n
ii
11
ββ .
Because the 1l optimization is convex, it is computationally tractable, and a solution can be
obtained using linear programming. In addition to the constraints of (6-6) we also impose positivity
constraints on the estimation of β i.e. 0>β for eni <<1 . This is because if the routing matrix
does not contain any inconsistencies then ideally the optimizer should allow for all links to attain
positive values.
In addition, Donoho [132] further comments on 1l -optimization, “ in “most” applications in
science and technology, of course, the underlying model will not be perfectly correct and
measurements will not be perfectly accurate. It is essential to use procedures which are robust
against the effects of measurement noise and modelling error.” He further comments that when
matrices underlying underdetermined systems have a sufficiently sparse near-solution, “…the near-
solution with minimal 1l norm is a good approximation to it”. Bruckstein et al. in [133] show that if

136
we further impose non-negativity constraints on the solution in addition to its sparsity, we get a
solution that is unique.
For AMP networks (Figure 6.14) we observe that as the number of monitored paths increases
leading to more stringent constraints for the CO estimator, we see sharp spikes where the predictor
yields high prediction error because the optimizer fails to assign non-negative delays to all links and
terminates prematurely. Moreover, the L1 error does not reach zero even when all rank r paths are
selected for monitoring and the algorithm diverges for AMP-50 after 150 paths are selected for
monitoring. This adds conviction to our initial suspicion that it is due to the presence of routing
matrix inconsistencies.

137
AMP-30-30/Jun/2006
00.10.20.30.40.50.60.70.80.9
1
0 50 100 150 200 250Number of monitored paths
L1-e
rror
AMP-50-30/Jun/2006
0
0.1
0.2
0.3
0.4
0.5
0.6
0.7
0.8
0.9
1
0 50 100 150 200 250 300 350 400 450 500
Number of monitored paths
L1-e
rror
Figure 6.14 Comparison of performance of CO estimator for AMP networks.
138
6.5.2 Can RMI be eliminated? The next question is can we identify the rows of the routing matrix M that are the source of RMI.
However, finding such rows is a NP-hard problem, since it would require enumerating all possible
subsets of rows to be plugged into CO estimator to find out the rows containing the inconsistencies.
Since, it is very difficult to infer the actually topology by identification of RMI using only
traceroute snapshot of the network. We propose a straw-man algorithm. Our algorithm for inferring
a consistent routing matrix is centered around removal of false links as highlighted earlier. We first
tabulate all link delays over each 10 min interval as recorded by the traceroutes. Of the three values
for the nth hop, the link delay between the n-lth and the nth hop is calculated taking into view the
least positive non-negative value. This is because it is well known that ICMP replies by routers to
TTL expired packets sent by traceroutes are often rate limited. Similarly, when all three yield a
negative value for the link delay we take the least negative value for the obvious reason. We then
map the topology discovered by the traceroutes into a directed graph G=(V,E) where the vertex set
V represents routers (using the router interface IP address) and the edge set E represents directed
edges between two routers.
We introduced the concept of false links in the preceding section (Figure 6.9). Some of these
false links connect the source with a vertex in the graph by a false link for which there already
exists a path albeit a different one; others connect two vertices for which there is no path in the
actual graph (and the real network!). Such false links can be detected easily in situations when a
link is sighted with seemingly negative value in the majority of the traceroutes and we can be
almost sure that it is not due to a router delaying an ICMP response. Such negative delay links are
removed by finding if there exists another set of links joining the same two vertices without
encountering a negative delay link. This we call the Deletion With Replacement (DWR) heuristic.
If not, then we simply delete the false link ⟩⟨ +1, ii νν and replace it with a new edge by inserting an
edge between one previous vertex 1−iν and 1+iν to yield a longer link ⟩⟨ +− 11 , ii νν with a non-
negative delay as shown in Figure 6.15. We call this as the Deletion With Insertion (DWI) heuristic.
We take care not to detect or delete any interAS link in this manner so as not to destroy the
connectivity of the graph. We use an iterative greedy algorithm for the detection and removal of
such false links exhibiting negative delay values, removing links in turn which lead to the most
reduction of anomalous paths until all anomalies have been resolved. We find that this naïve
algorithm only works for the smaller AMP-30 network but fails to work for AMP-50 (Figure 6.16).
Statistical techniques will be introduced in Section 6.7 to mitigate the effects of RMI.
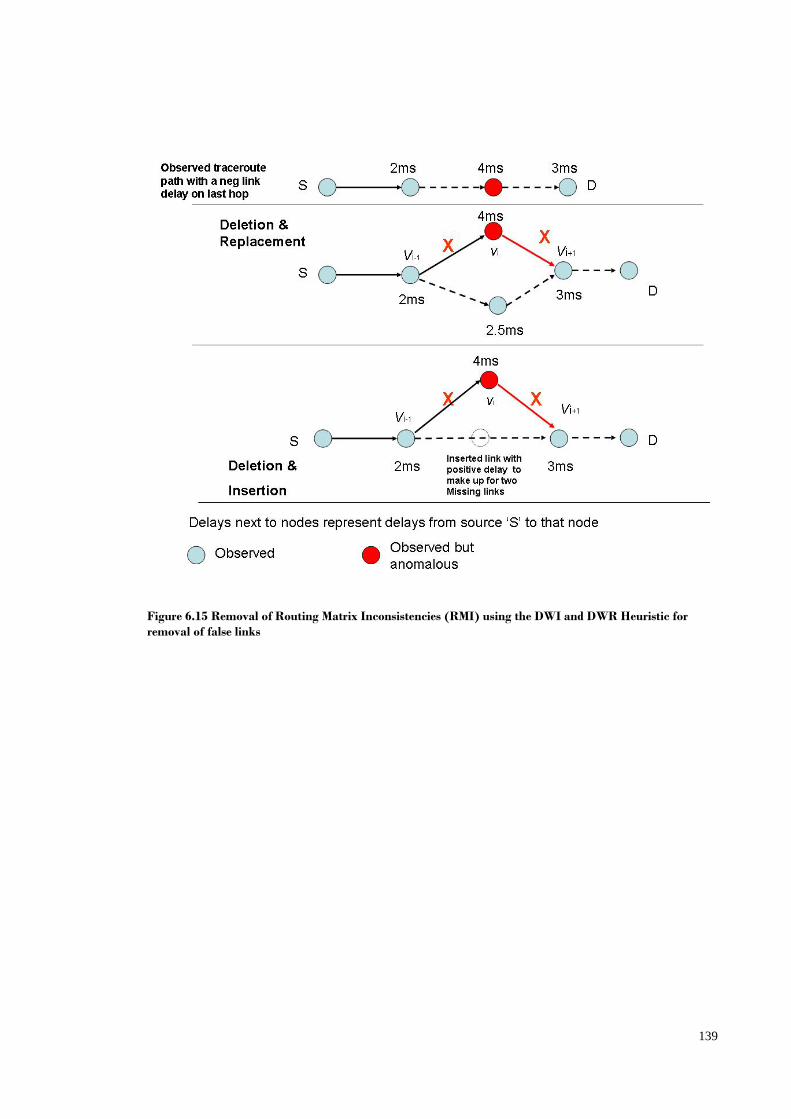
139
Figure 6.15 Removal of Routing Matrix Inconsistencies (RMI) using the DWI and DWR Heuristic for removal of false links
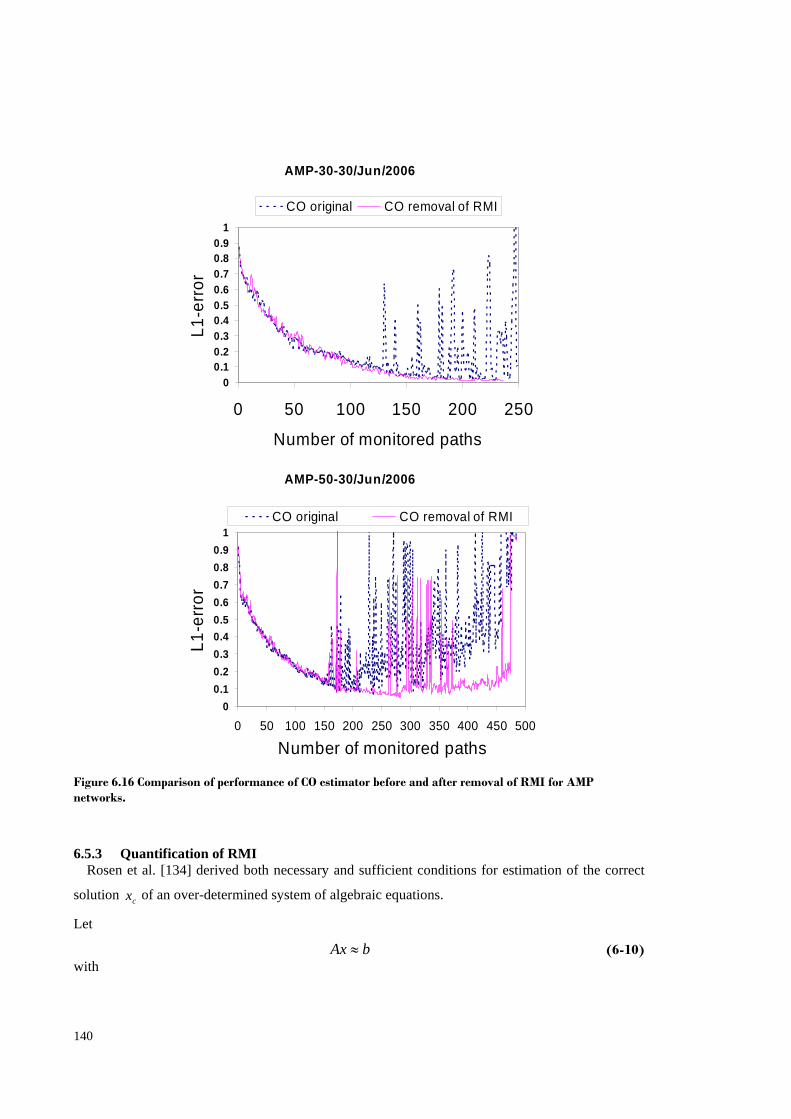
140
6.5.3 Quantification of RMI Rosen et al. [134] derived both necessary and sufficient conditions for estimation of the correct
solution cx of an over-determined system of algebraic equations.
Let
bAx ≈ (6-10) with
AMP-30-30/Jun/2006
00.10.20.30.40.50.60.70.80.9
1
0 50 100 150 200 250
Number of monitored paths
L1-e
rror
CO original CO removal of RMI
AMP-50-30/Jun/2006
00.10.20.30.40.50.60.70.80.9
1
0 50 100 150 200 250 300 350 400 450 500
Number of monitored paths
L1-e
rror
CO original CO removal of RMI
Figure 6.16 Comparison of performance of CO estimator before and after removal of RMI for AMP networks.

141
nmA ×ℜ∈ with full column rank n ( nm > ) and, nb ℜ∈
and there are large errors in some rows of ] [ bA with the underlying assumption being that there is
a correct (but unknown) matrix cA and cb . They find that the probability P that the calculated
solution *x will be close to the correct solution cx depends largely on the magnitude of the size of
the measurement data, the parameter nm − . Using an empirical model they find that as an upper
bound;
1=P when σk
nnm 2)(
≥−
[134] (6-11)
where
k is the number of rows of ] [ bA containing large errors (independent of the number of
errors in any particular row of A); and,
σ>0 is the lower bound on the singular values related to A .
A probability 995.0=P can be achieved with knm 222 +≥− [134]. Although as highlighted
earlier that the main goal is to be able to predict unmonitored paths as accurately as possible rather
than the accurate estimation of the link metrics vector, estimating the correct link metrics vector
helps towards this goal. We see later that most of our algebraic system of equations are
underdetermined; this is due to partial network observations; we only select complete traceroutes
for which each probe received a response (lack of response is often shown as stars) for our analysis.
However, the routing matrix M is rank-deficient so nm − relates to the quantity rnp − ( r being
the rank of the routing matrix M ) in our situation. The probability P is deeply related with the
avoidance of selecting any row of bM , with a large error in the subset selected for monitoring for
the ability to estimate the link metrics vector accurately.
If careful techniques are not employed to cater for the mitigation of RMI, problems can be
encountered in the estimation of link-metrics vector. We saw earlier that the BL predictor returns
large prediction errors if the link metrics vector is not estimated carefully to cater for RMI. These
measurement artifacts of the routing matrix estimation using traceroutes necessitate a procedure to
infer the correct (or a more consistent) routing matrix as the methods described previously may
break down completely or return large path estimation errors that could offset any benefits of
monitoring fewer number of paths than the rank of the routing matrix. We analyze and propose
methods to deals with mitigation of such errors.
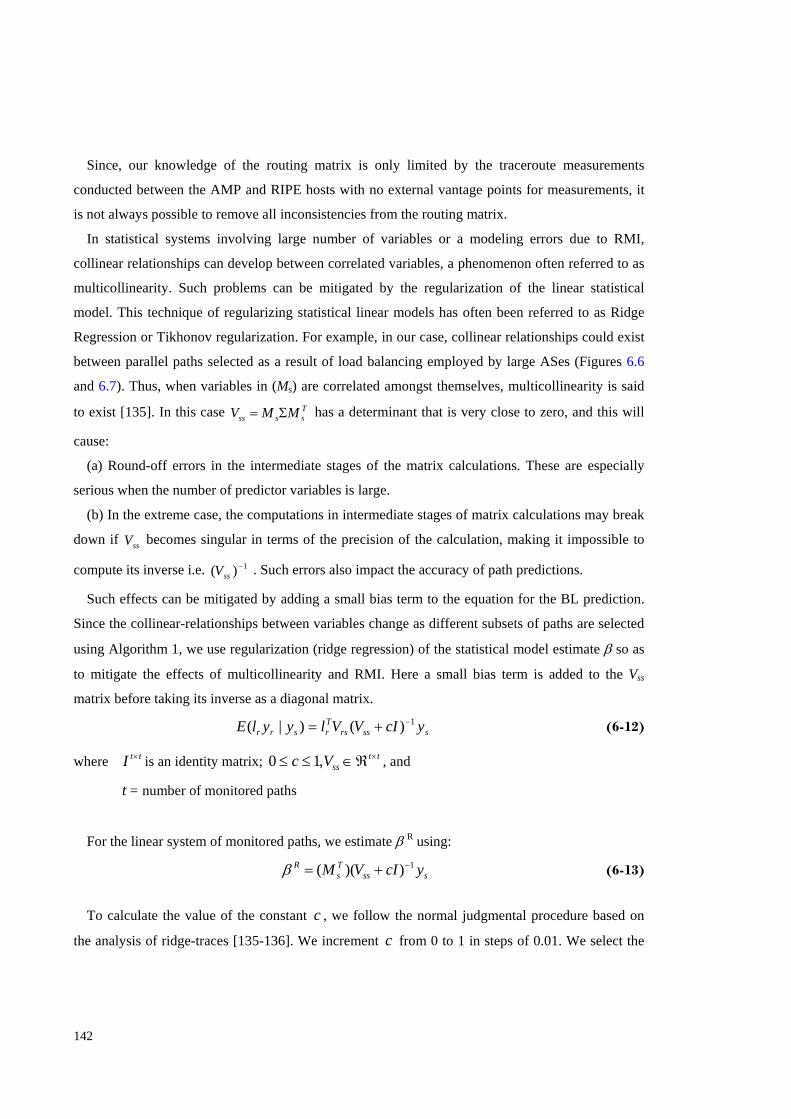
142
Since, our knowledge of the routing matrix is only limited by the traceroute measurements
conducted between the AMP and RIPE hosts with no external vantage points for measurements, it
is not always possible to remove all inconsistencies from the routing matrix.
In statistical systems involving large number of variables or a modeling errors due to RMI,
collinear relationships can develop between correlated variables, a phenomenon often referred to as
multicollinearity. Such problems can be mitigated by the regularization of the linear statistical
model. This technique of regularizing statistical linear models has often been referred to as Ridge
Regression or Tikhonov regularization. For example, in our case, collinear relationships could exist
between parallel paths selected as a result of load balancing employed by large ASes (Figures 6.6
and 6.7). Thus, when variables in (Ms) are correlated amongst themselves, multicollinearity is said
to exist [135]. In this case Tssss MMV Σ= has a determinant that is very close to zero, and this will
cause:
(a) Round-off errors in the intermediate stages of the matrix calculations. These are especially
serious when the number of predictor variables is large.
(b) In the extreme case, the computations in intermediate stages of matrix calculations may break
down if ssV becomes singular in terms of the precision of the calculation, making it impossible to
compute its inverse i.e. 1)( −ssV . Such errors also impact the accuracy of path predictions.
Such effects can be mitigated by adding a small bias term to the equation for the BL prediction.
Since the collinear-relationships between variables change as different subsets of paths are selected
using Algorithm 1, we use regularization (ridge regression) of the statistical model estimate β so as
to mitigate the effects of multicollinearity and RMI. Here a small bias term is added to the Vss
matrix before taking its inverse as a diagonal matrix.
sssrsTrsrr ycIVVlyylE 1)()|( −+= (6-12)
where ttI × is an identity matrix; ttssVc ×ℜ∈≤≤ ,10 , and
t = number of monitored paths
For the linear system of monitored paths, we estimate β R using:
sssTs
R ycIVM 1))(( −+=β (6-13)
To calculate the value of the constant c , we follow the normal judgmental procedure based on
the analysis of ridge-traces [135-136]. We increment c from 0 to 1 in steps of 0.01. We select the
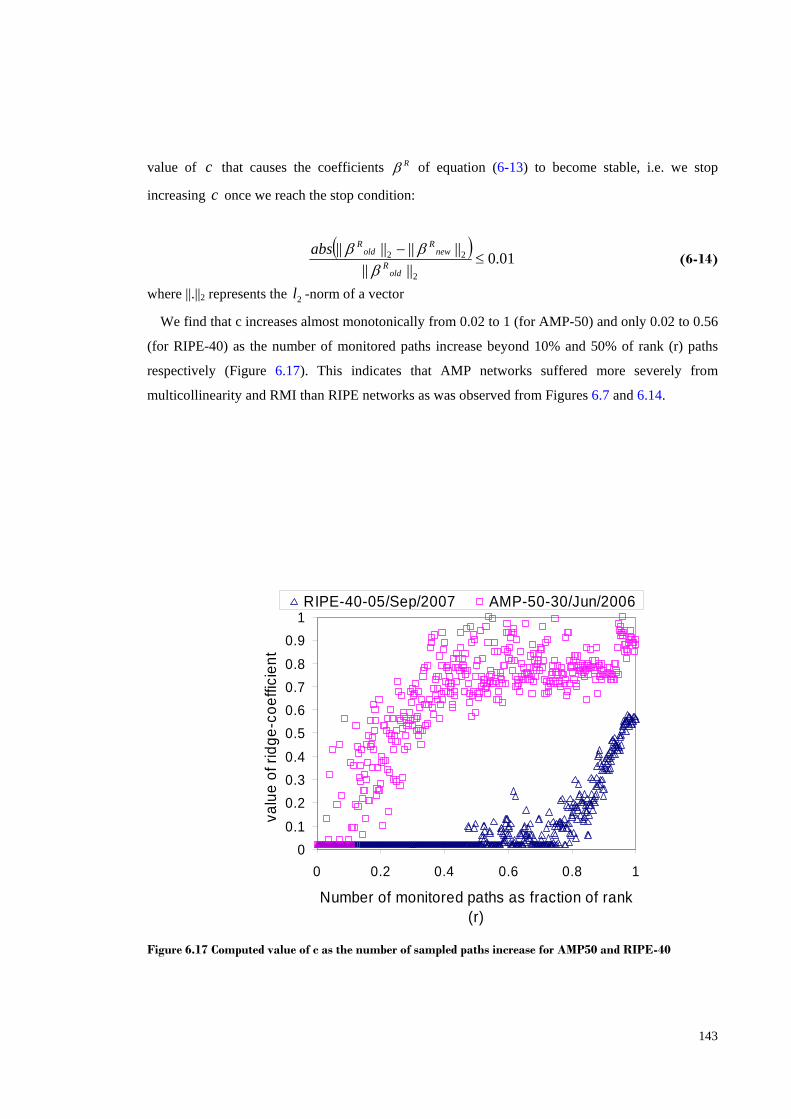
143
value of c that causes the coefficients Rβ of equation (6-13) to become stable, i.e. we stop
increasing c once we reach the stop condition:
( ) 01.0||||
||||||||
2
22 ≤−
oldR
newR
oldRabsβ
ββ (6-14)
where ||.||2 represents the 2l -norm of a vector
We find that c increases almost monotonically from 0.02 to 1 (for AMP-50) and only 0.02 to 0.56
(for RIPE-40) as the number of monitored paths increase beyond 10% and 50% of rank (r) paths
respectively (Figure 6.17). This indicates that AMP networks suffered more severely from
multicollinearity and RMI than RIPE networks as was observed from Figures 6.7 and 6.14.
00.1
0.20.30.40.50.60.70.8
0.91
0 0.2 0.4 0.6 0.8 1
Number of monitored paths as fraction of rank (r)
valu
e of
ridg
e-co
effic
ient
RIPE-40-05/Sep/2007 AMP-50-30/Jun/2006
Figure 6.17 Computed value of c as the number of sampled paths increase for AMP50 and RIPE-40
144
6.6 Statistical Techniques to Mitigate the Effects of RMI
Note that even measuring a subset of the paths reveals information of the end-to-end path metrics
such as path delay/loss rates but does not necessarily reveal any information about the individual
link metrics on those paths. Thus the problem is to estimate both the monitored and the
unmonitored link metrics so as to minimize the prediction error on the unmonitored paths.
Moreover, the rank deficient system of linear equations does not have a unique solution for the link
metrics vector so it has to be estimated. Literature [8, 22] proposed several estimation techniques
the two most common ones are based on the minimum-norm (sparse) solution
( 10 |||| or |||| ββ MinMin ) and the minimization of 2l -norm of error, i.e. 2||)(|| βss MyMin − by
using the Least Squares (LS) method. Minimum norm (sparse solution) as used earlier can only
help towards finding the optimum solution that reduces overall path prediction error but may not
track individual path properties efficiently. For mitigating the effects of RMI, more robust
estimation of the link metric vector is required.
Link-Metric Vector Estimation based on Iteratively Re-weighted Least-Squares method
Statistical theory for Best Linear Prediction (BLP) [136] suggests estimating β by solving the
following generalized least-squares problem.
).().( 1 βββ ssss
Tss MyVMyMin −− − (6-15)
where sy and sM respectively denote the rows of y and M to be monitored and Tssss MMV Σ=
the covariance between the selected paths where Σ is the link covariance matrix. The solution to
the above is given by the Generalized Least-Squares (GLS) estimate β̂ is given by [136]:
sssTssss
Ts yVMMVM 11 )(ˆ −−−=β (6-16)
where −R denotes the generalized-inverse of matrix R
One drawback of GLS based estimation in [8] of β̂ in BL prediction for ,
εβ += sS My (6-17)
is that it gives equal weight to all observations including the outliers thus penalizing each outlier
equally. Robust regression techniques such as Iteratively Re-weighted Least Squares (IRLS)
attempt to assign small weights to the outliers. Thus, instead of a GLS based estimation proposed in
[8] for BL estimator, we use a weighted version of generalized least squares minimization which
145
can yield superior results in such cases. We use a variant of the specific method of Daubechies et al.
[137] for IRLS in estimating the link metrics vector (Eq 6-18). The algorithm keeps reiterating
(iterations are labelled ,..2,1=t ,50) until it converges. Each iteration of the algorithm tries to find
the new solution 1+tβ at the tht 1+ iteration:
sTsts
Tst
t yMDMMD 11 )( −+ =β (6-18)
where tD is a ee nn × diagonal matrix at tht iteration. We denote the thj diagonal entry of tD as tjw . Once 1+tβ is found, the new weight 1+tw is found by:
ettj
tj ,...,n,,jw 321 ))(( 2/12
1211 =+= −
+++ εβ (6-19)
Here
))(,( 11
1e
Kt
tt nrMin +
+
+ =βεε (6-20)
and enr ℜ∈ , )( 1+tr β is the non-increasing rearrangement of the absolute values of the entries of
1+tβ . Thus, itr )( 1+β is the thi largest element of the set ej
t nj ,..,3,2,1 ,|| 1 =+β . The algorithm
terminates when 01 =+tε or 1+tε stabilizes at some non-negative value. At the start of the algorithm,
)1,...,1,1,1(0 =w and 10 =ε . To initialize K , we compute the number of non-zero elements p in the
initial solution 0β (using 0w ) and set cpK = . We find that the algorithm converges better when
.6.05.0 ≤≤ c .
There are other robust regression techniques besides IRLS based estimation like LMS (Least
Median of Squares) which aims to minimize the median of squares of the error instead of
minimizing the sum (or average) of squares of the errors. However, unlike IRLS, LMS does not
have any closed form expression and requires brute force search for evaluating combinational
subsets of solutions (by removing rows from the set of linear equations which may be the cause of
large overall estimation errors) and thus is not feasible for regression problems of large dimensions.
We refer to the predictor using IRLS based on robust regression for link metrics prediction as the
Robust Predictor in the remainder of this chapter to distinguish it from the BLP [8]. When
estimating the link metrics vector using the IRLS based method, the estimated value for the link
metrics vector as defined in Equation 6-18 is used. We call this the Robust Predictor as the method
works iteratively based on minimizing the residual errors by improving on previous estimate of the
link metrics vector and so removing larger outliers more aggressively. It mimics 1|||| β
minimization albeit with no positivity constraints like the Convex Optimizer used earlier (Section
6.6) by computing a sparse solution.
146
Link-Metric Vector Estimation based on Least-Squares method after regularization of the statistical
model
Regularization of the statistical model (Section 6.5.3) can also act like a simple tool to mitigate
the effects of large statistical errors. We use the estimate of link metrics vector using Ridge
Regression (Tikhonov Regularization) for use in BL predictor. We call this predictor as BL-ridge to
differentiate from the BLP [8].
6.7 Improvement in Path Prediction and Anomaly Detection for AMP and RIPE networks after application of Robust Statistical Techniques
Figure 6.18 and 6.19 shows the L1 error for RIPE and AMP networks after application of robust
statistical prediction Techniques. The L1 error for RIPE networks decreases more sharply. For
AMP networks, overall L1-error is reduced as well as the spikes being diminished in magnitude
when using the Robust estimator.
The iterative nature of robust prediction using IRLS based estimate of link metric vector may be
a cause of concern about its path tracking properties. We show that not only the robust prediction
technique outlined lowers overall path prediction errors on unmonitored paths but also improves the
individual path prediction. Figure 6.20 shows the improvement in the variance of the Relative
Prediction Error (RPE), defined below as the number of monitored paths increases (for AMP-50
and AMP-30).
yactualdeladelaypredicteddelayactualabsRPE ) ( −
= (6-21)
We next select the subset of paths which resulted in large prediction errors based on our results
from Figures 6.7 and 6.14. Figure 6.21 shows sample variation of path delays on one unmonitored
path and its prediction using the BL, BL-ridge and Robust Estimator. We observe that all three
predictors (BL, BL-ridge and Robust) are good at tracking path anomalies showing peaks (in either
direction) corresponding to major path variations even thought the granularity of path
measurements on the monitored paths is of the order of 60 second intervals. Furthermore, since the
path monitoring is not GPS synchronized in the datasets considered, we estimate )(tys ( )(tyr ) as
belonging to (one of the) windows of successive one minute intervals. Hence, the peaks of the
predicted path metrics are sometimes offset by one such window-interval (either side) from the
actual path anomaly. We see that BL-ridge and Robust estimator are more sensitive towards path
anomalies than BL prediction.
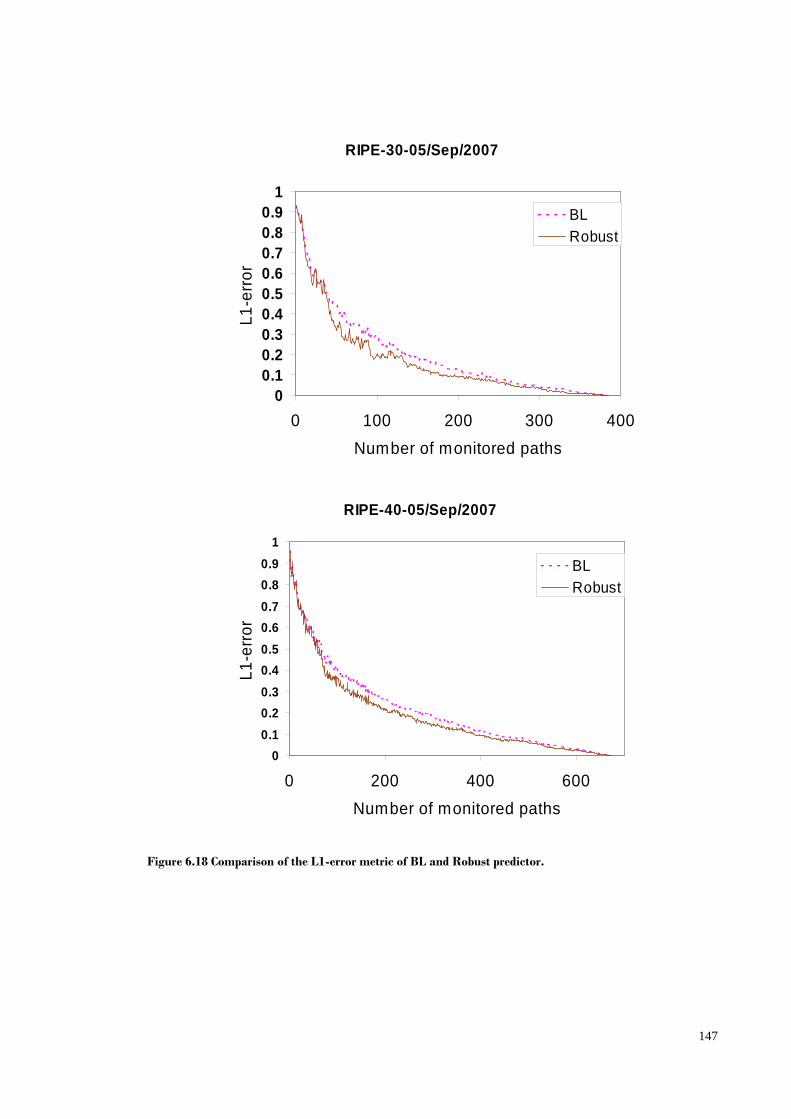
147
RIPE-30-05/Sep/2007
00.10.20.30.40.50.60.70.80.9
1
0 100 200 300 400Number of monitored paths
L1-e
rror
BLRobust
RIPE-40-05/Sep/2007
00.10.20.30.40.50.60.70.80.9
1
0 200 400 600Number of monitored paths
L1-e
rror
BLRobust
Figure 6.18 Comparison of the L1-error metric of BL and Robust predictor.
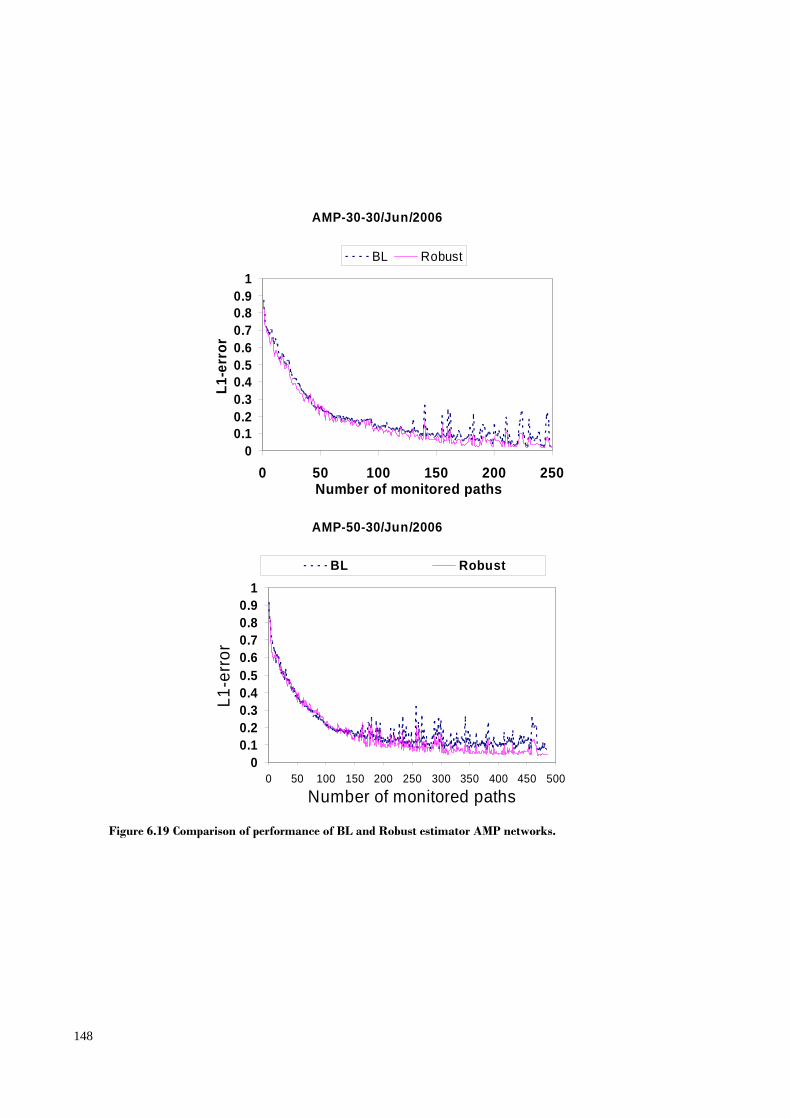
148
AMP-30-30/Jun/2006
00.10.20.30.40.50.60.70.80.9
1
0 50 100 150 200 250Number of monitored paths
L1-e
rror
BL Robust
AMP-50-30/Jun/2006
00.10.20.30.40.50.60.70.80.9
1
0 50 100 150 200 250 300 350 400 450 500
Number of monitored paths
L1-e
rror
BL Robust
Figure 6.19 Comparison of performance of BL and Robust estimator AMP networks.
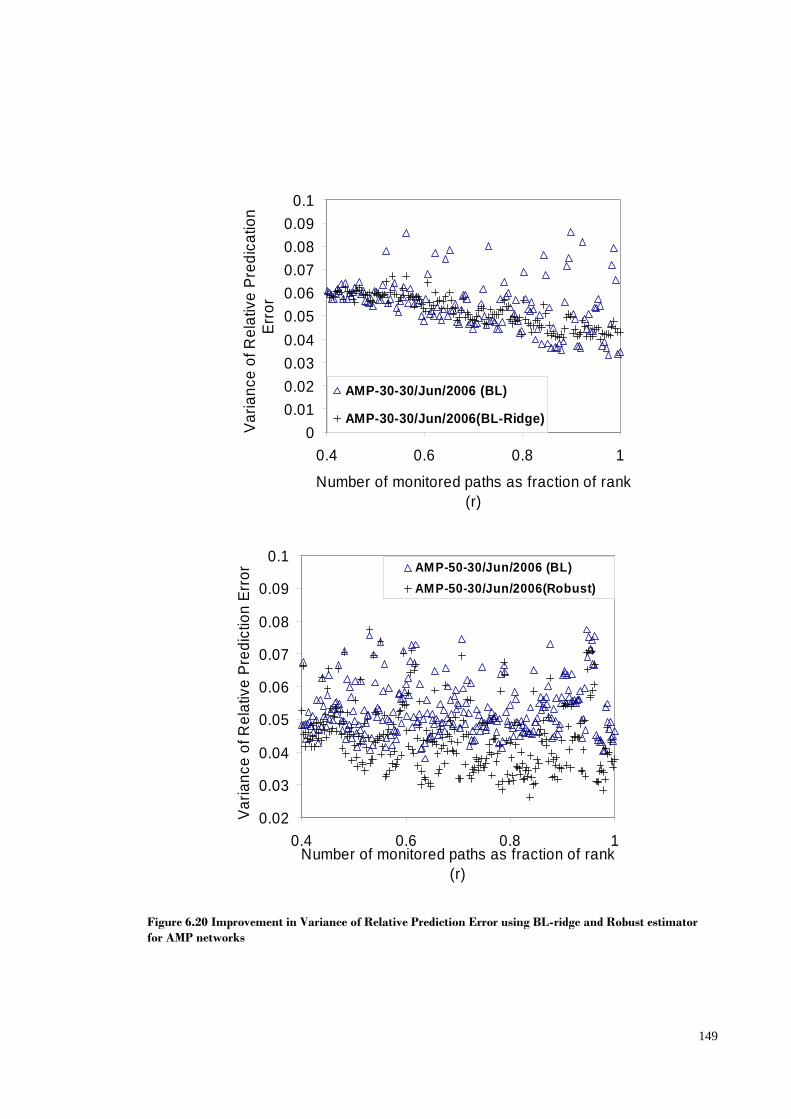
149
00.010.020.030.040.050.060.070.080.09
0.1
0.4 0.6 0.8 1
Number of monitored paths as fraction of rank (r)
Varia
nce
of R
elat
ive
Pred
icat
ion
Erro
r
AMP-30-30/Jun/2006 (BL)
AMP-30-30/Jun/2006(BL-Ridge)
0.02
0.03
0.04
0.05
0.06
0.07
0.08
0.09
0.1
0.4 0.6 0.8 1Number of monitored paths as fraction of rank
(r)
Varia
nce
of R
elat
ive
Pred
ictio
n Er
ror AMP-50-30/Jun/2006 (BL)
AMP-50-30/Jun/2006(Robust)
Figure 6.20 Improvement in Variance of Relative Prediction Error using BL-ridge and Robust estimator for AMP networks
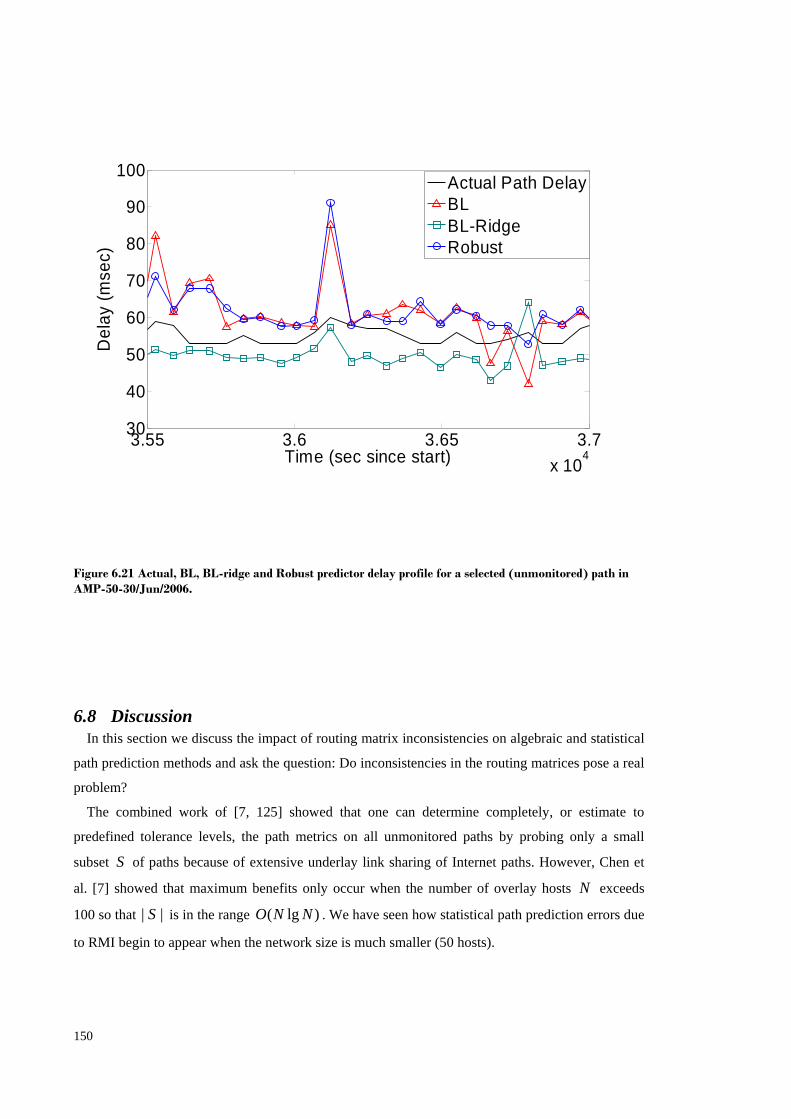
150
6.8 Discussion In this section we discuss the impact of routing matrix inconsistencies on algebraic and statistical
path prediction methods and ask the question: Do inconsistencies in the routing matrices pose a real
problem?
The combined work of [7, 125] showed that one can determine completely, or estimate to
predefined tolerance levels, the path metrics on all unmonitored paths by probing only a small
subset S of paths because of extensive underlay link sharing of Internet paths. However, Chen et
al. [7] showed that maximum benefits only occur when the number of overlay hosts N exceeds
100 so that || S is in the range )lg( NNO . We have seen how statistical path prediction errors due
to RMI begin to appear when the network size is much smaller (50 hosts).
3.55 3.6 3.65 3.7x 10
4
30
40
50
60
70
80
90
100
Time (sec since start)
Del
ay (m
sec)
Actual Path DelayBLBL-RidgeRobust
Figure 6.21 Actual, BL, BL-ridge and Robust predictor delay profile for a selected (unmonitored) path in AMP-50-30/Jun/2006.
151
We saw from Figure 6.7 & 6.14, that the effects of RMI are most pronounced after approximately
30% of the linearly-independent rank- r paths have been included in path monitoring set. From
Figure 6.7 this roughly corresponds to an L1-error of 0.2 for both AMP and RIPE in spite of the
rapidly decaying trend; this is clearly not good for accurate path prediction or anomaly detection.
For example in AMP-50, to be able to estimate path-metrics to within 10% L1-error requires that at
least 62% of the linearly-independent rank-r paths be monitored. The first major spike due to
routing matrix inconsistencies occurs when monitoring a small fraction of the linearly-independent
rank- r paths and this problem exacerbates as more paths are selected for monitoring. This shows
that by the time we are able to achieve good path prediction, routing matrix inconsistencies begin to
cause randomly large path prediction errors. These in turn can cause problems in predicting path
anomalies (Figure 6.19), which is one of the prime objectives of RONs; to alleviate path
outages/degradations before a user can detect these. Thus the techniques described in this chapter
for removing RMI are essential in order to allow a subset of paths to be monitored and so reduce
the monitoring overheads that would otherwise limit the scalability of RONs.
This chapter concludes the third contribution of this thesis, namely an investigation of the
practical problems in the area of algebraic and statistical path monitoring when applied to practical
networks. We presented a constrained convex optimization technique to show how RMI can be
identified and also showed how it is related with inaccurate routing knowledge on the network
providing anecdotal evidence from network traceroutes. In addition we quantified the statistical
prediction errors due to RMI through regularization of the linear model. We also studied the impact
of RMI on path prediction; use of robust statistical techniques reduces the path prediction error (L1-
error) by 10-20% over BL estimation. Anomaly detection is also improved through robust statistical
techniques.
6.9 Conclusion Research aimed at reduction of path monitoring overheads by leveraging topological knowledge
seems to be the most promising area of research at the moment [7-8, 21-22] at first sight but
unfortunately the performance benefits they claim to have are only based on limited deployment
over a few selected ISPs, e.g. Abilene and Sprint [8, 22, 87], PlanetLab [26] or simulated topologies
[5, 23-24]. The underlying assumption is that the routing (network layer) topology of the network is
accurately known. These issues need to be addressed in detail using real heterogeneous overlay
deployments in the Internet with limited topological knowledge [50] to fully ascertain their benefits
beyond the theoretical claims.
Our primary aim in this chapter was to investigate the source of practical problems in the area of
algebraic and statistical path monitoring. These mainly stem from incorrect topology estimation due

152
to the measurement artifacts of traceroutes. These can result in inaccurate estimation of path
metrics. More advanced topology estimation techniques using more robust route path tracing, e.g.
[129], or exploiting techniques to correct such inaccurate path information [52, 138] can help
towards improving such statistical path estimation techniques.
153
7 CONCLUSIONS AND PROPOSALS FOR FUTURE DIRECTIONS OF RESEARCH
7.1 Reviewing the Goal BGP can suffer from delayed convergence after failure, and Internet flows seeking QoS
guarantees may seek alternate paths to mask such failures. Resilient Overlay Networks can quickly
provide such alternate paths. However, this requires large overheads for path monitoring to be able
to select best alternate routes. The thesis of this dissertation is to investigate heuristics that make
Resilient Overlay Network management more scalable. We established this thesis in terms of three
intertwined yet competing aspects of scalability; architecture, path selection and path monitoring
overheads.
7.1.1 Architecture
RON suffers from scalability problems. Aggressive path probing on all end-to-end paths
between overlay hosts (overlay links) does not scale well beyond tens of hosts [4]. In Chapter 4, we
showed a landmark based distributed architecture that can enable overlay networks to scale well
while using a very sparse topology - )(NO instead of )( 2NO overlay links. The sparse topology
equates to an equal reduction in path monitoring overheads. We presented techniques for
determining how overlay hosts should select a small set of geographically diversified detours. We
showed that in spite of such a sparse topology, it can find a good working path with a very high
probability.
7.1.2 Path Selection
Path selection in Resilient Overlay Networks is directly tied with path monitoring overheads.
These path monitoring overheads could be traded with heuristics that enable disjoint path selection.
Previous studies, e.g. [6], show that an intuitive method of selecting disjoint paths is just to select
one which diverges earliest from the direct path. However, this should be based on AS level paths
which are easier to obtain than IP level paths. In Chapters 3 and 5, we showed that that a significant
percentage of one-hop overlay paths shared similar levels of path disjointness, thus making the
process of path selection even more challenging. In Chapter 5, we presented a more elegant graph
based algorithm to cater for this problem, i.e. to filter out a small set of disjoint paths to make path
154
selection easier. We then presented our technique of greedy selection using a ToR graph [27, 116].
We showed that not only the number of candidate paths could be brought down to a small number
but also it filtered out the good paths by picking a path performing close to the best possible path in
a large majority of the cases.
7.1.3 Path Monitoring
Previous research has shown the possibility of statistical techniques [8] of monitoring paths based
on network tomography principles [7]. Such techniques depend on an accurate snapshot of the
routing topology of the overlay network. Previous works [8] have investigated such statistical path
prediction techniques for networks whose topology was well known e.g. Abilene. In Chapter 6, we
highlighted how such an accurate snapshot of large networks using only commodity tools, e.g.
traceroutes, is impossible to obtain. We then presented methods to reduce or eliminate the effects of
such topology estimation errors by (a) identifying and fixing topology estimation errors; and (b)
harnessing techniques in statistics, e.g. robust estimation, to deal with them when they cannot be
identified and removed completely.
7.2 Future Research Directions Future research in overlay networks will revolve around the same three aspects of enhancing and
improving RON management described above.
7.2.1 More accurate overlay topology ‘modeling’
Research aimed at reduction of path monitoring overheads by leveraging topological knowledge
seems to be the most promising area of research at the moment [7-8, 21-22] at first sight but
unfortunately the performance benefits they claim to have are only based on limited deployment
over a few selected ISPs e.g. Abilene and Sprint [8, 22, 87], PlanetLab [26] or simulated topologies
[23-25]. The underlying assumption is that the routing (network layer) topology of the network is
accurately known. These issues need to be addressed in detail using real heterogeneous overlay
deployments in the Internet with limited topological knowledge [50] (Chapter 6) to fully ascertain
their benefits beyond the theoretical claims.
7.2.2 Accurate depiction of Internet failure models Due to unavailability of real Internet failure information, some studies employ analytical models
for generating failure scenarios on Internet paths; e.g. LM1 model [23] and exponentially
distributed failures [139]. This may lead to an overestimation of the efficiency of overlay networks
155
in computing alternate paths. Naidu et al. [49] claim anomalies to be very rare events in the Internet
than suggested by prior studies. Exploiting this fact could lead to non-negligible reduction of path
monitoring overheads achieved by conservative methods of other researchers [8, 21]. Also, it would
be difficult to compare results across different studies unless accurate modeling of Internet failure
occurrence is not dealt with seriously.
7.2.3 Investigation of synergy between competing overlays
There have been overt criticisms the research community directed against selfish routing by
overlay networks [39, 70] (Chapter 2, Section 2.2.5). However, again such claims have been made
on emulated hypothetical situations, when path monitoring and path switching decisions in two or
more overlays cause them to synchronize, i.e. switch traffic to the same path simultaneously. There
is an urgent need for large scale deployment of multiple overlays to see the impact on the underlay
network mechanisms when competing for bandwidth on same set of underlay links. For example,
previous studies [140-141] have shown that content distribution overlays that are locality aware do
not hurt ISP objectives as they are optimized to fetch content from the nearest location, e.g. within
the ISP, a thing an ISP would also prefer from a commercial point of view. Such RONs will try to
shift traffic within a certain radius in the network, e.g. choosing a relay node (detour) very close to
the source or destination; thus it may not cause appreciable harm to other traffic flows.
In addition, routing overlays such as RONs could be made to sense the presence of other overlays
around them by monitoring the behavior of its frequently occurring path switching cycles and
employing a randomized hysteresis algorithm to vary its anomaly detection and path switching
algorithms to prevent any type of synchronization with other overlays. There is also an urgent need
to study the business models that will evolve out of competing overlays. A large RON operator may
actually be willing to provide its services to smaller RON operators in exchange for a fee.

156

157
APPENDIX
We introduce some matrix notation before deriving the equation for the BL-estimator. We first
sort the rows in the matrix M, according to the largest singular values using a row-permutation
(detail later). The values of the column vector y are similarly sorted. Let us denote the new matrix
and column vector as ep nnnewM ×∈ ]1,0[ and pn
newy ℜ∈ respectively. Let sM represent the rows
(paths) of newM which are selected for monitoring because they can approximate the largest
singular dimensions to approximate the complete path matrix M well enough for reasonably
predicting the unmonitored paths.
news
news
yky
MkM
:),:1(
:),:1(
=
= (A.1)
where the notation Jba :),:( and Jba ):(:, refer to rows a through b and columns a through b
( a and b inclusive) respectively of matrix J .
Similarly, the unmonitored paths and path metrics are the remaining rows of newM and newy , as
shown below.
newpr
newpr
ynky
MnkM
:),:1(
:),:1(
+=
+= (A.2)
The vectors y, ys and yr will vary over time so references to ys and yr relate to the values of )(tys
and )(tyr at some instant t . If we let β and Σ be the mean and covariance of link delays
respectively, then the mean (ν ) and covariance (V ) of y can be expressed as:
⎥⎦
⎤⎢⎣
⎡=⎥
⎦
⎤⎢⎣
⎡=
ββ
νν
νr
s
r
s
MM
(A.3)
⎥⎦
⎤⎢⎣
⎡
ΣΣΣΣ
=⎥⎦
⎤⎢⎣
⎡= T
rrTsr
Trs
Tss
rrrs
srss
MMMMMMMM
VVVV
V (A.4)
Chua et al [125] found the link-covariance matrix Σ to be dominated by the diagonal elements
for the considered Abilene network (the variance of the link delay values), with other elements
mainly zero. For the datasets we consider, we find that the link covariance cannot be calculated
efficiently by using traceroutes alone to infer link delays, as some traceroutes anomalously report
smaller path delays to thn 1+ hop than the thn hop, implying a negative link delay at thn 1+ IP hop.
Due to these measurement artifacts, we assume Σ to be an identity matrix like [142]. However, we
158
find that some nontrivial interrelationships between link properties can arise in practical situations
as we discuss in the next section.
The BL estimator for an unknown parameter y given x [136] is:
*)()|( cxxyE xy µµ −+= (A.5)
where µx=E(x), µy=E(y), c* is the solution to Vxxc=Vxy (Vxx=Cov(x), Vxy=Cov(x,y) [136] (Section
6.3))
Similarly the BL-estimator for path metrics on the unmonitored paths (yr) given the path metrics
on monitored paths (ys) is given by:
)()|( * ββ ssTrr
Trsr
Tr MyclMlyylE −+= (A.6)
(where c* is any solution to c*Vss=Vrs, and lr is a column-vector with the one element set to 1 (and
others to 0) so as to select one row of Mr corresponding to a particular unmonitored path.)
Since, the BL-estimator in (7) cannot be realized without knowledge of β; one natural solution is
to estimate it from the data. Statistical theory [136] suggests estimating β by minimizing the
following generalized least-squares problem.
).().( 1 βββ ssss
Tss MyVMyMin −− − (A.7)
And the generalized least-squares estimate β̂ is given by [136]:
sssTssss
Ts yVMMVM 11 )(ˆ −−−=β (A.8)
where R- denotes the generalized-inverse of matrix R
And after substituting β̂ in (A.7) and simplifying, the BL estimator becomes:
sssrsTrsrr yVVlyylE 1)()|( −= (A.9)
159
REFERENCES: [1] The AS Number Report see http://www.potaroo.net/tools/asn32/. [2] C. Labovitz, et al., "Delayed Internet routing convergence," in SIGCOMM '00: Proceedings of the
conference on Applications, Technologies, Architectures, and Protocols for Computer Communication, 2000, pp. 175-187.
[3] X. Yang and D. Wetherall, "Source selectable path diversity via routing deflections," in SIGCOMM '06: Proceedings of the 2006 conference on Applications, technologies, architectures, and protocols for computer communications, 2006, pp. 159-170.
[4] D. Andersen, et al., "Resilient overlay networks," in SOSP '01: Proceedings of the eighteenth ACM symposium on Operating systems principles, 2001, pp. 131-145.
[5] C. Tang and P. K. McKinley, "Improving multipath reliability in topology-aware overlay networks," in Distributed Computing Systems Workshops, 2005. 25th IEEE International Conference on, 2005, pp. 82-88.
[6] T. Fei, et al., "How to Select a Good Alternate Path in Large Peer-to-Peer Systems?," in Infocomm 06, Barcelona, Spain, 2006.
[7] Y. Chen, et al., "Tomography-based overlay network monitoring," in IMC '03: Proceedings of the 3rd ACM SIGCOMM conference on Internet measurement, 2003, pp. 216-231.
[8] D. B. Chua, et al., "Network Kriging," Selected Areas in Communications, IEEE Journal on, vol. 24, pp. 2263-2272, 2006.
[9] D. Andersen, et al., "Best-path vs. multi-path overlay routing," in IMC '03: Proceedings of the 3rd ACM SIGCOMM conference on Internet measurement, 2003, pp. 91-100.
[10] A. Akella, et al., "A comparison of overlay routing and multihoming route control," in SIGCOMM '04: Proceedings of the 2004 conference on Applications, technologies, architectures, and protocols for computer communications, 2004, pp. 93-106.
[11] D. G. Andersen, et al., "Improving Web Availability for Clients with MONET," in 2nd Symposium on Networked Systems Design and Implementation (NSDI), Boston, MA 2005.
[12] L. Subramanian, et al., "HLP: a next generation inter-domain routing protocol," in SIGCOMM '05: Proceedings of the 2005 conference on Applications, technologies, architectures, and protocols for computer communications, 2005, pp. 13-24.
[13] W. Xu and J. Rexford, "MIRO: multi-path interdomain routing," SIGCOMM Comput. Commun. Rev., vol. 36, pp. 171-182, 2006.
[14] X. Yang, "NIRA: a new Internet routing architecture," in FDNA '03: Proceedings of the ACM SIGCOMM workshop on Future directions in network architecture, 2003, pp. 301-312.
[15] R. Teixeira, et al., "Network sensitivity to hot-potato disruptions," in SIGCOMM '04: Proceedings of the 2004 conference on Applications, technologies, architectures, and protocols for computer communications, 2004, pp. 231-244.
[16] K. Gummadi, et al., "Improving the Reliability of Internet Paths with One-hop Source Routing," in OSDI '04, 2004, pp. 183-198.
[17] S. Savage, et al., "Detour: a Case for Informed Internet Routing and Transport," IEEE Micro, vol. Vol 19, no 1 pp. 50-59, January 1999.
[18] Z. Li and P. Mohapatra, "The Impact of Topology on Overlay Routing Service," in Infocom, Hong Kong, 2004.
[19] A. Nakao, et al., "Scalable routing overlay networks," SIGOPS Oper. Syst. Rev., vol. 40, pp. 49-61, 2006.
[20] S. Han Hee, et al., "NetQuest: a flexible framework for large-scale network measurement," SIGMETRICS Perform. Eval. Rev., vol. 34, pp. 121-132, 2006.
[21] Y. Chen, et al., "Algebra-based scalable overlay network monitoring: algorithms, evaluation, and applications," IEEE/ACM Trans. Netw., vol. 15, pp. 1084-1097, 2007.
[22] M. Coates, et al., "Compressed network monitoring for ip and all-optical networks," in IMC '07: Proceedings of the 7th ACM SIGCOMM conference on Internet measurement, 2007, pp. 241-252.
[23] C. Tang and P. K. McKinley, "On the cost-quality tradeoff in topology-aware overlay path probing," in Network Protocols, 2003. Proceedings. 11th IEEE International Conference on, 2003, pp. 268-279.
160
[24] C. Tang and P. K. McKinley, "A distributed approach to topology-aware overlay path monitoring," in Distributed Computing Systems, 2004. Proceedings. 24th International Conference on, 2004, pp. 122-131.
[25] C. Tang and P. K. McKinley, "Improving Multipath Reliability in Topology-Aware Overlay Networks," in Proceedings of the Fourth International Workshop on Assurance in Distributed Systems and Networks (ADSN 2005) (in conjunction with IEEE ICDCS), Columbus, Ohio, USA, 2005.
[26] H. H. Song, "Scalable and Flexible Network Measurement (Masters Thesis) ", Department of Computer Science, University of Texas at Austin, 2006.
[27] S. Qazi and T. Moors, "Using Type-of-Relationship (ToR) Graphs to Select Disjoint Paths in Overlay Networks," in GLOBECOM 2007, pp. 2602-2606.
[28] Y. Zhu, et al., "Dynamic overlay routing based on available bandwidth estimation: a simulation study," Comput. Networks, vol. 50, pp. 742-762, 2006.
[29] G. Kwon and K. Ryu, "BYPASS: topology-aware lookup overlay for DHT-based P2P file locating services," in Parallel and Distributed Systems, 2004. ICPADS 2004. Proceedings. Tenth International Conference on, 2004, pp. 297-304.
[30] B. Y. Zhao, et al., "Brocade: Landmark Routing on Overlay Networks," in IPTPS '02, MIT Faculty Club, Cambridge, MA, USA., 2002.
[31] B. Y. Zhao, et al., "Exploiting Routing Redundancy via Structured Peer-to-Peer Overlays," in IEEE International Conference on Network Protocols (ICNP 2003), Atlanta, Georgia, USA, 2003.
[32] A.-J. Su, et al., "Drafting behind Akamai (travelocity-based detouring)," in SIGCOMM '06: Proceedings of the 2006 conference on Applications, technologies, architectures, and protocols for computer communications, 2006, pp. 435-446.
[33] M. Faloutsos, et al., "On Power-Law Relationships in Internet topology," in Sigcom 99, Cambridge, MA, USA, 1999.
[34] B. Eriksson, et al., "Network discovery from passive measurements," SIGCOMM Comput. Commun. Rev., vol. 38, pp. 291-302, 2008.
[35] S. Ratnasamy, et al., "A Scalable Content Addressable Network," in SIGCOMM '01, San Diego, USA, 2001.
[36] I. Stoica, et al., "Chord: a scalable peer-to-peer lookup protocol for Internet applications," Networking, IEEE/ACM Transactions on, vol. 11, pp. 17-32, 2003.
[37] S.-J. Lee, et al., "Bandwidth-Aware Routing in Overlay Networks," in INFOCOM 2008. The 27th Conference on Computer Communications. IEEE, 2008, pp. 1732-1740.
[38] T. Rakotoarivelo, et al., "A Super-Peer based Method to Discover QoS Enhanced Alternate Paths," in Communications, 2005 Asia-Pacific Conference on, 2005, pp. 454-458.
[39] B.-G. Chun, et al., "Characterizing Selfishly Constructed Overlay Routing Networks," in Proceedings of the 23rd IEEE International Conference on Computer Communications (INFOCOM 2004), 2004.
[40] J. Han, et al., "Topology aware overlay networks," in INFOCOM 2005. 24th Annual Joint Conference of the IEEE Computer and Communications Societies. Proceedings IEEE, 2005, pp. 2554-2565 vol. 4.
[41] "RIPE, Test Traffic Measurements (TTM) Home Page. See http://www.ripe.net/projects/ttm/data.html."
[42] Active Measurement Project (AMP). see http://watt.nlanr.net/. [43] D. Anderson, et al., "Best Path Vs Multi-path Overlay Routing," in IMC’03 . Miami Beach, Florida,
USA, 2003. [44] D. Antonova, et al., "Managing a portfolio of overlay paths," in NOSSDAV '04: Proceedings of the
14th international workshop on Network and operating systems support for digital audio and video, 2004, pp. 30-35.
[45] H. Madhyastha, et al., "iPlane: an information plane for distributed services," in OSDI '06: Proceedings of the 7th symposium on Operating systems design and implementation, Seattle, Washington, 2006, pp. 367-380.
[46] H. V. Madhyastha, et al., "A Structural Approach to Latency Prediction," presented at the IMC 2006, 2006. .
[47] H. V. Madhyastha, et al., " iPlane Nano: Path Prediction for Peer-to-Peer Applications. ," in NSDI 2009, 2009.
161
[48] A. Broido and k. Claffy, "Analysis of RouteViews BGP data: policy atoms " presented at the Network Resource Data Management Workshop, 2001.
[49] K. V. M. Naidu, et al., "Detecting Anomalies Using End-to-End Path Measurements," in INFOCOM 2008. The 27th Conference on Computer Communications. IEEE, 2008, pp. 1849-1857.
[50] S. Qazi and T. Moors, "Practical Issues of Statistical Path Monitoring in Overlay Networks with Large, Rank-Deficient Routing Matrices," in Broadnets, London, UK, 2008.
[51] Y. Zhang and N. Duffield, "On the constancy of internet path properties," in IMW '01: Proceedings of the 1st ACM SIGCOMM Workshop on Internet Measurement, 2001, pp. 197-211.
[52] The Skitter Project (CAIDA) 2002. http://www.caida.org/tools/measurement/skitter/. [53] C.-M. Cheng, et al., "Path probing relay routing for achieving high end-to-end performance," in
Global Telecommunications Conference, 2004. GLOBECOM '04. IEEE, 2004, pp. 1359-1365 Vol.3. [54] M. Coates, et al., "Maximum likelihood network topology identification from edge-based unicast
measurements," SIGMETRICS Perform. Eval. Rev., vol. 30, pp. 11-20, 2002. [55] R. Govindan and H. Tangmunarunkit, "Heuristics for Internet map discovery," in INFOCOM 2000.
Nineteenth Annual Joint Conference of the IEEE Computer and Communications Societies. Proceedings. IEEE, 2000, pp. 1371-1380 vol.3.
[56] F. Viger, et al., "Detection, understanding, and prevention of traceroute measurement artifacts," Comput. Netw., vol. 52, pp. 998-1018, 2008.
[57] M. Luckie, et al., "Traceroute Probe Method and Forward IP Path Inference," presented at the Internet Measurement Conference (IMC '08), Vouliagmeni, Greece, 2008.
[58] A. Nakao, et al., "A Routing Underlay for Overlay Networks " in SIGCOMM’03 Karlsruhe, Germany, 2003.
[59] W. Cui, et al., "Backup path allocation based on a correlated link failure probability model in overlay networks," in Proceedings of 10th IEEE International Conference on Network Protocols (ICNP’02), Paris, France, 2002, pp. 236-247.
[60] R. Kawahara, et al., "On the Quality of Triangle Inequality Violation Aware Routing Overlay Architecture," in INFOCOM 2009. The 28th Conference on Computer Communications. IEEE, Rio de Janeiro, 2009, pp. 2761-2765.
[61] M. Uchida, et al., "QoS-Aware Overlay Routing with Limited Number of Alternative Route Candidates and Its Evaluation," IEICE Trans Commun, vol. E89-B, pp. 2361-2374, 2006.
[62] N. Hu and P. Steenkiste, "Exploiting internet route sharing for large scale available bandwidth estimation," in IMC '05: Proceedings of the 5th ACM SIGCOMM conference on Internet Measurement, Berkeley, CA, 2005, pp. 16-16.
[63] L. Gao, "On inferring autonomous system relationships in the internet," IEEE/ACM Trans. Netw., vol. 9, pp. 733-745, 2001.
[64] F. Dabek, et al., "Designing a DHT for Low Latency and High Throughput," in NSDI '04, 2004, pp. 85-98.
[65] S. Ratnasamy, et al., "A scalable content-addressable network," in SIGCOMM '01: Proceedings of the 2001 conference on Applications, technologies, architectures, and protocols for computer communications, 2001, pp. 161-172.
[66] (2000) Fast Internet Content Delivery with FreeFlow, Akamai see www.cs.washington.edu/homes/ratul/akamai/freeflow.pdf
[67] Z. Li and P. Mohapatra, "QRON: QoS-aware routing in overlay networks," Selected Areas in Communications, IEEE Journal on, vol. 22, pp. 29-40, 2004.
[68] S. D. Patek, et al., "Enhancing aggregate QoS through alternate routing," in Global Telecommunications Conference, 2000. GLOBECOM '00. IEEE, 2000, pp. 611-615 vol.1.
[69] L. Subramanian, et al., "OverQoS: offering Internet QoS using overlays," SIGCOMM Comput. Commun. Rev., vol. 33, pp. 11-16, 2003.
[70] R. Keralapura, et al., "Race Conditions in Coexisting Overlay Networks," Networking, IEEE/ACM Transactions on, vol. 16, pp. 1-14, 2008.
[71] H. Tangmunarunkit, et al., "Network Topology Generators: Degree based vs Structural," in Sigcomm '02, Pittsburgh, Pennsylvania, USA, 2002.
[72] S. Zhou and R. J. Mondragon, "The rich club phenomenon in internet topology," IEEE Communication letters, vol. 8, pp. 180-182, March 2004.
[73] PlanetLab. see http://www.planet-lab.org/. Available: http://www.planet-lab.org/
162
[74] H. Chang, et al., "Internet connectivity at the AS-level: an optimization-driven modeling approach," in MoMeTools '03: Proceedings of the ACM SIGCOMM workshop on Models, methods and tools for reproducible network research, 2003, pp. 33-46.
[75] S. Jaiswal, et al., "Comparing the structure of power-law graphs and the Internet AS graph," in Network Protocols, 2004. ICNP 2004. Proceedings of the 12th IEEE International Conference on, 2004, pp. 294-303.
[76] S. Agarwal, et al., "OPCA: robust interdomain policy routing and traffic control," in Open Architectures and Network Programming, 2003 IEEE Conference on, 2003, pp. 55-64.
[77] A. Bremler-Barr, et al., "Improved BGP Convergence via Ghost Flushing," in Infocom '03, San Francisco, USA, 2003.
[78] W. Xu and J. Rexford, "MIRO: multi-path interdomain routing," in SIGCOMM '06: Proceedings of the 2006 conference on Applications, technologies, architectures, and protocols for computer communications, 2006, pp. 171-182.
[79] J. Chandrashekar, et al., "Limiting path exploration in BGP," in INFOCOM 2005. 24th Annual Joint Conference of the IEEE Computer and Communications Societies. Proceedings IEEE, 2005, pp. 2337-2348 vol. 4.
[80] J. Chandrashekar, et al., "Fixing BGP, one as at a time," in NetT '04: Proceedings of the ACM SIGCOMM workshop on Network troubleshooting, 2004, pp. 295-300.
[81] D. Pei, et al., "BGP-RCN: improving BGP convergence through root cause notification," Comput. Netw. ISDN Syst., vol. 48, pp. 175-194, 2004.
[82] O. Bonaventure, et al., "Achieving sub-50 milliseconds recovery upon BGP peering link failures," IEEE/ACM Trans. Netw., vol. 15, pp. 1123-1135, 2007.
[83] C. Labovitz, et al., "Delayed Internet routing convergence," Networking, IEEE/ACM Transactions on, vol. 9, pp. 293-306, 2001.
[84] J. Luo, et al., "An Approach to Accelerate Convergence for Path Vector Protocol," in Globecom '02, Tapei, Taiwan, ROC, 2002.
[85] N. Kushman, et al., "R-BGP: Staying Connected in a Connected World," in 4th USENIX Symposium on Networked Systems Design & Implementation 2007, pp. 341-354.
[86] B. Quoitin, et al., "Interdomain traffic engineering with BGP," Communications Magazine, IEEE, vol. 41, pp. 122-128, 2003.
[87] M. Motiwala, et al., "Path splicing," in SIGCOMM '08: Proceedings of the ACM SIGCOMM 2008 conference on Data communication, Seattle, WA, USA, 2008, pp. 27-38.
[88] M. Shand and S. Bryant, "IP Fast Reroute Framework," draft-ietf-rtgwg-ipfrr-framework-10, work in progress, Feb 27 2009.
[89] P. Francois and O. Bonaventure, "An evaluation of IP-based fast reroute techniques," in CoNEXT '05: Proceedings of the 2005 ACM conference on Emerging network experiment and technology, Toulouse, France, 2005, pp. 244-245.
[90] S. Singh, et al., "Asynchronous Transfer Mode (ATM) over Layer 2 Tunneling Protocol Version 3 (L2TPv3), RFC 4454," May 2006.
[91] A Path Computation Element (PCE)-Baed Architecture, IETF RFC 4655, 2006. [92] M. Yannuzzi, et al., "On the challenges of establishing disjoint QoS IP/MPLS paths across multiple
domains," Communications Magazine, IEEE, vol. 44, pp. 60-66, 2006. [93] I. v. Beijnum. (2002 A Look at Multihoming and BGP. See
http://www.oreillynet.com/pub/a/network/2002/08/12/multihoming.html. Available: http://www.oreillynet.com/pub/a/network/2002/08/12/multihoming.html
[94] G. Huston. (2004, BGP Routing Table Analysis Reports, http://bgp.potaroo.net/ Available: http://bgp.potaroo.net/
[95] T. Bu, et al., "On characterizing BGP routing table growth," Comput. Netw., vol. 45, pp. 45-54, 2004.
[96] C. De Launois and M. Bagnulo, "The paths toward IPv6 multihoming," Communications Surveys & Tutorials, IEEE, vol. 8, pp. 38-51, 2006.
[97] O. Antonova, "Introduction and Comparison of SCTP, TCP-MH, DCCP protocols," 2004. [98] S. Tao, et al., "Exploring the performance benefits of end-to-end path switching," in Network
Protocols, 2004. ICNP 2004. Proceedings of the 12th IEEE International Conference on, 2004, pp. 304-315.
163
[99] J. Han, et al., "An Experimental Study of Internet Path Diversity," Dependable and Secure Computing, IEEE Transactions on, vol. 3, pp. 273-288, 2006.
[100] G. Huston. The growth of the bgp table - 1994 to present. http://bgp.potaroo.net Available: http://bgp.potaroo.net
[101] CAIDA , The Cooperative Association for Internet Data Analysis see http://www.caida.org/home/. [102] NLANR-AMP, "Location of AMP monitors. see http://watt.nlanr.net/," ed. [103] RIPE-NCC, "Location of RIPE monitors. see http://www.ripe.net/projects/ttm/Plots/locations.cgi,"
ed. [104] S. Savage, et al., "The end-to-end effects of Internet path selection," in SIGCOMM '99: Proceedings
of the conference on Applications, technologies, architectures, and protocols for computer communication, 1999, pp. 289-299.
[105] M. Faloutsos, et al., "On power-law relationships of the Internet topology," in SIGCOMM '99: Proceedings of the conference on Applications, technologies, architectures, and protocols for computer communication, 1999, pp. 251-262.
[106] CAIDA AS Relationships Dataset, see http://www.caida.org/data/active/as-relationships/. [107] R. Keralapura, et al., "Can ISPs Take the Heat from Overlay Networks?," presented at the HotNets
(04), San Diego, CA USA 2004. [108] T. S. E. Ng and H. Zhang, "Predicting Internet network distance with coordinates-based
approaches," in INFOCOM 2002. Twenty-First Annual Joint Conference of the IEEE Computer and Communications Societies. Proceedings. IEEE, 2002, pp. 170-179 vol.1.
[109] V. Padmanabhan and L. Subramanian, "An investigation of geographic mapping techniques for internet hosts," in SIGCOMM '01: Proceedings of the 2001 conference on Applications, technologies, architectures, and protocols for computer communications, 2001, pp. 173-185.
[110] S. Ratnasamy, et al., "Topologically-Aware Overlay Construction and Server Selection," in Infocom, New York, NY, USA, 2002.
[111] M. Costa, et al., "PIC: practical Internet coordinates for distance estimation," in Distributed Computing Systems, 2004. Proceedings. 24th International Conference on, 2004, pp. 178-187.
[112] P. Francis, et al., "IDMaps: A Global Internet Host Distance Estimation Service," ed, 2000. [113] L. Tang and M. Crovella, "Virtual Landmarks for the Internet," in IMC’03, Miami Beach, Florida,
USA, 2003. [114] G. Mohan, et al., "Efficient algorithms for routing dependable connections in WDM optical
networks," Networking, IEEE/ACM Transactions on, vol. 9, pp. 553-566, 2001. [115] T. Rakotoarivelo, et al., "A structured peer-to-peer method to discover QoS enhanced alternate
paths," in Information Technology and Applications, 2005. ICITA 2005. Third International Conference on, 2005, pp. 671-676 vol.2.
[116] T. Erlebach, et al., "Cuts and Disjoint Paths in the Valley-Free Path Model," presented at the Proceedings of the First Workshop on Combinatorial and Algorithmic Aspects of Networking (CAAN), 2004
[117] G. Di Battista, et al., "Computing the types of the relationships between autonomous systems," in INFOCOM 2003. Twenty-Second Annual Joint Conference of the IEEE Computer and Communications Societies. IEEE, 2003, pp. 156-165 vol.1.
[118] J. Xia and L. Gao, "On the evaluation of AS relationship inferences [Internet reachability/traffic flow applications]," in Global Telecommunications Conference, 2004. GLOBECOM '04. IEEE, 2004, pp. 1373-1377 Vol.3.
[119] R. E. T. J.W. Suurballe, "A Quick Method for Finding Shortest Pairs of Disjoint Paths," Networks vol. Vol. 14, pp. pp 325-336, 1984.
[120] J. Kleinberg, "Approximation Algorithms for Disjoint Paths Problems, PhD thesis," PhD thesis, Dept. of EECS MIT 1996.
[121] T. Rakotoarivelo, et al., "Enhancing QoS Through Alternate Path: An End-to-End Framework " in ICN 2005, 4th International Conference on Networking ReunionIsland, France, 2005, pp. 125-132.
[122] Cymru IP TO ASN Whois Service. http://www.cymru.com/. [123] GNU netcat. see http://netcat.sourceforge.net. [124] RouteViews. Available: http://www.routeviews.org/
164
[125] D. B. Chua, et al., "Efficient monitoring of end-to-end network properties," in INFOCOM 2005. 24th Annual Joint Conference of the IEEE Computer and Communications Societies. Proceedings IEEE, 2005, pp. 1701-1711 vol. 3.
[126] H. V. Madhyastha, et al., "iPlane: An Information Plane for Distributed Services," in In Proceedings of the 7th USENIX Symposium on Operating Systems Design and Implementation, Seattle, WA, 2006, pp. 367-380,.
[127] G. H. Golub and C. F. V. Loan, Matrix Computations, Third ed.: John Hopkins, 1996. [128] N. Spring, et al., "Measuring ISP topologies with rocketfuel," in SIGCOMM '02: Proceedings of the
2002 conference on Applications, technologies, architectures, and protocols for computer communications, 2002, pp. 133-145.
[129] B. Augustin, et al., "Avoiding traceroute anomalies with Paris traceroute," in IMC '06: Proceedings of the 6th ACM SIGCOMM on Internet measurement, 2006, pp. 153-158.
[130] D. Dobson and F. Santosa, "Recovery of blocky images from noisy and blurred data," SIAM J. Appl. Math., vol. 56, pp. 1181-1198, 1996.
[131] E. J. Candes, et al., "Robust uncertainty principles: exact signal reconstruction from highly incomplete frequency information," Information Theory, IEEE Transactions on, vol. 52, pp. 489-509, 2006.
[132] D. Donoho, "For most large underdetermined systems of equations, the minimal â„“1-norm near-solution approximates the sparsest near-solution," Communications on pure and applied mathematics, vol. 59, pp. 907-934, 2006.
[133] A. Bruckstein, et al., "On the Uniqueness of Nonnegative Sparse Solutions to Underdetermined Systems of Equations," IEEE Transactions on Information Theory, vol. 54, pp. 4813-4820, 2008.
[134] Rosen, et al., "Accurate Solution to Overdetermined Linear Equations with Errors Using L1 Norm Minimization," Computational Optimization and Applications, vol. 17, pp. 329-341, 2000.
[135] J. Neter, et al., Applied Linear Regression Models, Third ed.: Irwin, 1996. [136] R. Christensen, Plane Answers to Complex Questions: The Theory of Linear Models, Third ed.:
Springer, 2002. [137] I. Daubechies, et al., "Iteratively Re-weighted Least Squares minimization: Proof of faster than
linear rate for sparse recovery," in Information Sciences and Systems, 2008. CISS 2008. 42nd Annual Conference on, 2008, pp. 26-29.
[138] The Archiplego Project (CAIDA) http://www.caida.org/projects/ark/. [139] W. Cui, et al., "Backup path allocation based on a correlated link failure probability model in
overlay networks," in Network Protocols, 2002. Proceedings. 10th IEEE International Conference on, 2002, pp. 236-245.
[140] V. Aggarwal, et al., "Can ISPS and P2P users cooperate for improved performance?," SIGCOMM Comput. Commun. Rev., vol. 37, pp. 29-40, 2007.
[141] T. Karagiannis, et al., "Should internet service providers fear peer-assisted content distribution?," in IMC '05: Proceedings of the 5th ACM SIGCOMM conference on Internet Measurement, Berkeley, CA, 2005, pp. 6-6.
[142] D. B. Chua, et al., "A Statistical Framework Fo Efficient Monitoring Of End-to-End Network Properties," CoRR, vol. abs/cs/0412037, 2004.