scale ladders – communicating size and · pdf fileobjects to communicate their size and...
TRANSCRIPT

Scale Ladders – Communicating Size and Scale
Design-Based Research
Joyce Ma
September 2007

Scale Ladders - Communicating Size and Scale
NISE Network Research and Evaluation - 2 - www.nisenet.org
Joyce Ma Exploratorium 3601 Lyon Street San Francisco joycem at exploratorium dot edu 415 674-2874
Acknowledgements
The author would like to thank Karen Chang, Fay Dearborn, Alyssa Freedman, Nina Hido, and Mary Kidwell for recruiting visitors and administering the interviews for these studies. Karen Chang, Alyssa Freedman and Rita Shiau also helped in coding visitors’ responses. This work was done in collaboration with the design team, Jennifer Frazier, Diane Burk and Tom Rockwell who were key in defining the direction of this work.
This report was based on work supported by the National Science Foundation under Grant No. ESI-0532536. Any opinions, findings, and conclusions or recommendations expressed in this report are those of the author and do not necessarily reflect the views of the Foundation.

Scale Ladders - Communicating Size and Scale
NISE Network Research and Evaluation - 3 - www.nisenet.org
Table of Contents
Purpose......................................................................................................... 4
Summary Of Key Findings............................................................................ 5
Study 1 ...........................................................................................................7 The Scale Ladder............................................................................................................................... 7 Method .............................................................................................................................................. 10 Data Corpus ..................................................................................................................................... 11 Results .............................................................................................................................................. 12 Design and Use Implications........................................................................................................... 16
Study 2.........................................................................................................18 Materials ........................................................................................................................................... 18 Method .............................................................................................................................................. 20 Data Corpus ..................................................................................................................................... 20 Results .............................................................................................................................................. 21 Design and Use Implications........................................................................................................... 23
Study 3........................................................................................................ 24 Materials ........................................................................................................................................... 25 Method .............................................................................................................................................. 31 Data Corpus ..................................................................................................................................... 31 Results .............................................................................................................................................. 32 Design and Use Implications........................................................................................................... 40
Conclusions .................................................................................................41
References .................................................................................................. 42
Appendix A: Interview Questions for Study 1 ............................................. 43
Appendix B: Interview Questions for Study 2............................................. 45
Appendix C: Interview Questions for Study 3..............................................47

Scale Ladders - Communicating Size and Scale
NISE Network Research and Evaluation - 4 - www.nisenet.org
Purpose
Scale ladders are a class of diagrams that show the relative size ordering of different objects to communicate their size and scale. Typically, a scale ladder diagram includes a number line, or ruler, and familiar objects to indicate size relationships. Some examples are shown in Figure 1.
Schombert, James. Distance Scale. Retrieved September 30, 2007 from http://abyss.uoregon.edu/%7Ejs/ast123/lectures/lec13.html.
University of Kentucky, Department of Chemistry. Cluster Hires in Bio-Inspired NanoTechnology. Retrieved September 30, 2007 from http://www.chem.uky.edu/facultysearch/Bio-inspired_Nanotechnology_Search.html.
Figure 1.
Examples of scale ladders

Scale Ladders - Communicating Size and Scale
NISE Network Research and Evaluation - 5 - www.nisenet.org
This report documents a series of interview studies conducted at the Exploratorium, as part of a larger effort of NISE Net, to determine how museum visitors interpret scale ladders that focus on the nanoscale. These studies look at different versions of an example scale ladder in order to
• iteratively develop a scale ladder that may be used by other informal science institutions.
• formulate guidelines to inform the design and use of other scale ladders.
Three studies make up our series.
• The first study served as a baseline to identify: What, if anything, does a scale ladder convey to visitors, in particular about the nanoscale? As part of this study, we also collected visitor feedback on what people found confusing, interesting and surprising, and unfamiliar about the scale ladder.
• The second study looked at the scale ladder without the ruler, which our first study found was confusing for some visitors. This study addressed the question: Does removing the ruler from the scale ladder change visitors’ interpretation of its main message?
• The final study compared three versions of the scale ladder as used in an exhibit label. It determined: Do visitors think that the scale ladder helps them better understand the exhibit and the nanoscale, and in what way? It also explored the trade-offs in including objects specific to the accompanying exhibit versus using more varied but familiar objects to indicate the size of the nanoscale. That is: How does the choice of objects used in the scale ladder affect visitors’ understanding of the nanoscale and of the exhibit?
Summary Of Key Findings
The following table summarizes our key findings and their possible design and use implications.

Scale Ladders - Communicating Size and Scale
NISE Network Research and Evaluation - 6 - www.nisenet.org
Table 1. Summary - Key findings with design and use implications
Study Finding Implication
Most visitors thought the scale ladder showed the (relative) size of objects.
→ The scale ladder is a useful device for conveying relative size.
1
Less than half of the visitors looked closely at or thought deeply about the nanoscale portion
of the scale ladder poster.
→ A scale ladder poster alone may not be enough to convey the size and scale of the nanoscale.
2 Removing the ruler from the scale ladder did not have a measurable effect on visitors’
interpretation of its main message or their definition of nano.
→ It is not critical to include a ruler, or number line, especially if the scale ladder is intended to communicate relative size.
Most visitors found the scale ladder helpful in understanding an exhibit about
nanostructures, but some visitors felt that the scale ladder was confusing and / or
superfluous to the exhibit.
→ The scale ladder, when used with an exhibit, should help explain that exhibit. When it introduces a supplemental message not immediately related to the exhibit, that scale ladder may be seen as extraneous and, worse, confusing.
Visitors were more likely to see the scale ladder’s relevance when it included items
specifically mentioned in the exhibit.
→ When incorporating a scale ladder into an exhibit’s label, include objects that refer specifically back to the structures and phenomenon in the exhibit. Otherwise, visitors are more likely to see the scale ladder as disconnected from the exhibit.
A more diverse (and possibly more familiar) set of objects did not lead to a better
understanding of the nanoscale.
→ When creating a scale ladder for an exhibit, it is more important to use objects mentioned in the exhibit rather than objects from different fields (such as biology and technology) or more generally familiar objects.
3
When reading a scale diagram to determine the size of a nano-sized object, visitors looked more at the objects that bracket the nanoscale
category than at other objects on the ladder.
→ Some rungs were more important than others in helping visitors interpret the nanoscale. Pay particular attention to selecting easily recognizable objects on the lowest rung in the microscale and on the highest rung on the atomic scale, which bound the nanoscale.

Scale Ladders - Communicating Size and Scale
NISE Network Research and Evaluation - 7 - www.nisenet.org
Study 1
The purpose of this study was to collect baseline information to gauge
• What, if anything, does a scale ladder convey to visitors?
• In particular what, if anything, does the scale ladder convey about the nanoscale?
We used a variety of measures to try to answer these questions, including coding visitors’ impressions of the diagram’s main message, identifying pre-post changes in visitors’ definition for the word nano, and cataloging confusing, interesting and surprising, and unfamiliar aspects of the ladder that stood out for visitors. We also administered a short reasoning task to try to characterize how visitors read the nanoscale portion of the scale ladder, although we considered these data only as supplemental information since the task may not be part of an authentic floor experience.
The Scale Ladder
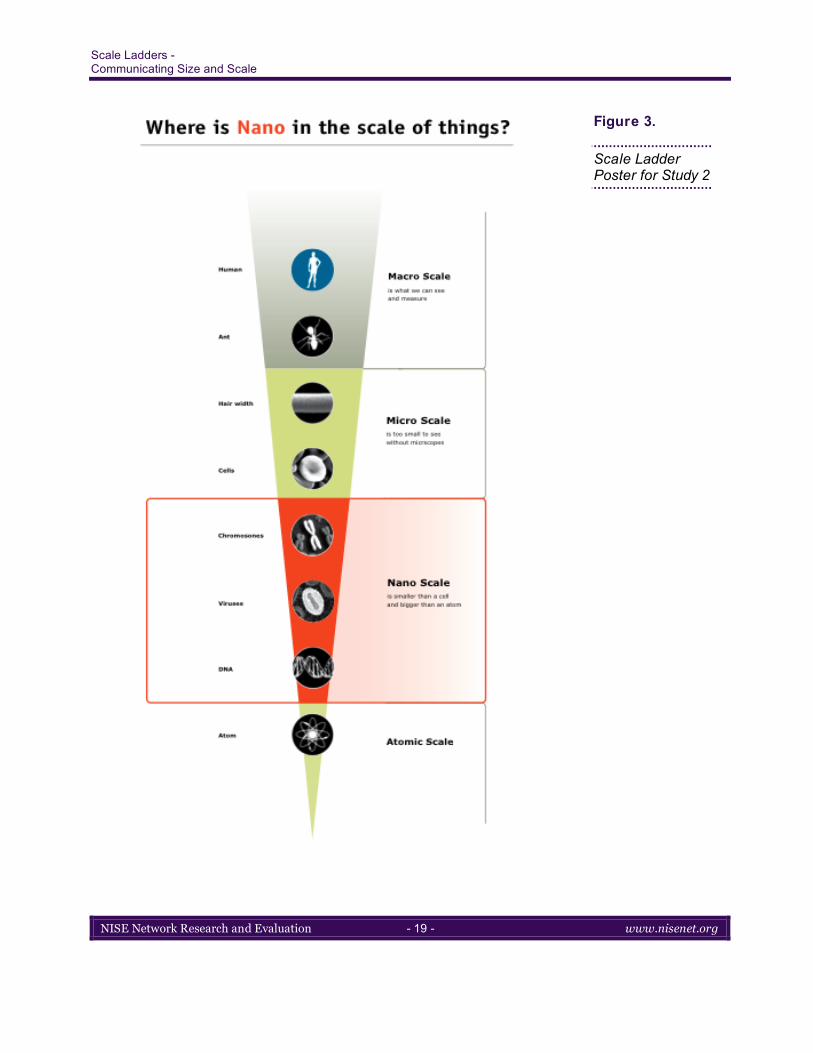
The scale ladder we used, Where is nano in the scale of things? depicts the nanoscale as a size category smaller than a cell but bigger than an atom. (See Figure 2.)

Scale Ladders - Communicating Size and Scale
NISE Network Research and Evaluation - 8 - www.nisenet.org
Figure 2.
Scale ladder poster for Study 1

Scale Ladders - Communicating Size and Scale
NISE Network Research and Evaluation - 9 - www.nisenet.org
The scale ladder’s design was informed by studies on people’s understanding of size and scale and research on analogical reasoning. In particular,
• We included size landmarks (Tretter, Jones, Andre, Negishi, & Minogue, 2006) and anchoring objects (Tretter, Jones, & Minogue, 2006) in our scale ladder to provide visitors with familiar size references for each scale category. See Table 2.
Table 2. Landmarks and anchoring objects used in the scale ladder
Scale Category Landmark Notes
Macro Person “This landmark was a major referent for all groups, from experts… to elementary students” (Tretter, Jones, Andre et al., 2006), p 298)
Macro Ant This was a size landmark for gifted seniors and experts.(Tretter, Jones, Andre et al., 2006)
Micro Hair thickness This landmark was identified in Tretter, Jones, & Minogue, (2006), although the authors found that some people from graduate to elementary school students thought this object was smaller than it actually is.
Micro Cell This was identified in Tretter, Jones, & Minogue (2006). None of the elementary students interviewed thought of a cell when asked for something in this size category.
Atomic Atom This was a landmark for graduated students in science. (Tretter, Jones, Andre et al., 2006)
• We chose to emphasize relative size as opposed to exact size, since research results “indicate that relative size information [is] more readily understood.” (Tretter, Jones, Andre et al., 2006)
• We supplemented the metric unit with another measuring unit, the width of a human hair. Our intention was to create a more familiar unit to help people think about and measure the very small, an attempt to encourage ‘unitizing’, an expert strategy of creating and then working with a new unit more appropriate for a different size scale. (Tretter, Jones, & Minogue, 2006)
• We noted an analogy that compares a familiar base (human height: hair width) to the less familiar target (hair width: width of DNA), in order to emphasize the scale jump between a nano-size object (e.g., DNA) and a more familiar, almost visible object (e.g., width of a strand of hair). Research on analogical reasoning has shown that making comparisons highlights relationships and can help people make sense of the unfamiliar by mapping it to the familiar (Gentner & Markman, 1997).

Scale Ladders - Communicating Size and Scale
NISE Network Research and Evaluation - 10 - www.nisenet.org
The scale ladder design is also the product of the experienced judgment and aesthetic sense of our graphic designer, Diane Burk. Details of the design process can be found in her Designer’s Notebook.
Method
A 27-inch by 36-inch copy of the scale ladder was mounted on poster board, set on an easel, and placed on the museum floor. It remained covered until the interview.
To recruit visitors, the evaluator drew an imaginary line on the floor near the poster and approached every third visitor who crossed that line for an interview. We only recruited visitors 10 years old or older. If it were not clear how old a child was on sight, the evaluator would ask at the start of the interview. These interviews were conducted with individual visitors, although other members of the visiting group could look on if they chose.
Each interview lasted approximately 15 minutes and consisted of several parts, as outlined here.
• Pre-Ladder Interview. Before visitors saw the scale ladder, we asked a set of questions to get a sense of what visitors associated with the word nano. (There was also a short drawing task asking visitors to represent the idea of small. Those findings are reported elsewhere.)
• Interview with the Scale Ladder. We then showed visitors the scale ladder poster and asked them to talk about what they thought the diagram was trying to show and what was interesting, surprising, unfamiliar, and confusing about the scale ladder.
• Post Ladder Interview. Afterwards, we asked again what they now associated with nano without referring back to the poster.
• Supplemental Placement Task. Finally, we asked visitors to try to place a nanoscale object in the scale ladder to better understand how visitors reason with the diagram. This came at the very end of our interview since we suspected that visitors would look more closely at the different elements of the diagram just for this task, and that their reasoning for this task would not reflect how they would typically read and interpret a scale ladder when it is used in a poster or an exhibit label on the museum floor.
The interview questions can be found in Appendix A.

Scale Ladders - Communicating Size and Scale
NISE Network Research and Evaluation - 11 - www.nisenet.org
Data Corpus
We recruited and interviewed visitors over four consecutive days:
March 29, 2007 Thursday
March 30, 2007 Friday
March 31, 2007 Saturday
April 1, 2007 Sunday
We interviewed 34 visitors in total (N = 34). Their demographic information are summarized in Table 3 and Table 4.
Table 3. Gender of visitors (Study 1)
Gender Count
Female 15 (44%)
Male 19 (56%)
All 34 (100%)
Table 4. Age group of visitors (Study 1)
Age Group Count
Child (10-12) 3 (9%)
Teen (13-17) 10 (29%)
Adult (18-65) 19 (56%)
Senior (65+) 2 (6%)
All 34 (100%)

Scale Ladders - Communicating Size and Scale
NISE Network Research and Evaluation - 12 - www.nisenet.org
Results
Key Findings
• Most visitors thought the scale ladder showed the (relative) size of objects.
• Less than half of the visitors looked closely at or thought deeply about the nanoscale in the scale ladder poster. That is, less than 40% of the visitors identified the main message of the scale ladder as being about the nanoscale, and less than half of the visitors were able to articulate a more precise definition of nano after looking at the poster.
• Visitors found the ruler to be the most confusing aspect of the scale ladder, the relative size of objects to be the most interesting and surprising, and the nanoscale objects to be the most unfamiliar.
Most visitors thought the scale ladder showed the (relative) size of objects.
We asked visitors during the scale ladder interview, what they thought the diagram was trying to show, if anything. We coded their responses first into three broad categories according to the types of relationships they noted:
• Size – the poster shows something about size
• Composition – the poster shows what something is made of
• Other Themes – the poster is about biology or another content area
A visitor’s response could fall into multiple categories. Size is represented in various ways in our scale ladder: 1) The order of the objects from big to small shows relative size; 2) the ruler indicates exact size; and, 3) the macro, micro, nano and atomic scale are delineated and labeled as different regions on the poster to convey size categories. We took a closer look at visitors’ comments to identify what type(s) of size visitors described:
• Relative Size – X is smaller than / bigger than Y
• Size Category – X is in the Z category, or there is a Z size category
• Size and Measure – Originally, we looked for visitors’ description of exact measures, but we found that no one talked about exact size or gave specific numbers. Instead, a few visitors mentioned, more vaguely, that the poster was trying to show them something about measurement and the size of different objects. This category includes those responses.
Table 5 summarizes the results and gives examples for each category to better illustrate the coding scheme.

Scale Ladders - Communicating Size and Scale
NISE Network Research and Evaluation - 13 - www.nisenet.org
Table 5. What visitors thought the scale ladder was trying to show (Study 1). Categories are not mutually exclusive.
Visitors thought the scale ladder was about …
Count
(out of 34) Visitors’ Responses - Examples
Size (The size of X)
34 (100%)
Relative Size (The size of X relative to the size of Y)
30 (88%) V02FA: The size of things in relationship to other things that we might be familiar with
V12MA: They’re comparing it to things you’ve seen before, like an ant
Size Categories (X is in the Z size category or grouping; there is a Z size category)
8 (24%) V24FA: showing the groups of sizes V28FA: You can see some things with the naked eye, but need
magnifiers for others… There are things you can see with eyes, things you can see with magnification, and really small things
Size and Measures (The size and measure of X with NO mention of relative size)
8 (24%) V14MT: How big things are. How wide things can be V31MT: How big /tall/long something is and how you can measure
it or if you can even measure it
Composition (X is made of Y)
5 (15%) V14MT: Breaking down the level of complexity in nature, like down to atoms
Others Themes 2 (6%) V12MA: it has something to do with a virus or DNA. Some kind of organism
We found that every visitor thought the scale ladder diagram showed something about size1. A large majority (88%) thought it conveyed the relative size of different objects, whereas a much smaller percentage (24%) mentioned size categories.
In addition, our placement task revealed that most visitors reasoned using relative (72%) instead of exact (24%) size. That is, when they were asked to place a new object on the scale ladder, most visitors’ strategy was to determine what it was smaller than and larger than and then position the object between the two. This is instead of using the ruler to determine the exact size and the placement of the object.
These findings suggest that the scale ladder is a good device for conveying relative size. Visitors can readily interpret the size ordering with the scale ladder.
1 We note, however, that a few visitors (15%), in addition, thought that the diagram’s main message was about how one thing is made of other, smaller, things. And, one person was under the impression that the poster depicted different living organisms.

Scale Ladders - Communicating Size and Scale
NISE Network Research and Evaluation - 14 - www.nisenet.org
Less than half of the visitors looked closely at or thought deeply about the nanoscale in the scale ladder poster.
There were, however, several indications suggesting that some visitors did not look closely at or think deeply about the nanoscale portion of the poster. That is, the nanoscale did not stand out or make a strong impression with some visitors. First, only 38% of visitors thought the scale ladder’s main message had something to do with the size of the nanoscale. This is even though the title of the poster was Where is Nano in the Scale of Things?
The second indication was that less than half of the visitors thought about the size of nano differently after seeing the scale ladder. To determine if the scale ladder changed visitors’ associations with the word nano, we asked visitors before and after seeing the scale ladder what they thought of when they heard the word nano2, and coded visitors’ responses according to the following scheme:
• No Change to Size– There are two types of responses that fall in this category.
− A visitor’s association with the word nano did not change at all. − There was no change regarding the size of nano. For example, a visitor may
think nano has something to do with iPods in the pre-ladder interview and then associate nano with science in the post-ladder interview.
• Change to Size – During the pre-ladder interview, the visitor did not associate nano with size. However, in the post-ladder interview, nano connoted size, usually something of a very small size.
• Change with Refinement in Size – The visitor became more specific about the size of the nanoscale.
The results with examples of each coding category can be found in Table 6. After spending about 5 minutes with the poster, 44% of the visitors had changed their associations with the word ‘nano’.
2 We were not looking for conceptual or any other profound change in visitors’ understanding, which would have involved a much more extensive set of questions. Instead, we were simply interested in capturing any indication that visitors’ associations with nano had changed, even if it’s merely repeating what they had just read on the poster.

Scale Ladders - Communicating Size and Scale
NISE Network Research and Evaluation - 15 - www.nisenet.org
Table 6. Visitors’ pre - post associations with the word nano (Study 1)
Was there a pre-post change?
Count
(out of 34) Example
NO CHANGE (Regarding the size of nano)
19 (56%)
No change in size of nano 153 (44%) V07FT: (Pre) It's something very small (Post) VERY small things
Change but not related to size of nano
4 (12%) V15MS: (Pre) Something to do with computers. IPods (Post) The number 9
CHANGE TO SIZE (From nano is unrelated to size to nano is related to size)
7 (21%) V16FT: (Pre) Ipod… Microsoft (Post) Something very small
CHANGE WITH SIZE REFINEMENT (Refinement in the size connoted by nano)
8 (23%) V33FT: (Pre) Small, tiny, miniscule (Post) small and microscopic… atomic is smaller
Furthermore, only 9% (3/34) of all the visitors when interviewed immediately after looking at the scale ladder, mentioned that nano is bigger than an atom and smaller than a cell, the definition we had hoped to communicate in our scale ladder. In fact, a few visitors came away with inaccurate definitions of the nanoscale:
V01FA: [It’s] something you can explore under microscope V02FA: [It’s] The width of a hair or something that size V09FA: [It’s] 10-4 V16FT: [It’s] Something in your body
However, when they were asked to place a nanoscale object in the scale ladder, almost every visitor (97%) was able to find the nanoscale in the scale ladder and place the object in that region. This suggests that visitors, when asked to simply look and comment on the scale ladder, do not focus closely on the nanoscale. However, given a more directed task, visitors can read the diagram enough to identify different categories of scale and where the nanoscale fits in the scale ladder.
3 None of these visitors started with a precise definition for the size of the nanoscale. All but one, in fact, said that nano was something very small in both the pre-ladder and the post-ladder interview.

Scale Ladders - Communicating Size and Scale
NISE Network Research and Evaluation - 16 - www.nisenet.org
Aspects visitors found confusing, interesting, surprising and unfamiliar
As part of our interview, we asked visitors to look at the scale ladder and talk about what was confusing, interesting, surprising, and unfamiliar to them. The following summarizes visitors’ responses. It includes only those comments shared by at least 20% of the visitors.
• The Confusing
− More than a quarter (27%) of the visitors found some aspect of the ruler confusing. More specifically, some visitors were confused by hair width as a unit of measure, while others admitted to having difficulties really understanding numbers that were so small.
• The Interesting and Surprising
− Half of the visitors found relative size interesting and/or surprising. A minority (25%) found an interesting size comparison to an object in the nanoscale.
− Although we tried to unitize hair width, only a minority (25%) used it as a basis for comparison. Furthermore, 15% of the visitors mentioned that hair width was an interesting and surprising unit of measure; yet, the same percentage found this unconventional unit confusing.
• The Unfamiliar
− 21% of the visitors said they did not recognize an image used in the scale ladder, with 6 out of those 7 people professing to be unfamiliar with a nanoscale object. The nanoscale remains the least familiar of the different size scales on the poster.
Design and Use Implications
This study provided a first look at visitors’ interpretation of a scale ladder designed to convey the size and scale of the nanoscale. The findings suggest that the scale ladder is an effective device for conveying relative size, more so than exact size or categories of size. Therefore, if it is important to communicate measurements or scale categories, we may also want to explore other types of representations which may be better suited for those other expressions of size.
The findings also suggest that the nanoscale does not stand out in the poster; it does not have a strong impression on visitors. A poster alone without an accompanying activity or a context that gives visitors a reason to read and interpret the ladder may not be enough to motivate visitors to look closely or think deeply about the nanoscale as depicted. One of the limitations of this study is that the scale ladder we tested sat outside of a larger context for interpretation. That is, it was not part of an exhibition, a program, or even an exhibit. Some of the shortcomings of the current scale ladder may be addressed with a redesign; however, others such as highlighting the nanoscale, may also be addressed by situating the poster in a larger context to help focus its interpretation. We will explore this option in Study 3.

Scale Ladders - Communicating Size and Scale
NISE Network Research and Evaluation - 17 - www.nisenet.org
This study also identified the ruler as a source of confusion for over one-quarter of the visitors. Conveying exact size on a ruler that spans several orders of magnitude is a difficult design challenge to meet. Given visitor feedback, we venture that the ruler is superfluous for conveying relative size, and it does not seem to help visitors determine the exact size of the objects depicted on the ladder. This is in spite of the fact that a ruler, or a number line, is a typical element of a scale ladder. Although some visitors thought the supplementary unit, hair width, was interesting to think about, the ruler seemed to, if anything, confuse rather than illuminate. We take a closer look at the ruler in the following study.

Scale Ladders - Communicating Size and Scale
NISE Network Research and Evaluation - 18 - www.nisenet.org
Study 2
Study 1 found that the ruler was a source of confusion for some visitors. Given our emphasis on relative size and our desire to simplify the design, the team decided to remove the ruler from the scale ladder instead of redesigning it. The ruler, however, is typically a key if not one of the defining elements of a scale ladder. We, therefore, wanted to see if eliminating this element would detract from the diagram. The purpose of Study 2 was, therefore, to determine:
• Does removing the ruler from the scale ladder change visitors’ interpretations of its main message?
Materials
Figure 3 shows the redesigned scale ladder. There were other less drastic changes to the scale ladder. These included highlighting the nanoscale, reorienting the images so that all size comparisons are along the vertical (e.g., the height of a human, the length of an ant, the width of DNA), and removing the analogy, which only a handful of visitors remarked upon in Study 1.
Scale Ladders - Communicating Size and Scale
NISE Network Research and Evaluation - 19 - www.nisenet.org
Figure 3.
Scale Ladder Poster for Study 2

Scale Ladders - Communicating Size and Scale
NISE Network Research and Evaluation - 20 - www.nisenet.org
Method
We followed the same protocol for recruitment and asked the same questions4 as in Study 1, which was described previously. The interview questions for Study 2 can be found in Appendix B.
Data Corpus
Study 2 was meant to be a quick check on our redesign. Consequently, we did not recruit as many visitors to interview, collecting data on only 2 days:
June 24, 2007 Sunday
July 1, 2007 Sunday
We interviewed 17 visitors. (N = 17). Table 7 and Figure 8 summarize their demographic information.
Table 7. Gender of visitors (Study 2)
Gender Count
Female 6 (35%)
Male 11 (65%)
All 17 (100%)
Table 8. Age group of visitors (Study 2)
4 We did change the wording of a part of the placement task; we eliminated the part where visitors would have had to refer to a ruler.
Age Group Count
Child (10-12) 1 (6%)
Teen (13-17) 3 (18%)
Adult (18-65) 13 (76%)
Senior (65+) 0 (0%)
All 17 (100%)

Scale Ladders - Communicating Size and Scale
NISE Network Research and Evaluation - 21 - www.nisenet.org
Results
Key Findings
• Removing the ruler from the scale ladder diagram did not have a measurable effect on visitors’ interpretation of the poster’s main message or visitors’ association(s) with the word nano. We note, however, that we only talked with 17 visitors for Study 2.
Table 9 summarizes the main messages that visitors thought the scale ladder was trying to convey. These are the same coding categories used in Study 1. When we compared these to Study 1’s results, we found no statistically significant difference for any category of response. (See Table 10.)
Table 9. What visitors thought the scale ladder was trying to show (Study 2)
Visitors thought the scale ladder was about …
Count
(out of 17) Visitors’ Responses - Examples
Size (The size of X)
17 (100%)
Relative Size (The size of X relative to the size of Y)
14 (82%) V07FA: How small nano is relative to other things V08FA: Showing things in descending order from what we can see to what we can’t see, without a microscope or that we have to assume its there
Size Categories (X is in the Z size category or grouping; there is a Z size category)
5 (29%) V15MT: Different types of size groups
Size and Measures (The size and measure of X with NO mention of relative size)
8 (18%) V11FC: Size of stuff
Composition (X is made of Y)
2 (12%) V01FA: parts of a whole
Others Themes 1 (6%) V010MA: Science

Scale Ladders - Communicating Size and Scale
NISE Network Research and Evaluation - 22 - www.nisenet.org
Table 10. Comparison of visitors’ perception of the poster’s main message (Study 1 and Study 2)
Visitors thought the scale ladder was about …
Study 1
(out of 34)
Study 2
(out of 17)
Size [1] 34 17
Relative Size [1] 30 14
Size Categories [1] 8 5
Size and Measures [1] 8 8
Composition [1] 5 2
Others Themes [1] 2 1
[1] A Fisher’s Exact Test did not find any statistically significant difference between those visitors who described this as the main message of the poster and those who did not for Study 1 and Study 2; p > .05. We also found that although there were more visitors who said that the poster’s main message was about the nanoscale (8/17 or 47% compared to 13/ 34 or 38%), there was no statistically significant difference between the posters we assessed in Study 2 and Study 1; Fisher’s Exact Test, p > .05.
Likewise, we were unable to detect a difference in visitors’ definition of nano before and after looking at the scale ladder poster; Fisher’s Exact Test for 3x2, p > .05. Table 11 shows the tallies. This time, no one in her post-ladder interview repeated the poster’s description of the nanoscale as “bigger than an atom but smaller than a cell.”
Table 11. Comparison of visitors’ pre-post associations with the word nano (Study 1 and Study 2)
Was there a pre-post change? Study 1
(out of 34)
Study 2
(out of 15)
NO CHANGE (Regarding the size of nano)
19 (56%) 8 (53%)
No change in size of nano 15 7
Change but not related to size of nano 4 1
CHANGE TO SIZE (From nano is unrelated to size to nano is related to size)
7 (21%) 0 (0%)
CHANGE WITH SIZE REFINEMENT (Refinement in the size connoted by nano)
8 (24%) 7 (47%)

Scale Ladders - Communicating Size and Scale
NISE Network Research and Evaluation - 23 - www.nisenet.org
The above findings suggest that removing the ruler did not affect, either positively or negatively, visitors’ interpretation of the main message, nor did it affect visitors’ associations with the word nano. However, we note that a few (3/17) visitors did specifically ask for quantitative information while looking at the scale ladder diagram without a ruler. For example,
V05MA: But what are the actual size difference?
Design and Use Implications
The results indicate that removing the ruler, or number line, from the scale ladder diagram did not detract from its main message, nor did it enhance it. A ruler is not essential to communicate (relative) size in a scale ladder diagram.
However, we wonder if eliminating the ruler did affect visitors’ understanding of the nanoscale, but we simply could not detect the difference with our measures. For example, with the ruler (and the analogy) removed, there is no indication of the magnitude of the size differences between the different objects. It is not clear if visitors could infer how much smaller a nanoscale object is without the ruler. In fact 3/17 visitors asked for this type of information when they were looking at the version of the scale ladder without the ruler.5 Communicating how much smaller may now need to rely on other representation types, such as metaphors, analogies, animations and immersives, beyond the scale ladder we developed.
5 At the same time, it was not clear if visitors realized the magnitude of the size differences in the scale ladder with the ruler.

Scale Ladders - Communicating Size and Scale
NISE Network Research and Evaluation - 24 - www.nisenet.org
Study 3
One of the main limitations of our first two studies is that visitors were asked to look at a poster of a scale ladder apart from the larger context of a collection, exhibition, program or an exhibit about the nanoscale. In this third and final study in our series, the scale ladder is used as part of a label for an exhibit that demonstrates the macroscale manifestations of nanoscale structures. We used the exhibit, Nanotech Inspiration, for this study. A photograph with a brief description of the exhibit can be found in Figure 4.
Figure 4.
Nanotech Inspiration.
In this exhibit, water drops onto nasturtium leaves that sit on a platform inside a tank. Visitors can shake the platform and watch the water roll off the leaves. The exhibit is intended to show the macroscale behavior of nanoscale structures, specifically nanocrystals, which create air pockets that form an uneven surface that ‘repels’ water. It is an example of finding inspiration in nature at the nanoscale to inform the design of new man-made fabrics.
The purpose of this study was to determine:
• Do visitors think that the scale ladder help them better understand the exhibit? In what way? That is, does the scale ladder enhance or detract from the exhibit?
• What, if anything, does the scale ladder as used in an exhibit label convey about the nanoscale?
In designing the scale ladder for this study, we discovered a tension between depicting objects specific to the exhibit phenomenon and using more varied objects in the scale ladder diagram. Both Study 1 and Study 2 showed that a few visitors not only saw size relationships between the scale ladder objects, but also saw containment or thematic relationships that may detract from thinking of size categories as transcending these
Scale Ladders - Communicating Size and Scale
NISE Network Research and Evaluation - 25 - www.nisenet.org
other categories (e.g., nano is about biology). We wondered if choosing a more varied set of objects for our scale ladder would encourage visitors to think about different size categories irrespective of the type of object (i.e., whether biological or man-made). Alternatively, we wondered if too diverse of a set would dissuade people from making a connection to the exhibit or, at the extreme, prevent visitors from seeing the size relationship between the objects. The study design then became a comparative study to answer the additional question:
• How does the choice of objects used in the scale ladder affect visitors’ understanding of the nanoscale and of the exhibit?
Materials
The design team created three different versions of a scale ladder for the label for the exhibit, Nanotech Inspiration (aka the Nasturtium exhibit).
• Nasturtium Specific ladder (Figure 5) – This included only images of objects that were part of the nasturtium leaves found in the exhibit and that illustrated the phenomenon the exhibit was trying to demonstrate.
• All Natural ladder (Figure 6)– This included only objects that are found in nature. This was the same ladder used in Study 2.
• Mixed ladder (Figure 7)– This included both man-made objects and object found in nature.

Scale Ladders - Communicating Size and Scale
NISE Network Research and Evaluation - 26 - www.nisenet.org
Figure 5.
Nasturtium specific scale ladder

Scale Ladders - Communicating Size and Scale
NISE Network Research and Evaluation - 27 - www.nisenet.org
Figure 6.
All Natural scale ladder

Scale Ladders - Communicating Size and Scale
NISE Network Research and Evaluation - 28 - www.nisenet.org
Figure 7.
Mixed (man-made with natural objects) scale ladder

Scale Ladders - Communicating Size and Scale
NISE Network Research and Evaluation - 29 - www.nisenet.org
The three ladders differed only in the objects used on certain rungs. (See Table 12.) In all cases, we tried to select images of objects that would be easily recognizable to visitors, though we acknowledge that we could not control for familiarity of the objects among the three versions.
Table 12. Scale ladder objects for the three versions (Study 3). Shared objects are highlighted in purple.
Scale Nasturtium Specific Ladder
All Natural Ladder Mixed Ladder
Nasturtium Leaf Human Human Macro
Water Droplet Ant Penny
Plant Vein Hair Width Hair Width Micro
Plant Cell Cell Integrated Circuit
Microscopic Water Droplets
Chromosome Synthetic Nano-Material
Nasturtium Leaf Nanocrystal
Nasturtium Leaf Nanocrystal
Nasturtium Leaf Nanocrystal
Nano
DNA DNA DNA
Atomic Atom Atom Atom

Scale Ladders - Communicating Size and Scale
NISE Network Research and Evaluation - 30 - www.nisenet.org
Each scale ladder was incorporated into the label; an example with the All Natural ladder is shown in Figure 8.
Figure 8.
Exhibit label with the All Natural scale ladder

Scale Ladders - Communicating Size and Scale
NISE Network Research and Evaluation - 31 - www.nisenet.org
Method
The label was mounted at the exhibit as shown in Figure 4. An evaluator cycled through the three versions of the exhibit label (e.g., Nasturtium Specific to Mixed to All Natural), removing one label and mounting the next between interviews.
The evaluator recruited visitors, 10 years old and older, for cued interviews at the exhibit. She approached every third visitor who crossed an imaginary line near the exhibit and asked permission to ask that visitor a set of questions, which can be found in Appendix C. The interview structure is outlined here:
• Pre-Exhibit Interview. We asked the same set of questions we asked during the pre-ladder interview for Study 1 and Study 2. Visitors answered these questions before they looked at the exhibit.
• Interview in front of the exhibit and label. We brought the visitor over to Nanotech Inspirations and asked her to spend as much time as she liked using the exhibit. We prompted her to look at the label, mentioning that we were particularly interested in improving that aspect of the exhibit. After the visitor indicated that she was done, we asked her a set of questions about the exhibit and the label, and particularly the scale ladder in the label.
• Post Exhibit Interview. Afterwards, we asked again what they thought of when they heard the word nano. This is the same question we asked in Study 1 and 2.
Data Corpus
We collected data on the following days:
July 10, 2007 Tuesday
July 12, 2007 Thursday
July 13, 2007 Friday
July 15, 2007 Sunday
July 17, 2007 Tuesday
July 20, 2007 Friday
July 22, 2007 Sunday
In total, we interviewed 99 visitors (N =99). Their demographic information are given in Table 13 and Table 14.

Scale Ladders - Communicating Size and Scale
NISE Network Research and Evaluation - 32 - www.nisenet.org
Table 13. Gender of visitors (Study 3)
Gender Nasturtium Specific Ladder
All Natural Ladder
Mixed Ladder Total
Female 19 (56%) 18 (56%) 19 (58%) 56 (57%)
Male 15 (44%) 14 (44%) 14 (42%) 43 (43%)
All 34 (100%) 32 (100%) 33 (100%) 99 (100%)
Table 14. Age group of visitors (Study 3)
Age Group Nasturtium Specific Ladder
All Natural Ladder
Mixed Ladder Total
Child (10-12) 1 (3%) 5 (16%) 2 (6%) 8 (8%)
Teen (13-17) 5 (15%) 7 (22%) 11 (33%) 23 (23%)
Adult (18-65) 27 (79%) 17 (53%) 17 (52%) 61 (62%)
Senior (65+) 1 (3%) 3 (9%) 3 (9%) 7 (7%)
Total 34 (100%) 32 (100%) 33 (100%) 99 (100%)
Results
Key Findings
• Most visitors found the scale ladder helpful in understanding an exhibit about nanostructures.
• Visitors were more likely to see the scale ladder’s relevance when it included items specifically mentioned in the exhibit. Otherwise, some visitors found the scale ladder superfluous and / or confusing.
• A more diverse set of object (i.e., a scale ladder that uses objects outside of those referenced in the exhibit) did not affect visitors’ understanding of the nanoscale. This is even though the more diverse set included more landmarks and size references that were identified in earlier studies.
• Some rungs were more important than others in helping visitors interpret the scale ladder.
Most visitors found the scale ladder helpful in understanding an exhibit about nanostructures
Overall, a large majority (84%) of the visitors said that the scale ladder helped them understand the exhibit better. They gave various reasons why they thought so, and the

Scale Ladders - Communicating Size and Scale
NISE Network Research and Evaluation - 33 - www.nisenet.org
most popular ones are tallied in Table 15 along with representative quotes. We found that close to half of the visitors used the scale ladder to make sense of the size of the items in the exhibit, with about a third reporting that the ladder helped explain the exhibit phenomenon itself.
Table 15. Reasons visitors gave for finding the scale ladder helpful
The scale ladder was helpful in …
Count
(out of 95) Example quotes from visitors
Showing the size of things 47 (49 %) V03MA (Nasturtium): It shows the relativity between what you see and what's happening - the way the nanocrystals protect the leaves
V17MT (All Natural): [It] gives you a general idea on what it's about - you know it's talking about small things
V92FT (Mixed): It really emphasizes how small the nanocrystals are
Explaining the exhibit phenomenon
35 (37 %) V58MT (Nasturtium): otherwise you don't know why water rolls off the leaves
V89FA (Mixed): It shows that you see on the leaf and explains why water won't go through it.
Defining the nanoscale 16 (17 %) V41FA (All Natural): It defines nanoscale well… It drives home that there are nano stuff in everyday life.
V7FT (Mixed): It helps to know that you can't see the nanotechs because it's down in nanoscale, which is small and up here is human, which we can see.
Depicting the invisible 7 (7 %) V38MA (All Natural): It is fascinating to see so small nanocrystal.
We performed a set of Chi-square tests to see if there were any statistical differences between the three versions of the scale ladder, and found no significant difference for any of the reasons visitors gave. (See Table 16.)

Scale Ladders - Communicating Size and Scale
NISE Network Research and Evaluation - 34 - www.nisenet.org
Table 16. Reasons visitors gave for finding the scale ladder helpful according to ladder version.
The scale ladder was helpful …
Nasturtium Specific Ladder
(out of 31)
All Natural
Ladder
(out of 32)
Mixed Ladder
(out of 32)
All versions
(out of 95)
In some respect [1] 26 (84 %) 27 (84 %) 27 (84 %) 80 (84 %)
In showing the size of things [2] 12 (39 %) 19 (59 %) 16 (50 %) 47 (49 %)
In explaining the exhibit phenomenon [3]
10 (31 %) 10 (32 %) 15 (47 %) 35 (37 %)
In defining the nanoscale [4] 5 (16 %) 7 (22 %) 4 (13 %) 16 (17 %)
In depicting the invisible [5] 1 (3 %) 4 (13 %) 2 (6 %) 7 (7 %)
[1] This is a tally of every visitor who said the scale ladder was useful in any way. A Chi-square test looking at the count of visitors who did and did not say the ladder was helpful showed no statistically significant difference among the three versions; χ2 (2, N = 95) =0, p > .05. [2] There is no statistically significant difference among the three versions for visitors who did and did not give this reason for finding the ladder helpful; χ2 (2, N = 95) =2.7, p > .05. [3] There is no statistically significant difference among the three versions for visitors who did and did not give this reason for finding the ladder helpful; χ2 (2, N = 95) =2.09, p > .05. [4] There is no statistically significant difference among the three versions for visitors who did and did not give this reason for finding the ladder helpful; χ2 (2, N = 95) = 1.02, p > .05. [5] A 2x3 Fisher’s Exact Test showed no difference between the number of visitors who did and did not mention this among the three versions of the scale ladder; p > .05.
On the other hand, about 30% of the visitors6 found the scale ladder confusing or superfluous to the exhibit. They felt that it did not adequately explain the phenomenon the exhibit was trying to demonstrate, or they could not see a clear connection between the scale ladder and the exhibit. (See Table 17.) This hints at visitors’ expectation that the label should be much more closely tied to exhibit itself.
6 Note that a few visitors reported that certain aspects were useful while other aspects were confusing and unhelpful. We counted these responses in both the helpful and unhelpful category.

Scale Ladders - Communicating Size and Scale
NISE Network Research and Evaluation - 35 - www.nisenet.org
Table 17. Visitors’ explanations for why the scale ladder was not helpful.
The scale ladder was not helpful because …
Count
(out of 95) Example quotes from visitors
There’s no clear connection between the scale ladder and the exhibit
11 (12 %) V34FA (Mixed): I haven’t made the connection
The scale ladder doesn’t explain the phenomenon in the exhibit
15 (16 %) V88MC (Nasturtium): it doesn't show exactly how it repels water.
Visitors were more likely to see the scale ladder’s relevance when it included items specifically mentioned in the exhibit.
We looked more closely at what connections, if any, visitors saw between the scale ladder and the exhibit, and asked visitors specifically to describe any relationship they noticed. We coded their responses, first categorizing their answers according to whether or not they described any connection. That tally is shown in Table 18. We found that a higher percentage of visitors who saw the All Natural and the Mixed ladder did not see a connection compared to the Nasturtium Specific ladder; χ2 (2, N=94) = 6.33, p < .05. As one of these visitors explained:
V20MA (All Natural): They seem unrelated. Each seems like it could be by itself…. they're really talking about two different subjects. One is the scale of size in science. And the other is the effect nanocrystals have on these leaves.
Table 18. Did visitors identify a connection between the scale ladder and the exhibit?
Did visitors see a connection?
Nasturtium Specific Ladder
(out of 30)
All Natural
Ladder
(out of 32)
Mixed Ladder
(out of 32)
All versions
(out of 94)
No 2 (7 %) 9 (28 %) 10 (31 %) 21 (22 %)
Yes 28 (93%) 23 (72%) 22 (69%) 73 (78)
We looked more closely at the type of connections visitors did note. Overall, close to half of the visitors thought the scale ladder was there to illustrate the size of the objects and phenomenon described in the exhibit, while a very small percentage of visitors saw it as device to define, more generally, the nanoscale. See Table 19. But, we did not find a significant difference among the three versions for the types of connections they saw (Table 20).

Scale Ladders - Communicating Size and Scale
NISE Network Research and Evaluation - 36 - www.nisenet.org
Table 19. Connections visitors noted between the scale ladder and the exhibit.
Connection between the scale ladder and the exhibit7
Count
(out of 94)
Visitors’ Responses - Examples
The scale ladder shows, in general, the size of things mentioned in the exhibit
43 (46%) V47MA (Nasturtium): reference for size comparison V81FA (All Natural): In order to show scale V89FA (Mixed): I think it is related. It shows us know stuff
and sizes and dimensions
The scale ladder illustrates the size of the nanocrystals, in particular.
13 (14%) V70MT (All Natural): Helps place the size of the nanocrystal
The scale ladder defines the nanoscale.
9 (10%) V94MA (Nasturtium): explaining nanoscale and where the interaction is
The scale ladder includes certain items found in the physical exhibit.
4 (4%) V12FA (Nasturtium): Yes, the nano water droplets and the leaf are related. Only DNA, I do not think it is related.
7 We also found a few (4/ 99) visitors described connections that we did not intend:
V59MT (All Natural): (referring to human in ladder) humans use this info to make waterproof clothes.
A few others (9/99) called out items from the scale ladder that they believed did not seem to belong and that made the scale ladder more confusing. For example,
V96FT (All Natural): relating it is trippy. I think of DNA and chromosomes as really an animal thing, not part of plant life.
These counts were small, and we could not detect any difference among the three versions of the ladder in the number of unintended links or seemingly incongruous items.

Scale Ladders - Communicating Size and Scale
NISE Network Research and Evaluation - 37 - www.nisenet.org
Table 20. Connections visitors noted between the scale ladder and the exhibit
What connection(s) did visitors see?
Nasturtium Specific Ladder
(out of 30)
All Natural
Ladder
(out of 32)
Mixed Ladder
(out of 32)
All versions
(out of 94)
The scale ladder shows, in general, the size of things mentioned in the exhibit [1]
10 (33 %) 16 (50 %) 17 (53 %) 43 (46 %)
The scale ladder illustrates the size of the nanocrystals, in particular. [2]
1 (3 %) 5 (16 %) 7 (22 %) 13 (14 %)
The scale ladder defines the nanoscale. [2]
1 (3 %) 5 (16 %) 3 (9 %) 9 (10 %)
The scale ladder includes certain items found in the physical exhibit. [2]
3 (10 %) 1 (3 %) 0 (0 %) 4 (4 %)
[1] A Chi-square test looking at the count of visitors who did and did not mention this connection showed no statistically significant difference among the three versions; χ2 (2, N=94)= 2., p > .05. [2] A 2x3 Fisher’s Exact Test showed no difference between the number of visitors who did and did not mention this connection among the three versions of the scale ladder; p > .05.
These findings suggest that a scale ladder, when used with an exhibit, should include images that specifically refer to the items in that exhibit. For example, a scale ladder for the Nasturtium exhibit should be similar to a still zoom on the nasturtium leaf and water droplets; choosing more diverse objects to illustrate size categories may cause more visitors to question the diagram’s relevance.
A more diverse (and possibly familiar) set of objects did not lead to a better understanding of the nanoscale
We, however, wondered: Does selecting too specific a set deter visitors from seeing the nanoscale as a more general category of size? To try to answer this question, we looked at visitors’ pre and post-ladder interview associations with the word nano. Using the same coding categories as in Study 1 and Study 2, we analyzed how visitors’ definitions of nano changed, if at all. The results are tabulated in Table 21.

Scale Ladders - Communicating Size and Scale
NISE Network Research and Evaluation - 38 - www.nisenet.org
Table 21. Comparison of visitors’ pre-post associations with the word nano according to ladder version
Was there a pre-post change?
Nasturtium Specific Ladder
(out of 31)
All Natural
Ladder
(out of 32)
Mixed Ladder
(out of 32)
All versions
(out of 95)
NO CHANGE (Regarding the size of nano)
22 (71 %) 22 (69 %) 19 (59 %) 63 (66 %)
No change in size of nano 16 (52 %) 19 (59 %) 14 (44 %) 49 (52 %)
Change but not related to size of nano 6 (19 %) 3 (9 %) 5 (16 %) 14 (15 %)
CHANGE TO SIZE (From nano is unrelated to size to nano is related to size)
4 (13 %) 3 (9 %) 3 (9 %) 10 (11 %)
CHANGE WITH SIZE REFINEMENT (Refinement in the size connoted by nano)
5 (16 %) 7 (22 %) 10 (31 %) 22 (23 %)
We looked to see if there was a difference among the three versions in the percentage of visitors who changed8 and who did not change their associations with the word nano. A 2x3 Fisher’s Exact Test showed no statistically significant difference; p > .05. Nor could we detect a difference in the number of visitors who did and did not refine their definition9 among the three versions of the scale ladder; 2x3 Fisher’s Exact Test, p > .05. These results suggest that the diversity of the objects we choose to include in a scale ladder, whether they are directly related to the exhibit or are objects from a broader domain (e.g., biology) or a mix of domains (e.g., biology and technology), does not change visitors’ understanding of the nanoscale.
Even though we intended to only vary the diversity of objects used for the scale ladder, the ladders also differed in the number of familiar objects they included. Arguably, the one most specific to the exhibit, the Nasturtium Specific ladder, included the most number of unfamiliar objects (i.e., objects that were not identified by prior research as size landmarks or anchors (Tretter, Jones, Andre et al., 2006 ; Tretter, Jones, & Minogue, 2006)). These findings, therefore, also suggest that the number of familiar or common objects did not seem to affect visitors’ understanding of the nanoscale, possibly because the exhibit makes the previously unfamiliar more familiar.
8 We collapsed Change to Size and Change with Size Refinement into one category for this analysis. 9 We collapsed No Change and Change to Size to compare with Change with Size Refinement.

Scale Ladders - Communicating Size and Scale
NISE Network Research and Evaluation - 39 - www.nisenet.org
Some rungs are more important than others in helping visitors interpret the scale ladder
Are there then some rungs, or position, on the scale ladder that are more important than others in helping visitors understand the nanoscale? To answer this question, we asked visitors to tell us what they think is the size of a nanocrystal. The size of a nanocrystal is described both in the text and in the scale ladder diagram, and visitors were free to look at any part of the exhibit label to answer.
We sorted visitors’ responses first into two broad categories: 1) answers that could be found and 2) answers that could not found in the scale ladder. For example, almost one-quarter of the visitors described the nanocrystal as being 1/1000 of the width of a human hair, a statement found in the text but not the scale ladder itself. Also, some visitors simply said that a nanocrystal is very small, which can be inferred from the scale ladder but can also be attributed to a number of other sources. In both these cases, the responses would be considered answers not found in the scale ladder. Alternatively, when a visitor described a nanocrystal as being smaller than X and /or bigger than Y, where X or Y are on the scale ladder, it was a strong indication that their answer was derived from the scale ladder.
The results, summarized in Table 22, indicate that when visitors use the scale ladder to read the size of a particular object, a small percentage of visitors refer to the object immediately above or below that object in the scale ladder. Instead more visitors specified the size of the nanocrystal according to the bounds of its size category – smaller than a cell and bigger than an atom, the brackets of the nanoscale. Note that when the bounding object was not shown on the scale ladder, fewer visitors used the bracketing object to describe size.10 This is even when that bracketing object is mentioned elsewhere on the scale ladder. (‘Smaller than a cell and bigger than an atom’ appears as textual description for the nanoscale for all versions of the scale ladder tested.)
10 This is not statistically significant, Fisher’s Exact Test, p > .05. The percentage of visitors who used the cell in their description in the Nasturtium Specific and All Natural ladders was compared to the percentage of visitors who did so in the Mixed ladder, which did not show a cell.

Scale Ladders - Communicating Size and Scale
NISE Network Research and Evaluation - 40 - www.nisenet.org
Table 22. Visitors’ descriptions of the size of a nanocrystal
Visitor’s Description
Nasturtium Specific Ladder
(out of 31)
All Natural
Ladder
(out of 33)
Mixed Ladder
(out of 32)
All versions
(out of 96)
Smaller than the microscale 4 (13%) 2 (6%) 6 (19%) 12 (13%)
Smaller than a cell (the smallest object in the microscale)
14 (45%) 9 (27%) 6 (19%) 29 (30%)
Smaller than the object immediately above the nanocrystal
2 (6%) (Water Droplet)
4 (12%) (Chromosome)
0 (0%) (Synthetic Nano-material)
6 (6%)
Bigger than the object immediately below the nanocrystal
3 (10%) (DNA)
3 (9%) (DNA)
2 (6%) (DNA)
8 (8%)
Bigger than an atom (the biggest object in the atomic scale)
16 (52%) 14 (42%) 11 (34%) 41 (43%)
This observation suggests that there are certain rungs of the ladder that are more important than others in helping visitors interpret size and scale on a scale ladder. In particular, those objects that bracket a scale category are referred to more often than those that are immediately adjacent to an object.
Design and Use Implications
Most visitors found the scale ladder helpful in understanding an exhibit about nanostructures. This implies that scale ladders can be incorporated into an exhibit label to explicate the size and scale of the structures and phenomena illustrated in an exhibit about nanoscience.
However, visitors expect the label and the scale ladder to be closely tied to the exhibit itself. The scale ladder is useful for communicating size and scale, and unless this information is crucial to understanding what the exhibit shows, visitors may struggle with integrating the ladder with their exhibit experience. The scale ladder, when used with an exhibit, should help explain that exhibit. When it introduces a supplemental message not immediately related to the exhibit, that scale ladder may be seen as extraneous and, worse, confusing.
Visitors were more likely to see the scale ladder’s relevance when it included items specifically described in the exhibit. Although we thought that choosing a more diverse set of objects (e.g. familiar objects from nature or from technology and biology) for our scale ladder would help visitors see the nanoscale as a size category that transcends a specific subject or content area, we did not find any evidence to support this conjecture.

Scale Ladders - Communicating Size and Scale
NISE Network Research and Evaluation - 41 - www.nisenet.org
One possible explanation is that visitors are looking to the scale ladder to help them understand the exhibit phenomenon, not to better understand specifically the size of the nanoscale. They interpret the ladder enough to know where the phenomenon is occurring, not to explore size and scale in general. Therefore, selecting objects directly mentioned and related to the exhibit seems more important than including a more diverse set of objects.
Furthermore, it seems that choosing familiar objects, such as the landmarks and anchors identified in research studies, is not as critical when the scale ladder is incorporated into an exhibit label. This may be because when a scale ladder is used with an exhibit, the exhibit itself can provide the size anchors. The challenge then becomes selecting images of the exhibit subject, especially for the macroscale portion of the ladder, that are readily recognizable to visitors.
The data also suggest that certain rungs of the ladder are more important than others in helping visitors interpret size and scale on a scale ladder. In particular, those objects that bracket a scale category are referred to more often than those that are immediately adjacent to an object. When designing a scale ladder, special attention should then be paid to selecting those objects and clear depictions of those objects for these rungs.
Conclusions
A scale ladder is a useful way of conveying the relative size of nanoscale objects. Although scale ladders typically include a ruler, or a number line, we found that the ruler was not essential in communicating the size and scale of nano, and in fact, can confuse rather than clarify. We also found that when designing a scale ladder to be used in a label for a nanoscience exhibit, the ladder should include depictions of the structures and phenomena in the exhibit itself rather than show a more diverse or a more familiar set of objects on the rungs of the ladder. These and other design guidelines described in this report will be available on the NISE Net website, along with the example scale ladder that emerged from this iterative prototyping process.
The three studies documented here suggest that scale ladders can help visitors understand the size and scale of the nanoscale. However, visualizing objects that are invisible, largely unfamiliar, and so small as to border on the incomprehensible is a huge challenge. And, scale ladders are only one way of characterizing their size. Additional ways to represent the size of the very small need to be developed and used to complement the scale ladder in order to help visitors visualize the nanoscale.

Scale Ladders - Communicating Size and Scale
NISE Network Research and Evaluation - 42 - www.nisenet.org
References
Gentner, D., & Markman, A. B. (1997). Structure mapping in analogy and similarity. American Psychologist, 52, 45-56.
Tretter, T. R., Jones, M. G., Andre, T., Negishi, A., & Minogue, J. (2006). Conceptual Boundaries and Distances: Students' and Experts' Concepts of the Scale of Scientific Phenomena. Journal of Research in Science Teaching, 43(3), 282-319.
Tretter, T. R., Jones, M. G., & Minogue, J. (2006). Accuracy of Scale Conceptions in Science: Mental Maneuverings across Many Orders of Spatial Magnitude. Journal of Research in Science Teaching, 43(10), 1061-1085.

Scale Ladders - Communicating Size and Scale
NISE Network Research and Evaluation - 43 - www.nisenet.org
Appendix A: Interview Questions for Study 1
(Pre-Ladder Interview)
So today I will be asking you to take a look at a poster we have created, to get your feedback. But before I show it to you, could I ask you a few questions?
1. Have you heard the word “nano” before? (If yes) Can you tell me where you have heard it? Anywhere else? (ask until they say “no”)
a. (If they have answered no to Q1) I know you haven’t heard the word nano before, but hearing it now for the first time, what does it make you think of?
b. (if they have answered yes to Q1) What do you think of when you hear the word “nano”? (encourage the visitor to take a guess if they don’t have an answer)
2. Take a moment and tell me the smallest thing you can think of. How might you describe how small it is? (push if they don't say something very small)
3. Can you now draw something to show how small this thing is?
(Interview with the scale ladder poster)
So now I am going to show you this poster that we are working on. Looking at this,
4. Can you say a little bit about what you think this poster is trying to show or explain? Anything else? [to exhaustion]
a. Is there anything here that is surprising to you? (Ask, "anything else?" and mark-up a poster with the visitor’s response)
b. Is there anything that you find interesting? How so?
c. Is there anything on the poster that seems unfamiliar. Perhaps something that you’ve never seen before or even something that you’re not sure what it is?

Scale Ladders - Communicating Size and Scale
NISE Network Research and Evaluation - 44 - www.nisenet.org
d. Is there anything you find confusing or doesn’t seem to make sense about the poster? Can you say a little bit about what you find confusing?
(Post-Ladder Interview)
5. Now, looking back on this [drawing], is there anything you would like to change? It’s okay to say no.
6. Now without really looking back at the poster - I know this might sound like I am asking you the same question, but can you tell me what you think of when you hear the word nano now? Don’t feel that you have to give a different or the same answer as you did before.
(Placement Task)
7. So there is something called a buckyball. If the only thing you know is that a buckyball is nano size, where do you think you would put the buckyball on this poster? Can you tell me a little bit about why you chose to put it there?
Does it matter if it’s here and not here [somewhere else in nano zone].
Does it matter if it’s here and not here [move somewhere in the space]
Let's say this buckyball is 20 nanometers size. Where would you put it?
8. Have you heard about buckyballs before I mentioned them? (If yes) Can you say a little bit about what you have heard?
9. Is there additional feedback that you would like to give us about this poster?

Scale Ladders - Communicating Size and Scale
NISE Network Research and Evaluation - 45 - www.nisenet.org
Appendix B: Interview Questions for Study 2
(Pre-Ladder Interview)
So today I will be asking you to take a look at a poster we have created, to get your feedback. But before I show it to you, could I ask you a few questions?
1. Have you heard the word “nano” before? (If yes) Can you tell me where you have heard it? Anywhere else? (ask until they say “no”)
a. (If they have answered no to Q1) I know you haven’t heard the word nano before, but hearing it now for the first time, what does it make you think of?
b. (if they have answered yes to Q1) What do you think of when you hear the word “nano”? (encourage the visitor to take a guess if they don’t have an answer)
2. Take a moment and tell me the smallest thing you can think of. How might you describe how small it is? (push if they don't say something very small)
3. Can you now draw something to show how small this thing is?
(Interview with the scale ladder poster)
So now I am going to show you this poster that we are working on. Looking at this,
4. Can you say a little bit about what you think this poster is trying to show or explain? Anything else? [to exhaustion]
a. Is there anything here that is surprising to you? (Ask, "anything else?" and mark-up a poster with the visitor’s response)
b. Is there anything that you find interesting? How so?
c. Is there anything on the poster that seems unfamiliar. Perhaps something that you’ve never seen before or even something that you’re not sure what it is?

Scale Ladders - Communicating Size and Scale
NISE Network Research and Evaluation - 46 - www.nisenet.org
d. Is there anything you find confusing or doesn’t seem to make sense about the poster? Can you say a little bit about what you find confusing?
(Post-Ladder Interview)
5. Now, looking back on this [drawing], is there anything you would like to change? It’s okay to say no.
6. Now without really looking back at the poster - I know this might sound like I am asking you the same question, but can you tell me what you think of when you hear the word nano now? Don’t feel that you have to give a different or the same answer as you did before.
(Placement Task)
7. So there is something called a buckyball. If the only thing you know is that a buckyball is nano size, where do you think you would put the buckyball on this poster? Can you tell me a little bit about why you chose to put it there?
Does it matter if it’s here and not here [somewhere else in nano zone].
Does it matter if it’s here and not here [move somewhere in the space]
8. Have you heard about buckyballs before I mentioned them? (If yes) Can you say a little bit about what you have heard?
9. Is there additional feedback that you would like to give us about this poster?

Scale Ladders - Communicating Size and Scale
NISE Network Research and Evaluation - 47 - www.nisenet.org
Appendix C: Interview Questions for Study 3
(Pre-Ladder Interview)
So today I will be asking you to take a look at a new exhibit we have created, to get your feedback. But before I show it to you, could I ask you a few questions?
1. Have you heard the word “nano” before? (If yes) Can you tell me where you have heard it? Anywhere else? (ask until they say “no”)
a. (If they have answered no to Q1) I know you haven’t heard the word nano before, but hearing it now for the first time, what does it make you think of?
b. (if they have answered yes to Q1) What do you think of when you hear the word “nano”? (encourage the visitor to take a guess if they don’t have an answer)
2. Take a moment and tell me the smallest thing you can think of. How might you describe how small it is? (push if they don't say something very small)
3. Can you now draw something to show how small this thing is --- for example, if someone had no idea how small xxx is, what would you draw to show them how small it is.
(Interview in front of the Nasturtium exhibit)
So now I am going to show you the exhibit that we are working on. Will you take some time to look at it, including this [pt to label]? We are particularly interested in improving this information, the text and the pictures, here. You can take as long or as short a time as you like. Just let me know when you’re done looking at it and I’ll ask for your feedback. I’ll be standing right here.
4. Can you say a little bit about what you think this [point to label] is trying to show or explain? Anything else? [to exhaustion]
5. Is there anything you find confusing or doesn’t seem to make sense about this information, the text and/or the pictures? Can you say a little bit about what you found confusing?

Scale Ladders - Communicating Size and Scale
NISE Network Research and Evaluation - 48 - www.nisenet.org
6. Can you describe for me how small nanocrystals are?
7. We’d like your opinion about this diagram. So, we’re talking about just this part here [point and circle with your hands]
a. What do you think this diagram is trying to show? b. Do you feel that this diagram helps you better understand this exhibit? Or, not so
much? How so?
c. Do you feel that this diagram makes this exhibit more or less confusing? How so?
d. In your opinion, what, if anything, do these pictures here have to do with the exhibit?
8. Now without really looking back at the exhibit - I know this might sound like I am asking you the same question, but can you tell me what you think of when you hear the word nano now? Don’t feel that you have to give a different or the same answer as you did before.
9. Is there additional feedback or suggestions that you would like to give us about any part of this exhibit?