scale - portland state universityweb.pdx.edu/~jduh/courses/archive/geog492s09/projects/cooney... ·...
TRANSCRIPT

Multivariate Regression Analysis to Determine the Influence of Factors on Land Value at the Neighborhood
Scale
Alan Dittmar Aidan Padilla
Mark Cooney
• Rule #1 in Real Estate: Location, Location, Location!
• What does this mean? Is location still a factor when looking in the same region, city, down to the neighborhood level?
INTRODUCTION
OBJECTIVE
• What variables influence the differences in price of LAND VALUE of tax lots in the same general locale (neighborhood)?
• Should lots of the same size be the same price? If not, why?
• Using land values from tax lot data, we are interested in the value differences from individual locations (lots) and not buildings (houses).
• Using regression analysis, could we construct neighborhood models that are representative of the influence of different variables on land value?

Study Area
Utilizing Tax Lot Data
Sabin Tax Lots Attribute Table
Property Code Area Appraised Value (Land Value, Building Value, Total Value) Owner Address Tax Lot ID Sale Price Etc.
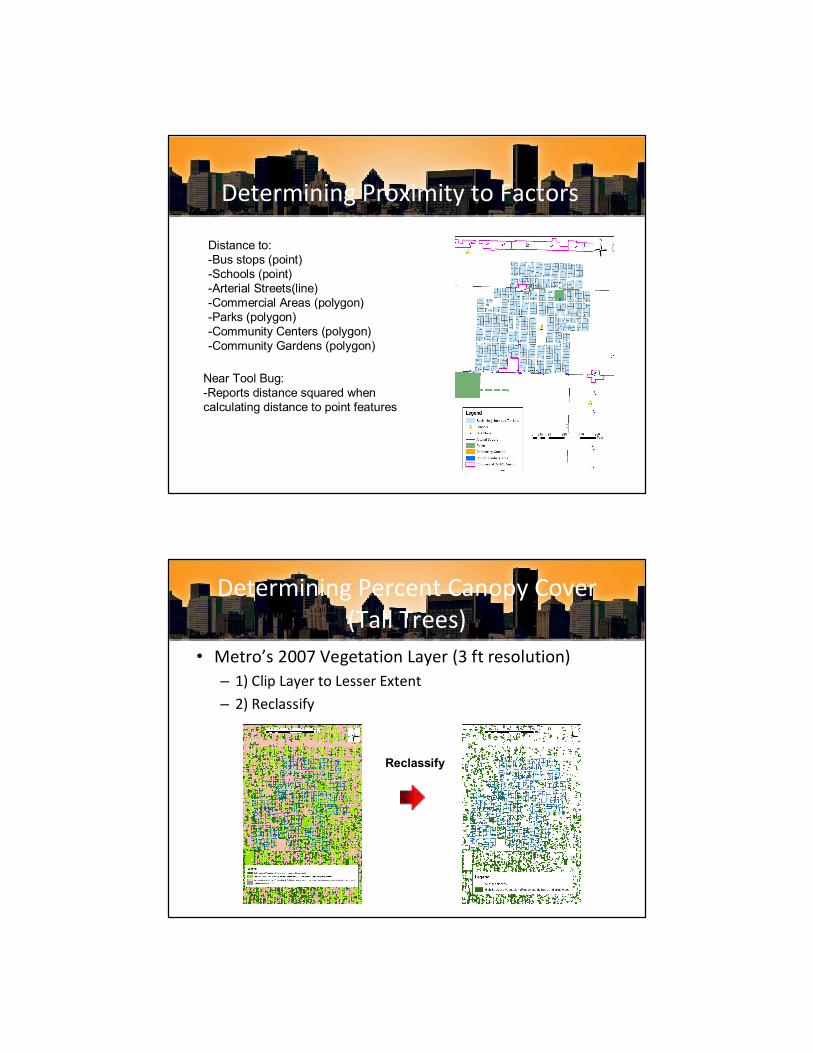
Determining Proximity to Factors
Distance to: Bus stops (point) Schools (point) Arterial Streets(line) Commercial Areas (polygon) Parks (polygon) Community Centers (polygon) Community Gardens (polygon)
Near Tool Bug: Reports distance squared when calculating distance to point features
Determining Percent Canopy Cover (Tall Trees)
• Metro’s 2007 Vegetation Layer (3 ft resolution) – 1) Clip Layer to Lesser Extent – 2) Reclassify
Reclassify
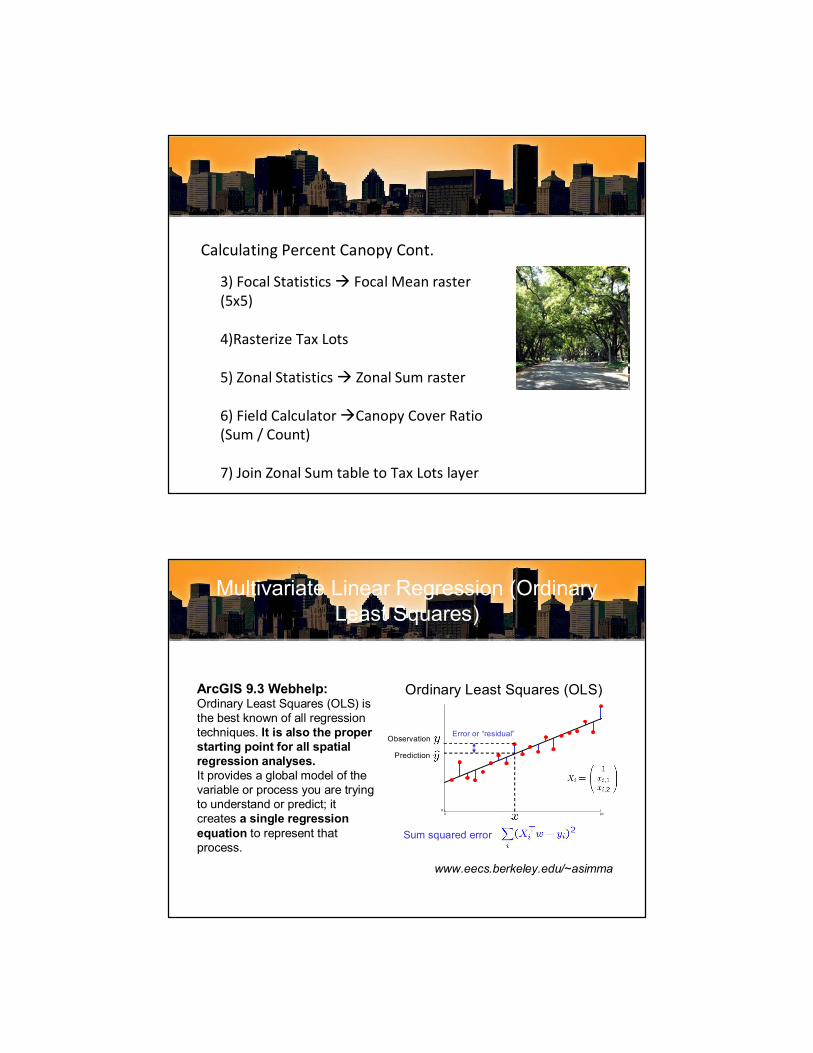
3) Focal Statisticsà Focal Mean raster (5x5)
4)Rasterize Tax Lots
5) Zonal Statisticsà Zonal Sum raster
6) Field CalculatoràCanopy Cover Ratio (Sum / Count)
7) Join Zonal Sum table to Tax Lots layer
Calculating Percent Canopy Cont.
Multivariate Linear Regression (Ordinary Least Squares)
ArcGIS 9.3 Webhelp: Ordinary Least Squares (OLS) is the best known of all regression techniques. It is also the proper starting point for all spatial regression analyses. It provides a global model of the variable or process you are trying to understand or predict; it creates a single regression equation to represent that process.
Ordinary Least Squares (OLS)
0 20 0
Error or “residual”
Prediction
Observation
Sum squared error
www.eecs.berkeley.edu/~asimma
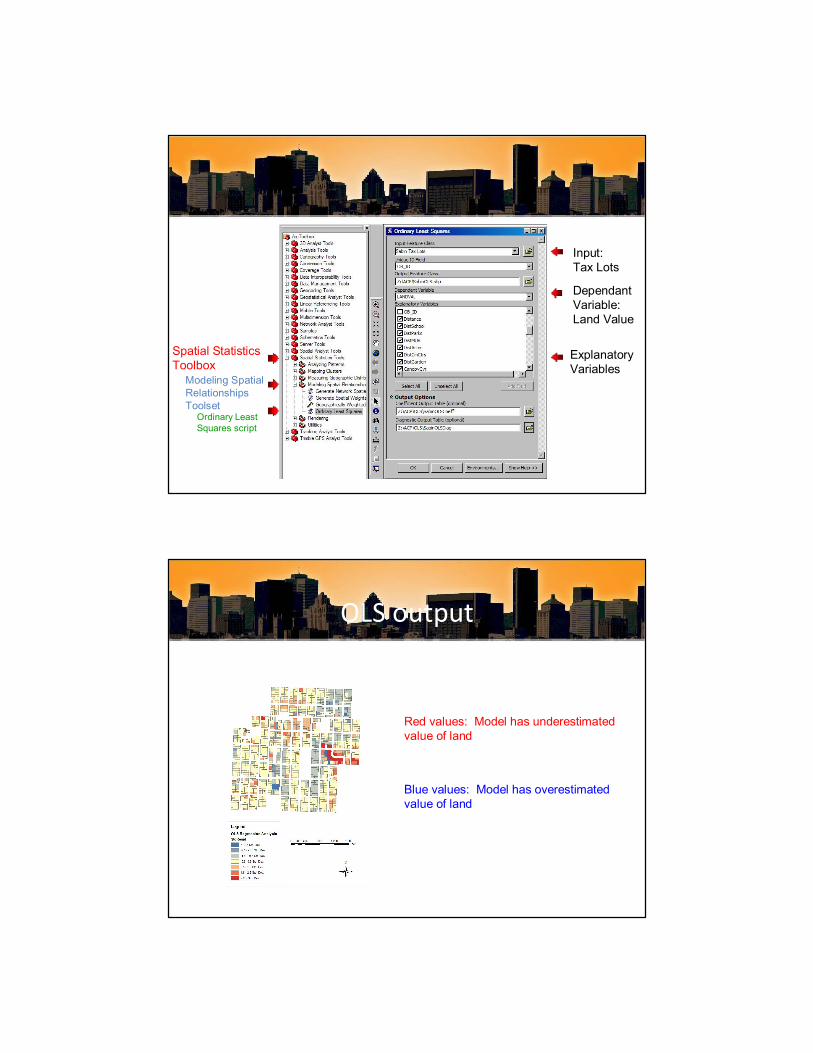
Spatial Statistics Toolbox
Modeling Spatial Relationships Toolset
Ordinary Least Squares script
Input: Tax Lots
Dependant Variable: Land Value
Explanatory Variables
OLS output
Red values: Model has underestimated value of land
Blue values: Model has overestimated value of land
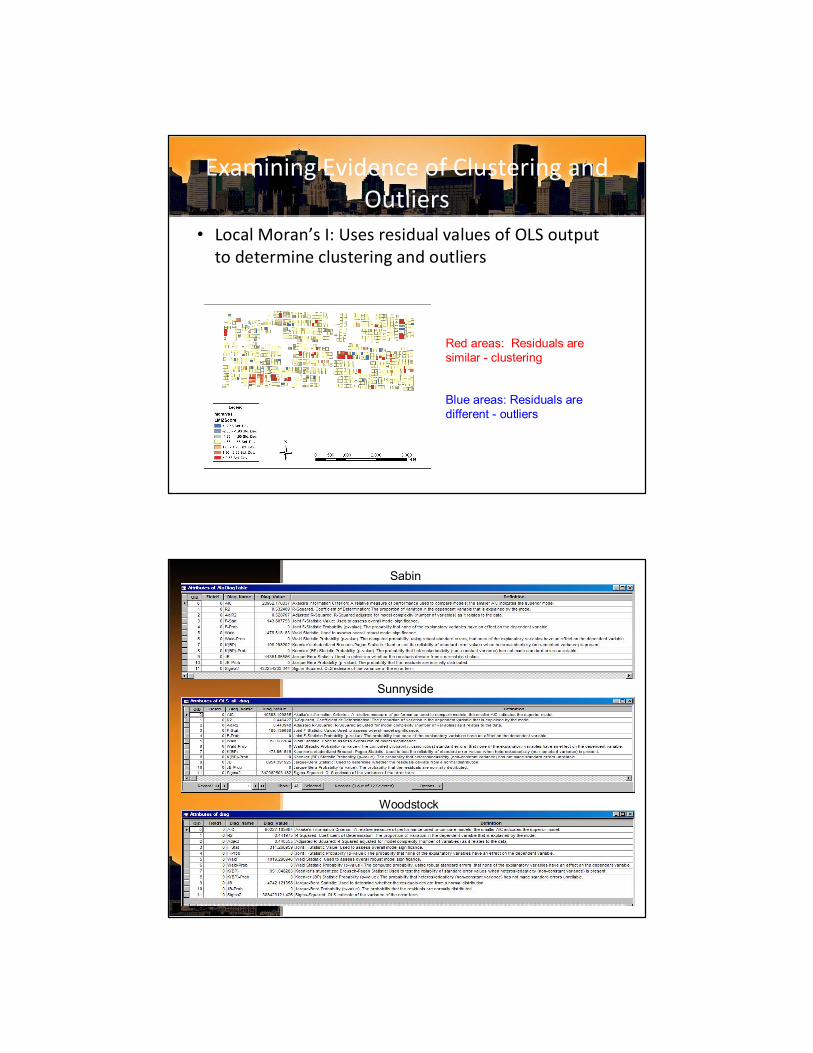
Examining Evidence of Clustering and Outliers
• Local Moran’s I: Uses residual values of OLS output to determine clustering and outliers
Red areas: Residuals are similar clustering
Blue areas: Residuals are different outliers
Sabin
Sunnyside
Woodstock
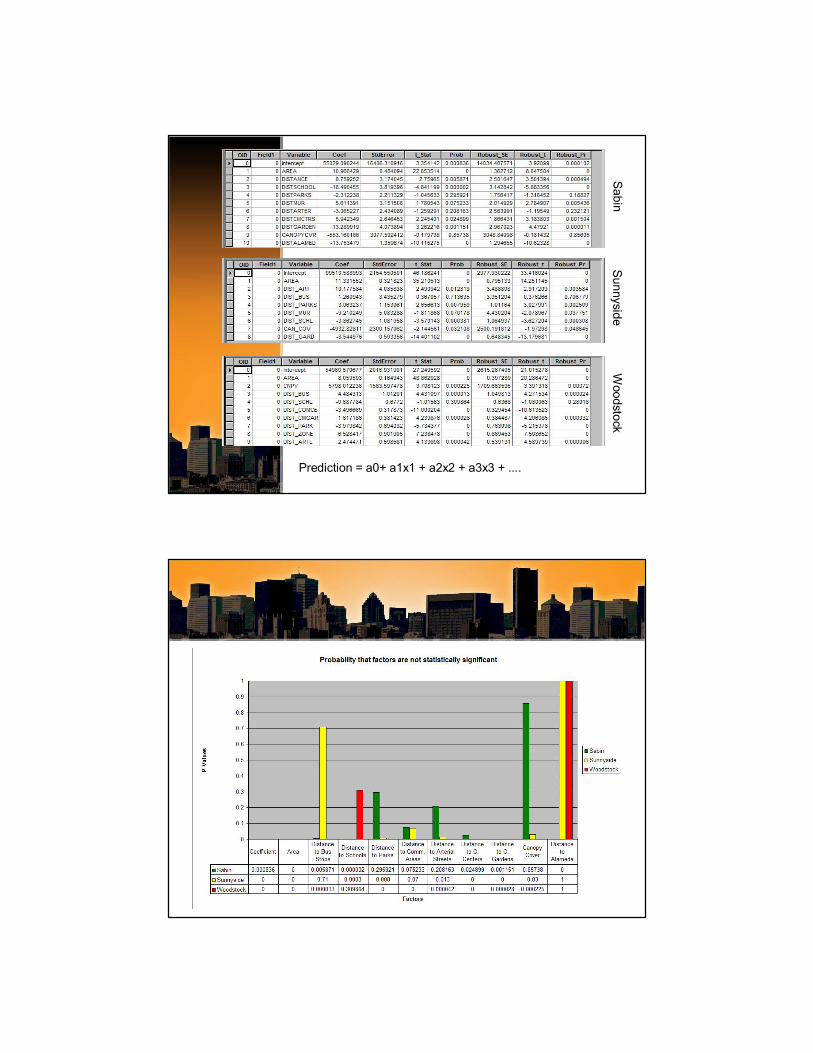
Sabin Sunnyside
Woodstock
Prediction = a0+ a1x1 + a2x2 + a3x3 + ....
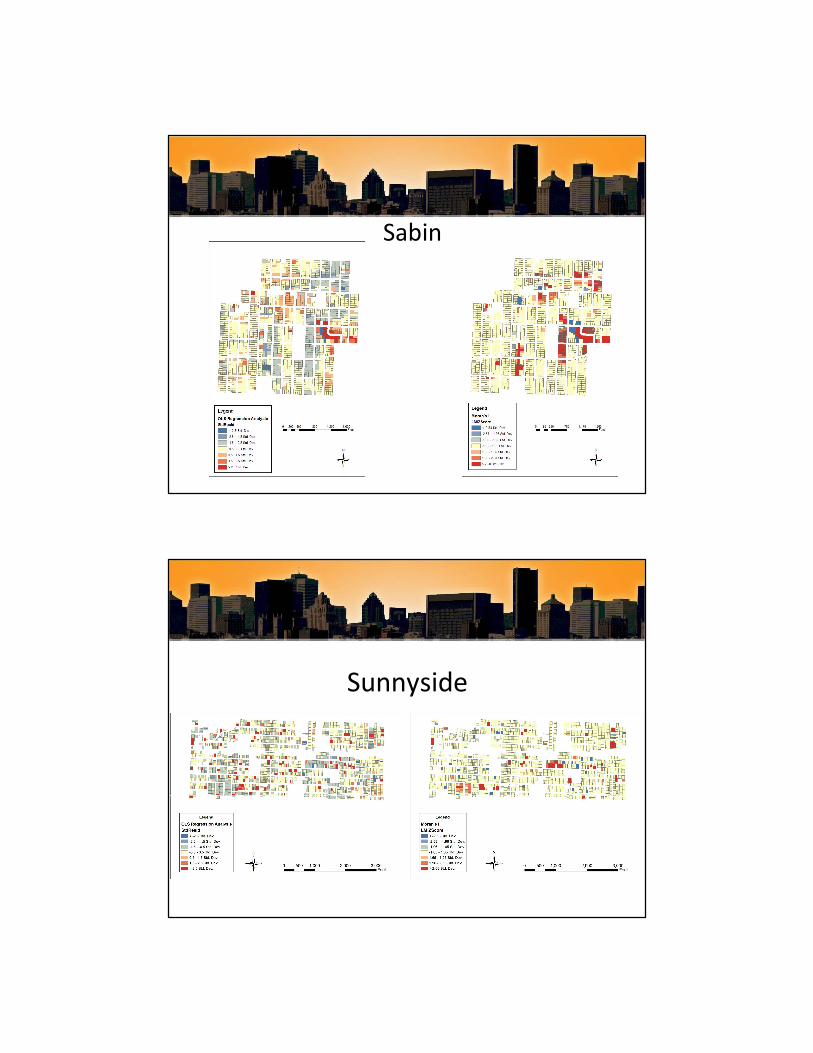
Sabin
Sunnyside

Woodstock
Conclusions
• While our models were incomplete, we have established a foundation upon which we can expand and improve upon.
• Additional variables to include in a future model could be: – Crime, lot topography, lot frontage, schools, view, “hot” neighborhoods, etc.
– Experiment with a nonlinear regression model
Questions?

References
• ArcGIS 9.3 Webhelp
• RLIS Metadata Viewer
• Dr. Geoffrey Duh • www.eecs.berkeley.edu/~asimma