scale without mass: business process replication … documents...business process replication and...
TRANSCRIPT

Brynjolfsson et al.: Scale without Mass Submitted to Management Science
1
Scale without Mass: Business Process Replication and Industry Dynamics
Erik Brynjolfsson* Andrew McAfee** Michael Sorell** Feng Zhu**
*MIT Sloan School, [email protected] ** Harvard Business School, {amcafee, msorell, feng}@hbs.edu
Since the mid-1990s, productivity growth has accelerated in the U.S. economy. In this paper, we identify
several other changes in the economy that have occurred during the same time and argue that they are con-
sistent with an increased use of information technology (IT) in general and enterprise information technol-
ogy in particular. In a series of case studies, we find that IT can enable firms to more rapidly replicate im-
proved business processes throughout an organization, thereby not only increasing productivity but also
market share and market value. We develop a simple model that shows how this process will increase both
turbulence and concentration in affected industries. We then document a substantial increase in firm-level
turbulence starting in the 1990s, as measured by the average intra-industry rank change in sales, enterprise
value, and other metrics. Furthermore, we find that IT-intensive industries account for most of this increase
in turbulence, especially after 1996. Before 1996, IT-intensive industries were becoming less concentrated
than non IT-intensive industries; this situation reversed in the late 1990s. The combination of increased
turbulence and concentration, especially among IT-intensive industries, is consistent with an increasingly
Schumpeterian style of competition. We conclude that the improved ability of firms to replicate business
innovations has affected not only productivity, but also the nature of business competition itself.
Key words: Business Process Replication; Creative Destruction; Information Technology; Industry Concen-
tration
____________________________________________________________________________________
1 Introduction: IT Heterogeneity and its Implications
The real, quality-adjusted quantity of computing power used by American companies increased by several
orders of magnitude between 1986 and 2006. Because one of the key roles of both firms and markets is
information processing (see, for example, Hayek 1945 and Galbraith 1973), it would be surprising if this
radical increase in information technology (IT) stocks did not have large effects on business performance
and industry dynamics.
A stream of economics research has focused on articulating the consequences of the rapid pene-
tration of IT into the U.S. economy. A key finding has been the linkage between IT investment and the

Brynjolfsson et al.: Scale without Mass Submitted to Management Science
2
surge in U.S. economic productivity, especially since 1995 (Brynjolfsson and Hitt 2000, Oliner and Si-
chel 2000, Stiroh 2002, Brynjolfsson and Hitt 2003, Dedrick et al. 2003). The research also suggests that
nothing about IT appears to be evenly distributed. IT investment levels themselves vary greatly across
firms and industries, as do the organizational forms and practices accompanying these investments
(Bresnahan et al. 2002) and the outcomes linked to them, including productivity and revenue gains
(Brynjolfsson and Hitt 1996, Dedrick et al. 2003, Brunner et al. 2006), stock market valuations
(Brynjolfsson and Yang 1997, Brynjolffson et al. 2002), and share-price volatility (Chun et al. 2005).
Research has also repeatedly demonstrated that the correlation between IT investment and positive out-
comes is far from perfect; it is possible to spend heavily on IT and realize few or no benefits (see, for ex-
ample, Brynjolfsson and Hitt 2000).
This paper extends research on the consequences of IT heterogeneity by considering outcomes
related to competition, namely concentration and turbulence. We find that a positive relationship has ex-
isted since the mid-1990s between an industry’s IT intensity and its levels of turbulence and concentration
growth. We hypothesize that this is the case because IT has become a means of embedding business in-
novations, then replicating them across an increasingly large intra-firm “footprint.” Today, managers can
scale up their process innovations rapidly via technology without the degree of inertia historically associ-
ated with larger firms. In other words, they can achieve scale without mass.
However, these innovations do not diffuse equally across all firms in an industry. Firms that suc-
cessfully use IT to embed and diffuse innovations grow relatively rapidly at the expense of other firms,
leading to greater concentration at the industry level. Because firms operate in dynamic environments,
however, successful adoption of a set of IT-enabled business innovations at one point in time does not
guarantee sustained dominance. Competitors and new entrants can also innovate and replicate with IT
over time, leading to high levels of turbulence within an industry. These phenomena are more salient in
IT-intensive industries than in non-IT-intensive ones.
This paper is organized as follows. Section 2, which makes use of several short case studies, de-
scribes how contemporary IT is used to embed and deploy business innovations, and why this work could

Brynjolfsson et al.: Scale without Mass Submitted to Management Science
3
be expected to lead to competitive heterogeneity across firms in an industry. Section 3 presents a more
formal model of competition which shows how, over time, both concentration and turbulence will in-
crease as IT-enabled replication becomes more prevalent. Section 4 describes our data sources and vari-
ables, and Section 5 gives results of empirical analyses that make use of industry-level IT endowment and
firm-level performance data. These analyses indicate that, since the mid-1990s, IT-intensive industries
have experienced higher levels of turbulence and concentration growth than have non-IT-intensive ones
and that these differences were not as strong when IT was less pervasive. Section 6 presents a brief sum-
mary and conclusion.
2 IT and Business Process Replication
2.1 Volatility and Technology
In recent years, the U.S. economy has been characterized by increased levels of firm-specific volatility
even as the economy as a whole became less volatile (Comin and Mulani 2004, Irvine and Schuh 2005).
Campbell et al. (2001) find that while market- and industry-level stock variance remained largely stable
between 1962 and 1997, firm-specific variance more than doubled over the same period. Campbell et al.
also document a decrease over time in correlations among individual stocks. Chun et al. (2005) document
similar patterns in firm-specific and systematic volatility between 1971 and 2000, and also find a positive
relationship between firm-specific volatility and the IT intensity (as measured by IT’s percentage of total
capital stock) of the industry in which a firm resides.
IT has been identified as a source of industrial disruption and shifts in market value since the
early 1970s (Hobijn and Jovanovic 2001). Stiroh (2002), however, finds clear evidence of a positive as-
sociation between IT intensity and productivity growth in many U.S. industries only since the mid-1990s.
Oliner and Sichel (2000) note that, until recently, IT represented only a relatively small portion of the
capital stock of U.S. firms, and thus could not be expected to have a significant impact on high-level out-
comes.

Brynjolfsson et al.: Scale without Mass Submitted to Management Science
4
2.2 IT and Business Process Replication
Information technology enables the replication of certain types of innovations at almost no cost. Bits, for
example, can be copied much more easily than atoms. This ease of replication is especially evident in the
computer software and hardware industries themselves. When a software engineer improves a sorting al-
gorithm in a database management program, a digital copy of that improved process can be instantly cop-
ied and included in thousands or even millions of copies of the next release of that program. The Internet
has broadened the set of activities subject to this phenomenon to include an increasing share of commerce
(Blinder 2000). Today, for example, when a marketing expert at Amazon.com develops a better se-
quence of images, words, and data requests for reducing abandoned “shopping carts” on the site’s check-
out page, a digital copy of that algorithm can instantly be made available in millions of virtual storefronts
on customer desktop PCs worldwide.
It is easy to see the power of replication in these purely digital domains. But economic impacts
also derive from business process changes that involve technology, people, and physical products. An
early example was Mrs. Fields Cookies (Cash and Ostrofsky 1986). Randy Fields sought to replicate not
only his wife’s cookie recipes throughout thousands of small stores, but also the daily, minute-by-minute
routine that made her initial Palo Alto store so successful, including when to mix each cookie batch, when
to dispose of unsold cookies, when to offer more free samples, what questions to ask of job applicants,
and so on. As better business processes were developed, they were embedded in store management soft-
ware that guided each employee worldwide based on a set of algorithms combined with local data and
parameters. Other franchisors and chain stores have adopted similar technologies to address processes
ranging from inventory management to pricing.
2.3 Enterprise Information Technology
In the 1990s, the use of technology to embed and replicate business processes became more sophisticated
and pervasive, addressing industries far more complex than cookie baking. In 1992, the German IT ven-
dor SAP released R/3, an enterprise system with client-server architecture. R/3 quickly proved popular
with large corporations, and other software vendors soon released enterprise information technology

Brynjolfsson et al.: Scale without Mass Submitted to Management Science
5
(EIT) aimed at different types of firms (e.g., large vs. medium-sized, discrete vs. continuous manufactur-
ing) and different business processes (e.g. customer-facing vs. supplier-facing, administrative vs. opera-
tional). Previously, firms that wanted integrated information systems had to develop them internally.
The availability of commercial EIT meant that firms now could purchase systems that interlinked their
functions.
The geographic “reach” of EIT was greatly increased by the Internet, which freed companies
from having to construct private networks when extending their systems to remote locations. The “Inter-
net era” that began in the mid-1990s can also be thought of as the era of enterprise computing. By one
estimate, up to three-quarters of U.S. corporate IT spending is now devoted to EIT (McAfee 2003).
With EIT, insights about better ways to work need not remain localized or diffuse slowly; instead, they
can be replicated widely and with complete technical fidelity. Just as a digital copy of a photograph or
song can be endlessly copied and distributed with no degradation of quality, so too can copies of EIT-
embedded business processes. Enterprise technologies thereby give firms the capability to “copy exactly”
the IT-based elements of their business processes. Exact copying of interdependent processes has been
shown to be optimal when initial knowledge is low, learning is difficult, and innovation lifecycles are
short (Terwiesch and Wu 2004). EIT allows firms to propagate a wide range of operational and adminis-
trative processes across all appropriate units. It is possible, of course, for people within the units to work
around, game, or even sabotage these processes, but these behaviors are often at least somewhat observ-
able since transactions are recorded in databases.
Case Study: In 2002, the retail pharmacy firm CVS became concerned about high customer
turnover and formed a team to determine root causes and implement solutions. The team found that an
initial step in the process of filling prescriptions was a computer-based drug safety check, performed ap-
proximately one hour before the desired pick-up time. Immediately after the safety check, the firm’s en-
terprise system for pharmacy operations performed a check of the customer’s insurance status. If the pre-
scription passed both of these steps, fulfillment was rarely problematic and could be completed in less

Brynjolfsson et al.: Scale without Mass Submitted to Management Science
6
than five minutes. However, 17% of prescriptions encountered problems during the insurance check, the
majority of which could not be resolved without involving the customer.
The team decided to switch the order of the two computerized checks and to perform the insur-
ance check at the time of prescription drop-off while the customer was still present. Both of these
changes were embedded in the firm’s EIT. Most insurance problems had simple sources, such as an in-
correct date of birth or a change of employer, which were resolved immediately. The new process led to
significant increases in customer retention and satisfaction. Once developed, the changes did not simply
improve performance at one CVS location. On the contrary, using the IT platform, the process changes
were replicated across CVS’s more than 4000 retail pharmacies within a year (McAfee 2005).
Other documented examples of business process replication via EIT include:
• European distributors of midrange computers linking their internal information systems to IBM’s to
standardize and automate order placement (McAfee and Otten 2005).
• The Port Authority of Dubai’s success in convincing both large and small shipping agents to submit
and clear cargo documents electronically rather than with paper (McAfee et al. 2002).
• The Spanish clothing retailer Zara’s ability to let local managers at over 750 stores worldwide place
individualized orders using uniform technologies, templates, and deadlines (McAfee et al. 2004).
In each of these cases, the advance took the form of a new business process embedded and deployed by
the use of enterprise IT.
IT can also assist with the propagation of other types of innovation; technologies such as email, instant
messaging, groupware, information portals, blogs, and wikis let employees share information and ideas
widely and, in many cases, generate them collaboratively (McAfee 2006). Like EIT, these technologies
are also tools for replicating valuable business innovations, albeit ones that are less formal or structured
than entire processes.
It is important to note that business process replication is perfectly consistent with decentralized
decision rights, and with local innovation. In many cases, the myriad small innovations and improve-
ments generated by line employees are collectively more important that any centrally conceived business
Brynjolfsson et al.: Scale without Mass Submitted to Management Science
7
process changes. Zara’s technology, for example, is explicitly designed to facilitate the rapid response to
local tastes as perceived by store managers around the world. Similarly, the many information technolo-
gies that explicitly or implicitly facilitate collaboration and the propagation of ideas will amplify and ac-
celerate productivity improvements which might have remained localized in earlier decades.
2.4 Difficulty of Intra-firm Propagation
Of course, replicating business innovations throughout organizations is nothing new. The rise of multi-
establishment firms in general and the M-form Corporation in particular reflect efforts to replicate key
business processes throughout an organization (Chandler 1990). However, replication has historically
been costly, slow, and imperfect. While training programs, oral and written instructions, and other tools
and techniques can help, human communication is inevitably imperfect, and much information is garbled
or remains tacit (Hayek 1945, Leonard-Barton 1989, Ancori et al. 2000).
Even with EIT, process replication can be difficult. Commercial EIT and the Internet have low-
ered many technical barriers, but other impediments exist. Business process design and deployment is
organizationally challenging, as is the imposition of greater monitoring. Numerous case studies docu-
ment the failure of large-scale IT adoption efforts, some so harmful that they led to firm failure (e.g., Rose
and MacDonald 1998). Surveys of EIT adoption efforts report failure rates of 30-75%, depending on the
technology studied and the definition of failure used (McAfee 2003). Across these investigations, a con-
sensus emerges that the observed failures have organizational root causes, not technical or budgetary
ones. As one review of the literature concluded, “…extant empirical research supports the assertion that
economic and technical considerations are unlikely to feature prominently when IT fails to deliver”
(McDonagh 2001).
2.5 Difficulty of Inter-firm Propagation
As difficult as intra-firm propagation of novel business processes can be, propagating them across firms is
typically far more challenging. The process configuration that works well in one firm might not transfer
well to one with a different culture, set of pre-existing routines, mix of incentives, asset base, and ap-
proach to human resources. Empirical research shows that many beneficial managerial practices are not

Brynjolfsson et al.: Scale without Mass Submitted to Management Science
8
universally diffused across firms (Bloom and Van Reenen 2005) and highlights the importance of com-
plementarities in explaining the difficulty of diffusion (Ichniowski et al. 1997).
This work suggests that the boundary of the firm is a significant barrier to the diffusion of IT-
enabled work changes. This conclusion is supported by research on the heterogeneity of workplace reor-
ganizations in the presence of IT (Bresnahan et al. 2002) and by research that reveals large differences in
firm-level outcomes such as productivity growth even after controlling for IT investment (Brynjolfsson
and Hitt 2000).
Case Study: It became evident in the late 1990s that the discount retailer Kmart operated less ef-
ficiently than did competitor Wal-Mart. Specifically, Kmart suffered from poor inventory availability in
its stores due to inadequate forecasting and fulfillment processes. Wal-Mart’s operational excellence was
due in part to an integrated IT infrastructure that rapidly transmitted sales and inventory data from all
stores to headquarters.
In October 2000, Kmart, whose previous large-scale IT initiatives had stumbled, announced a
$1.7 billion effort to improve both its physical and IT infrastructures. This process adoption effort, which
reflected a conscious strategy to adopt many of the processes of market-leading Wal-Mart, did not suc-
ceed. In fall 2001, Kmart wrote off two distribution centers and IT assets related to the effort worth $130
million while announcing a redirected $600 million IT strategy. In January 2002, Kmart declared bank-
ruptcy. The firm had had four chief information officers in the previous five years (Konicki 2002).
2.6 New Growth Theory and Creative Destruction
As the case studies throughout this section illustrate, firms are using information technologies to embed
and diffuse new knowledge. Although the “new growth theory” (Romer 1990, Romer 1994) has typically
focused on the national economy, rather than the firm, as the primary unit of analysis, its insistence that
knowledge, technology, and innovation be treated endogenously make it applicable to our work.
At least three of new growth theory’s stylized facts seem applicable when considering the com-
petitive impact of IT on firms in an industry. First, the theory asserts that while knowledge is non-rival, it
is at least somewhat excludable (Romer 1990). That is, trade secrets, path dependence, intellectual prop-

Brynjolfsson et al.: Scale without Mass Submitted to Management Science
9
erty protection, and other mechanisms combine to give the generator of new knowledge the ability to at
least partially exclude others from its benefits. Second, new growth theory maintains that knowledge-
based competition tends to become monopolistic over time (Romer 1992). Increasing returns to knowl-
edge, a cornerstone of new growth theory, implies that leading firms will build up significant advantages
over their rivals such that they become monopolies. This idea is consistent with the insight that informa-
tion itself can create economies of scale because of its relative ease of replication (Wilson 1975).
Monopolies are not eternal, however, because of a third stylized fact labeled “creative destruc-
tion” by Joseph Schumpeter. Competitive equilibria are repeatedly disturbed by innovation and new
knowledge; consequently, new ways of working displace old ones. Outcomes and end states, as a result,
become very difficult to predict (Romer 1994, Arthur 1996). One result that can be anticipated is that, as
competition revolves increasingly around knowledge, Schumpeterian creative destruction becomes in-
creasingly pronounced.
Case Study: In January 1998, brokerage Charles Schwab offered Internet-based stock trades to
all of its customers for $29.95 per trade, ending the previous tiered pricing structure. By December 1998,
Schwab’s market capitalization surpassed that of Merrill Lynch, a firm with nearly three times as many
client assets under management. Many analysts expected Merrill Lynch to also offer discounted online
trading, but Schwab’s CEO remarked, “I don’t think Merrill will ever have two things that have been
critical to our success. First, they will never embrace technology as the core of their business the way we
do. Second, they will never have as low a cost structure as we do, which will make it hard for them to
offer superior value” (McFarlan and Tempest 2001).
Merrill Lynch unveiled its “Integrated Choice” program in June 1999. Integrated Choice offered
a range of trading support and investment advisory options; its most basic option was similar to
Schwab’s, offering online trades for $29.95. In tandem with the launch of Integrated Choice, Merrill
Lynch made significant IT investments and changed the inventive structure of many of its employees
(McFarlan and Weber 2001). Unlike the first generation of Web-based trading platforms, Merrill’s sys-
tem focused not simply on low costs and simple execution of trades, but on a richer flow of information

Brynjolfsson et al.: Scale without Mass Submitted to Management Science
10
and advice that leveraged some of the unique assets, including a research staff, possessed by Merrill
Lynch. The new offerings were well-received by customers, and Merrill began to acquire new client as-
sets more rapidly than Schwab. By October 2005, Merrill Lynch’s market capitalization was almost four
times that of Charles Schwab.
2.7 Hypotheses
We hypothesize that, since the mid-1990s, when the adoption of commercial EIT and business use of the
Internet both began in earnest, an industry’s IT intensity has been positively associated with its level of
turbulence, defined here as the average yearly rank change among firms in measures such as sales and
enterprise value. While turbulence differs from firm-specific volatility, our hypothesis is consistent with
the claims of Chun et al. (2005) related to IT’s impact on volatility.
Chun et al. also argue that because general purpose technologies benefit newer firms more than
incumbents and because newer firms are likely to be smaller than incumbents, IT should benefit smaller
firms more than larger ones. If this is true, IT intensity should be associated with lower aggregate con-
centration and lower levels of measures such as the Herfindahl index. We argue, however, that IT-based
capabilities such as business process replication and standardization, monitoring, and remote collabora-
tion are just as likely to be beneficial to larger firms. These capabilities help overcome the losses of con-
trol, visibility, and personal connection that often accompany a larger scale, where high fidelity replica-
tion of business processes is especially relevant to competitive success. IT intensity should therefore be
positively related to concentration growth at the industry level. This hypothesis is consistent with
White’s speculation that “Improved technologies of managing and monitoring may have helped overcome
the inherent difficulties of managing larger organizations (Williamson 1967) and thus encouraged larger
enterprises” (White 2002).
Our broad hypothesis is that because the capabilities IT delivers are valuable, difficult to acquire,
and often transient, IT in recent years has become the opposite of a competitive leveler, or a “cost of
business that must be paid by all but provides distinction to none” (Carr 2003). Indeed, Brynjolffson and
Smith (2003) find that IT was not a “great equalizer” even in purely online markets. We posit instead

Brynjolfsson et al.: Scale without Mass Submitted to Management Science
11
that, since the mid-1990s, the dual innovations of commercial EIT and business use of the Internet have
heightened both turbulence and concentration in industries where IT is intensively used. The following
section formalizes these hypotheses.
3 Model
We use a simple dynamic model to illustrate the impact of information technology on firm performance
and industry structure. Consider an industry with two competing firms, A and B . Assume the economy
has n cities and each firm has one branch in every city. Let the branches be 1 2, ,..., nA A A for firm A and
1 2, ,..., nB B B for firm B . Assume iA and iB are competing in city i . Further, assume customers in each
city are uniformly distributed on a line with density one. Each period consists of two stages. In the first
stage, the branches of the two firms decide their locations in each city simultaneously. In the second
stage, they select their technologies and announce their prices simultaneously.
We assume quadratic transportation cost 2tx , where t is the transportation cost per unit of length
and x is the distance between a consumer’s location to a branch. The marginal costs of the two branches,
Aic and B
ic , have the same expected value, but their variances are determined by the technologies se-
lected. In each period, A Ai ic c k= + and B B
i ic c k= + , where c is a constant and Aik , B
ik are independ-
ently drawn from the same uniform distribution U(- ( )indf IT , ( )indf IT ), where ( )indf IT is a function of
total IT stock in the industry and is greater than zero. We assume '( ) 0indf IT > to capture the fact that
more IT stock used in the production processes often lead to greater potential to affect costs. We also as-
sume the performance of a branch in the current period to be uncorrelated to its past performance, as
modern innovations tend to make old competence obsolete.1
In equilibrium, the two branches will choose to locate at the two ends of the linear city (see Tirole
1988 or D'Aspremont et al. 1979 for detailed derivations). The equilibrium prices are:
1 The results do not change if we assume weak correlation.

Brynjolfsson et al.: Scale without Mass Submitted to Management Science
12
2 13 3
A A Bi i ip t c c= + + and
1 23 3
B A Bi i ip t c c= + + and market shares are:
12 6
B AA i i
ic cMS
t−
= + and
12 6
A BB i ii
c cMSt−
= + .
Assume that Ac and Bc are the lowest marginal costs among all branches of firm A and firm B
respectively. Without loss of generality, assume A Bc c< . The new growth theory suggests that knowl-
edge is partially excludable (Romer 1990, Romer 1994). A natural implication of this theory in our set-
ting is that IT processes can be replicated within the same firm but not beyond the firm boundary. As a
result, it can be shown (see Appendix A) that the variances of market shares for both firms, AMS and
BMS , are positively correlated to indIT . That is, the volatility of market shares increase as the total IT
stock in the industry increases. In addition, if we assume that the ability to replicate is positively associ-
ated with indIT , we can similarly show that the gap between AMS and BMS increases with indIT ; i.e.,
the industry becomes more concentrated with the increased use of IT.
This gives us two formal propositions:
P1: The variance of market share is an increasing function of IT intensity: ( ) 0
( )ind
dVar MSd IT
>
P2: The concentration of market share is an increasing function of IT intensity: ( ) 0
( )ind
dVar Concd IT
>
4 Data Sources and Variables
To test our hypotheses, we gather data on industry-level concentration, turbulence, and IT intensity from
multiple sources. In our study, we classify industries using the North American Industry Classification
System (NAICS).
4.1 Industry Turbulence and Concentration
We evaluate industry-level turbulence and concentration for two outcomes of interest: revenue (sales) and
enterprise value (EV). For each measure, the turbulence of an industry of year t is calculated as the aver-

Brynjolfsson et al.: Scale without Mass Submitted to Management Science
13
age rank change of all firms in that industry from year t-1 to t. We use rank change instead of actual
change because we do not want to include events that affect all firms in an industry uniformly, such as a
sudden change in input prices. Rank change has been used in many papers to measure volatility (see, for
example, Comin and Phillipon 2005).
We measure the concentration at the industry level with the Herfindahl index (HI), which is cal-
culated by squaring the market share of each firm in the industry and then summing the squares. As EV
can sometimes be negative, we standardize the lowest negative value in each industry to zero to properly
calculate HI.
Hou and Robinson (2004), note that yearly HI data might be subject to high volatility. To correct
for this possibility, we follow their approach and average the data over three years. We report the results
of the average in this paper. (The results are slightly weaker but substantively unchanged when unaver-
aged year-by-year data are used.).
Panel A of Table 1 provides a detailed description of the above variables and our construction of
them.
4.2 IT Intensity
We obtained data on industry-level IT and non-IT capital from the Bureau of Economic Analysis’s (BEA)
“Tangible Wealth Survey.” These data are available for 63 industry sectors at roughly the three-digit
NAICS level from 1987 to 2004. IT capital comprises computer hardware (mainframes, personal com-
puters, storage devices, printers, terminals, tape drives, and integrated systems) and computer software
(prepackaged, custom, and own-account). A more appropriate measure than IT capital stock levels is the
service flow of IT stock (Jorgenson and Stiroh 2000, Stiroh 2002). Following the approach outlined in
Jorgenson and Stiroh, we calculate the service flow for IT and other forms of capital. Throughout the re-
mainder of this paper, we use the phrase “IT capital” as shorthand for “IT capital service flows”; the same
is true for “total capital.”

Brynjolfsson et al.: Scale without Mass Submitted to Management Science
14
Following Stiroh (2002), we use three different measures of IT intensity: IT capital as the per-
centage of total tangible wealth (i.e., capital stock), IT capital per full-time employee (FTE),2 and IT capi-
tal as the percentage of nominal industry output. Like Stiroh, we use IT capital as a percentage of tangi-
ble wealth (ITTW) as our primary measure of IT intensity.
After calculating ITTW for each industry and year in our dataset, we use these figures to calculate
each industry’s z-value for each year from 1987-2004. We then calculate each industry’s mean z-value
over this time period. We use these 1987-2004 mean z-values as a continuous measure of each industry’s
IT intensity. In our analyses below, therefore, each industry has a single IT intensity value.3 To arrive at
a discrete categorization of industries as either IT-intensive or non IT-intensive, we took as the threshold
the median of these 1987-2004 mean z-values.
We summarize the variables for IT intensity and construction method in Panel B of Table 1.
4.3 Combining Data
While the BEA reports capital stock information for the Federal Reserve and credit intermediation indus-
tries separately, it combines these two industries when reporting the FTE data. In addition, no firms in
CompuStat are classified into the Federal Reserve industry. Therefore, we drop the Federal Reserve in-
dustry from our capital stock dataset and use the combined FTE data for the credit intermediation industry
only. CompuStat also does not contain any firms in the industry 51, “Management of Companies.” We
therefore drop this industry as well.4 Our final dataset thus consists of 61 industries. For each industry,
we present data on different IT-intensity measures from 1987-2004 and data on industry concentration
and turbulence from 1971-2004.
2 Data on the number of full-time employees (FTE) from 1998 to 2004 are from Section 6 of the BEA “National Income and Product Accounts Tables.” Earlier data on FTEs from BEA are based on SIC. We generate values for NAICS-based industries by taking the percentage change in the employment from the SIC data. Data on industry output are also from BEA and are detailed at Bureau of Economic Analysis (2004). 3 We also conduct analyses in which each industry’s IT intensity varied from year to year based on its z-value for the year. Results are substantively unchanged from those reported here. 4 In addition, BEA combines the hospital and nursing industries when reporting the industry-level GDP. To address this problem, we allocate their total GDP evenly to each industry.

Brynjolfsson et al.: Scale without Mass Submitted to Management Science
15
5 Empirical Results
This section empirically investigates the effects of rapid IT adoption on the competitive dynamics of US
industries. As Figures 1a and 1b show, the U.S. economy became substantially more IT intensive from
1987-2004. Figure 1a plots corporate IT stock (at historical cost) per FTE by year; the graph shows ac-
celerating IT intensity from 1987-2000, followed by two years of decline corresponding to recession. IT
per FTE resumed its upward trend in 2003. By 2004, at more than $2,600, it was the highest it had ever
been and was more than three times higher than it had been in 1987, even before adjusting for the large
increase in real computing power delivered per dollar of expenditure. Figure 1b plots IT’s percentage of
total investment in tangible wealth each year, together with the equivalent percentages for equipment and
plant (the three values for each year sum to 100). IT’s share of the total increased more than 10% during
this period to almost 23% of total tangible wealth.
We present two sets of regression results tying IT to industry-level turbulence and concentration
growth. We first examine whether IT-intensive industries in general are more turbulent and are concen-
trating faster than non IT-intensive industries during 1987-2004. We find that IT-intensive industries are
consistently more turbulent than non IT-intensive ones during this period, but not concentrating at signifi-
cantly higher rates. We then take a difference-in-differences approach that relates industries’ IT intensities
to their pre- vs. post-1996 changes in turbulence and concentration growth. We show that IT intensity is a
significant factor in post-1996 changes to industry dynamics captured by these measures. Finally, we dis-
cuss robustness checks to evaluate whether our key findings are artifacts of our particular measures, op-
erationalizations, and model specifications.
5.1 Turbulence and Concentration Growth in IT-intensive and non IT-intensive Industries
To examine the difference in the turbulence levels and concentration growth rates between IT-intensive
and non IT-intensive industries from 1987-2004, we consider the following model:
(1) 0 1 2IT # of firmsy β β β ε= + + +

Brynjolfsson et al.: Scale without Mass Submitted to Management Science
16
where y is the dependent variable. When the outcome of interest is the turbulence, y is measured as the
average rank change of sales or enterprise value. When the outcome of interest is the concentration
growth, y is measured as the percentage change of the Herfindahl Index for sales or enterprise value. For
discrete operationalization of IT intensity, IT is 1 if an industry is IT intensive, 0 otherwise. For continu-
ous operationalization, IT is measured as the logarithm of mean value of IT as a percentage of total wealth
over the sample period. We also include the number of firms for each industry in each period as a control
variable. In the case of turbulence, as the number of firms in an industry increases, firms in the industry
will have greater potential to change their ranks. Similarly, in the case of concentration, the number of
firms indicates the level of competition and may affect the change of the Herfindahl index. Removing this
control variable gives stronger results in all models.
As the continuous measure captures the actual magnitude of difference in IT intensities, we focus
our discussion on the continuous measure of IT and use the discrete operationalization of IT as a robust-
ness check.
Table 2 reports the regression results where the average rank change of sales and enterprise value
are used as the dependent variable respectively. We also consider some specifications in which we drop
low-density industries, or outliers for dependent and independent variables. An industry is considered to
be low-density if CompuStat has data for 5 or fewer firms for this industry in at least one year from 1987
to 2004. We consider an industry as an outlier if its value for the dependent or independent variable in any
year is more than four standard deviations away from the population mean. Panel C of Table 1 lists low-
density and outlier industries. In all models shown in Table 2, the coefficients for IT intensity and the
number of firms are significant at 1% level. The results indicate that IT intensive industries are more tur-
bulent than non IT-intensive ones during 1987-2004.
We then run a similar set of regressions using the percentage change in concentration (as meas-
ured by the Herfindahl index) as the dependent variable and report the results in Table 3. None of the
specifications shows significantly growth in concentration among IT-intensive industries over the period
1987-2004. In fact, in all cases, the coefficient of the IT variable is negative, albeit often statistically in-

Brynjolfsson et al.: Scale without Mass Submitted to Management Science
17
significant. This result indicates that industry-level IT intensity was not positively associated with con-
centration growth during the years 1987-2004. We now proceed to divide these years into two periods,
and compare the turbulence and concentration growth in these two periods.
5.2 Turbulence and Concentration Growth Pre- and Post-1996 for IT-intensive and Non IT-
intensive Industries
We first consider the appropriate year to use to divide our sample period (1987-2004) into two periods.
Chow test results suggest that 1995, 1996, or 1997 could be used as the break year. In particular, we find
that the year 1996 gives the most notable and economically significant accelerations in both turbulence
and concentration growth rates. Thus, in the following analyses, we use 1996 as the break year. (Results
are very similar if we use 1995 or 1997 as the break year.)
Visual inspection of data indicates differences in turbulence and concentration growth before and
after 1996. Figure 2a plots each industry’s average yearly sales turbulence levels over the period 1987-
1996 against the same average for the period 1997-2004. In these graphs, data points above the 45-degree
line represent industries in which turbulence was higher in the more recent period. This figure shows that
the increase in turbulence is widespread rather than limited to one or two industries. Figure 2b is a paral-
lel graph of the average percentage change in the Herfindahl index of sales during the two time periods.
In both graphs, we observe a similar pattern: the majority of the data points fall above the 45-degree line.
This suggests that industries in general are becoming more turbulent and are concentrating faster post-
1996.
We next turn to examining these patterns in a regression framework, taking a difference-in-
difference approach:
(2) 0 1 2 3 4D96 IT D96 IT # of firms +y β β β β β ε= + + + ⋅ +
where D96 equals 1 if the year is higher than 1996 and 0 otherwise. This model extends equation (1) with
an additional dummy for the post-break year period and its interaction with the IT intensity measure.

Brynjolfsson et al.: Scale without Mass Submitted to Management Science
18
We first consider turbulence. Table 4 reports the results for sales and enterprise value in Panel A
and B respectively. We first estimate models without the IT variable to determine whether there is a gen-
eral increase in turbulence after 1996. Models 1-4 in the two panels suggest that the post-1996 period is
significantly more turbulent for sales but not for EV. We then introduce the IT variable without the inter-
action term. The results from Models 5-8 suggest that even when we control for the time period, IT-
intensive industries are still significantly more turbulent than are non-IT-intensive industries. Finally, we
include the interaction term. Consistent with patterns evident in Figure 2a, results from the last three
models show that the increase in turbulence after 1996 is more pronounced for IT-intensive industries.
We then conduct a similar analysis for the concentration growth rates and report the results in
Table 5. Similar to the turbulence results, industries on average concentrate faster after 1996. Controlling
for the time period, the IT variable does not show any significance. The coefficient for the IT variable is
negative in all cases. After we add the interaction term, in several instances, the negative coefficient for
IT variable becomes significant. This suggests that before 1996, the concentration growth rate for IT-
intensive industries was actually below that of non-IT-intensive industries. The coefficient for the interac-
tion term in the weighted models is positive and significant. This indicates that IT-intensive industries
concentrated more quickly than did non-IT-intensive ones after 1996.
5.3 Robustness Checks
A natural concern is whether our results are a consequence of our choice of metrics and parameters. In
unreported regressions, we modify our analyses in several ways to explore the robustness of our findings.
We first discretely categorize industries as IT-intensive or non-IT-intensive based on their rela-
tion to the median intensity and repeat the analysis. We obtain similar results.
We also look at other outcomes of interest in addition to sales and enterprise value, such as earn-
ings before interest, taxes, depreciation, and amortization (EBITDA) and total assets. We also employ
other operationalizations of the dependent variables for concentration, such as the first difference in the
logarithm of the Herfindahl index and the percentage change in the four-firm concentration ratio (C4).
Results are again similar. In addition, as there is no standard definition of IT intensity, we also repeat the

Brynjolfsson et al.: Scale without Mass Submitted to Management Science
19
analysis for two other measures of IT intensity: IT capital per FTE and IT capital per industry output. The
results are broadly consistent with those presented here. In fact, we obtain higher significance for the IT-
intensity variable in a number of cases.
6 Conclusion
Enterprise information technology is increasingly pervasive in American businesses. As a result, firms
are able to more rapidly and completely replicate their innovations in business processes, achieving scale
without mass. Other types of IT, such as email, knowledge management systems, wikis, and instant mes-
saging allow firms to propagate innovations that are less structured than entire business processes
(McAfee 2006). IT makes it possible for better techniques and processes to become rapidly known and
adopted throughout the organization.
We show through a formal model how this process can lead to increased turbulence and concen-
tration. In particular, competition becomes increasingly Schumpeterian as innovators are able to leverage
their best practices to rapidly gain market share. At the same time, competitors and new entrants have the
opportunity to more rapidly leap-frog and displace leading firms. Our model is consistent not only with
the increase in productivity growth since the mid-1990s, but also with the higher levels of turbulence.
Furthermore, as predicted by our model, concentration levels have also increased in IT-intensive indus-
tries, an outcome that is not consistent with other explanations for higher turbulence.
Our research cannot conclusively establish that causality flows unidirectionally from IT invest-
ments to changes in industry dynamics, but our analyses of economy-wide data do present evidence of
discontinuities in these dynamics beginning at approximately the same time that investments in IT, and
particularly enterprise IT, accelerated. It is particularly reassuring that our qualitative case studies of in-
dividual firms and competitive dyads provide clear examples of the phenomena we model and illustrate
the causal mechanism.
Brynjolfsson et al.: Scale without Mass Submitted to Management Science
20
We believe that a great deal of fruitful ground exists between the case studies and the economy-
wide analyses. In particular, future research detailing the competitive impact of IT within a single indus-
try could help clarify the impetus for technology investments, their timing, and their effects.
Further research could also help determine the duration of IT’s competitive impact. Recent U.S.
productivity growth remains strong, indicating that IT continues to contribute positively to productivity
acceleration even though IT itself is no longer novel. If IT is in fact a means to embed and replicate busi-
ness innovations within a firm, if the boundary of the firm remains high, and if the stock of valuable busi-
ness innovations is not yet depleted, then one might expect to observe a permanent positive relationship
between IT intensity and levels of turbulence and concentration growth rather than a transient one.
However, our model does not necessarily predict that these trends will persist indefinitely. Investments
in IT and especially EIT are the key drivers in our story; if they tail off, then, all else being equal, so
would productivity, turbulence, and concentration growth. Furthermore, the nature of IT itself is multi-
faceted and evolving. If innovations in business processes become easier to translate across firm bounda-
ries, the variance in returns might decrease rather than increase.
Acknowledgements
We are grateful to Warren McFarlan and to workshop participants at Harvard University, Carnegie Mel-
lon University, and the National Bureau of Economic Research for insightful comments on this research.
We are also grateful to the Harvard Business School Division of Research, the MIT Center for eBusiness,
and the National Science Foundation (IIS- 0085725) for generous funding.

Brynjolfsson et al.: Scale without Mass Submitted to Management Science
21
Appendix A
By definition, we know that 1 2min( , ,..., )A A AA nc c c c= . Without loss of generality, we normalize the ex-
pected value of Aic , c , to be zero. We have:
1 2Pr( ) Pr(min( , , , ) )A A AA nc y c c c y≥ = ≥K 1 2Pr(( ) ( ) ( ))A A A
nc y c y c y= ≥ ∩ ≥ ∩ ≥L
1
1Pr( ) ( )2 2 ( )
nA ni
i ind
yc yf IT=
= ≥ = −∏
Therefore, 1( ) 1 ( )2 2 ( )
n
ind
yF yf IT
= − − .
The density function of Ac is 11( ) ( )2 ( ) 2 2 ( )
n
ind ind
n yf yf IT f IT
−= − . We then have:
( ) 1
( )
1 1( ) ( ) ( )2 ( ) 2 2 ( ) 1
ind
ind
f IT nA indy f IT
ind ind
ny y nE c dy f ITf IT f IT n
−
=−
−= − = −
+∫
Similarly, 22( )2 1
( )
( ) (2 ( 1))1( ) ( )2 ( ) 2 2 ( ) ( 1)( 2)
ind
ind
f IT n indA y f IT
ind ind
f IT n n nny yE c dyf IT f IT n n n
−
=−
+ −= − =
+ +∫
Therefore,
2 2 22
4( ) ( ) ( ) ( )( )( 1) ( 2)A A A ind
nVar c E c E c f ITn n
= − =+ +
( ) = ( )A BVar c Var c . Since Ac and Bc are independent, ( , ) 0A BCov c c = .
Therefore, the variance of the market shares of firm A and B, AMS and BMS , are:
2
2 2 2
( )1 1 2( ) ( ) ( ( ) ( )) ( )2 6 36 9 ( 1) ( 2)
indB AA B A
f ITc c nVar MS Var Var c Var ct t t n n−
= + = + =+ +
Hence, ( ) 0
( )A
ind
dVar MSd IT
> . ( )BVar MS has the same expression.

Brynjolfsson et al.: Scale without Mass Submitted to Management Science
22
Table 1 Variable definitions and definitions of outliers. In Panel A, we report data sources used to compute industry concentration and turbulence. In Panel B, we report data sources used to compute IT intensity for each industry. Panel C reports definitions of low-density industries, outliers for dependent and independent variables. The data on IT and non-IT capital are available for 63 industries from BEA. Federal Reserve banks and Management of Companies are dropped in all analyses because CompuStat does not have any data on these industries. An industry is considered a low-density industry if CompuStat has data for only five or fewer firms for this industry in at least one year during 1987-2004. The independent variable used in our regressions is the continuous operationalization of IT capital share of tangible wealth (ITTW). The dependent variables for turbulence analyses are average rank change for sales and enterprise value (EV); for concentration growth analyses they are the percentage change in the Herfindahl Index for sales and enterprise value (EV). We consider an industry an outlier if its value is more than four standard deviations away from the industry mean.
Panel A: Industry Concentration and Turbulence
Variable Source Computation
Enterprise Value (EV) CompuStat
Enterprise Value = Market Value (data25 * data199) + Total Debt (data9 + data34) + Preferred Stock (data130) - Cash and Equivalents (data1) (For two financial industries (Credit intermediation and related activities, and Securities, commodity contracts, investments), enterprise value is cal-culated without cash and equivalents because of savings accounts.)
Revenue (sasles) CompuStat Data 12
Panel B: IT Intensity
Variable Source Computation IT Capital BEA Created from the BEA “Tangible Wealth Survey” following the approach
outlined in Stiroh (2002) Non-IT Capital BEA Created from the BEA “Tangible Wealth Survey” following the approach
outlined in Stiroh (2002) Total Capital BEA IT Capital + Non-IT Capital Full-time Employees (FTE)
BEA From Section 6 of the BEA “National Income and Product Accounts Ta-bles”
Industry Output BEA From “Survey of Current Business” detailed at Bureau of Economic Analysis (2004)
Panel C: Definitions of Low-density Industries and Outliers
Low-density industries: Forestry & Fishing; Transit; Warehousing; Broadcasting; Information Processing; Legal Services Outliers Independent Variable ITTW Computer Systems Design and Related Services
Average Rank Change for Sales Computer and Electronic Product Manufacturing Credit Intermediation and Related Activities
Average Rank Change for EV Computer and Electronic Product Manufacturing Credit Intermediation and Related Activities
Percentage Change in Herfindahl Index for Sales Miscellaneous Health Care
Dependent Variables
Percentage Change in Herfindahl Index for EV None

Brynjolfsson et al.: Scale without Mass Submitted to Management Science
23
Table 2 Comparing turbulence levels of IT intensive industries with non IT-intensive industries using continuous operationalization of IT intensity. The sample period is 1987-2004. The dependent variables are average rank change of sales and enterprise value (EV) of industry i from year t-1 to year t respec-tively. Here IT intensity is a continuous variable. We first calculate IT capital share as a percentage of tangible wealth (ITTW) for each industry in each year, and calculate z-values of these figures for each industry by year. We then calculate each industry’s mean z-value over this time period. The logarithms of these mean z-values are used as continuous measures for each industry’s IT intensity. Model 1 and Model 2 are OLS and other models are weighted least squares using the square root of FTE in each industry in each year as weights. Standard errors are in parenthesis. All regressions allow errors to be correlated across industries and are corrected for heteroskedasticity.
Average Rank Change for Sales Average Rank Change for EV
Model 1 2 3 4 1 2 3 4 0.55*** 0.30*** 0.87*** 0.92*** 0.75*** 0.34*** 1.02*** 0.90*** IT-intensity (0.17) (0.08) (0.19) (0.15) (0.22) (0.13) (0.23) (0.20)
0.041*** 0.041*** 0.037*** 0.033*** 0.07*** 0.074*** 0.064*** 0.066*** # of firms (0.002) (0.002) (0.003) (0.002) (0.002) (0.003) (0.003) (0.003) Weights yes yes yes yes
Industry fixed effects Drop Outliers yes yes yes yes
Drop low-density industries yes yes yes yes
Observations 1096 936 1096 936 1095 936 1095 936 Number of industries 61 52 61 52 61 52 61 52
R-squared 0.74 0.77 0.83 0.9 0.83 0.84 0.89 0.93 * Significant at the 10-percent level; ** Significant at the 5-percent level; *** Significant at the 1-percent level

Brynjolfsson et al.: Scale without Mass Submitted to Management Science
24
Table 3 Comparing concentration growth rate of IT intensive industries with non IT-intensive industries using continuous operationalization of IT inten-sity. The sample period is 1987-2004. The dependent variables are percentage changes in Herfindahl Index (HI) of sales and enterprise value (EV) of industry i from year t-1 to year t respectively. Following Hou and Robinson (2004), we average the HI over 3 years. We first calculate IT capital share as a percentage of tangible wealth (ITTW) for each industry in each year, and calculate z-values of these figures for each industry by year. We then calculate each industry’s mean z-value over this time period. The logarithms of these mean z-values are used as continuous measures for each industry’s IT intensity. Model 1 and Model 2 are OLS and other models are weighted least squares using the square root of FTE in each industry in each year as weights. Standard errors are in parenthesis. All regressions allow errors to be correlated across industries and are corrected for heteroskedasticity.
Percentage Change in Herfindahl Sales Percentage Change in Herfindahl Enterprise Value
Model 1 2 3 4 1 2 3 4 -0.179 -0.221 -0.849* -0.944* -0.23 -0.256 -1.238 -1.341 IT-intensity (0.32) (0.31) (0.47) (0.51) (0.33) (0.30) (0.90) (0.95) 0.001 0.003* 0.007*** 0.009*** 0.004 0.006** 0.012 0.014 # of firms (0.00) (0.00) (0.00) (0.00) (0.00) (0.00) (0.01) (0.01)
Weights yes yes yes yes Drop Outliers yes yes
Drop low-density industries no yes no yes no yes no yes
Observations 1098 954 1098 990 1098 972 1098 990 Number of industries 61 53 61 55 61 54 61 55
R-squared 0 0.001 0.014 0.021 0.002 0.005 0.024 0.026 * Significant at the 10-percent level; ** Significant at the 5-percent level; *** Significant at the 1-percent level

Brynjolfsson et al.: Scale without Mass Submitted to Management Science
25
Table 4 Comparing turbulence levels of IT-intensive industries with non-IT-intensive industries pre- and post-1996 using continuous operationalization of IT intensity. The sample period is 1987-2004. In Panel A, the dependent variable is the average rank change of sales of industry i from year t-1 to year t. In Panel B, the dependent variable is average rank change of enterprise value (EV) of industry i from year t-1 to year t. Post-1996 dummy equals 1 if t > 1996, 0 otherwise. We first calculate 1) IT capital share as a percentage of tangible wealth (ITTW) for each industry in each year and 2) z-values of these figures for each industry by year. We then calculate each industry’s mean z-value over this time period. The logarithms of these mean z-values are used as con-tinuous measures for each industry’s IT intensity. Model 1, 2, 5, 6, 9 and 10 are OLS, and other models are weighted least squares using the square root of FTE in each industry in each year as weights. Standard errors are in parentheses. All regressions allow errors to be correlated across industries and are corrected for heteroskedasticity.
Panel A: Average Rank Change of Sales
Model 1 2 3 4 5 6 7 8 9 10 11
0.56*** 0.30*** 0.93*** 0.28 0.23 0.68*** IT-intensity (0.17) (0.08) (0.15) (0.24) (0.18) (0.25)
0.97** 0.68*** 1.19*** 1.13*** 0.99** 0.68*** 1.20*** 1.13*** 1.02** 0.81*** 1.16*** Post-1996 dummy (0.41) (0.24) (0.41) (0.31) (0.42) (0.24) (0.42) (0.31) (0.43) (0.28) (0.40) 0.66* 0.57** 0.787**
Post-1996 dummy * IT-intensity (0.38) (0.27) (0.36) 0.042*** 0.041*** 0.034*** 0.055*** 0.041*** 0.04*** 0.033*** 0.055*** 0.041*** 0.04*** 0.032*** # of firms (0.002) (0.002) (0.002) (0.005) (0.002) (0.002) (0.002) (0.005) (0.002) (0.002) (0.002)
Weights yes yes yes yes yes Industry fixed effects yes yes
Drop Outliers yes yes yes yes yes yes yes yes Drop low-density industries yes yes yes yes yes yes yes yes
Observations 1096 936 936 936 1096 936 936 936 1096 936 936 Number of industries 61 52 52 52 61 52 52 52 61 52 52
R-squared 0.74 0.77 0.9 0.94 0.74 0.77 0.91 0.94 0.74 0.77 0.90

Brynjolfsson et al.: Scale without Mass Submitted to Management Science
26
Panel B: Average Rank Change of EV
Model 1 2 3 4 5 6 7 8 9 10 11 0.76*** 0.35*** 0.903*** 0.35 0.25 0.57* IT-intensity (0.22) (0.128) (0.20) (0.28) (0.25) (0.29)
0.55 0.20 .022 -0.38 0.60 0.22 0.25 -0.38 0.64 .041 .021 Post-1996 dummy (0.42) (0.30) (0.56) (0.51) (0.42) (0.30) (0.57) (0.511) (0.44) (0.36) (0.55) 0.98** 0.83** 1.12**
Post-1996 dummy * IT-intensity (0.44) (0.39) (0.44) 0.072*** 0.075*** 0.068*** 0.103*** 0.07*** 0.074*** 0.066*** 0.103*** 0.07*** 0.07*** 0.07*** # of firms (0.002) (0.003) (0.003) (0.01) (0.002) (0.003) (0.003) (0.01) (0.002) (0.003) (0.003)
Weights yes yes yes yes yes Industry fixed effects yes yes
Drop Outliers yes yes yes yes yes yes yes yes Drop low-density industries yes yes yes yes yes yes yes yes
Observations 1096 936 936 936 1096 936 936 936 1096 936 936 Number of industries 61 52 52 52 61 52 52 52 61 52 52
R-squared 0.83 0.83 0.93 0.96 0.83 0.84 .0.93 0.96 0.74 0.77 0.93 * Significant at the 10-percent level; ** Significant at the 5-percent level; *** Significant at the 1-percent level

Brynjolfsson et al.: Scale without Mass Submitted to Management Science
27
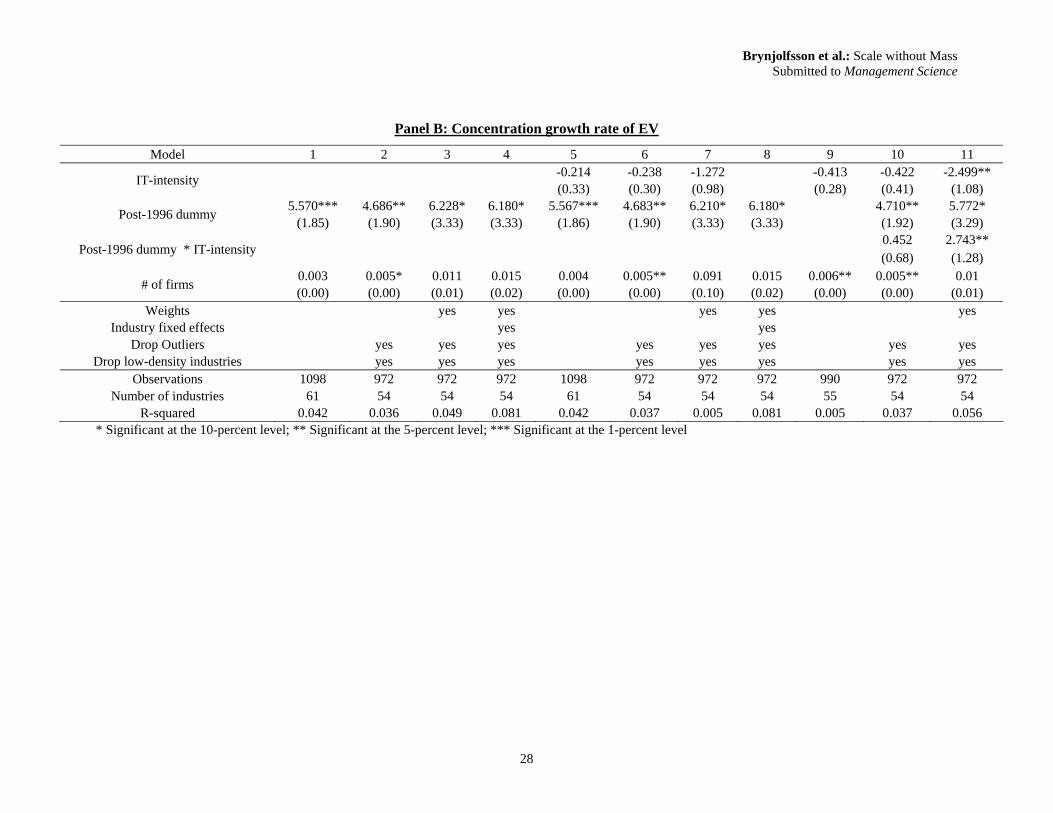
Table 5 Comparing concentration growth rate of IT-intensive industries with non-IT-intensive industries pre- and post-1996 using continuous operationali-zation of IT intensity. The sample period is 1987-2004. In Panel A, the dependent variable is the percentage change in the Herfindahl Index (HI) of sales of industry i from year t-1 to year t. In Panel B, the dependent variable is the percentage change in Herfindahl Index (HI) of enterprise value (EV) of industry i from year t-1 to year t. Following Hou and Robinson (2004), we average the HI over three years. We first calculate 1) IT capital share as a percentage of tangible wealth (ITTW) for each industry in each year and 2) z-values of these figures for each industry by year. We then calculate each industry’s mean z-value over this time period. The logarithms of these mean z-values are used as continuous measures for each industry’s IT intensity. Model 1, 2, 5, 6, 9 and 10 are OLS and other models are weighted least squares using the square root of FTE in each industry in each year as weights. Standard errors are in parentheses. All regressions allow errors to be correlated across industries and are corrected for heteroskedasticity.
Panel A: Concentration growth rate of Sales
Model 1 2 3 4 5 6 7 8 9 10 11 -0.165 -0.207 -0.843 -0.142 -0.576 -1.853*** IT-intensity (0.32) (0.31) (0.52) (0.42) (0.40) (0.72)
4.687*** 3.536*** 4.347*** 4.408*** 4.685*** 3.534*** 4.335*** 4.408*** 3.938*** 3.172*** 3.601*** Post-1996 dummy (0.80) (0.82) (0.89) (0.85) (0.81) (0.82) (0.90) (0.85) (1.00) (0.92) (0.92) -0.025 0.833 2.066**
Post-1996 dummy * IT-intensity (0.60) (0.57) (1.02) 0.001 0.002 0.006*** -0.003 0.001 0.002* 0.058*** -0.003 0.00 0.00 0.007*** # of firms (0.00) (0.00) (0.00) (0.01) (0.00) (0.00) (0.02) (0.01) (0.00) (0.00) (0.00)
Weights yes yes yes yes yes Industry fixed effects yes yes
Drop Outliers yes yes yes yes yes yes yes yes Drop low-density industries yes yes yes yes yes yes yes yes
Observations 1098 954 954 954 1098 954 954 954 1098 954 954 Number of industries 61 53 53 53 61 53 53 53 61 53 53
R-squared 0.039 0.026 0.058 0.136 0.039 0.027 0.008 0.136 0.028 0.023 0.062
Brynjolfsson et al.: Scale without Mass Submitted to Management Science
28
Panel B: Concentration growth rate of EV
Model 1 2 3 4 5 6 7 8 9 10 11 -0.214 -0.238 -1.272 -0.413 -0.422 -2.499** IT-intensity (0.33) (0.30) (0.98) (0.28) (0.41) (1.08)
5.570*** 4.686** 6.228* 6.180* 5.567*** 4.683** 6.210* 6.180* 4.710** 5.772* Post-1996 dummy (1.85) (1.90) (3.33) (3.33) (1.86) (1.90) (3.33) (3.33) (1.92) (3.29) 0.452 2.743**
Post-1996 dummy * IT-intensity (0.68) (1.28) 0.003 0.005* 0.011 0.015 0.004 0.005** 0.091 0.015 0.006** 0.005** 0.01 # of firms (0.00) (0.00) (0.01) (0.02) (0.00) (0.00) (0.10) (0.02) (0.00) (0.00) (0.01)
Weights yes yes yes yes yes Industry fixed effects yes yes
Drop Outliers yes yes yes yes yes yes yes yes Drop low-density industries yes yes yes yes yes yes yes yes
Observations 1098 972 972 972 1098 972 972 972 990 972 972 Number of industries 61 54 54 54 61 54 54 54 55 54 54
R-squared 0.042 0.036 0.049 0.081 0.042 0.037 0.005 0.081 0.005 0.037 0.056 * Significant at the 10-percent level; ** Significant at the 5-percent level; *** Significant at the 1-percent level

Brynjolfsson et al.: Scale without Mass Submitted to Management Science
29
Figure 1 Figure 1a shows U.S. Corporate IT stocks and flows per full-time employee (FTE), and Figure 1b shows annual US corporate investment in Equipment, Plant, and IT as percentages of total , 1987-2004. In Figure 1a, each year’s value is calculated by taking total IT stock (at historical cost) and dividing by total FTEs. In Figure 1b, The three values for each year sum to 100% (Data source: Bureau of Economic Analysis (BEA) Tangible Wealth Survey.)
Figure 1a Figure 1b
Figure 2 Scatterplot of average yearly changes in sales turbulence and average yearly changes in the Herfindahl Index of sales, 1987-1996 vs. 1997-2004. These graphs contain 55 data points, one for each industry. In Figure 2a, one industry, Computer and electronic product manufacturing, is not shown because plotting its data point – x = 36.99, y = 49.28 – would compress the rest of the graph. (Data source: CompuStat.)
Figure 2a Figure 2b
US Corporate IT per employee , 1987-2004
0
1000
2000
3000
4000
5000
6000
1987
1988
1989
1990
1991
1992
1993
1994
1995
1996
1997
1998
1999
2000
2001
2002
2003
2004
Dol
lars
(cur
rent
cos
t)
779
1570
2646
5134
Breakdown of Investments in US Corporate Tangible Wealth, 1987-2004
0
10
20
30
40
50
60
70
1987
1988
1989
1990
1991
1992
1993
1994
1995
1996
1997
1998
1999
2000
2001
2002
2003
2004
Perc
ent
Equipment
Plant
IT
12.5%
22.9%
Turbulence in sales, 1987-1996 vs. 1997-2004
0
5
10
15
20
25
30
35
40
0 10 20 30 40
Average rank change in sales, 1987-1996
Ave
rage
rank
cha
nge
in s
ales
, 199
7-20
04
Below Median IT IntensityAbove Median IT Intensity
Average growth rate in HI of Sales 1987-1996 vs. 1997-2004
-15
-5
5
15
25
35
45
55
-15 -5 5 15 25 35 45 55
Average of yearly HI Sales growth rate (%) , 1987-1996
Ave
rage
of y
early
HI S
ales
gro
wth
rate
(%
) , 1
997-
2004
Below Median IT IntensityAbove Median IT Intensity

Brynjolfsson et al.: Scale without Mass Submitted to Management Science
30
References Ancori, B., A. Bureth and P. Cohendet 2000. The economics of knowledge: The debate about codification and tacit knowledge. Industrial and Corporate Change 9(2) 255. Arthur, W. B. 1996. Increasing returns and the new world of business. Harvard Business Review 74(4) 100. Blinder, A. S. 2000. The Internet and the New Economy. Brookings Policy Brief 60 The Brookings Institution Washington, DC. Bloom, N. and J. Van Reenen 2005. Measuring and Explaining Management Practices across Firms and Countries. London School of Economics Centre for Economic Performance working paper London School of Economics Lon-don. Bresnahan, T. F., E. Brynjolfsson and L. M. Hitt 2002. Information technology, workplace organization, and the demand for skilled labor: firm-level evidence. The Quarterly Journal of Economics CXVII(1) 339-376. Brunner, D. J., B. Staats, M. Iansiti and G. Favaloro 2006. Information Technology and the Growth of the Firm: A Process Theory Perspective. working paper 06-053 Harvard Business School Boston. Brynjolffson, E., L. Hitt and S. Yang 2002. Intangible Assets: Computers and Organizational Capital. Brookings Papers on Economic Activity(1) 137-198. Brynjolffson, E. and M. Smith 2003. The Great Equalizer? Consumer Choice Behavior at Internet Shopbots. Man-agement Science. Brynjolfsson, E. and L. Hitt 1996. Paradox Lost? Firm-level Evidence on the Returns to Information Systems Spending. Management Science 42(4) 541-558. Brynjolfsson, E. and L. M. Hitt 2000. Beyond Computation: Information Technology, Organizational Transforma-tion and Business Practices. Journal of Economic Perspectives 14(4) 23-48. Brynjolfsson, E. and L. M. Hitt 2003. Computing productivity: Firm-level evidence. The Review of Economics and Statistics 85(4) 793. Brynjolfsson, E. and S. Yang 1997. The Intangible Benefits and Costs of Computer Investments: Evidence from the Financial Markets. Proceedings of the International Conference on Information Systems, Atlanta, GA. Campbell, J. Y., M. Lettau, B. G. Malkiel and Y. Xu 2001. Have Individual Stocks Become More Volatile? An Empirical Exploration of Idiosyncratic Risk. Journal of Finance 56(1) 1-43. Carr, N. G. 2003. IT Doesn't Matter. Harvard Business Review 81(5) 41-49. Cash, J. I., Jr. and K. Ostrofsky 1986. Mrs. Field's Cookies. case study 189056 Harvard Business School Boston. Chandler, A. D. 1990. Strategy and Structure: Chapters in the History of the American Industrial Enterprise. The MIT Press Cambridge, MA. Chun, H., J.-W. Kim, J. Lee and R. Morck 2005. Creative Destruction and Firm-Specific Volatility. Moscow Meet-ings Paper EFA Moscow. Comin, D. and S. Mulani 2004. Diverging Trends in Macro and Micro Volatility. working paper New York Federal Reserve Bank New York. Comin, D. and T. Phillipon 2005. The Rise in Firm-Level Volatility: Causes and Consequences. NBER Macro Annual Conference.

Brynjolfsson et al.: Scale without Mass Submitted to Management Science
31
D'Aspremont, C., G. J. J. and J. F. Thisse 1979. ON HOTELLING'S "STABILITY IN COMPETITION". Econo-metrica (pre-1986) 47(5) 1145. Dedrick, J., V. Gurbaxani and K. L. Kraemer 2003. Information technology and economic performance: A critical review of the empirical evidence. ACM Computing Surveys 35(1) 1. Galbraith, J. 1973. Designing Complex Organizations. Addison-Wesley Reading, MA. Hayek, F. 1945. The Use of Knowledge in Society. American Economic Review 35(4) 519-530. Hobijn, B. and B. Jovanovic 2001. The information-technology revolution and the stock market: Evidence. The American Economic Review 91(5) 1203. Hou, R. and D. T. Robinson 2004. Industry Concentration and Average Stock Returns. Working paper 2003-30 Dice Center. Ichniowski, C., K. Shaw and G. Prennushi 1997. The Effects of Human Resource Management on Productivity: A Study of Steel Finishing Lines. American Economic Review 87(3) 291-313. Irvine, F. O. and S. Schuh 2005. The Roles of Comovement and Inventory Investment in the Reduction of Output Volatility. 05-9 Federal Reserve Bank of Boston Boston. Jorgenson, D. W. and K. J. Stiroh 2000. Raising the Speed Limit: U.S. Economic Growth in the Information Age. Brookings Papers in Economic Activity The Brookings Institute. Konicki, S. 2002. Now in bankruptcy, Kmart struggled with supply chain - some software projects, intended to help, got scrubbe4r, sources say. InformationWeek 26(Issue):Jan 28, 2002. Leonard-Barton, D. 1989. Implementing New Production Technologies: Exercises in Corporate Learning.in M. Von Glinow and S. Mohrman Managing Complexity in High Technology Industries: Systems and PeopleOxford Press London, p. McAfee, A. 2003. When Too Much IT Knowledge is a Dangerous Thing. Sloan Management Review 44(2) 83-89. McAfee, A. 2005. Pharmacy Service Improvement at CVS (A). Harvard Business School case study 606-015 Har-vard Business School Boston. McAfee, A. 2006. Enterprise 2.0: The Dawn of Emergent Collaboration. Sloan Management Review 47(3) 21-28. McAfee, A., V. Dessain and A. Sjoman 2004. Zara: IT for Fast Fashion. Harvard Business School case study 604-081 Harvard Business School Boston. McAfee, A. and M. Otten 2005. IBM: Ordering Midrange Computers in Europe. Harvard Business School case study 605-022 Harvard Business School Boston. McAfee, A. P., L. Qasimi and K. Ooms-Wallis 2002. Dubai Ports Authority (A). Case study 603-061 Harvard Busi-ness School Boston. McDonagh, J. 2001. Not for the faint hearted: social and organizational challenges in IT-enabled change. Organiza-tion Development Journal 19(1) 11. McFarlan, F. W. and N. Tempest 2001. Charles Schwab Corporation (B). Harvard Business School case study 300-025 Harvard Business School Boston.

Brynjolfsson et al.: Scale without Mass Submitted to Management Science
32
McFarlan, F. W. and J. Weber 2001. Merrill Lynch: Integrated Choice (Abridged). Harvard Business School case study 301-081 Harvard Business School Boston. Oliner, S. D. and D. E. Sichel 2000. The Resurgence of Growth in the Late 1990s: Is Information Technology the Story? The Federal Reserve Board San Francisco. Romer, P. 1994. New goods, old theory, and the welfare costs of trade restrictions. Journal of Development Eco-nomics 43(1) 5. Romer, P. M. 1990. Endogenous Technological Change. The Journal of Political Economy 98(5) S71. Romer, P. M. 1992. Two strategies for economic development: using ideas and producing ideas. World Bank An-nual Conferece on Development Economics. Rose, M. and E. MacDonald (1998). FoxMeyer Trustee Sues SAP, Deloitte; $500 Million Is Sought From Each Firm. The Wall Street Journal. New York: B8. Stiroh, K. J. 2002. Information Technology and the U.S. Productivity Revival: What do the Industry Data Say? The American Economic Review 92(5) 1559-1576. Terwiesch, C. and Y. Wu 2004. The Copy-Exactly Ramp-Up Strategy: Trading-Off Learning With Process Change. IEEE Transactions on Engineering Management 51(1) 70. Tirole, J. 1988. The theory of industrial organization. MIT Press Cambridge, Mass. White, L. J. 2002. Trends in Aggregate Concentration in the United States. Journal of Economic Perspectives 16(4) 137-160. Williamson, O. E. 1967. Hierarchical Control and Optimal Firm Size. Journal of Political Economy 75 123-138. Wilson, R. 1975. Information Economies of Scale. Bell Journal of Economics 61 184-195.