scaling up solar powered water supply systems … · scaling up solar powered water supply systems:...
TRANSCRIPT
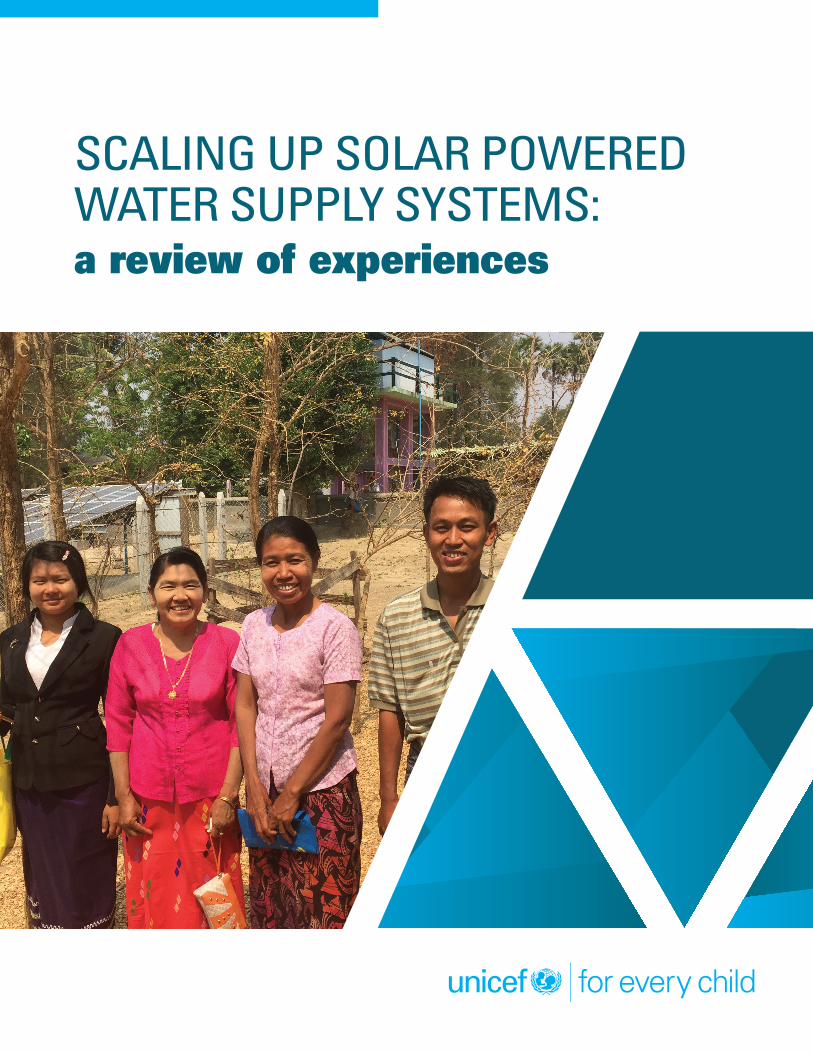
SCALING UP SOLAR POWERED WATER SUPPLY SYSTEMS: a review of experiences

2 I
© United Nations Children’s Fund (UNICEF) 2016
Disclaimer:The publication may be reproduced in whole or in part and in any form for educational or non-profit purposes without special permission from the copyright holder provided proper acknowledgement of the source is made.The designation of geographical entities in this report, and the presentation of the material herein, do not imply the expression of any opinion whatsoever on the part of the publisher or the participating organisations concerning the legal status of any country, territory or area, or of its authorities, or concerning the delimitation of its frontiers or boundaries.
For more information:For further information, comments and feedback, please contact UNICEF Water, Sanitation and Hygiene3 UN PlazaNew YorkNY 10017USAEmail: [email protected]
Authors:Emily Bamford, UNICEF Water, Sanitation and Hygiene Specialist, New York, United StatesDjani Zadi, UNICEF Supply Chain Specialist, Copenhagen, Denmark
Contributors:Cecilia Scharp, Senior Advisor Water and Environment, UNICEF Water, Sanitation and Hygiene, New YorkJose Gesti Canuto, UNICEF Water and Environment Specialist, New YorkChris Cormency, UNICEF Water, Sanitation and Hygiene Chief, MozambiqueTabinda Syed, UNICEF Supply and Logistics Manager, Syria Kanan Nadar, UNICEF Water, Sanitation and Hygiene Chief, NigeriaMai Maigana Ousseni, UNICEF Water, Sanitation and Hygiene Chief, MauritaniaPrakash Raj Lamsal, UNICEF Water, Sanitation and Hygiene Chief, UgandaBishnu Pokhrel, UNICEF Water, Sanitation and Hygiene Chief, MyanmarSahr Kemoh, Water, Sanitation and Hygiene Manager, Somalia
Key Informants:UNICEF WASH Staff in Nigeria, Mauritania, Uganda and Myanmar.Ministry of Water and Sanitation, Mauritania, Ministry of Water and Environment (Rural Development), UgandaRural Water Supply and Sanitation Agency (RUWASA), Anambra and Jigawa States, NigeriaHydraulique Assainissement (HA), Kaedi District, MauritaniaMinistry of Education, Infrastructure Service Department, Kabul, AfghanistanMinistry of Rural Rehabilitation and Development (MRRD), Kabul, AfghanistanDirectorate of Rural Development, Than Binkan District, MyanmarSave the Children, Care International, Danish Committee for Aid to Afghan Refugees (DACAAR), HELVETAS Swiss Intercooperation, Water Missions International, Oxfam.Private sector:Mauritania: Atica and Socusaf TP Afghanistan: European Technology Company, Zulistan Ltd and Stroke Renewable EnergyUganda: DRACO DrillingCommunity WASH Committees and end users: Anambra and Jigiwa States, Nigeria, Gorgol and Tekane Districts, Mauritania, Nebbi State and Kiryandongo refugee settlement, Uganda, Pauk Township and New Khuay Districts, Myanmar.
Cover photo:WASH Committee stand in front of their solar pump system in Central Myanmar© UNICEF Myanmar/2016

Scaling up solar powered water supply systems: a review of experiences I 3
Contents 1. EXECUTIVE SUMMARY ..................................................................................... 4 2. INTRODUCTION .................................................................................................. 5
3. METHODOLOGY ................................................................................................. 8
4. RESULTS ............................................................................................................. 9
i) Solar powered water systems – the technology ...................................... 9 a. Technology overview ................................................................................ 9 b. System dimensioning ............................................................................. 10 c. Ensuring sufficient, year-round water supply ..........................................11 d. Automated versus unautomated systems ............................................. 12
ii) The demand for solar powered systems ................................................. 12
iii) Initial Investment....................................................................................... 13 a. Procurement .......................................................................................... 13 b. Costs and benefits ................................................................................. 14
iv) Operation and Maintenance ..................................................................... 17 a. Overall functionality ............................................................................... 17 b. Majority causes of malfunction .............................................................. 18 c. System downtimes ................................................................................ 18 d. Availability of spare parts ........................................................................ 18 e. System management ............................................................................. 19
v) Professionalisation and capacity ............................................................. 21 a. Borehole siting and construction ............................................................ 21 b. Training and expertise ............................................................................ 21
vi) The enabling environment ....................................................................... 21 a. Policy ...................................................................................................... 21 b. Governance and accountability .............................................................. 22 c. Equity ..................................................................................................... 22
5. CONCLUSION ................................................................................................... 23
Additional Resources ................................................................................................. 24
References ............................................................................................................... 24

1. Executive Summary
Over the past few years, UNICEF has been exploring new and innovative approaches to water supply, placing an emphasis on systems which are affordable, scalable, environmentally sustainable and climate smart. Solar powered water systems have the potential to meet all of these criteria. The systems can also help provide a higher quality service to multiple communities through the use of small piped water schemes and therefore play a key role in helping to accelerate the achievement of the Sustainable Development Goal (SDG) on water and sanitation.
Globally, 35 UNICEF Country Offices are using solar powered water systems in their programmes. As the price of solar panels decreases and the systems become increasingly popular with partners and beneficiaries, it has become vital to assess the progress made so far.
The Solar Powered Water System assessment was carried out in four countries; Nigeria, Mauritania, Uganda and Myanmar and was supported by a global UNICEF country office survey and literature review. The assessment aims to take stock of the progress made so far, particularly in terms of programming and the long-term sustainability of systems. It will also provide key lessons to consider when moving forward.
Overall, the assessment found that when correctly sited and dimensioned, solar powered water systems are a sustainable and effective method of providing safe water to communities. Low day-to-day running costs combined with long-term durability mean that solar powered systems are now becoming financially competitive, particularly in comparison to motorised systems. The systems can also provide an important water storage buffer for climate adaptation purposes and additionally help reduce the carbon footprint of the water sector.
Despite the successes, significant challenges remain, particularly in terms of sector professionalisation and the strengthening of local markets. Also, because the potential cost of repairs is higher than for other systems, it is vital that the collection and management of user fees is made both affordable and effective for all. If such improvements can be made, solar powered water schemes have a real potential to ensure safe and sustainable water access for millions of people globally.
4 I
“Overall, the assessment
found that when correctly
sited and dimensioned,
solar powered water
systems are a sustainable
and effective method of
providing safe water to
communities„

Scaling up solar powered water supply systems: a review of experiences I 5
2. IntroductionAround 663 million people globally still lack access to safe water in 2016, despite the Millennium Development Goal (MDG) target for water being met. Even when improved drinking water sources exist, ensuring safe and sustained water services remains a challenge. Water points can regularly break down and services are often unreliable, creating major barriers to access. Reasons for this can include a lack of local capacity, particularly in terms of repair and maintenance, land degradation and pollution. Such challenges mean that the rural water sector has been left with significant unfinished business.
The new Sustainable Development Goal (SDG) on water and sanitation agenda is more ambitious and aims to ensure that everyone has access to a safe and reliable source of drinking water at home by 2030 (SDG 6.1). Countries are expected to progressively move up the drinking water ladder, ensuring communities have access to safer and more reliable services. In most rural areas, groundwater remains the most viable and safe source of water and will continue to play a key role in meeting the SDG for water supply.
In order to achieve the ambitious task of universal safe water access, UNICEF is continuing to explore new and innovative solutions which are affordable, scalable, environmentally sustainable and climate smart. Solar powered water systems have the potential to meet all of these criteria, providing higher quality services to multiple villages through the use of small piped water schemes. However, before scaling-up globally, it is vital that UNICEF learns from existing in-country experiences.
The UNICEF Solar Powered Water System Assessment is based on a combination of four in-country case studies, a global survey and literature review. It aims to take stock of the progress made so far, particularly in terms of programming and the long-term sustainability of systems. The assessment will also provide key lessons to consider when moving forward.
BackgroundUNICEF first began piloting solar powered water supply systems in off-grid areas more than 25 years ago. Since then, the technology has evolved and the reliability and efficiency of systems has improved significantly. Costs have also decreased as more brands and technology options have become available on the market.
According to a 2015 survey carried out among UNICEF country offices, 35 UNICEF offices are currently using solar powered water systems in their programming (Map 1). The majority of systems have so far been installed in rural communities, schools and health care centres. They are mostly small in size (less than 2,000 beneficiaries) and are often being used to replace handpumps and motorised systems.
Fig. 1 shows the configuration of a typical gravity-fed solar powered water supply system. Photovoltaic panels use solar energy to power a submersible pump. Water is then pumped up into a water storage tank, with gravity then allowing this water to be piped to tap stands or directly into households.
FIG.1 I Diagram of typical solar powered water supply system
Solar powered systems typically move water over an extended period of time and are able to operate autonomously in most cases. This can help reduce the pressure on boreholes by spreading yield throughout the day. The tank storage capacity of such systems can also help provide an important buffer, allowing spare water to be used during peak demand times, at night or during periods of intense cloud cover.
Both the literature and UNICEF experience have shown that solar powered systems have close to zero running costs, unlike motorised pumps, which are also noisy, polluting (emitting greenhouse gases which contribute to climate change) and are highly susceptible to fluctuating fuel prices. Even though the initial investment for solar powered systems is still slightly higher than for motorised systems, solar powered systems are becoming more competitive in price where strong market competition exists. Also, because of their durability and low running costs, they are considered cost effective in the long-term.
© Practical Action

The boundaries and names shown and the designations used on this map do not imply official endorsement or acceptance by the United Nations.
MAP 1 I Countries where UNICEF is supporting solar powered water supply systems
Suriname
Mauritania
Guinea Bissau
Sierra Leone
Ghana
Togo
Nigeria
Mali

Scaling up solar powered water supply systems: a review of experiences I 7
Mali
Chad
Sudan
Eritrea
Philippines
Timor LesteMyanmar
SomaliaEthiopiaSouth SudanUgandaKenya
United Rep. of Tanzania
Madagascar
Cambodia
Dem. People’s Rep. of Korea
KyrgyzstanPakistan
Iraq
Jordan
State of Palestine
Afghanistan
AngolaZambia
Malawi
Mozambique

8 I
3. MethodologyThe UNICEF Solar Powered Water System Assessment was carried out in four countries; Nigeria, Mauritania, Uganda and Myanmar from July 2015 to May 2016. The selected UNICEF Country Offices have piloted the use of solar powered water supply systems over the past few years and were chosen based on an initial broader online survey sent to all 35 offices implementing solar water supply programming. Table 1 shows the scale of implementation in the four selected countries. The countries covered a range of environmental, socioeconomic and political contexts. A desk review was also carried out in order to look at existing literature and other documentation collected from additional UNICEF Country Offices including Somalia, Ethiopia, the Philippines and Afghanistan.
The field assessment was carried out over a total of eight weeks, in collaboration with local partners (including government, NGOs and private sector), WASH Committees and households. Direct observations were carried out in 35 communities.
Additionally, more than 300 individuals (government, NGO staff, beneficiaries and private sector representatives) took part in focus group discussions and key informant interviews which took place at the community, district and national levels. Follow up discussions were also carried out with key informants and staff from the UNICEF Country Offices following the assessment.
TABLE 1 I Number of UNICEF-supported systems and beneficiaries in each of the 4 assessment countries
Myanmar Nigeria Uganda Mauritania
No. of solar powered systems installed since 2011 13 763 38 34
No. of solar pump beneficiaries since 2011 11,105 1,907,500 105,468 7,000

4. Resultsi) Solar Powered Water Systems: The Technology
a. Technology overviewSolar powered water pumps have been in mass production since 1983. Studies have shown that the technology has improved greatly over the past 30 years, with systems becoming more efficient, cost-effective and versatile (Hossain et al 2015 and PS Eau 2015). There are many types of pumps and systems currently available on the market, suitable for pumping deep wells, shallow wells, ponds and streams.
As solar powered systems are relatively simple to install and transport, the technology is especially suited to off-grid rural communities, particularly where the groundwater level may be too low to be reached by traditional handpumps. The assessment found that solar powered systems, when correctly dimensioned, are able to reach depths of up to 250 metres, but are more commonly used in boreholes less than 150 metres (Table 2).
Durability and minimal day-to-day running costs also make the technology suitable for low income communities. Unlike motorised pumps, solar powered systems
TABLE 2 I Comparison of water pumping technologies
Handpumps Motorised pumps (diesel or other fuel)
Solar Powered Water Pump
Initial cost (per beneficiary)
$10-20 $20-50 (varies according to context and size of system)
$10-90 (varies according to context and size of system)
Pumping depth Up to 80m Up to 600m1 Up to 250m2
Installation Simple Moderately complex Moderately complex
Popularity with beneficiaries
Less popular – major effort required to collect water and breaks down regularly. Cheap to maintain.
Less popular – minimal effort required to collect water and breaks down regularly. Expensive to maintain.
More popular – minimal effort required to collect water and rarely breaks down. Cheap to maintain.
Operating costs
None Significant day to day operating costs are required (cost of fuel and paying an operator)
None – unless system is manually operated3, in which case a part-time operator is necessary
Durability Poor – breaks down frequently and requires regular maintenance. Average lifespan of 1-5 years.
Poor – breaks down frequently and regular maintenance is required. Average lifespan of 5-10 years.
High – rarely breaks down and little maintenance is required. Average lifespan of 10+ years.
Pollution No greenhouse gas emissions Significant greenhouse gas emissions
No greenhouse gas emissions
Other considerations
Only suitable for shallow water depths and requires time and physical labour (usually from women and children).
Noisy, heavily reliant on reliable fuel supply.
Requires consistent sun exposure throughout the year, reduced output when cloudy.
1 Riser pipes are the limiting factor for the installation depth – more so than the power of the pump2 Example: Grundfos SQ Flex 1.2-33 Manually operated systems require an operator to switch the system off and on depending to how much water is available in the storage tank. Many of the newer systems now use automatic control panels in order to manage water flow, so operators are no longer required.
Scaling up solar powered water supply systems: a review of experiences I 9

generate no emissions and when combined with sufficient water storage facilities, can be considered a “climate smart investment.” The technology is well suited to tropical countries (with high levels of solar irradiation) and provides an important water storage buffer for climate adaptation purposes. Collecting water from solar powered systems, unlike handpumps, is also faster and doesn’t require manual labour.
Table 2 below shows a simple comparison of the benefits and challenges of three of the most popular water supply technologies currently being used by UNICEF.
The solar powered systems observed during the assessment had been installed between 1 and 10 years ago and were located in rural and peri-urban areas. Around 50% of systems could be classed as hybrid and utilized a back-up generator system when required. In all cases, water was being consumed by households or livestock either via tap stands (Mauritania, Nigeria and Uganda) or piped directly to the home (Myanmar).
BOX 1 I Top Solar Pump System Parameters for Dimensioning
• Water consumption per capita per day
• Total population and projected population growth
over the next 15 years
• Maximum yield of water source (m3/day)
• Expected drawdown
• Distance from source to solar panels
• Distance from source to water tank
• Elevation from source to tank
• Static and dynamic water table
• Inside borehole casing diameter
• Seasonality of water demand (increases and
decreases during the wet and dry seasons)
• Actual solar energy available (insolation averages),
shading and variation over the year (sunny, cloudy,
rainy seasons)
b. System dimensioningThe assessment found that the effectiveness of solar powered systems is highly dependent on smart system design, which must be based on accurate hydrogeological and demand data. A feasibility study, carried out at the community level was found to be absolutely vital, not just to ensure the viability of the physical environment, but also to determine whether or not the technology can produce enough water per person to be cost effective for the community. Unfortunately, this did not always happen and certain parameters were not being taken into account when planning installation. The most important parameters to assess prior to installation are included in Box.1.
“The assessment found that the effectiveness of solar powered systems is highly dependent on smart system design, which must be based on accurate hydrogeological and demand data„
10 I
UNICEF-supported solar pump in Anambra State, Nigeria© UNICEF Nigeria/2016

Scaling up solar powered water supply systems: a review of experiences I 11
Interviews with the government and other partners showed that whilst groundwater resource assessments usually took place prior to installation, just 25% of projects had carried out a thorough feasibility study in order to help determine accurate system dimensioning.
According to those who were interviewed, for water depths of more than 200m, some solar water supply brands struggle to yield sufficient water without also relying on a back-up generator to provide additional power. Therefore, in such situations, where initial costs are so high and “breakeven points” occur much later, motorized pumps may be more suitable, particularly when demand is high.
c. Ensuring sufficient, year-round water supplyOf the 35 systems visited during the field assessment, 94% were found to be able to provide sufficient water to all community members for most, if not all, days of the year (Fig. 2). Forty-one percent of systems experienced no issues with seasonality. For the 53% of systems that did experience issues with seasonality, water supply was found to be insufficient for just a few days per year. This was found to be due to either very heavy cloud cover (during peak rainy season) or due to very high water demand (during peak dry season).
FIG. 2 I Is the water produced sufficient year round?
41%
26%
27%
6%
Yes, all the time
Mostly, but for 1-7 days during the rainly season
Mostly, but for 1-7 days during the dry season
No, we struggle year round
BOX 2 I Solar Powered Systems in extreme climates
Despite being considered a climate resilient technology,
solar pump systems can still be vulnerable to the
impacts of extreme climatic events.
For example, in Mauritania, there were reports of
solar panel connectivity and wiring being sensitive to
extremely high temperatures – which can regularly
reach over 100°F during the dry season. This poses a
particular threat to hybrid systems with inverters, which
must be correctly dimensioned in order to support high
currents and heat.
Also during extreme weather events (such as monsoons
and flooding), unless solar panels are extremely well
protected and secured, they can easily be damaged,
and even worse, be dangerous if they shatter or become
dislodged (UNICEF Philippines 2016).UNICEF-supported solar powered water system in Uganda. © UNICEF Uganda/2015

12 I
“94% of systems were found to be able to provide sufficient water to all community members for most, if not all, days of the year„
Just 6% of the communities visited said they struggled year-round to provide sufficient water for everyone in the community. In such cases, systems had not been sufficiently dimensioned to get the most from the borehole. Most commonly, panels were not sufficient enough to match pump energy demand, pumps were not powerful enough to provide sufficient water at very low depths and storage was not sufficient enough to provide at least 2 days of buffer storage for communities. Additionally, in some cases, the need to reduce costs by procuring in bulk, meant that a “cookie-cutter approach” was used to dimension all systems – using the same number of panels, same sized storage tank etc. for each community. This meant that systems were often performing under capacity and were not able to fully meet the community’s demand for water. Similar issues were also found in Somalia, where “oversizing” (affecting 57% of systems) seemed to be the predominant issue – i.e. too many panels were installed. Not only did this inflate the price of installation, it could also lead to the overexploitation of groundwater sources, threatening the sustainability of the borehole in the long-term (UNICEF Somalia 2016).
It is important to note that all the systems which struggled to meet water demands were solar-only systems – not hybrids (which also had a back-up generator). Around 50% of all systems visited could be classed as hybrid systems with an ability to switch to a back-up generator if necessary. In many cases however, the generator was rarely used (only during very cloudy days or periods of very high demand). Also, according to those interviewed, the motorised components in hybrid systems are much more susceptible to malfunction and generators in particular often require replacing at least once every five years. However, in communities experiencing continually high water demand or heavy and extended rainy seasons, they remain vital in helping to ensure sustained water supply.
d. Automated versus unautomated systemsAround 30% of the solar powered systems visited were manually operated (switched off and on as needed). These systems were found to malfunction more regularly than those with automatic controls. Manually operated systems also led to additional running costs as a pump operator was required to oversee the day-to-day running of the system, leaving space for human error. In one case, a tank was seen visibly overflowing as the pump operator was not available to switch off the system, leading to water wastage and safety concerns.
None of the solar water supply systems visited used batteries. According to those interviewed, trials over the years had found the use of batteries (to store energy and allow pumping at night) was not sustainable due to their limited life span. The need for batteries can be offset by improved system dimensioning in order to get the most out of the system during daylight hours. The need for battery disposal is also avoided, which can lead to significant environmental hazards when not disposed of correctly.
ii) The Demand for Solar Powered Systems
In the four countries studied, solar powered systems were found to be popular with communities, government and private sector partners (Fig. 3). The vast majority of key informants had a highly positive opinion of the systems.
UNICEF staff and implementing partners also favoured the use of solar powered systems in their programmes largely due to the low running costs and long-term durability. Contractors and water service providers also favoured the technology for the same reasons.
In countries such as Mauritania, Uganda and Nigeria, which have relatively developed markets, initial investment costs were found to be highly competitive with motorised systems. As a result, the demand for solar powered technology was high. In contrast, in Myanmar, where the market was still in its infancy, import tariffs were high and supply chains were weaker, making the technology much less competitive. Demand by the government, private sector and beneficiaries for the technology, outside of UNICEF-supported projects, was therefore relatively low.
For ministry and local government partners, even though the vast majority favoured the use of solar powered systems, most had yet to implement at scale due to the higher initial investment costs required (compared to motorised pumps). As one local government official in

Scaling up solar powered water supply systems: a review of experiences I 13
Myanmar stated “it’s a tough choice – reaching a smaller number of people with a greener, more sustainable technology, reaching more with a dirtier technology.”
The technology was popular with households due to the low running costs and the reliability of water supply provided by the systems. The main criticism of the systems, particularly from the community Water Management Committees, centred on them being unable to provide sufficient water to meet the full needs of the population. In such cases, further investigation revealed that this was almost mostly due to an unusually high water demand (as a result of large herds of livestock) or poor dimensioning of systems which had resulted in reduced capacity (particularly in terms of storage), to cover night hours and cloudy days.
iii) Initial Investment
a. ProcurementIn the case of the 34 UNICEF Country Offices that implement solar pump programming, around 50% procure directly from UNICEF’s Supply Division in Copenhagen, the other 50% choose to procure locally. This decision is based on the specific country context (including in-country pricing, import tariffs and the security situation). Where it is too expensive or complex to procure locally (as was the case for Myanmar), UNICEF will procure directly from Supply Division. Nigeria, Mauritania and Uganda all procure solar powered water system components locally.
Fig. 4 shows the different brands that are currently being used by UNICEF in the four assessment countries.
FIG. 3 I What is your opinion of solar water supply systems?K
EY
INFO
RM
AN
T G
RO
UP End User
Water Management committees
Water service providers (private)
Contractors (private)
NGO Partners
UNICEF Country Office staff
Local Government
Ministry of Water Resources
Highly positive Somewhat positive Neutral Somewhat negative Highly negative
0 10 20 30 40 50 60 70 80 90 100
PERCENTAGE OF RESPONSES
FIG. 4 I The most popular solar pump brands used by UNICEF in the 4 assessment countries
5%5%
24%
67%
Grundfos SQ
Lorenz PS
Mono Sun-Sub
Franklin Fhoton
Irrespective of how procurement takes place, it was found that preference was given to the Grundfos SQ Flex and Lorentz PS pump models based on their proven durability, output and cost effectiveness in the long-term. All government, NGO and private sector partners interviewed similarly named Grundfos and Lorentz as the

14 I
FIG. 5 I The beautiful math of solar power (Bloomberg 2016)
0 10 100 1,000 10,000 100,000 1,000,000
100
10
1
0,1
Every time the world’s solar power doubles, the cost of panels falls 26%
MODULE COST HAVE FALLEN
99% SINCE 1976 80% SINCE 2008
Current2015price
Learning rate 26.3%
1976
1985
20032008
HISTORICAL PRICE (USD/W, USD/WH)
CU
MU
LAT
IVE
PR
OD
UC
TIO
N (
MW
, MW
H)
most desirable brands. The Grundfos SP line was found to be preferable for larger communities (e.g. peri-urban settings or refugee settlements). Mono and Franklin were also rated highly.
One main advantage of DC submersible pumps (such as the Lorentz PS pumps used in Uganda) is that they do not require inverters (which were found to be prone to malfunction), to convert the DC current from the solar panels to the AC current required for the pump. Grundfos SQ Flex models are also compatible with both DC and AC power supply without requiring an external inverter, which is particularly useful when a pump is powered by more than one power source (i.e. hybrid systems). This, combined with their overall efficiency and durability is another reason why they are being selected for use by UNICEF Country Offices.
b. Costs and BenefitsSince the 1980s, solar powered systems have increased in efficiency and durability, with more brands becoming
available on the market (particularly from China) – increasing competition and reducing costs.
This price decrease can largely be attributed to the rapid fall in cost of solar panels over the past 40 years. Module costs have fallen by 99% since 1976 and by 80% since 2008 (Fig. 5).
When comparing the costs of programming per country, the use of larger systems meant overall cost per beneficiary could be reduced. This, when combined with a relatively strong market environment meant that cost per beneficiary was the lowest in Nigeria and Uganda (Table 3). Solar panels (despite recent price decreases), pipes and storage remain the most expensive components of a system.
Even though the initial investment for solar powered systems is still slightly higher than for motorised systems in many countries, solar powered systems are becoming more competitive cost-wise with motorised-only pumps where strong market competition exists (Khan 2013). For

Scaling up solar powered water supply systems: a review of experiences I 15
TABLE 3 I Average costs (USD) associated with installing a solar powered system per country in assessed UNICEF Country Offices
Solar powered system component
Nigeria Uganda Myanmar Mauritania
Solar Panels $4368 $11205 $3320 $1500
Solar pump $2195 $7076 $5,725 $1500
Pipes $3900 $19949 $7,210 $800
Tank $1245 $12296 $4,504 $11000
Labour $2055 $5156 $555 $2000
Borehole Drilling $3170 $6667 $2,028 $4200
Other $3650 $9360 $3,919 $ 0
TOTAL $20,583 $71,709 $27,261 $21,000
Average population supported by the system 2,500 2,500 686 300
Cost per beneficiary (USD) $8 $29 $40 $70
* In Mauritania, despite solar powered systems being highly competitive with motorised systems (Table.4), the cost per person was still high due to the small size of systems and high in-country logistical costs.
The results of the UNICEF assessment similarly showed that in Mauritania in particular, solar water system technology was very competitive. This was largely due to multiple brands (particularly from China) competing for market share, soaring fuel prices and popularity of the technology with the government and general public. In Uganda and Nigeria, where markets were also relatively developed, solar powered systems were found to be 10-15% more expensive on average than for motorised systems (Table 4). In the case of Myanmar, where the market was still in its infancy (and import taxes are high), solar remains expensive in comparison motorised pumps.
For most of the countries visited during the assessment, markets have yet to fully evolve to the point where the initial cost of solar powered technology is fully comparable to motorized pumps (Table 3). However, when looking at the costs over a longer period of time (i.e. several years), the benefits become much more notable. Operation and maintenance costs for diesel pumps are higher, despite initial costs being slightly less than for solar powered systems. According to those interviewed, diesel pumps also need to be replaced every five years, whereas most solar powered systems last more than ten. Maintenance and operation costs (due to fuel costs) are also much higher, meaning that over a 20-year period – a motorized pump costs five times as much to maintain as a solar pump (Lorentz 2008).
“Even though the initial investment for solar powered systems is still slightly higher than for motorised systems in many countries, solar powered systems are becoming more competitive cost-wise with motorised-only pumps where strong market competition exists„
example, in Mali, the cost of water from a solar powered system is now 5 times cheaper than that from a motorised (diesel) pump – $0.08/m3 compared to $0.44/m3 or $0.20/m3 average for a hybrid system (PS-Eau 2015).

16 I
According to the communities interviewed, motorised systems can cost around $300-500 a month to run (for an average community of 1,000 people), depending on the price of fuel and cost of paying a pump caretaker. This means each community member would be paying on average, $0.30-$0.50 per month in additional charges to run a motorised system. When these figures are also factored into the Cost Per Person estimates provided in Table.4, in most cases, it would therefore take only a matter of months before the “breakeven” point (see Fig. 6) was reached.
Hossain et al (2015) similarly found that the cost benefit ratio of solar powered systems (1.91) was significantly higher than diesel-operated pumps (1.31) when looking at investment beyond the initial five-year period. Several studies have shown that the payback period for solar powered systems is around 4–6 years (NetWAS/Water Aid 2013, Kabade et al 2013, Chandel 2015 and Eau Solaire 2016). The proportional costs of operating a solar pump compared to a diesel pump can be seen in Figure 6 below.
Source: Eau Solaire 2016
FIG. 6 I Proportional costs of operation a solar pump versus a diesel pump (Flow: 15m3 7 day, 30m lift)
CO
ST
(E
UR
OS
)
YEARS 0 2 4 6 8 10 12 14 16 18 20 22 25
Diesel
Solar
90,000
80,000
70,000
60,000
50,000
40,000
30,000
20,000
10,000
Point at wich is becomes more cost effective to use solar
TABLE 4 I Comparative installation costs for solar powered and motorised* water pumping systems
CountryAverage
number of beneficiaries
Solar Powered Systems Motorised Water Supply Systems*
Overall Price Difference
Average cost per system (USD)
Average cost per person (USD)
Average cost per system (USD)
Average cost per person (USD)
Myanmar686 $27,261 $40 $16,753 $24
Solar is 42% more expensive
Nigeria2,500 $20,583 $8 $18,298 $7
Solar is 14% more expensive
Uganda2,500 $71,709 $29 $64,634 $26
Solar is 12% more expensive
Mauritania300 $21,000 $70 $27,000 $90
Solar is 29% cheaper
* Mechanised included those systems using a diesel or generator-based power source

Scaling up solar powered water supply systems: a review of experiences I 17
iv) Operation and Maintenance
a. Overall functionalityAccording to those interviewed, solar powered systems, when correctly sited and installed, are highly durable with an average lifespan of more than 10 years. The pump itself (depending on the brand) can last 5-15 years, solar panels have a life span of approximately 25-30 years and control panels usually have a lifespan average of about 7 years. This is in contrast to handpumps, which in more than 20% of cases have been found to become fully non-functional just one year after installation (Tincani et al 2015). Solar powered systems also only require minimal maintenance – for example cleaning solar panels (as required) and pumping mechanisms (yearly).
“ Just 13% of all solar powered systems visited had experienced a major malfunction since installation„
For the 36% of pumps which had malfunctioned since installation, in the majority of cases, this was found to be due to minor technical issues which, once the technician arrived, were reportedly easily resolved (Fig.8).
Around 25% of solar pump systems visited during the assessment were built prior to 2011; the rest were constructed between 1-5 years ago. Overall, 64% of the solar powered systems visited had always remained functional since installation (Fig.7).
Just 13% of all solar powered systems visited had experienced a major malfunction since installation (defined as costing more than $500 and taking more than 1 day’s labour to fix). In contrast, for motorised pumps, private sector, NGO and community respondents stated breakdowns could occur 2-5 times a year on average. This is something which was also confirmed by a recent UNICEF Somalia study (UNICEF Somalia 2016).
One major concern highlighted by the field visits was that none of the solar powered systems had undergone routine scheduled servicing and just 20% had any form of maintenance plan. Pumps were only being serviced “when needed.”
FIG. 7 I Functionality of solar pump since installation
64%
36%
Always functional
Broken down once or more
FIG. 8 I Severity of solar pump malfunction if solar pump malfunctioned
37%
63%
Minor
Major
18 I
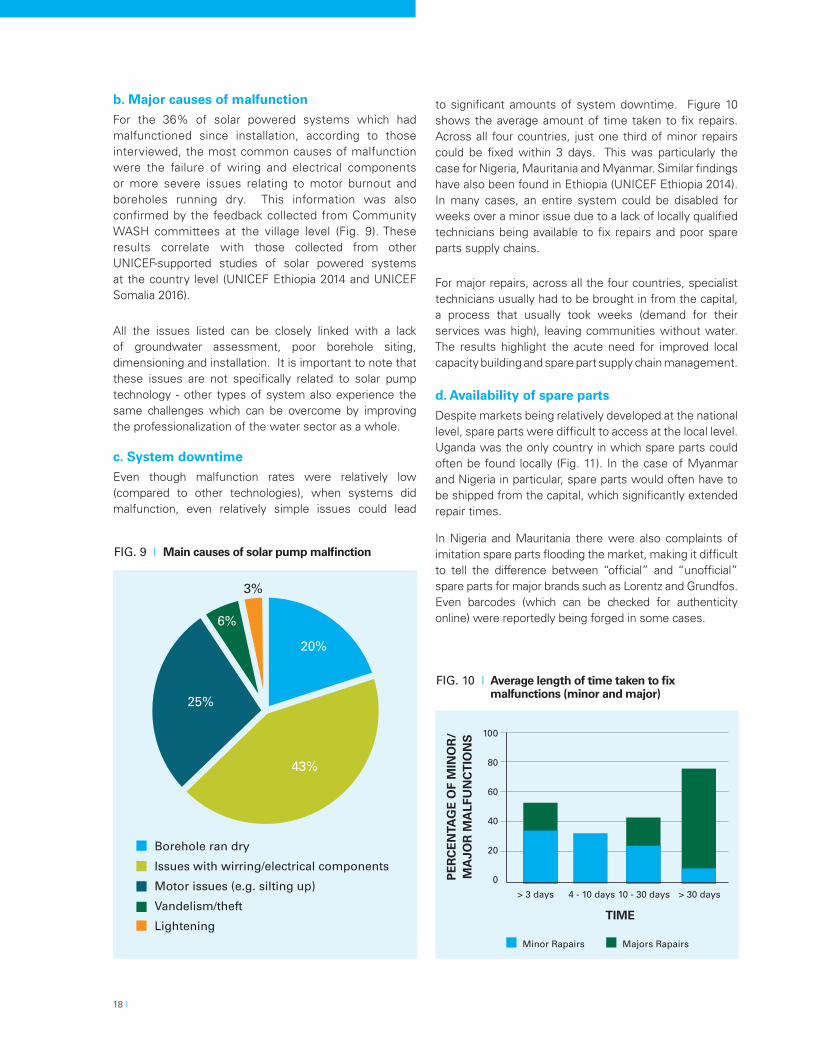
b. Major causes of malfunctionFor the 36% of solar powered systems which had malfunctioned since installation, according to those interviewed, the most common causes of malfunction were the failure of wiring and electrical components or more severe issues relating to motor burnout and boreholes running dry. This information was also confirmed by the feedback collected from Community WASH committees at the village level (Fig. 9). These results correlate with those collected from other UNICEF-supported studies of solar powered systems at the country level (UNICEF Ethiopia 2014 and UNICEF Somalia 2016).
All the issues listed can be closely linked with a lack of groundwater assessment, poor borehole siting, dimensioning and installation. It is important to note that these issues are not specifically related to solar pump technology - other types of system also experience the same challenges which can be overcome by improving the professionalization of the water sector as a whole.
c. System downtimeEven though malfunction rates were relatively low (compared to other technologies), when systems did malfunction, even relatively simple issues could lead
FIG. 9 I Main causes of solar pump malfinction
3%
6%
43%
25%
20%
Borehole ran dry
Issues with wirring/electrical components
Motor issues (e.g. silting up)
Vandelism/theft
Lightening
FIG. 10 I Average length of time taken to fix malfunctions (minor and major)
PE
RC
EN
TAG
E O
F M
INO
R/
MA
JOR
MA
LFU
NC
TIO
NS
> 3 days > 30 days4 - 10 days 10 - 30 days
TIME
100
80
60
40
20
0
Minor Rapairs Majors Rapairs
to significant amounts of system downtime. Figure 10 shows the average amount of time taken to fix repairs. Across all four countries, just one third of minor repairs could be fixed within 3 days. This was particularly the case for Nigeria, Mauritania and Myanmar. Similar findings have also been found in Ethiopia (UNICEF Ethiopia 2014). In many cases, an entire system could be disabled for weeks over a minor issue due to a lack of locally qualified technicians being available to fix repairs and poor spare parts supply chains.
For major repairs, across all the four countries, specialist technicians usually had to be brought in from the capital, a process that usually took weeks (demand for their services was high), leaving communities without water. The results highlight the acute need for improved local capacity building and spare part supply chain management.
d. Availability of spare partsDespite markets being relatively developed at the national level, spare parts were difficult to access at the local level. Uganda was the only country in which spare parts could often be found locally (Fig. 11). In the case of Myanmar and Nigeria in particular, spare parts would often have to be shipped from the capital, which significantly extended repair times.
In Nigeria and Mauritania there were also complaints of imitation spare parts flooding the market, making it difficult to tell the difference between “official” and “unofficial” spare parts for major brands such as Lorentz and Grundfos. Even barcodes (which can be checked for authenticity online) were reportedly being forged in some cases.

Scaling up solar powered water supply systems: a review of experiences I 19
utility companies. In this context, it was reported by all partners to be a more effective system in terms of operation, maintenance and the collection of user fees. However, at this time, the option is only available for larger communities (more than 2,000 people) in Mauritania, due to the limited profitability potential of operating in the smaller and most remote communities.
User fee pricingAs the potential costs of repairing a major solar powered system malfunction are high (compared to handpumps for example), it is vital that the community or service provider collect sufficient user fees to ensure the financial sustainability of the system. For UNICEF-supported programmes, this price is determined by the community WASH Committees, in consultation with households.
Average costs per household were found to vary, from an average family in Myanmar paying $1.50 a month to around $4.50 a month being paid in Uganda (Fig. 12). The majority of households found these prices to be affordable, particularly considering the increased convenience and time saving provided by the solar powered systems.
e. System Management
Overall community contributionFor the vast majority of UNICEF projects, following an initial 1-2-year warranty period, the community becomes responsible for managing and paying for repairs. In around 95% of communities surveyed, the systems were either fully managed by the community or partially-managed in collaboration with the local government. In exceptional circumstances (usually when a serious, expensive breakdown occurs and community funds are insufficient), the local government or UNICEF would step in to provide support.
In Myanmar, communities also contributed to the initial costs of installing the system – this ranged from 20%-50% of total costs based on what was financially feasible for the community. Experience in Myanmar has shown that this led to an even stronger sense of community ownership and responsibility for the solar powered system.
Mauritania was the only country where a small proportion of communities were supported by private
FIG. 11 I Where are spare parts usually sourced?
CO
UN
TR
Y
Myanmar
Uganda
Mauritania
Nigeria
Locally (within 10km) Regionally (within the state or province) Nationally (from the capital)
0% 10% 20% 30% 40% 50% 60% 70% 80% 90% 100%
PERCENTAGE OF RESPONSES
FIG. 12 I Average cost of user fees per household (USD per month)
CO
UN
TR
Y
Nigeria
Mauritania
Uganda
Myanmar
$0.00 $1.00 $2.00 $3.00 $4.00 $5.00 $6.00 $7.00 $8.00
COST (USD)

20 I
“ In 44% of communities, the poorest 5% had to use alternative (unimproved) water sources, as water from solar powered systems was unaffordable„
As is the case for other water pumping technologies, ensuring the absolute poorest were reached was a challenge. In all of the countries surveyed, communities would often make a provision for the absolute poorest (in the form of free or discounted water) but this very much depended on the strength of community cohesion. In many communities, provisions were not being made. According to the WASHComs and households interviewed, on average around 5% of the population in each community could not afford to pay the fees for water, whatever the cost. When this occurred, just 56% of communities were found to provide in-kind assistance to those in need. The reality was
that in 44% of communities, the poorest 5% had to use alternative (unimproved) water sources, as water from solar powered systems was unaffordable (Fig. 13).
User fee management For most of the communities visited, collected user fees were managed by WASH Committees and held in a Community WASH Fund. In just 33% of cases however, funds were held in an official bank account. Payment log books and receipts for users were provided in less than 20% of cases.
Most of the end users interviewed stated they would like to see more transparency around the collection, management and disbursement of user fees. For those WASH Committees with bank accounts, most were able to provide bank statements showing how much funding they had available.
Where this community-based management system worked well (for example in Myanmar) communities had amassed an average of $500-$3000 depending on how long the project had been running and if repairs had been
FIG. 13 I If the poorest cannot afford to pay for water, what happens?
They use an alternative unsafe source of water
They are given free water
They are given discounted water
Other households donate their water
11%
11%
33%
44%
Community in Myanmar displays their user fee payment log book for the monitoring team© UNICEF Myanmar/2016

Scaling up solar powered water supply systems: a review of experiences I 21
required. Where surplus funds did exist, money was often being used by communities to support other community-based initiatives, for example paying emergency medical expenses or providing low-interest loans to households. An interesting observation was that surplus funds (savings) were in general higher in communities which had solar-only systems. When hybrid systems were used, fuel and maintenance costs, combined with a higher rate of breakdown led to less cumulative funds being available.
v) Professionalisation and Capacity
a. Borehole siting and constructionIn all the countries visited, the most common “severe” causes of malfunction were closely related to poor borehole siting and construction (Fig. 8). In addition, several of the water points visited had lower yields than expected or became “dry” at certain times of the year. UNICEF Somalia (2016) also found that up to 29% of solar powered systems had problems with dry boreholes.
The issue of “silting-up” (leading to motor issues and boreholes running dry) was also a problem in several cases due to the inadequate positioning of screens, inappropriate fitting of gravel packs and lack of geotextiles. In order to save money, it was also found that several partners would favour the use of existing boreholes, often without sufficient hydrogeological testing which would lead to problems post-installation.
It should be noted that the issues mentioned go beyond solar powered systems and are a serious issue for all other types of submersible pumping systems (Furey 2014).
“ In all the countries visited, the most common “severe” causes of malfunction were closely related to poor borehole siting and construction„
b. Training and ExpertiseIn each of the four countries visited, there was a significant need to improve the technical capacities of staff at all levels. There was found to be a heavy reliance on a small number of qualified technicians, who often had to travel
long distances to reach communities. Demand for their services is high, meaning that the fixing of minor repairs (which could be easily done at the local level) remains both expensive and slow.
Interviewees stated that UNICEF, NGO, and government staff at all levels required additional training to allow them to better oversee the work of the private sector and monitor systems post-installation. For example, in Nigeria, local government staff stated that just one staff member per district was sufficiently trained on solar powered water systems. In Uganda, due to limited local government capacity, solar powered projects were overseen by a specialised local UNICEF consultant. In this context more emphasis was placed on building the capacities of WASH Committees to manage the projects post-installation.
Operation and maintenance plans only existed in a few communities. System overhauls were also found to be a rare occurrence, with the vast majority of problems being fixed as and when they occurred, as opposed to being routinely scheduled. Whilst operation and maintenance guidance manuals are provided by most major brands, the information included is often complex and not always easy to use at the local level. UNICEF Uganda and Nigeria were working with the Government to produce a more simplified, comprehensive version of this guidance for use by WASH Committees and other partners.
vi) The Enabling Environment
a. PolicyThree of the four countries visited, Nigeria, Mauritania and Uganda, had solar pump technology explicitly mentioned in their national Water and Sanitation strategy. In Nigeria, solar powered systems are listed as a major technical option for water supply in the government’s Partnership for Expanded WASH (PEWASH) Programme. They currently account for around 7% of all water points nationally. In Mauritania, solar pump technology is a major priority for the government and it is currently being used in 24% of Government-supported projects across the country, with the aim of ensuring at least 40% of systems are solar-based by 2017.
In Uganda and Myanmar, solar water supply systems, despite their popularity, account for less than 10% of all water supply systems. In these contexts, motorised systems and handpumps are still favoured as they are considered to be more cost effective to install in the short term.

22 I
In Uganda, the government is beginning to replace handpumps (which are considered to be low yielding and unsustainable) with small piped solar water schemes, using existing boreholes wherever possible. This is listed as a major priority in their 2016-2020 National Development Plan and solar powered systems are also included as one method of achieving this. In order to strengthen the market, the government has also recently issued a tax waiver on all renewable energy imports and has committed a minimum of $1 million/year annually to invest in solar powered systems. There is talk of similar incentives also being introduced in Mauritania, but much more needs to be done in order to improve the supply and pricing of solar pump technology in all of the four countries visited.
b. Governance and AccountabilityProfessionalism and capacity are closely linked with governance and accountability. In order to overcome the potential pitfalls of poor borehole siting and installation, agreements are signed with contractors post-installation (lasting 1-2 years), stating their responsibility for fixing repairs. In many cases, up to 5% of the final payment is withheld until water point functionality had been guaranteed for the designated time period.
After this initial warranty period ends, communities are then responsible for all repairs. WASH Committees are also asked to sign contracts, stating their responsibility for managing repairs and the transparent collection of
user fees. Mismanagement of user fees still remains a common concern and many of the end users interviewed stated they would like to see more transparency around the collection, storage and disbursement of funds.
c. EquityThe assessment found that in government-supported solar projects (including some of those implemented in collaboration with UNICEF) were found to favour larger communities and those located close to regional capitals. This was in addition to giving preference to those communities that already had a functioning borehole, upgrading their existing handpump or mechanised system in order to reduce costs. However, in terms of reaching the poorest (many of whom may never have had access to a functioning water point), this approach is not considered optimal.
This was similarly the case for private sector operators who also favoured larger, easier to access communities, where the potential for creating a viable business was higher. In Mauritania, there were also reports of both private and public water supply providers cutting off water supply services for those who are unable to pay. This meant that in many cases, households were forced to resort to using unprotected sources, which can be considered a major violation of the human right to water and sanitation. It is vital that social safety nets are provided, both in the public and private context, in order to ensure the poorest are not excluded from accessing new innovative water supply systems.
Scaling up solar powered water supply systems: a review of experiences I 23
5. ConclusionResults from the assessment have shown that solar powered water systems perform well in terms of flow rate and durability, where sunlight is plentiful, boreholes are well sited and systems are correctly dimensioned to meet the needs of the population. As such, they provide a significant opportunity to move up the water supply ladder and provide a higher level of service to communities in tropical regions, particularly in off-grid, rural communities. Solar powered water systems also have the potential to ensure greater resilience in the poorest communities, including those who are affected by conflict – leaving them less dependent on fuel supply, which can be easily disrupted and vulnerable to corruption.
The vast majority of pumps were able to provide sufficient water supply throughout the year, the exception being a few days during the height of the rainy season (due to excessive cloud cover) or the dry season (where water demand was very high). It was found that such issues could be offset by improving the dimensioning of systems (e.g. increasing storage capacity) or reverting to the use of a back-up generator.
The systems were popular with communities, government and private sector partners due to their low day-to-day running costs and high functionality rates in comparison to motorised systems and handpumps. In countries such as Mauritania, Nigeria and Uganda, as markets continue to develop, initial investment costs are becoming more competitive with motorised systems. When low running costs and high functionality rates are also factored in, solar powered water systems become an economically sound investment in the long-term.
Despite relatively high rates of functionality, when breakdowns did occur they could often take weeks to fix, even for minor repairs, due to weak technical capacity at the local level and poor availability of spare parts. The most common causes of malfunction were found to be relatively minor in nature (including issues with switches, wiring and invertors), with the more serious malfunctions primarily being attributed to poor borehole siting and dimensioning of systems. In addition, spare parts were rarely available at the local level. It is therefore vital that UNICEF works to systematically close the gaps in the service chain and also look to improve service models and the overall sustainability of services. Efforts should also be made by the Government and private sector (particularly key brands such as Grundfos and Lorentz) in order to strengthen local
markets and improve supply chains. Additionally, capacity building at all levels, particularly for local contractors and technicians is vital in order to further professionalise the solar powered water system management model.
The continued financial sustainability of solar powered systems was found to be highly dependent on the successful collection and management of user fees by WASH Committees at the community level. In the case of solar powered systems, the stakes are high as the repair costs are potentially greater than for most other water supply systems. It is therefore vital that sufficient reserve funds are available to cover the costs of repair. Where community cohesion and capacity was strong, the community-based management model was found to be successful at collecting sufficient reserve funds to cover the cost of repairs. Where community cohesion and capacity was weak, limited reserve funds were available. In this context, a more professional service management model should be identified and perhaps provides an opportunity to engage with the private sector. The use of mobile phone payment systems in particular may be one method of improving the management and transparency of user fee collection.
For all types of management model, efforts should be made in order to ensure solar powered technologies are made accessible and affordable for everyone. In terms of reaching the absolute poorest, service delivery models should include significant negotiations around the price of the water and also include subsidies to support most marginalised households where required.
Finally, it is important to note that the majority of challenges highlighted in this assessment are not specific to solar powered systems – similar issues are also experienced with handpumps and motorised systems and are indicative of the urgent improvements required from the water sector as whole. Significant investment is required in order to build both public and private sector capacities to successfully install and manage systems, strengthen markets and improve accountability. This is imperative if solar powered systems and other water supply systems are to fully meet the needs of the communities they serve. If these improvements can be made, solar pump technology provides a significant opportunity to achieve universal and sustainable water access for millions of people globally.

24 I
Additional ResourcesLorentz dimensioning tool: http://www.genproenergy.com/genpro-energy-blog/lorentz-compass-3-1-software-update.html
Grundfos dimensioning tool: https://product-selection.grundfos.com/front-page.html?%3Ftime=1461698941877&qcid=53629151
UNICEF WASH Technology Information Packages (TIPS) http://www.unicef.org/supply/index_54301.html
ReferencesBloomberg (2016) The World Nears Peak Fossil Fuels for Electricity http://www.bloomberg.com/news/articles/2016-06-13/we-ve-almost-reached-peak-fossil-fuels-for-electricity
Chowns, E (2015) Community management: The limits of institutional design and collective action, International Research Society for Public Management (IRSPM) Conference, 31 March 2015, Panel I103, Available from http://irspm2015.com/sppa/index.php/irspm/IRSPM2015/paper/viewFile/1273/537
Eau Soleil (2016) Pompage solaire http://www.eausoleil.org/site/pompage-solaire
PS-Eau (2015) Le pompage solaire : Options techniques et retours d’expériences des repères pour l’action http://www.pseau.org/outils/ouvrages/ps_eau_arene_le_pompage_solaire_2015.pdf
Chandel, S.S, M. Nagaraju Naik and Rahul Chande (2015) Review of solar photovoltaic water pumping system technology for irrigation and community drinking water supplies, Renewable and Sustainable Energy Reviews, 2015, vol. 49, issue C, pages 1084-1099
Forbes (2014) Solar Energy Revolution: A Massive Opportunity http://bit.ly/29J8dHt
Furey, S., (2014) Handpumps: where now? A synthesis of online discussions (2012-2014), Rural Water Supply Network http://www.rural-water-supply.net/en/resources/details/614
Kabade, A., Rajoriya,A. and Chaubey, U.C. (2013) Solar Pump Application in Rural Water Supply – A Case Study from Ethiopia
Khan, Tareek-Al-Islam et al (2013) The feasibility study of solar irrigation: Economical comparison between diesel and photovoltaic water pumping systems for different crops http://ieeexplore.ieee.org/xpl/abstractAuthors.jsp?arnumber=6777844
Lorentz (2008) Solar Water Pumps in Namibia - A Comparison Between Solar and Diesel http://www.lorentz.de/pdf/lorentz_brochure_namibia_usd_en.pdf
Hossain et al (2015) Feasibility of solar pump for sustainable irrigation in Bangladesh, International Journal of Energy and Environmental Engineering 06/2015; 6(2). DOI: 10.1007/s40095-015-0162-4
NetWAS and Water Aid (2013) Recommendations for the sustainability and scalability of solar powered water pumping for domestic supply in Adjumani and Kanungu districts of Uganda http://washtechnologies.net/_ressources/documents/default/6-20-2-1383642719.pdf
Tincani, L., Ross, I., Zaman, R., Burr, P., Mujuca, A., and Evans, B. (2015) “Regional assessment of the operational sustainability of water and sanitation services in Sub-Saharan Africa” VFM-WASH project report, August 2015
UNICEF (2016) WASH Technology Information Packages (TIPS)
http://www.unicef.org/supply/index_54301.html
UNICEF Ethiopia (2014) Solar powered water pump technology in Ethiopia, lessons learnt for scaling up
UNICEF Philippines (2016) Implementing the Solar Pumping Water Systems in Schools in Haiyan Typhoon Affected Areas, March 2016
UNICEF Somalia (2016) UNICEF Evaluation of the Performance of Solar Powered Water Systems in Somalia


UNICEF Water, Sanitation and Hygiene3 UN PlazaNew YorkNY 10017USAEmail: [email protected]://www.unicef.org/wash