scanning electron microscope analysis of fly ash, quarry ... · v-1975), differential free swell...
TRANSCRIPT

Scanning Electron Microscope Analysisof Fly Ash, Quarry Dust Stabilized Soil
P. Indiramma(&) and CH. Sudharani
Department of Civil Engineering, S.V. University College of Engineering,Tirupati, India
[email protected], [email protected]
Abstract. Soil is a complex material with different minerals present in variantproportions, since it is formed due to weathering of rocks. The proportion ofmineral governs the behaviour of soils. The soils with Montimorillonite mineralare more expansive in nature. The structures build with or on these soils areprone to problems like cracking, foundation failures due to their Swelling andShrinking behaviour. Stabilization of expansive soil using admixtures is effec-tive way of improving the intended soil properties and strength in specific. Thispaper focuses on the performance of Fly Ash and Quarry Dust as admixtures tothe selected expansive soil. Laboratory investigations for determining AtterbergLimits, Compaction Characteristics, Deformation behaviour and UnconfinedCompressive Strength and mineralogical analysis are performed by ScanningElectron Microscope (SEM) technique. The general behaviour of soil alone andafter admixing with different percentages of Fly Ash and Quarry Dust areanalyzed from laboratory test results and cross checked from Scanning ElectronMicroscope studies on the selected expansive soil.
Keywords: Expansive soil � Fly Ash � Quarry Dust � Scanning ElectronMicroscope (SEM) � Unconfined Compressive Strength
1 Introduction
Around 20% of total land area in the world are covered by expansive soils. Expansivesoils have low Bearing Capacity, high Swelling and Shrinkage characteristics and highwater susceptibility. Presence of Montimorillonite mineral is responsible for thisbehaviour of expansive soils. Structural cracks, premature failure of the pavementoccurs when constructed on or with expansive soils. Stabilization of expansive soilsusing different additives such as Fly Ash, Quarry Dust, Lime, Cement and Bitumen areeconomical and effective. Fly Ash is an industrial by-product which is generated fromThermal Power Plants. Fly Ash is classified into class F and class C Fly Ash. Fly Ash isgenerally grey in colour, abrasive, mostly alkaline and refractory in nature. Safe dis-posal of Fly Ash is a major problem and creating severe environmental problems.Quarry Dust is a mineral solid waste, obtained from crushing of stone aggregates.Researchers used industrial waste admixtures namely, Quarry Dust, Fly Ash and SteelSlag etc. as soil stabilizers so that there is a value addition to the industrial wastes andenvironmental pollution is also minimized. Many research works are reported in
© Springer International Publishing AG 2018W. Frikha et al. (eds.), Soil Testing, Soil Stability and Ground Improvement,Sustainable Civil Infrastructures, DOI 10.1007/978-3-319-61902-6_22

literature using Fly Ash Phanikumar and Sharma (2004, 2007); Phanikumar (2009) andQuarry dust Sridharan and Soosan (2005) in their study areas to investigate the vari-ation of properties of soils to analyze them as beneficial Geotechnical materials.
An attempt has been made by in this investigation to use industrial waste admix-tures namely, Quarry Dust and Fly Ash as soil stabilizers to the selected expansive soil.The effect of Fly Ash and Quarry Dust on expansive soils, laboratory tests are con-ducted for determining Plasticity characteristics, Differential Free Swell Index, Com-paction Characteristics, and Unconfined Compressive Strength. Soil behaviour mainlydepends on minerals present in soil, so a micro level investigation is carried out usingScanning Electron Microscope (SEM) technique in order to arrive the mineral com-position and to understand the mechanism involved in soil stabilization.
2 Materials and Methods Used
2.1 Materials
1. An expansive soil collected from Tirupati Airport site, near Renigunta.2. Fly ash from Vijayawada Thermal Power Station (VTPS), Vijayawada and3. Quarry Dust from Tirupati Quarry.
2.2 Admixture Proportions
In the present study two series of tests are conducted. In first series the expansive soil ismixed with Fly Ash varying from 5% to 25% in increments of 5% by weight of soiltaken. In second series expansive soil is mixed with Quarry Dust varying from 5% to25% in increments of 5% by weight of soil taken.
2.3 Methods Adopted
The following tests are conducted on selected soil alone and Soil-Fly Ash mixtures andSoil-Quarry Dust mixtures:
Liquid Limit Test (IS: 2720 (PART V)-1975), Plastic Limit Test (IS: 2720 PARTV-1975), Differential Free Swell Index (DFSI) Test (I.S: 2720 (Part-XL)-1977),Compaction Test IS: 2720 (PART-7)-1980), Unconfined Compression Test (IS: 2720(Part-10)-1991) and Scanning Electron Microscope studies (SEM) using FEI Quanta200 unit (Tables 1, 2 and 3).
3 Analysis of Test Results
The variation of Liquid Limit, Plastic Limit, Plasticity Index, Differential Free SwellIndex, Optimum Moisture Content, Maximum Dry Unit Weight and Strength of soiladmixtures are given in Figs. 1, 2, 3, 4, 5, 6 and 7 in the form of plots and thequantified values of respective properties are given in Tables 4, 5, 6, 7, 8 and 9.
Scanning Electron Microscope Analysis of Fly Ash 285
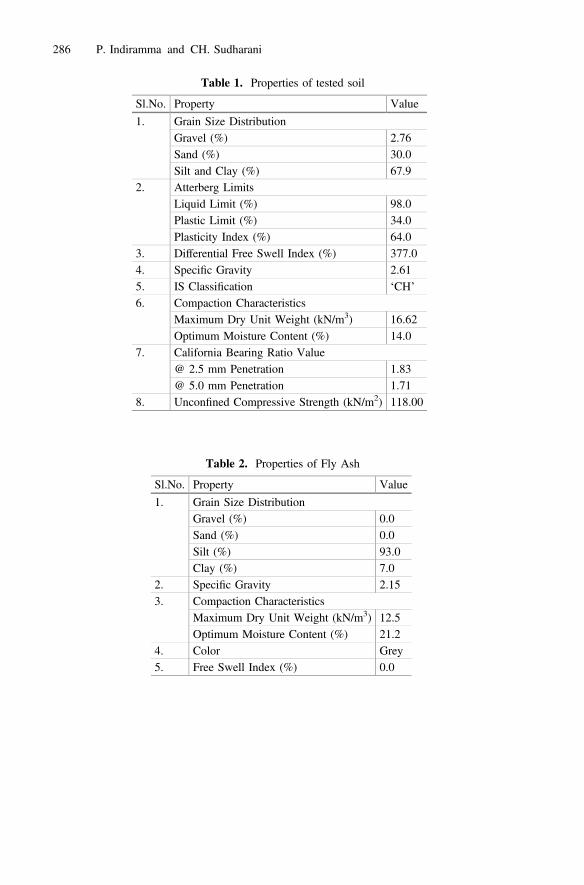
Table 1. Properties of tested soil
Sl.No. Property Value
1. Grain Size DistributionGravel (%) 2.76Sand (%) 30.0Silt and Clay (%) 67.9
2. Atterberg LimitsLiquid Limit (%) 98.0Plastic Limit (%) 34.0Plasticity Index (%) 64.0
3. Differential Free Swell Index (%) 377.04. Specific Gravity 2.615. IS Classification ‘CH’6. Compaction Characteristics
Maximum Dry Unit Weight (kN/m3) 16.62Optimum Moisture Content (%) 14.0
7. California Bearing Ratio Value@ 2.5 mm Penetration 1.83@ 5.0 mm Penetration 1.71
8. Unconfined Compressive Strength (kN/m2) 118.00
Table 2. Properties of Fly Ash
Sl.No. Property Value
1. Grain Size DistributionGravel (%) 0.0Sand (%) 0.0Silt (%) 93.0Clay (%) 7.0
2. Specific Gravity 2.153. Compaction Characteristics
Maximum Dry Unit Weight (kN/m3) 12.5Optimum Moisture Content (%) 21.2
4. Color Grey5. Free Swell Index (%) 0.0
286 P. Indiramma and CH. Sudharani
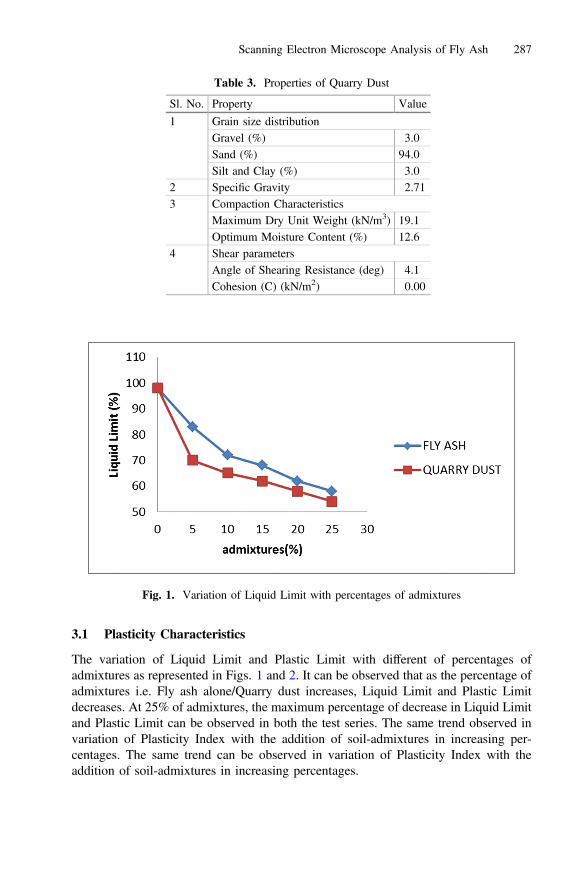
3.1 Plasticity Characteristics
The variation of Liquid Limit and Plastic Limit with different of percentages ofadmixtures as represented in Figs. 1 and 2. It can be observed that as the percentage ofadmixtures i.e. Fly ash alone/Quarry dust increases, Liquid Limit and Plastic Limitdecreases. At 25% of admixtures, the maximum percentage of decrease in Liquid Limitand Plastic Limit can be observed in both the test series. The same trend observed invariation of Plasticity Index with the addition of soil-admixtures in increasing per-centages. The same trend can be observed in variation of Plasticity Index with theaddition of soil-admixtures in increasing percentages.
Table 3. Properties of Quarry Dust
Sl. No. Property Value
1 Grain size distributionGravel (%) 3.0Sand (%) 94.0Silt and Clay (%) 3.0
2 Specific Gravity 2.713 Compaction Characteristics
Maximum Dry Unit Weight (kN/m3) 19.1Optimum Moisture Content (%) 12.6
4 Shear parametersAngle of Shearing Resistance (deg) 4.1Cohesion (C) (kN/m2) 0.00
Fig. 1. Variation of Liquid Limit with percentages of admixtures
Scanning Electron Microscope Analysis of Fly Ash 287

Reduction in Diffused Double Layer thickness and Clay percentage are responsiblefor decrease in Liquid Limit with increase the percentage of admixtures. The reductionin Plastic Limit of soil admixtures is due to filling of voids of flocculated soil therebyreducing water holding capacity.
3.2 Differential Free Swell Index
The swelling tendency of soils can be directly assessed by conducting Differential FreeSwell Index test. The swelling tendency of selected expansive soil is decreasing with
Fig. 2. Variation of Plastic Limit with percentages of admixtures
Fig. 3. Variation of Plasticity Index with percentages of admixtures
288 P. Indiramma and CH. Sudharani

addition of admixtures Fly ash or Quarry Dust as shown in Fig. 4. The Differential FreeSwell Index is observed to decrease with increase in percentage of admixtures due toprevailing of Divalent and Trivalent cations (Ca2+, Al3+, Fe3+ etc.,) increasing floc-culation of clay particles therby reducing surface area and water affinity of the soilsample.
Fig. 4. Variation of Differential Free Swell Index with percentages of admixtures
Fig. 5. Variation of Optimum Moisture Content with percentages of admixtures
Scanning Electron Microscope Analysis of Fly Ash 289

Fig. 6. Variation of Maximum Dry Unit Weight with percentages of admixtures
Fig. 7. Variation of Unconfined Compressive Strength with percentages of admixtures
290 P. Indiramma and CH. Sudharani

Table 4. Liquid Limit at different percentages of Fly Ash and Quarry Dust
Fly Ash (%) Liquid Limit (%) Quarry Dust (%) Liquid Limit (%)
0 98 0 985 83 5 7010 72 10 6515 68 15 6220 62 20 5825 58 25 54
Table 5. Plastic Limit at different percentages of Fly Ash and Quarry Dust
Fly Ash (%) Plastic Limit (%) Quarry Dust (%) Plastic Limit (%)
0 34 0 345 33 5 3210 31 10 3015 30 15 2820 29 20 2725 27 25 25
Table 6. Plasticity Index at different percentages of Fly Ash and Quarry Dust
Fly Ash (%) Plasticity Index (%) Quarry Dust (%) Plasticity Index (%)
0 64 0 645 50 5 3810 41 10 3515 38 15 3420 33 20 3125 31 25 29
Table 7. Differential Free Swell Index at different percentages of Fly Ash and Quarry Dust
Fly Ash(%)
Differential Free SwellIndex (%)
Quarry Dust(%)
Differential Free SwellIndex (%)
0 377 0 3775 320 5 29510 295 10 25015 280 15 21720 262 20 19025 250 25 148
Scanning Electron Microscope Analysis of Fly Ash 291

3.3 Compaction Characterstics
Figures 5 to 6 the Optimum Moisture Content is found to decrease and MDD toincrease with addition of Fly ash or Quarry Dust to the expansive soil. The increasingattractive pressure of soil particles minimizes dispersion thereby reducing and Opti-mum Moisture Content increasing Dry Unit Weight
4 Strength Characterstics
Figure 7, depicts the variation of unconfined compressive strength with increasingpercentages of Fly Ash or Quarry Dust to the soil. Maximum Unconfined Compressivestrength is observed at 25% of admixture addition to the soil due to reduction ofcohesion. Soil-Fly Ash strength is more compared to Soil-Quarry Dust strength.
5 Scanning Electron Microscope (SEM) Studies
Scanning Electron Microscope studies are conducted using Quatum 200 unit on soilalone, soil-Fly Ash and Soil-Quarry Dust admixtures for understanding the mechanismof behavior of soils with different additives at different percentages. Figures 8, 9 and 10shows Microscope analysis for soil alone, 10% Fly Ash + 90% Soil and 10% QuarryDust + 90% soil respectively. It is observed that structure of the soil has dispersed
Table 8. Optimum Moisture Content at different percentages of Fly Ash and Quarry Dust
Fly Ash (%) Optimum MoistureContent (%)
Quarry Dust (%) Optimum MoistureContent (%)
0 14 0 145 13.5 5 1310 13 10 12.715 12 15 12.420 12 20 1225 11.7 25 11.3
Table 9. Maximum Dry Unit Weight at different percentages of Fly Ash and Quarry Dust
Fly Ash (%) Maximum Dry UnitWeight (kN/m3)
Quarry Dust (%) Maximum Dry UnitWeight (kN/m3)
0 16.62 0 16.625 16.69 5 17.0010 16.91 10 17.2015 17.12 15 17.2920 17.18 20 17.5025 17.23 25 17.63
292 P. Indiramma and CH. Sudharani
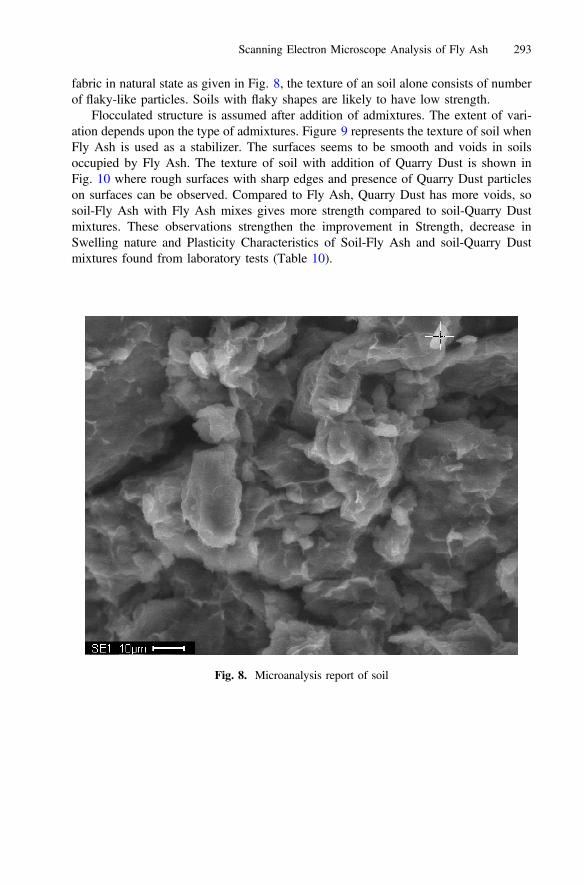
fabric in natural state as given in Fig. 8, the texture of an soil alone consists of numberof flaky-like particles. Soils with flaky shapes are likely to have low strength.
Flocculated structure is assumed after addition of admixtures. The extent of vari-ation depends upon the type of admixtures. Figure 9 represents the texture of soil whenFly Ash is used as a stabilizer. The surfaces seems to be smooth and voids in soilsoccupied by Fly Ash. The texture of soil with addition of Quarry Dust is shown inFig. 10 where rough surfaces with sharp edges and presence of Quarry Dust particleson surfaces can be observed. Compared to Fly Ash, Quarry Dust has more voids, sosoil-Fly Ash with Fly Ash mixes gives more strength compared to soil-Quarry Dustmixtures. These observations strengthen the improvement in Strength, decrease inSwelling nature and Plasticity Characteristics of Soil-Fly Ash and soil-Quarry Dustmixtures found from laboratory tests (Table 10).
Fig. 8. Microanalysis report of soil
Scanning Electron Microscope Analysis of Fly Ash 293

6 Conclusions
A series of laboratory tests were conducted to study the effect of Fly Ash and QuarryDust on Plasticity Characteristics, Differential Free Swell Index, Compaction Char-acteristics (MDD, OMC) Compressive Strength on selected expansive soil. Fly Ashand Quarry Dust were added in different percentages from 0–25% in increments of 5%.Based on the test results the Plasticity Characteristics indicated by Plasticity Index,Optimum Moisture Content and Differential Free Swell Index are observed to decreasewhereas Maximum Dry Unit Weight and Strength of soil admixtures increased withincrease in percentage of Fly Ash and Quarry Dust.
Table 10. Unconfined Compressive Strength at different percentages of Fly Ash and QuarryDust
Fly Ash (%) Unconfined CompressiveStrength (kN/m2)
Quarry Dust(%)
Unconfined CompressiveStrength (kN/m2)
0 10.6 0 10.65 18.1 5 15.010 22.5 10 18.615 25.0 15 18.920 34.6 20 21.225 42.2 25 22.1
Fig. 9. Microanalysis report of (Soil + 10% Fly Ash)
294 P. Indiramma and CH. Sudharani
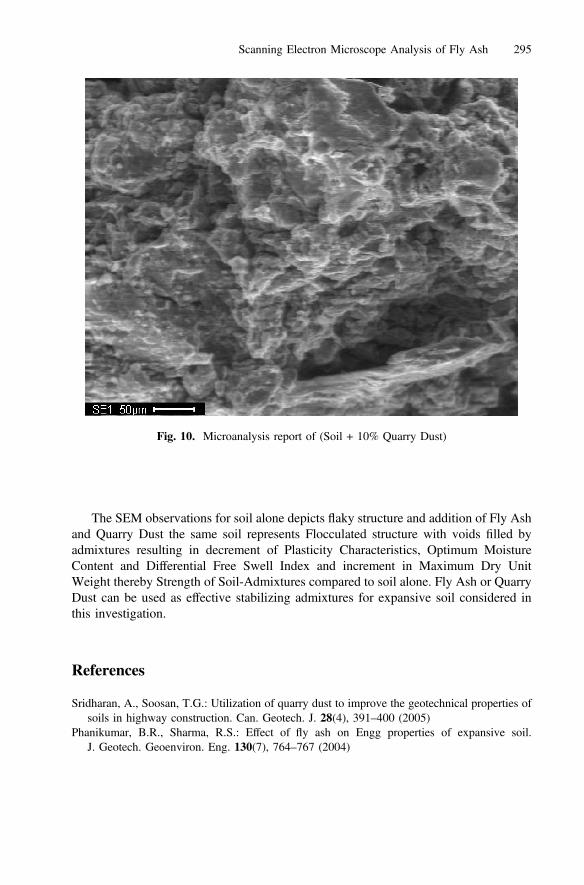
The SEM observations for soil alone depicts flaky structure and addition of Fly Ashand Quarry Dust the same soil represents Flocculated structure with voids filled byadmixtures resulting in decrement of Plasticity Characteristics, Optimum MoistureContent and Differential Free Swell Index and increment in Maximum Dry UnitWeight thereby Strength of Soil-Admixtures compared to soil alone. Fly Ash or QuarryDust can be used as effective stabilizing admixtures for expansive soil considered inthis investigation.
References
Sridharan, A., Soosan, T.G.: Utilization of quarry dust to improve the geotechnical properties ofsoils in highway construction. Can. Geotech. J. 28(4), 391–400 (2005)
Phanikumar, B.R., Sharma, R.S.: Effect of fly ash on Engg properties of expansive soil.J. Geotech. Geoenviron. Eng. 130(7), 764–767 (2004)
Fig. 10. Microanalysis report of (Soil + 10% Quarry Dust)
Scanning Electron Microscope Analysis of Fly Ash 295

Phanikumar, B.R., Sharma, R.S.: Volume change behavior of fly ash-stabilized clays. J. Mater.Civ. Eng. (ASCE) 19(1) (2007). doi:10.1061/(ASCE)0899-1561(2007)19:1(67)
Phanikumar, B.R.: Effect of lime and fly ash on swell, consolidation and shear strengthcharacteristics of expansive clays: a comparative study. Geomech. Geoeng. Int. J. 4(2), 175–181 (2009).
296 P. Indiramma and CH. Sudharani