scanpaths analysis with fixation maps to provide factors
TRANSCRIPT

Scanpaths Analysis with Fixation Maps toProvide Factors for Natural Gaze Control
Bum-Soo Yoo and Jong-Hwan Kim
Department of Electrical Engineering, KAIST, 335 Gwahangno,Yuseong-gu, Daejeon, Republic of Korea
{bsyoo,johkim}@rit.kaist.ac.kr
Abstract. Human-like gaze control is needed for robots to be compan-ions of humans. For human-like gaze control, much research has beenprogressing to identify factors that affect human gaze. The conventionalapproaches to discover factors that affect human gaze is based on theirhypotheses. They presented gaze control algorithm based on hypothesesand verified through experiments. However, since the algorithms wereoriginated from the hypotheses, they were prone to be biased to the hy-potheses. This paper derives the factors that affect human gaze based onobservation of real human’s scanpaths, not hypothesis. From the recordedscanpaths, fixation maps are produced using the Gaussian distribution.The earth mover’s distance (EMD) is used to measure similarity amongfixation maps, and the fixation map with minimal difference is selectedin each test image. The selected fixation maps are used to derive thefactors that affect human gaze. The derived factors are center, salientregions, human, depth, objects, scene schema information, and they areshown with examples.
Keywords: Gaze, attention, eye tracking, scanpaths, fixation map, earthmover’s distance.
1 Introduction
Robots will be partners in near future. As companions of humans, robotsshould make natural human robot interaction (HRI). Since gaze represents pay-ing attention, HRI should accompany with human-like gaze control.
For making natural gaze control, factors that affect human gaze are neededto be discovered. From the visual input, salient regions that are different withsurrounding in color, intensity, and orientation were detected as candidates forpaying attention. [1]. Effect of faces on the gaze was tested and showed thatpeople gazed faces independent with goals such as a finding objects [2]. Auditoryinformation was added to salient regions system to enhance the gaze control [3].These studies tried to make human-like gaze control based on their assumedfactors and showed effectiveness through experiments. Even though their studiesshowed good results, they are prone to be biased to their assumed factors.
In this paper, factors that affect human gaze are identified from observation ofhuman’s scanpaths. From measured scanpaths, fixation maps are generated with
2 Bum-Soo Yoo and Jong-Hwan Kim
the Gaussian distribution. The produced fixation maps are compared with eachother by the EMD to find commonly gazed directions in each test image. Amongvarious EMD measurements, the EMD with threshold is used. The fixation mapsare generated from 79 images with 53 subjects, and one fixation map is selectedfrom each image. The selected fixation maps are analyzed to find factors thataffect human gaze. Results are presented with example images.
The paper is organized as follows. Section II describes fixation maps andimage comparison methods including the EMD. Section III describes the ex-periments with analysis and concluding remarks on Section IV.
2 Scanpath Comparison
2.1 Fixation Map
To find where people gaze, it is necessary to measure similarity among humanscanpaths. There are two categories for measuring similarity among scanpaths.The first method is based on string comparison methods. Images are quantizedwith cells and different letters are assigned to each cell. When a scanpath isproduced, a sequence of cells is generated according to the scanpath, and itcan be replaced by a string of the assigned letters. As a result, the scanpathis transformed to the string, and then it can be compared by various stringcomparison methods.
The other method is based on map comparison methods. On a two-dimensionalimage, an index describing how much human gaze the location is added as thez-axis to make the three-dimensional image. The generated three-dimensionalimages can be compared by map comparison methods. Transforming into a maphas a strong point of visualization. However, it has a shortcoming of loss ofsequential information.
In this paper, scanpaths are compared by producing fixation maps. The fix-ation map is a three-dimensional record of locations of all fixations being ana-lyzed with the third dimension representing the quantity of property d obtainedfrom that fixations [4]. For making a fixation map, the z-axis is added to two-dimensional images, and all z values are initialized to zero. When scanpaths aregenerated, the Gaussian distribution is assigned to each fixation points in thescanpaths. This process is repeated to all fixations, and it will make the Gaus-sian mixture model. Finally, the z values are normalized. Note that sequentialinformation is discarded since orders of human scanpaths is hard to predict inimages [5], [6]. Fig. 1 shows generated fixation maps. The fixation maps in thethird rows are generated from the images in the first row. The second row showsimages which the z values are changed to luminance for the visualization.
2.2 Comparison Method
The EMD is used to measure similarity among fixation maps. The EMD can bedescribed as the minimal cost that must paid to transform from one histogram

Scanpaths Analysis with Fixation Maps to Provide Factors for Gaze Control 3
Fig. 1: Fixation maps.
to other histogram. Given two histograms P and Q, the EMD is defined as [7]:
EMD(P,Q) = (minfij
∑i,j
fijdij)/(∑i,j
fij) s.t fij ≥ 0 (1)
∑j
fij ≤ Pi,∑i
fij ≤ Qj ,∑i,j
fij = min(∑i
Pi∑j
Qj)
where fij is the amount of transported from the i-th bin to the j-th bin and dijis the ground distance between the i-th bin to the j-th bin. As other version ofthe EMD, the EMD is used in this paper. The EMD is defined as [8], [9]:EMDα(P,Q) = (min
fij
∑i,j
fijdij) + |∑i
Pi −∑j
Qi|αmaxi,j
dij (2)
where the EMD can be used as a metric when α ≥ 0.5. Compared to the EMD,the EMD shows faster and better performance. For better performance, dij inboth (1) and (2) can be modified as:
dt(a, b) = min(da,b, t). (3)
By applying (3), connections from P to Q are simplified, and the algorithmsbecome faster [9].
3 Experiments
3.1 Eye Tracking Experiments
The scanpath measurements were performed on 79 images with 53 people.Totally, 4, 187 fixation maps were produced. Eyes fixations were recorded with

4 Bum-Soo Yoo and Jong-Hwan Kim
Fig. 2: Examples of selected images.
the Tobii T120 eye tracker. It is an integration of an eye tracker with a 17 inchmonitor. The accuracy is about 0.5 ◦, drift is about 0.1 ◦ and spatial resolutionis about 0.3 ◦. It can display images up to the size of 1280×1024. In the exper-iments, the images were tuned to the size of 640×480 and used. The subjectswere 37 male and 16 female, from 17 to 30. They were instructed to look atthe monitor without any comments. The images were shown five seconds withfive seconds breaks sequentially. Due to fatigue of eyes and sampling quality, aminute break was added in every 10 picture. At the beginning and after the oneminute breaks, five points calibration was performed.
Images were randomly selected from the MIT Judd’s 2009 and 2012 data sets[10], [11]. The image sets, created as saliency benchmark data sets, contains morethan thousands of free-viewed indoors and outdoors images. The selected imageswere adjusted to contain similar number of the images of buildings, animals,landscapes, sports, night views, person, people and close-shots. Fig. 2 showsseveral examples of selected images. The size of images was tuned to 640×480.
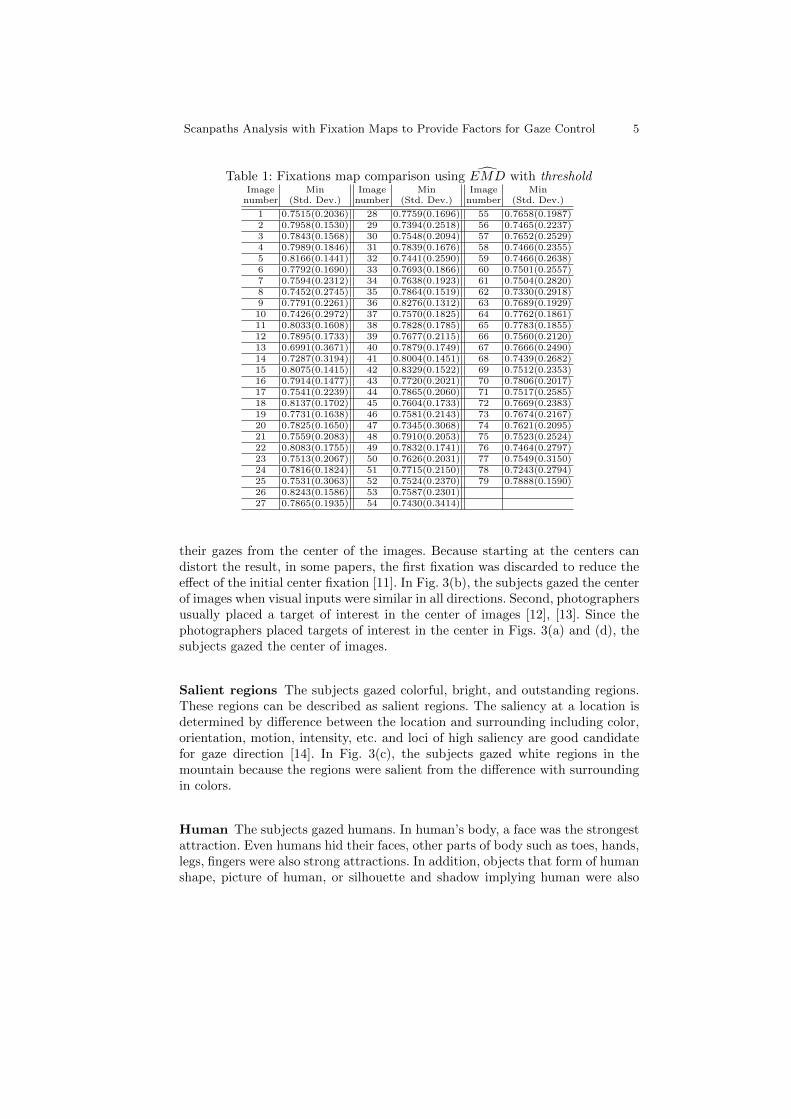
Comparisons among fixation maps were performed with the EMD withthreshold. Table 1 shows the comparison results with the minimum EMD andthe standard deviation. Since the EMD represents the cost of the transforma-tion, smaller number means two fixation maps are more similar. The outputsof the cost function in the EMD were normalized to have average one in eachimage. After the normalization, the average difference with others in each imagewas calculated and compared.
3.2 Analysis
From each image, a fixation map with the largest similarity was selected. Theselected fixation maps were used to derive the factors that affect human gaze.
Center Fixation maps were biased to the center of images. There were tworeasons why the subjects gazed the center of images. First, the subjects started
Scanpaths Analysis with Fixation Maps to Provide Factors for Gaze Control 5
Table 1: Fixations map comparison using EMD with thresholdImage Min Image Min Image Minnumber (Std. Dev.) number (Std. Dev.) number (Std. Dev.)
1 0.7515(0.2036) 28 0.7759(0.1696) 55 0.7658(0.1987)2 0.7958(0.1530) 29 0.7394(0.2518) 56 0.7465(0.2237)3 0.7843(0.1568) 30 0.7548(0.2094) 57 0.7652(0.2529)4 0.7989(0.1846) 31 0.7839(0.1676) 58 0.7466(0.2355)5 0.8166(0.1441) 32 0.7441(0.2590) 59 0.7466(0.2638)6 0.7792(0.1690) 33 0.7693(0.1866) 60 0.7501(0.2557)7 0.7594(0.2312) 34 0.7638(0.1923) 61 0.7504(0.2820)8 0.7452(0.2745) 35 0.7864(0.1519) 62 0.7330(0.2918)9 0.7791(0.2261) 36 0.8276(0.1312) 63 0.7689(0.1929)10 0.7426(0.2972) 37 0.7570(0.1825) 64 0.7762(0.1861)11 0.8033(0.1608) 38 0.7828(0.1785) 65 0.7783(0.1855)12 0.7895(0.1733) 39 0.7677(0.2115) 66 0.7560(0.2120)13 0.6991(0.3671) 40 0.7879(0.1749) 67 0.7666(0.2490)14 0.7287(0.3194) 41 0.8004(0.1451) 68 0.7439(0.2682)15 0.8075(0.1415) 42 0.8329(0.1522) 69 0.7512(0.2353)16 0.7914(0.1477) 43 0.7720(0.2021) 70 0.7806(0.2017)17 0.7541(0.2239) 44 0.7865(0.2060) 71 0.7517(0.2585)18 0.8137(0.1702) 45 0.7604(0.1733) 72 0.7669(0.2383)19 0.7731(0.1638) 46 0.7581(0.2143) 73 0.7674(0.2167)20 0.7825(0.1650) 47 0.7345(0.3068) 74 0.7621(0.2095)21 0.7559(0.2083) 48 0.7910(0.2053) 75 0.7523(0.2524)22 0.8083(0.1755) 49 0.7832(0.1741) 76 0.7464(0.2797)23 0.7513(0.2067) 50 0.7626(0.2031) 77 0.7549(0.3150)24 0.7816(0.1824) 51 0.7715(0.2150) 78 0.7243(0.2794)25 0.7531(0.3063) 52 0.7524(0.2370) 79 0.7888(0.1590)26 0.8243(0.1586) 53 0.7587(0.2301)27 0.7865(0.1935) 54 0.7430(0.3414)
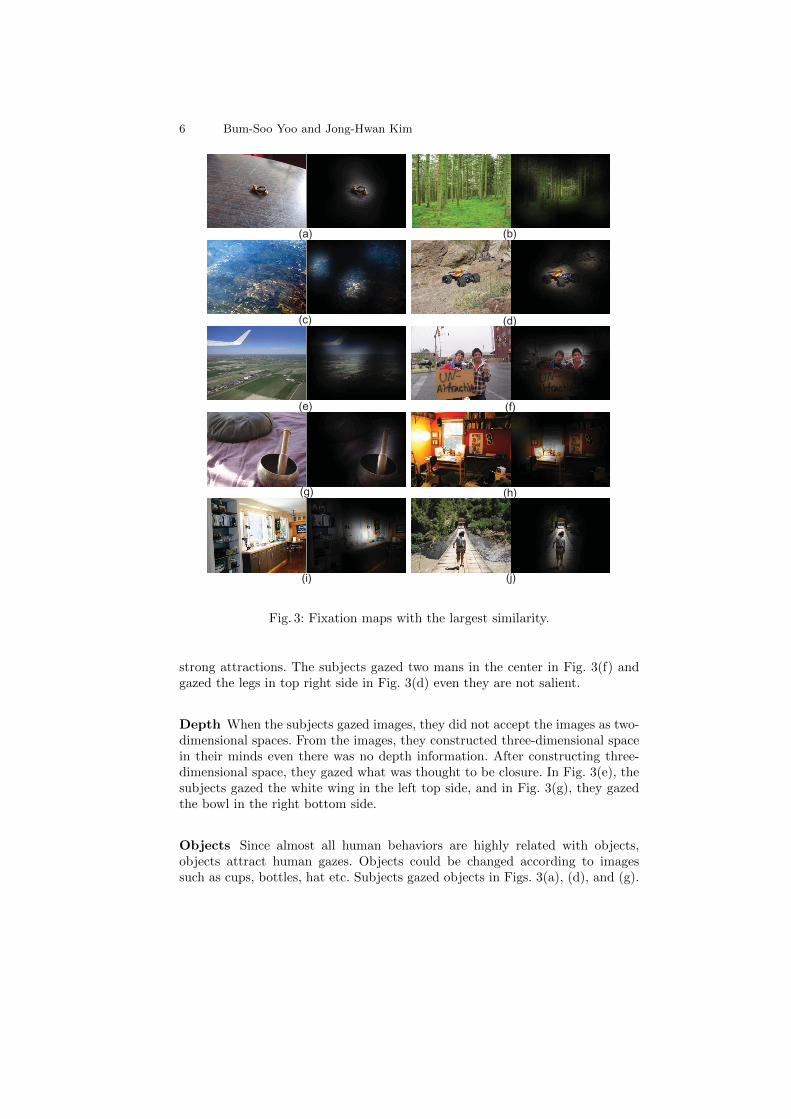
their gazes from the center of the images. Because starting at the centers candistort the result, in some papers, the first fixation was discarded to reduce theeffect of the initial center fixation [11]. In Fig. 3(b), the subjects gazed the centerof images when visual inputs were similar in all directions. Second, photographersusually placed a target of interest in the center of images [12], [13]. Since thephotographers placed targets of interest in the center in Figs. 3(a) and (d), thesubjects gazed the center of images.
Salient regions The subjects gazed colorful, bright, and outstanding regions.These regions can be described as salient regions. The saliency at a location isdetermined by difference between the location and surrounding including color,orientation, motion, intensity, etc. and loci of high saliency are good candidatefor gaze direction [14]. In Fig. 3(c), the subjects gazed white regions in themountain because the regions were salient from the difference with surroundingin colors.
Human The subjects gazed humans. In human’s body, a face was the strongestattraction. Even humans hid their faces, other parts of body such as toes, hands,legs, fingers were also strong attractions. In addition, objects that form of humanshape, picture of human, or silhouette and shadow implying human were also
6 Bum-Soo Yoo and Jong-Hwan Kim
Fig. 3: Fixation maps with the largest similarity.
strong attractions. The subjects gazed two mans in the center in Fig. 3(f) andgazed the legs in top right side in Fig. 3(d) even they are not salient.
Depth When the subjects gazed images, they did not accept the images as two-dimensional spaces. From the images, they constructed three-dimensional spacein their minds even there was no depth information. After constructing three-dimensional space, they gazed what was thought to be closure. In Fig. 3(e), thesubjects gazed the white wing in the left top side, and in Fig. 3(g), they gazedthe bowl in the right bottom side.
Objects Since almost all human behaviors are highly related with objects,objects attract human gazes. Objects could be changed according to imagessuch as cups, bottles, hat etc. Subjects gazed objects in Figs. 3(a), (d), and (g).
Scanpaths Analysis with Fixation Maps to Provide Factors for Gaze Control 7
Scene schema information People can understand environment and knowwhere attractions are usually placed. For example, objects are placed mainly onthe ground or on the table, not in the sky. In Figs. 3(h) and (i), the subjectsrecognized the table and knew that objects were usually placed on the table.Thus, they gazed upper side of the table where attractions were probably placedrather than the salient bright windows.
Expectation Expectation from images affected human gazes. When there wasan object which was not adequate to environment, the subjects gazed the object[15]. For example, a machine tool in a kitchen attracts gazes with curiosity ofwhy the tool is in the kitchen. Forecasted situation also affected human gazes.When the subjects gazed a man walking along the bridge in Fig. 3(j), they gazedthe gate in front of the bridge.
4 Conclusion
This paper showed the factors that affect human gaze by analyzing the scan-paths. From measured scanpaths of 53 subjects with 79 images, the Gaussiandistribution was used to make fixation maps. The generated fixation maps werecompared by the EMD with threshold, and the fixation map with the minimaldifference was selected from each test image. Analysis of the selected fixationmaps showed the center of images, salient regions, human, depth, objects, sceneschema information and expectation affected human gazes. If these factors areconsidered in the design of the gaze control, robot’s gaze would be natural andsimilar to human gaze.
Acknowledgement
This research was supported by the MOTIE (The Ministry of Trade, Indus-try and Energy), Korea, under the Technology Innovation Program supervisedby the KEIT (Korea Evaluation Institute of Industrial Technology)(10045252,Development of robot task intelligence technology that can perform task morethan 80% in inexperience situation through autonomous knowledge acquisitionand adaptational knowledge application).
This research was supported by the MOTIE (The Ministry of Trade, In-dustry and Energy), Korea, under the Human Resources Development Programfor Convergence Robot Specialists support program supervised by the NIPA(National IT Industry Promotion Agency)(H1502-13-1001, Research Center forRobot Intelligence Technology).
References
1. Itti L, Koch C (2000) A saliency-based search mechanism for overt andcovert shifts of visual attention. Vision Res 40(10):1489-1506. doi:10.1016/S0042-6989(99)00163-7

8 Bum-Soo Yoo and Jong-Hwan Kim
2. Cerf M, Harel J, Einhauser W, Koch C (2008) Predicting human gaze using low-level saliency combined with face detection. Adv Neur In 20: 241-248.
3. Ruesch J, Lopes M, Bernardino A et al (2008) Multimodal saliency-based bottom-up attention a framework for humanoid robot iCub. Papers presented at the IEEEConf Robotics and Automation, Pasadena, CA, USA, 962-967 May 2008
4. Wooding DS (2002) Eye movement of large populations: II. Deriving regionsof interest, coverage, and similarity using fixation maps. Behav Res Meth Instr34(4):518-528. doi:10.3758/BF03195481
5. Privitera CM, Stark LW (2000) Algorithms for defining visual regions-of-interest:Comparison with eye fixations. IEEE Trans Pattern Anal Mach Intell 22(9):970-982. doi:10.1109/34.877520
6. Yarbus AL (1967) Eye movement and Vision. Academy of Sciences of the USSR,Moscow. English edition: Haigh B (1967) Eye movement and Vision (trans: HaighB). Plenum Press, New York
7. Rubner Y, Tomasi C, Guibas LJ (2000) The earth mover’s distance as a metric forimage retrieval. Int J Comput Vision 40(2):99-121. doi:10.1023/A:1026543900054
8. Pele O, Werman M (2008) A linear time histogram metric for improved sift match-ing. Paper presented at the European Conf on Computer Vision, Marseille, France,495-508 Oct 2008
9. Pele O, Werman M, (2009) Fast and robust earth mover’s distances. Papers pre-sented at the Int Conf on Computer Vision, Kyoto, Japan, 460-467 Oct 2009
10. Judd T, Durand F, Torralba A (2012) A benchmark of computational models ofsaliency to predict human fixations. MIT tech report
11. Judd T, Ehinger K, Durand F, Torralba A (2009) Learning to predict where hu-mans look. Paper presented at the Int Conf on Computer Vision, Kyoto, Japan,2106-2113 Oct 2009
12. Zhang L, Tong MH, Marks TK et al (2008) SUN: A Bayesian framework for saliencyusing natural statistics. J Vision 8(7):1-20. doi:10.1167/8.7.32
13. Talter BW (2007) The central fixation bias in scene viewing: Selecting an optimalviewing position independently of motor biases and image feature distribution. JVision 7(14):1-17. doi:10.1167/7.14/4
14. Koch C, Ullman S (1985) Shifts in selective visual attention: towards the underlyingneural circuitry. Hum Neurobiol 4:219-227. doi:10.1007/978-94-009-3833-5 5
15. Summerfield C, Egner T (2009) Expectation (and attention) in visual cognition.Trends Cogn Sci 13(9):403-409. doi:10.1016/j.tics.2009.06.003