scatterplots are used to investigate and describe the relationship between two numerical variables...
TRANSCRIPT

Scatterplots are used to investigate and describe the relationship between two numerical variables When constructing a scatterplot it is conventional to use the vertical axis for the dependent variable (DV) and the horizontal axis for the independent variable (IV). To construct a scatterplot using the calculator follow the steps on pg 105 of your text.
How to interpret a scatterplot
The features of a scatterplot are able to provide information which allow us to draw conclusions based on the data. This helps us indentify and describe a relationship between the variables. To do this;
Identify whether the graph shows a pattern. The presence of a pattern indicates a relationship, connection or association between the variables.
Certain patterns tell us that relationships exist between the two variables. This is referred to as a correlation. We look at what type of correlation exists and how strong it is.
No pattern suggests that there is no relationship.

When describing the relationship between two variables displayed on a scatterplot, we need to comment on:
(a) the direction — whether it is positive or negative
(b) the form — whether it is linear or non-linear(c) the strength — whether it is strong,
moderate or weak(d) possible outliers

Direction & Outliers
Random scatter of points.
No relationship between the variables Height and Age.
Possible outlier -203 cm tall

Positive relationship between the variables.
Tall players tend to be heavy and vice versa. No apparent outliers.

Negative relationship between variables.
Countries with high working hours tend to have low university participation rates and vice versa.
No apparent outliers.

Direction and outliers:If the trend appears to follow an upward
direction, a positive relationship is present. As x increases, y also increases.
If the trend appears to follow a downward direction, a negative relationship exists. As x increases, y decreases.
Always comment on the presence of an outlier if they appear. This can effect the r value later on.
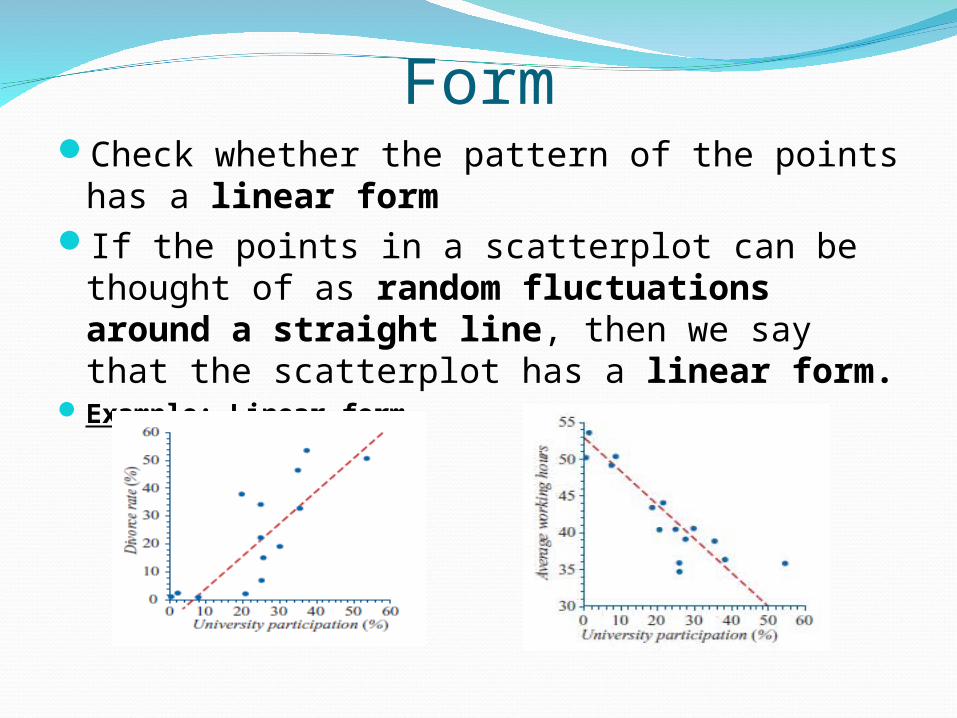
FormCheck whether the pattern of the points has a
linear formIf the points in a scatterplot can be thought
of as random fluctuations around a straight line, then we say that the scatterplot has a linear form.
Example: Linear form

Example: Non-linear form
If non-linear, you cannot proceed from this point.
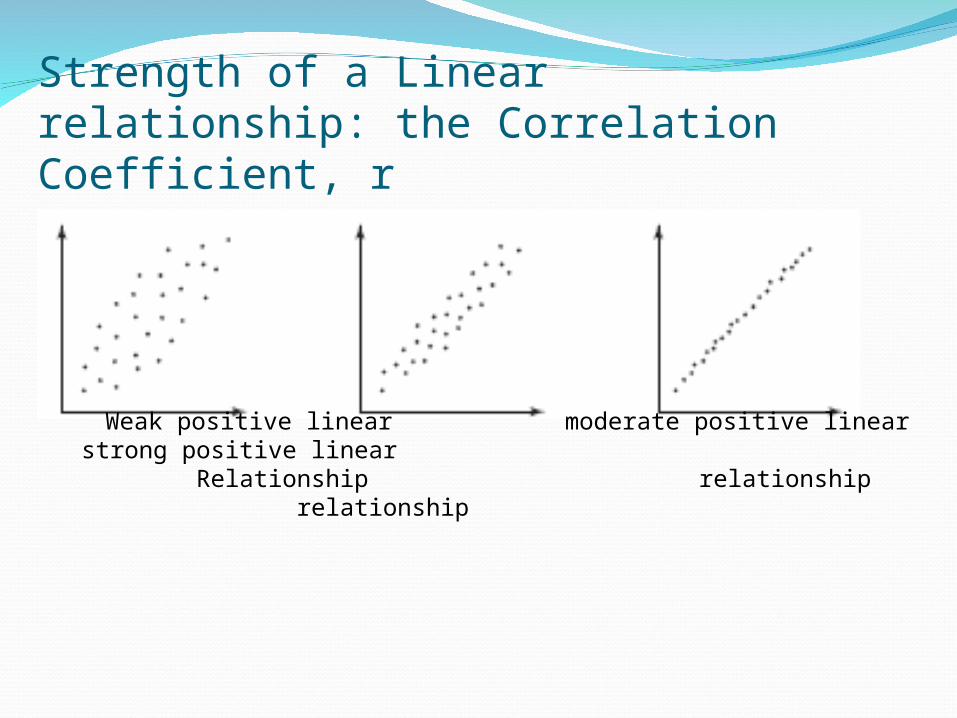
Strength of a Linear relationship: the Correlation Coefficient, r
Weak positive linear moderate positive linear strong positive linear Relationship relationship relationship
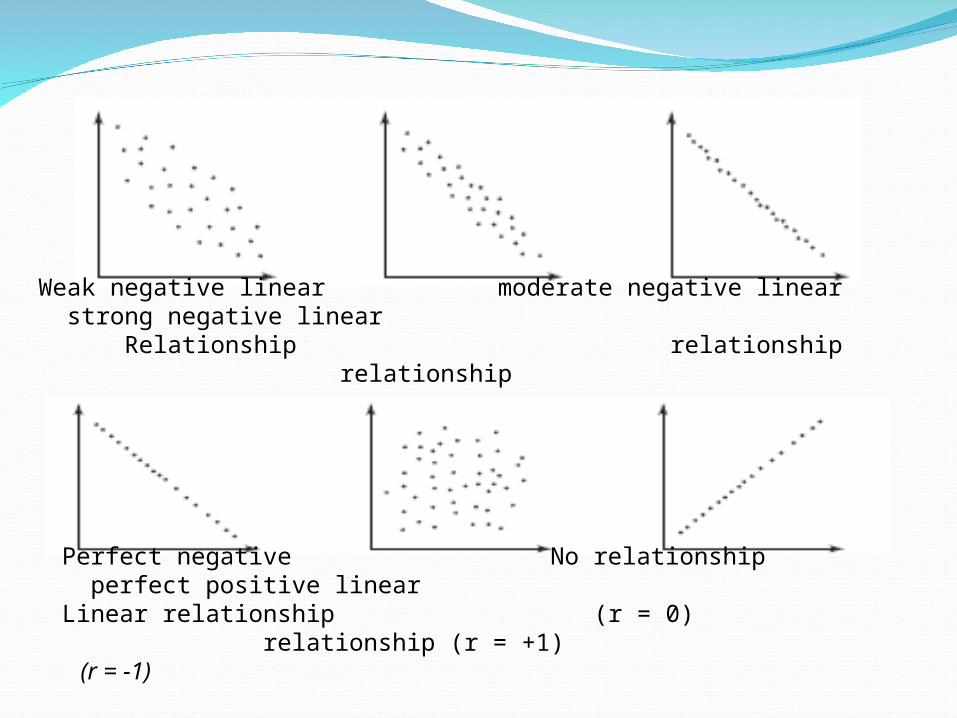
Weak negative linear moderate negative linear strong negative linear Relationship relationship relationship
Perfect negative No relationship perfect positive linear Linear relationship (r = 0) relationship (r = +1) (r = -1)

4.6 Pearson’s product–moment correlation coefficient, rThe correlation coefficient is used to measure
the strength of a linear relationship between two variables.
The symbol for Pearson’s product–moment correlation coefficient is r.
The value of r can be estimated from the scatterplot –1 ≤ r ≤ 1

Examples
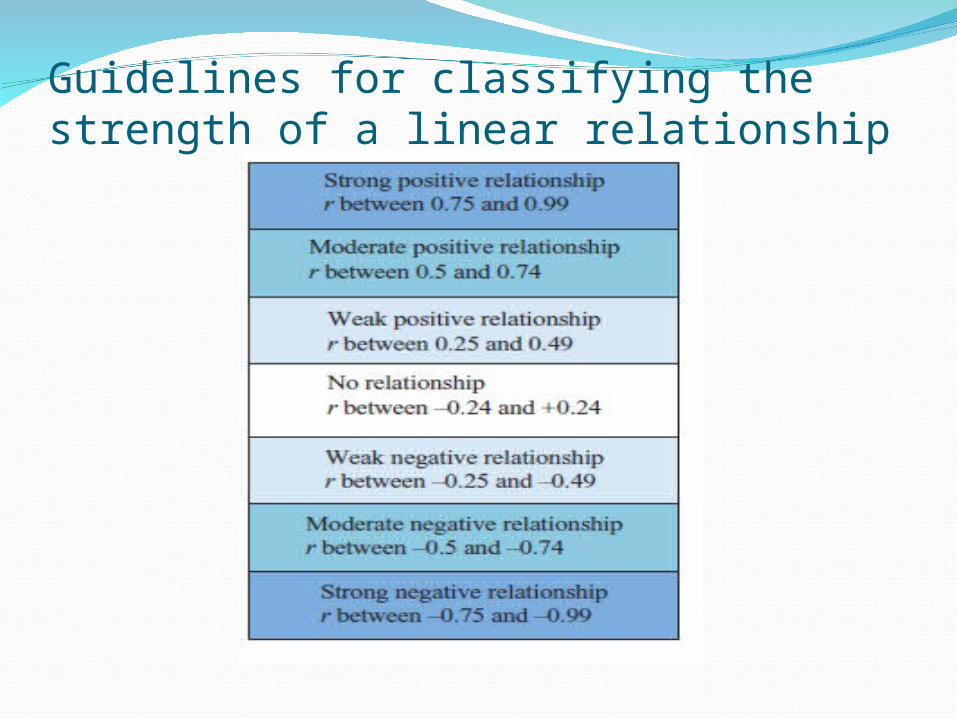
Guidelines for classifying the strength of a linear relationship
Warning!!!If you are using the value of the correlation
coefficient r as a measure of the strength of a relationship, then you are implicitly assuming:
The variables are numericThe relationship is linearThere are no outliers in the data. The
correlation coefficient can give a misleading indication of the strength of the linear relationship if there are outliers present.