scb_081947
TRANSCRIPT

AUGUST 1947
SURVEY OF
CURRENTBUSINESS
UNITED STATES DEPARTMENT OF COMMERCE
BUREAU OF FOREIGN AND DOMESTIC COMMERCE
Digitized for FRASER http://fraser.stlouisfed.org/ Federal Reserve Bank of St. Louis

Survey of
CURRENTBUSINESS
VOLUME 27, No. 8 AUGUST 1947
( Statutory Functions: "The Bureau of Foreign and Domestic Commerce...to foster, promote, and develop the foreign and domestic commerce ofthe United States'9 [Law creating the Bureau Aug. 23, 1912 [37 Stat. 408].].
Contents
Page
THE BUSINESS SITUATION 1
National Product and Income in the First Half of 1947. • 4
Redemption of Armed Forces Leave Bonds 7
STATE INCOME PAYMENTS IN 1946 9
STATISTICAL DATAi
Monthly Business Statistics. S-l to S-40Statistical Index * Inside back cover
Classification ofStatistical Sections
PageBusiness indexes . . . . . . . . . . * • . . . . . • S—lBusiness population S-3Commodity prices S-3Construction and real e s t a t e . . . . . . . . . . . . . . S—5Domest ic trade. S -6E m p l o y m e n t c o n d i t i o n s a n d w a g e s . . * . * . . * S—9Finance S-15Foreign trade S-20Transportation and c o m m u n i c a t i o n s . . * . . * 3*21Commodity sectionsi
Chemicals and allied products S-23Electric power and gas S-25Foodstuffs and t o b a c c o . . . . . . . . . . . . . . . . . S—26Leather and p r o d u c t s . . . . . . . . . . . . . . . . . . . S-29Lumber and manufactures . . . . . . . . . * . . . . S—30Metals and manufactures:g Iron and steel • S-31
N on ferrous metals and products S-32Machinery and apparatus 8-33
Paper and printing.... S—34Petro leum and coal products S-35Rubber and rubber products . S-37Stone , clay, and glass products . . . . . . . . . . S-37Textile products S—38Transportation equ ipment S-40
Canadian stat ist ics S-40
( 1 1 O 1(3—Contents of this publication are not copyrighted and [1may be reprinted freely. Mention of source will be appreciated^ Jr
Published by the Department of Commerce, W. AVERELL IlARRIMAN, Secretary—Office ofBusiness Economics, AMOS E. TAYLOR, Director. Subscription price, including weeklystatistical supplement, $3 a year; Foreign $4. Single copies, 25 cents. Make remittancesdirect to the Superintendent of Documents, United States Government Printing Office,Washington 25, D. C.
Digitized for FRASER http://fraser.stlouisfed.org/ Federal Reserve Bank of St. Louis

Chart L-COMPOSITION OF GROSSNATIONAL PRODUCTBILLIONS OF DOLLARS
1 0 0
7 5 \ PERSOj LX
5 0
2 5
o, i \ r
SJAL CONSUMPTION \PENDITURES^r^"^ i
150
100
7 5
5 0
2 5
\ . 0
0, U
2 5
GROSS PRIVATE * .DOMESTIC INVESTMENT I
.j \ L , 0
NET FOREIGN
0 ,vCVJffiftSffiftl&y*'*'
_XP, o
100
75
50
25
j GOVERNMENT PURCHASES* '
J
2 5
*GOODS AND SERVICES.
1945 1946QUARTERLY TOTALS, SEASONALLY
ADJUSTED, AT ANNUAL RATE
1947
47-400
755297—47-
The
Business SituationBy the
Office of Business Economies
FIRMING of commodity prices during July was accompaniedby seasonal declines in retail trade and manufacturing
activity. At the same time, total employment was at a highpoint, as a result of the summer rise in agriculture, construction,and various service trades, and the flow of personal income wasbeing bolstered by further upward adjustment of wage rates.
With consumer, business, and foreign demand remaining rela-tively steady, apart from seasonal influences, and with Govern-ment purchases showing only minor variations, there was appar-ently little change—other than that resulting from the upwarddrift of prices—in the aggregate value of production as the econ-omy entered the second half of the year. In the second quarterof 1947 gross national product was at an annual rate of 226billion dollars, according to the estimates presented in this issue.This dollar rate is somewhat higher than the war peak, reflect-ing the substantial price increases during the postwar period.
The recent advances in the weekly wholesale price index haveoccurred not merely in the volatile farm and food sectors, but inthe industrial sector as well. Thus, the 3-month period of rela-tive steadiness in the over-all price index for commodities otherthan farm products and foods was terminated in July as newincreases were made effective for a wide range of industrialproducts. Among the increases which will affect raw materialcosts for an important segment of industry was the advance inprices of principal steel products, amounting to about 6 dollarsa ton, on the average.
Inventory Rise Slackens, Foreign Investment Stepped Up
Data now available covering the second quarter show themagnitude of the counterbalancing changes that served to sus-tain private expenditures. On the downside was the decline inthe rate of inventory accumulation which, on a national productbasis, dropped from an annual rate of 2.7 billion dollars in thefirst quarter to 1.5 billion dollars in the second quarter. Themonth-to-month changes in the book value of total businessinventories were minor in both May and June, with actual de-clines—largely seasonal—being recorded at the distributive levelin the 2 months.
On the upside, net foreign investment in the second quarterrose to 10.6 billion dollars, at seasonally adjusted annual rates,an increase more than sufficient to offset the drop in net inven-tory buying. Although the value of shipments abroad in Junewas lower than in the 3 preceding months, it seems that thedecline was associated with the 3-day work stoppage at manyocean ports.
Developments in International Field
There were two significant economic events in the interna-tional field in July: First, the establishment of convertibility ofsterling received by other countries in payment for exports of
1Digitized for FRASER http://fraser.stlouisfed.org/ Federal Reserve Bank of St. Louis

SURVEY OF CURRENT BUSINESS August 1947
goods and services to the United King-dom; and, second, the sale of debenturesby the International Bank for Recon-struction and Development.
The requirement to convert sterlingpaid out on current transactions intodollars or other "hard" currencies begin-ning with July 15, 1947, is part of theloan agreement between the UnitedStates and the United Kingdom whichwas signed on July 15, 1946. The lateststep makes currently earned sterling bal-ances generally transferable in worldtrade even when the United Kingdom isnot a partner. Over the last severalmonths, however, the list of countrieswhose sterling receipts could be con-verted had been gradually extended, sothat only very few additional countriesremained to be added when the deadlineof July 15th arrived. It is important tonote that the obligation to exchangedollars for sterling does not apply to pre-vious obligations, particularly to sterlingobligations incurred during the war, ex-cept in so far as specific agreementswith the creditor countries made themconvertible. At the present time the loanarrangement with the United States ismeeting the current deficit, but thesedollar resources are being depleted at amore rapid rate than contemplated atthe time the loan was negotiated, for avariety of reasons. These include theinability of the United Kingdom to meetthe projected export schedule at thesame time that increased prices of goodsobtained from the United States andother countries raised the expendituresfor imports.
Initial Borrowing by International Bank
A new source of dollars for foreigncountries was opened up by the success-ful first offering in July of 250 milliondollars of debentures by the Interna-tional Bank for Reconstruction and De-velopment. Two types of bonds were is-sued in the amounts of 100 milliondollars at 2*4 percent for 10 years and150 million dollars at 3 percent for 25years. Both issues were admitted atonce to trading on the New York StockExchange where they were quoted at apremium.
The 250 million dollars would meet thebank's requirements for the recentlygranted loan to Prance in the sameamount. Further bond issues, and the725 million dollars obtained from themembers' subscriptions (including 635million dollars from the United States)would be required to meet additional re-quirements when action is taken on fur-ther loan requests which so far amount toover 2 billion dollars.
Construction Activity Up, Awards LagOn the construction front, activity
continues to show the usual seasonalgains, with the largest relative increasesoccurring in residential building andpublic highway construction. The cum-ulative dollar value of new constructionthis year through July was 35 percentabove the value in the same period of1946. The year-to-year gains in Juneand July were 22 and 16 percent, respec-tively.
Both the number of new permanentprivate dwelling units started and thenumber completed in June were higherthan in the preceding month. June"starts" totalled 75,000, probably thehighest for any month since the periodof the twenties, and completions were63,000.
The value of contract awards for con-struction declined from May to June toabout the same volume as in March andApril, even though some rise is normallyexpected during this season of the year.For the first half of the year, the totalvalue of contract awards was about 10percent below the value in the sameperiod a year ago. Awards for nonresi-dential building, due partly to official re-strictions in effect this year, were almostone-fourth less than last years' volume,but contracts for public utilities andheavy engineering construction wererunning ahead of a year ago.
Little Change in Retail Sales
Retail sales have shown the least va-riation since the first of the year of allelements in the total demand picture.June sales, at a seasonally adjusted an-nual rate of 106 billion dollars, were atabout the same rate as in the 2 pre-ceding months and 15 percent above thefigure for June 1946.
The major area of strength in the salespicture continued to be in the durablegoods group. Sales at home furnishingsand building materials and hardwarestores advanced 10 and 5 percent, re-spectively, from May to June, after ad-justment for seasonality. Automotivedealers reported little change, however,due to the lower volume of new car de-liveries in the latest months.
Sales at nondurable goods stores weregenerally unchanged in June, althoughsome falling off in business volume wasnoticeable at eating and drinking places.The year-to-year gain for the nondur-able goods group was smaller than inthe preceding month even though foodsales in June 1946 were held down bythe limited meat supply.
Pick-up in Department Store Orders
As already noted, the accumulation ofinventories by department stores and
other retail outlets was halted during thesecond quarter of the year. This devel-opment came about as a result of theshift in buying policy instituted by thelarger merchandisers in the latter partof 1946, as a result of developmentswhich influenced other retailers withsome lag. Late this spring, however,there was evidence that this policy hadproduced the desired stock-sales ratiosin some segments so that new ordersbegan to pick up to a point more in linewith current sales. The widespread re-newal of summer sales indicates the re-turn of prewar policies of not carryingover seasonal merchandise, but theseclearances are being accompanied by thebuilding up of fall stocks.
Federal Reserve Board statistics cover-ing stocks, sales, and outstanding ordersof 296 large department stores indicatean increase in new orders in both Mayand June from the low point reached inApril. Although some pick-up in orderplacing is customarily expected at thistime, the increase this year was largerpercentagewise than that which tookplace between April and June a year ago.The rise in new orders, in addition to thelow level of merchandise receipts in June,brought about the first increase in totaloutstanding commitments of these storessince the first of the year.
Industrial Production Edges Downward
Industrial production continued toedge downward in June and July, chieflyas a result of slackening activity in somenondurable goods manufacturing indus-tries and the temporary slow down insteel operations which stemmed fromuncertainty over the signing of the newwork contract in the coal industry. TheFederal Reserve Board seasonally ad-justed index of nondurable goods manu-facturing at midyear was about 5 per-cent below the first quarter average.Durable goods manufacturing showedonly minor variations over the half-yearperiod, with supply difficulties still limit-ing the output of finished goods. Assem-blies of passenger cars and trucks, forexample, dropped from 398,000 in Juneto about 380,000 units in July, or 4 per-cent, despite the fact that there was onemore working day in the latter month.On a daily average basis, output in Julywas the lowest since January.
The dollar value of manufacturers*shipments was lower in June than in thepreceding 2 months, but the index ofshipments, which is adjusted for thenumber of working days, rose during themonth. Daily average shipments werehigher in both the durable and nondur-able goods industries.
Digitized for FRASER http://fraser.stlouisfed.org/ Federal Reserve Bank of St. Louis

August 1947 SURVEY OF CURRENT BUSINESS
Seasonal Gains Lift Employment Total
As a result of influences largely sea-sonal in nature, total civilian employ-ment increased in June, with approxi-mately 60 million persons reported bythe Bureau of the Census as holdingcivilian jobs, as compared with somewhatover 56 million in June 1946.
The volume of employment is nor-mally at a seasonal high in the summermonths, and the labor force also under-goes a rise as schools close down for thevacation period. Thus, the 1.7 millionrise in employment from May to Junewas acompanied by an increase in un-employment associated with these tem-porary entries. At 2,6 millions, unem-ployment was at the same level as a yearago, but the Census week came severaldays later this year and caught a largernumber of persons just out of school.
Farm work accounted for an increaseof 1.4 million jobs from May to June, asemployment in agriculture reached 10.4million, 400,000 more than a year ago.June was the second consecutive monthin which the number of farm workersexceeded the number in the correspond-ing month of 1946.
Among the seasonal changes affectingnonfarm employment, most importantwere the further rise in construction em-ployment and the advances scored inmining, transportation, trade, and serv-ices. A further factor was the return ofthe remaining telephone workers whohad been on strike.
INo Change in Factory Employment
Manufacturing employment, accordingto Bureau of Labor Statistics estimates,showed little change from May to June,a period in which some seasonal increasewas to be expected. Thus, the seasonallyadjusted index continued the slow de-cline in evidence since March of thisyear. It should be pointed out, however,that the appropriate seasonal adjust-ments are sometimes difficult to deter-mine because of changes in the long-term seasonal pattern of operations insome industries.
Within manufacturing, the recentchanges have been comparatively smalland were largely in the nature of offset-ting seasonal movements. Among theindustries reporting gains were foodprocessing and lumbering. The declinein textile and apparel employment ap-parent since the early months of the yearappeared to have been about halted inJune. The small declines in such indus-tries as radio, nonferrous metals, andrubber, however, could not be ascribed toseasonal factors.
Chart 2.—Weekly Insured UnemploymentMILLIONS OF PERSONS
J A S O N D
1945Source of data : Bureau of Employment Security, Social Security Administration.
1946J F M A M J J A S O N D
47-3871947
Unemployment Rises Seasonally
The increase of almost 600,000 in thepersons unemployed in June occurredprimarily in the school-age brackets andrepresented for the most part summerjob hunting by students just out ofschool. Over the past twelve months un-employment has moved within the nar-row range of from 1.9 to 2.6 million per-sons, with most of the variation ac-counted for by the seasonal shifting injob opportunities.
As may be seen from chart 2, insuredunemployment in mid-July was slightlyunder 2 million persons, a level whichhas prevailed since early May. The in-sured unemployment statistics are de-rived from reports on continued claims(i. e., all claims other than initial claims)filed under the State and Railroad un-employment insurance programs andunder the Veterans' Unemployment Al-lowance program and are not directlycomparable with the Census estimates ofunemployment derived from the month-ly sample survey of the labor force. Themore obvious differences between the twosets of figures stem from the limited cov-erage of the unemployment programs,the exhaustion of benefit rights, thetreatment of workers with jobs but notat work, the handling of part-time work-ers, and the definition of unemployment.
The low point over the last year in thenumber receiving State unemploymentbenefits was reached in November 1946.
By the end of the year, the number hadrisen to slightly over 1 million, and it hasremained above that level for the last 6months. On the other hand, the numberof veterans receiving unemployment al-lowances has been declining almoststeadily for more than a year, as formerservicemen found peacetime occupationsin the active job market which has pre-vailed, or, in some cases, exhausted theirbenefit rights. Some 760,000 were re-ceiving veterans' allowances in mid-July,as compared with 1.7 million a yearearlier.
Personal Income Moves Upward
Higher wage rates and farm productprices were the principal factors re-sponsible for the rise in personal incomein June to an annual rate of 193 billiondollars, after seasonal correction, but thetermination of the strike in the telephoneindustry also influenced the month-to-month change. The rate was under 192billion dollars in May and about 173billion dollars in June of last year.
The contribution of increases in aver-age hourly wage earnings to the rise inpersonal income so far during 1947 isdescribed in the quarterly analysis of theincome flow which appears in a latersection of this review. Wage rate ad-justments, affecting the cost of bothbasic raw materials and fabricated prod-ucts, have also influenced the recent up-ward move in industrial prices.
Digitized for FRASER http://fraser.stlouisfed.org/ Federal Reserve Bank of St. Louis

SUEVEY OF CURRENT BUSINESS August 1947
Wholesale Prices Top March Average
The advance in wholesale prices whichtook place in July resulted from increasesin the three broad groups of commodi-ties: farm products, foods, and indus-trial commodities. Unlike the price in-dexes for farm and food products, whichreached high points in March, recededsomewhat, and then rose again, the in-dex for the nonfarm, nonfood group hadshown practically no change for 3months prior to July.
New highs in fuel and lighting prod-ucts prices, reflecting primarily the Julyincrease in bituminous prices, in addi-tion to advances in the prices of ironand steel products, leather, and hidesand skins accounted for most of the in-
crease in the industrial price average.As a result of developments abroad,crude rubber prices which had been un-der steady downward pressure earlier inthe year, moved forward again in July,showing a net gain of 14 percent for themonth. It may be noted that the recentprice increases for steel and coal werenot fully reflected in the price indexesduring July.
The rise in prices of farm productsduring July reflected for the most parthigher livestock and poultry prices. LateJune and early July declines in grainprices were wiped out in following weeksand by the end of the month grain priceswere again close to the postwar highs oflast March. Except for fruits and vege-tables, prices of foods continued their
rise, the wholesale food price index atthe end of July standing 3 percent abovethe end-of-June level.
Prices of building materials continuedto edge down slightly in July, while sub-stantially lower prices for oils and fatsand drugs and Pharmaceuticals reducedthe index of chemicals and allied prod-ucts prices by 4 percent over the month.
Food Prices Lead Rise at Retail
On June 15, the BLS Consumers' PriceIndex stood at 157 (1935-39 = 100). Mostof the increase of about 1 percent overthe index for the previous month wasattributable to the higher cost of food.In the case of meats, for example, theMay-to-June advance averaged 6 percentat retail.
National Product and Income in the First Half of 1947
In the second quarter of 1947, the grossnational product, which measures themarket value of the output of goods andservices produced by the Nation, wasflowing at an annual rate of 226 billiondollars. This represented an increaseover the first quarter, but the rate ofgrowth had slackened as compared with1946.
In terms of current dollars, the levelof production is at an all time high,exceeding by 4 billion the war peak of 222billion dollars reached in the first quarterof 1945. To a considerable extent, how-ever, these dollar values reflect higherpostwar prices. The volume of produc-tion—though far above prewar levels—was below its wartime peak because lessurgent demand led to shorter hours ofwork and withdrawals from the laborforce.
As can be seen from chart 3, the post-war dip in national product was smalland the recovery rapid. The majorforces responsible for maintaining eco-nomic activity in spite of the rapidliquidation of war production can besummarized with the aid of table 1.
Postwar Expenditure Pattern
Table 1, which compares the secondquarter of 1947 with the second quarterof 1945, is similar to the table on the"Nation's Economic Budget" published inrecent annual Budget messages of thePresident and in his Economic Reports toCongress. It represents a rearrange-ment of the basic national income andproduct data so as to show the impactof the four major sectors of the econ-
omy — consumers, businesses, govern-ment, and foreign nations—upon theflow of income and production. Themain difference between table 1 and theregular gross national product statementis that it shows not only the expendi-tures for gross national product by thevarious sectors, but also their receiptsand net expenditures.
It can be seen from this table that inthe second quarter of 1947 personal con-
sumption expenditures—at an annualrate of 159 billion dollars—accounted for70 percent of total expenditures for grossnational product. In the second quarterof 1945, immediately before the end ofthe war, they constituted only 54 percent.
To put the comparison in a somewhatdifferent manner, in the second quarterof 1947 individuals saved 11 billion dol-lars at annual rates out of a total dis-posable income of 170 billion. Two years
Table 1.—Receipts and Expenditures for Gross National Product by Major Sectorsof Economy, Second Quarter of 1945 and 1947; Seasonally Adjusted Quarterly Totalsat Annual Rates
[Billions of dollars]
Persons:Disposable income _Consumption expendituresNet expenditures
Private business:Undistributed corporate profits and other
reserves *_ .._ _Gross domestic investmentNet expenditures
Rest of the world:Net foreign investment
Government:ReceiptsExpendituresNet expenditures . _ _ _
Adjustment for nongross-national-product receiptsand expenditures 2 _ _
Gross National Product or Expenditure
Second quarter 1945
Receipts
152.9
19.1
56.1
-7 .9220. 2
Expend-itures
118.8
7 6
-2 .6
104.3
-7 .9220.2
Net ex-pend-itures
—34 1
—11.5
—2.6
48.2
00
Second quarter 1947
Receipts
170.1
14.9
55.7
-14.7226.0
Expend-itures
159.0
28.8
10.6
42.3
-14.7226.0
Net ex-pend-itures
-11.1
13.9
10.6
-13.4
00
1 Consists of undistributed corporate profits, corporate inventory valuation adjustment, capital consumption allow-ances, and the statistical discrepancy.
2 Consists of Government expenditures other than for gross national product—viz., transfer payments, net interestpayments, and subsidies minus surplus of Government enterprises.
Note: The main difference between table 1 and the "Nation's Economic Budget" as published in recent annualBudget messages of the President and in his Economic Reports to Congress lies in the treatment of Government receiptsand expenditures. The measurement of Government receipts and expenditures in table 1 conforms to national incomeand product definitions (cf. footnote 1 to table 8 in the National Income Supplement to the July Survey of CurrentBusiness); in the ''Nation's Economic Budget" the "Receipts from and payments to the public" concept is employed.
Digitized for FRASER http://fraser.stlouisfed.org/ Federal Reserve Bank of St. Louis

August 1947 SURVEY OF CUEEENT BUSINESS
Chart 3.—Gross National ProductBILLIONS OF DOLLARS250
200 -
150 -
100 -
1945 1946 19475 - QUARTERLY TOTALS, SEASONALLY ADJUSTED,
AT ANNUAL RATE 47-399
Source of data: Office of Business Economics.
earlier, under the influence of wartimeincentives, shortages, and price controls,they had saved 34 billion dollars, or threetimes as much, out of a disposable in-come of only 153 billion. This postwarshift in consumption outlays, influencedto a considerable extent by the shortagescreated by war, was one of the most im-portant factors supporting economic ac-tivity at a high level after Governmentdemand for war output had been with-drawn.
The high volume of domestic businessinvestment has been another. As canbe seen from the table, domestic busi-ness investment, at an annual rate of 29billion dollars, represented 13 percent ofgross national product in the secondquarter of the current year. In the sec-ond quarter of 1945 it amounted to only8 billion, or 3 percent of total production.It will be recalled, of course, that at thattime the capital formation privatelyfinanced measured only a fraction of to-tal additions to capital equipment.
The increase in net sales to foreigncountries, also rebuilding their peace-time economies, further added to thepostwar demand for the output of Amer-ican business. In the second quarter,the net demand on this score was 11 bil-lion dollars, as contrasted with a negativeof 3 billion dollars two years earlier,when the rest of the world was, on bal-ance, a seller of goods to the UnitedStates.
The shift in the situation is also shownby the net receipts and expenditures ofeach sector. In the second quarter of
1947, American business and foreigncountries made a net addition of morethan 24 billion to the income stream.This was offset by personal savings of 11billion and a government surplus (cal-culated according to national incomedefinitions) of 13 billion. In the secondquarter of 1945, a Government deficit of48 billion dollars was the main expan-sionary factor. Consumers, businesses,and foreign countries had an excess ofreceipts over expenditures offsetting thegovernment deficit.
Heavy postwar consumption and in-vestment demand, bidding for a dimin-ished labor supply in the framework ofa productive organization that had notyet made a complete adjustment to post-war conditions, was sufficient in termsof dollars not only to offset the sharpreduction of government demand for waroutput, but, in addition, to give rise to
Table 2.—National Income and Product,First and Second Quarters of 1947
[Billions of dollars]
Table 2.—National Income and Product,First and Second Quarters of 1947—Continued
[Billions of dollars]
NATIONAL INCOME BY DIS-TRIBUTIVE SHARES
National incomeCompensation of employees
Wages and salariesPrivateMilitaryGovernment, civilian, -
Supplements to wagesand salaries
Proprietors' and rental in-come 2
Business and professionalFarmRental income of persons-
Corporate profits and in-ventory valuation ad-justment
Corporate profits beforetax
Corporate profits taxliability
Corporate profits aftertax
Inventory valuation ad-justment
Net interestAddendum: Compensation
of general Governmentemployees
GROSS NATIONAL PRODUCT OREXPENDITURE
Gross national productPersonal consumption ex-
pendituresDurable goodsNondurable goodsServices
Gross pri\ate domesticinvestment
New constructionR esidential nonfarmOther
Producers' durable equip-ment
Change in business inven-tories
Net foreign investmentGovernment purchases of
goods and servicesFederalLess: Government sales--State and local
Unad*justed
48.930.929.524.91.23.4
1.4
11.85.64.41.8
5.5
7.1
2.9
4.3
- 1 . 7.8
4.5
53.5
36.54.1
21.511.0
8.02.1.9
1.3
1.72.3
6.74.4.6
2.8
II
0)31.630.125.71.03.4
1.4
11.85.54.51.
0)
C1)
0)
0)-1 .0
.8
4.3
55.5
39.24.8
23.411.0
6.52.41.01.3
- . 32.7
7.14.4.5
3.1
Seasonally-adjusted,at annual
rates
197.6124.9119.4101.5
4.613.3
5.4
47.022.417.67.0
22.4
29.0
11.6
- 6 . 63.3
17.5
222.2
156.819.094.043.8
29.610.34.45.8
2.79.2
26.617.2.2
II
C1)125.8120.3103.0
4.113.1
5.5
47.021.818.07.2
0)
C1)
0)
•0)
- 4 . 13.3
16.7
226.0
159.020.095.044.0
28.89.54.15.4
17.8
1.510.6
27.617.71.8
DISPOSITION OF PERSONALINCOME
Personal incomeLess: Personal tax and non-
tax paymentsFederalState and local
Equals: Disposable personalincome
Less: Personal consumptionexpenditures
Equals: Personal saving
RELATION OF GROSS NATION-AL PRODUCT, NATIONALINCOME, AND PERSONALINCOME
Gross national productLess: Capital consumption
allowancesIndirect business tax and
nontax liabilityBusiness transfer paymentsStatistical discrepancy
Plus: Subsidies less currentsurplus of government en-terprises
Equals: National incomeLess: Corporate profits and
inventory valuation adjust-ment
Contributions for socialinsurance
Excess of wage accrualsover disbursements
Plus: Government transferpayments
Net interest paid by Gov-ernment
DividendsBusiness transfer payments
Equals: personal income-
Unad-justed
8.1. 5
38.5
36.52.0!
53.5
2.9
4.1.1
-2 .6
.048.9
5.5
1.5
.0
2.8
1.11.4.1
47.1
48.0
3.8
Seasonallyadjusted,at annual
rates
190.9
21.419.81.6.41
44.3 169.4
39.2 150.85.01 12.6
55.,
3.0
4.1.1
0)
.00)
C1)
1.5
.0
1.31.5.1
16.8.5
- 4 . 5
- . 2197.6
22.4
5.9!
.o!
10.4
4.56.2.5
190.9
191.6
21.620.01.6
170.0
159.011.0
226.0
11.8
16.6.5
0)
.10)
C1)
5.9
.0
10.1
4.56.2.5
191.6
11.2 11.7
1 Not available.2 Includes noncorporate inventory valuation adjust-
ment.NOTE.—Amounts of less than 50 million dollars shown
as .0 in the table.
heavy inflationary pressures which afterthe abolition of price controls pushedprices up to the extent shown in chart 4.As can be seen from this chart, the risein prices had levelled off in the fewmonths prior to June. Further price in-creases, however, have occurred recentlyboth in farm and industrial markets.They have been called forth less by gen-eral demand factors than by particularsupply shortages and by increases incosts.
In conjunction with the movement ofprices, the progressive slackening inthose types of demand which have pro-pelled national output to its present lev-els is of particular significance. Thisslackening is revealed by a study of themain branches of the expenditure streamsummarized in the chart on the intro-ductory page of this issue.
Inventory Rise Slackens
The behavior of business inventoriesconstituted one of the main contrasts
Digitized for FRASER http://fraser.stlouisfed.org/ Federal Reserve Bank of St. Louis

6 SURVEY OF CUREENT BUSINESS August 1947
between the economic situation in 1946and 1947. The year 1946 had been char-acterized by a rapidly increasing accu-mulation of inventories which reachedits peak in the last quarter of the year.This accumulation slackened noticeablyin the first quarter of 1947. In the sec-ond quarter, the net increase, measuredin current prices, amounted to about 1%billion dollars, as compared with a peakrate of about bVz billion dollars in thelast quarter of 1946. The major partof the reduction was due to a virtual ces-sation of inventory accumulation in re-tail and wholesale trade. The rate ofaccumulation in manufacturing as awhole was reduced much less sharply.
There occurred, however, a significantchange in the composition of manufac-turing inventories. Whereas in 1946stocks of purchased materials and goodsin process accounted for the bulk of theincrease, and finished products were ofdecidedly smaller importance, the 1947increase was mainly in finished goods.In the second quarter, manufacturers'stocks of purchased raw materials actu-ally declined and goods in process showedlittle change.
It would appear that the impetus be-hind the recent movement of businessinventories stems from retailers who,witnessing the easing of supplies at atime when they anticipated a levelingoff of trade, cut their purchases fromwholesalers in order to prevent or atleast to minimize further increases intheir inventories. Wholesalers, in turn,proceeded to diminish their purchasesfrom manufacturers. The consequentincrease in manufacturers' stocks of fin-ished items was offset by sharp restric-tions upon the accumulation of pur-chased raw materials, and, to a lesserextent, of goods in process.
It should be noted, of course, that thispattern, though descriptive of industryas a whole, did not apply to all branchesof activity. It was typical of those non-durable goods lines where wartime de-ficiencies had been made good. It didnot hold in segments of the economy inwhich shortages persisted, for instancein the production and distribution of stillscarce durable goods.
So far inventory buying has slackenedin a gradual manner without depressingthe over-all level of economic activity.The main reason for this lies in the factthat the expansion was limited at a stageof the postwar business cycle at whichthe demand situation was still generallystrong. As will be seen from the follow-ing discussion, other components of na-,tional expenditure expanded to compen-sate for the smaller demand for businessinventories . Most important in this con-nection was net foreign investment,though a cushioning effect was exercised
Chart 4.—Wholesale and Consum-ers9 Price Indexes
INDEX, 1935-39-= 100100
175
150
125
100
WHOLESALE
1
r
i i i i i I i . i
CONSUMERS'PRICES
, 1 , , . ,
i t *
• •
! i i i . i
1946 1947
1 Preliminary estimates for July 1947 basedupon weekly indexes through July 26.
Sources: Basic data, U. S. Department ofLabor ; conversion of wholesale prices to a 1935-39 base and estimate for July 1947, Office ofBusiness Economics.
also by fixed domestic investment andincreased personal consumption expend-itures for items that had been scarcesince the war and gradually becameavailable again. Wage rate increasesalso maintained consumer demand.
Foreign Demand at Peak
In the first two quarters of 1947 netsales to foreigners were at unprecedentedannual rates of 9 and 11 billion dollars,respectively—almost twice the level ofthe last quarter of 1946. In part, foreigndemand replaced domestic demand thatwould have been exercised in the absenceof foreign bidders. In part, however, itserved as an outlet for products forwhich domestic demand was softeningat prevailing prices, and thus prolongedthe period at which economic activitycould proceed at peak levels without thenecessity of price adjustments.
At the current rate of sales, dollar andgold resources of foreign countries arebeing drawn down rapidly, and it is ap-parent that a reduction in exports is im-pending unless these resources are re-plenished by further loans. The rate atwhich remaining available gold and dol-lar balances are spent depends on manyfactors, including the prospects of finan-cial aid, and the course of foreign pur-chases in the near future may vary with-in wide limits. However, import and for-eign exchange restrictions imposed re-cently by a number of American andEuropean countries show that attemptsto restrict imports from the UnitedStates are already being made.
Producers' Durable Equipment
Producers' purchases of durable equip-ment have continued to increase in 1947,but a slackening also was apparent inthis component of national expenditure.Prom the first to the second quarter theexpansion was at an annual rate of onlyone billion dollars, as against the rate oftwo billion which had been typical dur-ing 1946. In some instances the levelingoff of purchases was due to a softening ofdemand after immediate postwar re-quirements had been filled. In others,however, demand continued urgent andthe attainment of a plateau of produc-tion reflected the fact that capacity op-erations had been reached and that, dueto shortages of basic materials and otherfactors, only gradual further expansionof output is possible.
Rise in Construction Interrupted
Private construction has moved side-ways in 1947, small increases in the firstquarter being offset by decreases in thesecond. Virtually all categories of pri-vate construction shared this pattern.The rapid rise in construction costs andin prices charged to ultimate purchaserswhich occurred over the past year wasan important factor limiting demand forconstruction. In the second quarterconstruction costs were relatively stable,and data on starts for residential and oncontract awards for nonresidential con-struction indicated a moderate uptrendin private construction activity.
It was apparent, however, that thelevel of construction activity was inade-quate, both in terms of housing needsand in terms of the volume of construc-tion that will be required in the future tomaintain high levels of income and pro-duction. Private construction currentlyforms a very low proportion of capitalformation and of gross national productas compared with previous periods ofprosperity. In 1929, when the peak ofconstruction was well passed, privateconstruction accounted for 50 percent ofgross private domestic investment and 8percent of gross national product, ascompared with 32 percent and 4 percentin the second quarter of 1947.
Consumer Expenditures Level Off
Consumer demand remained generallyfirm in the first half of 1947. It contin-ued to be in excess of supply for manytypes of durable goods. Nondurablegoods and services also showed furtherexpansion, but here mixed tendencieswere apparent, demand losing some ofits urgency as goods became more readilyavailable.
Competition for the consumer's dollaris becoming important over a growingsegment of the economy. Even thoughDigitized for FRASER
http://fraser.stlouisfed.org/ Federal Reserve Bank of St. Louis

August 1947 SUEVEY OF CUEEENT BUSINESS
purchases of scarce durable goods can beexpected to expand further merely in re-sponse to improvements in the supplysituation, it is apparent that expendi-tures in general are tending to parallelconsumers' disposable income. Never-theless, it seems probable that the post-war personal restocking movement hascontinued to be a factor making for ahigh level of consumer expenditures,which are to that extent, therefore, bol-stered by an element that is temporaryin character.
Role of Government
Federal government expenditures in1947 had ceased to play their spectacularwartime role of being the most importantsingle determinant of the size and pat-tern of national economic activity. Gov-ernment purchases of gross nationalproduct were near the levels to whichthey had dropped rapidly after the cessa-tion of hostilities, and no substantialchange in this situation appears to bedue in the near future. The fact thatthese purchases are comparatively sta-ble at rates which are low as comparedwith the war period does not mean thatFederal finances have ceased to be animportant factor in the economic picture.Most relevant for the immediate eco-nomic situation was the large FederalGovernment surplus which exceeded the13 billion dollar annual rate shown forthe combined Federal and State and localsurplus in table 1. Given the generalexcess of demand over supply in the restof the economy taken as a whole, thissurplus served as a check upon infla-tionary developments.
In addition to this particular influence,however, the increase of Federal ex-penditures and receipts as compared
with prewar tends to decrease the sensi-tiveness of the economic structure to theimpact of cyclical disturbances. Cur-rently Federal purchases of gross na-tional product are at annual rates of 18billion dollars or 8 percent of the total,as compared with 1 percent in 1929 and6 percent in 1939. These substantialpurchases are less influenced than otherpurchases of national output by changesin the level of economic activity and canthus be expected to exercise a stabilizinginfluence. The tax structure which sup-ports the increased level of Federal ex-penditures has a similar influence. Theeffect of initial changes in economicactivity and income on disposable in-come is mitigated, because taxes absorbpart of the change. Hence, the effectupon spending is dampened and thesecondary changes in income and eco-nomic activity are smaller.
State and local government expendi-tures continued to expand in the firsthalf of 1947 as a result of higher costs ofgovernment operations and some in-crease in construction. Though Stateand local construction has about tripledsince the end of the war it is still lowboth in terms of past achievements andalso in terms of State and local plans forpostwar construction.
Flow of Income
The flow of income has been main-tained at high levels thus far in 1947,with noteworthy stability both in the ag-gregate and in the major components.Wages and salaries reflected mainly thegradual stabilization of production. Thetotal increased moderately each quarter,private pay rolls more than compensat-ing the reduction in government. With-in the private sphere a large part of the
increase was concentrated in durablegoods manufacturing. Expansion inother industries was noticeably slower.
Increases in average hourly earningscontributed to the increase in pay rolls.They were accelerated in May and June,but even earlier were a factor in theeconomic situation, tending to increasepurchasing power and to sustain con-sumer expenditure. Available data indi-cate that in manufacturing and tradecombined, which currently account formore than one-half of private pay rolls,the change in pay rolls between thefourth quarter of 1946 and the firstquarter of 1947 which was attributable tochanges in average earnings amountedto about one and a half billion dollars atannual rates, and to about three billionbetween the fourth quarter of 1946 andthe second quarter of 1947.
With the rise in the volume and valueof business, first quarter profits of cor-porations and of unincorporated enter-prises increased as compared with thelast quarter of 1946.
The profit record of various industriescontinues to be divergent. In general,the reconversion industries in the durablefield are now experiencing the favorableresults of expanding production. Theposition of the railroads has changedmarkedly for the better. Other publicutilities showed a moderate rise. Thenondurable manufacturing industries inthe aggregate are just about holdingeven. In the distributive trades, profitsremained high, though below the peaksattained in the strong sellers' marketlast year.
Data on corporate profits for the sec-ond quarter are as yet fragmentary, butno sizable change from the first quarterfigure is expected.
Redemption of Armed Forces Leave BondsRedemption of Armed Forces Leave
Bonds on or after September 2, 1947,permitted under legislation passed in lateJuly, may be expected to provide a tem-porary stimulus to personal consump-tion expenditures in the immediate fu-ture. In signing the bill, the Presidentissued a statement urging veterans notto cash their bonds unless they are inurgent need of the money now.
The Armed Forces Leave Act, enactedAugust 9, 1946, had provided for the pay-ment of unused leave due enlisted menwhen demobilized in bonds maturing in5 years and bearing interest at 2l/z per-cent. The bonds were issued, one to aveteran, in multiples of 25 dollars (anda minimum of 50 dollars) with odd
amounts paid in cash. In order to pre-vent a substantial addition to purchas-ing power at that particular time, thelaw stipulated that the bonds be non-negotiable and nonredeemable. Bondpayments were based upon accrued leave,rank at time of discharge, subsistenceand quarters allowances, and length ofservice, with payment limited to a maxi-mum of 120 days leave.
Bonds Total 1.8 Billion Dollars
As of June 30, 1947, approximately8,500,000 veterans held Armed ForcesLeave Bonds having a face value plusaccrued interest of 1,838 million dollars(see chart 5). Fifty-four million dollarshad been redeemed through death and
applications to insurance premiums. Al-though it is difficult to estimate howmany of the remaining 6,000,000 veteransof World War II are eligible for bondpayments and may be expected to makeapplications before September 1, 1948(the new deadline replacing September 1,1947), indications are that the bonds al-ready issued constitute the bulk of theGovernment liability.
The average holding (face value plusinterest) is 216 dollars and 82 percent ofthe total bond value is in denominationsof 400 dollars or less. While the size ofbonds ranges from 50 dollars to 1,000dollars and more, the greatest concentra-tion of total bond value is in the smallerdenominations, with almost 30 percent
Digitized for FRASER http://fraser.stlouisfed.org/ Federal Reserve Bank of St. Louis

8 SURVEY OF CURRENT BUSINESS August 1947
Table 3.—Distribution of Armed Forces Leave Bonds Outstanding as of June 30,1947
Bond denomination 1
$50-100125-200 _225-300 . _325-400425-500525-1,000 .1,025 and over
Veterans holding bonds
Number Cumulativenumber
Thousands
1, 7623,2842, 016
812336275
15
1, 7625, 0467, 0627, 8748,2108,4858,500
Cumulativepercentage
distribution
20. 759.483.192.696.699 8
100. 0
Bond value
Amount
(face valueinterest)
Cumulativeamount
Millions of dollars
142544529295157152
19
142686
1,2151,5101, 6671,8191, 838
DIUS accrued
Cumulativepercentage
distribution
7 737.366.182.190.799.0
100. 0
1 Bonds are in $25 multiples (and a minimum of $50) with one bond to a veteran.
Source: U. S. Treasury Department.
of the total bond value in 125 to 200 dol-lar bonds, and an additional 29 percentin 225 to 300 dollar bonds. The concen-tration of veterans holding bonds in thesmaller denominations is even greater,with 93 percent of the veterans holdingbonds in denominations of 400 dollars orless, and 39 percent in denominationsranging from 125 to 200 dollars. Thedistribution of bond value and veteransholding bonds, by denomination of bond,is shown in table 3.
Parallel Experience in 1936
A parallel to the permissive redemp-tion of Armed Forces Leave Bonds on
September 2, 1947, is to be found in thepayment of the Adjusted Service Certif-icates in 1936. The World War VeteransAdjusted Compensation Act of 1924 pro-vided "adjusted service credit" to veter-ans on the basis of length of service inexcess of 60 days during World War I—$1.25 for each day of service overseas and$1 per day for service at home—with amaximum of 625 dollars for overseas vet-erans and 500 dollars for nonoverseasveterans.
The Adjusted Compensation Act of1936 provided for the immediate pay-ment of the face amount of AdjustedService Certificates, which had been is-
Chart 5.—Adjusted Service Bonds and Armed Forces Leave Bonds
BILLIONS OFOOLLARS3
ADJUSTED SERVICEBONDS- 1936
MILLIONS OFPERSONS15
ARMED FORCES LEAVEBONDS- 1947
DOLLARS600
- 400 -
- 200 -
BONDSISSUEDi/
VETERANSRECEIVING
BONDS
AVERAGEVALUE OF
BONDS
n 1 v////\ BMfi f nBONDS ISSUED, ASPERCENTAGE OFDISPOSABLE PER-SONAL INCOME^
47-4051 Represents adjusted service bonds issued during and after 1936, and armed forces leave bondsissued through June 30, 1947, less a small amount paid on death or applied to payment of insurancepremiums.
2 Data for disposable personal income are totals for first half of 1936 and 1947, seasonally adjusted,at annual rates.
Sources of data : TJ. S. Treasury Department and Office of Business Economics.
Chart 6.—Redemptions of Ad-justed Service Bonds: Percent-age of Total Issued
PERCENTIOO
25
CUMULATIVEPERCENTAGE
PERCENTAGE' IN PERIOD
S O N D J F M A M J J A S O N1937
Source of data : U. S. Treasury Department
sued pursuant to the 1924 law, less out-standing loans and accrued interest toSeptember 30, 1931. Payment was au-thorized to be made on or after June 15,1936, by the issuance of nonnegotiablebut immediately redeemable bonds inthe denomination of 50 dollars with oddamounts between 50-dollar multiplespaid by check. Bonds were dated June15, 1936, to mature on June 15, 1945, andaccrued interest at the rate of 3 per-cent, with no interest payable prior toJune 15, 1937.
Under the Act, veterans received bondstotaling 1,850 million dollars andchecks totaling 84 million dollars. In all,approximately 3,500,000 veterans ofWorld War I received Adjusted ServiceBonds averaging about 530 dollars.
Rapid Cashing in of 1936 Bonds
The bulk of the bonds were cashed inalmost immediately: 39 percent in thefirst 15 days, 61 percent in the first 45days, and 75 percent in the first year.The actual distribution of redemptionsover the 1936-37 period is illustrated inchart 6. How much of the bonds cashedwas actually spent within given timeperiods is not known since there is noway of determining what expenditureswould have been without this stimulus.Retail sales data show some unusual risein sales of apparel stores and generalmerchandise stores in July, 1936, but in
(Continued on p. 24)Digitized for FRASER http://fraser.stlouisfed.org/ Federal Reserve Bank of St. Louis

August 1947 SUKVEY OF CURRENT BUSINESS 9
State Income Payments in 1946By Charles F. Schwartz and Robert E. Graham, Jr.
DURING 1946 income payments to in-dividuals were at a record high in
nearly every State.1
For the continental United States as awhole, total income received by individ-uals in 1946 amounted to more than 169billion dollars, approximately one-tenthabove the previous all-time high of 155billions in 1945. In four-fifths of theStates, the 1945-46 increase in individualincomes was 5 percent or more (see table1). In 15 States, it was as much as 12percent or more, with Iowa's gain of 27percent ranking highest. In the threeSouthern States where 1946 total incomesfailed to rise—Florida, Louisiana, andMississippi—the declines were fractional.
Income gains of 10 to 12 percent werescored in the Central, New England, andMiddle Eastern regions. In the Far West,Southeast, and Southwest—the threeareas where the war effort had providedthe greatest impetus to the expansion ofincomes—the 1945-46 gains were of less-than-average proportions.
Total income payments in 1946 werealso high throughout the country bycomparison with the peak war year 1944.With the national total of income pay-ments last year 12 percent above 1944,throughout the National generally theflow of income to individuals was appre-ciably higher than during the war. Ex-ceptions are found principally in severalof the Southern and Western States. Insuch States, the lag behind the Nation-wide 1944-46 expansion resulted directlyfrom the drastic curtailment of a specificwar activity (such as shipbuilding, air-craft production, or the concentration of
1 Technical notes denning State incomepayments are provided at the end of thearticle. Attention is called in particular tothe explanation of the status of the State in-come series in relation to the revised nationalincome and product series published in theNational Income Supplement to the July 1947SURVEY.
NOTE.—Mr. Schwartz and Mr. Graham aremembers of the National Income Division,Office of Business Economics.
SummaryIn nearly every State the flow of
dollar income in 1946 was at a rec-ord level, appreciably higher thanduring the war.
Largest relative income gainsduring 1946 were scored in theCentral, New England, and MiddleEastern regions. In the Far West,Southeast, and Southwest—thethree areas where individual in-comes had been boosted to an un-usual degree by the stimulus of thewar effort—the 1945-46 gains wereof less-than-average proportions.
Comparison of the State distri-butions of income payments for1946 and 1940 reveals a significantredistribution of income from NewEngland and the Middle EasternStates to the South and West. Ingeneral, this was an acceleration of1929-40 trends.
This article continues the seriesof reports on State income pay-ments which have been publishedannually in the SURVEY.
military and naval establishments) thathad become a major source of income.Even in these States, however, aggregate1946 incomes were close to peak wartimelevels.
It is fully apparent, then, that on aState and regional basis, as well as forthe Nation as a whole, the year 1946was one of high prosperity. The Stateincome data reflect generally swift ad-justments to peacetime conditions in allparts of the country. This is a general-ization of prime importance that never-the less does not deny the severity of re-adjustment problems in specific localareas and the unequal impact of thetransition period on various incomegroups or classes of the population.
Developments on National ScalePrior to a further discussion of State
income payments in 1946 as comparedwith those in previous years, a summarypicture of developments on a nationalscale should prove useful. Moreover, forthe purpose of analyzing the principalshifts in the geographic distribution ofincome from prewar 1940 through post-war 1946, a knowledge of the moredynamic elements in the Nation's incomeflow is essential. These elementsstemmed in large measure from Federalwar spending, an income generatingforce of "national origin" that condi-tioned geographic changes in incomepayments to a considerable degree.
Table 2 shows, for the continentalUnited States for selected years since1940, total income payments and theprincipal components to which thechanges in total income can be traced.
Prom 1940 to 1943 the aggregate in-come received by individuals rose from76 billion dollars to 140 billions. Three-fifths of this unprecedented 64-billion-dollar expansion was contributed by"war" manufacturing payrolls, pay of thearmed forces, Federal civilian pay rolls,and agricultural income. The upsurgeof these four sources of income resulteddirectly—particularly for those otherthan agricultural income — from therapid climb of Federal war spending.Their uneven expansion among theStates contributed markedly to an accel-eration of the prewar redistribution ofincome in favor of the South and FarWest.
In 1944, however, these four sources ofincome accounted for only one-sixth ofthe 11-billion increase in total incomepayments. War production having lev-elled off, expansion of total incomestemmed mostly from payments by tradeand service establishments, military al-lowances and allotments, and Federal in-terest payments. Their geographic ex-pansion was rather uniform, and theState distribution of income payments in1944 was closely similar to that in 1943,
755297—47-Digitized for FRASER http://fraser.stlouisfed.org/ Federal Reserve Bank of St. Louis

10 SUEVEY OF CURRENT BUSINESS August 1947
The annual data for 1945 reflect thesummary effects of the strikingly differ-ent developments before and after VJ-day. On a Nation-wide basis, neitherthe level nor composition of incomepayments changed markedly from 1944through the second quarter of 1945.With the surrender of Japan and theimmediate curtailment of war produc-tion, income payments in the fourthquarter of 1945 were nevertheless main-tained at the wartime level by (1)greatly expanded volumes of mustering-out payments to discharged servicemenand unemployment benefits, (2) an in-come spurt in the trade and service sec-tors as consumer spending turnedsharply upward, and (3) a continued
advance of income payments by mostother private nonagricultural industries.These developments are manifested inthe State distribution of income by theslightly reduced shares of the Nation's1945 total received by States where warspending had boosted income paymentsto an unusual degree. The distributionof income in 1945, however, was verysimilar to that in 1944.
Income Flow in 1946Comparison of the 1946 and 1945 data
shown in table 2 reveals, for the mostpart, an accentuation of the 1944-45 in-come changes. These are, on the onehand, contracted pay rolls in "war" man-ufacturing, sharply reduced military
Table 1.—Percent Distribution of, and Relative Changes in, Total Income Payments,by States and Regions, Selected Years, 1929-46 l
State and region
Continental United States
New EnglandConnecticutMaineMassachusettsNew HampshireRhode IslandVermont
Middle EastDelaware . ___District of ColumbiaMarylandNew JerseyNew York _ _ _PennsylvaniaWest Virginia
SoutheastAlabama. _Arkansas ._ _.FloridaGeorgiaKentuckyLouisianaMississippiNorth CarolinaSouth CarolinaTennesseeVirginia _____
SouthwestArizonaNew Mexico _OklahomaTexas ___ __
Central __Illinois _"_IndianaIowa _MichiganMinnesotaMissouriOhioWisconsin
NorthwestColoradoIdaho _Kansas __MontanaNebraska-_North DakotaSouth DakotaUtahWyoming
Far WestCaliforniaNevada __Oregon,Washington
1929
100.00
8.221.77
.544.58
37.70.26
33.70.26.77
1.343.96
17.538.88
.96
10.51.97.68.84
1.161.171.04
661.17
.531.101.19
5.03.30.19
1.313.23
29.328.522.271.634.291.752.675.952.24
4 75.77.28
1.20.39.92.32.3533
.19
8 476. 31
.09
.731.34
Percent distribution
1940
100.00
8.071.87
.574.36
35.67.25
32.06.31
1.191.614.14
15.608.211.00
11.921.00
.651.191.301.161.12
581.49
.721.221.49
5.15.31.25
1.093.50
28.567.572.451.634.511.882.525.862.14
4 44.78.31
1.00.42.75.31.3235
.20
9.807.39
.12
.841.45
1943
100.00
7.311.89.61
3.6827
.66
.20
27.66.27
1.031.723.84
12.597.33
.88
13.881.27.70
1.501.531.201.34.77
1.61.81
1.421.73
6.09.43.27
1.144.25
27.976.682.661.614.901.622.405.962.14
4.96.81.34
1.27.37.83.36.32.49.17
12.138.79
.151.122.07
1944
100.00
7.081.79.57
3.6028
.64
.20
27.77.27
1.001.683.83
12.767.33
.90
14.201.29.74
1.571.561.211.32
.791.66
.841.511.71
6.11.38.28
1.204.25
27.646.792.601.454.741.592.395.902.18
4.95.76.35
1.30.35.86.37.36.42.18
12 258.91
.141.082.12
1945
100. 00
7.001.70
.553.62
30.62.21
28.08.25
1.041.613.72
13.187.33
.95
14.351.30
.781.561.581.261.28.78
1.69.84
1.571.71
6.04.38.29
1.164.21
27.626.892.641.534.381.682.435.872.20
4.96.82.34
1.23.36.86.36.39.42.18
11.958.79
.141.051.97
1946
100. 00
7.081.70
.543.70
.32
.59
.23
28.35.25
1.021.603.64
13.527.34
.98
13.811.22.78
1.401.511.281.17.70
1.79.83
1.501.63
5.73.37.29
1.093.98
28.267.102.591.784.361.822.575.792.25
4.99.81.35
1.17.40.88.37.40.41.20
11. 788.78
.141.021.84
1929 to1940
- 8
- 1 0- 3
A
- 1 3— 11- 1 2- 1 3
- 1 3+10+42+10
- 4- 1 8- 1 5
- 4
+4- 5
- 1 2+29+3- 9
-18+17+24+2
+14
- 6- 3
+18- 2 3
- 1
—11- 1 8
i
- 9- 3- 1
- 1 3- 1 0- 1 2
— 14
+1- 2 4
—26- 1 0- 1 6
- 3- 2
+6+7
+24+5
(2)
Percent change
1940 to1946
+123
+96+103+113+90
+102+97
+105
+98+80+92
+122+96+94
+100+118
+159+172+169+163+160+146+134+167+168+158+174+144
+149+164+158+123+154
+121+109+136+144+115+1164127+120+134
+151+134+153+163+108+162+163+178+160+122
+109+1G5+155+173+184
1940 to1944
+99
+75+92
+101+65+56+88+63
+73+68+67
+108+85+63+78+80
+138+155+128+163+141+107+136+168+122+132+146+130
+136+145+121+118+143
+93+79
+111+77+109+69+89
+100+103
+123+95
+127+161+65
+128+135+126+140+77
+149+140+124+158+191
1944 to1946
+12
+12+6+6
+15+30+4
+26
+14+7
+15+7+6
+19+12+21
+9+7
+18(2)+8
+19- 1- 1
+21+11+11+6
+5+8
+17+2+5
+14+17+12+38+3
+28+20+10+15
+13+20+11+1
+27+15+12+23+8
+25
+8+10+14+6
q
1945 to1946
+9
+10+9+8
+11+18+5
+16
+10+9+8+9+7
+12+9
+13
+5+3+9
2+5
+10(2)
- 2+16+8+4+4
+4+6
+10+3+ 3
+1?+12+7
+27+ 9
+18+15+8
+11
+10+9
+12+4
+21+12+10+13+6
+17
+8+9
+12+6+2
1 Computed from data shown in table 12.2 Less than five-tenths of 1 percent.Source: Office of Business Economics.
payments, and lower Federal civilianpay rolls; and, on the other, an impres-sive 10-billion-dollar increase in incomefrom trade and service, a rise of one-fifthin pay rolls of "nonwar" manufacturingindustries, a greatly enlarged volume ofveterans' pensions and benefits, and asharp increase in agricultural income.
Prices were an important element inthe 1946 income expansion. The under-lying economic pressures continued to beinflationary. When these were un-leashed by the elimination of price con-trols, prices climbed rapidly in the latterhalf of the year. The consumers' priceindex of the Bureau of Labor Statistics,which had advanced 4 percent over the3-year period 1943-45, rose 15 percentfrom June to December in 1946, and forthe year as a whole averaged 8 percentabove 1945.
Particularly to be noted from table 2are the marked shifts in the compositionof income payments from 1944 to 1946and the sources of the 18-billion-dollargrowth of total income. The aggregateof "war" manufacturing pay rolls, mili-tary payments, and Federal civilian payrolls was 17 billion dollars less in 1946than in 1944. This reduction, amount-ing to almost two-fifths, was much morethan offset by the 35-billion-dollar in-come expansion in "nonwar" sectors ofthe economy. The principal role of tradeand service in this expansion is clearlyevident.
Changes in Income SourcesIn broad outline, this national pattern
prevailed on a State basis. In everyState, income payments in 1946 approxi-mated or exceeded the 1944 total mainlyby virtue of a rise in income from tradeand service, "nonwar" manufactures,and agriculture replacing—or some-times far outstripping—the loss of in-come from "war" manufactures, militarypayments, and Federal civilian pay rolls.Further generalization would involveoversimplification, as there were widedifferences among the States in the rela-tive importance of these several sourcesin the 1944 income stream and in therates at which they changed from 1944to 1946. These differences are summar-ized in table 3. This table permits an-alysis by States and regions of the majorchanges in the levels and sources of in-come payments that occurred in thetransition from war to peace.
No less interesting than a comparisonof wartime and postwar incomes is ananalysis of the changes which occurredbetween the immediate prewar periodand 1946. Table 4 measures for eachState and region the proportion of totalincome payments in 1940 and 1946formed by agricultural income, manufac-turing wages and salaries, trade and
Digitized for FRASER http://fraser.stlouisfed.org/ Federal Reserve Bank of St. Louis

August 1947 SURVEY OF CURRENT BUSINESS 11
service income, and government incomepayments. The table thus provides datafor analysis of prewar to postwar changesin the principal industrial sources, of in-come payments and, correlatively, thecomparative importance of these sourcesin contributing to the 1940 to 1946 in-come expansion.
It is clear, for example, that agricul-ture provided the greatest impetus to the1940-46 growth of total income paymentsin the Northwest and in several of thefarm States of the Central and South-eastern areas. The influence of manu-facturing on the growth of aggregateincomes from 1940 to 1946 was most pro-nounced in New England, the MiddleEast, and the Southwest.
Trade and service were more impor-tant in the Middle East, Southwest, andFar West than elsewhere in contributingto the rise in incomes from 1940 to 1946.In every part of the country, income pay-ments by Federal and State and localgovernments accounted for a largershare of all income in 1946 than in 1940.But the influence of government wasmost pronounced in the South. Thiswas due mainly to military payments,which even in postwar 1946 formed asmuch as 5 percent of total income in thetwo Southern regions.
Redistribution of Income
The probable nature of the geographicdistribution of income in the immediatepostwar period was a principal subjectof analysis in the reports on State in-come payments of the last few years.
Table 2.—Income Payments to Individuals in Continental United States, 1940 and1943-46
Item
"War" manufacturing pay rolls 1__. _"Nonwar" manufacturing pay rolls 2
Pay of armed forces 3
Military allowances and allotments 4
Federal civilian pay rolls 5
Agricultural income 6 . . . . . .-Trade and service income 7
Unemployment benefits 8. _ .Veterans' pensions and benefits 9
All other income
Total income payments
[Billions of dollars]
1Ii
. .
1940
7.37.9
.4
1.75.4
18 2.5.4
34.1
75. 9
1943
27.113.25.53.06.9
12.828 1
.1
.442.9
140.0
1944
28.214.05.26.27.3
13.431 5
.1
.644.7
151. 2
1945
22.814.74.28.57.0
14.035 1
.41.1
47.4
155.2
1946
18.017.72 .34.05.8
16.744 8
1.14.4
54.6
169. 4
1 "War" manufacturing industries include chemicals and allied products, rubber products, iron and steel and theirproducts, ordnance and accessories, transportation equipment (except automobiles), nonferrous metals and theirproducts, electrical machinery, machinery (except electrical), and automobiles and automobile equipment.
2 "Nonwar" manufacturing industries consist of food and kindred products, tobacco manufactures, textile-mill products, apparel and other finished fabric products, lumber and timber basic products, paper and allied products, printingand publishing, products of petroleum and coal, leather and leather products, stone, clay, and glass products, andmiscellaneous manufacturing industries.
3 Net of allotments of pay to individuals and of contributions to family-allowance payments.4 Include family-allowance payments, allotments of pay to individuals, mustering-out payments, and enlisted men's
cash terminal leave payments.5 Include pay of employees (net of their contributions to retirement funds) in the Federal Executive Service in the
continental United States.6 Includes net income of farm operators (adjusted for change in inventories of crops and livestock), farm wages, and
net rents to landlords living on farms.7 Includes wages and salaries (net of employee contributions to social insuiance programs) and proprietors' income.8 Include State unemployment compensation benefits and railroad unemployment insurance benefits.9 Include pensions and disability compensation, readjustment allowances, self-employment allowances, cash subsis-
tence allowances, and State government bonuses to veterans of World War II.
Source: Office of Business Economics.
The nature of developing war-periodshifts, the appraisal of regional differ-ences in sources of war-period incomegrowth, and the geographic income dis-tribution in the fourth quarter of 1945shown by special compilations presentedin the August 1946 SURVEY all furnishedthe general preview of a significant re-distribution of income from New Eng-land and the Middle Eastern States tothe South and West.
These are the main shifts in the geo-graphic distribution of income now indi-
Map 1.—Percentage Increase in Total Income Payments, 1946 from 1940
£ 8 8 8 140 TO 160
V//A I 15 TO 139
WWi UNDER 115
UNITED STATES 123
Source of data : Office of Business Economics.
cated by a comparison of the 1946 and1940 State income totals. They areclearly portrayed in map 1. Of the 24States which scored 1940-46 increases inincome payments falling in the two topbrackets depicted on the map, 23 arelocated in the Southeast, Southwest,Northwest, and Far West. On the otherhand, all but two States falling withinthe lowest bracket are in New Englandand the Middle East. Aggregate incomereceived in the four Southern and West-ern regions rose 159 percent from 1940to 1946. This contrasts with the 97 per-cent gain for the New England and Mid-dle Eastern areas combined. The incomegain of the Central region closely ap-proximated the Nation-wide average.
This pattern of change in the geo-graphic distribution of income accords,in general, with that occurring over theprewar period 1929 to 1940. In the pre-war period, as well as from 1940 to 1946,New England and the Middle East re-ceived declining shares of the country'stotal income and the two Southern re-gions and the Far West received increas-ing shares. Over the span of both pe-riods, the share received by the largeCentral region was relatively constant.The Northwest, however, furnishes anexception to the generalization thatchanges in the geographic distributionof income between 1940 and 1946 werein accord with developments of the pre-war decade. This region's income sharewas reduced over the 1929-40 period, butit rose appreciably from 1940 to 1946.
Digitized for FRASER http://fraser.stlouisfed.org/ Federal Reserve Bank of St. Louis
12 SUKVEY OF CURRENT BUSINESS August 1947
Regions with Declining TrendsOver the period 1929 to 1946 compara-
tive stability and a declining trend rela-tive to the Nation characterized NewEngland's income payments. The re-gional movements were dominated byMassachusetts, which receives about halfof New England's total income. Therelative income decline of the region wasslight from 1929 to 1940 but was accel-erated from 1940 to 1946.
The declining relative trend of theMiddle East was slight in the prewarperiod but was more accentuated overthe 1940-46 period. The relative de-cline centered in New York and Pennsyl-vania in the prewar years but was quitegeneral throughout the region in thelater period. The 1940-46 decline in theregion's income share was a compositeof a sharply accelerated relative declinefrom 1940 to 1944 and a better-than-average income record from 1944 to 1946.These were determined by New Yorkand are attributable mainly to the lesserrole of direct war activities in the State'seconomy.
While for market analysis significanceshould be attached to the long-term de-clining relative trends of income pay-ments in New England and the MiddleEast, two facts of correlative importancewill not be overlooked. These are thatthe two regions have comparatively highper capita incomes and are principalcenters of population.
Gains in South and Far West
The marked improvement in the rela-tive income position of the Southeastbetween 1940 and 1946 was an accelera-tion of prewar developments. In the1929-40 period total income paymentsincreased 4 percent in this region, ascontrasted with the 10 percent declinein the rest of the country. In the1940-46 period, income growth in theSoutheast was second only to that in theFar West. Strides in industrializationand expanded flows of government in-come payments were major elements inthe income gains in both periods. Dur-ing the war military payments were ofunusually large volume in the Southeast,and their reduction with the end of thewar was the main reason why the South-east's income share was reduced between1944 and 1946.
In the Southwestern region, Texas,New Mexico, and Arizona scored 1940-46gains in income payments substantiallybettering the national average, whilethat of Oklahoma matched it. Each ofthem except Oklahoma improved its in-come position in the prewar decade. Asin the Southeast, growth of manufac-tures and relatively large government in-come payments were the principal fac-
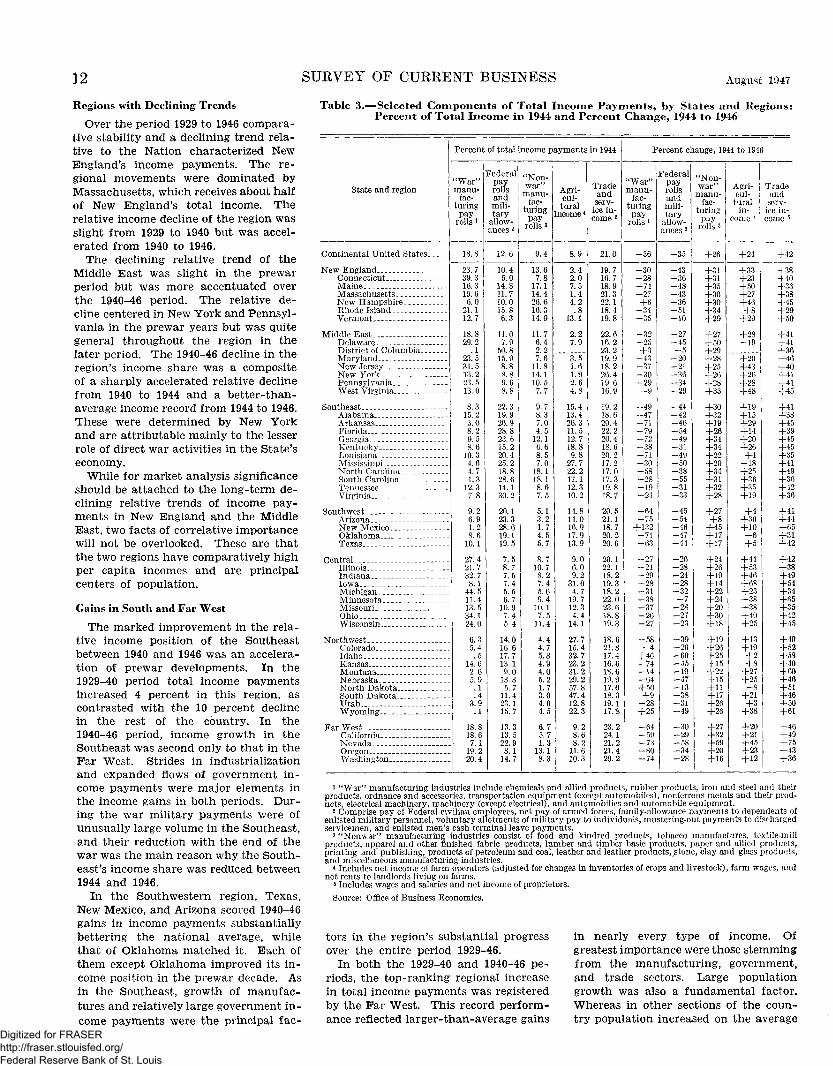
Table 3.—Selected Components of Total Income Payments, by States and Regions:Percent of Total Income in 1944 and Percent Change, 1944 to 1946
State and region
Continental United States
New EnglandConnecticutMaineMassachusettsNew Hampshire .Rhode IslandVermont
Middle EastDelawareDistrict of Columbia.MarylandNew JerseyNew YorkPennsylvaniaWest Virginia
SoutheastAlabamaArkansasFloridaGeorgiaKentuckyLouisianaMississippiNorth Carolina.South Carolina-.TennesseeVirginia
SouthwestArizonaNew Mexico.OklahomaTexas
CentralIllinoisIndianaIowaMichigan-_Minnesota.MissouriOhioWisconsin..
NorthwestColoradoIdahoKansasMontanaNebraskaNorth Dakota..South Dakota..UtahWyoming
Far WestCaliforniaNevadaOregonWashington
Percent of total income payments in 1944
"War"manu-
fac-turing
payrolls i
18.8
23.739.316.319.66.0
21.112.7
18.829.2
.123.531.513.223.513.0
Federalpayrollsandmili-tary
allow-ances 2
8.315.23.08.29.58.6
10.34.64.71.3
12.37.8
9.26.91.28.6
10.1
27.421.732.78.1
44.511.413.534.124.0
6.35.4.5
14.62.65.9.1.4
3.9.1
18.818.67.1
19.220.4
12.6
10.45.0
14.811.710.015.86.3
11.07.9
50.815.9
9.68.8
22.319.920.928.823.615.220.425.218.828.614.130.2
20.123.328.619.119.5
7.58.77.57.45.56.7
10.97.45.4
14.016.617.713.19.0
13.35.7
11.423.115.7
13.313.522.98.1
14.7
'Non-war"
manu-fac-
turingpay
rolls s
9.4
13.67.8
17.114.426.616.314.9
11.76.42.27.6
11.814.110.57.7
9.78.37.04.5
12.16.68.57.0
18.118.18.67.5
5.13.21.74.55.7
8.710.78.27.45.69.4
10.17.5
11.4
4.44.75.84.94.05.21.73.04.04.5
6.75.71.3
13.18.3
Agri-cul-
turalncome4
8.9
2.42.07.51.44.2.8
13.1
2.27.9
3.51.61.92.64.8
15.413.426.311.512.718.89.8
27.722.217.112.310.2
14.814.016.917.913.9
9.06.09.2
31.04.7
19.712.34.4
14.1
27.715.432.723.231.229.257.847.412.822.3
9.28.68.2
11.610.3
Tradeandserv-
ice in-come 5
21.0
19.716.718.921.322.118.419.8
22.616.223.219.918.226.419.616.9
19.218.620.422 220 418.620.217.217.017.319.818.7
20.521.118.720.220.6
20.122.118.219.318.222.023.618.819.3
18.621.817.416.618.619.917.018.319.117.8
23.224.121.221.420.2
Percent change, 1944 to 1946
War"manu-
fac-turingpay
rolls i
Federalpayrollsandmili-tary
allow-ances 2
- 3 6
- 3 0- 2 8—74- 2 7+6
- 3 4- 3 5
- 3 2- 2 5+3
- 4 3- 3 7- 3 0- 2 9
- 9
- 4 9- 4 7- 7 1- 7 9- 7 2- 3 8- 7 1- 3 0- 5 8- 2 8- 1 9- 2 4
- 6 4- 7 5
+132- 7 1- 6 3
27- 2 1- 2 9- 2 8- 3 1- 3 8- 3 7- 2 6- 2 7
- 5 8- 4
+46- 7 4- 1 4- 6 4+50+9
- 2 8+25
- 6 4- 5 9- 7 3- 8 0- 7 4
- 3 5
- 4 3- 3 6- 4 8- 4 3- 3 6- 5 1- 1 0
- 2 7- 4 5- 5
- 2 0- 2 1- 3 6- 3 4- 2 9
- 4 4- 4 2- 4 6- 5 4- 4 9- 3 1- 4 9- 5 0- 3 8- 5 5- 3 1- 3 3
- 4 5- 5 4- 4 6- 4 7- 4 4
- 2 6- 2 8—24- 2 8- 3 2
n- 2 8- 2 7- 2 3
- 3 9- 2 6- 6 0- 4 5—19—47- 1 3- 3 8- 3 1- 4 9
- 3 0- 2 9- 5 8- 3 4
'Non-war"manu-
fac-turingpay
rolls 3
+26
+31+31+35+30+30+34+29
+27+50+29+28+25+26+28+33
+30+32+19+26+34+34+22+20+34+31+32+28
+27+8
+45+17+17
+24+26+19+14+22+24+20+30+18
+19+26+25+15+22+15+11+17+26+26
+27+32+59+20+16
Agri-cul-
turalin-
come 4
f-24
+33+23+50+27+46+8
+29
+28- 1 9
+20+43+26+28+48
+19+15+29+14+20+26+4
-18+25+36+35+19
+4+30+10
- 6+5
+44+53+46+68+23+38+38+40+25
+13+19+2+8
+27+25
- 8+21+3
+38
+20+21+45+23+12
Tradeandserv-
ice in-come 5
+42
+38+40+33+38+45+29+50
+41+41+36+46+40+41+41+45
+41+38+45+39+45+45+35+41+49+36+42+36
+41+44+65+31+42
+42+38+49+54+34+65+35+42+45
+49+52+58+40+60+46+51+46+50+61
+46+49+75+43+36
1 "War" manufacturing industries include chemicals and allied products, rubber products, iron and steel and theirproducts, ordnance and accessories, transportation equipment (except automobiles), nonferrous metals and their prod-ucts, electrical machinery, machinery (except electrical), and automobilies and automobile equipment.
2 Comprise pay of Federal civilian employees, net pay of armed forces, family-allowance payments to dependents ofenlisted military personnel, voluntary allotments of military pay to individuals, mustering-out payments to dischargedservicemen, and enlisted men's cash terminal leave payments.
s "Nonwar" manufacturing industries consist of food and kindred products, tobacco manufactures, textile-millproducts, apparel and other finished fabric products, lumber and timber basic products, paper and allied products,printing and publishing, products of petroleum and coal, leather and leather products,.stone, clay and glass products,and miscellaneous manufacturing industries.
4 Includes net income of farm operators (adjusted for changes in inventories of crops and livestock), farm wages, andnet rents to landlords living on farms.
s Includes wages and salaries and net income of proprietors.
Source: Office of Business Economics.
tors in the region's substantial progressover the entire period 1929-46.
In both the 1929-40 and 1940-46 pe-riods, the top-ranking regional increasein total income payments was registeredby the Par West. This record perform-ance reflected larger-than-average gains
in nearly every type of income. Ofgreatest importance were those stemmingfrom the manufacturing, government,and trade sectors. Large populationgrowth was also a fundamental factor.Whereas in other sections of the coun-try population increased on the average
Digitized for FRASER http://fraser.stlouisfed.org/ Federal Reserve Bank of St. Louis

August 1947 SURVEY OF CURRENT BUSINESS 13
by 12 percent between 1929 and 1946, thepopulation of the Far West expanded bytwo-thirds.
The considerably more-than-averageadvance in total income payments by theagricultural Northwest from 1940 to 1946contrasts with the relatively unfavorableexperience of this area in the precedingdecade. In both periods, the incometrends were determined largely by thewidely varying fortunes of Northwesternagriculture.
Stability of Central States' Share
The long-term tendency of the Cen-tral States to receive a comparativelyconstant share of total income paymentsis an interesting composite of differingState trends. These stemmed mainlyfrom the widely different emphases with-in the region placed upon agriculture andheavy industry as sources of income.
The influence of agriculture and heavyindustry is clearly stamped on recent-year changes in income payments in in-dividual States of the Central region.From 1944 to 1946, when pay rolls in their"war" manufacturing industries were re-duced about one-fourth, the industrialStates of Michigan, Indiana, and Ohioreceived smaller shares of income pay-ments. In Iowa, Minnesota, Missouri,and Wisconsin substantial expansions offarm income resulted in increased sharesof income payments in 1945 and 1946.For most oT these States the relativemovements were not in conformity withlonger-term trends, but they very prob-ably should not be construed as reversalsof those trends. This is because of the"short-run" nature of the factors—con-tracting war-industry pay rolls andsharply rising farm income—that deter-mined the movements.
Manufactures and GovernmentThe following two sections provide
data for analysis of the roles of manu-facturing and government in the geo-graphic shifts of total income paymentsover the period 1929-46. The manufac-turing industry is of obvious and basicimportance in conditioning both short-term and long-term changes in the Statedistribution of income. World War IIhas resulted in the considerably greaterinfluence of government on State incomepayments. In 1946, the 36.5-billion-dol-lar total of factory pay rolls and the 29.5billion-dollar volume of income pay-ments by Federal and State and localgovernments together comprised almosttwo-fifths of all income payments to in-dividuals.
Distribution of Factory Pay Rolls
A principal fact revealed by table 5 isthat the pattern of shifts in the State
distribution of factory pay rolls from1929 to 1940 and from 1940 to 1946 wasmuch the same as that noted for totalincome payments. New England and theMiddle East received a declining share ofthe national total; and the Southeast,Southwest, and Far West received in-creasing shares. The relative declinesin New England and the Middle East,however, were not appreciable. Morepronounced was the substantial progressin industrialization made by the Southand Far West—a continuation of up-
trends traced by the Census of Manu-factures as far back as 1889.
From 1929 to 1946, the South and FarWest increased their combined share ofthe Nation's manufacturing pay rollsfrom 15.5 percent to 20.3 percent. Thiswas a relative gain of one-third. It rep-resented largely a relative shift of manu-factures to these areas from the "OldManufacturing Belt" (comprising theeleven States of Michigan, Ohio, Illinois,Indiana, Wisconsin, Connecticut, Massa-chusetts, New York, New Jersey, Penn-
Table 4.—Major Industrial Sources of Income Payments in Each State and Region?Selected Components as a Percent of Total Income, 1940 and 1946
State and region
Continental United States
New England.ConnecticutMaineMassachusettsNew HampshireRhode Island __Vermont
Middle EastDelaware _ _ __District of ColumbiaMarylandNew JerseyNew York _ _PennsylvaniaWest Virginia
SoutheastAlabama. .ArkansasFloridaGeorgia __KentuckyLouisianaMississippiNorth Carolina..South Carolina __TennesseeVirginia ._
Southwest __ __ArizonaNew MexicoOklahomaTexas
CentralI l l i n o i s _ _ _ _ _ _I n d i a n aIowaMichigan _MinnesotaMissouriOhioWisconsin __
NorthwestColoradoIdaho __ . __-KansasMontana __NebraskaNorth DakotaSouth Dakota _UtahWyoming
Far WestCalifornia _ _ _ _ _Nevada _ _OregonWashington
Manufacturingpay rolls
1940
20.3
26.734.023.323.826.830.618.8
21 225.32.8
21.130.417.825.818.5
15.718.78.47.3
16.512.012.410.024.621.718.616.2
8.04.62.47.39.0
25.823.130.710.638.211.816.630.526.1
7.18.48.18.76.46.92.44.08.84.3
13.612.51.8
18.417.6
1946
21.3
30.736.325.628.831.634.321.9
24.229.42.7
21.632.722.826.918.2
15.517.87.87.4
17.312.013.411.621.722.219.214.7
8.94.84.57.6
10.0
26.726.329.510.436.614.517.131.826.9
7.19.27.29.35.67.01.83.37.24.7
14.213.73.5
18.515.4
Agriculturalincome *
1940
7.2
2.02.06.01.12.7.8
10.5
1.95.6
3.61.61.42.25.6
15.414.730.38.4
15.815.810.228.017.518.414.59.9
15.913.720.918.115.1
7.84.67.4
28.44.4
16.99.54.0
11.7
20.310.924.118.822.420.438.031.511.523.1
7.06.59.0
10.37.3
1946
9.8
2.92.4
10.61.54.7
.813.4
2.46.0
4.02.12.02.95.9
16.814.528.613.114.019.910.322.823.020.915.011.4
14.716.915.916.513.9
11.37.9
12.037.8
5.621.214.15.6
15.2
27.715.230.024.931.431.947.146.712.124.6
10.29.5
10.413.511.8
Trade and serviceincome 2
1940
25.2
23.421.323.524.523.521.823.3
25.317.623.824.022.128.123.119.4
25.225.224.131.626.923.825.822.722.222.726.024.7
25.226.023.524.025.6
24.526.621.722.622.326.028.223.623.2
23.926.823.622.621.225.423.023.125.519.5
29.330.125.327.426.3
1946
26.6
24.222.123.625.424.622.823.5
27.821.427.427.123.931.424.720.2
24.924.025.030.827.422.327.624.421.021.325.224.0
27.528.226.426.027.9
24.926.124.321.623.628.426.424.324.2
24.527.624.623.023.525.422.921.726.523.0
31.532.432.628.928.1
Government in-come payments 3
1940
12.4
11.88.4
14.212.714.212.511.9
12.57.8
42.011.910.412.011.19.7
13.011.711.613.012.512.413.613.610.814.512.716.7
12.518.616.114.611.1
10.810.510.611.110.313.510.610.112.2
15.117.614.514.414.714.213.315.015.416.5
14.614.415.913.016.3
1946
17.0
15.910 619.417.815.417.114.1
16.612.149.320.216.314.315.816.4
21.522.420.822.920.719 321.424.917.821.019.627.1
21.120.126.823 220.2
14 013.613.812 214.615.516.213.612 5
17.321 316 017 115 415.013 914.125 514.6
18 217.916 615 O21.9
1 Includes net income of farm operators (adjusted for change in inventories of crops and livestock), farm wages, and netrents to landlords living on farms.
2 Includes wages and salaries and net income of proprietors.3 Consists of pay of State and local and of Federal civilian employees, net pay of the armed forces, family-allowance
payments to dependents of enlisted military personnel, voluntary allotments of military pay to individuals, mustering-out payments to discharged servicemen, enlisted men's cash terminal leave payments, interest payments to individuals,public assistance and other direct relief, work relief, veterans' pensions and benefits, State government bonuses to WorldWar II veterans, and benefit payments from social insurance funds.
Source: Office of Business Economics.Digitized for FRASER http://fraser.stlouisfed.org/ Federal Reserve Bank of St. Louis

14 SURVEY OF CURRENT BUSINESS August 1947
Table 5.—Percent Distribution of, and Relative Changes in, Total ManufacturingWages and Salaries, by States and Regions, Selected Years, 1929—46
State and region
Continental United States
New EnglandConnecticutMaineMassachusettsNew Hampshire.Rhode IslandVermont
Middle EastDelawareDistrict of ColumbiaMarylandNew JerseyNew YorkPennsylvaniaWest Virginia
SoutheastAlabamaArkansasFloridaGeorgiaKentuckyLouisianaMississippiNorth Carolina^South Carolina-.TennesseeVirginia
SouthwestArizona^New MexicoOklahomaTexas
CentralIllinoisIndianaIowaMichigan,.Minnesota.Missouri-.-OhioWisconsin..
NorthwestColoradoIdahoKansasMontanaNebraskaNorth Dakota..South Dakota..UtahWyoming
Far West..*California—NevadaOregonWashington.
Addendum: U. S. totals (mil-lions of dollars)
Percent distribution
1929
100. 00
11.342.74.56
5.99.56
1.20.29
34. 62.20.16
1. 175.49
15. 9410. 83
.83
7.77.79.31.46.91.66.74.34
1.27.53.90.86
1.94.10.03.45
1. 36
36. 609.893. 36
.876.721.192.249.263.07
5.833.84.01.69
1.29
1940
100. 00
10.633.13
.655.13.47
1.02.23
33. 52.39.17
1.686.20
13.7410.43
.91
9.23.93.27.43
1.05
1.81.77
1.121.19
2.04.07.03.39
1.55
36.438.633.71
.858.511.092.068.822.76
1.5532
.12
.43
.14
.25
.04
.06
.15
.04
6.604, 57
.01
.761.26
16, 299 15, 372
1943
100. 00
3.27.74
4.58.32.87.20
30.28.34.09
2.055.89
12.418.84
8.611.04.24.67
1.08.59.78.30
1.35.59
1.00.97
2.84.10.03.50
2.21
35.087.253.78
788.801.162.018.712.59
1.87.35.07.80.09.31.02.04.16.03
11.347.90.06
1.29
40, 693
1944
100. 00
1945
100. 00
9.393.00.68
4.34.32.85.20
30.06.34.09
1.855.89
12. 398.84.66
9.061.07.26.71
1.20.65.88.32
1.34.58
1.12.93
3.11.14.03.55
2.39
35.397.803.77.80
8.411.172.008.712.73
1.89.27.08.91.08.34.02.04.12.03
11.107. 66.04
1.24 |2.16
9.462.84.63
4.55.37.86. 21
31.28.32.11
1.765.77
13. 439.12
9.621.10.28.62
1.22.68.85.34
1.50.68
1.331.02
2.94.14.05.54
2. 21
35.168.263. 63
.847.431.272.168.782.79
1, 88.33.09.77.09.35.03.05. 13.04
,. ~4.021.091.81
1946
100. 00
10.222.89.655.01.48.96
32.31.35.131.635.5914.489.29.84
10.041.03.29.491.23.72.74.381.82.871.351.12
2.41.08.06.391.88
35.488.763.59.877.481.242. 008. 642.84
1. 65.35.1252
.1029.03.06. 14.04
7.895. 65.02.891. 33
Percent change
1929 to
42,621 37,903 ! 36,045
- 1 2+8
+ 11- 1 9- 2 1- 2 0- 2 5
- 9+88+2
+35+7
- 1 9- 9+4
+12+11- 1 9- 1 2+9- 1
- 1 3- 2 0+35+37+18+30
-1-36+ 12-18+7
-6-18+4-8
+19-14-13-10-15
-23-18—26— 22-23-31-42-9-16—20
+ 12
1940 to 1940 to
+ 177 I +134
1944 to1946
-15
+ 145+ 165+ 187+ 135+90
+130+139
+149+137+46
+207+163+150+135+ 102
+172+220
+126+117+134+129+138+121+138
+126+109+85
+128+111+147+109+115
+ 155+159
- 8- 1 8- 1 8
- 3+26
—4. . . .
- 9- 2
+26- 2 6- 2 0
- 1- 1 1+7- 6
- 1 9+171+359+214+163+258+208+106+ 108+ 176+117
+323+435+167+293+328
+169+151+181+159+174+198+169 i+174 |+175 I
+237 '+ 133+78
+484+70
+269+79+95
+115+92
+366+365+918+354+374
+149+ 168 i+174 !+146 I+153 I+208 !+ 136 |+164 I+182 S+121 !
+176 '+173+383+133+184
Q
- 4 2- 1 3- 6
- 2 9
+ 15+27+2+2
- 3 5- 4 9+80- 4 1- 3 4
+123+138+127+140+106+167+134+130+141
+150+156+125+182+83
+168+102+126+113+143
+180+190+382+175+148
- 1 5- 5
- 1 9- 8
- 2 5- 1 0- 1 3- 1 6- 1 2
- 2 6+10+26- 5 2+7
- 2 7+13+16
- 1+26
- 4 0- 3 8- 5 3- 3 9- 4 8
Source: Office of Business Economics.
sylvania, and Maryland). The aggre-gate share of the Nation's factory payrolls received in this Belt declined from74.5 percent in 1929 to 72.8 percent in1940, and to 70.1 percent in 1946.
Of considerable interest are the dataon rates of changes in manufacturingwages and salaries for the periods 1940-44 and 1944-46. These measure geo-graphic differences in the impact of warproduction and of subsequent reconver-sion. For example, spectacular increasesin factory pay rolls of 366 percent and323 percent, respectively, are shown forthe Far West and Southwest for the1940-44 period. So great were these war-period expansions that sharp contrac-
tions of two-fifths from the 1944 levelsleft factory pay rolls in these regions in1946 nearly three times as large as in1940.
Another point of interest is that innearly every State where manufacturinggrowth during the war lagged behindthat of the Nation the experience from1944 to 1946 was relatively favorable.This readjustment of wartime distor-tions explains much about interstatedifferences in 1944-46 changes in totalincome payments.
Shifts in Manufactures
For more detailed analysis, the datain table 5 can be supplemented by those
in table 6, which shows percentage dis-tributions by States of manufacturingwages and salaries separately for nine-teen types of manufactures.
The substantial relative gains alreadynoted for the Far West, Southeast, andSouthwest are apparent also from thistable. Each of these regions increasedits share of the Nation's total from 1940to 1946 in fifteen of the nineteen typesof manufactures. These relative gainswere shared by nearly all States of theregions. On the other hand, New Eng-land, the Middle East, and the CentralStates sustained relative declines from1940 to 1946 in most manufacturingindustries.
Comparisons of the 1940 and 1946 dis-tributions of pay rolls for the severalgroups of manufactures show a numberof significant geographic shifts.
In some cases, the geographic shifts, asmeasured by relative gains and losses inwage-and-salary payments, representsimply interchanges among establishedcenters of production. In the produc-tion of textile-mill products, there wasfurther concentration in the Southeast,mainly in Georgia and South Carolina,with a corresponding relative decline inthe Middle East, mainly in Pennsylvania.All of these States are major textile cen-ters. In lumber manufacturing, the pro-nounced relative shift from the Far Westto the Southeast involved the two largestlumber-producing areas. The two lead-ing tobacco-manufacturing States, NorthCarolina and Pennsylvania, substantiallyimproved their relative positions, whileKentucky, New Jersey, and New York(also important in tobacco manufac-tures) sustained relative losses. Simi-larly, New York State, with nearly one-half the Nation's apparel industry, scoredan appreciable gain in apparel from 1940to 1946 that was matched by relativelosses in several of the comparativelyfew other States, such as Illinois, NewJersey, and Massachusetts, in which asignificant portion of the industry is lo-cated. Also in industries such as iron andsteel, electrical machinery, and productsof petroleum and coal, such shifts as oc-curred were restricted for the most partto the established producing areas.
In several types of manufactures,however, there appear to be relativeshifts to newer areas. In paper produc-tion, the importance of the South in-creased over the period 1940-46, whilethat of New England declined. In themanufacture of chemicals and alliedproducts, there were relative decreasesin the large producing States of NewYork, New Jersey, Massachusetts, Illi-nois, and Ohio. Significant relativegains occurred in Tennessee and Texas.In the manufacture of food, the Southand Far West achieved gains, in contrastDigitized for FRASER
http://fraser.stlouisfed.org/ Federal Reserve Bank of St. Louis

August 1947 SURVEY OF CURRENT BUSINESS 15
to relative declines in several importantfood-producing States in the East. Inthe manufacture of nonferrous metalsand of rubber products also the Southand Par West, as "newer" areas, madeappreciable progress. The Far West(especially California) substantially in-creased its share of total pay rolls in fur-niture production, while Illinois, Michi-gan, and Ohio, three of the largest fur-niture-producing States, sustained re-duced shares.
In transportation equipment the 1946State distribution differed from the 1940distribution primarily in the sharply re-duced share of Michigan and the in-
creased shares of the Pacific CoastStates. Aside from the fact that auto-mobile production last year was ham-pered by reconversion difficulties andwas far below the projected postwarlevel, an evaluation of this prewar topostwar shift in the transportationequipment industry should take into ac-count that the industry changed mark-edly in composition from 1940 to 1946.In the latter year, as compared with 1940,aircraft production and shipbuildingwere of much greater importance andautomobile production of much lesserimportance. This is of significance inthe present instance because the Pacific
Coast States are leaders in aircraft pro-duction and shipbuilding and Michiganis the leading automobile-producingState.
In all other types of manufactures,there were no significant shifts amongestablished centers of production orevidence of the development of newcenters.
Government Income Payments
Data for the analysis of the influenceof government on the State distributionof income payments are provided in ta-bles 7 and 8. The former shows theState distribution of government income
Table 6.—Percent Distribution, by States and Regions, of Wages and Salaries in Specified Manufacturing Industries, 1940,and 1946
State and region
Continental UnitedStates
New EnglandConnecticutMaineMassachusetts -New HampshireRhode IslandVermont
Middle EastDelawareDist of ColumbiaMarylandNew JerseyNew YorkPennsylvaniaWest Virginia
SoutheastAlabamaArkansasFloridaGeorgiaKentuckyLouisianaMississippiNorth CarolinaSouth CarolinaTennesseeVirginia
Southwest. _ArizonaNew MexicoOklahomaTexas
CentralIllinois...IndianaIowaMichiganMinnesotaMissouriOhioWisconsin
NorthwestColoradoIdahoKansas .MontanaNebraskaNorth Dakota .South Dakota _UtahWyoming.. .
Far West-CaliforniaNevadaOre aonWashington
Addendum: U. S.totals (millions ofdollars)
Food andkindredproducts
1940
100.00
5.16.63. 35
3.59.1138
.10
27.07.2349
2.024.34
12.577.01.41
9.09.54.33.88
1.121.371.30.33.86.37
1.10.89
4.33.19.08.90
3.16
37.2611.393.263 014.083.333.565.463.17
6.081 03.28
1.7833
1.41.22.43.49.11
11.018.25.05
1.001.71
1,667
1946
100. 00
4.34.56.48
2.67.1532
.16
24.38.2734
2.053.43
11.616.27.41
11.0464
.431.411.341.691.44.39.92.41
1.311.06
4.56.25.10.92
3.29
36.1411.002.982 973.943.363.464.743.69
6.3197
.401.89
281.59.22.40.47.09
13.239.62.05
1.312.25
3,580
Tobaccomanufactures
1940
100.00
1.70.53
.64
.53
31.70.11
.218.726.81
14.681.17
53.30
7.55
7.77.96
22.981.381.60
11.06
.11
.11
10.961.061.17
1.81.11
3.093.40
.32
2.232.23
94
1946
100.00
1.65.47
.71
.41
.06
29.29.06
.065.684.56
17.871.06
57. 58.36
8.76.30
4.91.59
27.871.121.48
12.19
.36
.36
9.521.241.18
1.24.06
2.193.25
.36
1.601.60
169
Textilemill
products
1940
100.00
25.304.232.00
11.721.355.64.36
31.11.31
1.466.628.83
13. eo
.29
35.562.7406
.025.66.28.1528
14.447.032.762.14
.62
.08
.54
6.321.33.84.12
1.16.38.27
1.081.14
.06
.06
1.03.75
.22
.06
1,182
1946
100. 00
25.533.932.24
11.611.835.41.51
28.10.26
1.296.178.86
11.24.28
39.253.62.08
7.12.27.14.34
14.728.252.402.31
.70
.01
.07
.62
5.421.22.57.08.53.45.27
1.36.94
.03
.03
.97
.62
.29
.06
2,608
Apparel andother finishedtextile prod-
ucts
1940
100. 00
7.332.17.15
4.63.07.24.07
63.63.20
2.477.42
43.409.98
.16
5.95.32.10.08
1.44.56.44.51.46.14
1.02.88
1.05
.021.03
18.146.831.70.30.84.72
3.473.66.62
.27
.09
.09
.05
.04
3.633.15
.21
.27
916
1946
100. 00
6.171.48.13
4.17.07.21.11
65.34.10.01
1.856.49
47.199.51.19
6.79.35.12.19
1.63.67.39.60.52.48
1.10.74
1.43.01.01.06
1.35
15.185.691.16.28.65.64
2.972.89.90
.42
.12
.14
.09
.07
4.6741.9
.20
.28
2,332
Lumber andtimber basic
products
1940
100.00
4.15.17
1.93.67.71.04.63
5.99.06.13.56
! .501.721.701.32
29.793.213.862.452.081.173.773.143.252.142.372.35
4.41.36.34.46
3.25
13.191.781.071.723.02.96
1.03.86
2.75
3.96.13
2.45.10.82.10
.15
.06
.15
38.517.90.02
13.1717.42
477
1946
100. 00
4.84.14
2.48.81.76.04.61
7.60.06.07.57.41
2.992.061.44
33.204.113.741.793.811.393.283.773.932.332.352.70
4.74.49.30.31
3.64
12.071.501.311.092.74.99
1.171.052.22
3.64 1.30
1.93.1182
.09
.15
.10
.14
33.917.05.05
14.4412.37
1,032 '
Furniture andfinished lum-ber products
1940
100.00
7.86.80
1.104.17.94.23.62
24.22.37.07
1.103.05
12.756.60.28
17.58.44.80
1.311.421.77.85
1.064.45.78
1.952.75
1.97.07
.231.67
39.2411. 315.62.62
7.201.332.227.323.62
.79
.21
.23
.21
.09
.05
8.345.64
1.421.28
436
1946
100. 00
8.27.86
1.314.19.98.18.75
23.26.19.06.93
3.1913.245.33.32
18.88.66
1.121.211.811.99.87.69
5.04.81
2.412.27
2.26.09.02.26
1.89
34.409.594.73.72
5.571.272.436.353.74
.88
.2301
.2103
.24
.02
.11
.03
12.058.51
1.502.04
966
Paper andallied
products
1940
100.00
17.861.694.369.151.90.34.42
30.44.62.10
1.094.23
15.428.29.69
10.80.91.52.91.85.08
2.10.26
1.61.81.75
2.00
.97
06.91
32.396.311.98
286.211.591.516.917.60
.42
.06
.26
.08
.02
7.122.00
1.353.77
504 1
1946
100. 00
15.441.653.817.671.47.39.45
29.52.33.11
1.104.94
15.067.69.29
13.151.05.57
1.081.49.09
2.1585
1.671.33.86
2.01
1.06
09.97
33.586.521.96
285.812.131.897.487.51
.46
.11
.26
.07
02
6.792.41
1.203.18
1,167
Printing, pub-lishing and
alliedindustries
1946
100.00
7.661.56.25
4.92.26.53.14
38.19.13
1.301.392.99
23.938.07.38
6.06.40.24.72.69.74.56. 15.59.23.97.77
2.92.17.0863
2.04
35.1214.132.031 253.512.042.827.092.25
2.66.5314
.6322
.56
.13
.14
.24
.07
7.395.78
05.57.99
1,022
1946
100.00
6.931.45.21
4.45.28.42.12
39.39.10
1.391.282.63
26.317.34.34
5.99.41.24.77.79.76.50.14.58.20.94.66
2.89.16.0857
2.08
34.7414.891.961 083.172.212.586.832.02
2.23.4611
.5715
.45
.11
.12
.20
.06
7.836.09
05 1.59
1.10
1,954
Chemicalsand alliedproducts
1940
100.00
5.681.80.07
3.56.03.18.04
45. 253.77.05
1.6515.5214.206.883.18
13.47.53.25.55
1.27.39
1.25.48.70.36
3.634.06
1.96.09.02
231.62
28.297.612.89
605.25.94
2.747.31.95
.96
.16
.51
.15
.03
.11
4.393.90
.16
.33
811
1946
100. 00
4.971.85.08
2. 72
.20
.05
42.133.10.05
1.4812.9313.697.493.39
16.33.61.26.60.95.82
1.20.50.60.33
6.234.23
3.87.08.30. 24
3.25
25.856.963.02
655.03.83
2.386.08.90
1.30.15.01.72.04.27
.0308
5.554.17
05.16
1.17
1,966
1Products ofpetroleumand coal
1940
100.00
1.85.36
1.33
31.48
1.9810.068.08
10.81.55
6.981.01
55.03.10.78
4.32
.06
.10
.03
22.12
104 94
17. 08
19.296.536.72
1.04.49.68
3.38.45
4.51.13.06
2.60.49
"""."63"
32.88
13.7713.67
.10
308
1946
100. 00
1.58.31
1.04
29.42.09
1.167.496.87
13.19.62
9.69.8072
.20
.507.03
03
.07
.23
.11
21.09
124 03
16.94
18.996.695.20
1.04.50
1.044.20
.32
4.04.12.05
2 05.34.04.01
341.09
15.1915.05
.07
.07
740
Digitized for FRASER http://fraser.stlouisfed.org/ Federal Reserve Bank of St. Louis

16 SURVEY OF CURRENT BUSINESS August 1947
Table 6.—Percent Distribution, by States and Regions, of Wages and Salaries in Specified Manufacturing Industries, 1940*and 1946—Continued
Continental United States
New England _ . .__ConnecticutMaine - -MassachusettsNew HampshireRhode IslandVermont -
Middle EastDelaware -District of ColumbiaMar viandNew JerseyNew YorkPennsylvania. _ _West Virginia
SoutheastAlabamaArkansasFloridaGeorgia _KentuckyLouisianaMississippi..North CarolinaSouth CarolinaTennesseeVirginia
Southwest _- _ArizonaNew Mexico _ _OklahomaTexas
CentralIllinoisIndianaIowaMichiganMinnesotaMissouriOhio _.Wisconsin
Northwest - - --Colorado - -IdahoKansasMontanaNebraskaNorth Dakota _South DakotaUtah - -.Wyoming
Far WestCaliforniaNevadaOregonWashington
Addendum: U. S. totals (millions ofdollars)
Rubberproducts
1940
100.00
15. 864.94
.048 27
2.61
17.63.32
" L 2 1 "8.194.503.41
3.29.92
.48
24
!os
1.29.28
.16
.04
04.08
56.872.574.90
.368.07
.04
.3238.56
2.05
1.371.33
.04
4.824.74
.04
.04
249
1946
100.00
16.043.77
.079.85
.122.01
.22
15.53.54
~~~~65~6.293.274.78
5.641.73
.01
.07
.09
.01
.03
.52
.20
2.76.22
.57
45.12
53.861.684.76
.477.36
.34
.5336.32
2.40
2.481.98.01.32
.17
5.885.79
.05
.04
758
Leather andleather
products
1940
100.00
30.40.69
3.9919.475.98
.11
.16
33.13.85
" I " 09"3.67
19.267.84
.42
4.36.03
.58
.48
.03
~~~~32~
1.511.41
.32
.32
30.147.79
.64
.191.73
.378.544.925.96
.29
.21
.03
.05
1.361.17
.11
.08
376
1946
100.00
28.73. 55
3.65 |19. 324.94
.13
.14
35. 62.81.01.81
2.8523.81
6.91.42
5.19.01.07.02.49.56.01
"~~39~
2.421.22
.61
.61
27.347.57
.66
.241.47.43
7.923.825.23
.38
.27
.05
.05
.01
2.131.89
.12
.12
838
Stone, clayand glassproducts
1940
100.00
1946
100.00
5.91.86.27
5.131.18.16 !
3 31 f 9.30.23.21
1.03
40.51.06.17
1.396.969.71
16.445.78
8.42.93.32.44
1.22.82.99
i .29.68.40
1.231.10
2.03.06.0268
1.27
35.177.534.541.062.411.612.81
14.62.59
1. 56.42.04.48.10.21.02.04.1906
6.405.51.04.19.66
526
.21
.37
.91
39.98.06.05 ;
1.466.399.87
15.836.32
8.12.91. 3 9 i.43.95.74.93.26.71.50
1.43.87
2.88.14.0586
1.83
34.387.264.26
.912.521.922.95
13.77.79
1.77.4604
.56
.09
.23
.0306
.2208
7.746.52.08.30.84
1,151
Iron and steeland theirproducts
1940 1946
I100.00 ; 100.00
8.04 7.49 14.01 3.71
.07 .10 !3 08 2.80 ;
.07
.73
.08
36.82.22.02
3.186.95
21.711.97
4.782.35.03.05.22.86.13.01.10.0173
.12 !
.63 i
.07
33.14.21.02
2.333.087.03
19.011.46
4.652.05.04.10.27.67.16.02 i.16 !.02
Ri
29 1 .35
.62
.02
.0121
.38
45.3410.596.71.46
6.51.72
1.3916.912.05
.90
.5401
.16
.01
.07
.01
.10
3.503.01
.21
.28
2,113
1.08.06.01
24. 77
47.7611.07
5.61.71
10.801.241.43
14.422.48
1.10.52.02.22.02.12
.01
.19
4.784.11
.27
.40
4, 511
Nonferrousmetals and
their products
1940
100.00
1946
100.00
21.44 i 17.8715.18 10.79
.024.30
.021.92
34.47.06
~~i~32~9.02
14.937.831.31
3.35.17.15.02.08
.01 14.79 ;
.072.20
.01
33.46.04.02.85
7.6415.897.961.06
5.09.82.14.02. 18
63 i 1 94-.13
1.54.36
1.98.44.04
58.92
32.6310.65
2.74.12
6.32.40
1.238.622. 55
2.69.29.02.06
1.25.15.02
.90
3.442.55
.06
.83
521
.06 ,
1.97.47
2.40.32.3847
1.23
33.109.893.30
.185.59.72
2.218.242.97
1.89.29.09.04.74.22.01.04.44. 02
6.194.75.21.22
1.01
1,335
Machinery(except
electrical)
1940
100 00
1946
ioo no !
Electricalmachinery
1940
inn on
1946
mn no
Transporta-tion equip-
ment includ-ing autos
1940
inn on
1946
inn nn !
Miscellaneousmanufacturing
industries
1910
inn nn
1946
inn no
14.445.86.38
5.68.35
1.45.72
24.77.10.01.65
4.689.469.75.12
1.63.14.01.06.28.38.17.03.19.05.22.10
1.97.01
311.65
52.9714.143.911.409.621.031.29
14.467.12
.46
.12
.01
.19
.01
.12
.01
3.763.15
.21
.40
1,454
12.755.38
.335.35.23.98 i.48
23.5112
.01
.624.46
10.577.60.13
2.10.19.02 !.13 j.34.49 !.18 !.10 !.24 ;06 '
.28 !
.07
1.77.01
281.48
55.0213.834.311.43
10.271.361.55
16.036.24
.71
.24
.04
.23
.01
.12
.01
.02
.04
4.143.45
.34
.35
3,928
13.01 14.464.41
7.94.05.61
41.90
.021.09
13.5413.6313.49
.13
.64
. : o s .1 .02
.11
.35
.02
.0202
4.52.06
9.08.08.70.02
38.60.01.04
1.7511.8014.0510.74
.21
.96
.03
"~"02~.10.40.02.07in
.05 .21m
.22
05.17
42.0413.876.31
.203.15
.662.12
13.422.31
.10
.02
.05
.03
2.091.98
.06
.05
635
.21
.04
04.13
42.7815.997.40.48
3.08.98
2.489.812.56
.52
.03
.28
.21
2.472.31
.07
.09
1,947
4.712.52.38
1 76
5.12 !2 38 i
.401 QR
?,n"."To*"
22.05.19.03
2.287.556.765.21
.03
3.31.30
~"~24".26.20.23.13.06.01.20
1 68
.53
06.47
59.582.355.35
.1342.34
.201.365.362.49
.34
.02
.29
.01
.02
9.488.09
.101.29
1,593
.16
22.07.21
~"3~46~5.597.205.46
.15
4.64.54.02.53.37.23.54.49.38.07.20
1 27
2.05.01
231.81
48.803.675.61
.3127.59
.311.397.272.65
1.11.11
.89
.10
.01
16.2112.66
.822.73
3,715
14.69 ! 14.254 06 3.24.08 ! .07
7.52 i 7.89.49 .44
2.36.18
53. 54.06.10.92
I 8.67i 36.06
7.381 .35
1.88
~~~."68~.18.35.35.08
"""."16"! .04
.37
.33
.47
.02
04.41
26.2911.371.701.092.83
.661.505.661.48
.67
.25
.02
.08
.02
.18
.02
.02
.08
2.462.03
.25
.18
488
2.31.30
51.12.24.07.97
8.7335.165.74.21
1.91.08.12.17.30.30.05.04.11.01.42.31
.56
.01
.01
.07
.47
27.6411.321.221.184.41.88
1.345.651.64
.86
.45
.04
.11
.03
.13
.01
.01
.07
.01
3.663.21
.01
.22
.22
1,348
Source: Office of Business Economics.
payments for 1929, 1940, and 1946. Cor-relative data included in the table arepercentage distributions of private in-come payments and percentages of totalincome payments formed by governmentincome payments. Table 8 furnishesseparate data on income payments fromthe Federal Government, State and localgovernments, and social insurance funds.To assist in an evaluation of the relativeimportance of the three categories incontributing to changes in the shares oftotal government income payments re-ceived by the States, the percentages oftotal government income payments ac-
counted for by each of these three in1946 also are shown in the table. Thesedata, moreover, are of considerable in-terest in themselves. For this type ofanalysis, changes in national totals—shown as an addendum in the table—also must be taken into account.
Government income payments com-prise payments to individuals in suchforms as civilian wages and salaries, mili-tary payments, interest, veterans' pen-sions and benefits, payments to farmers,relief, and social insurance benefits. Itshould be emphasized that the datameasure only income payments flowing
directly to individuals. They do not takeaccount of income arising from govern-ment purchases from business, or theindirect, secondary effects of governmentspending on the general income stream.
For each of the years 1929, 1940, and1946 the share of the national total ofgovernment income payments receivedby the States, relative to the share ofprivate income payments received,tended to vary inversely with per capitaincome levels. In the low-income Statesof the South and Northwest the share oftotal government income payments re-ceived exceeded the share of private in-
Digitized for FRASER http://fraser.stlouisfed.org/ Federal Reserve Bank of St. Louis

August 1947
come payments. Conversely, in theStates with high per capita incomes theshare of government income paymentsreceived was generally smaller than theshare of private income payments. Anotable exception is the Par West, wherehigher-than-average incomes were asso-ciated with a relatively large share ofgovernment income payments.
Larger Role of Government in 1946The share of all government income
payments received by New England and
SURVEY OF CURRENT BUSINESS
the Middle East declined from 1929 to1940, and from 1940 to 1946. Over thisperiod increasing shares accrued to theSoutheast, Southwest, and Far West. Ineach of these five regions, changes in theshare of government income receivedwere in the same direction—and indeedcontributed to—changes in the share oftotal income payments. An interestingexception to pattern, however, is theNorthwest. Whereas the region's shareof total income payments rose sharply
Table 7.—Percent Distribution of Private Income Payments and Total GovernmentIncome Payments, and Total Government Income Payments as Percent of TotalIncome Payments, by States and Regions, 1929, 1940, and 1946
State and region
Continental United States _.
New England _ ___ _ - ._ConnecticutMaine -Massachusetts ___ _ ._ - -New HampshireRhode Island __Vermont
Middle EastDelawareDistrict of Columbia _ _ .MarylandNew Jersey.- _ _ ___New YorkPennsylvania _ _West Virginia _ __
SoutheastAlabamaArkansas . __. _FloridaGeorgiaKentuckyLouisiana . _Mississippi- __ __ _ _ ______North CarolinaSouth Carolina _ _ _ _ _ _ ._TennesseeVirginia, ___ _.
SouthwestArizonaNew MexicoOklahoma..- ___ ___Texas-
Central.- -_ _IllinoisIndianaIowaMichigan _ _Minnesota.-. « . _Missouri. .OhioWisconsin _
NorthwestColoradoIdahoKansas , . _ __ _MontanaNebraska __. _._ _ _North DakotaSouth DakotaUtah __Wyoming
Far WestCaliforniaNevada . .OregonWashington
Privat
1929
100. 00
8.231.79.54
4.58.36.70.26
33.89.27.58
1.343.96
17.739.04.97
10. 37.97.67.82
1.151.161.03.65
.116.51
1.091.16
5.0028
.181.303.24
29.528 672.271.624.261.732.706 032.24
4.63.75.27
1.17.38.9131
.34
.32
.18
8.366.26.09.71
1.30
Percent distribution
3 income pay-ments i
1940
100. 00
8.211.98.56
4.39.35.68.25
32.33.33.80
1.634.28
15.848.411.04
11.64.98.62
1.191.27]. 151.08.53
1.51.68
1.211.42
5.02.29.24
1.043.45
29.107 772.501.594.651.812.576 062.15
4.10.7229
.93
.39
.68
.28
.28
.34
.19
9.607 26
.12
.831.39
1946
100. 00
7.201.84.53
3.67.33.60.23
28.58.27.63
1.543.68
14.007.47.99
13. 071.15.75
1.301.451.241.11.63
1.77.79
1.451.43
5.43.36.25
1.003.82
29.217 402.691.864.481.822.596 042.33
4.90.7635
1.17.40.89.37.40.36.20
11. 618 70
.141.041.73
Total government in-come payments 2
1929
100. 00
8.161.41.60
4.75.44.67.29
31.22.21
3.161.383.92
14.726.94.89
12.201.04.77
1.161.241.211.16.77
1.32.74
1.191.60
5.3249
.331.343.16
26.926 582.351.734.662.012.395 032.17
6.271.03
381.57.62.97.48.51.42.29
9.917 07.15.95
1.74
1940
100. 00
7.201.18.62
4.17.38.63.22
30.28.19
3.751.463.22
14.046.88.74
13.741.16.83
1.201.471.221.36.94
1.36.96
1.331.91
6.0447
.351.453.77
25.076 242.151. 833.622.302.254 602.08
6.611.12
411.44.61
1.23.55.54.43.28
11.068 21
.15
.871.83
1946
100.00
6.531.04.62
3.78.29.59.21
27.28.18
2.901.883.42
11.226.75.93
17.391.59.96
1.861.831.471.481.031.871.011.732.56
7.1744
.461.514.76
23. 685 652.131.403.761.802.484 621.84
5.401.05
351.23.39.84.37.37.62.18
12.559 16.13.91
2.35
Total government in-come payments as apercent of total in-come payments
1929
7.3
7.35.98.17.68.87.08.2
6.85.7
30.07.67.36.25.76.88.57.88.3
10.17.87.68.28.68.3
10.38.09.9
7.812.012.57.57.2
6.75 77.67.88.08.46.66 27.1
9.79.9
10 19.5
11.57.7
11.010.79.4
11.4
8.68 2
11.99.69.6
1940
13.4
11.98.4
14.612.814.412.512.2
12.68.0
42.012.110.412.011.29.9
15.415.417.113.515.114.116.221.412.217.814.617.1
15.720 218.617.714.4
11.711 011.815.010.716.411.910 513.0
19.919.218.119.219.221.923.722.716.518.9
15.114 816.113.916.8
1946
17.4
16.110.719.817.815.717.216.1
16.812.449.320.516.414.416.016.6
22.022.721.423.221.020.122.025.818.221.320.227.5
21.820 627.624.220.8
14.613 914.313.715.017.216.813 914.3
18.922.517 818.217.216.717.316.426.416.0
18.618 216.915.522.2
i Represents total income payments to individuals minus governmnt income payments to individuals.i Consist of all income payments to individuals by the Federal Government, State and local governments, and social
insurance programs. For specific composition see footnotes to table 8. Differ in definition from total government incomepayments shown in table 4 by the inclusion ol Government payments to farmers. For the special purpose of this tableGovernment payments to farmers are included in government income payments rather than in private income pay-ments as part of agricultural income.
Source: Office of Business Economics.
17
from 1940 to 1946 by virtue of a largeexpansion of farm income, its share ofgovernment income declined, mainly be-cause of reduced Government paymentsto farmers.
For the country as a whole govern-ment income payments increased sub-stantially from 1929 to 1940—from 6.1billions to 10.1 billions. Prom 1940 to1946, however, the volume of governmentincome payments was tripled, whereastotal private income payments wereslightly more than doubled. Reflectinga generally higher rate of increase ingovernment income payments than inprivate income payments, in all regionsexcept the Northwest income paymentsby government formed a larger percent-age of total income payments in 1946than in 1940. As already noted, govern-ment provided a larger impetus to totalincome expansion in the South than inany other area of the country.
Per Capita Income
State estimates of per capita incomepayments to individuals are shown intable 13 for the years 1929-40, 1945, and1946. These are computed by dividingtotal income payments by total popula-tion.2 Per capita income is thus a "perperson," and not a "per family" or "perworker" average.
Since revised population data for1941-44 are not yet available from theBureau of the Census, per capita esti-mates for those years are omitted fromthe table. They will be published in aspecial table in the September issue ofthe SURVEY. The cooperation of theCensus Bureau in furnishing advancetabulations of the State population datafor 1945 and 1946 makes possible thepresentation of per capita income forthose years in the present report.
Per capita income, unlike total incomepayments, makes adjustment for geo-graphic differences in size of populationand population change. This adjustmentassumes special significance for the pe-riod 1940-46 because of the extensiveshifts in residence that occurred in theprosecution of the war effort and thenin the reabsorption of servicemen intocivilian pursuits and the relocation ofmigrant war workers. As these shifts,for the most part, had been completedby the middle of 1946, the per capita in-come estimates for that year are of pri-mary interest.
The per capita income of the conti-nental United States in 1946 was $1,200.This was 2 percent higher than the 1945
2 See note 3 of the appended section on"Technical Notes."
755297—47-Digitized for FRASER http://fraser.stlouisfed.org/ Federal Reserve Bank of St. Louis
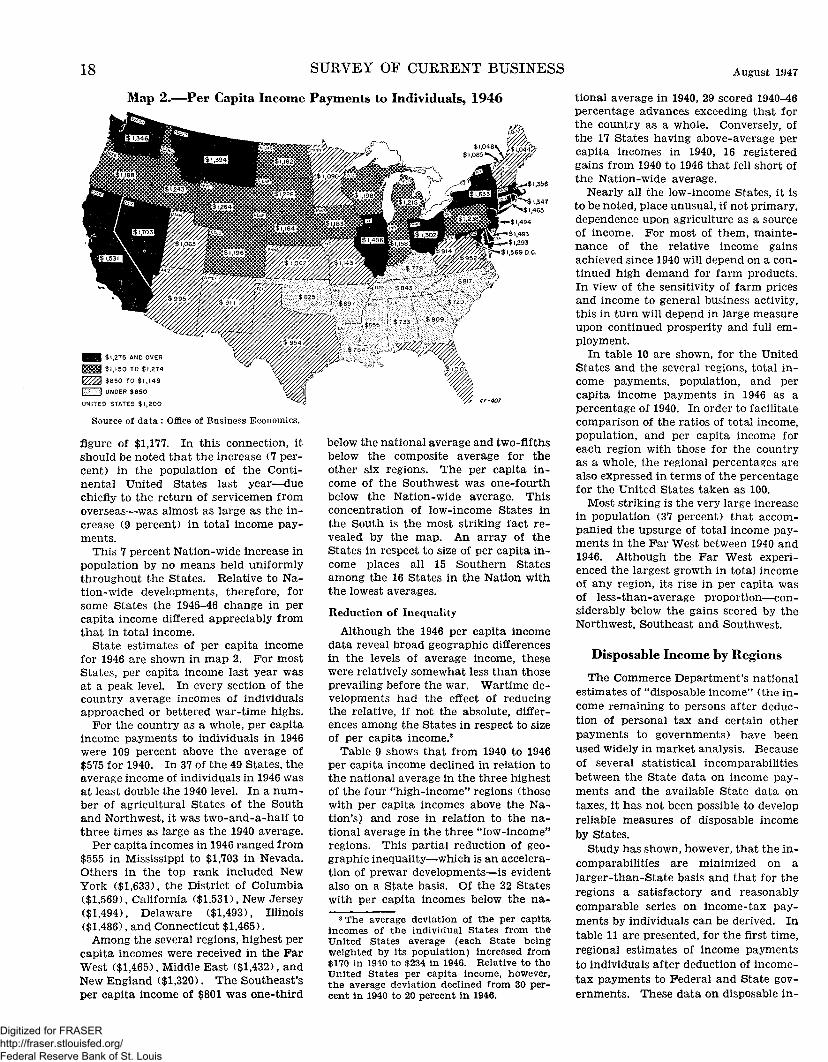
18 SURVEY OF CURRENT BUSINESS August 1947
Map 2.—Per Capita Income Payments to Individuals, 1946
I $1,275 AND OVER
| $1,150 TO $1,274
[2222 $850 TO $1,149
t/ml UNDER $850
UNITED STATES $1,200
Source of data : Office of Business Economics.
figure of $1,177. In this connection, itshould be noted that the increase (7 per-cent) in the population of the Conti-nental United States last year—duechiefly to the return of servicemen fromoverseas—was almost as large as the in-crease (9 percent) in total income pay-ments.
This 7 percent Nation-wide increase inpopulation by no means held uniformlythroughout the States. Relative to Na-tion-wide developments, therefore, forsome States the 1945-46 change in percapita income differed appreciably fromthat in total income.
State estimates of per capita incomefor 1946 are shown in map 2. For mostStates, per capita income last year wasat a peak level. In every section of thecountry average incomes of individualsapproached or bettered war-time highs.
For the country as a whole, per capitaincome payments to individuals in 1946were 109 percent above the average of$575 for 1940. In 37 of the 49 States, theaverage income of individuals in 1946 wasat least double the 1940 level. In a num-ber of agricultural States of the Southand Northwest, it was two-and-a-half tothree times as large as the 1940 average.
Per capita incomes in 1946 ranged from$555 in Mississippi to $1,703 in Nevada.Others in the top rank included NewYork ($1,633), the District of Columbia($1,569), California ($1,531), New Jersey($1,494), Delaware ($1,493), Illinois($1,486), and Connecticut $1,465).
Among the several regions, highest percapita incomes were received in the FarWest ($1,465), Middle East ($1,432), andNew England ($1,320). The Southeast'sper capita income of $801 was one-third
below the national average and two-fifthsbelow the composite average for theother six regions. The per capita in-come of the Southwest was one-fourthbelow the Nation-wide average. Thisconcentration of low-income States inthe South is the most striking fact re-vealed by the map. An array of theStates in respect to size of per capita in-come places all 15 Southern Statesamong the 16 States in the Nation withthe lowest averages.
Reduction of Inequality
Although the 1946 per capita incomedata reveal broad geographic differencesin the levels of average income, thesewere relatively somewhat less than thoseprevailing before the war. Wartime de-velopments had the effect of reducingthe relative, if not the absolute, differ-ences among the States in respect to sizeof per capita income.3
Table 9 shows that from 1940 to 1946per capita income declined in relation tothe national average in the three highestof the four "high-income" regions (thosewith per capita incomes above the Na-tion's} and rose in relation to the na-tional average in the three "low-income"regions. This partial reduction of geo-graphic inequality—which is an accelera-tion of prewar developments—is evidentalso on a State basis. Of the 32 Stateswith per capita incomes below the na-
8 The average deviation of the per capitaincomes of the individual States from theUnited States average (each State beingweighted by its population) increased from$170 in 1940 to $234 in 1946. Relative to theUnited States per capita income, however,the average deviation declined from 30 per-cent in 1940 to 20 percent in 1946.
tional average in 1940, 29 scored 1940-46percentage advances exceeding that forthe country as a whole. Conversely, ofthe 17 States having above-average percapita incomes in 1940, 16 registeredgains from 1940 to 1946 that fell short ofthe Nation-wide average.
Nearly all the low-income States, it isto be noted, place unusual, if not primary,dependence upon agriculture as a sourceof income. For most of them, mainte-nance of the relative income gainsachieved since 1940 will depend on a con-tinued high demand for farm products.In view of the sensitivity of farm pricesand income to general business activity,this in turn will depend in large measureupon continued prosperity and full em-ployment.
In table 10 are shown, for the UnitedStates and the several regions, total in-come payments, population, and percapita income payments in 1946 as apercentage of 1940. In order to facilitatecomparison of the ratios of total income,population, and per capita income foreach region with those for the countryas a whole, the regional percentages arealso expressed in terms of the percentagefor the United States taken as 100.
Most striking is the very large increasein population (37 percent) that accom-panied the upsurge of total income pay-ments in the Far West between 1940 and1946. Although the Far West experi-enced the largest growth in total incomeof any region, its rise in per capita wasof less-than-average proportion—con-siderably below the gains scored by theNorthwest, Southeast and Southwest.
Disposable Income by Regions
The Commerce Department's nationalestimates of "disposable income" (the in-come remaining to persons after deduc-tion of personal tax and certain otherpayments to governments) have beenused widely in market analysis. Becauseof several statistical incomparabilitiesbetween the State data on income pay-ments and the available State data ontaxes, it has not been possible to developreliable measures of disposable incomeby States.
Study has shown, however, that the in-comparabilities are minimized on alarger-than-State basis and that for theregions a satisfactory and reasonablycomparable series on income-tax pay-ments by individuals can be derived. Intable 11 are presented, for the first time,regional estimates of income paymentsto individuals after deduction of income-tax payments to Federal and State gov-ernments. These data on disposable in-
Digitized for FRASER http://fraser.stlouisfed.org/ Federal Reserve Bank of St. Louis

August 1947 SURVEY OF CUKRENT BUSINESS 19
come4 are shown on both a total and percapita basis.
As might be expected, the regional dis-tribution of disposable income, as com-pared with that of income payments (seetable 1), assigns larger shares to theregions where per capita income is rela-tively low and smaller shares to the re-gions where per capita income is rela-tively high. In the years 1929 and 1940income taxes absorbed less than 2 per-cent of aggregate individual incomes, andthe regional distributions of disposableincome and income payments were verysimilar. Larger differences between thetwo distributions are found in 1944 and1946, when rates of income taxation (par-ticularly Federal) had increased sharplyand, in general, individuals had movedinto higher income brackets. In theseyears approximately one-seventh of allincome payments were drawn off by Fed-eral and State income taxes.
The differences between the two dis-tributions for 1944 and 1946, however,should not be exaggerated. For each offive regions in 1946, the share of theNation's disposable income received dif-fered by 1.5 percent or less from theshare of total income payments received.In the two other regions, the Northwestand Southeast, the differences in theshares received were only 2.0 percentand 2.5 percent, respectively.
Interest attaches also to a comparisonof changes over time in the regional dis-tributions of disposable income and in-come payments. As already indicated,from 1929 to 1940 the changes in thetwo distributions were much the same.From 1940 to 1946 income expansion wasrelatively larger in disposable incomethan in income payments for the low-income regions, and it was relativelysmaller in disposable, income than in in-come payments for the high income re-gions. With the exception of the FarWest, then, the 1940-46 regional incomeshifts already noted for income paymentsare accentuated or sharpened on a dis-posable income basis. For the Far Westthe change in the income share from1940 to 1946 is less in disposable incomethan in income payments.
As might be deduced, however, fromthe fact that the regional distributionsof disposable income and income pay-ments were very similar in 1940 and did
4 It should be noted that, although for con-venience the term "disposable income" isused, these estimates represent income pay-ments minus individual income taxes (lessFederal income tax refunds), with no deduc-tion being made, as in the Department's na-tional series, for the relatively small amountof other personal taxes and of "nontax pay-ments." The latter comprises items such aspublic tuition fees, public hospital fees, andfines and penalties.
not differ markedly in 1946, the 1940-46shifts in income indicated by the twomeasures are not substantially different.
Technical Notes1. Revised national income and national
product series covering the period 1929-46
were published by the Department of Com-merce in the special National Income Supple-ment to the July 1947 SURVEY OP CURRENTBUSINESS (available for 25 cents from theSuperintendent of Documents, U. S. Govern-ment Printing Office, Washington 25, D. C, orfrom any of the Department of Commercefield offices). The new series include a num-
Table 8.—Percent Distributions of Income Payments From Federal Government,State and Local Governments, and Social Insurance Funds, by States and Regions,1929, 1940, and 1946
State and region
Continental UnitedStates __
New EnglandConnecticutMaineMassachusetts.. _ _New HampshireRhode Island. __ _Vp.rtn on t
Middle EastDelaware . . . . . . .District of Colum-
biaMarylandNew JerseyNew YorkPennsylvaniaWest Virginia
SoutheastAlabamaArkansasFloridaGeorgiaKentuckvLouisiana _ _._MississippiNorth CarolinaSouth CarolinaTennesseeVirginia
SouthwestArizona.. . . .New MexicoOklahomaTexas
CentralIllinoisIndianaIowa_ _MichiganMinnesotaMissouriOhioWisconsin
NorthwestColoradoIdaho .KansasMontanaNebraskaNorth DakotaSouth DakotaUtahWyoming
Far WestCaliforniaNevadaOregon _ __ _._Washington _
Addendum: U. S. totals(millions of dollars) _ _
Percent distr
Federal Government1
1929
100. 00
7.551.13
.743.86.64.78.40
30.66.21
8.351.802.38
10.536.54.85
15.301.221.121.181.761.601.131.051.331.031.462.42
6.32.69.54
1.483.61
23.605.612.441.752.731.722.854.621.88
7.131.19.42
1.78.82
1.11.44.55.4240
9.446.30.18
1.011.95
1,968
1940
100.00
5.72.71.70
3.16.38.53.24
25.71.15
8.571.851.827.784.97.57
19.291.701.371.392. 191.641.571.581.481.581.862.93
8.29.59.49
1.S95.32
21.234.811.972.232.192 402.453.561.62
9.021.27.51
1 89.87
1.91.91.83.4439
10.747.39.18.97
2.20
3,898
1946
100. 00
5.73.85.63
3.20.27.58.20
26.36.17
3.832.093.159.636.57.92
20.181.831.152.092.141.711.611.262.171. 151.953.12
8.03.47.47
1.645.45
21.925.282.011.372.921 742.614.291.70
5.601.11.36
1.23.39.86.37.40.7018
12 188.96.14.81
2.27
19,989
ibution of income payments from—
State and local gov-ernments a
1929
100.00
8.441.54
.555.12.36.61.26
30.38.21
.601.154.59
15. 837.06.94
11.10.98.63
1.201.021.061.21.67
1.38.63
1.071.25
5.07.40.24
1.343.09
28.676.922.351.795.732.162.255.152.32
6.09.98.39
1.54.54.93.52.51.4325
10.257.49.14.96
1.66
3,868
1940
100.00
7.981.53
.574.65.39.62.22
32.17.22
.621.154.11
17.337.86.88
10.56.83.49
1.081.07
.991.28.58
1.41.60.96
1.27
5.03.44.28
1.293.02
27.696.902.301.684.592 282.225.172.55
5.441.06.38
1 25.45.85.36.41.4523
11 138.58.13.84
1.58
5,194
1946
100.00
8.311.41
.585.24.33.52.23
26. 29.20
.621.243.41
13.296.56.97
12.581.13.60
1.501.311.021.29
.661.45.86
1.301.46
6.25.41.55
1.403.89
27.816.112.381.665.662 072.255.322.36
5.741.09.42
1 31.46.92.45.39.4822
13 029.36.16
1.102.40
7,132
Social insurancefunds 3
1929
100.00
8.871.59
.316.18.04.71.04
50.15.09
1.631.505.92
32.328.34
.35
3.98.35.18.35.44.26.49.13.18.18.93.49
1.06.09.04.22.71
25.889.231.59.44
3.181 99.71
6.622.12
1.89.49.04.23.26.44.13.04.26
8 176.58
.311.28
226
1940
100.00
8.851.15.59
5.53.36
1.06.16
38.00.19
1.321.564.03
21.029.16.72
8.80.79.50
1.08.80.84.93.36.68.40
1.191.23
2.65.22.17.57
1.69
26.408.382.101.024.112 061.615.591.53
3.44.80.25.65.46.55.15.11.31.16
11.869.45.11.64
1.66
1,043
1946
100.00
7.841.59
.624.34.27.85.17
37.71.19
1.932.045.69
18.108.83.93
8.691.05.44
1.01.80.84.90.28.64.32
1.221.19
2.74.22.09.76
1.67
26.057.432.33.895.16
1 442.105.291.41
2.77.46.11.97.20.45.08.12.31.07
14.2010.17
.051.142.84
2,404
Individual componentsas a percent of totalgovernment pay-ments, 1946
Fed-eral
67.7
59.554.969.357.264.866.766.7
65.465.0
89.475.362.358,165.966.7
78.577.581.376.079.278.773.982.378.577.076.182.4
75.873.669.573.677.3
62.663.264.166.252.565 671.262.962.6
70.171.568.767.967.369.168.172.676.967.5
65.766.368.060.565.5
Stateandlocal
24.1
30.732.722.633.527.621.526.6
23.326.4
5.215.924.128.723.425.2
17.417.115.019.517.216.721.115.518.720.418.213.8
21.122.428.922.319.8
28.426.127.028.636.327.821.927.831.1
25.724.928.825.728.526.530.024.918.929.5
25.124.728.729.324.7
Socialinsur-ance
funds
8.2
9.812.48.19.37.6
11.86.7
11.38.6n8.8
13.613.210.7
8.1
4.15.43.74 . 53.64 . 65.02.22.82.65.73.8
3.14.01.64.12.9
9.010.78.95.2
11.26.66.99.36.3
4.23. 62.56.44.24.41.92.54.23.0
9 29.03.3
10.29.8
1 Comprises pay of civilian employees, net pay of armed forces, family-allowance payments to dependents of enlisted'military personnel, voluntary allotments of military pay to individuals, mustering-out payments to discharged service-men, enlisted men's cash terminal leave payments, interest payments to individuals, public assistance and other directrelief (including grants to States for special types of public assistance), work relief, veterans' pensions and benefits,and Government payments to farmers.
2 Comprises wages and salaries, interest payments to individuals, public assistance and other direct relief (excluding-.Federal grants for special types of public assistance), work relief, and State government bonuses to World War I Iveterans. K<
3 Consists of old age and survivors insurance benefits, State unemployment insurance benefits, railroad retirementinsurance benefits, railroad unemployment insurance benefits, Federal civilian pensions, and State and local govern-ment pensions.
Source: Office of Business Economics.Digitized for FRASER http://fraser.stlouisfed.org/ Federal Reserve Bank of St. Louis

20 SURVEY OF CURRENT BUSINESS August 1947
Table 9.—Differentials and Relative Changes in Per Capita Income Payments, by Statesand Regions 1
State and region
Continental United StatesN e w England
ConnecticutMaineMassachusettsNew HampshireRhode IslandVermont
Middle East .DelawareDistrict of Columbia. .MarylandNew JerseyNew YorkPennsylvaniaWest Virginia
SoutheastAlabamaArkansasFloridaGeorgiaKentuckyLouisianaMississippiNorth CarolinaSouth Carolina. _.TennesseeVirginia
SouthwestArizonaNew MexicoOklahomaTexas
CentralIllinoisIndianaIowaMichiganM innesotaMissouriOhioWisconsin
NorthwestColoradoIdahoKansasMontanaNebraskaNorth DakotaSouth Dakota _UtahWyoming
Far WestCaliforniaNevadaOregonWashington
Percent of nationa
1929
100
12313583
13296
12588
13613517510313916511368
514545714855614045375162
6884566768
1061378680
1108390
11093
799176788982576179
101
12713912094
105
1940
100
12614489
13395
12491
13115618812414015010969
564744825554623555505578
6982626272
1051269484
1138988
11290
79917773
10075646583
105
130140145101110
per capita income
1945
100
11112589
11483
11386
119121117111129135104
74
886356896964714864587483
8087727283
1041219985
1038590
11398
951019491
1049293949198
124128128105119
1946
100
11012287
11387
11290
119124131108125136103
76
676158846765654668617079
7783766980
1051249799
1019195
109100
9710010189
1169797
102S9
105
12212814299
112
Percent chan
1929 to1940
- 1 5
- 1 3- 1 0- 1 0- 1 5- 1 6- 1 6- 1 3
- 1 9- 2- 9+1
- 1 5- 2 3- 1 8- 1 4
- 6- 1 2- 1 2
- 3- 4
- 1 7- 1 4- 2 6+2
+13- 9+7
- 1 4- 1 7
Q
- 2 2- 1 1
- 1 6- 2 2
- 7- 1 1- 1 3- 1 0- 1 7- 1 4- 1 9
- 1 5- 1 5- 1 5- 2 1
- 5- 2 2
- 5- 1 0- 1 1- 1 2
- 1 3- 1 5+2
- 1 0- 1 1
1940 to1946
+109
+82+77
+105+77+92+88
+108
+90+67+45+81+86+89+97
+130
+149+174+177+114+157+153+120+175+159+155+166+112
+132+110+156+132+131
+109+105+114+144+87
+114+126+102+132
+156+128+182+152+143+169+216+227+121+109
+95+90
+104+105+113
ge
1945 to1946
+2
+1(2)(2)
+1+7+1+8+2+4
+14- 1— 1+3+1+5
(2)- 2+6- 1
' +4- 6- 3+9+6- 3
9
- 2- 3+7- 3- 2
+3+4- 1
+19
+10+8
2+3+4+1
+12- 1
+14+7+6
+10
+10(2)
+2+13
- 3- 4
1 Computed from data shown in table 13.2 Less than five-tenths of 1 percent.Source: Office of Business Economics.
Table 10.—Regional Comparisons of Total Income Payments, Population, and PerCapita Income in 1946 With Those in 1940
Kegion
Continental United States
New England - __ __Middle EastSoutheastSouthwest - -_ -Central - - -Northwest __ .-Far West
1946 as percent of 1940
Incomepayments1
223
196197258249221251269
Popula-tion
107
10810410410710698
137
Per capitaincome
209
182190249232209256195
1946 as percent ofpressed on basepercentage as 100
Incomepayments
100
8888
11611299
113121
Popula-tion
100
1019797
1009992
128
1940, ex-of U. S.
Per capitaincome
100
8791
11911110012293
1 To obtain comparability with the population data, the residence adjustments used in the computation of per capitaincome (see note 3 of "Technical Notes") were applied to total income payments.
Source: Income payments, Office of Business Economics; population, computed from data supplied by Bureau of theCensus and War and Navy Departments.
ber of changes in definition. Also, they em-body a complete statistical revision of formerseries that was designed to utilize improvedestimating procedures and to base the esti-mates on the latest source data. Of particu-lar note is that the name of the series on"income payments to individuals" has beenchanged to "personal income."
It has not as yet been possible to incorpo-rate the revisions into the State incomeseries. The estimates contained in this re-port conform to the "income payments toindividuals" concept. The considerable jobof preparing State distributions of personalincome and its components for the years1929-47 cannot be completed before the latesummer of 1948.
The State income estimates presented inthis report include revisions of estimatespreviously published for the years 1942-45.These revisions represent partly the incorpo-ration of better and more complete statisticalinformation by States than was availablepreviously, but they stem also from the com-prehensive revision of the national seriesnoted above. Beginning with 1942, the Stateestimates of each of the components of non-agricultural proprietors' income and of prop-erty income were adjusted statistically inconformity with the new national totals.Moreover, one conceptual change—generallyof some magnitude for the important farmStates—was introduced into the 1942-46 esti-mates. This was the inclusion of the changein all farm inventories in the computation ofthe net income of farm proprietors. For-merly the change in farm inventories of cropsnot held for sales was excluded, the defini-tion of the change in farm inventories beingrestricted to total livestock and to crops heldfor sale. The estimates of farm inventorychange on the revised basis were made avail-able by the Bureau of Agricultural Economics.The value of change in inventories, it may benoted, is included in farm proprietors' netincome in order to secure a measure of in-come from current production.
2. "Income payments to individuals" is ameasure of the income received by residentsof each State from business establishmentsand governmental agencies. It comprises in-come received by individuals in the form of(1) wages and salaries, after deduction ofemployees' contributions to social security,railroad retirement, railroad unemploymentinsurance, and government retirement pro-grams; (2) proprietors' incomes, represent-ing the net income of unincorporated estab-lishments, including farms, before owners'withdrawals; (3) property income, consist-ing of dividends, interest, and net rents androyalties; and (4) "other" income, which in-cludes public assistance and other directrelief; labor income items such as work relief,government retirement payments, veterans*pensions and benefits, workmen's compensa-tion, and social insurance benefits; muster-ing-out payments to discharged servicemen;family-allowance payments and voluntaryallotments of pay to dependents of militarypersonnel; enlisted men's cash terminal leavepayments; and State government bonuses toveterans of World War II. Income paymentsare distributed among the States on a where-received basis (with the exception of wagesand salaries, as noted below). Only pay-ments made to residents are included in theestimates for the continental United Statesand the individual States.
3. Per capita income payments are de-rived by division of total income payments bytotal population excluding Federal civilianand military personnel stationed outside thecontinental United States. In five instances,however, income was transferred from theplace of recipients* employment to place of
Digitized for FRASER http://fraser.stlouisfed.org/ Federal Reserve Bank of St. Louis

August 1947 SURVEY OF CURRENT BUSINESS 21
residence before computation of per capitaincome. These are New York and New Jerseyand the District of Columbia, Maryland, andVirginia. In this connection, it should benoted that the wage-and-salary componentof total income payments is allocated byStates on the basis of State of employment,rather than of residence. For all States, ex-cept the five listed above, it is assumed thatState of employment is identical with Stateof residence.
For the years 1929-43 population data usedin the derivation of per capita income arethe midyear estimates of the Bureau of theCensus of the Department of Commerce.For the years 1944-46 population totals usedare the sum of the civilian population fromthe Bureau of the Census and military per-sonnel, as compiled from monthly or quar-terly data, from the War and Navy Depart-ments.
4. The regional classifications used in thepresentation of income payments by States
Table 11.—Total and Per Capita Disposable Income, by Regions, Selected Years,1929-46
Region
Continental United States
New EnglandMiddle EastSoutheast- _SouthwestCentralNorthwestFarwest
Total disposable income 1
Amount
1929
81, 289
6,66327, 0728,6574,127
23, 9373,9136,920
1940
74, 627
6,01423, 6669,0253,867
21, 3903,3377,328
(millions)
1944
134,195
9,39236, 52420, 0078,466
36, 8786,917
16,011
1946
152, 713
10. 69542, 51621, 7878,838
43, 2897,751
17, 837
Percent distribut]
1929
100.0
8.233.410.65.1
29.44.88.5
1940
100.0
8.131.612.15.2
28.74.59.8
1944
100.0
7.027.214.96.3
27.55.2
11.9
on
1946
100.0
7.027.714.35.8
28.45.1
11.7
Per capita disposableincome (dollars)
1929
669
822902341461711532855
1940
566
712734318395597451739
1946
1,082
1,1771,272
740843
1,1441,0681,309
1 Equals total income payments to individuals minus Federal and State individual income taxes (less Federal incometax refunds). To obtain comparability with the income tax data, the residence adjustments used in the computationof per capita income (see note 3 of "Technical Notes") were applied to total income payments prior to the deduction ofincome taxes.
Source: Office of Business Economics.
Table 12.—Total Income Payments to Individuals, by States and Regions, 1929-46 *[Millions of dollars]
State and region 1929 1930 1931 1932 1933 1934 1935 1936 1937 1939 1940 1941 1942 1943 1944 1945 1946
Continental United States
New EnglandConnecticutMaineMassachusettsNew HampshireRhode IslandVermont
Middle EastDelawareDistrict of Columbia--MarylandNew Jersey.New YorkPennsylvaniaWest Virginia
Southeast--.AlabamaArkansasFloridaGeorgiaKentuckyLouisianaMississippiNorth CarolinaSouth CarolinaTennesseeVirginia
SouthwestArizonaNew MexicoOklahomaTexas
CentralIllinoisIndianaIowaMichiganMinnesotaMissouriOhioWisconsin
NorthwestColorado _.IdahoKansasMontanaNebraskaNorth DakotaSouth DakotaUtahWyoming
Far WestCaliforniaN e vadaOregonWashington
82,617 73,325 61,971 47, 432 46, 273 53,038 ,8, 558 68, 000 72,211 66,045 70, 601 '5, 852 92, 269 116, 433 140,021 151,217 155, 201 169,373
6,7921,459449
3,787302579216
27, 840218638
1,1063,268.4, 4797,338793
8,681802562695956964862544966438905987
4,153245161
1,0792,668
24,2267,0361,8771,3483,5431,4432,2104,9201,849
3,927633230997325764264288272154
5,21774603
1,104
6,2821, 337432
3,512279527195
25, 609182644
1, 0363,08113, 3466,638682
7,127617393635798794725385812365743860
3, 428208137844
2, 239
20,8335,9031,5951,2482,9401,3251,9844,2511,587
3,592580204928264749224264239140
6, 4544,878
70524
5,6231,178381
3,156259477172
22,031167619927
2,71311, 4355,580590
6,064512332546667679640292690314622770
170116659
1,843
17,1854,8131,325965
2,4131,1251,6883,5641,292
2,824478153730213578160199195118
5,4564,151
62443
4,481911298
2, 555199385133
17, 045128549743
2,1518,8404,172462
4,979419287439560530499256576261498654
2,19912286507
1,484
12, 6303,517974619
1,816839
1,2842,610971
1,931362112487158344122117143
4,1673,182
46338601
4,264888297
2,386200366127
.6, 337127495720
1,9858,5094,027474
5,136419288425596534487256677299516639
2,29912090537
1,552
12,1933,335978644
1,641812
1,2442,601
1,95335811547415837412611814387
4,0913,113
43337
4,6781,000323
2,593228391143
18,299147556815
2,1979, 3694,627588
6, 354537342516735636595339845378661770
2,623149113583
1,778
14,1393,7871,167606
2,131921
1,3803,0661,081
2,250404146549212378136157165103
4,6953,530
53404708
5, 0311,096353
2,757241426158
19, 577161631871
2,3619,9414,989623
6,976585389584800713641373915406721849
2,924167131666
1,960
16,2204,2221,312896
2,4691,0831,5333,4471,258
2,627446165622250476178184192114
5,2033,904
62459778
5, 6731,267398
3, 093262473180
22, 448192763
1,0002,69011, 2465,818739
8,132699470711907847748463
1,006468846967
3,402202162753
2,285
18, 9864,9091,571982
2,9261,2811,7634,0721,482
3,029538201724283534197196224132
6,3304,730
72560
5,9001,356408
3,193272494177
23, 481205792
1,0672,835
11, 6356,174773
8,457711479773920902792442
1,077485880996
3,804232177841
2,554
20,6205,3951,7131,0923,2571,3621,8244,4061,571
3,238584223781299549217202247136
6,7115,047
77580
1,007
5,3721,199377
2,928258447163
51, 503178781
1,0002,658.0, 7595,438689
7,904652456751863793789399
1,011451801938
3,583213165767
2,438
18, 3784,8331,5221,0682,7051,3041,7093,7941,443
2,974526207690271509196208235132
6,3314,772
69540950
5,7291,301400
3,106268480174
22,783203813
1,0742,85911, 3015,819714
8, 414681478819901
4361,090493853
3,756227179796
2,554
20,0905,2851,6881,1853,0541,3781,8324,1541,514
3,099563213692288523209227243141
6,7305,047
84587
1,012
6,1241,417431
3.309'269511187
24, 319239905
1,2223,13811, 8306,225760
9,043763493900
847444
1,131545927
1,127
3,908237190829
2,652
21,6645,7401,8581,2333,4251,4241,9144,4481,622
3,363589232757321569237242265151
7,4315,606
92633
1,100
7,3671,837505
3,846309651219
28, 203278
1,0401,5163,67613,3847,404905
11, 5801,037658
1,0621,2411,0421,066630
1,436703
1, 2211,484
4,734287222956
3,269
!6,8006,8892,4371,5274,2711,6262,3635,6462,041
4,109695278974372655331301329174
9,4767,044107824
1,501
8,9712,341673
4,528350826253
33,277315
1,2542,0084,55215, 2158,8471,086
15, 5091,428896
1,4521,6421,3351,411883
1,864959
1,5282,111
6,517445299
1,3224,451
33,1478,0873,0921,9945,4822,0402,9206,9732,559
6,086990419
1,508475
1,039440472527216
12, 9269,315207
1,1932,211
10, 2352,648857
5,141378925
38, 735374
1,4482,4095,38117,61410, 2701,239
19, 4331,780977
2,1052,1431,6851,8741,0842,2441,1401, 9832,418
8,528598375
1, 5935,962
39,1659,3583,7252,2606,8562,2713,3568,3492,990
6,9461,137477
1,768517
1,162505448687245
16, 97912, 302
2111,5722,894
10, 7112,713864
5,447419963305
41, 994402
1,5082,5365,79419,30411,0851,365
21, 4761,9431,1222,3692,3731,8252,0011,1882,5141,2682,2762, 597
9,246582420
1,8086,436
41, 78910,2763,9282,1887,1622,4113,6128,9173,295
7,4841,146527
1,979528
1,298556547635
18, 51713,472
2061,6363,203
10, 8602,635847
5, 631460956331
43, 577393
1,6072,5015,774
20, 45411,3761,472
22, 2672,0211,2182,4202,4451,9571,9861,2052,6211, 3032, 4432,648
9,370594448
1,8016,527
42, 89310,6954,1022,3756,7992,6143,7769,1143,418
7,6921,271525
1,908555
1,333566598649287
18,54213,649
2101,6313,052
11, 9952,877917
6,269543
1,006383
48, 031430
1,7362,7166,16
22,89512, 4371,656
23,3952,0731,3282,3722,5672,1631,9821,1823,0311,4072,5352,755
9,714627491
1,8486,748
47, 83812,0194,3863,0127,3793,0824, 3499,8083,803
8,4391,380588
1,992669
1,489624673689335
19,96114,879
2351,7293,118
1 For definition and description see section on "Technical Notes."
Source: Office of Business Economics.
Digitized for FRASER http://fraser.stlouisfed.org/ Federal Reserve Bank of St. Louis

22 SURVEY OF CURRENT BUSINESS August 1947
are adapted from those proposed by HowardW. Odum in Southern Regions of the UnitedStates (University of North Carolina Press,Chapel Hill, 1936).
5. Estimates of total income payments toindividuals for each State are derived as thesummation of a very large number of sepa-rately estimated components. The followingstatement, which necessarily omits consider-able detail, affords a brief description of theprincipal sources of data used in the deriva-tion of State estimates for each of the fourbroad types of income payments definedabove. Uniform sources and methods areutilized for all States.
Wages and salaries, which for the Nationare more than three-fifths of all income, areamong the types of income for which dataare most complete and reliable. They areestimated by States in considerable industrialdetail. For most industries they are derivedfrom reports of the Bureau of the Censusand of the Social Security Administration.In the preparation of estimates for 1939 andsubsequent years, heavy reliance was placedon wage data compiled by the Social SecurityAdministration from tabulations by the Stateunemployment compensation agencies of re-ports received from all covered employers.For each State these tabulations include asummary of the total amount of wages, classi-fied by detailed industry groups, actually paidout by establishments located in the State.The unemployment compensation wage datawere supplemented by special tabulations ofthe Social Security Administration furnish-ing data on wages in the very small-sizedfirms excluded from unemployment insur-ance coverage by the varying size-of-firm pro-visions of the State laws. These tabulationswere compiled from wage data filed by em-ployers under the old age and survivors in-surance program, which includes all-sizedestablishments within "covered" employment.Supplementation of the unemployment com-pensation wage data by the old age and sur-vivors insurance wage data yields a completemeasure of wages and salaries paid out by allestablishments in "covered" industries. Ona Nation-wide basis, wages and salaries incovered industries in 1946 constituted three-fourths of all civilian wages and salaries andnearly one-half of all income payments toindividuals.
State estimates of wages and salaries areprepared for each of the several industries,or types of employment, not covered by So-cial Security laws. These include agricul-ture; Federal, State, and local governmentagencies; railroads; domestic service; mari-time industries; and nonprofit religious,charitable, scientific, and educational agen-cies. Data used in the formulation of esti-mates for these categories are obtained, forthe most part, from Federal agencies. Forexample, estimates of wages paid to hiredfarm laborers are secured from the Bureau ofAgricultural Economics of the Department ofAgriculture. Wage-and-salary payments bygovernmental agencies are based on data sup-plied by the Civil Service Commission, Bureauof Labor Statistics of the Department ofLabor, Bureau of the Census, Office of Edu-cation of the Federal Security Agency, andthe War and Navy Departments.
Estimates of government wages and sala-ries are made separately for the executive,judicial, legislative, and military branches ofthe Federal Government, and for the schooland nonschool groups of employees of Stateand local governments. Pay of the armedforces, net of their contributions to allow-
Table 13.—Per Capita Income Payments by States and Regions, 1929-40 and 1945-46[Dollars]
State and region
ContinentalStates
United
New England.ConnecticutMaineMassachusettsNew HampshireRhode IslandVermont
Middle EastDelawareDistrict of Colum-
bia.. _MarylandNew JerseyNew YorkPennsylvaniaWest Virginia
SoutheastAlabamaArkansasFloridaGeorgia.. _-.KentuckyLouisianaMississippiNorth Carolina..South Carolina..TennesseVirginia
SouthwestArizonaNew Mexico..OklahomaTexas
CentralIllinoisIndianaIowaMichigan...Minnesota..MissouriOhioWisconsin..
NorthwestColoradoIdahoKansasMontanaNebraskaNorth Dakota..South Dakota..UtahWyoming
Far WestCalifornia...NevadaOregonWashington.
1929
838918566897652851601
926919
191703947,125767464
344305305484329371415273309252349422
464573383455465
720932583546745566612748634
534616518532602557389417537687
865946817640713
1930
596
768830540825599767542
841762
,179651869
p023688393
279232211431274303344191255209283367
376475322352383
612772491504608515546638539
487558455498490544329382470619
775854761547626
1931
577751871576336
235191177363227256299143214178234326
303382265275312
503626405388503433461532435
384455336402393421236289379515
642710660455503
1932
380
542558367594422562369
552522
9264605S6671429261
191155153287189198230125176147185276
237271192212248
369456296248382320349388325
262342241267290251181171276371
481533479342374
1933
514540364553420533351
526513
441535644414265
195154152272200199222123205167190266
247263196226257
355431296258348307337386312
265336242258290275190172275369
465511447337369
1934
420
561605394597478573397
586586
876493589705474326
239197180325245234269162253209241316
279322240246292
411488351242455346373453357
304376304298387279205232313435
524568535399432
1935
460
659428634502626439
623634
955524630743510342
260213204360264260286177270222260347
309355272281319
469543392357524403413507413
354412338337455353269273362477
571617614447470
1936
531
678758480713544691501
711750
,124597712S3 7594402
301253246423298307330218294254302393
357425330319369
546630468391606473473598484
409493406395514399300294419548
684734699539579
1937
561
704808490737562714493
740795
,107635750861629417
310256249445301325346207312262311405
397482353358409
589691508434659500488646510
438532444430541412333306459560
714769733552597
1938
509
640710450677531639454
674682
1,044594699791553369
287233236418280283341185289241280380
371436322327387
449423535474455554466
402475406382488384302318434537
662714645507558
1939
539
764474719548678483
709771
,031634746825589378
303242246442290297354201308261295402
461341340401
565671495468591497486603485
418505411383515397325351443567
692741767544588
1940
725827509766546715521
752
,080713803863628398
322268252471315308357202316286317450
399473356356413
605726541485649509505643516
454524440422574433368376480605
750805836579632
1945
1,177
1946
1 See note 3 of section on "Technical Notes."Source: Office of Business Economics.
ances and allotments going to their depend-ents, is allocated by States in terms of theirState of duty. This allocation is made sepa-rately for each of the four military servicesand is based on monthly or quarterly databy States on numbers of officers and of en-listed personnel stationed in each State andon average rates of pay for the two groupsof personnel.
Proprietors' income may be divided forpurposes of this discussion into net incomeof farm operators and net income of non-farm proprietors. State estimates of thenet income of farm operators are derived bydeducting from farmers' gross income duringthe calendar year their total expenses ofproduction. Gross income includes cash in-come from marketings of crops and livestock,Government payments, the value of productsconsumed on the farm, and the value (posi-tive or negative) of the change in inventoriesof crops and livestock. The total of produc-
1,200
1,3201,4651,0441,3561,0481,3471,085
1,4321,493
1,5691,2931,4941,6331,238914
801733697
1,010809778784555817729843952
927995911825954
1,2641,4861,1581,1831,2151,0901,1431,3021,198
1,1621,1961,2431,0621,3941,1641,1621,2281,0631,264
1,4651,5311,7031,1881,346
tion expenses is a summation of 34 separatelyestimated items. Data on which the incomeand expenditures data are based are those ofthe Bureau of Agricultural Economics. Itshould be noted that products consumed onfarms are valued at farm prices. For somepurposes, particularly those related to "wel-fare" comparisons, valuation at retail pricesmight be preferable.
The total net income of proprietors in non-agricultural industries is prepared by Statesfor each major industry division. The geo-graphic distribution of these components oftotal income payments is based mainly onreports of the Bureau of the Census, includ-ing reports of both the industrial and popula-tion censuses. Pending the availability ofmore complete information from Census enu-merations, year-to-year alterations of theState distributions derived for the census-year 1939 were based for each industry on a
Digitized for FRASER http://fraser.stlouisfed.org/ Federal Reserve Bank of St. Louis

August 1947 SUEVEY OF CUKRENT BUSINESS 23
relevant measure such as volume of salesor wage-and-salary payments.
National estimates of dividends, interest,and net rents and royalties are distributed byStates primarily on the basis of tabulationsby the Bureau of Internal Revenue of theamounts of those items reported by indi-viduals on Federal income tax returns. Ex-ceptions to this general procedure are theseparate estimation of net rents received byfarmer landlords (from data of the Bureau ofAgricultural Economics) and, for 1942-46, ofFederal interest payments to individuals.
For most of the numerous individual com-ponents of the category of "other" incomepayments, State and national data repre-
sent actual disbursements, as reported byFederal agencies. Types of income for whichdata on disbursements by States are avail-able from official reports include public as-sistance and other relief, retirement andunemployment insurance benefits under theSocial Security and Railroad Retirement andRailroad Unemployment Insurance programs,and veterans' pensions and benefits. Fortwo other items of this category—workmen'scompensation and retirement payments byState and local governments—estimates aresupplied by the Social Security Administra-tion as a product of its studies of socialinsurance and related payments. Data onState bonus payments to veterans of World
War II were furnished by the individualState governments.
The War and Navy Departments report dis-bursements for the country as a whole formustering-out payments, military allowances,and enlisted men's cash terminal leave pay-ments. Additionally, they supply requisitedata for estimating the amounts of these dis-bursements received by residents of the vari-ous States. Such data include a tabulationby the War Department of the actual amountof family-allowance payments received ineach State during June 1944, annual data onmilitary separations by State of residence,and annual data on the number of militarypersonnel according to State of residence.
Table 14.—State Income Payments, by Type of Payment, 1942-46 *[Millions of dollars]
United States, total_ _Wages and salariesProprietors' incomeProperty incomeOther income
Alabama, totalWages and salariesProprietors' incomeProperty incomeOther income
Arizona, totalWages and salariesProprietors' incomeProperty incomeOther income
Arkansas, totalWages and salariesProprietors' incomeProperty incomeOther income-.
California, totalWages and salariesProprietors' incomeProperty incomeOther income
Colorado, total _Wages and salariesProprietors' incomeProperty incomeOther income
Connecticut, total ___Wages and salariesProprietors' incomeProperty incomeOther income
Delaware, totalWages and salariesProprietors' incomeProperty incomeOther income
District of Columbia, totalWages and salariesProprietors' incomeProperty incomeOther income
Florida, totalWages and salariesProprietors' incomeProperty incomeOther income
Georgia, totalWages and salariesProprietors' incomeProperty incomeOther income
Idaho, totalWages and salariesProprietors' incomeProperty incomeOther income
Illinois, totalWages and salariesProprietors' incomeProperty incomeOther income
1942
116,43377, 94521,41012,8874,191
1,428963
48
4452871023620
8964563445640
9,3156,2821,5481,151334
58222812753
2,3411,74318137047
3152084457
1,2549969512736
1,45297224816963
1,6421,09336612360
4192241503015
8,0875,5251,297964301
1943
140, 02196, 39424,23113, 5955,801
1,7801,179397104100
4101263626
9775133315875
12, 3028,5752,0791,219429
1,13767925813466
2, 6481,98720638570
374255505910
1,4481,174
9013450
2,1051,45537618292
2,1431,440444143116
4772601673218
9,3586,5261,4391,020373
1944
151,217101, 54825, 84814, 5449,277
1,9431,216431112184
5823801174144
1,12253438967132
13, 4729,2042,3201,310638
1,14666224714295
2.7131,966223409115
402267556317
1,5081,195
9214378
2,3691,596427191155
2,3731,555460154204
5272821813430
10, 2767,1361,4991,078563
1945
155, 20199,15827, 69415, 47612, 873
2,0211,177460122262
5943681224460
5252641823841
10,6957,1261,6501,149770
1946
169,373105, 21534,16617,30812,684
2,0731,156
541140236
6273651595053
1,21857139673178
13, 6498,9192,4721,393865
1,271702300151118
2,6351,796236428175
393251536524
1,6071,255
99150103
2,4201,533472205210
2,4451,477519167282
1,32856451588161
14, 8799,2693,1301,546934
1,380776324168112
2,8771, 933307476161
430271627225
1, 7361, 320122170124
2,3721, 415532234191
2,5671,529613192233
5882982084240
12, 0197,8812,1211,282
735
State
Indiana, totalWages and salaries-Proprietors' income.Property incomeOther income
Iowa, totalWages and salaries..Proprietors' income.Property incomeOther income
Kansas, totalWages and salaries..Proprietors' income.Property incomeOther income
Kentucky, totalWages and salaries..Proprietors' income-Property incomeOther income
Louisiana, totalWages and salaries. _Proprietors' income-Property incomeOther income
Maine, totalWages and salaries..Proprietors' income-Property incomeOther income
Maryland, totalWages and salaries-Proprietors' income-Property incomeOther income
Massachusetts, totalWages and salaries-Proprietors' income-Property incomeOther income.—
Michigan, totalWages'and salaries..Proprietors' income.Property incomeOther income
Minnesota, totalWages and salaries..Proprietors' income.Property incomeOther income
Mississippi, totalWages and salaries..Proprietors' income-Property incomeOther income
Missouri, totalWages and salaries..Proprietors' income-Property incomeOther income
Montana, totalWages and salaries.Proprietors' income.Property incomeOther income
Nebraska, totalWages and salaries..Proprietors' income.Property incomeOther income
1942
3,0922,060
651279102
1,99480993718563
1,50876355514149
1,33576337213961
1,41196126412660
6734831006723
2,0081,481
252226
49
4,5283,279
443624182
5,4824,163
688450181
2,0401,090
66119297
883440353
5436
2,9201,815
691302112
4752391793621
1,039460448
9635
1943
3,7252,572
715293145
2,260950
1,02219791
1,7681,031
51614873
1,685975460150100
1,8741,287
350137100
8576101447033
2,4091,802
29023780
5,1413,798
470647226
6, 8565,400
771478207
2,2711, 266
692201112
1,084588359
6473
3,3562,138
735317166
5172651923822
1,16259342210146
1944
3,9282,675
715311227
2,1881,019
814208147
1,9791,102
595164118
1,8251,010
478162175
2,0011,355
330146170
864604130
7555
2,5361,829
324252131
5,4473,927
493689338
7,1625, 448
888510336
2,4111, 361
667215168
1,188562417
72137
3,6122,247
759339267
5282721824133
1,298'65346410972
1945
4,1022,547
905338312
2,3751,044
915221195
1,9081,007
569175157
1,9571,016
525175241
1,9861,249
348157232
8475501418076
2,5011,704
344268185
5, 6313,898
536724473
6,7994,788
923555533
2, 6141,419
737232226
1,205518421
74192
3,7762,300
758359359
5552741924445
1,33364547311897
1946
4,3862,6741,050
375287
3,0121,1901,384
252186
1,992967686195144
2,1631,112
631198222
1,9821,227
379176200
9175651839079
2,7161,771
455297193
6, 2694,215
656803595
7,3795,1141,110
624531
3,0821,610
959263250
1,182531410
83158
4,3492,4891,077
410373
669321254
5044
1,48965560813492
Digitized for FRASER http://fraser.stlouisfed.org/ Federal Reserve Bank of St. Louis

24 SURVEY OF CURRENT BUSINESS August 1947
Table 14.—State Income Payments, by Type of Payment, 1942-46 1—Continued[Millions of dollars]
State
Nevada, totalWages and salaries...Proprietors' income..Property incomeOther income
New Hampshire, total...Wages and salaries._.Proprietors' income-Property incomeOther income
New Jersey, totalWages and salaries...Proprietors' income..Property incomeOther income
New Mexico, totalWages and salaries...Proprietors' income..Property incomeOther income
New York, totalWages and salaries...Proprietors' income-Property incomeOther income
North Carolina, totalWages and salaries-Proprietors' income..Property incomeOther income
North Dakota, totalWages and salaries._.Proprietors' income-Property incomeOther income
Ohio, totalWages and salaries...Proprietors' income..Property incomeOther income
Oklahoma, totalWages and salaries..Proprietors' income..Property incomeOther income
Oregon, totalWages and salaries...Proprietors' income..Property incomeOther income
Pennsylvania, totalWages and salaries. _Proprietors' income..Property incomeOther income
Rhode Island, totalWages and salaries. _Proprietors' income..Property incomeOther income
1942
20714045175
350243435014
4,5523,467
478464143
299173842715
15, 21510, 3291,9992,297590
1,8641,13552015356
4401412553014
6,9734,950
9a3
232
1,32272041211971
1,1938212498637
8,8476,4221,0541,068303
8266128010727
1943
21114641186
378255515220
5,3814,182518485196375235902921
17, 61412, 3002,2382,373703
2,2441,425544167108
5051612963117
8,3496,1141,054868313
1,593969395126103
1,5721,1093169354
10,2707,5011,2391,117413
9257007811136
1944
20614038199
419274585532
5,7944,403565518308420254993136
19, 30413, 2862,4292,5281,061
2,5141,453671191199
5561793163427
8,9176,4081,091923495
1,8081,022474141171
1,6361,12133010085
11,0857,8701,3621,189664
9637048411956
1945
210133442013
460290665846
5,7744,1626125554454482611053349
20, 45413,6912, 6432,6531,467
2,6211,445695201280
5661932953840
95666784125
1946
235143572312
876543
6,1614,3107796204524912711353847
22,89515, 2083,2542,9401,493
3,0311,672900235224
6242353094436
9,1146,1831,271982678
1,801992428150231
1,6311,032374110115
11,3767, 7151,4651,261935
9,8086,5661, 5251,086631
1,848945506169228
1,7291,058426124121
12, 4378,2221,8101,4021,003
1,00668810013880
State
South Carolina TotalWages and salaries..Proprietors' income.-Property incomeOther income
South Dakota, totalWages and salaries . . .Proprietors' income.-Property incomeOther income
Tennessee, totalWages and salaries..Proprietors' income..Property incomeOther income
Texas, totalWages and salaries..Proprietors' income..Property incomeOther income
Utah, totalWages and salaries..Proprietors' income..Property incomeOther income
Vermont, totalWages and salaries...Proprietors' income-Property incomeOther income
Virginia, totalWages and salaries-Proprietors' income-Property incomeOther income
Washington, totalWages and salaries._.Proprietors' income..Property incomeOther income
West Virginia, totalWages and salariesProprietors' income...Property incomeOther income
Wisconsin, totalWages and salariesProprietors' income...Property incomeOther income
Wyoming, totalWages and salaries...Proprietors' income.Property incomeOther income
1942
2015336
4721622633116
1,52894737714163
4,4512,7551,122
407167
5273521223320
2531555139
8
2,1111,555
34416151
2,2111,544
41317579
1,0867961567955
2,5591,592
589290
88
2161286516
1943
1,1407932176466
448191
19
1,9831,262
453153115
5,9623,8631,365
449285
6874671593526
286175594012
2,4181,774
37117796
2,8942,097
511185101
1,2399001798476
2,9901,902
675306107
2451457318
1944
1,26881725972
120
5471992833530
2,2761,397
514165200
6,4364,0781,395
486477
6354171393742
305180634319
2,5971,804
439185169
3,2032,268
589200146
1,36596518390
127
3,2952,089
718327161
268163721914
1945
1,30379426976
164
5982133044041
2,4431,428
558180277
6,5273,9441,407
514662
6494121404156
331184734529
2,6481,746
470200232
3,0522,058
574220200
1,47299919999
175
3,4182, 053
790349226
287165802121
1946
1,407835359
90123
6732273594641
2,5351,443
631206255
6,7483,9151,649
579605
6894231584662
383221864927
2,7551,779
552226198
3,1181,944
686247241
1,6561,119
258114165
3,8032,238
958387220
3351871062418
1 For definitions see section on "Technical Notes ." Comparable estimates for the years1929, 1933, and 1939-41 were published in the August 1945 issue of the SURVEY OF C U R R E N TBUSINESS.
Source: Office of Business Economics.
The Business Situation
(Continued from p. 8)
total retail sales the bulge is not readilyapparent.
The year 1936 was the period of great-est expansion in economic activity in the1933-37 recovery from the depressionlow. While the bonus was one of thelesser expansionary forces, its contribu-tion to the level of production and priceswas undoubtedly important. The sea-sonally adjusted annual rate of personalincome rose from 68.0 billion dollars inMay to 78.9 billion in June and declinedto 71.2 billion in September. The rise inincome in 1936, the large average size ofthe bonds, and the age range of the vet-erans suggest that a significant propor-tion of the bonds was used to liquidate
debt, to invest in houses and other capi-tal goods, and to add to liquid assets.
Spending StimulusIn comparison with 1936, the factors
that may lead to a higher propensity tospend the proceeds of bond redemptionsare the relatively small average size ofthe bonds, the young age distribution, thenumber of veterans in college, and theneed to finance the setting up of newhouseholds. On the other hand, unem-ployment is now lower and wages higherthan 11 years ago, and durable goodsare not now so readily available.
The increase in personal consumptionexpenditures arising from this sourcewill have some expansionary effect in theeconomy. Concerning the types of goodsand services most likely to be affected,it might seem that nonrecurrent lump
payments such as the present one wouldtend to favor expenditures for durablegoods. In view of the still limited outputof many durable goods, however, the ef-fect may be to limit borrowing throughincreasing the size of down payments.Also to some extent it could be expectedto reduce commercial borrowing athigher rates. As in 1936, the bulge inpersonal consumption expenditures maynot be obvious, but there can hardly beany doubt that expenditures in late1947 will be higher than they would havebeen without the cashing of leave bonds.It follows that appraisal of current mar-ket tendencies should take account ofthis nonrecurring item, though obviouslysuch appraisals would include the rela-tive magnitude in what is at present aconsumer spending market of 159 bil-lion dollars.
Digitized for FRASER http://fraser.stlouisfed.org/ Federal Reserve Bank of St. Louis

August 11)47 SURVEY OF CURRENT BUSINESS S-l
Monthly Business StatisticsThe data here are a continuation of the statistics published in the 1942 Supplement to the SURVEY OP CURRENT BUSINESS That
volume contains monthly data for the years 1938 to 1941, and monthly averages for earlier years back to 1913 insofar as available italso provides a description of each series and references to sources of monthly figures prior to 1938. Series added or revised since publica-tion of the 1942 Supplement are indicated by an asterik(*) and a dagger (f), respectively, the accompanying footnote indicating wherehistorical data and a descriptive note may be found. The terms "unadjusted" and "adjusted" used to designate index numbers referto adjustment of monthly figures for seasonal variation.
Data subsequent to June for selected series will be found in the Weekly Supplement to the Survey.
Unless otherwise stated, statistics through 1941and descriptive notes may be found in the1942 Supplement to the Survey
1947
June
1946
June July August Sep-tember
Octo-ber
Novem-ber
Decem-ber
1947
Janu-ary
Febru-ary March April May
BUSINESS INDEXES
PERSONAL INCOME*
Seasonally adjusted, at annual rates:Total personal income bil. of dol_
Wage and salary receipts, total doTotal employer disbursements do
Commodity-producing industries doDistributive industries doService industries _doGovernment do
Less employee contributions for social insurancebil. ofdoL
O ther labor income . . . .doProprietors' and rental income doPersonal interest income and dividends doTotal transfer payments do
Total nonagricultural income .do
FARM MARKETINGS AND INCOME
Farm marketings, volume: •Indexes, unadjusted:
Total farm marketings _. 1935-39= 100..Crops doLivestock and products do
Indexes, adjusted:Total farm marketings .do
Crops __ doLivestock and products .do
Cash farm income, total, including Government pay-ments* .__ mil. of doL
Income from marketings* ....doCrops* doLivestock and products*. do
Dairy products* doMeat animals* doPoultry and eggs* do
Indexes of cash income from marketings:!Crops and livestock, combined index:
Unadjusted 1935-39= 100..Adjusted _ ._ do
Crops ..doLivestock and products do
INDUSTRIAL PRODUCTION
Federal Reserve Index
Unadjusted, combined index! 1935-39=100-.Manufacturesf ..do
Durable manufactures! doIron and steel! do.....Lumber and products!-- do
Furniture!-— - doLumber! do
Machinery! doNonferrous metals and products! do
Fabricating* doSmelting and refining* do
Stone, clay, and glass products! doCement doClay products* doGlass containers! do
Transportation equipment doAutomobiles! § do
Nondurable manufactures! do_...Alcoholic beverages! doChemicals! do
Industrial chemicals*.. do.___
2,192743
1,449387794234
3320)0)0)
v 184J»190J>218
193••145' 159' 139' 273'182' 180'186'207
v 162254
v 229* 186v 168
178*>245
173.2107.9109.845.830.613.619.8
1.91.6
39.313.211.2
155.3
11194125
131150118
' 1, 573r 1, 520' 598-•922' 350'328'206
•-229271332226
171176194154141146138241137147110191166147237238167162174231
179.0109.9111.846.431.314.020.1
1.91.6
43.313.310.9
157.5
154150158
155142164
2, 6232, 4891,1401, 349'391'693'227
'375335311354
174178203180137144133243150155139193171147239241176159187232396
I
180.9112.3114.248.531.914.019.8
1.91.6
42. 913.310.8
160.5
145156136
139130146
' 2, 388' 2,325' 1, 108r 1, 217
'370'612'211
'350313294327
180186210184144152140254159163150204179154261242182166174233395
178.5113.0114.849.431.814.119.5
1.81.6
39.513.311.1
162.0
130162106
111117107
r 2,123' 2,110'1,211'899'342' 302'236
'318249279227
184191214185147152144261172176161212188155270240188172237235395
184.0113.6115.449.532.014.219.7
1.81.6
45.313.310.2
162.7
188231155
142142142
' 3, 401' 3, 386' 1, 862' 1, 524'343'875
'510348346349
184191215184142155136268184191167209181158258237185172221240402
188.4115.4117.250.633.014.419.2
1.81.6
47.613.510.3
165.6
169166
156155157
' 2, 999' 2, 986'1,450r 1, 536'315'933'274
'449367347382
183192214178139157131271192198176207175155254235187174196244411
189.9117.0118.852.333.514.418.6
1.81.6
47.213.710.4167.3
150153148
154155154
' 2, 438r 2, 420
'999' 1. 421'317'829'266
'364363349374
180188209159129160114276197203182203161158247235187172210250422
190.3117.1
••119.253.133.514.618.0
2.11.6
46.613.911.1
168.2
144149140
166191148
2, ISO2,144834
1,310320811174
323366370364
185192218192326161107277204212184208148156273229181172206252430
190. 7117.5
'119.653.233.714.618.1
2.11.7
46.814.010.7
168. 5
11293
127
148148148
1,7451.701
5221.179
314(.186174
256352310384
185193220191135167118277205211190205154156255233190171195253429
191.8117.5
'119.653.733.714.617.6
2.11.7
47.714.010.9
168.8
11891138
145148143
1.9961,930608
1, 322337754225
'291364338
187195223196140166126281199200196209157159269
'239197171187254'431
190.2116.7
'118.953.233.414.817.5
2.21.7
46.914.010.9
167.8
11985144
' 185193
' 222195143161134
'276'195r 193
203208166160263237193169182
'253'433
'191. 5'118.3'120.4
' 54.1' 3 4 . 2
14.9' 17 .2
2.11.8
' 46 .914.0
' 10. 5
' 169.2
12786
158
141141141
1,9721,912
5821,330
347736233
288367364
0)0)0)2,025
' 1,996'614
' 1, 382'383
716'260
'3000)0)
' 185' 191' 2 i 8
197' 143'158
136273
'187' 182' 198'206
14S' 162
269'224'178'169
167'252'434
p Preliminary. ' Revised. § Index is being revised; see note for automobile index at the bottom of p. S-2 of the February 1947 Survey. i Discontinued.*New series. The new series on personal income replace the series designated "income payments" shown in the Survey through the June 1947 issue; personal income is current
income received by persons from all sources, exclusive of transfers among persons; data for 1929-46 and a description of the series are published in "The National Income Supplementto the July 1947 Survey of Current Business" which can be purchased from the Superintendent of Documents, U. S. Government Printing Office, Washington 25, D. C , for 25 cents.Data to continue through May the series on income payments are given on p. 2, July, 1947 Survey. For a description of the indexes of the volume of farm marketings and figures for1929-42, see pp. 23-32 of the April 1943 Survey; indexes since 1942 are from the Department of Agriculture. Data for 1913-41 for the dollar figures for total cash farm income and totalincome from marketings are shown on p. 28 of the May 1943 Survey; data for 1940-44 published in that and later issues are subject to revision; data beginning 1945 have been revisedand revisions for January 1945-May 1946 for the totals and the breakdown of cash farm income will be published later. Data beginning 1939 for the new series under industrial pro-duction are shown on p. 18 of the December 1943 issue.
tRevised series. For revisions for the indicated series on industrial production, see pp. 18-20 of the December 1943 issue. Revised data for 1913-40 for the unadjusted index of cashincome from farm marketings are available on p. 28 of the May 1943 Survey; 1941-May 1946 data are subject to revision; the adjusted index has been discontinued.
Digitized for FRASER http://fraser.stlouisfed.org/ Federal Reserve Bank of St. Louis

S-2 SURVEY OF CUEKENT BUSINESS August 1947
Unless otherwise s ta ted , s tat is t ics th rough 1941and descriptive notes may be found in t he1942 Supplement t o t he Survey
1947
June
1946
June July August Sep-tember
Octo-ber
Novem-ber
Decem-ber
1947
Janu-ary
Febru-ary March April May
BUSINESS INDEXES—Continued
INDUSTRIAL PRODUCTION—Continued
Federal Reserve Index—Continued
Unadjusted—Continued.Manufactures—Continued.
Nondurable manufactures—Continued.Leather and products! __ 1935-39=100__
Leather tanning* m doShoes do
Manufactured food products! doDairy productsf doMeat packing doProcessed fruits and vegetables* do
Paper and products! - -doPaper and pulpt do
Petroleum and coal products! doCoke do.Petroleum refinrngf do.
Printing and publishing! _do_Pub her productst do.Textiles and products! . .do .
Cotton consumption do.Pay on deliveries do.Wool textile production _.do.
Tobacco products. do.Minerals! do.
Fuelsf do.Ant.hra.cite! do.Pituminous coal! do.Crude petroleum do.
Metals do.Adjusted, combined index! do.
Man u factures _ do.Durable manufactures. do.
Lumber and products... do.Lumber do.
Nonferrous metals do.Smelting and refining* do.
Stone, clay, and glass products.. ___do.Cement do.Clay products* do.Glass containers do.
Nondurable manufactures do..Alcoholic beverages do.Chemicals do.Leather and products do.
Leather tanning* doManufactured food products do
Dairy products , doMeat parking doProcessed fruits and vegetables* do
Paper and products do___Paper and pulp do
Petroleum and coal products doPetroleum re fin in pf do.
Pn-ntirsp and publishing do.Textiles and products do.Tobacco products do.
Minerals do.Metals do.
MANUFACTTPFFS ' O P P F R S , SHIPMENTS,AND INVENTORIES (VALUE)
New orders, index, totalt avg. month 1939=100..Durable goods industries do . . .
Iron nud steel and their products do___MaoMnerv. including electrical do_._Other durable goods do.._
Nondurable poods industries doShipments, index, tofalt do . . .
Durable poods industries doAutomobiles and equipment doIron and steel and their products. doMachinery, including electrical doNonferrous metals and products doTransportation equipment Cexc. autos) do . . .Other durable Foods industries do
Nondurable goods industries doChemicals and allied products doFood and kindred products doPaper and allied products do . . .Products of petroleum and coal doBubber products doTextile-mill products.. doOther nondurable goods industries. _do
Inventories:Index, fota 1 , . . . . do
Durable goo^s industries doAutomobiles and eouipment doIron and steel and their products doMachinery, including electrical! doNon ferrous metals and products* A doTransportation equipment fexc. autos) doOther durable goods industries! do I
v 154v229
150J»101v 160v 155
146p 213»154
133261
P 165»153v 153P 1 0 9*>147v 159v 153P 183p 189P 2 1 7P 148P ! 2 8p 182J>188*>206
257v 167159
P 248
p 154p 153152
v 131P 159
146v 154159
P 149
127104142137
*18984125147142
»174137
1292181651522451741591411498615615395170176193133127137110190155148240162161233128107139
P12985162146142
»174
12916515313978
214231223331161203209212126187255210535220206208209208185293208199
173189234124251152626128
10194106161
*>197154228136131
J>178160
11521114512723914414515015312815915412617217720212912115114019215514724915717623510399150
*136165175136131
124145140146103
204229252295153188206216169197240206497211199198220185193268174186
181195245128256157642132
119100133164
i>175122255147142
*132165
123221163149240173161147150120156151132178184208135126159150197159150251164174237120101147
*>137138155147142
*>182
129163155144107
211232250292166198222233188212257241457230215206253198196282180193
186200252131261161684136
11899131164
»15137315150144
»181166
128234168153242181166149151125163149136180186212137129172161204162150265165227235119101136
»14338143150144
128168157146111
228254281321173212240259216229289276531247227223244222209311207218
190206258134268163708141
11798130158
»120117216152146
J>179167
135234169155248178179147150124160149126182188214136127184168200156149250168
11797146
J»146115167152146
132169173145111
228248267318173215244262217228287289506263231224248225203333217
••221
197211263137276167739144
123114129158*96181147153147
P 1 7 7152
135243174164256181172135140123116150105183191214142135192175202162150251173213243121110156
*>146163160153147
»177
130174169136117
2332542743141862212672782352373153195032/0260250306242219313221240
200215259137284167781147
114110117157J>95175132150146
*178143
14125216414125418013813214112113014776182190211141132197181210177152265174234249115110162
*147151170150146
»178
138164148137111
241271294326204223276292255232346340561271266255306248232352219251
204220256138290166819153
116113118149*95191102156150
»180171
13324717216126317115714115111817314681189196221142131204184219182168278177241253116113161
*>148163157156150
»180
138172158146117
240270295308215222274292246246326335572283260264291255224290213254
209226269140299179816156
123127121140
»10715286157151
» 185172
13824617316126217816014115010716215084189197222147K7205190219203164263176223252120118156
»149159137157151
»185
140173168146122
254295327344224229290311267256364366567290275277309273229315228267
213232284142306182860159
121121121140
P 1 2 713883159154
»'185172
14523917216027017214914315311316315383190198225147138199195218192165269176208252122122157153149151159154
P 186
142172158148117
249288319336217226288312268263364366547290272278301268236322222263
217238298143316184897165
115118113144
v 16113988156150
p 179166
144234166154270
' 159151139144102127155
r 112«• 1 8 7194222144135
' 195203211175
M64263172189251115119158
P 154150144156150
p. 179
141166160
' 136
••241279
••308••316
219219
r 288320
•• 366371597
••300265
' 2 7 8r 282••276
244311209265
222244300145
••326184928170
12
232527292022283125263f3C60282626282725
2026
2225311533189517
r Pev i sed . p P re l iminary . 1 Index is in process of revision. .• N e w series. Da t a beginning 1939 for the new series under indust r ia l product ion are shown on p p . 18 a n d 19 of the December 1943 Survey . Fo r 1938-45 da ta for t h e index ot in-
ventories for nonferrous meta ls and the i r p roduc t s , s e e p . 22 of t h e Augus t 1946 Survey .! Revised series. For revisions for the indicated unadjus ted indexes a n d all seasonally adjusted indexes shown above for t h e indust r ia l product ion series, see p p . 18-20 of t ne D e -
cember 1943 Survey . Seasonal ad ju s tmen t factors for a n u m b e r of industr ies included in the indust r ia l product ion series shown in the Survey were fixed a t 100 beginning var iousm o n t h s from J a n u a r y 1939 to J u l y 1942; dnta for these industr ies are shown only in the unadjus ted series as the " a d j u s t e d " indexes are the same as the unad jus ted . D a t a for 1939-44for the revised indexes of new orders and sh ipmen t s , except combined indexes for mach inery , are shown on p . 23 of the Ju ly 1946 Survey, and combined indexes for mach inery forthese series and for inventories for 1938-45 are on p . 22 of t h e Augus t 1846 issue; revised figures th rough Augus t 1945 for inventories of "o the r du rab le goods indus t r i e s , " supersedingfigures in the August 1946 Survey , will be publ i shed la ter .
Digitized for FRASER http://fraser.stlouisfed.org/ Federal Reserve Bank of St. Louis

August 1947 SURVEY OF CURRENT BUSINESS S-3
Unless otherwise stated, statistics through 1941and descriptive notes may be found in the1942 Supplement to the Survey
1947
June
1946
June July August Sep-tember
Octo-ber
Noven, Decem-ber
1947
Janu-ary
Febru-ary March April May
BUSINESS INDEXES—Continued
MANUFACTURERS' ORDERS, SHIPMENTS,AND INVENTORIES, (VALUE)—Continued
Inventories—Continued.Index—Continued.
Nondurable goods a-vg month 1939=100Chemicals and allied products doFood and kindred products doPaper and allied products doPetroleum refining _ _ do __Rubber products doTextile-mill products . doOther nondurable goods industries! -- ---do
Estimated value of manufacturers' inventories*mil. of dol
NEW PLANT AND EQUIPMENTEXPENDITURES*
All industries total mil. of dolElectric and gas utilities doManufacturing and mining do _Railroad doCommercial and miscellaneous _ do
3 670410
1,850240
1,160
158166150164118192156176
17,175
2,790230
1,530130910
169170180171120195164182
18,010
173171183178124198168186
18,466
176174184181129204171189
18,886
3,310280
1,810160
1,070
184180195183132212174200
19, 533
187185199183134215173207
19,896
190195202185133216174208
20,259
3,730360
1,920180
1,280
195199206187134238177217
20,805
197204203192133250178221
21,176
199211202196136262183222
21,612
3,160330
1,600160
1,080
' 2 0 3222201
139273
••188223
22,061
203228199206142
188222
22,408
BUSINESS POPULATION
OPERATING BUSINESSES ANDTURN-OVER*
(U. S. Department of CommeiOperating businesses, total, end of quarter
Contract constructionManufacturingRetail tradeWholesale tradeService industriesAll other
New businesses, quarterlyDiscontinued businesses quarterlyBusiness transfers, quarterly
INDUSTRIAL AND COMMERCIAL
(Dun and Pradstreet)Grand total
Commercial serviceConstructionManufacturing and miningRetail tradeWholesale trade
Liabilities, grand total . __ __Commercial serviceConstruction _ _ _ _ _ _Manufacturing and miningRetail trade - _ _. _Wholesale trade
BUSINESS
ce)..thousands
dododododododododo
FAILURES
numberdodododo-_-do
thous. of doldododo_-_dodo
BUSINESS INCORPORATIONS
New incorporations (4 states) . number 2,893
3, 494. 7232.2287 8
1, 614, 5160.1661.2538.8168.7
43 1103.3
693
132524
43,006
7262
1,996661
80
4,388
7479
3617
53,434
413162
1,948835
76
3,946
9212123726
53,799
459516
2,113297414
3,550
3, 595.3241.9298.8
1,661.8165 7681.9545.1146.846 3
108.3
96111732288
4,877311
1,3682,510
367321
3,399
1231114602117
6,400147500
4,975352426
3,771
104139
3836
812, 5113,202
1368,492
392289
3,068
v 3,644.6v 247.9v 307.8
P 1,674.1p 169.0p 696.6p 549.2p 103.5
P 54 288.5
1411418583516
17,105801266
7,2171,0257,796
3,561
2021715677627
15,193582575
11,0201,6741,342
4,202
2382220927034
12,976651766
7, 6541 3962 509
3,018
2542113
1088824
15,251758341
11, 3361,1691,647
3,299
2772316
1178437
16, 0801,015
24711,822
1,5031,493
2,99S
3783320
155119
5117, 326
739321
10, 9713,0372.258
2,870
COMMODITY PRICES
PRICES RECEIVED AND PAID BY FARMERS
U. S. Department of Agriculture
Prices received, all farm productsf 1909-14=100--Crops do
Food grain doFeed grain and hay doTobacco doCotton doFruit doTruck crops doOil-bearing crops do
Livestock and products doMeat animals doDairy products doPoultry and eggs do
Prices paid:*All commodities 1910-14=100
Commodities used in living doCommodities used in production do
All commodities, interest and taxes doParity ratio* do
27126225324039027522821531827833S233205
244252233231117
218223200195370210261185219213230207178
196201190188116
244240215244369249249163242247268245196
209214202199123
249233203225388271203162242263294257199
214221204204123
243236207221396285210154236250249271221
210217200200122
273244218222410304208151255299318300257
218231202207132
263230220187399236186207342294313307230
224239204212124
264232224186406242211166334294311312226
225239207213124
260236223184399240196238336281306292201
227242207215121
262245235185390246203275334278319270192
234248215221119
280266283212390257215299360292345269199
240252224227123
2762692772233872602232053582S2331257'204
243255227230120
272268276218390270222286326275327241203
242254226229119
' Revised, *> Preliminary.•New series. For estimated value of manufacturers' inventories for 1938-42, see p. 7 of the June 1942 Survey and p. S-2 of the May 1943 issue. For data prior to 1945 for the
series'on operating businesses and business turnover, see pp. 21-23 of the May 1946 Survey and p. 10 of the May 1944 issue. The series on new plant and equipment expenditures arecompiled by the Securities and Exchange Commission and the U. S. Department of Commerce and are estimated quarterly totals for all private industry, excluding agriculture, basedon reports from a sample including most of the corporations registered with the Commission and a l»rge sample of unregistered manufacturing companies; data are reported actualexpenditures. The series on prices paid by farmers and the parity ratio are from the U. S. Department of Agriculture; the latter is the ratio of prices received by farmers to prices paid,interest and taxes; data for 1913-45 will be shown later.
t Re vised series. Revised figures for 1938-August 1945 for inventories of "other nondurable goods industries" wi]] be shown later. Indexes of prices received by farmers for 1913-45 are shown on pp. 17-19 of the April 1947 Survey; data for July 15, 1947, are as follows: Total 276; crops, 263: food grain, 251; feed grain and hay, 253; tobacco, 390; cotton, 289;fruit, 215; truck crops, 189; oil-bearing crops, 314; livestock and products, 286; meat animals, 343; dairy, 244; poultry and eggs, 220.
Digitized for FRASER http://fraser.stlouisfed.org/ Federal Reserve Bank of St. Louis

S-4 SURVEY OF CURRENT BUSINESS August 1947
Unless otherwise stated, statistics through 1941and descriptive notes may be found in the1942 Supplement to the Survey
1947
June
1946
June July August Sep-tember
Octo-ber
Novem-ber
Decem-ber
1947
Janu-ary
Febru-ary March April May
COMMODITY PRICES—Continued
RETAIL PRICES
Consumers' price index:§National Industrial Conference Board:$
Combined index 1923=100..Clothing doFood doFuel and light ~ _- doHousing _ _ _ doSundries do
U . S . Department of Labor:Combined index 1935-39=100
Clothing _ - - _ doFood __ __do
Cereals and bakery products* doDairy products* doFruits and vegetables* _ __ doMeats* • do
Fuel electricity and ice do -Gas and electricity* doOther fuels and ice* do
Housefurnishings do __Rent 5 doMiscellaneous do _
U.S . Department of Commerce index:All commodities* _ 1935-39=100..
U .S. Department of Labor indexes:Anthracite 1923-25=100..Bituminous coal do _
Fairchild's index:Combined index Dec. 31,1930=100
Apparel:Infants' doMen's _ _ do __Women's __ do____
Home furnishings do __Piece goods _ _ - __ do
WHOLESALE PRICES
U. S. Department of Labor indexes:Combined index (889 series) d" 1926 =» 100..
Economic classes:Manufactured productscf - do.__.Raw materials _ doSemimanufactured articles _ __» _. do
Farm products doGrains do -Livestock and poultry . _.do
Commodities other than farm products^1 do.___Foods do .
Cereal Droducts _ do____Dairy products _ doFruits and vegetables _ _ . do __Meats do
Commodities other than farm products and foods d*1926=100.-
Building materials „___ _ doBrick and tile do __Cement doLumber. _ do _Paint and paint materials do
Chemicals and allied products! - doChemicals doDrug and pharmaceutical materials! do _Fertilizor materials do _Oils and fats do
Fuel and lighting materials _ . doElectricity doGas _ doPetroleum products-. do.
Hides and leather products _ doHides and skins doLeather ._ doShoes do
Housefurnishing goods , . . . . do _Furnishings _ doFurniture do
Metals and metal productscf - - doIron and steel do___Metals, nonferrous. ._ doPlumbing and heating equipment _ --do
Textile Droducts - -.do .Clothing doCotton goods ._ _ . doHosiery and underwear „ do _Rayon doSilk doWoolen and worsted goods »_ do__
Miscellaneous doAutomobile tires and tubes doPaper and pulp . . . do
Wholesale prices, actual. (See respective commodities.)
v 157.0
190.5154.6171.5205.0216.9
178.8
116.8123 6
123.7
121.7121.4120.4130.7120.1
147. 8
142.3160.2144.2177.9206.0200.9141.0161.8149.2140.9145. 2208.6
131.8175.2134.7114.3266.1163.9120.2118.7156.1101.8139.2103.9
87.5168.0187.1157.1172.6129.2137.2120.9142.6131.4142.9119.1138. 9133.9193.8100.837.068.4
129.2115. 873.0
154.2
108.296.4
116.297.391.0
117.6
133.3157. 2145.6122.1147.8183.5134.0110.592.1
128.4156.1108.5127.9
147.7
108.8111.0
114.7
108.1106.2115.0117.2113.3
112.9
107.3126.3105.7140.1151.8137.4106.7112.9101.7127.3136.1110.1
105.6129.9121. 3102.6176.0108.696.498.0
109.482.7
102.187.867.279.664.0
122.4121.5110.7129.5110.4114.5106.1112.2110.199.2
106.0109.2120.3139.475.830.2(0112.798.573.0
115.6
141.2158.7165.7126.1179.1188.4173.7113.392.1
133.8157.9
128.2
156.3
117.9114.3
115.1
108.2106.6115.7117.4113.3
124.7
118.9141.7110.2157.0181.4162.9117.5140.2124.9156.9130.0169.9
109.5132.1122.5104.0177.3114.999.398.5
112.688.2
114.290.365.680.765.1
141.2169.3133.2140.4111.9117.3106.41.13. 3111.3102.7106.0118.1120.5148.676.330.2
126.7112.7101.373.0
117.1
144.1161.2171.2135.4180.1178.3186.6113.791.8
135.0160.0108.7129.8
159.8
118.0114.4
116.0
109.1108.0116.6118.7113.5
129.1
123.9145.7111.9161.0169.0177.6121.9149.0124.7161.8120. 4198.1
111.6132.7126.0105.8177.6113.998.498.4
110.194.4
102.594.463.979.572.8
138.9155.8133.3140.1112.6118.5106.6114.0113.3101.4106.3124.0122.8160.087.730.2
134.8112.8102.073.0
119.6
114.799.7
131.499.991.0
120.2
145.9165.9174.1137.3186.6176.4188.5114.491.7
136.5165.6108.8129.9
164.3
119.8116.2
116.7
110.3109.1117.5119.8113.9
124.0
117.2141.4115.0154.3170.6150.4117.2131.9127.4169.1115.5131.3
112.2133.8127.8106.5178.2116.798.49S.6
110.390.2
103.394.364.780.673.0
141.6151.5138.5144.8113.6119.4107.5114.2113.5101.4107. 2125.7122.9166.688.730.2
126.5113.9102.173.0
121.9
148.6168.1180.0138.5202.4176.5190.7114.491.6
136.6168.5
131.0
167.2
119.6116.4
117.8
110.4110.0118.2121.3114.3
134.1
129.6148.7118.2165.3174.2174.6127.1157.9128.5185.5122.5191.4
115.8134.8127.8106.5178.9119.299.998.8
111.591.9
111.194.264.180.873.1
142.4153.0138.5145.2115.3121.3109.2125.8113.7101.8107.2128.6125. 5172.988.830.2
125.7116.6104.073.0
124.6
152.2171.0187.7140.6198.5184.5203.6114.891.8
137.2171.0
132.5
171.5
119.6116.5
119.0
111.3111.5118.3124.3116.1
139.7
134.7153.4129.1169.8165.4197.4132.9165.4136.1182.9139.5202.8
120.7145.5129.1107.0192.1151.3118.9106.9152.896.3
191.094.565.284.473.4
172.5221.0178.1162.9118.2124.4111.8130.2114.0118.4107.2131.6127.9174.789.332.0
115.0117.7106.573.0
127.7
123.2105 8149.3100.391.0
125.9
153.3176.5185.9141.6200.9185.0197.8115.592.0
138.3177.1
136.1
172.7
119.6117.6
120.7
117.2114.8118.5126.4118.2
140.9
135.7153.2136.2168.1163.0194.7134.8160.1139.5180.0134.5188.2
124.7157.8130.0106.9227.2155.4125.7111.8181.295.1
203.096.165.883.175.8
176.7216.5185.0169.9120.2126.3113.9134.7117.4129.3114.9134.7129.8181.696.933.8
103.2119.0108.973.0
136.4
153 3179 0183 8143.4190 1187 9199 0117 391 9
142.1179.1108 8137 1
172.7
121 6121 9
122.1
118 4117 7119 5127 9117.5
141.5
136.7152 1138.8165 0162.6189.6136.1156.2139.9164.6131.6183 4
127.6169.7132.2108.3249.9171.2128.1112.7181.799.9
210.697.764.980.876.5
175.1198.5181.6170.6123.3128.4118.2138.0123.9130.5117.0136.6132.4184.699.333.8
101.2120.8110.373.0
141.9
153.2181.5182.3144.1183.2191.7196.7117.592.2
142.3180.8108.9137.4
172.7
121.6122.2
122.9
120.0119.3120.1129.1120.2
144.5
139.7154.9142.1170.4171.1201.5138.6162.0141.3161.8134.2199.5
128.5174.8132.3109.9263.6173.9129. 3113.8182.599.2
214.397.965.784.376.6
173. 8191.4181.1171.5124.6129.6119.5137.9125.0131.3117.1138.0132.7193.7100.037.080.2
121.9110,973.0
143.4
124 9108 3152 3101.591.0
126 9
156 3184.3189.5148.1187 5199 6207.6117 692 2
142.5182. 3109 0138 2
177.2
121.6122 3
123.5
120 9121 1120.2129 9121.4
149.5
143.3163.2145.9182.6203.3216.0142.1167.6150.4157.6141.5207.3
131.1177.5132.4112.3269.3176.1132.2114.5182. 7101.8231.5100.764.384.981.7
174.6192.2183.7171.5125.8131.4120.0139.9126.9139.0117.9139.6133.0196.6100.837.073.2
127.5115.373.0
145.1
156 1184 6188.0153.4178 9200 4202 6118 492 5
143.7182.4109 0139 1
177.2
121. 5122 5
123.9
121 2121 5120 6130 4120. 5
147.7
141.9160 1144. 5177.0199.8199.2141.0162.4154.1148.8142.2196.7
131.8178.8134.5114.0273. 5175.5133.2119.5181.0101.2220.1103.464.384.086.3
166. 4178.1158.0172.1127.4134. 4120.0140.3127.6141. 0118.2139.2133.0194.7100.837.069.4
129.1115.773.0
152. 5
155 8184 4187 6154.2171 5207 0203 9117 692 4
142.2181.6109 2138 7
177.1
116 8123 4
123.8
121 8121 5120 6130 5120.0
146.9
141.7158 6143.2175 7202 4198.7140.4159 8151.7138 8144. 3203 0
131.7177.0134.5114.0269.4169.2127.1118.7173.6102.5179.9103.3
85.086.8
165.6177.7154.5172.2128.8136.9120.3141.4128.6143. 9120.0138.9133.9193.0100.837.067.9
129.2116.173.0
154.3
r Revised. *> Preliminary. i Not available. §Formerly designated "cost of living index." JFor revised 1943 data see p. 20, of April 1946 Survey.d*Current prices of motor vehicles were introduced into the calculation beginning October 1946: April 1942 prices were carried forward in earlier computations (see explanation in
January 1947 Survey); if April 1942 prices had been used in October 1946- June 1947 calculations, indexes would have been as follows: All commodities, 132.5,137.9,139.0,139.5,142.6,147.6, 145.8, 145.0, 145.9; manufactured products, 127.0, 131.7, 132.5, 133.5,136.7,140.2,138.9; 138.7,139.2; commodities other than farm products, 125.1, 130.7, 132.4,133.7, 136.3, 139.8,138.8, 138.1, 138.7; commodities other than farm products and foods, 113.2, 117.8, 121.6,124.4, 125.5,128.1128.9,128.7,128.8; metals and metal products, 114.3,117.0,120.5,123.7,124.3,126.3, 126.9, 127.8, 129.0.
• In May, June, September and October 1946, it was impossible to obtain adequate samples for some meats in a number of cities; in such cases, the latest available prices were car-ried forward in the index; July index reflects full price change from mid-April and November index, full price change from mid-August.
J Data for 1947 are estimated, based on a survey of rents in 5 cities in January and 6 in February, March, April and May; see note in February 1947 issue regarding earlier data.•New series. For a description of the Department of Commerce index of retail prices of all commodities, see p. 28 of the August 1943 Survey; and for revised figures for 1929,1933
and 1935-44, p. 31 of February 1946 Survey. Data for 1923-45 for the indexes of retail prices of the food sub-groups are shown on p. 16 of the November 1946 Survey. Data beginning1935 for the indexes of retail prices of "gas and electricity" and "other fuels and ice" will be published later.
fRevised series. For revised data for 1941-43 for the indicated series on wholesale prices, see p. 23 of the November 1945 Survey.Digitized for FRASER http://fraser.stlouisfed.org/ Federal Reserve Bank of St. Louis

August 1947 SURVEY OF CURRENT BUSINESS S-5
Unless otherwise stated, statistics through 1941and descriptive notes may be found in the1942 Supplement to the Survey
1947
June
1946
June July August Sep-tember
Octo-ber
Novem-ber
Decem-ber
194?
Janu-ary
Febru-ary March April May
COMMODITY PRICES—Continued
PURCHASING
As measured b y -Wholesale pricesConsumers' pricesRetail food pricesPrices received by
POWER
farmers!
OF THE DOLLAR
1935-39=100..d o . . . .do
.do . . . .
54.»63.P52.
39.
1
43
71.375.068.648.9
6470.60.43.
8936
62.369.658.342.8
64.868.557.343.8
60.067.455.539.0
57655340
69
4
67.165.253.740.3
56.965.254.341.0
55.765.354.840.7
53.64.52.38.
8070
54.64.53.38.
5115
546453.39.
9222
CONSTRUCTION ACTIVITY*
New construction, total mil. of doLPrivate, total do. . .
Residential (nonfarm) _ , _ do. -Nonresidential building, except farm and public
utility, total ...mil. of doL.Industrial do
Farm construction _ _. doPublic utility do
Public construction, total do. _Residential _ doMilitary and naval do.Nonresidential building, total... . do. _.
Industrial _ . ._ _ doHighway doAll other _ do
CONTRACT AWARDS, PERMITS. ANDDWELLING UNITS PROVIDED
Value of contracts awarded (F. R. indexes):Total, unadjusted 1923-25=100...
Residential, unadjusted do.Total, adjusted _ do
Residential, adjusted doContract awards, 37 States (F. W. Dodge Corp.):
Total projects numberTotal valuation thous of dol
Public ownershio doPrivate ownership. _ do
Nonresidential buildings:Projects numberFloor area thous. of sq.ft..Valuation _ thous. of dol_.
Residential buildings:Projects numberFloor area thous of sq ftValuation thous of dol
Public works:Projects numberValuation thous. of dol
Utilities:Projects numberValuation . . _ theus. of dol
Indexes of building construction, based on buildingpermits (U. S. Dept. of Labor): f
Number of new dwelling units provided. 1935-39=100,.Permit valuation:
Total building construction . . . . doNew residential buildings. doNew nonresidential buildings doAdditions, alterations, and repairs . do
Estimated number of new dwelling units scheduled tobe started in nonfarm areas (U. S. Dept. of Labor):
Total nonfarm* _ number..Urban, total t - do
Privately financed, total _. . do1-family dwellings - do2-family dwellings - doMultifamily dwellings do. . .
Publicly financed, total doEngineering construction:
Contract awards (E. N. R.)§. thous. of dol..
HIGHWAY CONSTRUCTION
Concrete pavement contract awards: %Total thous. of sq. yd._
Airports _ doRoads doStreets and alleys do
CONSTRUCTION COST INDEXES
Aberthaw (industrial building) 1914—100American Appraisal Co.:
Average, 30 cities . . .1913=100Atlanta _ _ do __New York doSan Francisco . doSt. Louis do
CONSTRUCTION
1,062788369
25213750
117274
81645
312580
v 157v 125P ! 3 5v 113
24, 044605, 070226. 471378. 599
4, 35527, 561
209, 942
17, 60429, 213
209, 458
1,744142,495
34143,175
271.1
271.4387.8172. 6265.7
83, 20047, 01046, 00534, 5763,5427,8871,005
517,175
4,228212
2,4561,560
427448438396421
'871699
'284
3041384071
172231426
66346
201195174177
48,265807,914214,534593,380
4,35741,370
273,207
41,57451,533
332,248
1,950154,009
38448,450
' 300.2
' 235. 2' 360.4r 137. 0' 207. 6
76,90052, 23538,13031,3882,1564,586
14,105
555, 469
4,585747
2,7351,103
270
317337324294309
'982'767'324
3171495076
215321430
68158
179162165161
36,523717,991201,645516,346
3,58242,457
283,635
31,11245,327
281,227
1,537121,149
29231,980
283.7
218.7321.2135.8203.1
79,00052,22737, 96631,1701,9804,816
14, 261
' 512,330
3,345385
1,6871,274
326346332308316
r AND
' 1, 056'809'347
3211596081
247421832
79164
164155158157
40,101679,909204,817475,092
4,10833,080
211,530
33,72745,145
284,025
2,008153,456
25830,898
317.6
235.4378.7119.4215.9
81,80055,40738, 66032, 921
1,9433,796
16,747
541,325
3,73166
2,0551,609
335360341313323
REAL ESTATE
' 1, 066'800'356
3151675079
2665416359
9368
152147151147
36, 902619,857186,882432,975
3,64825,929
169,627
31,45847,121
293,831
1,557107,941
23948,458
248.3
194.6288.0115.9188.4
65, 50042,77535,04429,3352,0503,6597,731
373, 056
3,382490
1,6781,214
287
342367347317332
'3,070'788'347
3181714083
2826620329
9965
138136145140
33,342573,206133,806439,400
3,69633,932
225,355
28,12836,910
235,068
1,27175,535
24737,248
215.7
191.4286.2108.4192.9
60,20037,40136,06729,5761,8994,5921,334
' 448,467
3,182104
1,9571,121
347372353320337
'987'745'335
3081712082
242681727
77654
125118139122
27,149503,745130,329373,416
3,60923, 708
160,871
22,25133,530
221,113
1,01882,626
27139,135
165.3
153.2222.599.2
137.3
46,60028, 66128, 53923, 7471,5943,198
122
275,825
3,239138
1,9701,130
352377356323344
'905'711'320
296166
1085
1945116235
5747
125122154143
25, 536457, 278108, 920348,358
2, 85719, 656
148,014
21, 70429. 975
193, 365
74662, 652
22953, 247
123.2
129.4162.097.0
140.0
35, 20021, 36921, 36917,469
9772,923
0
352, 855
2,30655
1,661590
300
371399375343367
839666300
275159
1081
1733912335
3752
120119146144
27,619571,628166,672404,956
3,09625,700
200,312
23, 59339, 279
257,419
68180,721
24933,176
146.4
151.8196.7107.7164.8
41,00025,38324, 29920, 5371,4962,2661,084
430,970
1,34326
606711
381410390353375
795634284
2601521080
1613312323
3450
131135151152
24,321442,19795,770
346, 427
3,00621, 488
143, 258
20, 44032, 469
208,391
66559, 806
21030, 742
156.1
158.3207.6111.5168.9
44, 40027, 07427, 07422,1561,6153,303
0
356, 491
1,4631
1,081382
390419403364383
826648285
2471462096
1782412363
4858
133135132129
32, 268596, 755143, 316453,439
3,67022, 242
191, 903
21, 41442, 991
282, 881
91877,926
26644,045
217.1
218.5308.8141.8214.1
61,60037,64937,15830,6152,4484,095
491
400,415,
2,43852
1,578808
304
404434420379396
876662306
2401423080
2141615414
7567
152144133123
29,957602, 338177,272425, 066
3,90526, 034
184,317
24, 28439, 006
256, 668
1,509123, 249
25938,104
247.2
251. 6359.1159 4248.7
' 73, 500' 42, 862' 42, 534r 35, 214
' 3, 142r 4, 178
'328
454,471
5,280513
3,1671,600
414444427390403
958717339
2431394095
241101543
310073
'153' 130'127'110
' 27,769' 674,657' 233,873440, 784
4,55430, 238
235, 899
21, 25542, 672
254, 085
' 1, 607' 119,713
35364, 960
237.2
244.2338. 5163. 5241.4
74, 500'41,138'41,138' 33, 670
r 3, 0854,383
514, 343
3,82835
2,607' 1,186
300
419448432392405
f Revised. •» Preliminary. § Data for May, August, and October 1946 and January 1947 are for 5 weeks; other months, 4 weeks.% Based on weekly data combined into 4- and 5-week periods except that a week falling in December and January is prorated; see note in February 1947 Survey.* New series. Estimates of total nonfarm dwelling units for 1910-44 are shown on p. 15 of the November 1946 Survey. Monthly estimates of new construction activity for 1939-45
and annual estimates for 1915-46 are shown on pp. 23 and 24 of the July 1947 Survey; revisions for 1946 not shown above (mil. of dol.): Total new construction—Jan., 469; Feb., 488; Mar.,567; Apr., 661; May, 768; private, total—Jan., 382; Feb., 409; Mar., 466; Apr., 541; May, 622; residential, (nonfarm)—Jan., 133; Feb., 138; Mar., 161; Apr., 198; May, 240.
t The index of purchasing power of the dollar based on prices received by farmers has been shown on a revised basis beginning in the April 1944 Survey. Revisions for the indexesof building construction for January 1940-December 1945 are available on request. Data for 1920-44 for the number of new dwelling units are shown on p. 15 of the November 1946Survey (see note in February 1947 Survey with regard to January and February 1945 figures). Since early 1945 data for new dwelling units and the indexes of building constructionabove should be considered volume of construction for which permits were issued or contracts awarded rather than volume started. (See note in July 1947 Survey.)
Digitized for FRASER http://fraser.stlouisfed.org/ Federal Reserve Bank of St. Louis

S-6 SURVEY OF CURRENT BUSINESS August 1947
Unless otherwise stated, statistics through 1941and descriptive notes may be found in the1942 Supplement to the Survey
1947
June
1946
June July August Sep-tember
Octo-ber
Novem-ber
Decem-ber
1947
Janu-ary
Febru-ary March April May
CONSTRUCTION AND REAL ESTATE—Continued
CONSTRUCTION COST INDEXES—Continued
Associated General Contractors (all types)—1913=100—E. H. Boeckh and Associates, Inc.:
Apartments, hotels, and office buildings:Brick and concrete:
Atlanta U. S. average, 1926-29=100—New York do -San Francisco -doSt. Louis do
Commercial and factory buildings:Brick and concrete:
Atlanta __doNew York doSan Francisco -doSt. Louis _ - - _-do
Brick and steel:Atlanta __» ... doNew York - __doSan Francisco ~ --doSt. Louis do
Residences:Brick:
Atlanta doNew York —doSan Francisco doSt. Louis.. do
Frame:Atlanta doNew York doSan Francisco - _ -doSt Louis do
Engineering News Record:Building* -1913=100--Construction (all types) do
Federal Home Loan Bank Administration:Standard 6-room frame house:f
Combined index. 1935-39=100-Materials _ — do
REAL ESTATE
Fed. Hous. Admn., home mortgage insurance:Premium-paying mortgages (cumulative) mil. of doL.
Estimated total nonfarm mortgages recorded ($20,000and under)* thous. of doL_
Estimated new mortgage loans by all savings and loanassociations, total thou . of dol._
Classified according to purpose:Mortgage loans on homes:
Construction doHome purchase -doRefinancing - doRepairs and reconditioning do
Loans for all other purposes do __Loans outstanding of agencies under the Federal Home
Loan Bank Administration:Federal Savings and Loan Associations, estimated
mortgages outstandingt mil. of doL_Federal Home Loan Banks, outstanding advances to
member institutions - mil. of doL-Home Owners' Loan Corporation, balance of loans
outstanding mil. of dol._Foreclosures, nonfarm, index, adjustedt-1935-39=100-.Fire losses -. thous. of dol._
294
160.3211.2186.6187.8
159.6212.5190.6187.8
158. 8206.6188.0187.5
184.0223.4195.1205.6
187.9225.0194.0207. 2
304.9406.5
7,217
947,357
323,368
69,700184,62628, 94811. 96328,131
3,762
289
557
50,840
252
138.6178.6158.7161.9
137.0180.3158.7164.8
135. 5175. 6160.1160.8
148.6181.3159.0167.8
150.2181.6157.5167.7
267.3354.7
145.7141.6153.8
6,721
917, 414
325,997
56, 297218, 57522, 4026,625
22,098
2,887
203
7356.7
44, 240
258
141.2180.0160.6164.0
141.3181.5159 3166.2
137.5177.3161.5162.9
152.4185.6163.5172.5
153.3186.0164.0172.7
272.3B61.4
147.7143.7155.6
6,759
S81,187
326,048
59, 708216, 369
21, 3887,327
21, 256
202
7156.3
40,998
263
142.6181.5164.0164.9
144.4184.5167.0166.7
141.8179.5168.0164.3
154.5187.1165.8173.7
155.4187.4162. 9174.0
272.4360.2
149.8146.1157.2
6,789
999, 221
324,459
59, 377211,80422, 0328,481
22, 765
214
6996.8
40,019
267
143.0181.9164.3165.3
144.7384.8167.2167.0
142.2179.9168.2164.7
155.6188.0166.0174.6
156.5188.5163.1175.1
273.0360.9
151.8148.0159.3
6,818
928, 878
309,791
55, 354198, 84221,5468,027
26,022
3,152
235
6827.0
40, 256
267
144.0182.3164.8165.8
146.0185.1167.6167.2
142.7180.3168.6164.9
156.2188.9166.4174.9
157.0189.7163.5175.4
274.0362.5
154.0150. 3161.6
6,855
1,006,681
326,199
60,931207,13924, 3769,061
24,692
253
6657.4
40,108
270
144.9183.4165.9167.2
146.6185.9168.4168.3
143.9182.3169.8166.5
159.2192.6169.6178.9
160.8194.4166.8179.8
278.8368.1
156. 7153.6163.1
6,885
869, 489
271, 476
51,187170,162
21, 6257,034
21, 468
258
6519.7
44,706
275
145.7183.9167.3168.5
147.1186.2169.4169.3
145.8183.0172.5169.5
161.9195.4173.2183.4
164.2198.0170.8183.8
289.1381.7
159.8158.6164.8
6,921
836, 404
253,701
50,233151,84822,1166,040
23,464
3,358
293
6368.6
58,094
277
148.8194.7172.4173.9
149.9193.5174.6175.2
148.8191.1176.1172.8
165.8204.7177.0187.6
166.8208.9173.9187.0
297.7390.8
167.0168. 2166.8
6,959
847, 043
250,016
51,145145, 25322, 5996,795
24, 204
251
621'8 .6
57,180
280
153. 4196.2174.2175.8
152.0194.4175.7176.4
153.1192.9178.4175.3
178.7211.2185.6196.9
182.9217.2184.9198.9
298.8392.0
173.8177.6168.6
6,995
770, 095
241, 263
52, 723133, 39922, 5297,091
25, 521
242
6098.5
64, 247
282
154.4204.7177.8178.0
153. 5205.9180.4179.0
153.5202.4180.7176.9
179.2217.6188.6199.1
183.3220.8187.0200.3
300.8396.1
179.6185.6170.2
7,036
858,675
288,221
61, 543161. 69425,9169, 665
29,403
3,526
236
5969.3
72,435
286
155.1205 6178 1178.3
154.1206.8180.6179.2
154.2203.4180.9177.1
180.2219.1188 8199.3
183.9221.6187.2200.5
299.6396.5
182.5188.8172.4
7,087
941,020
313,636
70,214176. 39526.14910,78830,090
245
582
68,029
290
155.4205 9178 4182.8
154.3207.0180 8185.4
154.4203.6181.1182.1
180 4219.3189 0202.2
184.1221.8187.4202.2
303.1403.3
183.7189.1175.5
7,147
965, 733
335,074
78, 612186,14828, 38311,55830,373
257
570
56,545
DOMESTIC TRADE
ADVERTISING
Advertising indexes, adjusted:!Printers' Ink, combined index 1935-39=100..
Farm papers do^Magazines doNewsnapers doOutdoor doRadio do
Tide, combined index* __doRadio advertising:
Cost of facilities total thous. of dolAutomobiles and accessories doClothing - do . . .Electrical household equipment doFinancial do _Foods, food beverages, confections doGasoline and oil . doHousefurn t h i n g s etc do _Soap, cleansers, etc „ doSrnokinp materials doToilet goods medical supplies doAll other___ do
15,023505100275400
3,878499167169
1, 4334,4621,613 5
156.8167.7191.3125. 9193.9313.2171.9
15,827771196323376
4,114505163
1,4491,2684,9071, 755
177.1184.2228.7145.9199.9307.0193.9
14,414660
91327351
3, 637503154
1,3141,3374,7141, 320
184.5182.8237.7153. 0213.8307.8207.6
14,01155995
332350
3, 554503177
1,3321,2674,5251,316
171.9200.9214.1139.5217.7317.1202. 0
15,133666
80266356
3,927536168
1, 3751,2195, 0041,536
163.5195.7218.8134.4212.3264.0189.1
16,74162284
254364
4,512520168
1, 5751,4075.3061,929
167.2212.7201.6138.1233.3275.5195.6
16,338654105268387
4, 396530159
1, 4901, 3735,1231,855
160.6201.9202.9131.5237.5268.0189.9
16,800731112252428
4,379583165
1,5741, 3905, 3161,870
205.7
16, 548670100273444
4, 357546169
1, 6421,3555,1481,845
201.0
15,102629
99224458
3, 924507153
1, 5551,2574, 5681,726
194.2
16, 728740123249532
4, 344541175
1. 6851, 3975,0071,934
197.1
15, 5485r'508
284508
4,040407155
1,7291, 3084,7141,641
196.2
16,009573111301412
4,120409177
1, 7621, 4334,7441,877
*• Revised. JMinor revisions for January 1939-July 1942 are available on request.*New series. For a description of the series on nonfarm mortgages recorded and data for January 1939 to September 1942 see p. S-5 of the November 1942 Survey. For a brief
description of the Tide index of advertising see note marked "*" on p. S-6 of the April 1946 Survey; data beginning 1936 are available on request. See note in the February 1947 Sur-vey regarding the Engineering News Record index of building cost; data beginning 1913 will be shown later.
t Revised series. Revisions for the index of nonfarm foreclosures for 1940-41 are shown on p. S-6 of the May 1943 Survey. Indexes of advertising from Printers' Ink have beenrevised recently. This revised series will be substituted for indexes shown above when complete data are received. The indexes of cost of the standard 6-room frame house areshown on a revised basis beginning in the April 1946 Survey; revision beginning November 1935 will be published later.
Digitized for FRASER http://fraser.stlouisfed.org/ Federal Reserve Bank of St. Louis

August 1947 SUKVEY OF CURRENT BUSINESS S-7
Unless otherwise stated, statistics through 1941and descriptive notes may be found in the1942 Supplement to the Survey
1947
June
1946
June July August Sep-tember
Octo-ber
Novem-ber
Decem-ber
1947
Janu-ary
Febru-ary March April May
DOMESTIC TRADE—Continued
ADVERTISING—Continued
Magazine advertising:Cost, total thous. of dol__
Automobiles and accessories ._ doClothing doElectric household equipment.. _ . doFinancial doFoods, food beverages, confections doGasoline and oil doHousefurnishings, etc doSoap, cleansers, etc _ _ . _ do __Office furnishing and supplies doSmoking materials . doToilet goods, medical supplies doAll other do
Linage, total._ _. thous. of linesNewspaper advertising:
Linage, total (52 cities) _ _ _ _ _ _ _ . . do _Classified doDisplay, total _ _ . d o
Automotive doFinancial . doGeneral do __Retail do
GOODS IN WAREHOUSES
Space occupied in public-merchandise warehouses §percent of total._
POSTAL BUSINESS
Money orders:Domestic, issued (50 cities):
Number _ ._ thousandsValue thous. of dol._
Domestic, paid (50 cities):Number thousandsValue thous. of dol__
CONSUMER EXPENDITURES
Estimated expenditures for soods and services:*Quarterly totals, seasonally adjusted, at annual rate:
Total exnenditures bil of dol
Nondurable commodities doServices do
RETAIL TRADEAll retail stores:f
Estimated sales, total __.mil. of dol__Durable goods store _ _ _ do
Automotive group doMotor vehicles doParts and acessories.. do
Building materials and hardware doBuilding materials. _ do _Farm implements doHardware . _ _ do
Homefumishings group doFurniture and housefurnishings _ doHousehold appliance and radios do
Jewelry stores_ _ _ _ _ do __Nondurable goods stores _ do
Apparel group _ _.. _ _ _ _ d oMen's clothing and furnishings doWomen's apparel and accessories__ do _Family and other apparel doShoes, _ _ do __
Drue stores __ _ _ _ _ doEating and drinking places... _ .do __Food group. . _ do
Grocerv and combination .doOther food. _ do
Filling stations doGeneral merchandise group _«. do_
Department, including mail order. . do __General, including general merchandise with
food doOther general mdse, and drv goods doVariety "_ do
3,413
163,13039, 341
123, 7897,0141,933
26, Oil88,831
85.1
159 020 095 044.0
8,7652,077
833703130669425
7716747931316696
6,688717192295
97133288996
2,2721,770
502340
1,200788
153125134
32,3602,2972,448
782580
3,919589
1,980793790808
5,87911, 2853,757
137, 71834, 502
103,2163,7142,138
21,37175,993
85.2
4,40898,557
13,343175,987
138.213 983 241.2
7,7361,554
551426125516312
57147386275111101
6,181731186312101132296
1,0091,9271,452
475310
1,136748
134120134
25,1062,0341,215
549564
3,298557
1,138481406546
4,6089,7103,870
131,28035, 98395, 2963,6442,584
19, 97369,095
85.1
4,444101,857
13, 217181, 229
7,6711,611
609484125541336
6214237725911884
6,06055513124480
100293
1,0242,0191,512
507325
1,022640
140112131
27,1342,1862,936
638478
2,907638
1,180476554604
4,20810,3284,704
144, 28838,643
105, 6454,0461,931
19,37880,290
85.5
4,330101, 735
13, 690192,319
8,5561,770
691560132571362
5815141828513291
6,786719166322105127300
1,0732, 2871, 748
538340
1, 207788
348126146
36,5062,4254,8831,145
6953,660
5262,426
6741,053
9165,226
12,8765,308
152,87139,018
113,8533,4951,877
22,06786,414
87.0
4,167101,169
13,125185,779
147.316 288.942.1
8,1991,722
682562120545349
5214341028112986
6,476791195355111130287
1,0542,0041,502
502320
1,203809
139124131
39,4632,5034,8311,161
6294,394
7152,772
779896
1,0956,172
13, 5155,420
165,01439, 628
125,3864,4802,197
27, 20791, 502
87.6
4,575107,822
15, 649219, 270
8,9111,921
753621132602381
6415847131715496
6,990856222377123134298
1,0722,1611,628
532343
1, 357910
154142151
42, 5652,7554,4491,315
7454,993
7162,753
6671,0251,2526,694
15,1995,213
164,12036, 772
127,3484,6752,025
26, 59694,052
88.2
4,25395,112
14,042193,807
9,0861,854
730598132540330
56154468317151116
7,232858237364129127300
1,0112, 3241,792
532332
1,4881,016
155146171
36, 2321,4993,4561,080
6084,172
2182,408
455992
1,2775,779
14,2873,783
163, 25734, 404
128, 8533,4151,894
22,388101,155
88.8
4,44793, 691
13,932189,903
154.918 293.643.1
10, 2822,054
742586155535306
50180532357175245
8,2291,089
316454162158395
1.0152, 3801,831
548332
1, 9301,277
173199281
23,9631,3831,826
466505
3,931160
1,147407369920
3,4119,4383,952
139,89436, 223
103, 6713. 5562,511
19,89577, 709
89.6
4,47795,899
14,086193,877
7,8381,620
696589107476304
51120377240137
716,218
6101452808898
286961
2,2131,707
506304995656
124100116
32,1091,5763,345
740566
5,033250
1,641760551829
5,13711, 6834,580
139,99334, 588
105, 4054,0971.767
22, 32377, 218
88.8
4,14790, 038
12, 691186, 444
7,4641,584
68158299
460293
50117373240132
715,880
5491332507888
275861
2,0981, 632
467282973639
12097
117
42, 6172,3255,2771,169
6666,068
5362,687
916863
1,0696,086
14, 9565,102
167, 38439, 437
127, 9485,5372,157
27,16393,090
88.9
4,863108,862
14, 755210, 579
156.819 094.043.8
8,7461,860
79968311655234366
143429283146
796,886
806192375108131302960
2,3171,812
505314
1,247842
142123141
40, 8162,2624, 6631,288
6594,926
6003,2921,016
624887
5,92414, 6774,703
168, 44539, 580
128, 8656,4732,008
28,10092,283
88.7
4, 57997, 079
14, 651195, 527
8,8221,988
828710118635394
7816444429315081
6, 834775185352101137289978
2,3021, 786
516327
1,260834
151126149
42, 8012,6014,6611,541
6985,246
6273,5301,182
995860
6,12014, 7404,332
172,37641,301
131, 0756,5121,950
28, 21094,403
89.2
4,28089,824
13, 771188, 244
' 9, 2802,102
835706129
'674414
79182
'496331164
97r 7, 178
••786' 194'348
104139303
1, 0362,4781,942
536346
' 1,305r857
165136147
*• Revised. § See note marked " § " on p. S-6 of the April 1943 Survey in regard to enlargement of the reporting sample in August 1942*New series. The estimates of consumer expenditures shown above nave been revised in accordance with revisions in the quarterly estimates for 1939-46 and earlier annual totals
shown as a component of the gross national product in the "National Income Supplement to the July Survey" referred to in the note marked with an "*" on p. S-l. In addition,it should be noted that quarterly dollar figures, seasonally adjusted, arejnow shown at annual rates instead of unadjusted quarterly totals, as formerly. The indexes have been dis-continued. A breakdown of the quarterly estimates by major groups is being compiled and will be included in the Survey at a later date.
tRevised series. For revised data (dollar figures and indexes) on sales of retail stores for January 1943 to June 1944, and earlier revisions for a number of series, see table on pp.19 and 20 of the September 1945 Survey (corrections for p. 19: March 1944 indexes—building materials and hardware stores, 143.6; jewelry stores, 460.7; June 1944 index for apparelstores. 201.0; 1940 dollar figures, all retail stores—January 3, 198; February 3, 108); except as given in this table or indicated in footnote 1 thereto, data for 1929, 1933, and 1935-42 arecorrect as published on pp. 7 and 11-14 of the November 1943 Survey. Revisions for January-April 1945 are shown on p. 24 of the August 1946 Survey and data for later months of1945 are on pp. S-7 and S-8 of the July 1946 issue.
Digitized for FRASER http://fraser.stlouisfed.org/ Federal Reserve Bank of St. Louis

S-8 SUEVEY OF CURRENT BUSINESS August 1947
Unless otherwise s ta ted , s tat is t ics th rough 1941and descriptive notes may be found in t h e1942 Supplement to the Survey
1947
June
1946
June July August Sep-tember
Octo-ber
Novem-ber
Decem-ber
1947
Janu-ary
Febru-ary M arch April M a y
DOMESTIC TRADE—Continued
RETAIL TRADE—Continued
All retail stores!—Continued.Estimated sales—Continued.
Nondurable goods store—Continued.Other retail stores . . .mil . of dol...
Feed and farm supply doFuel and ice do. _LiQUors doOther - - . d o
Indexes of sales:Unadjusted, combined index. 1935-39= 100..
Durable goods stores doNondurable goods stores - do
Adjusted, combined index doIndex eliminating price changes - do
Durable goods stores doAutomotive doBuilding materials and hardware do _Homefnrnishings doJewelry ^ _ do
Nondurable goods stores •»- -do__AppareL. -doDrug - - doEating and drinking places doFood doFilling stations doGeneral merchandise. doOther retail stores do
Estimated inventories, total* mil. of doL.Durable goods stores* doNondurable goods stores* do. __
Chain stores and mail-order houses:Sales, estimated, total* -- do
Apparel group* . doMen's wear* do. _Women's wear* doShoes* - d°
Automotive parts and accessories* doBuilding materials* doDrug* doEating and drinking* _ __ _ _do___Furniture and housefurnishings* - doGeneral merchandise group* - ----- --do
Department, dry goods, and general merchan-dise* . mil.ofdoL-
Mail-order (catalog sales)* -- doVariety* do
Grocery and combination* doIndexes of sales:
Unadjusted, combined index* 1935-39=100.-Adjusted, combined index* do
Apparel group* doMen's wear* > do"Women's wear* doShoes* do
Automotive parts and accessories* - doBuilding materials* -- - -do. . .Drug* ___doEating and drinking* - doFurniture and housefurnishings* doGeneral merchandise group* do
Department, dry goods, and general merchan-dise* . . . 1935-39=100..
Mail-order* doVariety* . do_ __
Grocery and combination* doDepartment stores:
Accounts, collections, and sales by type of payment:Accounts receivable:
Instalment accounts?,- 1941 average=100_.Open accounts! do
Ratio of collections to accounts receivable:Instalment accounts! percentOpen accounts§ - do
Sales by type of credit:*Cash sales percent of total sales.-Charpe account sales - - doInstalment sales do
Sales, unadjusted, total U. S ! . ._ 1935-39= 100..Atlanta! - doBoston! doChicago! - . . - doCleveland! „ -doDallas! doKansas City! -- doMinneapolis! >. -_ _ -doNew York! doPhiladelphia! doRichmond! doSt. Louis! . doSan Francisco - do
875237137140361
279.8267. 6283.8275.3153.8253.9185.9305.4369.1387. 6282.3297. 7247.2387.1295. 4152. 5249.9307.79,3613, 5965,765
1,966228
37104694493655025
509
30477
116661
273.0270.2285.4260.1365. 0220.9218.3330. 8224.0227.5260. 8264.3
321.5237.2162. 7314.8
5539
6p 265
307
270267308
269231238278269
»294
773207
89146331
242.3200.1256.1238.7162.6189.8122.4235.6296.9397.8254. 7290.2251.0392.3289.3139.0232.9268.87,1142,1864,928
1,650224
36105654464684822
146
25961
116479
220.8218. 6270. 5240.5357.9199.1216.0225. 4229. 6216.5232.4224.8
262. 5196.7
' 185. 6213.3
46133
3360
59374
253306216245257
'310'266
236221228
'269274288
822232125150315
235.2200.0246.7247.5158.2201.0134.6250.2298.4417.5262.6291. 5240.4387.6251.9140.6237.2299.17,4392,3195,120
1,5991712484504564675021
425
24259
113486
212.9230.6278.1250. 8343.2230.2224.9225. 8226.1224.3225.5242.0
283.9222.5189.3226.8
45119
3257
61354
208275157198203290239204158175220234266
859219134163344
252.6214.1265.2261.4163.4214.9152.3263.7304.7409.9276.5331.3242.4382.2271.5147.2253.4297.48, 0552,4775, 578r
l',876205
3396594872705123
502
28679
126618
234.1254.0330. 0360. 5379.3268.0234.5234. 5232.5222.1201.3259.4
300.9259.3197.0267.4
48127
3559
60364
242321184236249332279232189195254284291
817205136144333
266.8228.1279.4256.5156.6221.4159.4256.1329.6421.9267.9299.8242.0395. 5262.6146.9237.9294.18,4872,6825, 805
1,715213
3996604274665022
492
27891
113482
244.2238.3284.8321.6358. 5191.0237.8233. 3225.3209.5202.0244.9
279.8250. 5188.6243.9
50145
3456
57394
278374237268251395311287214246316316326
903218156160369
269.0232.6280.8260.3156.0225. 6172.2249.9329. 6387.3271.6285.0249.1408.6274. 5157. 5230.4297.89,1362,9506,186
1,913233
46103634675705327
571
324104131542
250.1237.2273.7283.4337.4206.7251.3211.3226.8212.5204.1241.5
283.0202. 5199.3245.8
55156
3760
5639
5278372240268265384312281202258312313330
918210152176381
282.2238.6296.4273.0159.3229.2172.0256. 0342.0388. 5287.3295. 3260.4421.9296. 4163.3241.8320.39,5623,1906,372
2,037235
48103
634961725127
594
331104147650
268.3254.9280.9286.0336.3226.6287.9208.9239.0218.2215. 7249.4
289.6221.3203.4283.1
62176
3759
57385
336416284318333434340302301318370371376
1,089207162228491
321.6262.4340.9270.1156. 8231.6168.2280.7331.3385.9282.7289.2264.9394.6298.7166.2240.7303.38,7282,9115, 817
2,398303
55139845955
1005532
776
42992
243666
325.7258. 8280.0262. 9328.6245.2299.4250.2250.8208.9216.0243.1
288.9181.5206.7297.0
75224
3554
5738
5441570398409430567448385392408494463503
848204202143299
241.3201.2254.4276.2160.2236.7170.9294.0336.8364.1289.1303.0251.7423.3303.4169.1239.0313.48,9433,1925,751
1,690163
3073462965665218
387
20375
100633
225.2262.8299. 6258.9358.4269.1192.0290.9227.1228.8230.0253.0
287.0259.7196.2300.7
75176
2952
5737
6209273170196194294225196182188219228249
842209203140291
250.1214.6261. 7280.6162.8250. 7184.6315. 7337. 4391.7280.3309.2255.4406.5301.3171.5242,9327.79, 4413,4166,025
1, 658153
2772412863644722
389
20277
101629
239.1269.1297.9274.0361. 5251. 2201.7331.3231.2221.8257.4256. 3
293.7268.6191.8309.9
74154
2851
56386
222298171210210306247202188192226244278
941252192157341
265.1230.6276.4277.6156. 6249.5187.1299.4343.0413.5286. 7308.4259.1389. 5297.6162. 2246.2322.09,9543, 7746,180
2, 01524C
45118623574705224
508
28096
122713
261.5272.7298.6309.8381.0210.5222.9320.8231. 4220.8241.7268. e
312.7276.0198.3212.2
76160
3256
55396
266346227250262337283258229255292288295
902270138147348
275.4249.8283.7274.2154. 6250.7197.1267. 6321.5408. 7281.8293. 0250. 9393. 4299. 5159.0244.721-5.09,9713, 71 66,175
2,017'240
40' 111
' 6 938
r f\~
• 5 1
24.532
30388
129689
' 272. 7' 268. 5' 290. 7' 268. 0' 373. 0'221 .8
212.6
927 7'218 .6' 223. 2' 264. 2
' 309. 4246.3205.4313.3
80164
2954
5539fi
2C<h,
35C227
266347290264223248210297297
' 9 22513
' 1 5' 3 7
279.260.285.274.
' 154.245.186.
' 291.'336.
386.283.
' 296.'248.'396.
299.154.
' 252.'293.'9 ,66' 3, 6?'5 ,97
'2 ,12'24
4' 11
t4c(c
5,
35i
IS7
272.209.294287374219234
r228223
r ?32264
'7315246
'194313
1
' 2322232
' 2
2333
' Revised. » Preliminary. §Minor revisions in the figures prior to November 1941 are available on request.•New series. Revised 1940-43 dollar figures and indexes for total chain store sales and furniture and house furnishings, 1942-43 indexes for all series in the general merchandise
group except mail-order, and revisions in the 1942 or 1943 data for a few other series are available on p. 20 of the September 1945 Survey. Except as given on that page, data for 1929,1933, and 1935 to March 1943 are correct as published on pp. 15-17 of the February 1944 Survey. Revisions for January-April 1945 for grocery and combination stores and the total(dollar figures and indexes) are shown on p. 24 of the August 1946 Survey. Data beginning 1939 for retail inventories will be published later; data shown in the Survey beginningwith the June 1944 issue are comparable with estimates published currently. See p. S-9 of the August 1944 Survey for data beginning June 1943 for the series on department storegales by type of payment.
!Revised series. See note marked "f" on p. S-7 for reference to data through June 1944 and for January-April 1945 for sales of all retail stores. The indexes of department storesales for the United States and the indicated districts have been revised for all years. Revised data beginning 1919 or 1923 for the United States and several districts have been p r v
lished as follows United States, p . 17 of December 1944 Survey (there have been unpublished minor revisions in the adjusted index for 1938-45); Atlanta, p. 23 of May 1947 issue;Dallas, p. 20 of February 1944 issue; New York, p. 20 of April 1947 issue; Richmond, p. 22 of June 1944 issue (further revisions in the 1943-44 data are in footnote on p. S-8 of March1946 issue); complete revisions for other districts will be shown later; there have been further revisions in the adjusted indexes for Kansas City and Cleveland as published prior tothe July 1946 and September 1946 issues, respectively, and for Philadelphia as published prior to July 1947 issue.
Digitized for FRASER http://fraser.stlouisfed.org/ Federal Reserve Bank of St. Louis

August 1947 SURVEY OF CURRENT BUSINESS S-9
Unless otherwise stated, statistics through 1941and descriptive notes may be found in the1942 Supplement to the Survey
1947
June
1946
June July August Sep-tember
Octo-ber
Novem-ber
Decem-ber
1947
Janu-ary
Febru-ary March April M a y
DOMESTIC TRADE—Continued
RETAIL TRADE—Continued
Department stores—Continued.Sales, adjusted, total U. S.f—- 1935-39=100.
Atlantaj - - __do___Boston! - do._.Chicagot - doCleveland! ._ do. . .Dallas! _ - . do. . .Kansas City! do.. .Minneapolis! -- do.. .New Yorkf_ do._.Philadelphiaf do.. .Richmond! doSt. Louisf do.. .San Francisco . _ do._.
Stocks, total U. S., end of month:! ,Unadjusted 1935-39=100.Adjusted do
Mail-order and store sales:Total sales, 2 companies thous. of dol.
Montgomery Ward & Co. _ do.. .Sears, Roebuck & Co __ _do___
Rural sales of general merchandise:Total U. S., unadjusted 1929-31=100,
East do. . .South do.. .Middle West „._ do.. .Far West do.. .
Total U. S., adjusted . do.. .East .do___South _do___Middle West.._. . .do . . .Far West _ _do.__
WHOLESALE TRADE
Service and limited function wholesalers:*Estimated sales, total mil. of dol
Durable goods establishments do__Nondurable goods establishments do__
All wholesalers, estimated inventories* do..
365
278284362
P 3 0 5283254265316299
253,09189,635163, 456
287.7278.0384.3251.1335.3315.8302.8478.0266.0351.8
4,8421,7003,1426, 755
276365232253273
••365•-289
248243253
'306305
'314
205210
201,97675, 428
126, 548
243.4236.6322.4210.0294.1267.2257. 7401.0222.4
4,1451,2392,9064,498
273343227254260381281253236243307300322
223222
194, 50372, 667121,836
214.8189.5300. 4188.3263.5294.2266.1442.4255.1321.4
4,5051,3173,1884,642
290365246281286381300259259259307330324
238221
232,81191,864
140,946
288. 0268.0394.0253.2325.2352.1336.2546.4306.9353.1
4,7721,4363, 3364, 809
270367226263249376321265205246298313313
250226
242,46194,005148, 456
340.3320.1493.2286.7383.5321.9325. 6446.8279.7327.7
4,8791,4833,3965,055
257347216250248349297254179233286293319
267237
283, 733112,155171,578
345.1334.6493.8293.2384.9265.6260.0333.2230.8320.5
5,6421,6803,9625,338
272347230261266356283253231239291294319
277256
281, 422106, 355175,067
376.9372.8552.2313.2439.0289.7289.2402.1238.9361. 9
5,3681,6003, 7685,738
274363231264277348299251232250293303317
235274
313, 678117,281
333.8491.5312.6465.5229.4200.5327.2200.4285.2
5,3461,6713,6755,939
265341215245256363281262228247
'293278313
234268
201, 05267, 097133,955
239.7243.8348.3199.6258.9315.0320.7440.3261. 0352. 2
5,1091,5833, 5266.271
269338219262256347272261224234281290330
252275
185, 80071, 205114,595
279.6266.0430.4235. 5295. 0345.6325.2471.9296.2398. 6
4,7321, 5093,1336, 514
275346237260257347298279229236307294
"325
265273
249, 26397, 552151, 711
331.0358.2423.2289.0350.5376.9398.9468.6326.2425.8
4,9961, 7363,2606,729
276353227261272377296257235258299306315
263265
260,32599,623160, 701
307.6309.3409.5263. 5336. 5334.6324.6464.8282.1376.8
4.9771.8183,1596,823
367*>241276298379
*316'273253275303321323
»'253
2 75,884104,322171,562
292.5296.3382.9250.6328.8318. 6322.1451.5264.7365.7
4,948' 1, 763' 3,1856,734
EMPLOYMENT CONDITIONS AND WAGES
EMPLOYMENT
Employment status of noninstitutionarpopulation:*Estimated number 14 years of age and over,
total thous..Female , . doMale do
Armed forces.. doCivilian labor force, total do
Female doMale do
Employed.. .. .doFemale ...doMale _. do.-«.Agricultural employment. - doNonagricultural employment do
Unemployed ._ doNot in labor force » do
Employees in nonagricultural establishments: fUnadjusted (U. S. Department of Labor):
Total . . . . .doManufacturing doMining doConstruction doTransportation and public utilities ..doTrade doFinancial, service, and miscellaneous do.—Government _ do
Adjusted (Federal Reserve):Total . . . . . . .do
Manufacturing . doMining ..do.-..-Construction . doTransportation and public utilities ..doTrade.. do
Estimated production workers in manufacturing indus-tries, total (U. S. Dept. of Labor)* thousands..
Durable goods industries doIron and steel and their products do
Blast furnaces, steel works, and rolling millsthousands. -
107,40754, 50652,910
1,39862,60918,14944,46060,05517,30242, 75310,37749, 678
2, 55543,399
42, 22615, 259
8891,7614,1218,5676,2225,407
P 42, 203* 15, 288
*>889v 1, 693v 4,080
12,3526,4571,554
106, 21053,75052,4603,070
58, 93017, 27041, 66056,36016, 71039, 65010,01046,3602,570
44, 210
40,68014,371
8641,5323,9968,3425,9615,614
• 40,67114,400
8641,4733,9568,426
11,6235,8651,403
453
106,36053,82052, 5402,710
60,11017,40042, 71057,84016, 89040,9509,970
47, 8702,27043,540
40,87714,526
8731,6274,0518,3375,9755,488
• 40, 79714,475
8731, 5353,9918,464
11,7675, 9841,445
470
106,47053. 89052, 5802,45059,75017,17042,58057,69016, 71040,9809,14048,5502,060
44,270
41, 46614,876
8861,7134,1038,4025,9845,502
'41,30914,745
8861,6014.0428,573
12,1016,1601,490
480 i
106, 63053,98052,6502,22059,12017, 27041, 85057,05016, 78040, 2708,75048,3002,07045, 290
41,84815,035
8841,7474,0648,5236,9905,605
' 41,66914,953
8841,6484,0648,609
12, 2446,2491, 514
480
106,76054,06052,7002,170
17,17041, 82057,03016, 76040,2708,620
48, 4101,960
45, 600
42,06515,064
8831, 7534,0938,6676,0545,551
• 41,85415,019
8831,6704,0938, 581
12,2536,2811,500
474
106, 84054,11052,7302,01058,97017,02041,95057,04016, 61040, 4307,90049,1401,930
45, 860
42, 43915, 271
8831,7134,101
5,475
• 42,13915,233
8831,6794,1018,639
12,4496,3791,535
482
106, 94054,15052, 790
1,89058, 43016, 44041, 99056, 31016, 01040, 300
7,21049,100
2,12046, 620
42,92815,348
8741,6444,0719,2346,1195,638
• 42,20715.310
8741,7314,0918,630
12, 5146,3931.521
467
106,97054,18052,790
1,72057, 79015,93041,86055, 39015, 48039, 9106,500
48, 8902,400
47, 460
41,80315,372
8831,6274,0148,5526,0716,384
' 42,24315,426
8831,6784,0758,595
12, 5116,4291,552
480
107, 06054, 23052,830
1,62058, 01015.91042,10055, 52015, 43040, 090
6,92048.6002,490
47,430
41. 84915, 475
8801,502
4,01 18,5076,1075,367
' 42, 35415, 529
8801, 6514, 0528,637
12, 5936. 5021,562
483
107,19054,37052,8201,570
58,39015,95042,44056, 06015, 47040, 590
7,24048,8202,330
47, 230
42, 043' 15, 510
8791,534
' 4,0208,5636,1205,415
' 42, 39515, 565
8791,632
' 4, 040' 8, 695
12, 6146, 5321,567
482
107, 26054,42052,840
1,53059,12016,32042,80056, 70015,80040,900
7,86048,840
2,42046, 610
• 41, 823• 15,429
8561,619
«• 3,8368, 5516,1065,426
' 42,064• 15, 513
8561,652
' 3,8558,637
' 12, 524' 6,527
1,567
487
107,33054,46052,8701,470
60,29017,12043,17058,33016, 58041, 7508,960
49,3701,960
45, 570
-41,91615,230
881' 1,688' 3,968' 8, 547' 6,155
5,447
' 42,075r 15,351
'881r 1,671' 3, 968' 8, 633
'12,343' 6,428' 1, 555
491
' Revised. » Preliminary.•New series. Annual estimates of total wholesale sales beginning 1939 are available on p. 32 of the February 1946 Survey and the table on the back cover of the February 1947
issue and monthly figures beginning June 1943 for all series are on p. S-9 of the August 1944 and later issues. For estimates of wholesalers' inventories for 1938-42, see p. 7 of the June1942 Survey and p. S-2 of the May 1943 issue. Estimates of the labor force have been revised beginning July 1945 (see explanation in the February 1947 Survey) and revision of theearlier data is in progress; all revisions for these series and data prior to 1946 for the series on noninstitutional population and persons not in the labor force will be published when re-visions are completed. See note marked "*" on p. S-10 regarding the estimates of production workers in manufacturing industries.
! Revised series. See note marked " ! " on p. S-8 regarding revisions in the indexes of department store sales. Revised data for 1919-45 for the index of department store stocksare shown on p. 24 of the August 1946 Survey. Revised estimates of employees in nonagricultural establishments for January 1939-February 1946 are shown on pp. 22 and 23 of theMay 1947 Survey; earlier data back to 1929 for several series are available in the July" 1945 Survey as indicated in the footnote on p. 23 of the May 1947 Survey; the Depart-ment of Labor recently compiled a break-down of the financial, service and miscellaneous group above; computation of seasonally adjusted data for the separate groups resulted inminor revisions in the seasonally adjusted total for all groups, which are available upon request.
Digitized for FRASER http://fraser.stlouisfed.org/ Federal Reserve Bank of St. Louis

S-10 SURVEY OF CURRENT BUSINESS August 1947
Unless otherwise stated, statistics through 1941and descriptive notes may be found in the1942 Supplement to the Survey
1947
June
1946
June July August Sep-tember
Octo-ber
Novem-ber
Decem-ber
1947
Janu-ary
Febru-ary March April M a y
EMPLOYMENT CONDITIONS AND WAGES—ContinuedEMPLOYMENT—Continued
Est4niated production workers in manufacturing*—Con.Durable goods industries—Continued
Electrical machinery _ thousands. .Machinery, except electrical do
Machinery and machine-shop products doMachine tools§_ do .
Automobiles do .Transportation equipment, exc. automobiles..do
Aircraft and parts (excluding engines)§ doAircraft engines § doShipbuilding and boatbuilding§_ .do
Nonferrous metals and products doLumber and timber basic products.._ . . do
Sawmills and logging camps§ doFurniture and finished lumber products do
Furniture § doStone, clay, and glass products do
Nondurable goods industries doTextile-mill products and other fiber manufactures
thousands. .Cotton manufacturing, except small wares..doSilk and rayon goods doWoolen and worsted manufactures (except dyeing
and finishing) thousands. .Apparel and other finished textile products. .do
Men's clothing § - - d oWomen's clothing § do
Leather and leather products. . doBoots and shoes§ do
Food and kindred products doBaking _. doCanning and preserving doSlaughtering and meat packing do
Tobacco manufactures doPaper and allied products do
Paper and pulp doPrinting, publishing, and allied industries do
Newspapers and periodicals... doPrinting, book and job do
Chemicals and allied products doChemicals do
Products of petroleum and coal __..doPetroleum refining do
Rubber products „ doRubber tires and inner tubes do
Production workers, unadjusted index, all manufactur-ing (U. S. Dept. of Labor)t 1939=100
Durable goods industries doIron and steel and their products do
Blast furnaces, steel works, and rolling mills1939=100-
Electrical machinery doMachinery, except electrical do
Machinery and machine-shop products doMachine tools§ do
Automobiles doTransportation equipment, exc. automobiles-do
Aircraft and parts (excluding engines) § doAircraft engines§ doShipbuilding and boatbuilding§ . do
Nonferrous metals and products doLumber and timber basic products do
Sawmills and logging camps§ doFurniture and finished lumber products do
Furniture § . . . d oStone, clay, and glass products do
Nondurable goods industries doTextile-mill products and other fiber manufactures
1939=100..Cotton manufactures, except small wares.-_doSilk and rayon goods doWoolen and worsted manufactures (except dyeing
and finishing) 1939=100..Apparel and other finished textile products-__do
Men's clothing § doWomen's clothing § do
Leather and leather products doBoots and shoes § do
Food and kindred products doBaking doCanning and preserving doSlaughtering and meat packing do
Tobacco manufactures doPaper and allied products do.
Paper and pulp doPrinting, publishing, and allied industries__.do
Newspapers and periodicals^ do.Printing, book and jobj do.
Chemicals and allied products do .Chemicals do.
Products of petroleum and coal do .Petroleum refining do .
Rubber products do.Rubber tires and inner tubes do.
5711,174
779465
408667
424
4155,895
1,177
1,038
343
1,111
84381
422
539
161
215
150.8178.8156.7
220. 3222.2
193.7292.9
177.9158.5
129.3
141.5128.7102.9
130.1
90.2143.7
128.7
186. 9
152.0
178.0
5211,049
34859
69347912626
183378553
'447391210398
5,758
1,19144892
1601,013
261399360
'2201,033
23411112886
36816839313015652211815399
221106
141.9162.4141.5
116.6201.2198.6171.8161.9172.3301.6316.3292.3264.6164.9131.6
' 142. 6119.1117.9135. 6125.7
104.1113.076.6
107.3128.3113.6139.4103.8'05.4120.9101.582.8
106. 592.1
138.8121.9119.9109. 4123.8181.3169.0144.5136.1182.9195.8
5261,0663525972547612927
174392561
'454392211401
5,783
1,17544591
155983258371357
••2191,1192341841238536516639713016051611715510021499
143.6165.7145.7
120.9203.2201.8173.7161.5180.2299.9324.2298.3251. 2171.2133.5
r 144.8119.6118.7136.6126.2
102.8112.475.9
103.9124.5112.2129.6103. 0'95.0131.0101.4136.8102.490.7
137.4120.9121.1109.6126.3178.9168.4146.7137.4177.0183.1
5451,0923576175546813428
158406584
'473405217415
5,941
1,189452
1561,030266402356
'2171,18423720713886369168399131158520117156100223103
147.7170.6150.2
123.6210.5206.6176.2167.5187.8294.7338. 3309.3228.6177.3139.0
' 150. 7123.4122.2141.6129.7
104.0114.277.2
104.4130.5115.7140.5102.7' 94.1138. 6102.7153. 5114.891.7
139.2122.1121.6110.4125.0180.5168. 5147.4137.4184. 0189.9
5631,1123636278845514028139411583
'469405217418
5,995
1,20445693
1601,049
267415358
'2191,1752412459587372168401132159530117157100229107
149. 5173.1152.7
123.6217.3210.3179.5169.2196.0286.8351.6310.5200.8179.5138.6
'149.4123. 5121.7142.5130.9
105. 2115.177.6
107.0132.9116.1145.0103.1'95.0137.5104.6182.278.693.5140.0122.0122.3111.0125.8184. 0167. 6147.8137.0189.1197.0
5791,1313706277445714329134417590
'474411220422
5,972
1,21546094
1611,065
270418355
'2161,091241173
37616841013416353911815599236110
149.6173.9151.2
121.9223.4214.0183.0169.2192.3287. 8360.9321.8193.3182.0140.4
'151.0125. 2123.7143.8130.4
106.2116.078.3
107.5134.9117.7146. 0102.2'93.7127.7104. 6128.970.095.8
141.7122. 0125.0112.8128.9187.2169. 8146. 8136.2194.8204. 0
5901,1503786077846414629
134422599
'480419224422
6,070
1,23046595
1621,063
280407357
'2191,1412491321399138317141513516555012115599240112
152.0176. 7154.9
124.0227.6217.7186.7164.6193.3292.4368.8329.8193.2184.0142.4
'152.9127.7125.6143.9132.5
107.6117.579.1
108.7134. 6121.8142.1102.9' 94.7133.5107.998.1
115.397.6
144. 3124.1126. 6113.7130. 6190. 9173.3146.6136.0198.8207.0
5971,1613806177447314529143426592
'473425227424
6,121
1,242469
1641,079
283414362
'2221,1392531161519238717242013716655512315599242112
152.8177.0153.4
120.2230.6219.6187.6165.3192.3298.2364.8326. 2206.2185.8140.8
' 150. 7129.6127.7144.4133.6
108.6118.479.8
110.2136. 6123.1144.8104.4'96.0133.3109.686.2
125.098.3
145.7125.0127. 9115.2131.6192.5176.7146.1136. 4200.1206. 3
JData beginning August 1942 are available in the November 1943 Survey: earlier data will be published later.Ct7^*- 1O/M Ac> A r-» + ^ f,A- ,~,V»i .V^-.n^K*-nT. f-^rt »-» irv ^.f T\ ^ ««»- . U..- m i - i o - . J f,... m o n A A ^i ^ *. ~ f _ J _ _ r i . i •
1,1733816075547414430
142428592
'471432230425
6,082
1,242470
1631,090
285422362
'2231,0982499515490
38617241713516656412415498240110
152.7178.0156.5
123.5230. 8222.0188.8163.2187.7298.4362. 8331.4205.7186.9140.9
' 150. 2131.8129.9144.9132.8
108.6118.779.9
109.2138.0123.9147.4104.4'96.4128.4107.970.3
128.196.1
145.6125.2127.2114.0131.5195.6178.6145.4135. 0198.8203.5
6011,18138559
79147214229
141432598
'477441235424
6,091
1,24747295
1621,119288439364
'2241,0592448214989
38717342013716656812415599240109
153. 7180.1157.5
124.4232.0223.5190.3161.1196. 62Q7.6357.6321.8203. 3188.9142.3
'152.1134.5132.1144.5133.0
109.1119.179.6
108.6141.7125.3153. 5104.9
'97.1123.9105. 760.8
123.595.4145.9125.7128.1115.6131. 4197.1178.6146.0135. 2198. 2201.2
5991,18938658
79847114128140430611
'489440234427
6,082
1,24247095
1581,120288442363
'2241,0552457714486
38717342113916556912515599238108
154.0" 180.9158.1
124.2231.3225.1190.6158.4198.2296.7355. 8314.9
' 202. 8187.5145.4
' 155. 7134. 2131.3145. 3132.8
108.6118.779.5
105.9141.9125. 2154. 5
' 104. 7' 97.2123.5106. 256.9
119.192.2145. 9125. 5128.2116.7130. 4197.5179.1145.9135.4196. 5
' 199.2
5671,1978365780747714328
' 144424
'627'503433230428
5,997
1,22346894
1531,066284408358
'2211,0682478013982
38517142214016456512515498
234106
152.9180.8158.0
125. 3218.7226.6190.8156. 1200. 5300. 8359. 2315.8' 207. 8184.8
'149.1' 160. 3132. 1129. 1146. 0130.9
106. 9118. 178.4
102.7135. 0123. 5142.4' 103. 0' 95. 6125.0107.259.6115.487.5145. 0124. 6128.6117.6130. 1196. 2180.1145.4134.1193. 5
' 195. 0
'554' 1,194
38455
'749'46813927141
'413'651525
'425226
'4195,915
' 1,19746092
148' 1, 037
281389
'345'213
' 1, 0772468014383
'381172422141163
'561125158101
'223102
' 150. 7' 178. 0' 156. 8
126.4' 213.8' 225.9189.6150.5
' 186. 2' 294. 8349.9306.2203.5
' 180.1' 154. 8' 167. 5' 129. 5127.2
' 142. 6' 129.1
' 104. 6116.276.7
99.2' 131.4122.2136.0-•99.492.1
'126.0106. 559.3118.8'88.4' 143. 7125.0
' 128.7118.7129.1
' 194. 8180. 3
' 149. 3138.0184.2188.7
p Revised.
1941-(dasimilarly been revised beginning 1939; revisions prior to May 1946 will be shown later.
*New series. Estimates of production workers for 1929-43 for all manufacturing, total durable goods, total nondurable goods, and the industry groups are shown on p 22 of De-cember 1945 Survey; data for 1944 are on p. 24 of July 1946 issue and data for January 1945-February 1946 are on p. 24 of the May 1947 issue. Data beginning October 1941 for theindividual industries are available on pp. S-8 and S-9 of the December 1942 and later issues (except as indicated in note marked " § " above) and data back to 1939 will be shown later.
tRevised series. The indexes of production-worker employment and pay rolls (pp. S-12 and S-13) have been completely revised; for 1939-41 data for the individual industries(except as indicated in note marked "§") and 1939-40 data for the unadjusted series for all manufacturing, total durable goods and total nondurable goods industries and the im] •<** ygroups, see pp. 23-24 of the December 1942 Survey; for 1941 data for the totals and the industry groups see p. 28 of the March 1943 issue, for 1942-43, p . 20 of the October 1945 issuefor 1944, p. 24 of the J u l y 1946 issue, and for January 1945-February 1946, p. 24 of the May 1947 issue.
Digitized for FRASER http://fraser.stlouisfed.org/ Federal Reserve Bank of St. Louis

August 1947 SUKVEY OF CUEEENT BUSINESS S-ll
Unless otherwise stated, statistics through 1941and descriptive notes may be found in the1942 Supplement to the Survey
1947
June
1946
June July August Sep-tember
Octo-ber
Novem-ber
Decem-ber
1947
Janu*ary
Febru-ary March April May
EMPLOYMENT CONDITIONS AND WAGES—Continued
EMP LO YM ENT—C ontinued
Production workers, adjusted index, all manufacturing(Federal Reserve)! .1939=100..
Durable goods industries! doNondurable goods industries! do
Nonmanufacturing, unadjusted (U. S. Dept. of Labor):Mining:!
Anthracite 1939—100Bituminous coal _ doMetalliferous . doQuarrying and nonmetallic . . . do
Crude petroleum and natural gas! do .Public utilities:!
Electric light and power doStreet railways and busses... do.Telegraph doTelephone do
Services:!Dyeing and cleaning.__ _ doPower laundries . doYear-round hotels _ do
Trade:Retail, total! do
Food* doGeneral merchandising! _ do
Wholesale! . doWater transportation* do
Miscellaneous employment data:Federal and State highways, totalt number
Construction (Federal and State) doMaintenance (State) do
Federal civilian employees:^United States _ _ thousands
District of Columbia . _ doRailway employees (class I steam railways):
Total thousands..Indexes: Unadjusted! 1935-39=100.-
Adjusted! . do
LABOR CONDITIONS
Average weekly hours per worker:Natl. Indus. Conf. Bd. (25 mfg. industries)*., hoursU. S. Dept. of Labor, all manufacturing! do. _
Durable goods industries* . doIron and steel and their products*. _ do
Blast furnaces, steel works, and rollingmills* _ . . _ hours
Electrical machinery* doMachinerv, except electrical* do
Machinery and machine-shop products* doMachine tools* do
Automobiles* . _ doTransportation equipment, except autos* ..do
Aircraft and parts (excluding engines)*, doAircraft engines* doShipbuilding and boatbuilding*. do
Nonferrous metals and products*.,. . . . doLumber and timber basic products* . do
Sawmills and logging camps* doFurniture and finished lumber products* . do
Furniture*. doStone, clay, and glass products*. do
Nondurable goods industries*. doTextile-mill products and other fiber manufac-
tures*- hoursCotton manufactures, except small wares*_doSilk and rayon goods*- doWoolen and worsted manufactures (except dye-
ing and finishing)*- _ hoursApparel and other finished textile products* do
Men's clothing*. doWomen's clothing*.. _ do
Leather and leather products* . doBoots and shoes*... ._ do
Food and kindred products*. doBaking* __ doCanning and preserving* doSlaughtering and meat packing*, do
Tobacco manufactures*. doPaper and allied products*-. _ do
Paper and pulp*.- doPrinting, publishing, and allied industries* do
Newspapers and periodicals*. doPrinting, book and job* do
Chemicals and allied products* doChemicals*.. do
P 151.0v 178.6p 129.3
89.289 7
107.4103.5
127.8112 1119 4
111 5
108 8
P 1 850
p 1, 405P 134.8P 133.0
»40.1*41 5
P39.6
142.2162. 3126.3
79.089.674.498.994.2
99.9128.7112.1171.7
131.6112.3119.9
107.2103.5121.0106.9229.0
205,16159,001
110, 537
2,299235
1,358130.4128.6
39.840.039.838.8
36.039.840.941.242.236.639.540.441.638. 140.941.541.141.841.440.440.2
40.039.540.8
41.137.138.136.139.339.042.343.940.039.340.043.143.740.537.941.640.540.8
143.0165.2125.6
81.489.578.0
101.295.4
101.2128.9112.4177.7
130.0113.6119.1
106.2. 101.3
117.7107.5228.2
225,18473, 766
114, 717
2,282235
1,378132.2129.5
40.039.739.338.5
36.439.440.440.741.337.839.340.040.638.440.039.138.941.040 639.540.1
39 639.440.7
40.536.086.235.438.237.843 844.843 243.039.142.843.840 237.941.540.741.5
146.3169.7127.8
82.090.882.5
103.295.5
101.9130.2111.9181.1
124.5111.6119.3
106.6103.6117.4109.1225.9
237, 60182, 384
117,543
2,232233
1,400134.3131.6
40.140.540.539.9
38.240.640.941.642.039.239.740.741.438.040.841.841.441.941.740.740.4
40.139.841.3
40.937.037.536.437.836.943.745.042.343.438.643.444.440.838.741.840.841.1
148.6172.7129.6
82.290.583.5
102.593.9
101.9129.9112.0181.0
125.6109.9119.5
109.8103.5125.4109.4( i )
236,64488, 473
110, 940
2,154226
1,392133.6130.4
40.040.340.339.7
38.040.841.141.241.938.538.840.641.935.740.741.441.241.841.640.540.3
40.039.840.4
41.136.937.735.838.237.943.044.543.535.939.543.043.8
r 41.039.442.040.941.1
149.1173.8129.7
83.290.183.9
101.793.4
102.0130.3110.3181.6
126.1110.1120.6
112.2103.7132.4110.7
1 199. 2
235, 04587,889
110, 363
2,119225
1,405134.9130.5
40.440.540.740.3
38.740.741.541.642.638.840.040.642.137.740.941.941.542.241.840.640.2
40.239.941.6
40.936.837.735.537.536.942.443.641.737.540343.444.541.039.341.741.341.4
151.5176.4131.8
82.990.085.2
101.293.0
102.5130.6108.7183.4
123.0109.9120.2
117.2108.6144.8112.7
220, 87975, 850
108, 328
' 2,018224
1,412135.4134.3
40.440.240.240.0
38.840.640.941.142.338.638.439.637.235.740.940.640.241.741.440.340.3
40.240.341.1
40.136.637.834.937.136.342.944.037.344.939.743.344.441.039.341.941.341.1
152.4177.1133.0
83.088.186.299.792.6
103.0130.1107.4184.6
120.9110.9119.1
126.5111.8171.1114.4
198,09756, 289
104,901
1,981221
1,383132.5134.6
40.440.940.839.8
37.041.141.441.842.839.440.640.441.940.041.741.741.142.241.641.041.1
40.940.941.8
41.337.038.135.339.138.844.445.338.846.440.243.744.641.539.342.741.641.2
153.4178.7133.4
83.490.887.296.992.1
102. 5130.9104.6185.2
118.2111.0117.3
110.5108.5125.6112.2
186,44945,094
104, 914
1,973220
1,361130.5135.7
40.840.640.540.2
38.240.541.441.742.238.940.239.841.440.241.040.640.041.841.540.540.7
40.540.641.1
41.336.937.835.739.339.143.643.937.647.539.243.244.241.038.942.041.54L3
154.4180.8133.6
82.990.487.697.191.7
103.2131.1
' 201. 5186.9
117.0109.5117.7
109.6111.2119.4111.9
188,21246, 048
105, 699
1,966219
1, 353129.7133.0
40.840.440.540.0
38.540.041.341.542.338.839.740.140.738.441.042.141.841.942.040.140.4
40.440.541.6
41.036.737.836.239.539.242.743.237.042.737.843.244.340. 1
' 38 .640.841.441.0
154.6181.5133.4
81.889.788.698.792.0
104.0131.0100.7188.4
118.8108.7117.3
111.1112.8122.5111.7
199, 33852,330
107,855
1,944218
1,355129.9133.2
40.640.440.740.4
38.9' 40. 5
41.541.642.339.7
'39.839.839.4
'39.940.9
'41.040.641.741.940.540.1
40.040.141.5
40.136.737.636.1
' 39 .0' 3 8 . 1
42.343.037.7
'41.937.543.244.340.338.841.141.3
'40.9
153.8181.2132.2
80.183.4
'89.6103.192.6
' 104. 8130.9104.5
' 127.2
121.5109.1117.5
111.4113.7122.8110.5
213, 87169, 239
105, 407
1,926215
'1,375' 131.9' 134.0
'40.5'40.0'40.7
40.4
39.2'40.0
41.541.642.038.5
'39.839.739.8
'39.9'40.9'41.4'40.9
41.541.4
'40.539.6
39.139.340.2
39.135.536. 634.438. 3
'37.842.142.537.8
'41.736. 843.044.440.138.9
. 40.841.040.8
' 151.9'178.3' 131.1
81.1'88.4'89.4104.393.3
' 105. 7' 130. 7
102.8160.1
' 123. 7r 110.2' 118. 4
111.3113.9121.4109.7
257, 292107, 049109, 641
' 1, 907'212
p 1, 395p 133. 9P 134. 4
40.4'40.1'40.5
40.4
39.239.841.341.642.138.240.239.539.640.341.641.941.541.541.240.339.7
38.938.841.0
39.235.837.234.738.237.743.043.138.243. 936. 343.144.740.038.9
•40. 641.140.9
Digitized for FRASER http://fraser.stlouisfed.org/ Federal Reserve Bank of St. Louis

S-12 SURVEY OF CURRENT BUSINESS August 1947
Unless otherwise s ta ted, stat ist ics th rough 1941and descriptive notes may be found in the1942 Supplement to the Survey
1947
June
1946
June July August Sep-tember
Octo-ber
Novem-ber
Decem-ber
1947
Janu-ary
Febru-ary March April M a y
EMPLOYMENT CONDITIONSLABOR CONDITIONS—Continued
Average weekly hours per worker—ContinuedU.S. Dept. of Labor, all manufacturing—Continued
Nondurable goods industries—ContinuedProducts of petroleum and coal* _- hours
Petroleum refining* doRubber products* do
Rubber tires B,nd inner tubes*- doNonmanufacturing industries (U. S. Dept. of Labor):*
Building construction _ . hours _Mining:
Anthracite doBituminous coal doMetalliferous doQuarrying and nonmetallic _ do
Crude petroleum and natural gas doPublic utilities:
Electric light and power doStreet railways and busses doTelegraph doTelephone do
Services:Dveing and cleaning doPower laundries do
Trade:Retail doWholesale do
[ndustrial disputes (strikes and lockouts):*Beginning in month:
Work <?t oppages numberWorkers involved thousands
In effect during month:Work stoppages numberWorkers involved thousands._
Man-davs idle during month _ _do. _U, S. Employment Service placement activities:
Nonagricultural placements! thousands.Unemployment compensation (Social Security Admin.):
Initial claims* . _ thousands.-Continued claims© doBenefit payments:
Beneficiaries, weekly average ® - doAmount of payments _thous. of dol
Veterans' unemployment allowances:*Initial claims thousandsContinued claims - _ __ _ do. .
Claims filed during last week of month § doAmount of payments thous. of dol
Labor turn-over in manufacturing establishments:^Acopwinn r^tp monthlv rate tier 100 emoloveesSeparat ion rate, total do
Discharges - __do __Lav-offs doQuits doMilitary and miscellaneous do
PAY ROLLSProduction-workers pav rolls, unadjusted index, all
manufacturing (U. S. Dept. of Labor) f_ .1939= 100. _Durable goods industries do
Iron and steel and their products doBlast furnaces, steel works, and rolling
mills . 1939=100Electrical machinery doMachinery except electrical do
Machinery and machine-shop products doMachine tools t do
Automobiles - doTransportation equipment, except autos do
Aircraft and parts (excluding engines) X doAircraft enginest doShipbuilding and boatbuildingX do
Nonferrous metals and products doLumber and timber basic products do
Sawmills and logging campst doFurniture and finished lumber products do
Furniture X doStone clay and glass products doNondurable goods industries doTextile-mill products and other fiber mfrs do
Cotton manufactures, exc. small wares - doSilk and rayon goods doWoolen and worsted manufactures (except dyeing
and finishing) _ _ 1939=100Apparel and other finished textile products—do
Men's clothingt doWomen's clothing^ do
Leather and leather products doBoots and shoest - - do
Food and kindred products doBaking doCanning and preserving doSlaughtering and meat packing do
P 4 7 5
P 6 2 5P 3,750
453
^8781 4, C06
i 1,006i 73,559
4P23, 021
72258,509
39.639.539.337.4
38.2
38.243.440.845.739.5
40.949.344.539.3
43.843.3
40.941.4
388181
758455
4,580
479
7615,395
1,17492,982
6026,9821,744
150, 063
6.75.7. 3
1.24.0.2
262.8289.1240.3
182.0347.9342.0296.4270.4259. 9557.5585.5469.4483.4298.6261.9
' 286. 3233.3229.9241 4237.0217.2248.2166.8
238.5258.6230. 3283.2204.9
' 196. 2208.2168.8181.9167.4
40.039.739.238.0
38.2
31.736.039.645.440.4
41.548.445.239.7
43.243.4
41.341.4
563228
910408
3, 970
530
r 6825,504
1,06988, 408
6577,8281,720
152, 648
7.45.8.4.6
4.6.2
267.1296.3247.5
191.8351.0346.2299.4262.3292.8558.7605.6468.9468.8303.9252.1
' 276.1231.9228.0242.2238.5213.3246.1166.3
228.6240.3215. 3254.2198.7
' 190. 4235.1178.5325.8179.9
40.340.039.437.4
38.2
37.942.840.946.540.9
41.648.645.439.3
42.643.0
41.341.7
560227
965425
3,900
522
5414,604
98078,047
6027,1471,650
148,036
7.06.6
.4
.75.3.2
284.4316.1265.9
204.0378.9362.2314.2281.4319.0558.1640.8498.3421.5324.2285.6
-" 313.1250.0246.7260.1253. 4229.4275.5181.4
234.1272.5236.4306.3199.6
' 188.1254. 3184.1387.4202.3
AND
40.440.240.639.6
38.7
37.741.840.646.139.9
41.047.544.838.5
42.942.9
40.9,41.8
499356
853499
4,880
532
5803,895
83963, 216
4496,1281,304
124, 082
7.16.9
.41.05.3.2
290.3323.3273.6
206.3397.2376.2322.3285.5330.3524.1663.9507.8352.5331.8285. 2
' 309.8254. 4249.9267.0258. 1235.5281.7180.9
242.7283.0242.7320.1204.7
' 195. 2246. 5187.5466.8118.2
WAGES—Continued
40.440.239.438.2
38.8
39.242.941.046.141.2
41.947.744.439.1
42.243.0
40.141.9
516307
848467
6,220
547
6814,141
76564,433
4134,9001,019
100, 380
6.86.3
.41.04.7.2
292.8328.1273.7
203. 2408.1388.0333.5291.9324.3542.3681. 3530. 2353.7338.8292.0
' 315.0264.2200.1271.3258.3241.1285. 4189.3
243.7283.6246.2311.8199.5
' 188. 2232.2190.8324.7110.5
40.340.040.039.0
37.2
35.741.739.945.440.4
41.647.343.539.3
41.942.6
39.741.6
344435
677707
4,980
440
6203,492
71054, 098
4053,743
87774, 421
5.74.9
.4
.73.7.1
298.2331.1280.8
208.7416.0390.1336.8285.5325.7531.1680.4484.3336. 8345.3284.7
' 305. 7268.5263. 7274.8266.0246.0293.5191.4
242.7283.2271.9284.9201.6
' 190.8252.0199.0212, 9215.7
40.040.441.139.8
38.4
40.946.742.245.839.5
41.447.943.238.0
42.843.5
40.242.3
16876
402500
3,130
358
9094,119
74859, 370
5834,345
93581, 964
4.34.5
.41.03.0.1
306.2337.3276.2
193.9430.2399.9346.7290.7328.9571.2683.3533.7399.1356.3290.6
' 306.9279.1273.4281.6275.8253. 7301.2197.9
253.0292.7278.4296.3218.3
' 209.3263.3209.0201.1236.9
40.239.940.639.5
37.6
39.146.741.243.141.3
41.947.743.838.4
42.343.3
39.941.5
* 290» 100
» 460» 150
» 1, 250
366
1,0114,982
89374,756
6385,2421,168
106, 586
6.04.9
.4
.93.5.1
307.3340.0287.9
208.9425. 6406.6350.32817321.1562.6668.7535.0395.8354.8292.4
' 30P.2283.1278.8280.0275.3254.3304.4201.3
251.8300. 6277.2340.0220.8
r 197. 7256.4201.1158.2268.0
40.139 840.639.3
36.9
35 143.642.042.840.3
41.048.044.038.0
41.142.5
40.140.8
*290
P 4 6 0v 145
p 1, 225
348
7314,488
91165,910
4444. 5041,149
88, 364
5.04.5
.4
.83.2.1
310.6344.6,237.9
209.3422. 9409.6352. 0278. 9337.3558. 2667.8506.8377.9360.0310.7
'333.4292.0289.1278. 4277.4262. 0309.1206. 9
275.0314.1280.8344.8223. 0
r 198. 9242.5194. 5137.2237. 8
40.239 839.8
r38.2
38.0
39 843 741 643.539.6
41.047.843 737.9
42 042 4
40 040.8
325100
P 500
»850
391
7254, 684
97471, 545
3974, 4231,002
89,052
5.14.0
.4
.93.5.1
•• 314.1' 349.9
294.2
212.9r 429.6
416 6354.9275.6347.7556.9662.2479.9
' 386.0359.0
' 310. 1' 334. 5
292.0288.8285.7
«• 279. 2265.0322.0208.8
262.0r 317. 5
281.3340.0
' 222. 2' 213.7
239.3193.2130.4217.1
40.640 3
r 3 9 538.2
37.1
32 3' 3 6 . 4
41.844.540. 8
'"42.247.847.328.1
41.942. 8
39. 941.2
P600
v 6f.OP 7, 750
419
1,0204, 833
92971, 569
3733, 913
85078, 806
ph. 1p 5 .2
p. 4p 1.0P 3 . 7
p . l
r 310. 7>• 349. 9r 297. 5
219.8r 306. 6
423.0357.6269. 7343.4565.3660.2487.6
r 399. 1' 354.0' 323. 4' 350. 5
286.8282.4288.8
' 272. 3255.4314.8200.9
248.3' 279. 8
267.1277.7
' 214. 6r 205. 3
243.1195.4140.2211.4
40.393937.
3744.42.45.40.
41.47.46.31.
42.42.
39.41
p 4SP 2 (
P 6 <
P&»5,7(
4
1,1r 4 ,8 (
'&72,2<
33,116
63,7
P 4v 5
p
P 1v 3
V
312353306
236407429362263327558642431397350351384285279287271248303200
240272270260207197252199143231
r Revised. » Preliminary. JSee note marked " § " on p. S-10. G Small revisions in the data for January 1940 to May 1944 are available on request, i Partly estimated.§ Week ended the last Saturday of the month.
® Before July 1946 computed from weeks compensated in calendar month; thereafter, from weeks compensated in the weeks ended during the month.• The series for "in effect during the month" continue data published in the Survey through the July 1944 issue. They include data for stoppages beginning in the month and
those continuing from previous months; data for 1944-45 are shown on p. 23 of December 1946 Survey.d* Rates refer to all employes rather than to wage earners and are therefore not strictly comparable with data prior to 1943 published in the Survey.•New series. Data on average hours for the telephone industry for 1937-43 are on p. 20 of the May 1945 Survey (see note for hours and earnings in the telephone Industry at the
bottom of p. S-13 of April 1946 Survey regardin g a change in this series in April 1945) and data for the telegraph industry beginning June 1943 (the earliest available) are given in note onp S-ll of the January 1945 issue; data beginning March 1942 for all other series on average hours are available in the May 1943 Survey and data back to 1939 will be published later.The new series on veterans' unemployment allowances relate to readjustment allowances payable under the Servicemen's Readjustment Act of 1944; data beginning September 1944for these series and beginning 1939 for initial unemployment compensation claims will be shown later (see note in April 1946 Survey for definition of initial claims).
fRevised series. Data beginning June 1942 for nonagricultural placements are available in the August 1943 Survey; earlier data will be published later. For information regardingthe revised indexes of production-worker pay rolls in manufacturing industries, see note marked " t " on p. S-10.
Digitized for FRASER http://fraser.stlouisfed.org/ Federal Reserve Bank of St. Louis

August 1947 SURVEY OF CURRENT BUSINESS S-13
Unless otherwise stated, statistics through 1941and descriptive notes may be found in tlie1942 Supplement to the Survey
1947
June June July August
EMPLOYMENT CONDITIONS
1946
Sep-tember
AND
Octo-ber
Novem-ber
Decem-ber
1947
Janu-ary
WAGES—Continued
Febru-ary March April May
PAY ROLLS—Continued
Production-worker pay rolls, mfg. unadj.!—Con.Nondurable goods industries—Continued
Tobacco manufactures 1939=100.Paper and allied products _-do..-
Paper and pulp do . . .Printing, publishing, and allied industries do . . .
Newspapers and periodicals* doPrinting, book and job* dO-_.
Chemicals and allied products doChemicals do
Products of petroleum and coal doPetroleum refining .._ __do
Rubber products doRubber tires and inner tubes do
Nonmanufacturing, unadjusted (U. S. Dept. of Labor):Mining:f
Anthracite 1939—100-.Bituminous coal do.-..Metalliferous _ .doQuarrying and nonmetallie do
Crude petroleum and natural gasf -- do .Public utilities:f
Electric light and power. do, . . .Street railways and busses doTelegraph _ __ do. . . .Telephone . _ do
Services:!Dyeing and cleaning doPower laundries __doYear-round hotels - .do.
Trade:Retail, total! - . do . . . .
Food* „, do—.General merchandising! _. . .do
Wholesale! do . . . .Water transportation* do
WAGES
Average weekly earnings, manufacturing industries:Natl. Ind. Con. Bd. (25 industries) ..dollars..U. S. Dept. of Labor, all manufacturing! do
Durable goods industries doIron and steel and their products! do
Blast furnaces, steel works, and rollingmills! ._ dollars-
Electrical machinery! doMachinery, except electrical!,— do
Machinery and machine-shop products!-doMachine tools . .do
Automobiles! .__do.-_-Transportation equipment, except autos-__do
Aircraft and parts (excluding engines) doAircraft engines* ._ __doShipbuilding and boatbuilding do
Nonferrous metals and products!.... doLumber and timber basic products! do
Sawmills and logging camps doFurniture and finished lumber produets!_._do
Furniture t doStone, clay, and glass products! do
Nondurable goods industries doTextile-mill products and other fiber
manufactures ! . dollarsCotton manufacturers, except small wares!
dollars..Silk and rayon goods! doWoolen and worsted manufactures
(except dyeing and finishing)! dollars..Apparel and other finished textile products!
dollars..Men's clothing!. doWomen's clothing§ do
Leather and leather products! doBoots and shoes do
Food and kindred products! doBaking doCanning and preserving! doSlaughtering and meat packing do
Tobacco manufactures! .doPaper and allied products! do
Paper and pulp doPrinting, publishing, and allied industries!
dollars. .Newspapers and periodicals* _ doPrinting, book and job* do..—
Chemicals and allied products! _.doChemicals do
Products of petroleum and coal! doPetroleum refining __ _ do
Rubber products! doRubber tires and inner tubes do
*>48.91P52. 39
45. 08
184.1247.0216.7191.3162.0204.6313.0283. 0242.fi223.3331.4318.3
182.7243.8126.9207.7147.1
148.4199.5174.9259.9
236.6190.9205.0
171.3170.0188.8172.6467.4
47.2043.3146.3246.74
46.9845.7250.0449.7053.8649.3253.3252. 5555.9153.9947.6137.6236.5638.7339.3142.0140.28
35.02
31.7534.64
41.63
35.2338.1844.0237.3436.1441.0941.4235.7843.0533.8342.7445.34
51.7356.0849.8243.9550. 6953. 3456.4650. 4554.82
178.3246.4218.4193.3163.7209.1315. 5289.2251.0228.0321.4304.3
156.5198.4132.4213.6151.3
150.2206.7178.6268.8
231.3193.3204.9
172.6in. 5187.1174.5490.1
47.6443.3846.2446.80
47.8545.5949.7649.4962.4451.1553.7053.0154.7255.2046.6835.6034.6638. 3738.8041.8040.46
34.76
31.6434.94
41.18
33.8335.8442.6736.4635.3843.2243.8138.8948.0533.2443.1246.06
51.7966.6250.0344.6752.0954.1957.0250.6056.11
186.2256.5227.8198.1168.8210.4320.0288.0253.1228.7336.9311.2
193.3241.0145.2225.1152.6
152.4211.2178.5267.6
216.9188.4208.9
174.6177.2188.1177.3478.8
48.7444.9948.0248.78
49.8447.4950.9951.1554.0753.8053.9153.8556.0854.4148.0038.7837.7540.0940.8543.2341.89
37.00
34.8137.42
41.88
36.4838.1147.4536.7435.1744.3444.6341.1248.3734.1644.2647.56
53. 0158.0950.8344.9151.8154.3657.1051.0355.42
196.0259.8228.0203.1175.6215. 8329.1289.6257.4232.7363.9348.9
194.0234.9147.0227.9149.5
153.3207.9177.3265.0
225.6188.7209.5
180.8173.6199.0182.80)
49.1445.3948.3649.29
50.2848.3151.7451.0554.4553.3752.6553.7356.9350.9148.5538.7337.6940.8641.6244. 0342.34
37.54
35.3537.20
42.44
37.2539.1447.8237.4936.1843.5944.6041.5041.1135.2544.5747.55
53.9660.0451.5045.4152.6155.2558.3553. 6959.89
207.4268.5234. 9208.4178.9220.8335.3294.0252.7228.2361.3346.1
199.9237.1148.0227.6150.1
155.3212.6201.7269.2
225.7189.8214.5
182.5174.6204.8184.5
1 422. 6
49.7945.7348.9049.86
50.3948.2852.5751.9155.6153.4154.3253.8157.3153.9648.9239.2137.8441.7342.4244.4642.45
38.09
35.5738.67
42.40
36.6838.8946.2537.0735.6543.8545. 4540.8243.0636.4745.6149.05
54. 2860.2851.5045.5052.8754.3857.3251.7457.38
212.7276.6240.3214.0182.0227.9345.0301.3252.6226.9377.4360.3
182.3233.1146.9222.4151.0
157.6210.9194.2273.0
217.0191.5218.5
191.7185.7225.0189.7
50.1445.7948.6249.91
50.8248.3352.0651.3855.9053.8352.3752.5351.0651.4749.2437.7436.3741.6242.4144.9142.87
38.38
36.1438.69
41.67
36.5441.3943.2837.2435.7644.8446.0135.2851.1536.6646.0849.37
55.1161.1152.6045.8852.9654.5057.1152 Q358." 87
222.0284.5244.9223.9189.7239.4357.0313. 4250.9230.2392.2368. 9
212.3258.3159.3221.9147.1
161.6213.6190.5264.5
219.5201.0218.8
212.2194.6277.2197.2
50.3046.9649. 5749. 67
48. 5949.1352.8752.6256.6654.9855. 3563.4656.8957.2150.4038.7937.0542.4943.0445.8944.24
39.26
36. 8539.57
42.96
37.2341. 7844.1439.8338. 6546.9347. 5537. 9351.7338.1246.8749.92
57.0362.9554.9847.1454.1554.5557.8054.6360.46
209.4285.1246.9219.6185.2235. 2362.9321.0253.9227. 5386.3361.2
202.0265.4156. 8204.8153.8
159.5216.1189.1267.5
213.8201.8215.1
187.2189.4208.4189.7
51.6247.1049.6050.64
50.8948.6353.1252. 7856.1754.1354.4852.5956.1557.0549.9139.1137.4142.4143.3545.5844.47
39.29
37.0640.21
43.10
38.2241.7047.3040.1839.0547.3146.3236.5557.2036.7447.0550.18
56.6062.0854.1947.3954.7755.2457.7454.0359.78
201.0288.1251. 4221.8191.0234.2372.6323.5256.8228.8385. 0357.7
184.7248.7162.0205.6152.9
163.7219.5185.4269.4
204.7196.1216.6
187.5197.1201.4190.4
52.1047.2949.7450.33
50.6748.1353.2252.6156.0954. 2954.3453.4154.7755.3750.1241.1839.8942.8044.2045.4944.67
40.32
37.5641.45
47.44
38.7441.8648.7740.2938.9646.4045.8036.8252.8235.4447.4250. 98
56.7463.0054.0748.1755.1055.3957.7554.0659.90
193.1290.9252.5227.7196.9238 9377^5326.8262.1234.9374.3
' 343.2
206.2245.6162.6213.7154.5
160.8218.6
r 198.0267.2
214.7196.9216.8
190.1199.9205.6191.6
52.10' 47. 69r 50. 30'51.31
51.77' 49.07r 53.82
53.1056.46
r 55.45* 54. 25
53.2253.02
r 56. 59' 50.26' 40. 31
39.12* 43. 00
44.33r 46. 38' 44.89
41.01
39.2241.94
46.28
38.41Ml. 99
47.75r 40.11* 38. 91
46.0545.1737.4049.87
r 35.2147.9251.27
58.1964.25
r 55. 671 48. 60r 55. 33
56.5359.15
' 52. 97' 58.05
'181.6290.9254. 8230.9201.7240.3378.3329.5264.2235. 6383. 9
' 357. 2
155.3192.4164.7233.2162.3
r 166. 5218.8239.3136.1
221.7' 200. 5
219.4
192.6202.8210.4190.8
' 52. 79' 47. 48' 50.30' 51. 79
52.83' 48. 40' 54. 2553.3156.06
' 54.14' 54. 2352.7253.69
' 56. 97' 50. 33' 40. 99>• 39. 81' 42. 8444.07' 46. 55' 44. 40
40.12
38.5340.89
45.26
35.4440.1642. 32' 39. 44' 37. 9646.1745. 2638.4950.13' 34. 8648.2052.07
58.8165. 2956. 05' 48. 9355.45
r 57. 2960.22
r 55. 2361.64
182.8292. 6259. 0234. 5208. 8240.4381. 5334.9274.7242.7371.2349.0
186.3248. 0172.1241. 7163. 4
168.2220.0226.9196.9
231. 5203.8221.1
195.1208.0212.8191.4
53.59' 48.46' 51. 71
53.73
56.2650.2455.2154.4457.1355. 8755. 2352.6354.7658. 2151. 2242.9341. 8043.3944.3447.34
' 44. 93
39. 89
37.7341.80
45.28
35.3641.1841.3339.5037.8647.7146.5539.5253.3134.4748.9752.82
59.6867.1056.3249.7756.3857.9760. 0155.9861.96
r Revised. v Preliminary.i Data for October 1946 relate to the end of the preceding month. Data for the week ending September 15th are not available. The index has been temporarily discontinued.tfeample was changed ra November 1942; data are not strictly comparable with figures prior to that month.§Sample was changed in July 1942; data are not strictly comparable with figures prior to that month.*New series. Indexes of pay rolls beginning 1939 for retail food establishments and 1940 for water transportation are shown on p. 31 of the June 1943 Survey. Data beginning
1932 for the newspapers and printing, book and job, industries will be published later; see November 1943 Survey for data beginning August 1942. Data for the aircraft engine industrybeginning 1939 will also be published later. & & & y
! Re vised series. See note marked " ! " on p. S-10 regarding revisions in the indexes of pay rolls in manufacturing industries and reference to revised data and note marked " !" onP- k-11 for reference to revised data for pay rolls in nonmanufacturing industries. The indicated series on average weekly earnings and average hourly earnings (p. S-14) have beenshown on a revised basis beginning in the March 1943 Survey (see note in that issue for an explanation of the revision); data prior to 1942 have not been published in the Surveyand will be shown in a later issue; there were no revisions in the data for industries that do not carry a reference to this note.
Digitized for FRASER http://fraser.stlouisfed.org/ Federal Reserve Bank of St. Louis

S-14 SURVEY OF CURRENT BUSINESS August 1947
Unless otherwise stated, statistics through 1941and descriptive notes may be found in the1942 Supplement to the Survey
WAGES—ContinuedAverage hourly earnings:
Natl Ind Con Bd (25 mfg industries)U S Dept of Labor all manufacturing!
Durable goods industries!Iron and steel and their products!
1947
June
1946
June July August
EMPLOYMENT CONDITIONS
. dollars.do .
. .do . .do
Blast furnaces, steel works, and rolling mills!do
Electrical machinery!Machinery except electrical!
dodo
Machinery and machine-shop products!_.doM^aohine tools do
Automobiles! doTransportation equipment, except autosf-.do
Aircraft and parts (excluding engines) doAircraft engines* doShipbuilding and boatbuilding
Nonferrous metals and products!dodo
Lumber and timber basic products! doSawmills and logging camps do
Furniture and finished lumber products!___doFurniture do
Stone, clay, and glass products!Nondurable goods industries! """""do""""
Textile-mill products and other fiber manufac-tures! dollars..
Cotton manufactures, except small wares!dnllflrs
Silk and rayon goods! doWoolen and worsted manufactures (except
dyeing and finishing)!... dollars..Apparel and other finished textile products!
dollarsMen's clothing!Women's clothing§
Leather and leather products!Boots nnd shoe1'
Food and kindred products!BakingCanning and preserving!Slaughtering and meat packing
Tobacco manufactures!Paper and allied products!
Paper and pulp
. do .dodododo
. . . do .dododododo
Printing publishing and allied industrfpst doNewspapers and periodicals*Printing book and job*
Chemicals and allied products!Chemicals
Products of petroleum and coal!Petroleum refining
Rubber products!Rubber tires and inner tubes
Nonmanufaeturing industries (U.S.Dep'Building constructionMining:
AnthraciteBituminous coalMetalliferousQuarrving and nonmetallic
Crude petroleum and natural gasPublic utilities:
Electric light and powerStrpct railways and bussesTelegraphyTelephonet
Services:Dyeing and cleaning*Power laundries®
Trade:RetailWholesale
dododododo _dododo
.of Labor)*:dollars
dodododo .do
dodododo -
d o . . . .do
dodo _
Miscellaneous wage data:Construction wage rates (E. N. R.):^
Common labor dol. per hr__Skilled labor do . . .
Farm wages without board (quarterly)dol.
Railway wages (average, class I)Road-building wages, common labor:
United States average
PUBLIC ASSISTANCE
Total public assistance
per month.,-dol. per bx..
do
mil. of dolOld-age assistance, and aid to dependent children and
the blind, total rail, of dolOld-age assistance..
General reliefd o —do
v 1.220v 1.294
1.1892.01
l H 4 QO
.89
v 122
p 109v 82v 13
1.1891.0841.1651.206
1.3031.1481.2231.2021.2771.3471.3501.3021.3431.4161.163.908.888.927.950
1.0411.003
.875
.803
.850
1.014
.951
.9991.191.950.923.972.945.898
1.095.846.993
1.0381.2781.4491.2031.0841.2431.3471.4311.2831.461
1.444
1. 5591.4741.180.994
1.322
1.2751. 053
.9081.147
.834
.703
.8761.146
1.0341.80
1.139
.81
95
85669
1.1941.0931.1771.216
1.3141.1581.2321.2121.2691.3541.3661.3251.3481.4361.166.910.892.937.957
1.0571.009
.877
.803
.858
1.017
.941,985
1.180. 954.927.986.980.904
1.115.851
1.0071. 0531.2871. 4591.2121.0981. 2561. 3551.4371.2921.472
1.473
1. 5621.4571. 2051.0041.311
1. 2581.097
.9101.135
.826
.698
.8881.155
1.0581.81
106 001.136
.80
96
86679
1.2171.1121.1861.222
1.3051.1691.2461.2281.2911.3731.3591.3231.3541.4311.177
.928
.911
.957
.9821.0631.036
.924
.875
.906
1.024
.9861.0091.263.972.945
1.015.964.976
1.116.885
1.0201.0701.2991.4751.2201.1021.2601.3471.4271.2951.474
1.482
1.5981.4661.2121.0161.307
1.2601.099
.9101.129
.832
.693
.8931.148
1.0711.82
1.130
.86
97
876810
Sep-tember
AND
1.2291.1261.2011.241
1.3251.1851.2601.2381.3001.3851.3561.3231.3571.4261.192.935.915.977
1.0021.0871.050
.940
.888
.922
1.034
1.0101.0271.300.982.955
1.0131.003.960
1.144.893
1.0371.0851.3151.4951.2321.1101.2811.3681. 4531.3231.507
1.510
1.6111.4801.2211.0421.334
1.2911.110
.9141.148
.839
.708
.9081.179
1.0721.85
1.155
.84
99
896910
Octo-ber
Novem-ber
Decem-ber
1947
Janu-ary
WAGES—Continued
1.2311.1301.2021.239
1.3031.1861.2661.2451.3061.3761. 3591.3261.3631.4321.195.936.913.990
1.0141.0961.056
.948
.892
.931
1.037
.9971.0241.266.987.960
1.0351.042.983
1.147.905
1.0501.1021. 3251.5111.2381.1021.2781.3471.4281.3131.492
1.526
1.5931.4001.2101.0471.308
1.2841.1301. 0671.137
.854,708
.9071.172
1.0731.85
104 001.132
.87
107
967411
1.2431.1391.2101.247
1.3101.1911.2731.2491.3221.3941.3641.3261.3731.4411.204
.931
.906
.9991.0241.1141.065
.955
.898
.941
1.038
.9981.0861.2111.004.978
1.0461.045.950
1.137.924
1.0641.1111.3431.5281.2591.1121. 2881. 3511.4291. 3221.503
1.549
1. 5821.4771.2191.0451.334
1.3021.1251.0631.131
.854
.729
.9171.186
1.0781.86
1.146
.86
110
997611
1.2471.1481.2161.248
1.3141.1951.2771. 2571.3221.3951.3621.3251.3571.4301.210
.931
.9011.0071.0341.1191.077
.959
.900
.944
1.039
1.0061.0891.2231.018
.9951.0581.051
.9821.119
.9471.0711.1191.3741.5691.2951.1331.3161.3621.4341.3311.513
1.569
1.6151.4911. 2321.0521.346
1.3371.1421.0621.132
.867
.739
.9191.202
1.0851.86
1.150
.83
114
1027712
1.2681.1611.2241.261
1.3321.1991.2831.2641.3261.3901.3561.3211.3571.4201.217
.962
.9351.0151.0461.1251.094
.970
.914
.975
1.045
1.0371.0951.2971.023
.9951.0841.056
.9751.206
.9381.0881.1341.3811.5751.2971.1431.3271.3721.4471.3301.511
1.594
1.5941.4901.2291.0581.355
1.3131.1651.0691.132
.874
.745
.9531.197
1.1091.89
106 001.146
.84
116
1037813
Febru-ary
1.2791.1701.2291.258
1.3171.2031.2901.2671.3251.3991.3671.3321.3441.4421.222'.979'.9541.0221.0491.1331.107
.997
.927
.996
1.156
1.0491.0971.3141.021
.9891.0881.060
.9971.193.937
1.0981.1491.4151.6071.3361.1651.3421.3821.4511.3311.517
1.598
1. 6371.4911. 2381.0621.390
1.3521.1741.1641.141
.861
.748
.9571.230
1.1231.92
1.173
.81
118
1047914
March
1.2851.180
' 1. 2361.269
1.333' 1.212
1.2981. 2751. 334
' 1. 396r 1.362
1.3381.344
' 1.4181.226'.983.965
' 1. 0311.0591.1441.119
1.024
.9791.012
1.155
1.045' 1.106
1. 293' 1. 028
'.9991.0881. 057
.995r 1.188
.9391.1091.157
r 1. 4431.626
' 1.3641.177
' 1. 3511.4081.488
' 1. 330' 1. 512
1.610
1.6321.4841.2411.0691.421
1.3411.1841.1641.124
.876
.759
'. 9601.231
1.1231.92
1.146
.84
121
1078114
April
' 1 3041 186
' 1. 2431.281
1 347' 1 210'1 .308
1.2791 334
' 1.406'1 .362
1.326' 1.351'1 .426'1 .234
'.990.972
'1 .0311.0631.1491.122
1.027
.9811.016
1.159
.999' 1 . 0 9 5
1.200'1 .029
.9981.0971.0651.019
'1 .097' .9491.1211.1731.4651. 6511.3821.193
'1 .3591.4101.4901.397
'1 .608
1.634
1.545'1 .483
1.2371.0801.444
'1 .3431.1901.2521.147
.888' . 7 5 7
.9731.229
1.1381.94
107 001.136
.86
122
1088114
May
1 32S' 1 208' 1.277
1.331
1 4361 2641.3361.3071 3571.4611.3751.3271,3831.4371.2611.0241.0061.04£1.0731.174
'1 .131
1.02E
.9741.02C
1.15S
.98?l . ioe1.1651.03C
.9951 .1Kl.os:1.03(1.1K
.9451.13,1.18<1.4911.69J1.39v1.21C1.37,1.4411.50t1.43C1.645
v 1. 65(
1.59:1.47(1.27!1.081.44}
1.35*1.191. 241.18
.89
.75
.981.24
1.141.94
1.13
.88
12
'108
' 1
r Revised. » Preliminary, i Rate as of July 1. § Sample was changed in November 1942; data are not strictly comparable with figures prior to that month.• The comparability of the series was affected by a change in the data in July 1945; see January 1946 Survey for June 1945 figures on both the old and the new basis.% Data beginning A*pnl 1945 are not comparable with earlier data; see note for hours and earnings in telephone industry at the bottom of p. S-13 of the April 1946 Survey.5 Rates as of July 1. 1947: Construction—common labor, $1,217; skilled labor, $2.07.c?Data beginning February 1947 include increases amounting to approximately ten cents per hour set aside by the Western Union Telegraph Company as a result of awards or
recommendations of Governmental boards but not yet distributed pending completion of job classification structure; approximately 6 cents of this increase has been accruing sinceDecember 1945 and the remainder since June 1946.
*New series. Data on hourly earnings for 1937-43 for the telephone industry are shown on p. 20 of the May 1945 Survey (see also note marked "$" above regarding a change m thedata in April 1945) and data for the telegraph industry beginning June 1943 are on p. S-14 of the January 1945 issue. Data on hourly earnings beginning March 1942 for the othernonmanufacturing industries and beginning August 1942 for the printing and publishing subgroups are available, respectively, in the May 1943 and November 1943 issues, and databack to 1939 will be published later.
t Revised series. See note marked "f' on p. S-13.
Digitized for FRASER http://fraser.stlouisfed.org/ Federal Reserve Bank of St. Louis

August 1947 SURVEY OF CURRENT BUSINESS S-15
Unless otherwise stated, statistics through 1941and descriptive notes may be found in the1942 Supplement to the Survey
1947
June
1946
June July August Sep-tember
Octo- Novem- Decem-b e r b e r b e r
1947
FINANCE
BANKING
Agricultural loans outstanding of agencies supervisedby the Farm Credit Administration:©
Total mil. of dolFarm mortgage loans, total do
Federal land banks __ __ _ doLand Bank Commissioner do
Loans to cooperatives, total _ doBanks for cooperatives, incl. central bank..doAgr. Marketing Act revolving fund do
Short term credit, total _ do . .Federal intermediate credit banks % doProduction credit associations doRegional agricultural credit corporations...doEmergencv crop loans doDrought relief loans do
Bank debits, total (141 centers)! doNew York City.. _ doOutside New York City do
Federal Reserve banks, condition, end of month:Assets, total do
Reserve bank credit outstanding, total doBills discounted __ doUnited States securities do
Gold certificate reserves® -- doLiabilities, total . __ do
Deoosits, total doMember bank reserve balances _ do_ _.
Excess reserves (estimated) doFederal Reserve notes in circulation . do
Reserve ratio _ percent. .Federal Reserve weekly reporting member banks, con-
dition, Wednesday nearest end of month:fDeposits:
Demand, adjusted mil. of dolDemand, except interbank:
Individuals, partnerships, and corporations-doStates and political subdivisions . . doUnited States Government .. . . d o
Time, except interbank, total doIndividuals, partnerships, and corporations, doStates and political subdivisions _. ._ do
Interbank! .. . _ __ __ _._ ___do _Investments, total do
U. S. Government obligations, direct and guaran-teed, total __ _. __ __ mil. of dol
Bills doCertificates _ . - ._ _ _ _ doBonds (incl. guaranteed obligations) doNotes do
Other securities _ . _ __ _ doLoans, total do
Commercial, industrial, and agricultural doTo brokers and dealers in securities - . d oOther loans for purchasing or carrying securities
mil. of dol__Real estate loans . . . doLoans to banks doOther loans. do
Money and interest rates: ^Bank rates to customers:
New York City ...percent..7 other northern and eastern cities do11 southern and western cities do
Discount rate (N. Y. F. R. Bank) ,___doFederal land bank loansd" .- doFederal intermediate credit bank loans _ doOpen market rates, New York City:
Prevailing rate:Acceptances, prime, bankers', 90 days doCommercial paper, prime, 4-6 months doTime loans, 90 days (N. Y. S. E.) do
Average rate:Call loans, renewal (N. Y. S. E.)- doU. S. Treasury bills, 3-mo do
Average yield, U. S. Treasury notes, 3-5 yrs.:Taxable* do
Savings deposits, New York State savings banks:Amount due depositors,.. mil. of dol__
U. S. Postal Savings:Balance to credit of depositors... , do
CONSUMER SHORT-TERM CREDIT
Tota^*consumer short-term debt, end of month*._doInstalment debt, total* do
Sale debt, total* . . doAutomobile dealers* doDepartment stores and mail-order houses*_doFurniture stores* . ._ _ . . . doHousehold appliance stores* doJewelry stores* doAllother* do
1,7061,033
910123159155
151439
3622
8328
84, 92535, 63249, 293
44, 42522,170
7021,87220, 03944, 42517, 74816,112
*78424,154
47.8
46, 602
46, 4433,191
59614, 46014, 055
32810, 53243, 094
38, 990989
4,64830, 7012, 6524,104
20, 27711,8091,266
9862, 981
1583,077
1.832.442.951. 004.001.63
.811.001.50
1.38.376
1.21
9,535
v 3,397
v 10, 884v 4 906v 2, 004
v S62J>413*396
*>35v 118*>180
1,7791,1821,008
174118115
347934
3044
10532
78,19134,97243,219
44,82824, 456
15723, 78318,10344,82818,20616,1231,112
24,19142.7
45, 417
45, 3072.8378,188
13, 51213, 249
19111,24652, 247
48, 3031,131
11,42530, 083
5,6643,944
17,1828,4752,110
2,1541, 989
1832,271
1.842.512 971.004.001.50
.50
.751.25
1.00.375
1.15
8,762
3,120
7,9052, 9021,035
336210299
1763
110
1,7701,1691,001
168124118
3477
33305
410432
82, 37437,35745,017
44,62524,164
24523, 63318,10544, 62517,90615,991
85624, 244
43.0
45,650
45, 5462,7917,781
13. 63413, 346
21411,16651, 827
47, 808875
11,11130. 290
5, 5324,019
17, 2508,9161,749
2,0152,071
1952,304
1.004.001.50
.59
.771.25
1.00.375
1.13
8,825
3,160
8,0253,0221,070
3652122992063
111
1,7511,151
989162130125
247032
3023
10231
73,90030, 21643,684
45,04524,748
33123,94618,09845,04518, 29416, 2451,085
24, 41242.4
45, 625
45, 3012,7736,993
13, 72513, 424
22211, 07950,868
46, 884824
10, 20830, 436
5, 4163,984
17, 5079,4441,503
1,8672,140
1882,365
1.004.001.50
.71
.811.50
1.38.375
1.14
8,875
3,188
8,3623,1651,124
394221308
64115
1,7411,136
979157151146
245430
2913
9831
74, 55231, 39743,155
44,81324, 594
21324, 04918,09544,81318, 06015,910
72524, 448
42.6
45, 621
45, 5842,8725,003
13, 80613, 504
22611, 14648, 449
44, 281746
7,79230, 566
5, 1774,168
18, 00110, 1801,367
1, 6162,241
1342, 463
1.832.432 751.004.001.50
.81
.811.50
1.38.375
1.22
8,919
3,207
8,6313,2881,177
425235311
2365
118
1,7171,117
966151180175
242130
2643
9331
81,58333,91347, 671
44, 88924,109
25323, 51818, 22944,88917, 57915,931
56724, 583
43.2
46,187
46,1862,7574,956
13, 87113, 573
22211, 09448, 336
44, 375741
7,99430, 6365. 0043, 961
18, 70410, 8251,299
1,5062,324
1992,551
1.004.001.50
.81
.881.50
1.38.375
1.24
8,958
3,235
9,0133, 4581, 261
466257322
2566
125
1,6901,099
954145189183
240133
2453
9130
77,19331, 08846,105
45, 64724, 791
31623,94418,31045,64718,08316,5131,063
24, 79942.7
46, 751
46, 9752,7963.762
13. 90213, 585
24010, 97046, 996
43,069795
6,74230, 5744, 9583,927
19,24611,2341,442
1,3892,400
1522,629
1.004.001.50
.81
.941.50
1.38.376
1.22
9,013
3,260
9,5273, 6461,358
505284337
2672
134
1,6611,085
944140188182
2389
34234
38830
93, 54741.25252,295
45,00624,093
16323, 35018, 38145, 00617, 35316,139
56224, 945
43.5
46, 582
47, 2522,9071,917
14,06313, 719
25911, 26945, 037
41, 053962
6,29930, 3743,4183,984
19, 41711,3461,471
1, 2562,490
722,782
1.852.432.761.004.001.50
.811.001.50
1.38.375
1.22
9,170
3,284
10,1473,9761,558
544337366
28123160
1,6621,068
932135195187
2399
35245
28729
83, 45234, 30549,147
45, 95724, 754
30823, 94118, 62745, 95718, 92816,063
66324,387
43.0
46, 552
46, 1062, 9481,819
14, 09613, 775
23710, 70544, 601
40, 642438
6,34530, 3983,4613, 959
19, 56611, 5991,235
1,1392,563
2152,815
1.004.001.50
.811.001.50
1.38.376
1.18
9,232
3,331
9,9674,0481,566
581337352
27114155
1,6701,060
928133194187
2416
32266
28629
72, 94329, 74543,198
46, 54724, 846
35624,11719,11346, 54719, 48915, 895
84724, 320
43.6
45,124
45,1992,9372,135
14, 22613, 887
25410, 54643, 550
39, 619424
5,38230, 354
3, 4593,931
19, 75911,8201,191
1,1122, 631
1702,835
1.004.001.50
.811.001.50
1.38.376
1.18
9,278
3,355
9,9104,1571, 609
631338349
30107154
1,6541,048
919129182175
2444
31296
28629
83, 50533, 54749,958
44, 93123, 431
53822, 59319, 22244, 93118, 24915, 264
34424,162
45.3
44,482
44, 2103,0751,817
14. 30313, 936
28510. 63642, 959
38, 850692
5,03630, 3072,8154,109
20, 02012, 271
874
1,0632,739
1792,894
1.822.372.801.004.001.63
.811.001.50
1.38.376
1.17
9,340
3,379
10, 2164,3291,695
691358354
29105158
1,6711,040
913126158153
2473
33323
28529
78, 30131, 39146, 910
44, 23622, 205
12521,85719,53744, 23617,47015, 826
65424, 022
47.1
46,150
45. 7983,3501,476
14, 34913, 955
31210, 35143, 574
39, 465753
5,40230, 4722, 8384,109
19, 86412, 043
833
1, 0512,831
1842,922
1.004.001.63
.811.001.50
1.38.376
1.17
9,377
' 3, 382
>• 10,407' 4, 537
1,813753386366
32109167
1,6831,034
910124152148
2497
35346
28529
78, 35430,89547,459
44,88222, 738
17922,08S19,68944, 88218,00916, 238
'99124,120
46.7
46, 314
45,8073,2681,119
14, 41114, 005
32410, 12643, 224
39, 220827
5.13530, 5562,7024,004
20, 01511,7921,169
1,0092,897
1912,957
1.004.001.63
.811.001.50
1.38.376
1.19
9,427
v 3, 393
v 10, 663p 4, 741v 1, 922
P 8 1 0»409*382
P 3 2P 1 1 4v 175
r Revised, v Preliminary. \ For bond yields see p. S-19. § Includes domestic and foreign bank deposits.© Effective Nov. 1,1946, jurisdiction over the emergency crop and drought relief loans included above ^ as transferred to the Farmers Home Administration.d* Rate on all loans: see note on item in April 1946 Survey.X Excludes loans to other Farm Credit Administration agencies.*New series. Data beginning December 1940 for the series on taxable Treasury notes are available on p. S-14 of the April 1942 and later issues of the Survey; since Dec. 15, 1945,
this series represents price of Treasury bonds of Dec. 15 1950. For information regarding the series on consumer credit see note marked "*" on p. S-16.tRevised series. Bank debits we're revised in the September 1943 Survey to include additional banks; see p. S-15 of that issue for revised figures for May-December 1942. The
series for weekly reporting banks have been revised to increase and improve the coverage; a number of important cities have been added while some cities formerly included havebeen eliminated and the coverage within included cities has been broadened; in addition, all branches of reporting banks are included, regardless of the location. The total numberof cities, including only the head-office city of branch systems, has been reduced from 101 to 94 while the number of banks reporting has been increased from 371 to 441. The per-centage of total commercial bank deposits represented by the series has been increased from 49 to 57. Revised figures are available only beginning July 2, 1946 (shown here as June).See July 1947 Survey for June 1946-May 1947 figures comparable with earlier data.Digitized for FRASER
http://fraser.stlouisfed.org/ Federal Reserve Bank of St. Louis

S-16 SURVEY OF CUEEENT BUSINESS August 1047
Unless otherwise stated, statistics through 1941and descriptive notes may be found in the1942 Supplement to the Survey
1947
June
1946
June July August Sep-tember
Octo-ber
Novem-ber
Decem-ber
1947
Janu-ary
Febru-ary March April May
FINANCE—Continued
CONSUMER SHORT-TERM CREDIT—Con.
Total consumer short-term debt—Continued.Instalment debt—Continued.
Cash loan debt, total* mil of dolCommercial banks* do __Credit unions doIndustrial banks* ._ ._ doIndustrial loan companies* __do _.Small loan companies doInsured repair and modernization loans* doMiscellaneous lenders* do
Charge account sale debt*. _ _ do -Single payment loans* doService credit* __ . do
Consumer instalment loans made by principal lendinginstitutions:
Commercial banks* mil. of dolCredit unions doIndustrial banks*. . . . do -Industrial loan companies* do . .Small loan companies do
LIFE INSURANCE
Life Insurance Association of America:Assets, admitted, totalJA - mil. of dol
Mortgage loans, total . . _ do _-Farm doOther do
Real-estate holdings doPolicy loans and premium notes _ doBonds and stocks held (book value), total _ do
Govt. (domestic and foreign), total doTJ. S. Government do
Public utility doRailroad ___ doOther do
Cash.. _ __ _ doOther admitted assets-- do
Premium> collections, total® thous. of dol._Annuities doGroup . doIndustrial doOrdinary do
Institute of Life Insurance:*Payments to policyholders and beneficiaries,
total. . . . thous. of dol-.Death claim payments doMatured endowments doDisability payments doAnnuity payments doDividends.- _ doSurrender values, premium notes, etc do
Life Insurance Agency Management Association:Insurance written (new paid-for-insurance):f
Value, total thous. of dol_.Group doIndustrial doOrdinary, total . do
New England _ . _ . . _ do -Middle Atlantic doEast North Central . . . . . . doWest North Central doSouth Atlantic . - _ . - _ - _ _ do -East South Central _ doWest South Central. do._-Mountain _ . . . doPacific..- . _ do
MONETARY STATISTICS
Foreign exchange rates:Argentina dol per paper pesoBrazil, free cf- dol. per cruzeiroBritish India dol per rupeeCanada, free rate§ dol. per Canadian dolColombia ._ - dol per pesoMexico doUnited Kingdom, free rate . dol. per £
Gold:Monetary stock, U. S . mil of dolNet release from earmark* thous. of dolGold exportsi doGold imports^ doProduction, reported monthly, total © do.. .
Africa doCanada®. _. _ _. doUnited States © . d o .-
v 2, 902v 1,197
p 224P 1 4 3P 1 1 8*>638P 4 6 9P 113
v 2,887v 2, 216
P 8 7 5
v 211v 44P 26v 24
P 1 1 7
40,0575,837
6245,213
6221,481
30, 74019,09317, 7044,9652,5224,160
588789
1,829,937291, 212349, 725
1,189,00078, 555
284, 748259,390118,937132, 38446, 62095, 61240, 382
132, 372
.298
.054
.302
.916
.570
.2064.027
p 21, 266118, 958
2,685202, 917
1
1,8677021499279
49824899
2,3271,846
830
14828191798
37, 5525,213
5874,626
6021,484
28, 92719,64518, 3234,3222,5562,404
651675
368, 22638, 32420, 41372,043
237, 446
221, 99798, 78929, 8607,438
17, 30944,06324, 538
1,863,485183, 743338, 999
1,340,74395,427
336, 659290, 952130, 779145,15655, 645
107,38440, 797
137,944
.298
.052
.302
.906
.570
.2064.034
20, 27015,010
74837, 07754, 74939,1018,2033,416
1, 9527441559681
512263101
2,2811,886
836
155292017
105
37, 7655,226
5904,636
6011,479
29,06919, 68818, 3684,3902,5362,455
715675
361, 40061,36325,19963, 947
210, 891
225, 877106, 74332, 9237,496
16, 88136, 69425,140
1,952,159284,896323,861
1,343,40292,405
327, 627292, 432127, 881154, 78154, 326
112,08142, 803
139, 036
.298
.052
.302
.967
.570
.2064.034
20, 2677,9962,5298,877
57,19340,0508,3843,993
2,04179015810084
527280102
2,4181,938
841
164302018
108
37,9115,255
5924,663
5971,475
29, 33519,70118, 3824,4002.5312.703
566683
343.08037, 94425, 23363, 834
216,069
216, 264101, 27628, 9748,120
16, 95035, 60425, 340
1,796,758200, 518323, 504
1,272,73683, 317
301, 929282, 453125,687142,193
53, 232108,18843, 087
132, 650
.298
.054
.302
.968
.570
.2064.034
20, 28060,12310,81626, 02760, 79538,9498,092
1 8,310
2,11182416410386
536295103
2, 4952,000
84S
15631201896
38,0795,289
5924,697
5941,475
29, 50419,75418, 4254,4542,5222,774
540677
352, 23038,80723, 08571, 062
219,276
210,89893, 97928, 7737,334
16,96438,41525,433
1,710,536238,591346,116
1,125,82973, 205
259,183249, 867112, 704128,77747, 73294,95738,138
121, 266
.298
.054
.302
.963
.570
.2064.033
20, 30512,30631,84624, 21757, 22137,8028,0476,798
2,19786517110890
547312104
2,6212,081
853
176342119
105
38,2815,317
5934,724
5911,474
29, 64219,67318, 3434,4932,5272,949
550707
350,54750, 71625, 30664,910
209,615
235, 775111, 75535,8997,996
17, 72136,23226,172
1,796,548198, 701347, 220
1,250,62787,873
311,142273,028118, 363141, 41549,69795, 72041,644
131, 745
.298
.054
.302
.960
.570
.2064.032
20, 402115.690
80624, 98959,46439, 2868,4295,930
2,288907176112
94565328106
2,8592,164
858
172332220
122
38, 4595,365
5924,773
5901,472
29, 67819,55818, 2314,5022,5173,101
581773
348, 27439, 22422, 57261, 902
224, 576
213, 74399, 25831, 0226,999
16, 46635, 22624, 772
1,648,423162,146343,113
1,143,16476, 411
283, 614253, 324108,934126,22844, 00388,91737, 774
123, 959
.298
.054
.302
.952
.571
.2064.031
20, 470127, 485
73378,63655,42437,1708,0924,900
2,41895618511798
608344110
3,0542,253
864
191392625
166
38, 8135, 437
5934,844
5841,471
30, 04319, 57418, 2254,5312,4903,448
473805
491, 79794, 38032, 32092, 701
272,396
258,173108, 24932,3127,888
15,55063, 58130, 593
1,962,873475, 709290,439
1,196.72576, 533
274,362263, 294121, 356132,94646, 44195, 92144,353
141, 519
.298
.054
.302
.954
.571
.2064.029
20, 52982, 830
115,91554, 72256, 97737, 5897,9616,255
2,4821,991
185122102611360110
2,7642,286
869
18733222098
39, 0325,480
5924,888
6011,470
30, 17719, 54218, 1924,5512,4983, 586
552772
414, 52373, 06837, 83369, 466
234. UQ
266, 447116,10539, 9958,747
22, 58150, 81828, 201
1,741,639184, 095328,518
1,229,02694,184
325, 519278, 083117,441121, 40641,81487, 86836, 348
126, 3631
!
.298
.054
. 302
.951
.571
.2064.029
20, 748196, 080102, 59385, 77453,12637,3308.1847,612
2,5481,030
190125105611377110
2,6022,277
874
18033212090
39, 2065,542
5954,947
6011,469
30,32919, 57118,1984,5672,4973,694
470795
383,85748, 21125, 97568, 491
241,180
238, 744107, 84136,123
7, 39317,91141,37728, 099
1,718,329181, 554350, 029
1,186,74687, 542
300,770263,884113,795126,06443,99888, 35937, 532
124,802
.298
.054
.302
.957
.570
.2064.027
20, 330-684,474
49, 21569, 57735, 47522, 217
7,7755,483
2,6341,079
197128108617394111
2,7682,243
876
214382423
121
39, 4505,601
5935,008
5971,471
30,10219. 27417,8804,5682,4963,764
878801
411, 30850, 33924, 55474, 642
261, 773
266, 482120, 77238, 2987,907
17, 21351, 32430, 968
1,845,995181, 315381, 519
1,283,16187, 521
314, 208280,199123, 723137, 36449, 692
102, 64841, 672
146,134
.298
.054
.302
.942
.570
.2064.027
20, 463203, 540
17, 691171, 32546, 80632, 0949, 2125,500
' 2, 7241,123
204133113627
'412112
2, 7822,215
873
213392424
116
39, 6065,661
6055,056
6051,473
30,43119, 29617,9044, 6912,4893,955
649787
351,97841,96430, 21663, 629
216,169
250, 576112,36338,4687,583
18, 48241,89831, 782
1,796,174167,136359, 906
1,269,13289,694
313,179275, 438124,683138,71347, 58499,57741,950
138,314
.298
.054
.302
.919
.570
.2064.027
20, 774271, 990
17, 45861, 508
8,9316,246
P 2 , 8 1 9P 1,167
P 2 1 3P 1 3 8p 116P 6 3 3P 4 3 9P 1 1 3
v 2,835v 2, 213
^874
P 212P 4 2*24P 2 4
P 1 1 5
39, 7765,750
6155,135
6141,477
30,57919, 27417,8884,7512,4914,063
568788
381, 21240,28927,16265, 497
248, 264
245,999111,67934, 595
7, 69318,31541, 26932, 448
1,829,245226, 596372,892
1,229,75784,104
301,884267, 028119,665131,96047, 67396,85441, 843
138,746
.298
.054
.302
.920
.570
.2064.027
20,93313,0573,028
132, 762
9,400
r Revised. v Preliminary. J36 companies which had 81 percent of the total admitted assets of all United States legal reserve companies at end of 1945.<g> Reported by 39 companies which had about 79 percent of the total business outstanding of United States legal reserve companies at the end of 1945.• In January 1944 one company was replaced by a larger one; for revisions October-December 1943 see December 1944 Survey; earlier 1943 revisions are available on request.d" See September 1946 Survey arid earlier issues for official rate; the official market was abolished July 22,1946. Free rate prior to August 1945 is available upon request.§The official rate for Canada was $0,909 from March 1940, when first quoted, through July 4,1946, and $1,000 thereafter; the average rate for July 1946 was $0,983.^Publication of data was suspended during the war period; data for November 1941-February 1945 will be published later. • Or increase in earmarked gold ( - ) .© See notes in the April 1946 and August 1946 issues regarding revisions in the data for 1941-44 and January-May 1945.•New series. Estimates of consumer short-term credit as originally compiled are published in the November 1942 Survey and the general estimating procedure is described in that
issue; data for various components have subsequently been revised; there have been recent revisions in data for commercial banks beginning July 1943, credit unions beginning 1945,small loan companies beginning 1930, and single payment loans beginning 1945, as published in the Survey prior to the July 1947 issue, with corresponding corrections in the relevanttotals, and earlier revisions that have not been published, as indicated in the note marked "*" on p. S-15 of the April 1946 Survey; all revisions through April 1946 will be shown later.See November 1942 Survey, p. S-16, for a brief description of the series on payments to policy holders and beneficiaries and data for September-December 1941 and early 1942.
fRevised series. All series for insurance written are estimated industry totals and for group and industrial insurance are not comparable with data published prior to the March1946 Survey (see note in that issue); data for 1940-44 for these series will be shown later; data for ordinary insurance continue the data from the Life Insurance Sales Research Bureaupublished in the 1942 Supplement and subsequent monthly issues.
Digitized for FRASER http://fraser.stlouisfed.org/ Federal Reserve Bank of St. Louis

August 1947 SUEVEY OF CURRENT BUSINESS S-17
Unless otherwise s ta ted , stat ist ics th rough 1941and descriptive notes may be found in t he1942 Supplement to t h e Survey
1947
June
1946
June July August Sep-tember
Octo-ber
Novem-ber
Decem-ber
1947
Janu-ary
Febru-ary March April May
FINANCE—Continued
MONETARY STATISTICS-Continued
Money supply:Currency in circulation mil. of dol..Deposits adjusted, all banks, and currency outside
banks total* mil. of dolDeposits, adjusted, total, including U. S. deposits*
mil. of dol. .Demand deposits, adjusted, excl. U. S.* doTime deposits, including postal savings*.._do
Silver:Exports A thous. of dolImportsAPrice at New York •_ . dol. perProduction:
Canada thous. ofUnited States
dofineoz..
fine ozdo
PROFITS AND DIVIDENDS (QUARTERLY)Industrial corporations (Federal Reserve): d*
Net profits, total (629 cos.) mil. of dolIron and steel (47 cos.) _.Machinery (69 cos.)Automobiles (15 cos.)Other transportation equip. (68 cos.).Nonferrous metals and prod. (77 cos.)Other durable goods (75 cos.)
..do . . .dodo .
. . d o . . . .dodo .
Foods, beverages and tobacco (49 cos.) do __Oil producing and refining (45 cos.). -Industrial chemicals (30 cos.),.Other nondurable goods (80 cos.)Miscellaneous services (74 cos.)
Profits and dividends (152 cos.):*Net profitsDividends:
Preferred...Common
Electric utilities, net income (Fed. Res.)*Railways, class I, net income (I. C. C.) . .
dodo. .
do
d o . . . .
d o . . . .dodo . . .
Telephones, net operating income (Federal Communica-tions Commission) mil. of dol. .
PUBLIC FINANCE (FEDERAL)U. S. war and defense program, cash expenditures, cu-
mulative totals from June 1940:* mil. of dolU. S. Savings bonds:*
Amount outstanding doSales, series E, F, and GRedemptions
Debt, gross, end of month®Interest bearing:
Public issuesSpecial issues to trust accounts, etc
Noninterest bearing
dododo
dodo
Obligations fully guaranteed by U. S. Gov't:Total amount outstanding (miniatured) do
Expenditures and receipts:Treasury expenditures, total. . do
War and defense activitiesJTransfers to trust accounts X . .Interest on debt. _ „All other*
Treasury receipts, totalReceipts, net
Customs ,Internal revenue, total
Income taxesSocial securty taxes.
dododododododododo
doNet expenditures of Government corporations
wholly owned* mil. of dol_.Government corporations and credit agencies :f
Assets, except interagency, total.. ._ . mil. nf dolLoans receivable, total (less reserves). .
To aid agriculture.To aid home ownersTo aid railroads.To aid other industriesTo aid banks......To aid other financial institutionsForeign loansAllother.. .
Commodities, supplies, and materials..mil.U .S . Government securitiesOther securities. _ .Land, structures, and equipmentAll other assets
dododododododododo
of dol
dododo
Liabilities, except in teragency, total.. . doBonds, notes, and debentures:
Guaranteed by the United StatesOther. .
Other liabilitiesPrivately owned interests..U. S. Government interests.
do. d o . .
dodo
. . d o . . . .
* 28,292
*165,100
P139, 100v 82, 500P 55,600
1,6854,408
.668
356, 544
51, 407482433
258, 286
227, 74727, 3663,173
83
4,5701,493
181.3961,6625,4805,473
353,9933s270
125
970
28,245
171,237
144, 72179,47651,829
3221,187.708
1,1751,063
604674921
26377462667180
250
21163151
70.7
339,264
49,053571519
269,422
245,77922,332
1,311
467
5,5132,442
51,3951,6714,4824,479
354,0803,392
76
- 1 6 1
27, 5725,4252,873
78219519622
235989633
1,4591,767
40115, 5582,9615,752
3251,2344,193
48221,338
28,254
170,700
144,30080,30052,400
1067,089l . 9 0 1
1,2671,395
340,497
49,336753537
268,270
243,99423,045
1,231
324
4,5141,190
631249
2,4442,600
442,2511,489
67
- 8 7 0
28,448
170,600
144,00080,60052,700
2738 283
.901
1,1862,583
342,061
49,493690478
267,546
242,91623,443
1,187
370
2,7961,509
13122
1,1522,7172,434
402,4941,513
302
136
28,607
170,200
143,70081,40063,000
1,1475,557.901
9532,993
698963242
2 3841419377677793
310
20149142
123.7
60.4
343,051
49, 560494482
265,369
240,36423,854
1,151
391
2,8511,100
32648
1,0704,4814,478
424,2913,550
89
- 9 6
29,5695,9492,860
72917118220
2371,632
6171,4291,836
39016,973
2,9925,004
3771,2503,377
49624,069
28,600
170,000
143, 50082,40053, 200
1664,385
.901
9292,940
344,536
49,638519489
263, 532
238.40024,015
1,116
378
3,0231,481
48160
1,3352,6172,644
452,2301,404
74
- 5 9
m _
28,861
169,500
142,80083,00053,400
85811, 595
.901
8422,561
345,955
49,723453418
262,277
236,67124, 254
1,351
362
2,5571,436
27105989
2,6392,364
452,4031,444
290
- 2 8
28,952
167,107
140,37783,31453,960
6,5797,861
.867
1,0132,928
8539761
102t 44
5057
12485779166
415
21209156
184 1
68.9
347,341
49,864676604
259,148
233,06424,585
1,500
331
3,6181,580
21952
1,0654,1134,107
433,6932,886
89
45
80,4096,6492 884
68517119219
2952,284
5981,2651,873
54716,9243 1525,101
2611,2523,588
49824,810
28,262
165,900
139,80082, 50064,200
2,94513, 295
.765
7672,464
348, 651
50, 407952483
259, 776
233, 60124, 777
1,399
262
3,0051,412
71343
1,1803,8603,820
473,4152,664
58
108
28,304
165,400
139,20080,60054, 700
12,7004,589
.723
8933,713
350,035
50,772712398
261,418
233,17624,9383,305
181
3,9461,457
16124
2,3504,6434,378
364,2743,222
387
- 3 2
28,230
165,100
139,10080,40054,900
3,5235,332.773
1,0393,250
875124
6999
4551
10389899764
424
20168191
86.4
66 1
351, 465
50, 995616449
259,124
230, 61825,1833 324
175
3,4921,428
1626
1,4385 7245,701
395,4464,650
118
106
32 3387 2943 056
663167204
17238
2 855590
1 0031,9853 426
15 4863 1434 560
1691 2503 142
50927, 268
28,114
165, 200
139, 20081,30055,100
1,8657,220
.757
8542,730
353,106
51,163572455
257, 701
229 14725 280
3 274
171
3 9811,728
46141
2, 0652 6242 556
412 3091, 597
75
20
' 28, 261
164,900
138, 90081,50055, 300
1,3874,488
.725
3,896
354, 375
51,282488421
258, 343
228 78926,186
3 368
171
4,4661,327
43292
2,6143,2042,865
372, 5781,619
365
- 6 1 4
' Revised. v Preliminary. * Deficit. i Average for July 11-31. ' Partly estimated. <g> Data are on the basis of Daily Treasury Statements (unrevised)A Data contain series published in the 1942 Supplement but suspended during the war period; data for November 1941-February 1945 will be published later.• Quotations are for foreign silver through July 1946; thereafter they apply also to domestic and Treasury silver if such silver enters into New York market transactions,d" For 1941-44 data for 629 companies and the industrial groups, see p. 31 of the October 1946 Survey.X For 1941 revisions see p. S-17 of the November 1942 Survey.* New series. For data for 1929-40 for profits and dividends of 152 companies see p. 21 of the April 1942 Survey; 1941-44 revisions are available upon request. Data beginning
July 1940 for expenditures for the U. S. war and defense program are shown on p. 29 of the June 1943 Survey; beginning July 1945 data are from the Treasury Daily Statements. Seenote marked "*" on p. S-17 of the February 1947 Survey for references to brief descriptions and the earliest data published for the series on net income of electric utilities, bankdeposits and currency outside banks, and U. S. savings bonds; data for bank deposits, etc., beginning January 1947 are for the last Wednesday of the month instead of the end ofthe month. Data for expenditures of Government corporations have been shown on a revised basis beginning in the September 1946 Survey; see note in that issue for an explanation.
. t Revised series. Data for government corporations and credit agencies have been shown on a revised basis beginning in the May 1946 Survey; data for certain items were furtherrevised in the October 1946 issue (see note on p. S-18 of the February 1947 Survey for further information on these series). The increase in securities other than U. S. Governmentin the first quarter of 1947 is due to large subscription to International Monetary Fund.
Digitized for FRASER http://fraser.stlouisfed.org/ Federal Reserve Bank of St. Louis

S-18 SUEVEY OF CURRENT BUSINESS August 1947
Unless otherwise stated, statistics through 1941and descriptive notes may be found in the1942 Supplement to the Survey
1947
June
1946
June July August Sep-tember
Octo-ber
Novem-ber
Decem-ber
1947
Janu-ary
Febru-ary March April May
FINANCE—Continued
PUBLIC FINANCE (FEDERAL)—Continued
Reconstruction Finance Corporation, loans outstanding,
Banks and trust cos incl receiversOther financial institutionsRailroads including receivers
dododo
Loans to business enterprises, except to aid in national
Other loans and authorizations
SECURITIES ISSUED
Securities and Exchange Commission:!Estimated gross proceeds total mil
By types of security:Bonds notes and debentures total
Corporate
Common stockBy types of issuers:
Corporate, totalIndustrialPublic utilityRailOther (real estate and financial)
Non-corporate total ®TJ S Government
N"ew corporate security issues:Estimated net proceeds total
Proposed uses of proceeds:New monev total
Plant and eouipmentWorking capital
Retirement of debt and stockFunded debtOther debt
Other purposesProposed uses by maior groups:§
Industrial total net proceedsNew monevjjpf irpmpnt of debt and stock
Public utility total net proceedsNew moneyRetirement of debt and stock
Railroad total net proceedsNew moneyRetirement of debt and stock
dodo
of dol
do_do _..dodo
dodododododododo
do
dodo
__do .._do
_do .dodo
. . d o . . . .
dododododododododo
Commercial and Financial Chronicle:Securities issued, by tvpe of security, total (new
capital and refunding)%. _ thous. of dol__New capital total X _ do __
Domestic, totalfCorporate tFederal agenciesMuniciDal State etc
ForeignRefunding, total t - -
Domestic total*Corporate t ..Federal agenciesMuncipal, State, etc
ForeismDomestic issues for productive uses (Moody's):
Total milCorporate"VfumVioal State ftp
Bond Buyer: State and municipal issues:Permanent (Ions: term) thous.Temporary (short term)
SECURITY MARKETS
Brokers' Balances (N. Y. S. E. members camargin accounts)^
Customers' debit balances (net). milCash on hand and in banksMoney borrowed _ .Customers' free credit balances
. . d o . . . ..do
__do.__.do
. . d o . . . .
. . d o . . . .do
. . d o . . . .do
-_do____do
of doldo ._do
of dol. .. .do. . ._
Lrrying
ofdoL.do
. . d o . . . .do
BondsPrices:
Average price of all listed bonds (N. Y. S. E.)_ dollars..Domestic - . d oForeign _ _ _ _ . __do____
Standard and Poor's Corporation:Industrials, utilities, and rails:
High grade (15 bonds) „ dol. per $100 bond..Medium and lower grade:
Composite (50 bonds)Industrials (10 bonds)Public utilities (20 bonds)Railroads (20 bonds)
Defaulted (15 bonds)Domestic municipals (15 bonds)!
. do. .. . d o . . . .
dodo
_.do____-_do____
1,033,363743, 777743. 377517, 009
15, 225211, 543
0289, 586251, 586210, 65738, 455
2,47438, 000
209, 32749,167
552
222650
102. 25102. 7074.02
122.8
114.3122.6113.0107.363.4
134.4
1,47421483
171
171419416
1,542
1,257377129156
6634211823524
879755124
643
24516977
331285
143267
40520616617910
13535
926
867,842428, 991428, 991311,710
9,145108,136
0438, 8524 9, 3513 2, 651
40, 58016,12019,500
23615383
130, 85156,461
809370498651
104. 21104.6181.64
123.9
119.5123.9116.0118.783.2
142.0
1,45321281
148
168429415
1,859
1,633495
99126
672289342
933
1,1861,053
132
703
327198129352265464025
325131171338181156
981
983, 545493, 272493, 272368, 802
0124,470
0490, 274435, 774395,174
32, 9207,680
54, 500
306210
96
138,678141,185
745
442653
103. 52103. 9280.97
124.0
119.1123.4115.3118.580.1
140.9
1,433208
51147
158459410
1,360
1,178345
34148
497399
413
5486377865
518
34412621916494502110
422326
9141
634
330
570, 721419, 510418, 510354, 302
064,208
1,000151, 211126, 46192, 85732, 920
68424, 750
23917564
67,5263,482
723
377647
103.10103. 4980.15
123.8
119.1124.0115.4117.778.8
140.0
1,327206
50147
160358406
1,088
1,0161955517
26713411320
1821742
77
261
13810137
117381860
6
13010816
111139819163
442, 219241, 757241, 757170, 349
0'71, 408
0200, 462199, 702144, 64238. 45516, 605
760
18812761
89, 389131,893
631
305729
102.15102. 5677.95
122.8
117.4123.3114.7114.365.4
137.8
1,273203
49147
158318397
1,276
1,208315
2443
383214126403
89370350
377
20216043
17036
122125
21071
133124108
17402119
561, 778363, 050363, 050266, 635
47, 26549,150
0198, 728198,72865. 208
132, 645875
0
293246
47
53, 29062, 729
583
253720
102. 46102.8877.19
121.8
115.8122.2112.9112. 362.7
136.0
1,279203
49147
165320396
1,320
1,14845712547
629540
63198
691619
71
617
511329183867466
19
5304705361183318180
761,054659, 364659, 364589, 878
069,486
0101,690101, 69086, 31613,3951,979
0
528459
69
78,194«47,388
571
238723
102.00102. 4176.89
121.6
115.9122.5112.6112.763.6
136.8
1,287201
50147
168327395
1,957
1,79966013820
818232487
4752
1,139936170
807
62355766
17397591712
22614570
48341172473512
1,011,544788, 447788, 447668, 968
0119, 479
0223, 097189, 597105, 385
33, 94050, 27133,500
649533116
175, 44910, 685
537453217693
102. 64103. 0776.18
121.5
115.9123.0111.9112.967.7
133.4
1,27018854
146
172318391
1,717
1,645249
1557
••322233453311
1,3961,170
226
316
18313845
131811138
2
229136924314293328
5
622, 874487. 806487, 229251, 532
20. 835214, 862
577135, 067135, 067102, 635
21, 50010, 932
0
261115146
228, 92977, 979
533
210687
102. 89103. 3077.12
122.6
116.3123.5111.2114.368.3
134.4
1,26818660
146
174312390
1,406
1,2891494967
26512368
866
1,141921
97
260
206105101491815165
1198822674720872
437,652258, 679248, 584118, 24834, 30096, 03510, 095
178, 97356,16230, 92424, 0351, 203
122, 811
1427171
100,18481, 067
573
217681
102. 86103. 2777.20
122.7
116.8123.7112.4114.369.3
133.1
1,29818268
144
178310415
1,686
1,618382
3928
45094
336129
1,236891344
442
28515313215211031115
905234
332223108
1292
855,196635,063614, 064309, 822
11,695292. 546
21, 000220,132191,132139, 82449, 725
1,58329, 000
36226597
353, 502146,137
576
216677
102. 95103. 3677.00
122.4
116.6123.7112.6113.666.1
132. 5
1,29017980
144
183292412
1,611
1, 454292
7582
449334
94174
1,162746400
441
2541011531838098
53
32820412293306117170
883, 559782, 831772,831375, 689
0397,142
10, 000100, 72795, 72773, 21419, 8702, 6435,000
25215597
405, 77671, 803
553
205665
102. 63103. 0676.42
122.8
116.5123.5112.7113.264.0
133.2
1,25017797
144
186232413
1,225
1,08830911226
4461702293710
779653106
437
18010971
251198
1934
7
16512931
22531
192371522
703, 418351, 770329, 770211, 877
15,170102, 72320, 000
351, 649351, 649317, 49832, 920
1,2310
24617076
r 109, 692' 29, 927
530
201652
102. 49102. 9275.32
122.9
115.0123.2112.5109.261.9
133. Qf Revised. §Small amounts for "other corporate," not shown separately, are included in the total net proceeds, all corporate issues, above.IData except for June and December are from the New York Stock Exchange.® Includes data for nonprofit agencies not shown separately.tSee note in the A pril 1946 Survey regarding revisions in data for 1944. Corrections in January to March 1946 figures shown in March to May 1947 issues of the Survey (thousands
of dollars): New capital—total and domestic total, January, 203,847; February, 122,819; domestic corporate, February, 47,616; refunding—domestic total, March, 310,674.fRevised series. The classification of Reconstruction Finance Corporation loans was revised in the November 1943 Survey (see note in that issue); the figures include payments
unallocated, pending advices, at end of month. There have been unpublished revisions in the 1941-44 data for security issues compiled by the Securities and Exchange Commissionas indicated from time to time in notes in the Survey; and revisions in the 1945 data as shown in the September 1946 and earlier issues; all revisions will be shown later. For an ex-planation of the revision in the price series for municipal bonds and data beginning February 1942, see p. S-19 of the April 1943 Survey; earlier data will be published later.Digitized for FRASER
http://fraser.stlouisfed.org/ Federal Reserve Bank of St. Louis

August 1947 SURVEY OF CURRENT BUSINESS S-19
Unless otherwise s ta ted , s tat is t ics th rough 1941and descriptive notes may be found in the1942 Supplement to t he Survey
1947
June
1946
June July August Sep-tember
Octo-ber
Novem-ber
Decem-ber
1947
Janu-ary
Febru-ary March April May
FINANCE—Continued
SECURITY MARKETS—ContinuedBonds—Continued
Prices—ContinuedU. S. Treasury bonds (taxable)t- dol. per $100 bond..
Sales (Securities and Exchange Commission):Total on all registered exchanges:
Market value§--_ thous. of dolFace value§ do
On New York Stock Exchange:Market value§ doFace value§ do
Exclusive of stopped sales (N. Y. S. E.), facevalue, total thous. of dol
U. S. Government doOther than U. S. Government, total . . .do
Domestic doForeign . _ _ do ..
Value, issues listed on N. Y. S. E.:Face value, all issues mil. of dol
Domestic _ _ .do _Foreign do
Market value, all issues _ doDomestic do. .Foreign do
Yields:Domestic corporate (Moody's) percent..
By ratings:Aaa doAa _ doA doBaa . do
By groups:Industrials doPublic utilities doRailroads _ _ _ _ _ _ _ _ _ _ do
Domestic municipals:Bond Buyer (20 cities) .. ._ doStandard and Poor's Corp. (15 bonds) . do
U. S. Treasury bonds, taxable f do
Stocks
Cash dividend payments and rates, 600 cos., Moody's:Total annual payments at current rates.-mil. of doL.Number of shares, adjusted millionsDividend rate per share (weighted average)..dollars..
Banks (21 cos.) . doIndustrials (492 cos.) doInsurance (21 cos.) doPublic utilities (30 cos.) - doRailroads (36 cos.) do
Cash dividend payments publicly reported:*Total dividend payments __ mil. of dol._
Manufacturing doMining _ doTrade doFinance _ . doRailroads.. doHeat, light, and power . doCommunications . _ doMiscellaneous do
Prices:Average price of all listed shares (N. Y. S. E.)
Dec. 31, 1924=100--Dow-Jones & Co. (65 stocks; _dol. pershare.-
Industrials (30 stocks) doPublic utilities (15 stocks) . doRailroads (20 stocks) . do
New York Times (50 stocks) doIndustrials (25 stocks). doRailroads (25 stocks) _ do
Standard and Poor's Corporation:Combined index (402 stocks) 1935-39=100..
Industrials (354 stocks) doCapital goods (116 stocks) doConsumer's goods (191 stocks) do
Public utilities (28 stocks) doRailroad? (20 stocks). __. do
Other issues:Banks, N. Y. C. (19 stocks) doFire and marine insurance (18 stocks) do
Sales (Securities and Exchange Commission):Total on all registered exchanges:
Market value thous. of doL.Shares sold thousands
On New York Stock Exchange:Market value thous. of doL.Shares sold thousands..
Exclusive of odd lot and stopped sales (N. Y.Times)-. thousands..
3hares listed, N. Y. S. E.:Market value, all listed shares mil. of dolNumber of shares listed millions—
104.1
70,077386
69, 69163, 5906.101
137, 058134, 932
2, 126140, 148138, 574
1,574
2.81
2.552.642.833.21
2.602.723.10
1.811.922.22
2, 310. 25954. 65
2.423.212.512.591.982.66
77.361.26
173. 7633.9844.86
115.12195. 8534.41
119.1124. 1111.9126.4100.897.6
94.7117.0
17,483
66, 5481,829
105.3
83,43897,833
73,70691,898
84,033256
83,77777,6096,168
136, 648134, 281
2,367142,406140, 474
1,932
2.71
2.492.592.733.03
2.592.702.85
1.411.552.16
1,943.39941. 47
2.063.212.012.581.812.71
517.3288.150.033 345.932.537 813 516 2
99.177.59
207. 3242.5166 64
144. 63237 1652.11
153.2156.9142.7166.7130.4161.8
115.9136.9
1,409,68356, 794
t, 149,18035, 865
21, 717
80,9291,686
104.9
73, 74390, 590
69,45985,918
79,886181
79, 70572, 4737,232
136, 596134, 257
2,339141,407139,513
1,894
2.71
2.482.592.723.03
2.582.692.86
1.511.602.18
'1,960.85941. 47
2.083.21
••2.042.581.812.71
394.5152.1
4.329.787.217.046.348.0
9.9
95.875.02
202. 2740.9663.22
140.10231.2148 99
149.6153. 4138.9162.7127.7153.6
116.5134.7
1,223.12447, 768
1,014, 33832,188
20, 595
79,1321,719
104.1
72,69194,121
69, 34690, 244
78,010279
77, 73172,4415,290
136,714134, 441
2,273140,958139,137
1,822
2.73
2.512.622.743.03
2.582.702.89
1.581.652.23
'1,957.89941. 47'2.083.21
'2.032.581.822.71
166.378.7
.95.6
28.95.3
40.5. 2
6 2
89.673.81
199. 4440.9361.45
136. 45225. 9746.93
146.4150.4135.2159.3125.3147.1
118.7133.9
1,163,51345,915
982,46132,196
20,807
74, 3501,738
103.3
104,881167, 352
99, 647160,265
149, 259468
148, 791142, 298
6,493
136,838134, 569
2,269139,784138,015
1,769
2.79
2.582.682.803.10
2.642.752.98
1.731.752.28
1,954. 89941.47
2.083.212.032.581.822.65
455.1276.923.940.931.817.334.812.616.9
80.262.66
172. 7235.0549.59
118.36198. 4938.24
125.4128.8114.6136.9109.7119.0
107.5119.4
1,902,71781,805
1,616,63160, 438
43, 450
66,8641,750
103.6
85,870131,885
81,197125, 782
112, 738392
112,346106, 488
5,858
136,880134,644
2,236140, 245138, 520
1,726
2.82
2.602.702.843.15
2.652.763.05
1.661.842.26
2,002. 26954.65
2.103.202.052.591.882.59
342.1146. 5
4.123.051.912.445.147.511 6
79.361.10
169 4834. 5847.28
114. 00191.6536.58
122.3125.9112.4132.3107.2110.2
105.0113.8
1,296,65454, 552
1,103,15138, 919
30, 384
66,1151,756
103.7
66, 55197,458
62,10191,836
95,127225
94, 90289, 201
5,701
136,787134, 584
2,203139, 521137,827
1,694
2.82
2.592.692.843.17
2.662.773.05
1.781.802.25
2,065.80954.65
2.163.202.122.591.902.76
160.586.84.29.9
24.02.0
31.2. 3
2 1
78.561.77
168. 9435. 2349.24
114.14190. 3237.97
120.6123.8111.5130.0105.5113.3
108.5115.8
1,118,02951, 669
950, 90436, 955
23,819
65, 7411,764
103.9
121,416161,049
116, 541154,937
127, 553265
127, 288120, 544
6,744
137,165134, 995
2,170140, 793139,139
1,653
2.83
2.612.692.833.17
2.662.773.04
1.851.972.24
2,110. 73954.65
2.213.202. 192.591.902.77
963.1561.174.190.298.144.446.114.334.8
'81.663.97
174. 3851.1836.77
118. 34197.2939.59
125.5128.9117.9133.5109.8118.8
108.7117.6
1,273,03556,527
1,074,02139, 723
29, 834
68, 5951,771
104.3
100, 265136, 235
95,470130,028
125,491126
125, 365118, 519
6,846
137,006134,859
2,148140,966139,310
1,656
2.79
2.572.652.793.13
2.632.733.00
1.811.922.21
2,128.87954. 65
2.233.212.222.591.922.75
434.5160.9
2.950.092.419.448.250.110.6
82.463.78
176.1036.5549.56
119.06199.9238.21
125.2128.5117.6133.8110.7114.7
106.2122.3
1,100,00647,312
918,46332, 628
23, 557
69,6271,779
104.4
73, 249100, 247
68, 97995,349
79, 98798
79, 88974, 5305,359
137,106134,956
2,150141,033139, 373
1,660
2.78
2.552.642.793.12
2.612.723.00
1.971.992.21
2,195. 70954. 65
2.303 212.322.591.952.75
190.589.1
1.29.6
29.58.0
51.0. 3
1 8
81.165.83
181. 5437.1751.74
122. 29204 8239 77
128.7132.6121.6139.7111.4118.8
103.9125.8
1,143,78653, 518
943, 86134,109
23,758
68,8391,786
104.6
67, 52289, 587
63,18781,491
75,58235
75, 54768,8606,687
136,937134,808
2,132140, 978139,336
1,641
2.79
2.552.642.803.15
2.612.733.02
1.902.022.19
2,195. 70954. 65
2.303.212.352.591.952.66
492.5308.525.445.325.822.736.39.9
18.6
79.463.64
176. 6636.0249.15
118. 07198. 4637.70
123.7127.7117.1133.5107.3109.9
101.2122.4
927,88837, 227
770,10325, 302
19,337
67, 6081,792
104.6
68, 97494, 673
64, 39388, 961
81, 601828
80, 77374, 8855,888
137,219135, 044
2,174140, 833139,172
1,662
2.78
2.532.632.813.16
2.602.713.03
1.891.982.19
2, 224. 33954. 65
2.333 212.402.591.962.66
388.9162.7
5.935. 155.921.647.549.610.6
75.761. 04
171. 2834. 5245.88
113. 74192. 5134.86
119.3123.1113.0126.7104.6102.2
94.7118.8
979, 76645,116
825, 73032, 338
20, 620
64, 5201,794
104.5
71, 02498, 349
63, 88090,458
82, 526140
82, 38675, 8636,523
137, 019134,856
2,163140,426138, 797
1,629
2.79
2.532.632.823.17
2.602.713.05
1.831.952. IS
2, 310. 25954. 65
2.423.212.502.591.962.66
159.285.9
1.39.6
18.25.4
35. S. 3
2.6
74.459.49
168. 6733.3943.60
' 109. 67186. 5732.78
115.2119.0108.0121. 4102.095.1
95.0114.0
883, 66240,181
739, 20927, 854
20, 616
63, 6461,814
r Revised.§ Since March 18, 1944, United States Government bonds have not been included in these data.*New series. For data for dividend payments for 1941-42, except for minor 1942 revisions, see p. 20 of the February 1944 Survey; revisions in the 1942 figures shown on that page
and 1943-44 figures are on p. 31 of the February 1947 i?sue.t Revised series. Revised figures through 1943 for prices and yields of U. S. Treasury taxable bonds and a description of the data are on p. 20 of the September 1944,Survey.
Yields through December 1945 for partially tax-exempt Treasury bonds are shown in the April 1946 and earlier issues of the Survey.
Digitized for FRASER http://fraser.stlouisfed.org/ Federal Reserve Bank of St. Louis

S-20 SURVEY OF CURRENT BUSINESS August 1947
Unless otherwise stated, statistics through 1941and descriptive notes may be found in the1942 Supplement to the Survey
1947
June
1946
June July August Sep-tember
Octo-ber
Novem-ber
Decem-ber
1947
Janu-ary
Febru-ary March April May
FINANCE—Continued
SECURITY MARKETS-Continued
Stocks—ContinuedYields:
Common stocks (200), Moody's percent..Banks (15 stocks) ..doIndustrials (125 stocks) _ ..doInsurance (10 stocks) doPublic utilities (25 stocks) doRailroads (25 stocks) do
Preferred stocks, high-grade (15 stocks), Standard andPoor's Corporation percent-.
5.14.65.03.55.17.3
3.76
'3.63.73.43.13.94.8
3.46
3.73.73.53.23.95.2
3.43
3.93.83.83.24.25.6
3.44
4.44.04.13.64.66.5
3.57
4.43.94.33.54.76.3
3.65
4.64.04.43.64.86.9
3.70
4.53.94.43.54.66.6
3.76
4.54.24.43.34.66.6
3.74
4.74.24.63.34.76.8
3.71
4.84.44.73.44.96.8
3.72
5.14.65.03.64.97.3
3.75
5.34.65.33.75.07.5
3.76
FOREIGN TRADE
INDEXESExports of U. S. merchandise:
Quantity 1923-25=100..Value .doUnit value do
Imports for consumption:Quantity __. . -doValue doUnit value do
Agricultural products, quantity:!Exports, domestic, total:
Unadjusted ...1924-29=100 _.Adjusted _ do
Total, excluding cotton:Unadjusted doAdjusted do
Imports for consumption:Unadjusted doAdjusted d o —
SHIPPING WEIGHT*
Exports, including reexports mil. of lb_General imports _.__ do__.
VALUE§
Exports, total, including reexports.. thous. of dol__Lend-lease* do
By geographic regions:Africa doAsia and Oceania doEurope doNorthern North America doSouthern North America doSouth America -do
Total exports by leading countries:Europe:
France doGermany doItaly doUnion of Soviet Socialist Republics (Russia)..doUnited Kingdom . .do
North and South America:Canada - doLatin American Republics, total do
Argentina doBrazil doChile ._ do.._-Colombia* _. doCuba doMexico. doVenezuela* .do
Other regions:Australia . . . doBritish Malaya .__ doChina doEgypt doIndia and dependencies doJapan . .doNetherlands Indies doPhilippine Islands doUnion of South Africa do
General imports, total--. doBy geographic regions:
Africa -doAsia and Oceania. doEurope. - . . . .doNorthern North America doSouthern North America - . . . doSouth America do
330
148
30, 84012,716
1,241,726276
466,019
220230105
12411695
118161
173210
19, 2759,679
877, 68357,194
42,166157,933370,099117,80488, 859
100,823
62, 5777,983
37, 23448,09062, 919
114, 925180, 27213, 62227,1927,43715,10622, 77942, 48120,124
5,854412
58,1393, 49.419, 84116, 9779,49425, 65222,007385,943
20,05078, 20866,95668,37555, 64996, 697
202217108
13913295
107153
156187
94112
23, 53412,490
825, 57037, 092
31,832130, 312379, 853123,83677,09482, 593
52, 79611, 09840,14638,07973,160
121,198151. 90314, 62826,1245,64510,99817, 23138, 20913, 315
7,3782, 052
42, 2201,891
17, 20216, 94610, 51221, 25115,645
433, 758
26,954101,32870, 51180,50669,20785, 250
218231106
130130100
95128
127131
112
24,64811,623
883, 29333, 809
43, 789137,854354,879137,08096,168113,224
46, 38215, 63631,00442, 67170, 755
134, 236199,48619, 79733, 2337,73016,38224, 75244,16619, 990
5,420809
39,9533,01015, 73820,28610,74917, 82325, 219425, 413
33,75690, 80663,07578, 01862, 48997, 533
154168109
120118100
10187
89101
21,07811,419
642, 71112, 477
27, 55399,470234,137135, 65179, 293
27, 5308,51821, 65112, 53166, 812
133, 784137,16613,06420,0475,7349,12414, 88445, 74411,093
5,114472
24,6702,11716, 76314, 2172,04018, 01913, 896
377, 564
20, 21086, 59358, 27381,30551,99479, 753
127142112
120124104
17, 28010, 571
536,6147, 587
16, 08167, 263168, 352158,20273,39553, 313
21,1902,3314,42411,10646,097
156, 252121, 39211, 95320,0913,6053,01013,14151, 5728,075
7,096803
19,0941,67814,1453, 5983,2888,3537,063
394,034
24, 66278,12463, 96890, 34052,31084,331
226260115
142147104
10276
136113
108117
18, 90610,904
987, 9128,557
53, 070121, 680388, 288157, 786120, 557144, 489
67, 49211, 68931,05616,039102, 586
153, 547252, 30629, 37947, 7607,47114, 21236, 43950, 33127,321
6,213779
35,4413,26115, 42812,4163,31125,40134, 358481,794
123, 40476, 25888, 07461, 094104,496
249291117
146156107
10890
160142
109112
17,44410,767
1,096,5267,201
46, 463208, 207362,113156, 202143,415180,777
54,66910, 94331,84614,07874,035
152, 752306, 29737, 85051,13811, 67221,12338,14357, 55431, 250
9.1402,57954,5902,85828,4356,3638,06958, 64623, 282535,832
22,978139, 23688,87793,09776, 938114,707
245294120
156168109
142144
141132
19, 74112, 305
1,114,4528,357
56, 357160, 783436,918149,080142, 223170,140
70, 81012, 61541,16824,671111,771
146,298292, 82831,97652,83511,79621,26639,43951,01127, 676
16. 7482,10335,9213,857
26, 5833,62711,80730, 21029, 312532, 986
29, 205152,82776, 31382,97975, 061116, 600
251305121
118133113
109128
158190
10096
20, 81510, 712
1,150,8313, 483
52, 512177, 270457,138150, 419140, 675174, 908
77,1039,595
45, 03215, 780103, 243
145,679287, 33636, 05556, 3409,12615, 22036, 49950, 41935, 902
8,3073,374
39, 7203,67725, 9432, 5395,43753, 00227, 719434, 778
21,172100, 58960, 04475, 52476, 932100, 516
350123
116136117
111128
162189
24, 26212, 286
,327,3051,710
73, 768213, 638483, 697185,146144, 662226, 394
73, 08113, 70449,1897,232
117, 354
181,351351,18766, 46465, 44511, 48119,93037, 22762,51530, 623
19, 5625,769
37, 3704,576
43, 4483, 57911, 28642, 93740, 000
444, 327
19,15998, 21749,67791, 64193, 45492, 120
274344126
123151124
141168
25, 69312,441
.,298,6022,037
68, 706177,172496,059188,353152,356215,955
76, 43214, 90055,3529,28193, 438
181, 511350,41349, 46461, 2409,919
21,23447, 57757, 00246,138
14, 2714,17226,1755, 537
38, 529283
9.77932, 04034, 656511,802
30,079100, 74465, 58390,932112, 659111,805
296'378128
121'142119
95117
150171
102105
31,57512, 792
,422,8783,800
86,806219, 997517,095210,305148, 641239,184
88.12317,89146,81927,11694, 512
203, 653369,65971,65368, 53512,38723,46742, 72556, 86239,118
24,4587,14541,3956,76541,6762.06316, 79833,06641, 763
'473,575
19, 795120,83058,40787,81786,026100, 701
' Revised.§ The publication of practically all series on foreign trade included in the 1942 Supplement but suspended during the war was resumed in May 1946 Survey. Export statistics
include lend-lease exports shown separately above, shipments by UNRRA and private relief agencies, and since June 1945 comparatively small shipments consigned to United StatesGovernment agencies abroad; shipments to U. S. armed forces abroad are excluded. Revised 1941 figures for total exports of U. S. merchandise and total imports are shown on p. 22of the June 1944 Survey; revised figures for 1942-43 for the totals and revised figures for 1941 and later data through February 1945 for other series will be shown later.
*New series. Data on shipping weight of exports and imports are compiled by the U. S. Department of Commerce, Bureau of the Census; they represent gross weight of mer-chandise exports and imports, including weight of containers, wrappings, crates, etc. Data beginning January 1943 will be published later. See p. 32 of the February 1946 Surveyfor annual totals for lend-lease exports for 1941-45; complete monthly data will be published later; all supplies procured through lend-lease procurement facilities are shown as lend-leaseexports although, since the program officially ceased to operate at the end of the war, the recipient nations have, with few exceptions, arranged to finance them prior to the exportationof the merchandise. Monthly data prior to February 1945 for Colombia and Venezuela will be shown later.
Digitized for FRASER http://fraser.stlouisfed.org/ Federal Reserve Bank of St. Louis

August 1947 SURVEY OF CURRENT BUSINESS S-21
Unless otherwise stated, statistics through 1941and descriptive notes may be found in the1942 Supplement to the Survey
1947
June
1946
June July August Sep-tember
Octo-ber
Novem-ber
Decem-ber
1947
Janu-ary
Febru-ary March April May
FOREIGN TRADE—Continued
VALUE §—Continued
General imports—Continued.By leading countries:
Europe:France thous. of dol._-Germany ...doItaly -doUnion of Soviet Socialist Republics doUnited Kingdom do
North and South America:Canada ...doLatin American Republics, total -do
Argentina doBrazil doChile doColombia* doCuba doMexico doVenezuela* -do
Other regions:Australia doBritish Malaya doChina.._ doEgypt doIndia and dependencies -doJapan - doNetherlands Indies doPhillippine Islands doUnion of South Africa do
Exports of U. S. merchandise, total doBy economic classes:
Crude materials -doCrude foodstuffs doManufactured foodstuffs and beverages doSemimanufactures ___doFinished manufactures do
By principal commodities:Agricultural products, total do
Cotton, unmanufactured doFruits, vegetables and preparations doGrains and preparations. doPacking house products do
Nonagricultural products, total.._ doAutomobiles, parts and accessories doChemicals and related products doCopper and manufactures ___ doIron and steel and their products .doMachinery do
Agricultural doElectrical __doMetal working _ doOther industrial do
Petroleum and products doImports for consumption, total do
By economic classes:Crude materials doCrude foodstuffs doManufactured foodstuffs and beverages doSemimanufactures _ doFinished manufactures _ do
By principal commodities:Agricultural, total do
Coffee doHides and skins doRubber, crude, including guayule... doSilk, unmanufactured ...doSugar ...doWool and mohair, unmanufactured ...do
Nonagricultural, total doFurs and manufactures doNonferrous ores and metals, total do
Copper, including ore and manufactures .doTin, including ore do
Paper base stocks _ doNewsprint doPetroleum and products do
1,228,295
472,644
4,80424
8,0997,225
15,230
66, 548147,96817.47140.4729,9759,783
26.62016,1848,041
7,9494,6499,9461,05917.62114, 689
6642,5979,717
858,033
'122,43579,193134, 521' 76, 731445,153
304,63152,81227, 76088,64648, 214553,40243,46346, 4242,952
35, 709125, 55311,96725.38117,17666, 26239,134
'371,686
"-121,08768,63640,148
* 77,053' 64, 762
••174,97746, 7794,1226,744
19,68315,14420,017
••196,70919,57220,0354,6395,146
13,96717.38211,320
6,44118
6,6717,823
12, 405
76,607147,31614,12827, 2908,149
14,45333,15120, 2828,373
18,48511, 79212,656
6519,46711,0952,7734,40214, 641
807,478
120,12253, 988165,15771, 279396,933
291,84050,42524, 57165, 54247,365515,63838,29740,0572,73835,345119,19414,10424,98516,34358,01635,903
••422,018
••163,01553,10152, 71184,63768,026
"• 190,01431,8447,149
14, 54814,26723,88028,530232,00430,50324, 5847,9076,26119,58821,36215,127
6,12423
6,2827,72111,512
74,715154,03713,91245, 9853,41813, 04825,36018, 39110,324
15,0418,2847,0612,89217, 53412,3782,4863,63615, 990
860, 405
138,55753, 340116,81581.383470,012
253,94758,85817,91162, 28435,280606,16051,62743,8273,53445,639137, 50417, 07432, 26015,35866,58843,135415, 371
152,20172,19343,43078,01868,426
201,65747,8866,657
19, 65412,63116,15925,411
213, 525' 22, 766
21,6834,9456,036
15,35720,92515,124
5,245149
4,5712,786
14,177
77,000125,29910, 90829,8704,754
14, 22419, 74914, 92211, 507
17,13914,4798,0411,345
20,5932,7803,2923,338
14,443626,942
115,58939,11881,56461,287329,385
187,24434,31613,66651, 54319,263439,69842,81730, 2571,994
30,83483, 72412, 04418, 5817,977
41, 37235,014378, 364
133,79260, 76138, 59976, 26268, 781
178,73036,8167,072
22, 5373,21112, 05223.459199,4648,36317,3646,513
89814,02620,80115,289
7,29841
5,1337,139
10, 269
88,167132,73913,90730,049
7,26311, 64423,93618,14013, 644
12, 71019, 7957,1231,7799,2902,2766,6093,635
13, 904528, 631
93,60129,00842,15050, 760313,245
121, 47516,99711, 52329,6434,338
407,28939, 80427,3911,205
26,75689, 67312.67723, 6089.477
39, 25327, 576396, 729
136,98959,01239, 27687,01773,819
176, 08432,0807,724
25, 562745
10. 38420,160220,469' 15,33925,4458,9693,80015,24522,83013,290
7,372403
9,5441,809
18, 476
84,110159, 77623,01637, 7926,71916, 55029, 27619, 9849,973
11,82219,0935,1837,05827,61814,3075,6605,89110, 363
967, 476
173,18351, 340107, 72582, 914551, 961
290, 47870, 56219,42871, 49413, 377
675,19775,97444,6514,82744,843148, 27316, 29435, 49014, 57474, 23736,007470, 239
161,75777,31347,35288,12895,192
229, 34643,90911,59530,93413,92215,41319, 441
240, 80914,17926, 5359,5804,21713,02126,31812,981
8,610125
8,00415,94414,224
90,187185,610
37,2778,77020.14236,16823,44110,523
7,72415,34711,5933,31224,94425,9178,04411,1959,064
1,083,238
135, 23168,347149,720105,381624,559
321,00257,43744,18496,34419,272
762, 23670,81657, 1116,256
51, 236154,43818,60040,60514, 54271, 20441,513497,550
169,04691, 25948,078101,14588.021
252,38150,43310,25625,57824,24717,03517,111
245,16924,66232.14312,5112,77814.02225,91614, 753
6,167252
5,3929,00616,892
79,278183,57916, 38251,4824,64818,17627, 55325,02414,201
14,14849, 77215,5721,068
27,9018,4454,54510,9658,629
1,094,442
133, 87962, 515132, 503114,370650,630
290, 35147, 71336,02689,22418,535803,47972,35952,4246,18457,157166, 33319, 34438,11919,86779,15537,137537, 669
210, 514112, 20738,04295, 66981,269
308, 91462,8968,65551,2055,94318,12222,665
228, 70914,79629, 7427,3433,76218,20823,76319, 379
3,53170
3,276817
19,020
74, 274169, 91616,90037, 5044,931
18,35134, 07721,36113,711
8,51628, 89113, 2061,354
19,4873,7621,8929,7794,715
1,132,221
139, 64065,807
136, 606115,595
' 673,339
'300,67660,97232,711
110,70518,124
'829,68074,74853,5334,979
52,116162,94919,14840,97914,03180,19448,532
423,350
128,83886, 03943, 27990,92574,271
226,22656,8496,38832,3882,884
26,91217,697
197,1844,434
27,5688,6251,46618,08721,00418,429
4,502218
3,3141, 24511,200
89, 755175,8328,767
29, 3678,18620, 25942, 80123,42917,072
16, 81315, 69910, 271
61022, 059
7752,519
17, 0575, 672
1,304,499
149, 57681, 225135, 941147, 032790, 493
316, 25460, 74827, 332120,38519,692
988, 24595, 87567,4056,625
70, 237191, 36524, 64948, 57517,80888,84450,192
434, 483
123, 58790, 23751, 27493, 73975, 647
230, 26554, 2065,670
19, 9921,109
34, 86122, 586
204, 2186,648
25, 4799,026
915,90625, 98721,620
5,073531
3,8256,255
18, 099
89, 442215, 29213,29442, 73411,80518, 51561, 23822, 26313,733
15,91821,1645, 955936
19, 218813
2,78015, 8755,297
1,280,408
129,81581, 472129, 279145, 796794, 046
279, 72045, 58819, 086125,12521, 206
1,000,688104, 68467,9275,935
71, 789202, 05228,81847, 43718, 45795, 54953, 928
483, 646
133, 699109, 75067, 69195, 50277, 003
268, 60266, 599r 5, 97723, 937
4350, 78021, 338
215, 0447,085
30,1078,0742,41017,18727, 04820,309
3,856766
3,6734, 46616, 824
85, 072176, 33018,83926, 76314,12014, 47744, 58617, 46613,134
15, 20643, 21211,917
95413,234
8042,584
17, 8968,207
'1,408,487
143,42480, 031144, 528171,308869,196
289,17841,13421,457126,89532, 807
1,119,309114, 90777, 9687,11179,012
246, 33031, 23355, 64021,129124,18859, 931
455, 400
160,06661,18553, 962103, 49476, 740
233,12132,0207,261
47,83757
34,31120, 893
222, 3279,187
35, 78916, 571
85320,52128,66721,879
TRANSPORTATION AND COMMUNICATIONSTRAN SPORT ATION
AirlinesOperations on scheduled air lines:J
Miles flown, revenue thous. of miles..Express and freight carried thous. of lb._Express and freight ton-miles flown* thousands. _Passengers carried (revenue) ; number..Passenger-miles flown (revenue) thousands. _
Express OperationsOperating revenue ..thous. of dol__Operating income do
Local Transit LinesFares, average, cash rate cents..Passengers carried! .__ thousands..Operating revenuesf thous. of dol..
8.05801,478,911
26, 7018,7442,390
1,094,982558,839
25,626
7.8835,580,541
115,800
27, 9659,9242,669
1,163,349565, 731
25,79873
1,580,540 1,555,2507. 9306555,250
114, 300
28, 95812,0113,173
1,301,161619,136
26,134
7. 97221,569,230
115, 700
28, 24315, 0303,644
1,241,438608,196
26, 41073
7. 98051,539,190
112, 900
28, 30118,3114,623
1,149,481553, 405
28,08469
7.98321,645,700
121, 400
25, 04616, 4354,390
979, 666465,015
28,32787
7.98321,591,280
116, 500
27,17324,0216,321
999,167503, 478
31,223
7.99151,627,260123, 600
22, 50212,3313,602
725,141376, 339
25,83855
8.01651,627,630
119,800
22, 51212, 6153,827
740,206368, 017
25,35579
8. 02201,481,063108,700
25,46417,4495,116
972,899
25,64561
8.02751,607,269116, 200
25, 31817, 2354,788
1,076,848519, 516
25,11250
8. 04141,591,152118, 200
25,08264
8.05801,605,975120,100
r Revised. §See note marked " § " on p. S-20.*New series. Data prior to February 1945 for imports from Colombia and Venezuela will be shown later. See note marked "%" regarding the new series under airlines.fRevised series. Data for local transit line revenues beginning in the April 1944 Survey and passengers carried beginning in the May 1945 issue are estimated totalsf or all local
transit lines; revised data beginning 1936 will be published later.{Data have been revised to exclude operation of feeder lines and to include Colonial airlines formerly excluded and, for passengers and passenger miles to cover revenue passengers
only. Revised earlier data, including data for the new series on express and freight ton-miles, will be published later.Digitized for FRASER http://fraser.stlouisfed.org/ Federal Reserve Bank of St. Louis

S-22 SUKVEY OF CURRENT BUSINESS August 1947
Unless otherwise s ta ted, s tat is t ics th rough 1941and descriptive notes may be found in t he1942 Supplement to the Survey
1947
June
1946
June July August Sep-tember
Octo-ber
Novem-ber
Decem-ber
1947
Janu-ary
Febru-ary March April May
TRANSPORTATION AND COMMUNICATIONS—Continued
TRANSPORTATION—ContinuedClass I S team Railways
Freight carloadinss (Fed. Reserve indexes):Combined index, unadjusted .1935-39=100 _
Coal doCoke do. __Forest products doGrains and grain products doLivestock doMerchandise, 1 c 1 - doOre -- doMiscellaneous . - do
Combined index, adjustedf - doCoalt doCoket doForest products __ -do __Grains and grain products! do. __Livestock! doMerchandise, 1. c 1 - do __Oret doMiscellaneous! do
Freight carloadings (A. A. R.):<g>Total cars „ thousands
Coal ._ _ do . .Coke doForest products doGrains and grain products doLivestock . doMerchandise, 1. c. 1 __ __ _ _ . _ doOre., __ do___Miscellaneous do
Freipht-car suplus and shortage, daily average:Car surnlust thousandsCar shortage* do
Financial operations (unadjusted):!Operating revenues, total thous. of dol__
Freight _. doPassensrer .__ . do . .
Operating expenses doTaxes, joint facility and equip, rents._ ._ _ doNet railway operating income . __do_. _Net income - do
Financial operations, adjusted:!Operating revenues, total - mil. of dol
Freight . doPasseneer _. __do__ .
Railwav expenses doNet railway operating income . . _ doNet income do .
Operating rpsnlts:Frpicht carripd 1 mile mil. of tonsRevenue per ton-mile . centsPassengers carried 1 mile . millions
Waterway TrafficClearances, vessels in foreign trade:©
Total IT S ports thous. net tonsForeign doUnited States do __
TravelHotels:
Average sale Per occupied room __ dollarsRooms occupied _ percent of totalRestaurant sales index avg. same mo. 1929=100-.
Foreten travel:XT S citi7pns arrivals numberTT S cif!7pns dpDarturps doEmigrants do
Passports issued cf doNational parks, visitors _ numberPullman Co.:
Revenue passenger-miles thousands.-Passenger revenues . . _ thous. of dol.
COMMUNICATION STelephone carriers: 1[
Operating revenues thous. of dolStation revenues doTolls, message _ _- do _.
Oppratins? pxppnses doNet operating income doPhones in service, end of month .thousands
Telegraph and cable carriers: §Operating revenues, total. . .^ - thous. of dol._
Telegraph carriers total doWestern Union Telegraph Co., revenues from
cable operations* thous. of dol_.Cahle carriers do
Net operating revenues doNet income trans, to earned surplus do
Eadiotelegraph carriers, operating revenues do
1421411701511438773
28614613714117314514010874
184142
3, 543708
5418820049
464324
1,555
1115
696,909556, 88984, 787
550, 0578C\ 65160, 201
4.7593
248
21, 831902, 034
13714613815512896
' 8 0213139133146140149
'12511881
137135
3,436725
45193
••18254
'510246
' 1, 482
187
611,998458, 539106, 605517,363'56.810' 37, 825
14, 620
638.7488.6102.9586.152.619.8
53, 524.921
5,387
7,2022,1795,022
4.2094
250
27,00927, 7082,166
13.45121,802
621, 794
1,774,79710,951
190, 708104,15371, 898
143,15323,61427,340
16, 67715, 521
6221,156
13, 5251,242
8711,661
143145172153166135
7826314213914517715313916678
164141
3,407668
52181228
74471289
1,444
514
674,040513,252112, 383542,16469.06962, 80632,051
650.8500.0103.0602.5
48.316.1
55, 236.989
5,720
7,5093,0294,481
4.2389
232
29. 32734. 201
2,90713.65122.437
1,075,421
1,666,97010,373
192,187103,58973,777
154, 21418,35927, 608
17, 91516, 673
6381,242
14,5251,155
7001,618
145152177165142113
77243146141152184157131118
77162145
4,478925
7025425580
611347
1,936
324
710,224546,130112,115555, 89272,63881,69352. 544
664.3512.6100.0613.3
51.018.4
59, 466.979
5,712
8,0253,3234,701
4.4596
254
33, 38734,281
1,88410, 98818, 505
1,152,584
1,637,26110, 470
194,230103, 72675, 726
152, 34620, 84627, 908
17, 57316, 437
5941,136
19, 838* 1621d S, 089
1,667
149160181166140120
792451501381601831541259175
164139
3,517743
5519719163
477269
1,521
221
660, 402515,62395. 361
529, 79863. 24167, 36239,070
672.8528. 595.7
604.668.236.5
56, 399.975
4,927
6,2202,7753,445
4.3394
236
34. 40927,9531,764
10, 86914,536
695, 958
1,499,6179,903
191,642105,05471,612
147,63621,17128,156
16,56815,372
6101,196
15,453d 865
* 1,1981,517
14915518015414219782
216151139155183146142128
79157139
3,680755
57192200112519249
1,597
231
709,938566,96889. 345
5.58, 42466, 39585,11957, 280
663.1521.891.3
606.057.124.8
60, 848.988
4,466
4,9862,9592,027
4.3695
226
29. 63924, 755
8729,563
14,470271,570
1,408,9129,458
200,127108,87275, 978
154,86422, 39128, 463
17,59016, 275
6201,315
15,673<* 289d 6141,641
141117166148144171
8416915413711716615114713683
157148
4,22071264
222248117642240
1,974
1233
6*58,160522.806
85, 510536,081
58,00564,07438,066
663.0524.389.4
601.261.829.4
54,8731. 0074,267
6,8432,7294,114
4.4490
241
29. 59731,178
3,0909 739
13,500118,066
1,165,4088,429
196,489107, 775
73,343151,471
22, 50428, 754
16,65315, 380
5951,273
14,4666
dSl1,607
131132163139152118
7845
13914013215515616212281
145148
3,02259948
166207
63473
491,416
1624
637, 241493. 531
92, 716549, 828d 15, 581102, 99588, 775
658.1520. 591.0
523.0135.198.0
52, 712.997
4,543
5,7682,0093,759
4.1684
208
30.92337, 782
11, 21814, 18687,287
1,149,3139,059
203, 627110, 477
77, 363159, 27223. 87829, 067
17, 94816, 553
7171,395
15, 549698320
1,990
138163184147157118
7444
139150163175163157123
77176152
3,168759
5616721668
44548
1,409
420
685, 541551,05082, 450
538, 96888, 85557,71828,822
698.3559.086.0
623.874.541.8
57,0191.0344,120
6,2222,3783,844
4.2590
214
17,98997,348
1,378,28410, 214
203, 553111,64976,009
157, 46420,45529, 249
17,68816, 330
5991,358
14,863590138
1,714
133149182159144897443
136142149171166147110
76172145
3,179736
5819520249
46149
1,430
331
635, 940518. 61570, 766
509, 38083, 41543,14614,382
696.4564.878.4
630.965.432.7
51,8331.0703,486
6,2962,4553,841
4.3792
213
18,468122,349
1,160,6468,677
197,097109, 98271,051
149, 04822,06829, 564
16. 23314,984
5341,249
13, 50352068
1,642
137147182159146967950
144146147180159159121
78171151
4,170917
73260265
67620
691,910
336
717, 826592,18671,411
649. 36895. 67672, 78243,147
723.05fe4.672.2
641.881.148.1
59, 4851. 0553,529
6,8702,7534,116
4.3792
214
20. 294137,189
1,179,7848,857
207,168112,80678,111
157.19823, 62529,874
17, 53016,134
5711,396
14, 2981,093
8731,775
1341191691481339880
157145137119173148151111
79184147
3, 23354753
18319154
505164
1,536
1220
689, 456564. 807
70, 414543, 301
87, 74558. 41032, 580
684.9555. 872.9
637.447.6
'15.2
53, 9351. 1153,489
7,6153,2914,324
4.8692
240
20,166205, 603
1,063,8678,094
154, 63297, 75440. 943
132, 9735,887
30, 448
23, 26421, 892
5341,372
16, 6444. 3992,6761,609
1441551831541219476
267146142155185148138104
76184145
4,376922
7223321366
593369
1,909
515
724, 432591, 68777, 349
557,31891, 38575, 72946,360
698.0565.378.2
633.264.832.5
60, 00$1.0553,729
9,646-4,3675,278
4.4692
244
20, 962442,191
1,060,8118,018
611
16. 3872,1401,0621,637
r Revised, d Deficit. ® Data for August and November 1946, March and May 1947 are for 5 weeks; other months, 4 weeks.% Revised data for May 1946. $36,029,000 deficit.O Data continue series published in the 1942 Supplement; data for December 1941-February 1945 will be published later. <? Passports to American seamen were included for
the period February 1942-July 1945. 5 Data relate to continental United States.§ Compiled on a new basis beginning 1943; see April 1944 Survey for 1943 data and reference for revised 1942 data.•New series. For comparable data beginning 1943 for car shortages and surpluses and an explanation of a change in the latter series, see p. S-21 of December 1944 Survey.fRevised series. See note marked " * " regarding car surpluses. Revisions for 1939-July 1942 for the indicated indexes of car loadings are available on request. Revisions for
January 1937-February 1943 for the adjusted series for financial operations are available on request.• Data have been revised beginning in the May 1947 Survey to include all revenues from cable operations; figures shown previously include only transmission revenues.
Digitized for FRASER http://fraser.stlouisfed.org/ Federal Reserve Bank of St. Louis

August 1947 SURVEY OF CUEEENT BUSINESS S-23
Unless otherwise stated, statistics through 1941and descriptive notes may be found in the1942 Supplement to the Survey
1947
June
1946
June July August Sep-tember
Octo-ber
Novem-ber
Decem-ber
1947
Janu-ber
Febru-ary March April May
CHEMICALS AND ALLIED PRODUCTS
CHEMICALS !
Inorganic chemicals, production:*Ammonia, synthetic anhydrous (100% NH3)®
short tons__Calcium arsenate [100% Cas(AsO<)2] tbous. of lb_.Calcium carbide (100% CaCa) short tons__Carbon dioxide, liquid, gas and solid (100% 002)0"
thous. oflb.-Chlorine short tons..Hydrochloric acid (100% HC1) do .—Lead arsenate thous. of lb_.Nitric acid (100% HNO3)® short tons..Oxygen mil. cu. ft..Phosphoric acid (50% H3PO4) .short tons._Soda ash, ammonia-soda process (98-100% Na2 CO3)
short tons..Sodium bichromate doSodium hydroxide (100% NaOH) doSodium silicate, soluble silicate glass (anhydrous)*
short tons__Sodium sulfate, Glauber's salt and crude salt cake
short tons__Sulfuric acid (100% H3SO4) do
Organic chemicals:Acetic acid (syn. and natural), prod.* thous. of lb_.Acetic anhydride, production* doAcetyl salicylic acid (aspirin), production* doAlcohol, denatured:!
Consumption (withdrawals) thous. of wine gaL.Production doStocks do
Alcohol, ethyl:!Production thous. of proof gal..Stocks, total do
In industrial alcohol bonded warehouses doIn denaturing plants do
Withdrawn for denaturing - doWithdrawn tax-paid do
Creosote oil. production* thous. of gal._Cresylie acid, refined, production* thous. of lb_.Ethyl acetate (85%) production* doGlycerin, refined (100% basis):*
High gravity and yellow distilled:Consumption doProduction __doStocks do
Chemically pure:Consumption . doProduction __ _doStocks do
Methanol, production^Crude (8(1%) thous. of ga l -Synthetic (100%) do
Phthalic anhydride, production* thous. of l b . . .
FERTILIZERS
Consumption, total* thous. of short tons..Midwest States* .doSouthern States© do
Exports, totalt long tons..Nitrogenous t doPhosphate materials! doPrepared fertilizers! do
Imports, total! doNitrogenous, total!... do
Nitrate of soda! doPhosphates! do .Potash! do
Price, wholesale, nitrate of soda, crude, f. 0. b. cars, portwarehouses© dol. per 100 lb_-
Potash deliveries __.short tons..Superphosphate (bulk):f
Production doStocks, end of month __ ___do
MISCELLANEOUS
Explosives (industrial), shipments ..thous. of lb._Gelatin:!
Production, total*. doEdible! do. . .
Stocks, total* do—Edible! d o —
Sulfur:*Production _ long tons..Stocks do
13,67714, ISO1,981
23,79227,03525,341
1,60426,0592,377
34080
260
802,128855,352
51,048
3,8472,9016,3742,787
359,3133,456,082
60, 6094,116
43,124
78,54596, 42027, 4384,874
55,418869
67, 717
308, 6236,285
148, 741
35,020
58, 200724,766
25,88342, 546
676
14, 64512, 3828,965
18, 600110,53937,01473, 52522, 8343,579
10, 3691,9036,542
6,8655,319
16, 591
5,3797,634
21,894
2365,8787,739
30866
24285. 78313,62968, 202
313114,554105,132
83, 5562,210
0
1.65077, 868
642,983667,144
47,122
3,1222,0386,1192,652
304, 4723,861,525
65,0486,438
48, 716
88,13798, 31427, 960
1,84857, 066
90465,858
361,0566,864
160, 347
39, 224
55, 669728,546
26, 20644, 521
572
14,77014,8319,642
16,61998, 54534,23964, 30627, 3774,684
11,1802,1819,877
6,1754,118
14, 821
5,2495,558
21,122
2386,7538,921
368159208
110, 51919, 80183, 362
53472,40959, 59828,279
0
1.65073, 575
679,777740,853
42,190
2,7501,9325,8182,628
347,936
75, 7948,081
53, 399
96,571102, 55029,519
25359,1441,008
74, 574
364,1787,254
163,615
36, 915
56,988753,817
26,93539, 954
460
17,61016, 0448,082
19, 98186, 47431, 78854,68629, 2675,733
12,1362,3398,122
6,2865,211
13, 234
5,7456,864
22, 017
2346,8238,467
367144223
101, 53913,17080, 474
77658,34551,89113, 5213,040
0
1.92572, 34S
701,522720,517
47,327
3,1422,1664, 9582,180
356,355
77, 4922,60853,940
78, 786104, 20629, 7891, 62454,136
99773.795
358, 6286,601
164, 652
34,714
57, 346755,378
24,46441, 209
574
18, 94616,0195,131
17.79672, 36828, 77943, 58929, 2744,36412, 7442,2847,334
6,0894,621
12, 805
4,9246,59422, 539
2186,5929,334
559158401
80, 8627,388
63, 394809
69, 26663, 87711,7161,463
0
1.92569, 690
721, 475709, 781
50, 307
2,9471,9004,7262,315
335, 300
80,8291,916
57, 074
74, 890108,17432, 3942,259
61, 6861,062
80, 673
382,0267,066
168, 708
41.188
63, 683822,833
27,66246, 376
710
21, 29118,9132,744
18, 74358.18929, 51228, 67634,9385,28413, 5702, 4568,745
5,3954,63812, 207
5,8206,13621,130
2646, 5939,276
58463522
95, 7962,871
86, 791253
80,94167, 57326, 9297,809
0
1.92570, 263
754,215667, 912
51,187
3,2021,6523,8641,743
333, 041
80, 3801,330
55, 312
62, 04897,13530,150
2, 86563. 277
1, 00682,020
368, 3027,176
153,275
34,442
52, 494838,040
27, 71845, 033
1,010
19, 74419, 6252,633
18, 02542, 35126,75115, 60036, 0865,202
13, 0272,100
10,170
5,2445,832
12, 709
5,2635,126
18, 054
2506,674
11, 246
52982
44883, 544
3,43070, 2542, 125
64,43455, 71223,1413,446
0
1.92572, 770
750, 940736, 357
45, 300
3,3112,0553.9991,824
355,179,874,808
82,123754
51, 830
56, 787102, 628
30, 7143,726
62, 4601,028
79, 788
385,3696,665
165,186
32, 479
64,878878,078
31, 72548, 703
965
17, 41617, 0142,200
20, 51832,80025, 7457,054
31, 2003,910
13, 4811,8179,602
5,9787,431
15,163
5,7916,042
18, 392
2216,505
10, 994
928195734
104, 3365,577
83, 7524,720
39, 92825, 096
1,3276,835
18
1.92581, 044
783, 275796, 677
45,147
3,6562,2594,8572,299
351, 0283 769 368
85,1211, 765
50. 675
60,491110, 08835,1444,923
64.1381,101
78, 892
380, 5896,979
173, 449
39,991
66, 275888,912
35,15249,157
925
14, 63614, 6702,211
22, 39830, 22622,939
7, 28827, 775
4, 35014, 0382,094
10,185
7,0227,386
14,102
6,9637, 662
17,941
2767,145
11, 687
' 1, 459239
r 1, 22089. 47410,85464,1471,914
50, 02040, 72810,029
4040
2.04598, 555
830, 752815,611
47,092
3,8582, 5085,5482,878
321,415
85, 6631,543
45, 411
49,858101,717
33. 9663, 691
62, 1931,010
74, 926
350. 6345,954
156, 786
35,884
63, 208835,163
30, 67045, 6621,024
12,36111, 6051,423
18,98630. 95421, 5739,381
21. 4093,260
14, 6802,1427,084
6,8008, 234
15, 340
6.1388,573
18,106
'2306.681
10,847
1, 225182
1,04298. 94521,61666. 4012,448
51.94340, 8519,3583,759
0
2.07577, 839
824,578750,550
45, 017
3,7932,4075,7892,866
298. 5653,704,059 3,667,729
95,8591,221
52, 466
62, 449117, 03936, 9934,481
64, 6471,218
89,050
383, 7537,129
179,400
42,120
70, 059931, 237
33,62054, 206
832
12, 59412, 6831,520
19, 45628, 89122, 6766,21523, 6223,17514, 6962,2347, 902
7,4078,746
17, 544
6, 5558, 45018, 875
6,11,
244991690
1,120
9220,58,
1,
160960213851802449
116, 166103. 70465, 886
3, 579897
2.07595, 229
888, 875645,412
46, 444
3, 9542,2376,0782,988
350, 307
93,0072,32051,830
81,330109,05034,6375,470
64,2881,14682,452
367,8477,089
50,267
69,947865,447
30,37653,0861,043
13,46913, 6731,712
23, 55626, 85324,8002,05325, 2262, 55514,2712,4365,984
8,1277,65118,135
6,1398, 53119,137
2846,2069,605
954166788
132,89530,22689, 765
987145, 266117,10271,7384, 34613,301
2.07584, 207
"863, 787'599, 529
46,038
3,7002,4056,3692,922
333,531
97,1075,49256,286
96.487118, 28436,4063,71764,8261,188
82,655
396,2827,474
179,142
39, 726
74,473888,304
14,07713,8921,524
28.08229,34127,4721,869
25, 6752,170
7,4286, 60619,151
5, 9579,18120,789
644138505
141,78836,03794,580
636138,060108. 98880, 5554, 69611, 250
2.075
r892,045681, 235
51,296
4,1173,0286,4883,059
377, 218
' Revised, d* Data have been shown on a revised basis beginning in the March 1945 Survey.• Data were revised in the September 1945 Survey; see note in that issue. O For a brief description of this series see note in April 1946 Survey.® Data for nitric acid and ammonia include 2 additional plants beginning June 1946 and for the latter 1 additional plant beginning August 1946; see note in February 1947 Survey© Excludes data for Mississippi, which has discontinued monthly reports, beginning in the October 1946 Survey.§ See note in the April 1946 Survey with regard to differences between these series and similar data published in the 1942 Supplement to the Survey.!The indicated series, except data for alcohol stocks in denaturing plants (available only beginning 1942), continue series published in the 1942 Supplement; unpublished data
for 1941 or 1942 through February 1945, and corrected data for 1937-July 1945 for nitrogenous and total fertilizer imports, will be shown later. See also note marked " • " on p. S-24of the February 1947 Survey for further information on the series for ethyl alcohol and production of spirits at registered distilleries for industrial purposes.
*New series. See pp. 23 and 24 of the December 1945 Survey for data through 1943 for the indicated organic chemical series, except glycerin, and for ammonia, calcium carbide, oxy-gen, soda ash, and sulfuric acid (September 1941 revised, 572,579); data through 1943 for other inorganic ch< mical series have been revised or havt not been published and there have alsobeen recent revisions in the 1944-45 data for some series and 1944 data for sulfuric acid; all revisions will be published later. For a brief description of the series for glycerin see notein November 1944 Survey. Data for 1933-45 for fertilizer consumption by mid western States and the total, which are from the National Fertilizers' Association, and for 1935-Feb-ruary 1945 for the new series on gelatin, will be shown later. Data for 1940-43 for sulphur arc shown on p. 24 of the May 1946 Survey.
f Revised series. See note in November 1943 Survey regarding change in the superphosphate series. Data beginning January *1946 include operations of one company whichwas producing in 1945 but whose activities were not included in figures for that year; however, this change does not appreciably affect the comparability of the data.
Digitized for FRASER http://fraser.stlouisfed.org/ Federal Reserve Bank of St. Louis

S-24 SUEVEY OF CURBENT BUSINESS August 1947
Unless otherwise stated, statistics through 1941and descriptive notes may be found in the1942 Supplement to the Survey
1947
June
1946
June July August Sep-tember
Octo-ber
Novem-ber
Decem-ber
1947
Janu-ary
Febru-ary March Apri l M a y
CHEMICALS AND ALLIED PRODUCTS—Continued
NAVAL STORES
Rosin (gum and wood):Price, gum, wholesale " H " (Sav.), bulk
dol. per 1001b..Production* . _ . ...drums (520 lb.)Stocks* . do. .
Turpentine (gum and wood):Price, gum, wholesale (Savannah)t dol. per gal..Production* bbl. (50 gal.) ~Stocks* . .do.
7.58
.61
6.76416,690364,179
145, 47777, 440
6.95
.96
i.76
.84
7.40489,676390,781
1.00167,93390,167
7.80
1.05
7.83
1.30
8.07462, 007398,102
1.24143,055101, 295
9.61
1.15
9.65351,875222, 701
1.00113,52098,205
9.24
O I L S E E D S , O I L S , F A T S , AND B Y P R O D U C T S
Animal, including fish oil:Animal fats: t
Consumption, factory thous. of lb_.Production doStocks, end of month . _ do
Greases :tConsumption, factory . . . d oProduction doStocks, end of mon th . do
Fish oilsttConsumption, factory. doProduction doStocks, end of month . do
Vegetable oils, total:Consumption, crude, factory __.mil. of lb__Exportsd" thous. of lb._Imports, totalcf do
Paint oilsd*- doAll other vegetable oilsd* do
Production mil. of lb._Stocks, end of month:
Crude doRefined do
Copra:Consumption, factorycf short t ons . .Importscf - - . . doStocks, end of monthd" do
Coconut or copra oil:Consumption, factory:!
Crude thous. of lb._Refined do
Importsd1 . . . d oProduction:
Crude! doRefined ... do
Stocks, end of month:%Crude doRefined-. . _ do
Cottonseed:Consumption (crush) . thous . of short tons . .Receipts at mills doStocks at mills, end of month do
Cottonseed cake and meal:Production short tons . .Stocks at mills, end of month . . d o
Cottonseed oil, crude:Production thous. oflb._Stocks, end of month do
Cottonseed oil, refined:Consumption, factory! do
In oleomargarine doPrice, wholesale, summer, yellow, prime (N. Y.)
dol. per lb .Production thous. of lb._Stocks, end of mon th . _ do
Flaxseed:Importscf thous. of buDulu th :
Receipts doShipments doStocks do
Minneapolis:Receipts d o . . - .Shipments _ doStocks do _
Oil mills:*Consumption doStocks, end of m o n t h . . . do
Price, wholesale, No . 1 (Minneapolis) dol. per b u . .Production (crop estimate) thous. of b u . .
Linseed cake and meal:Shipments from Minneapolis thous. of lb
Linseed oil:Consumption, factoryt— - doPrice, wholesale (N. Y.) dol. per lb._Product ion! . . . t h o u s . of lb._Shipments from Minneapolis _doStocks at factory, end of month do .
Soy beans:Consumption, factory! thous. of bu._Production (crop estimate) do .Stocks, end of month do .
13107
30, 44987,614
23, 28620,144
.24135, 750
203, 856
77478
128202516
6.12< 38,374
26,160
.325
~13~626
102, 231136,182162,986
44,98238,07890,569
13, 31913,87658,906
26831,0546,4383,5592,879
235
48S475
21, 40834,23824,333
24,8888,148
0
27,18812, 729
85, 53710, 258
••509
100
' 21, 787' 41,341
"• 15, 563' 24, 538
67, 51313, 504
.143' 32, 220316, 318
788
278482292
134620
2,4702,789
3.35
24,840
45, 737.155
50, 52220,100
115, 468
12,051
" 22," 753
97, 229193,029180,883
40,23845,042
103, 285
13, 40827,87479,276
21917, 45712,3518,2904,061
261
503407
20, 23942,84637,710
14, 2188,571
0
25,2478,173
92, 3669,257
4260
118
18, 23431,628
13, 51823,333
65, 77416,132
.16314,982
263,154
642
114231175
554173261
3,6922,739
3.79
95,743194,810171, 286
46,76443,87992, 241
15, 64724,87093, 304
26416, 81717,86311, 0856,778
255
499321
31, 29436, 97548, 551
30,70916,055
945
39, 61416, 603
100, 8807,780
111140
37, 97227, 765
26,02127,114
82,16316, 501
()21, 354
197,152
377
210133194
2,725481
1,202
2,7893,309
3.95
86, 59561,731
145, 205
39,55027,69878, 390
15, 46521,540
108,211
2558,361
12,0016,2325,769
279
515267
37, 51035,96038,662
42, 70720, 4370)
47,41722,815
105,97410, 541
227446359
98,62952,276
69,80763, 245
61, 32113, 461
()26, 591
157, 322
97
629448
3,174751
3,219
2,3433,6444.00
73,125135,936135,550
42.10636, 66663,173
17,02818,726
121,676
3687,660
25.10719,3655,742
390
521250
36, 27827, 38112,964
49,74727,724
121
45,30626, 614
95, 4418,607
5151,070
914
228,93658, 277
160,01193,603
93, 54322,832
.268116,300165, 771
591387652
2,752547
3,967
2,1503,488
5.22
24,960
41, 603.176
75,88420,400
121,810
12,957
" 16," 702
41,700
46, 652.168
57,29022,980128, 814
11,955
~"9,~176
27,840
43, 227.178
46, 49423,040128, 653
9,033
~~i,~ 793"
34,020
44, 246.188
42, 62426,760126,136
10,929
~40~235~
97, 477260,976179, 567
39,29146,00063,123
18,97610, 812114,682
41610,01533,97321,11212,861
409
519247
15,94943, 49533,074
38,57717,236
380
18,82716, 305
77, 7939,622
525703
1,091
232,89280,913
164,961101,983
129,16027,101
.262138,120165, 735
48
1,9381,3961,194
1,8771,9413,905
2,2842,849
7.26
37, 200
42,302.354
44, 71227, 840
136, 550
15, 054
"56," 989
116, 785242, 506232, 347
45,00345, 63764,907
18,3747,867
116,786
41814, 56151,81741,904
9,913403
538262
44,12593, 76858, 654
44, 65516,438
0
54,83019, 505
90,9659,797
397338
1,032
176,065119, 928
124,78698, 093
113, 76925, 279
.280126,973171,157
20
2111,077
327
75073
3,889
1,8833,362
7.275 22,962
34,080
41,891.358
21,720152,069
15, 669196,72560,021
129, 026303, 997307, 623
48,68852, 59172, 871
18, 5091, 616
107, 320
43127, 09031, 94227, 274
4,668443
534279
56, 06974, 96389, 781
62, 87126, 6481,088
68, 68330, 909
87, 00512, 376
412151771
181, 204158, 905
129, 368105, 959
108, 24030,116
.302113,015170,239
307
479257
3,513
1,7902,024
7.25
33, 960
44, 978.366
34, 82320, 460
140,898
17,115
140, 495262, 265307, 692
45, 73047, 48467,138
18, 7721,260
102, 400
4125,634
46, 54531, 31415, 231
392
550304
51, 35251, 28571,902
64, 27029,8221,822
63, 02432, 749
97,17713, 935
300104575
132,015158, 675
93, 50486, 564
81, 66428, 008
.350103, 872182, 808
14
4069
303
182146
1, 5451,415
3)
144,102221,840286, 602
45,86444,58664,305
20,290777
79, 211
4177,011
32,69721,73710,960
382
556311
59,16372, 31972,777
74, 34931, 2175,549
73,90236,581
115,72213,228
21135
399
92,738126,818
68, 24872,088
73,35124,474
.38983,789
191,326
18
3569
270
311190
2,280
1,6361,0798.51
119, 584230,470339,877
42, 57246, 73569, 983
20, 3651, 577
66,335
3957.291
36,67728,3438,333
356
557353
59, 214.61, 92577, 541
72, 40631,057
813
74,04335,720
130,01114,267
16421
256
71, 216125,477
53,47551, 591
53, 07714, 485
.31471,126
207, 411
19
739
238
532345
1,615
1,560980
7.50
24, 420
41, 575.378
30, 49919, 380
136, 681
15, 983
28, 740
45,174.395
31,40123, 460
125,060
16,490
30, 720
47, 453.394
28,85025,380
131,769
15, 914
56,104 52, 338 41,977 I 41,6r Revised. 1 Less than 500 pounds. 2 No quotation. 3 No sales. i July 1 estimate. 5 December 1 estimate.d*Data continue series published in the 1942 Supplement; unpublished data through February 1945 for the indicated series will be shown later.{Revisions for 1941-42 for coconut or copra oil production and stocks and linseed oil production and for 1941-43 for other indicated series are available on request.*New series. See p. S-24 of the May 1946 Survey for a brief description of the new series for turpentine and rosin and data beginning 1945; data beginning in 1942
later.t Revised series. See note on p. S-23 of the November 1943 Survey regarding change in the turpentine price series.
; data beginning in 1942 will be shown
Digitized for FRASER http://fraser.stlouisfed.org/ Federal Reserve Bank of St. Louis

August 1947 SURVEY OF CURRENT BUSINESS S-25
Unless otherwise stated, statistics through 1941and descriptive notes may be found in the1942 Supplement to the Survey
1947
June
1946
June July August
CHEMICALS AND ALLIED
Sep-tember
Octo-ber
Novem-ber
Decem-ber
PRODUCTS—Continued
1947
Janu-ary
Febru-ary March April M a y
OIL SEEDS, OILS, FATS, ETC.-Continued
Soybean oil:Consumption, factory, refined} thous. of lb_.Production:}
Crude __doRefined do
Stocks, end of month:}Crude _ doRefined do
Oleomargarine:Consumption (tax-paid withdrawals)§ _._doPrice, wholesale, standard, uncolored, (Chicago)
dol. per lb..Production! thous. of lb_.
Shortenings and compounds:Production doStocks, end of month doVegetable price, wholesale, tierces (Chi) -dol. per lb._
PAINT SALES
Calcimines, plastic-texture and cold-water paints:*Calcimines thous. of doL.Plastic-texture paints doCold-water paints:
In dry form doIn paste form for interior use do
Paint, varnish, lacquer, and fillers, total doClassified, total do
Industrial doTrade do
Unclassified _do
CELLULOSE PLASTIC PRODUCTS
Shipments and consumption: ®Cellulose acetate and mixed ester plastics:
Sheets, rods and tubes thous. of 1b.Molding and extrusion materials . . .do.. .Nitrocellulose, sheets, rods, and tubes. do...
.330
86,459
107,904105,136
137, 539116,356
34, 567
.16536,062
103, 86145,868
.165
96111
476244
66,07159,42223,65335, 7696,649
1,8266,7361,429
85, 466
116,50896,301
146,866103,110
37,232
0)47,262
100,89644,045
0)
73115
500269
65,20259, 25824, 25934, 9995,944
1,8837,1671,524
98,870
107,441106,081
131,65990,535
40, 781
0)43,402
134,92142, 503
0)
87135
534286
68,48261, 24026,06035,1807,242
1,5097,2421,539
89,810
82, 61288,106
116, 52277, 293
32,373
.19537,067
100, 74052,830.171
73129
454217
63,05455, 77324,01431, 7597,280
1,5357,0011,515
94, 787
98,841
111,75655,998
51,428
.27060, 271
127, 69451,442.171
135
555261
69,99163,15628, 21934, 9376,836
1,9777,4721,697
106, 744
134,303120,031
108,59152, 604
56, 550
.42062, 966
157,00641, 578
0)
64146
420371
70,13662,48327,37435,1097,652
1,0735,9841,233
95, 542
137, 262121, 932
98, 53861,758
57, 680
.41259, 771
139, 76041,305
0)
101186
329286
73, 53866,13130, 34235, 7897,407
1,6917,9511,506
107,954
151, 554126,298
97, 71270,131
66,262
.39367,946
131, 75451, 391
0)
93254
403307
83, 78874, 21032,40541,8049,578
1,9207,6571,597
104, 827
141,115120,867
97, 22676,995
66,470
.39467, 755
129, 31548, 311
0)
89227
352329
81,63273, 27329. 92843,3458,358
1,4817,0811,319
113,782
145, 013121,389
94, 05373, 993
66, 626
.42469, 914
138, 55151,184
0)
102292
422348
92,11182,01732, 54049, 47710, 094
1,6106,4611,22k
101, 229
141, 456115,877
89, 30291, 327
39, 376
.42046, 716
99, 86766,178
0)
75235
419334
• 99, 51Q• 89, 296• 34, 338' 54, 95910, 220
1,7625, 3571,329
71, 893
135, 88992, 640
108,868114, 806
36, 493
.35437, 730-
63,15149, 9950)
90227
407312
99,41188, 57932, 35756, 22210, 831
1, 6894, 3171,052
ELECTRIC POWER AND GAS
ELECTRIC POWERProduction (utility and industrial), total*.mil. of kw.-hr.
Industrial establishments* doBy fuels* ...doBy water power* _ _._do
Utilities (for public use), totalf .doByfuelsf _.. .doBy water powerf . doPrivately and municipally owned utilities doOther producerst- -do
Sales to ultimate customers, total (Edison ElectricInstitute)!—. ._. mil. of kw.-hr.-
Residential or domestic doRural (distinct rural rates) ..doCommercial and industrial:
Small light and power! doLarge light and poweii do
Street and highway lighting! doOther public authorities!. .doRailways and railroads! doInterdepartmental! do
Revenue from sales to ultimate customers (EdisonElectric Institute) __.thous. of dol_.
GASfManufactured and mixed gas (quarterly):
Customers, end of quarter, total thousands..Residential (incl. house-heating)... doIndustrial and commercial do
Sales to consumers, total mil. of cu. ft_.Residential doIndustrial and commercial do
Revenue from sales to consumers, total.thous. of dol__Residential (incl. house-heating) ..doIndustrial and commercial do
Natural gas (quarterly) :Customers, end of quarter, total thousands._
Residential (incl. house-heating) doIndustrial and commercial do
Sales to consumers, total mil. of cu. ft..Residential (inel. house-heating) doIndustrial and commercial _ do
Revenue from sales to consumers, totaL.thous. of dol.Residential (incl. house-heating) doIndustrial and commercial _. do
24, 4694,2253,825
40020, 24413, 4516,793
17, 4142,829
21,4413,8183,381
43717,62410, 943
6,68115,2122,412
15,1852,954
443
2,6177,963
147459550
51
278,544
11,39410,687
133,35588,85643,139
122,18192,05529, 245
9.1718,554
612508,141129,143361,315159,85385,17772, 265
22,5833,9633,551
41218, 62012,204
6,41616,0452,575
15, 6082,883
470
2,7188,309
154464558
52
279, 659
23,6694,1553,788
36619,51513,389
6,12516, 7832,731
16,4742,900
548
2,815
16846857251
286,945
22, 7883,6833,674
30918,80513,1695,636
16,1232,682
16,3583,018
489
2,8258,800
184455537
50
288,041
11,31910,616
694110, 83470,11339,657
7107,83580,92326, 214
9,2598,654600
465,984,
73,020383,859131,16556,38373,393
24,4304,2083,867
34120,22213,9356,287
17, 3162,906
16, 7213,130
410
2,8219,064
206471572
47
292,587
23,9433,9943,675
31919,94913,6696,280
17,1192,830
16,9333,414
328
2,9448,908
22246060949
300,489
24,8754,0283,672
35620, 84714, 2696,578
17,8423,005
17,4503,739
302
3,0188,832
236600667
55
310,910
11,41110, 687
714146, 400
98, 47446,171
130,15597, 74331,345
9,4788,812
661573,015161, 021400, 202188.587101, 25685, 239
25,9574,3213,896
42521, 63614,500
7,13618,5453,092
18,3024,149
291
3,1759,219
23351167451
326,460
23,6984,0833,683
39919, 61613, 2616,355
16,8332,783
17,7833,960
295
3,142
204506643
46
320,174
25, 5444,2983,843
45521, 24613,981
7, 26518, 2662,980
17, 7723,727
320
3,0269, 285
200491673
50
313,074
11.22410, 502
713198, 580139,47657.139
159,188119,31838, 714
9,7398,999
734728, 393297, 553422, 05:270, 598171,93596, 797
24, 6524,1483,711
43720, 50413, 2167,287
17, 6612, 843
17, 6653,572
421
3,0709, 264
17849461846
310, 762
25, 009=4, 2033,809-
42420, 77613, 3877, 389
17, 8012, 975
17, 6103,437
514
2,9949,375
165475604
46
310, 025.
r Revised.- * No quotation. J Minor revisions for 1941-43 are available on request.§For July *941-June 1942 revisions see February 1943 Survey, p. S-23; revisions for July 1942-June 1944 are on p. 23 of the November 1945 issue; revisions for July 1944-June 1945
are on p. S-25 of the August 1946 issue; revisions for July 1945-June 1946 are on p. S-25 of the March 1947 Survey.• Data for some items are not comparable with data prior to 1945; see note for calcimines, plastics and cold-water paints at bottom of p. S-23 of the December 1945 Survey.! For 1943-44 revisions for the indicated series see notes at bottom of pp. S-23 and S-24 of the May 1945 Survey.<8> Data for sheets, rods and tubes are comparable with similar data in the 1942 Supplement; see note in September 1946 Survey regarding change in data for molding, etc. materials.• New series. For data for 1939-45 for production of electricity by industrial establishments see p. 32 of the February 1947 Survey.t Revised series. Gas statistics are shown on a revised basis beginning in the December 1946 Survey; see note in that issue. For revised figures for the indicated series on electric.
power production, except the series for "other producers," see p. 32 of the February 1947 Survey; revised figures for 1920-July 1945 for "other producers" will be shown later.
Digitized for FRASER http://fraser.stlouisfed.org/ Federal Reserve Bank of St. Louis

S-26 SURVEY OF CURRENT BUSINESS August 1947
Unless otherwise stated, statistics through 1941and descriptive notes may be found in the1942 Supplement to the Survey
1947
June
1946
June July August Sep-tember
Octo-ber
Novem-ber
Decem-ber
1947
Janu-ary
Febru-ary March April May
FOODSTUFFS AND TOBACCO
ALCOHOLIC BEVERAGES
Fermented malt liquors:!Production _ thous. of bblTax-paid withdrawals... do...Stocks, end of month do...
Distilled spirits:Apparent consumption for beverage purposes!
thous. of wine gal.Imports! _ thous. of proof gal. _Production! thous. of tax gaL.Tax-paid withdrawals!- -do.Stocks, end of monthf do.
Whisky:Imports§ thous. of proof gal._Production! thous. of tax gal_.Tax-paid withdrawals! doStocks, end of month! .do
Rectified distilled spirits, production, total!thous. of proof gal..
Whisky do.Wines and distilling materials:
Sparkling wines:Imports! thous. of wine gal..Production! _do.Tax-paid withdrawals! ___do_Stocks, end of month! do.
Still wines:Imports! do.Production 0 do.Tax-paid withdrawals! _.do.__Stocks, end of month! .do
Distilling materials produced at wineries© do.
DAIRY PRODUCTS
Butter, creamery:Price, wholesale, 92-score (N. Y.)J._ _dol. per lb_.Production (factory)! thous. of lb._Stocks, cold storage, end of monthcf do
Cheese:Imports§ doPrice, wholesale, American Cheddars (Wisconsin)
dol. per lb__Production, total (factory)! thous. of lb._
American whole milk! .doStocks, cold storage, end of monthcT do
American whole milk doCondensed and evaporated milk:
Exports: §Condensed _ doEvaporated do
Prices, wholesale, TJ. S. average:Condensed (sweetened) dol. per case..Evaporated (unsweetened) do
Production:Condensed (sweetened):
Bulk goods* thous. of lb_.Case goods! do
Evaporated (unsweetened), case goods! doStocks, manufacturers', case goods, end of month:
Condensed (sweetened) thous. of lb . .Evaporated (unsweetened) do
Fluid milk:Price, dealers', standard grade dol. per 100 lb . .Production! mil. of lb . .Utilization in manufactured dairy products!._.do__
Dried skim milk:Exports^ thous. of lb._Price, wholesale, for human consumption, U .S .
average dol. per lb_.Production, total! thous. of lb._
For human consumption! do...Stocks, manufacturers', end of month, total do
For human consumption do
FRUITS AND VEGETABLESApples:
Production (crop estimate) __thous. of bu._Shipments, carlot no. of carloads..Stocks, cold storage, end of month thous. of bu...
Citrus fruits, carlot shipments no. of carloads..Frozen fruits, stocks, cold storage, end of month
thous. of lb .Frozen vegetables, stocks, cold storage, end of month
thous. of lb_.Potatoes, white:
Price, wholesale (N. Y.) dol. per 100 lb . .Production (crop estimate)! .thous. of bu._Shipments, carlot no. of carloads..
8,3427,9399,565
16,4166, 037
525, 828
9,9323,278
464, 825
7,0046,518
.633156, 30549, 617
)151, 995125, 735160, 307129, 480
8.265.18
116. 62012, 950410, 000
7,196440, 952
4.4112, 982
. 956102. 02090, 730114. 439110, 775
111.174'626292
13, 829
6,8446,3748,035
18, 5351,525
13,486' 9, 940
420, 262
7087,3823,933
374, 072
' 11,9588,991
56194168
1,225
414655
11,100102,014
7,938
.523120,74949,649
1,275
.295130,672
r 97, 646136,759110,807
5, 66738, 760
6.334.54
133,525-" 13, 075380,880
9,617220,331
3.4712, 5784,803
5,101
.143<• 92, 177' 89, 805
87, 745' 85, 978
7,3737,2097,881
19,0681,46716,01112,120
421, 390
7118,5264,903
376, 213
14, 45011, 764
48238167
1,291
532974
10,17791,99510,041
.694127, 33069,510
1,807
.371116, 62587,830148,786120,136
6,619135,652
6.795.09
112. 69410, 800
336, 600
11,119229,279
4.0011, 9274,685
20,992
.14673,40071,30082, 41378,930
6,7237,4766,888
19,3921,13015,53811,519
420, 947
6397,5044,870
377, 290
15, 03612,150
32241194
1,331
4395,00910,64385,43516,186
.705115,76584,980
2,699
.409106, 47081,010160, 272126,899
3,06689, 447
7.035.32
'98.22110, 400
291, 400
10, 826211, 680
4.2110,8384,226
23, 596
.14556,72555, 30068, 98465, 712
8, 4367 2287,838
17,6911,312
25,02011,115
420, 778
8338,5174,915
378, 902
14,41512, 484
39249166
1,400
31951,13310, 321129,09897,470
.768104, 83073,931
2,652
.43593, 33070, 340157,180126,084
2,95555, 233
7.785.46
'69,6858,250
242,000
12, 549202,775
4.439,4463,724
11, 683
.14739,84039,10062, 26759, 698
7,9487,1108,309
20,4081,611
31, 48813,184
418, 925
9699,2575,968
380,295
16, 20214, 429
46251254
44384,15212,065
206, 301144,854
.84097,49559,586
3,089
()83, 34060,785129,941101,185
1,97930, 767
7.925.79
' 52, 9897,450
195,600
11, 377171,026
4.628,9893,334
6,546
.14629, 41029, 06046, 88544,852
6,6106,5238,175
19,9331,447
20, 70312, 734
419,350
1,0337,8386,454
380, 557
15,10413,462
85184230
1,325
47020, 90911,538
216,77056, 709
.81681, 26041, 477
1,384
.44970, 50051,655123, 43592, 422
3,63439,791
8.255.88
6, 275169,100
8,701148,210
4.878,2972,809
14, 728
.14724,15023,80034,80932, 786
7,1366,4618,467
19,7391,219
31,80212,173
433,117
87319,7905,816
391,613
13,90312,178
192181
1,315
3313,6399,878
205,3659,987
.82289,03527.874
1,304
.39969, 68050, 920
123, 59293,873
15, 58046,037
8.255.88
'33,9566, 780
183, 550
5, 230129,464
4.968,5293,016
4,540
.14535.69535,10039, 54338, 299
119,410
6,8905,9659,134
14,871725
38,43712, 498
454,426
58224,5835,952
408, 517
13, 82912,528
2019268
1,429
2551,0997,392
197, 3131,743
97, 78518,224
652
.38374, 27555, 680
114,60687,459
8,91128,871
8.255.86
'34,1607,980
206, 300
4,923130, 902
4.948,9113,311
9, 594
.13146,08045,13045,94745, 600
5,7615,5439,067
13,455817
34, 54110, 070
473,163
71321,4624,640
423,841
11,16410,170
• 7
15249
1,521
232862
5,577190,155
1,303
.70991,720
389
.37077,11058,99098, 05374,795
4,27323,354
8.255.72
'38,6957,100
210, 200
4,346117,497
4.748,4913,205
10, 321
.11451,16049,93061,88661,213
6,2779,325
13,730791
32, 7579,804
492, 466
19,2724,557
437,770
10, 6359,621
22675
1,665
265535
6,634181,194
3,279
110,4807,818
487
()100, 61078,01593,42771,757
4,69425, 355
8.285.64
' 56, 3408,620
270,800
5,450118,926
4.689,8703,964
7,545
.10068,80066,60080, 23679,126
7, 4357,0299,399
11,974751
27, 4568,650
506, 031
71217,1234,449
449, 351
9, 3428,675
922151
1,826
171466
174, 5861,580
.631115,915
9,194
'455
.338116,84592, 615
113. 85488, 737
7,27523, 534
8.275.42
'82,80011, 750
321, 200
5,279148, 266
4.6310, 4724,364
16, 208
.10075, 45073,10078, 04776, 646
7, 9837,5119,538
12,1731,125
21, 4375,846
516, 738
1, 07114, 0993.183
457, 941
6, 6916,159
1313062
1,882
172390
5,682169, 984
1,040
.613145,890
r 17,445
355
.298144,140118,420133,495106,479
7, 54939, 517
8.265.23
111,87512, 750
417, 450
6,387278, 814
4.4612, 2605,490
14, 401
.9490, 80087 200
102, 973100,888
cf See note marked "cf" on p. S-28.
Digitized for FRASER http://fraser.stlouisfed.org/ Federal Reserve Bank of St. Louis

August 1947 SURVEY OF CURRENT BUSINESS S-27
Unless otherwise stated, statistics through 1941and descriptive notes may be found in the1942 Supplement to the Survey
1947
Juno
1946
June July August Sep-tember
Octo-ber
Novem-ber
Decem-ber
1947
Janu-ary
Febru-ary March April May
FOODSTUFFS AND TOBACCO—Continued
GRAINS AND GRAIN PRODUCTS
Exports, principal grains, including flour and meald"thous. of bu.
Barley:Exports, including maltd" - - do . . .Prices, wholesale (Minneapolis):
No. 3, straight dol. per bu_No. 2, malting do.__
Production (crop estimate)! -thous. of bu_Receipts, principal markets do . . .Stocks, commercial, domestic, end of month do . . .
Corn:Exports, including meald1 - -thous. of bu_Grindings, wet process . do . . .Prices, wholesale:
No. 3, white (Chicago)._.. -dol. per bu_.No. 3, yellow (Chicago) doWeighted average, 5 markets, all grades do
Production (crop estimate)! thous. of bu. .Receipts, principal markets - doStocks, domestic, end of month:
Commercial - ._do.On farms! do.
Oats:Exports, including oatmeald* doPrice, wholesale, No. 3, white (Chicago)-dol. per b u _Production (crop estimate)! thous. of bu.Receipts, principal markets do--.Stocks, domestic, end of month:
Commercial do...Onfarmsf _ do_.
Rice:Exportsd" pockets (100 lb.)__Imports d" doPrice, wholesale, head, clean (N. 0.) dol. per lb.-Production (crop estimate)! thous. of bu_.California:
Receipts, domestic, rough bags (100 Ib.)._Shipments from mills, milled rice doStocks, rough and cleaned (in terms of cleaned),
end of month bags (1001b.)._Southern States (La., Tex., Ark., Tenn.):
Receipts, rough, at mills thous. of bbl. (1621b.)._Shipments from mills, milled rice
thous. of pockets (1001b.)__Stocks, domestic, rough and cleaned (in terms of
cleaned), end of mo..-thous. of pockets (100 lb.)--Rye:
Price, wholesale, No. 2 (Minneapolis) dol. per bu_.Production (crop estimate)! thous. of bu._Receipts, principal markets doStocks, commercial, domestic, end of month do
Wheat:Disappearance, domestic! . .doExports, wheat, including flour d*.. do
Wheat onlyd"1 do . . .Prices, wholesale:
No. 1, Dark Northern Spring (Minneapolis)dol. per bu_.
No. 2, Red Winter (St. Louis) doNo. 2, Hard Winter (K.C.) . . d o . . . .Weighted av., 6 mkts., all grades do
Production (crop estimate), total! _thous. of bu._Spring wheat do.Winter \r wheat do
Receipts, principal markets doStocks, end of month:
Canada (Canadian wheat) doUnited States, domestic, totals ! do
Commercial doCountry mills and elevators! doMerchant mills._ _ doOn farms! _ do
Wheat flonr:Exports d" doGrindings of wheatt _ .doPrices, wholesale:
Standard patents (Minneapolis)! dol. per bbl__.Winter, straights (Kansas City)§- do
Production (Census) :JFlour thous. of bbl._
Operations, percent of capacity..Offal thous. of lb__
Stocks held by mills, end of month thous. of bbL.
LIVESTOCK
Livestock slaughter (Federally inspected):Calves _-_thous. of aminals..Cattle . .doHogs doSheep and lambs do~__
' Revised.
2.032.14
1284, 8678,2527,753
11, 794
2.142.101.95
'2,612,80940,223
11,233687,803
1.0211,247,454
12,182
5,0383259,148
.0901 75,485
299,875242,090
171,381
107
246
476
3.031 25,219
1021,024
2.722.592.372.56
1,435,551343,4291,092,112i 26,156
70, 4053 83,4443 8,1293 9, 797
3 24, 5913 40,427
12.6011.03
41, 542
570
1.431.45
4,6684,464
7,03610, 636
()1.531.40
11,103
15,904496,928
653
5,915
3,153274,862
646, 0123,742
.066
406, 543283,065
262, 672
25
253
591
2.85
72322
232,06833, 28323,869
1.901.941.861.90
41,005
46,791'100,0883 29, 917T 3 8,376812,8383 41, 606
2,00337, 556
5,94360.2
505, 660
28,632
245
1.611.66
8,2843,983
2,5089,469
2.322.172.03
23,924
11,864
337
25, 315
7,181
305, 3693,098.116
385, 943239, 752
280, 446
7
439
171
2.09
193"262
25, 54217,109
2.222.111.982.03
76,432
39, 487
90, 253
1,79447, 500
9.539.58
11, 25972.8
641,300
27, 347
402
1.611.66
18,25011, 554
9979,977
(a)
1.931.88
16,830
11,768
2,384.78
30, 832
15, 080
63, 68613,383
.066
219,032299, 916
144,392
495
184
485
1.95
23, 55215, 977
2.062.031.941.99
53,853
50,903
1,61251,442
8.768.72
12,17375.8
712,000
24,134
249
1.671.70
22,04618, 248
11110, 456
(a)
1.891.83
11,297
4,944153,003
3,872.81
25, 257
20,3191,155,691
141,8485,955
.072
56, 39952,842
123, 691
2,493
1,085
1,987
2.24
"1,1231,126
305, 54319,83510, 501
2.102.081.962.05
56,113
109, 723950. 286103, 595177, 329114, 463552, 715
1,98654, 210
9.259.19
12,07884.5
902,9002,205
12, 333
209
1.611.70
14.84026,161
38511, 652
2.101.821.63
18,062
4,076
946
18,922
19, 669
89, 5206,668
.082
1,363,897491,946
523, 274
4,713
2,323
4,624
2.39
799"1,612
1 6 , 7936,100
2.202.142.042.14
54,929
141,047
"98~392
60,069
9.559.38
13, 29882.7
,022,700
26, 987
1.621.72
8,02624, 510
48712,198
1.751.391.31
40, 562
14, 758
2,517.85
11,426
14,185
1,145,3341,551
901,952704,105
452, 766
2,564
2,684
4,708
2,143
23,36911, 563
2.332.252.102.23
36, 581
152,631
85, 512
2,51257, 690
10.9510.38
12, 74989.1
)86, 350
6561,3485,4341, 529 i
35,135
435
1.691.77
3 263,3509,21420,985
2,07612,313
1.501.341.25
23,287,92744,316
27,8702,165,776
1,703.83
31,509,86711,253
9,158898,828
1,608,42163
.0902 71, 520
860, 461703, 634
327, 526
1,377
1,868
4,365
2.79» 18,685
5962,476
307,60330,92014,995
2.272.322.072.17
21,155,7152 281, 8222 873, 893
33,868
148,849642,685
56, 256118,991
96, 779366,255
60,647
11.6110.90
13,36889.5
1,043,6883,216
5911,3525,1351,346
33, 569
271
1.701.78
10, 24120, 608
5,15212, 705
1.431.331.21
49, 913
31, 667
797.84
11,543
7,360
486,2021,328.090
863, 324601,980
327, 349
1,814
3,396
2.86
""469"2,465
27, 34911,141
2.252.332.092.18
38,254
131,889
48,432
3,44964, 575
11.5211.10
14, 23892.3
,112,708
° No quotation.
5911,4035,8441,542
42,347
572
1.641.76
4,80619, 313
9,14911, 701
1.511.421.31
43,643
34, 505
323.84
9,412
6,162
1,066,04918
.090
758,817556, 844
283, 938
426
1,449
2,441
3.11
322'2,336
32, 30412, 712
2.312.402.262.28
38, 716
119.006
44, 745
4,16957,162
11.6211.42
12, 60993.2
982, 960
5211,1433,8971,271
48, 515
624
1.841.91
7,24214,108
8,04512, 245
1.741.731.59
48,169
37,3871,294,709
1,187.94
14,667
6,321536,787
364,15682
.090
791,866393, 260
410, 004
210
1,114
1,588
3.54
3542,139
333. 06438,66017,542
2.712.812.692.67
35,030
109,849308,56332, 838
r 61,010' 71, 957139,855
4,49363, 301
13. 6612.99
13. 99191.4
1,091.2602,84:
6441,2283,4061,237
48, 370
797
1.811.92
9,62510,816
15,42112,091
1.781.781.69
38, 765
29,112
656.92
12, 887
5,389
523, 813r 2,033
.089
594,339478, 230
328, 858
134
702
1,048
3.11
"""238"1,878
31,49513.250
2.642.742.682.62
37, 807
93, 964
24,440
3,88256,818
13.1712. 97
12, 60482.3
9G7. 092
6781,2033,6161,322
50, 767
1,226
1.902.01
8, 4498,869
20, 70612.385
1.791.781.68
38, 736
16,282
775.99
14, 201
4,592
352, 9691,626.090
583,169495,971
233, 296
515
615
3.19
~""l381,358
28,0609,111
'2.682.712.692.64
26,345
80, 514
15, 803
4,03255, 744
12.7412.39
12,44581.1
930, 000
6271,2643,8311,355
621 294 542 534 364 6511,207 451 1,239 1,240 360 1,1033,653 2,316 3,863 2,843 438 3 ,114 '1,329 1,678 1,738 1,578 I 1,300 I 2,005
2 Dec . 1 e s t ima te .3 Includes old crop only; new corn not reported in stock figures until crop year begins in October and new oats and wheat until crop year begins in JulycfData continue series published in the 1942 Supplement but suspended during the war period; data for October 1941-February 1945 will be published latert Bata relate to regular flour only; in addition data for granular flour, collected for January 1943 to February 1946, are given in notes in the May 1946 and previous issues of the
trch-August
1 July 1 estimate.
ii -i uv nuvm ".viuuw ""^«» w..i.vv* uj ".v wviiiiiiuun,j ^n.uii. v\Ji|./uio.Liuu siwcu uu LuiLLia m us uvvij Kieei any woooen Dins nott Revised series. The indicated grain series have been revised as follows: Crop estimate for oats, 1932-44, and rice; 1937-44;'other crop estimates, 1929-44; domestic disappearance
of wheat and stocks of wheat m country mills and elevators, 1934-44; corn, oat and wheat stocks on farms and total United States stocks of domestic wheat 1926-44- all revisions areavailable on request. ~
Digitized for FRASER http://fraser.stlouisfed.org/ Federal Reserve Bank of St. Louis

S-28 SURVEY OF CUREENT BUSINESS August 1947
Unlessand1942
otherwise stated, statisticsdescriptive notes may beSupplement to the Survey
throughfound in
1941t h e
1947
June June
FOODSTUFFS
1946
July August Sep-tember
Octo-ber
Novem-ber
Decem-ber
AND TOBACCO—Continued
1947
Janu-ary
Febru-ary March April May
LIVESTOCK—Continued
Cattle and calves:Receipts, principal markets thous. of animals._Shipments, feeder, to 8 corn belt Statesf doPrices, wholesale:
Beef steers (Chicago) . . . .dol . per 1001b..Steers, stocker and feeder (K. C.) doCalves, vealers (Chicago). do
Hogs;Receipts, principal markets thous. of animals..Prices:
Wholesale, average, all grades (Chicago)dol. per 1001b..
Hog-corn ratiof—bu. of corn per 100 lb. of live hogs_.Sheep and lambs:
Receipts, principal markets thous. of animals..Shipments, feeder, to 8 corn belt Statesf doPrices, wholesale:
Lambs, average (Chicago) dol. per 100 lb__Lambs, feeder, good and choice (Omaha) do
MEATS
Total meats (including lard):Exports§ .. .mil. of Re-production (inspected slaughter) doStocks, cold storage, end of inonth®^1 do
Edible offal® doMiscellaneous meats and meat products® do
Beef and veal:Exports§ thous. of lb_.Price, wholesale, beef, fresh, native steers (Chicago)
dol. per lb._Production (inspected slaughter) thous. of lb._Stocks, cold storage, end of month®^ . . .do
Lamb and mutton:Production (inspected slaughter) doStocks, cold storage, end of month® c?1 do
Pork, including lard, production (inspected slaughter)thous. of lb_.
Pork, excluding lard:Exports§ doPrices, wholesale:
Hams, smoked (Chicago) dol. per lb_.Fresh loins, 8-10 lb. average (New York) do
Production (inspected slaughter) thous. of lb__Stocks, cold storage, end of month®c? do
Lard:Exports! doPrice, wholesale, refined (Chicago) dol. per Re-production (inspected slaughter) thous. of lb__Stocks, cold storage, end of monthcT do
POULTRY AND EGGSPoultry:
Price, wholesale, live fowls (Chicago) dol. per lb._Receipts, 5 markets thous. of lb_.Stocks, cold storage, end of monthef do
Eggs:Dried, production* doPrice, wholesale, U.S. standards (Chicago)* -dol. per doz. _Production! millions. _Stocks, cold storage, end of month:d"
Shell thous. of cases..Frozen thous. of lb._
MISCELLANEOUS FOOD PRODUCTS
Candy, sales by manufacturers ..thous. of dol._Cocoa, imports§ long tons..Coffee:
Clearances from Brazil, total— .thous. of bags..To United States... do.
Imports§ doPrice, wholesale, Santos, No. 4 (N. Y.)._dol. per lb__Visible supply, United States . .do . . .
Fish:Landings, fresh fish, 4 ports thous. of lb.Stocks, cold storage, end of month do._.
Sugar:Cuban stocks, raw, end of months
thous. of Span, tons..
2,384120
25. 8721.1124.00
2,329
22.0612.6
1,982134
24.250)
1,4907746654
.408670, 038118, 622
54, 823
756,848
2.572.529
556, 305355, 489
.195146, 690171, 540
.24434, 800
171, 679
.4145,202
4,178236,292
43, 684
1,057545
.2531,132
90, 600
3,642
1,730141
17.3015.7215.88
1,355
14.7710.1
2,52176
16.750)
1897974963130
39, 738
.203275, 75267, 850
65,14910, 378
456,591
47, 624
.265
.266360, 342322,433
57, 689.148
69,83734, 910
.26932,865173, 905
16,553.3325,085
9,871265,050
30, 46714,048
1,312837
2,298.1342,319
68,02397,806
r 2, 226
3,121176
21.3615.5317.10
3,070
17.948.6
2,28698
20.380)
2201, 581
39
29, 912
.319674, 96468, 444
68,8449,108
837, 553
49, 412
.410
.419667, 522299,755
52, 5550)
123,34843,590
.28338,138178,842
13,864.3404,284
9,537260,101
24,67819,433
1,6351,1631,480.2062,122
66,854126,837
2,059
2,565323
21.7115.5116.44
1,832
20.8411.6
2,187338
20.5016.53
1181,2863894027
20,926
.382664, 848101,825
65,05313,135
555,686
42,219
.503
.514425,735168,861
27, 665.350
94, 78037,969
.26543,162207,137
11,151.3463,679
7,960236, 256
34,05614,409
1,573970
1,947.2212,182
46,776152, 403
1,700
1,923388
17.9915.9916.15
293
16.259.1
2,542865
19.0017.26
613512582219
19, 691
.235210, 42379,051
54,2688,844
85,991
12, 737
.265
.33371,18199,859
11,679.190
10, 66530, 021
.30761,131184,841
4,735.4063,295
5,738207,244
39, 5059,405
814484
1,401.2212,142
53,727147,085
1,310
3,664730
23. 5716.4218.19
2,208
22.8213.5
3,660941
23.0017.90
131,2452972621
2,535
590, 79864, 521
84,17010,602
570,068
1,076
.265
.476462, 454142, 912
8,268.190
77,88831,513
.29889,972261,006
2,900.420
3,190
3,585168, 591
54,12213,942
1,448902
1,237.2411,931
53,786149,549
712
2,875445
23.6416.3018.38
3,244
24.0718.0
1,966304
22. 2517.77
321,7424423926
532
.409689,827111,091
64, 59115,696
987, 245
1,305
.554
.512757, 765209, 946
16,647.392
167,38140,623
.24272,952301,030
2,585.4063,110
1,717132, 664
56, 28712,237
1,416946
1,612.2632,080
35,025158,486
553
2,447233
23.1917.6318.20
2,993
22.8718.6
1,495121
23.2518.00
401,724
6235636
828
.415705,974169,271
58,72316, 893
959, 053
6,635
2.522.404
728, 500276, 232
20, 5210)
168,32668, 756
.26665,114
316, 577
3,946.388
3,765
767102,437
56, 85025,027
1,178729
1,716.264
1,584
24, 645152, 803
342
2,404154
22.1617.6822.13
3,469
22.4518.0
1,669171
23.2519.45
421,954
8546854
3,475
.384757, 702192, 660
68, 21517,114
1,128,378
5,040
3.609.427
827, 411399, 473
25,074.260
220, 245122,988
.24227,631
316,792
11, 744.388
4,568
28780,800
56, 850r 46, 248
1,5241,0812,103.269
1,385
15,365127,381
373
1,95098
21.9418. 9622.88
2,304
25.7019.4
1,406198
23.1220.18
581,434
8546857
8,377
.362631,697195,820
57, 38016, 554
745,090
3,768
2.529.509
555,330399,317
38, 760.298
138,683117, 557
.26623, 641
283,825
12, 749.378
4,813
22173, 564
53, 43920,390
1,109721
1,804.272
1,467
17,00397,939
1,019
2,290161
23. 3020.1322.90
2,017
27.1017.6
1,293133
23.1221.22
561,393
8577164
7,024
.371681, 465201,209
57, 64814,110
653,686
6,587
2.614.505
484,593397, 794
37,884.338
123,637109,254
.29927,199
242,485
11,031.418
6,171
50898,718
58, 24915,382
1,341818
1,663.277
1,335
29,10378, 242
2,109
2, 183131
22.9319.9120. 38
2, 245
23.49\ 14.9
1,506, 136
21. 2519.56
571,438
8436767
17,401
.370679, 933175, 724
60, 73710, 808
697,129
7,173
2.546.508
521,406394,421
28, 041.300
128, 445127, 680
.29226, 255
208, 256
9,067.425
6,328
1,742153, 876
55,91938, 078
1,184677
' 2, 044.258
1,357
30, 72570, 202
3,292T Revised. l No quotation. 2 Prices beginning December not strictly comparable with earlier data; comparable figure for November 1946, 0.545.§Data continue series shown in the 1942 Supplement but suspended during the war period; data for October 1941-February 1945 will be published later.cTCold storage stocks of dairy products (p. S-26) meats, poultry, and eggs include stocks owned by the U. S. Dept. of Agriculture and other Government agencies, stocks held
for Armed Forces stored in warehouse space not owned or operated by them and commercial stocks; stocks held in space owned or leased by the Armed Forces are not included.®See note in May 1946 regarding changes in the indicated series made in that issue and an earlier change beginning June 1944.• Data beginning in the May 1943 Survey are from the U. S. Department of Labor. Quotations beginning July 1943 have been for U. S. Standards; they are approximately com-
parable with earlier data for fresh firsts.1 For data for December 1941-July 1942 see note in November 1943 Survey.•New series. Data for 1927-43 for dried eggs are shown on p. 20 of the March 1945 Survey.fRevised series. The hog-corn ratio has been shown on a revised basis beginning in the March 1943 Survey; revisions for 1913-41 will be shown later. The series for feeder ship-
ments of cattle and calves and sheep and lambs were revised beginning 1941 to include data for Illinois; revisions for 1941-42 are shown on p. S-27 of the August 1943 Survey. Data foregg production have been revised for 1940-45; revisions are shown on p . 24 of the June 1947 Survey.
Digitized for FRASER http://fraser.stlouisfed.org/ Federal Reserve Bank of St. Louis

August 1047 SURVEY OF CURRENT BUSINESS S-29
Unless otherwise stated, statistics through 1941and descriptive notes may be found in the1942 Supplement to the Survey
1947
June
1946
June July August Sep-tember
Octo-ber
Novem-ber
Decem-ber
1947
Janu-ber
Febru-ary March April May
FOODSTUFFS AND TOBACCO—Continued
MISCELLANEOUS FOOD PRODUCTS-Con.
Sugar—ContinuedUnited States:
Deliveries and supply (raw value):*Deliveries, total __ .short tons..
For domestic consumption doFor export -do
Production, domestic, and receipts:Entries from off-shore areas doProduction, domestic cane and beet do
Stocks, raw and refined, end of month doExports, refined sugar§ doImports: §
Raw sugar, total doFrom Cuba do
Refined sugar, total doFrom Cuba do
Receipts from Hawaii and Puerto Rico:Raw _.doRefined _do
Price, refined, granulated, New York:Retain _dol. perlb._Wholesale do
Tea, imports§ thous. of lb._
Leaf:TOBACCO
Exports, incl. scrap andstems§ thous. of lb__Imports, incl. scrap and stems§ . . .doProduction (crop estimate) mil. of lb._Stocks, dealers and manufacturers, total,
end of quarter doDomestic:
Cigar leaf doFire-cured and dark air-cured doFlue-cured and light air-cured doMiscellaneous domestic.-. do
Foreign grown:Cigar leaf doCigarette tobacco _.do
Manufactured products:Consumption (withdrawals:)
Cigarettes:Tax-free* _ ..millions.-Tax-paid do
Cigars, tax-paid thousands..Manufactured tobacco and snuff, tax-paid-thous. of lb _.
Exports, cigarettes § millions._Price, wholesale (list price, composite):
Cigarettes, f. o. b., destination dol. per 1,000..Production, manufactured tobacco, totaL.thous. of lb.
Fine-cut chewing do__.Plug do. . .Scrap, chewing do. . .Smoking do__.Snuff . .do . . .Twis t . . . - - . do . . .
983, 474975, 552
7,922
544,243
.096
.081
3 2,101
29,097432, 527
18,791
6.509
598,604526, 605
71,999
478,3119,613
955,03161,897
189, 418179,666
15,00115,001
160,82730,150
.074
.0591,540
60, 7404,861
!,853
1962,168
2,44526,360452,18021,0842,427
6.25521,092
3024,2803,6359,3953,022458
590,347557, 23533,112
460,17213,173
824,64147,191
267, 460267,46047,34947, 349
179,9224,750
.074
.0601,336
36,9705,381
2,48725,440439,39620,9491,832
6.25521,078
3264,6573,9688,9092,721497
561, 69547,188
402, 29949, 780
671, 49133,844
157,171145,07249,93249,932
209,6621,709
.075
.0606,350
39,5955,608
2,66528,953500,57222,7331,967
6.25522,868
3744,6314,4379,4863,429511
533,875521,42812,447
297, 27594, 691519,72722, 546
126,958116, 52930,29430,294
128,7474,774
.076
.067
50,3226,031
327165
2,3893
2687
1,94426,865457,70321.6711,125
6.25521.672
3114,3613,8609,6183,061461
396,831392,0184,813
233,063483, 532832,0713,280
97,96092,81235, 09935,098
76,4241
().0743,846
54, 383
2,56132,778588,06725,6311,139
6.42425,674
3484,8214,62711,6763,640561
482,194475,9216,273
223,781642, 6331,209,820
6,734
180,167180,16723,64723, 647
2,5005,004
.092
.07616, 286
94,1296,551
3,16527,696546,94922,7281,523
6.50923,236
3154,0963,79411,2663,303462
456, 566418, 79037, 776
257,017437, 4711,441,53124,968
210, 784210, 78416,16016,160
42,8162,751
.095
.07811,486
60, 8614,817
4 2,312
3,282
303159
2,6833
3697
2,95922, 695
465, 76917,6362,714
6.50918,361
2963,5003,4257,4103,332
498,073482, 72215, 351
243,687106,8851,317,26222,095
219,672219, 66915,91315, 559
15, 6943
.095
.07912,891
55,05930,930
3,51928,451510,26420,1241,438
20,107311
4,3803,6807,7893,447
330, 256299, 23731,119
335, 22949,365
1,384,01215, 221
275, 488275, 48719, 41619, 416
40, 6923,802
.096
.0804,105
54, 6124,912
2,71326, 338446, 04217,3892,480
6.50917, 712
2723,7623,3276,9612,948442
624,282•598,188' 26,094
568,79422,114
1,316,06834,877
313,067313,06746,62146,618
107, 89225, 761
.096
.08011, 498
49, 0185, 632
3,552
372253
2,7734
37113
3,24326, 336426, 78518, 7432,473
6,50919,212
2483,5923,4298,3103,200434
509,612497,22312,389
605, 34914, 634
1,426,19910,956
391,051391,04952,95652.956
136, 66717,444
.0814,963
33,8675,192
2,80527,493416, 27019,7161,667
6.50919,885
3373,7623,3028,7993,246438
522,621484,691' 37,930
655,18616,512
1,598,07029,826300,783300,78245,96445,964
182,95623,795
.095
.0812,508
23,1024,848
2,96625,068473,96816,1111,094
6.509
LEATHER AND PRODUCTS
HIDES AND SKINS
Livestock slaughter (see p. S-27).Imports, total hides and skins § thous. of lb._
Calf and kip skins thous. of pieces..Cattle hides doGoatskins doSheep and lamb skins do
Prices, wholesale (Chicago):Hides, packers', heavy, native steers dol. per lb_.Calfskins, packers', 8 to 15 lb . . . .do
LEATHERExports: §
Sole leather:Bends, backs and sides.. thous. of lb_Offal, including belting offal. do
l t h, g g
Upper leather square feet__Production:
Calf and kip thous. of skins-.Cattle hide thous. of hides..Goat and kid thous. of skins..Sheep and lamb do
.231
.638
13, 6671141
1,2713,268
.155
.218
655488
3,280
8012,0981,5373,584
19, 7753583
2,4965,124
.239
307186
2,264
7552,0731,6563,529
15, 38420
1052,6403,171
.155
.218
36425
2,011
8442,1741,7613,951
16, 78848
1501,8643,738
.155
.218
64017
8321,9091,7393,702
19, 238124140
2,2732,419
.155
.218
5120
1,107
9592,0522,5984,558
30,92159306
4,4542,540
.435
1465
1,899
9812,1502,3044,088
25,229126206
3,2392,157
.276
.414
7190
2,512
1,0112,1842,4123,667
18,19859118
2,6831,833
.238
.396
626153
3,099
'1,1042,4262,5063,388
13, 58931122
2,1131,369
.231
.475
189225
4,359
' 1,0882,4642,8493,341
10, 7714131
2,7151,052
.228
.625
35895
3,906
'1,0662,5122,9542,943
10, 8302229
3, 299'1,318
.220
.514
47140
3,907
r 1,130' 2, 5593,038
' 2,882
14,0173551
3,0392,013
.223
.534
14859
3,761
1,0112,4723,0462,675
1 Data beginning January 1946 reflect a change in the sample and in the method of summarizing reports; January 1946 figure comparable with earlier data is $0,064.2 No quotation. 3 j u i y i estimate. 4 December 1 estimate. r Revised.§ Data continue series published in the 1942 Supplement but suspended during the war period (it should be noted that data for sugar are shown in long tons in that volume);
data for October 1941-February 1945 will be published later.* New series. The new sugar series include raw and refined sugar in terms of raw (see also note in the April 1945 Survey). The new series for tax-free withdrawals of ciga-
rettes is from the Treasury Department, Bureau of Internal Revenue, and includes withdrawals of small cigarettes for export and for consumption outside the United States; tax-free withdrawals were comparatively small prior to the war period. Monthly data beginning July 1943 are shown on p. S-29 of the March 1947 Survey.
Digitized for FRASER http://fraser.stlouisfed.org/ Federal Reserve Bank of St. Louis

S-30 SUEVEY OF CURRENT BUSINESS August 1947
Unless otherwise stated, statistics through 1941and descriptive notes may be found in the1942 Supplement to the Survey
1947
June
1946
June July August Sep-tember
Octo-ber
Novem-ber
Decem-ber
1947
Janu-ary
Febru-ary March April M a y
LEATHER AND PRODUCTS—Continued
L E ATHER—C ontinued
Prices, wholesale:Sole, oak, bends (Boston)t dol. per lb_Chrome, calf, B grade, black, composite
dol. per sq. ft.:Stocks of cattle hides and leather, end of month :t
LEATHER MANUFACTURES
Boots, shoes, and slippers:Exports§ .thous. of pairs.Prices, wholesale, factory:cf
Men's black calf oxford, corded tip.._dol. per pair_Women's plain black kid blucher t do
Production, totals thous. of pairs.Government shoes doCivilian shoes, total do
Athletic do__.Dress and work shoes, incl. sandals and playshoes:
Leather uppers, total thous. of pairs.Boys' and youths' __do.._Infants' do.-_Misses' and children's _ do . . .Men's doWomen's do . . .
Part leather and nonleather uppers __do...Slippers and moccasins for housewear doAll other footwear do . . .
Gloves and mittens, production, total*thous. doz. pairs.
Dress and semi-dress, total doLeather _do.-_Leather and fabric combination do_._Fabric do . . .
Work, total d o . . .Leather.. doLeather and fabric combination do._.Fabric do . . .
0)1.069
6.004.90
.462
.536
1,701
4.803.92
44, 957315
44, 642627
32, 8151,7522,9604,3798,70315, 0215,3045,708
188
2,27476516628571
1,509156192
1,161
.675
.570
776
4.804.07
37, 021139
36,882536
26, 5041,5022,4563,3467,66211,5384,6934,980
169
2,02465214118
4931,372116159
1,097
.470
.558
1,159
5.374.18
46, 236172
46, 064486
32,1171,7202,8384,1198,69214, 7486,6796,563
219
2,25580617525606
1,449125186
1,138
.470
.565
342
5.374.26
41, 651140
41, 511330
30,0221,6072,5753,7277,901
14, 2125,2795,681199
2,10373715318566
1,366119175
1,072
.470
.565
289
5.374.26
47, 469171
47, 297394
34,1941,7432,9624,1838,87416, 4325,1737,234302
2,54988216720695
1,667143197
1,327
459
6.504.26
40, 752196
40, 556395
30, 0111,5882,5553,8318,15313,8844,3045,606240
2,28275714515597
1,525112164
1,249
.770
.902
691
6.504.90
39, 068
397
31, 8841,7612,6324,0348,94714, 5103.4612,915213
2,1036281029
5161,476
98178
1,200
.950
464
6.254.90
41, 051(2)
41,051354
34,9571,6762,9694,6369,17016,5063,0922,475173
2,251576979
4701,675
95195
1,385
0)
.958
494
6.004.90
38, 255(2)
38,255315
33, 2951,5182,7204,4428,53616,0792,3362,176
133
2.086540878
4451,546••93192
1,261
0)1.017
537
6.004.90
40, 429(2)
40, 429352
35, 6901,5052,8754,8109,06717,4332,0772,146
164
2,261588878
4931,674
95205
1,374
0)1.015
'631
6.004.90
' 39, 525
' 39. 525375
•34,879'1,4492,7084,690
' 9,191• 16, 841' 1,751' 2,364
' 158
' 2, 462'581
863
'4911,882
95230
1,557
LUMBER AND MANUFACTURES
LUMBER—ALL TYPES
Exports, total saw mill products § M bd. ft._Sawed timber§ doBoards, planks, scantlings, etc.§ do
Imports, total sawmill products! __ doNational Lumber Manufacturers Association^
Production, total mil. bd. ft_.Hardwoods __ .doSoftwoods do
Shipments, total ._.doHardwoods - doSoftwoods . . .do
Stocks, gross, end of month, total doHardwoods doSoftwoods do
FLOORING
Maple, beech, and birch:Orders, new M bd. ft_Orders, unfilled, end of month _..do.--Production do.-_Shipments __.do-_-Stocks, end of month _ do . . .
Oak:Orders, new doOrders, unfilled, end of month _ _do.--Production.. doShipments _. do . . .Stocks, end of month . .do
SOFTWOODSDouglas fir:
Exports, total sawmill products§ M bd. ft.Sawed timber§ „_ do.-.Boards, planks, scantlings, etc.§ - do...
Prices, wholesale:Dimension, No. 1, common, 2" x 4" x 16'
dol. per M bd. ft..Flooring, B and better, F. G., 1" x 4", R. L. . .do
Southern pine:Exports, total sawmill products! M bd. ft.
Sawed timber§ do...Boards, planks, scantlings, etc.§ do.-.
62. 23094.080
56,87110, 29044,96876,930
2,749656
2,0932,605614
1,9643,753959
2,794
2,7506,2502,5502,7002,425
15, 42631,15817, 23917,6395,162
30,0205,84522,682
41. 52858.310
10,8612,035
43, 78413,87627,825109,970
2,753694
2,0592,594590
1,9683,8541,0132,841
2,3005,7502,3752,3752,375
20,24731, 65720, 83819,7476,081
22, 2719,25613,015
42.63059.780
9,5652,7036,862
54,36512,63335,001123,411
2,934774
2,1602,710630
2,0264,0681,1252,943
3,5606,1503,1003,1252,475
18,93130, 05522,86024, 7344,209
18, 7106,01113,112
42.63059.780
16, 3845,26011,124
44, 72515,33126,823111,685
2,742794
1,9482,500583
1,8624,2821,2603,022
2,5505,4252,9253,3752,425
22, 851• 47, 86127,52727, 331' 4,404
20,47810, 04110,453
42.63059.780
11,7164,0807,636
23, 8024,32917, 485131, 669
2,946829
2,1172,727698
1,9534,5401,3693,171
3,7505,7003,4003,4252,200
29,21242,19035,92234,8824,738
6,2332,6323,601
42. 63059. 780
5,3171,0344,283
38,2517,18330,103117,696
2,533698
1,8352,418570
1,7854,6521,4533,199
3,2505,2503,4753,6251,975
29,24541,80034,07933, 0655,752
2,138654
1,484
43.85559. 780
21,3604,95516, 405
81, 97628,61445,149123,816
2,303604
1,6992,326542
1,7234,6451,4743,171
4,3506,1003,9503,7001,950
29,19441, 24933,95531.2487,431
37, 42120,62916, 792
47.824
15,8854,88011, 005
79,72020,53754, 377109,414
2,214583
1,6312,414590
1,8244,3231,4212,902
3,8505,5503,9004,3751,650
41,52141, 52340, 25341, 2475,730
44,93115,30529,626
51.94072. 520
11,8422,0079,835
76,40322,65652,062111, 718
2,403612
1,7912,378598
1,7804,3461,4202,926
5,2007,4503,8753,6251,850
33,89340,15737,97637, 7335,978
36,87212, 69524,177
58. 80085.505
20,1598,21411,945
114, 34527, 25575, 572133,390
2,578623
1,9552,389507
1,8824,4561,4273,029
5,8258,3754,0504,4001,625
42,07539, 97042,94442,2606,032
65, 07321, 35643, 717
60.27091. 630
19,0414,44114,600
88,46816,61063,10993,070
2,732632
2,1002, 560
5302,0304,5371,4703,067
5,8259,5004,6754,7251,500
41, 28438,41847, 36146,1407,016
38,9489,36429, 584
62. 23094. 080
17,5114,34113,170
^Publication of data discontinued by the compiling agency.r Revised. i No quotation. 2 Data not collected separately; included with data for civilian shoes.§Data continue series published in the 1942 Supplement but suspended during the war period; data for October 1941-February 1945 will be published later.cf These data continue series published in the July 1944 and earlier issues of the Survey which provide data through May 1944; the series for women's shoes was substituted in the
June 1943 Survey for the series for colored elk blucher formerly shown. Data for June 1944 to May 1946 are as follows: Men's black calf oxford—June 1944-December 1945, $4 60; Janu-ary 1946, $4.76; February-May 1946, $4.80; Women's black kid—June 1944-October 1945, $3.50; November 1945, $3.69; December 1945. $3.75; January-March 1946, $3.75; April and May1946, $3.92.
^See note for boots and shoes at the bottom of p. S-23 of the July 1945 Survey regarding changes in several classifications and note marked "$" on p. S-28 of that issue regardingother revisions; revisions for January-May 1943 and 1945 and January-April 1944, which have not been published, will be shown later.
*New series. The series for gloves and mittens were first included in the May 1946 Survey; see note in that issue.fRevised series. The price for sole oak leather has been shown on a revised basis beginning in the October 1942 Survey; revisions beginning July 1933 are available on request.
There have been unpublished revisions in the January 1944-April 1946 data for the lumber series and also earlier revisions which have been published only in part (see note in theApril 1946 Survey); all revisions through April 1946 will be shown later; recent revisions resulted from adjustment of the monthly series to 1945 production data compiled by theBureau of the Census. See note marked "&" above regarding the price series for women's shoes.
Digitized for FRASER http://fraser.stlouisfed.org/ Federal Reserve Bank of St. Louis

August 1947 SURVEY OF CURRENT BUSINESS S-31
Unless otherwise stated, statistics through 1941and descriptive notes may be found in the1942 Supplement to the Survey
1947
June
1946
June July Sep-tember
Octo- Novem- Decem-ber ber ber
1947
Janu-ary
Febru-ary March April M a y
LUMBER AND MANUFACTURES—Continued
SOFTWOODS—Continued
Southern pine—ContinuedOrders, newf mil. bd. ftOrders, unfilled, end of monthf doPrices, wholesale, composite:
Boards, No. 2 common, 1" x 6" or 8" x 12'tdol. per M bd. ft._
Flooring, B and better, F. G., 1" x 4" x 12-14'tdol. per Mbd. ft..
Production! - mil. bd. ftShipments! doStocks, end of montht do
Western pine:Orders, newf doOrders, unfilled, end of month\ doPrice, wholesale, Ponderosa, boards, No. 3 common,
1" x 8" dol. per M bd. ftProduction! ...mil. bd. ft._Shipments! doStocks, end of month! do
West coast woods:Orders, new! doOrders, unfilled, end of month. . doProduction! doShipments! _ _ doStocks, end of month do
SOFTWOOD PLYWOOD
Production* thous. of sq. ft., %" equivalentShipments* doStocks, end of month* do
FURNITURE
All districts, plant operations _ _ .percent of normalGrand Rapids district:
Orders:Canceled percent of new ordersNew _ __ _ no. of days' productionUnfilled, end of month do
Plant operations percent of normalShipments . .no. of days'production
64. 333
130.683
54.36
139, 623142, 97531,481
544701
46. 029
65. 091610589
1,081
558298
40.07666595835
477559546532378
121,412125,06824,391
62
240
1476937
602679
46. 083
65.091625624
1,082
583276
40.93671604901
492545507493378
99, 74792, 28834,189
59
153
1376233
576633
46.083
65.091625622
1,085
634258
40.19737649987
514554526496403
126,974124,89133,842
68
347
1417139
593651
46. 083
65.091567575
1,077
605283
40.35••632r577
1,041
448538487468420
129,270128,08635,560
68
235
1377040
601642
46. 083
65.091668610
1,135
580288
40.38625573
1,092
536576
'534'493
462
149,600149, 58334,959
72
353
1417242
547633
53.182
74. 723589556
1,168
489275
40.36491501
1,083
445544503484475
129,635128,69134,984
73
627
1307538
506574
67.163
96. 546610565
1,213
436269
43.30394440
1,038
451514461489448
121, 816129, 72726,882
70
1728
1207736
588665
71. 656
106. 782578£97
1.294
461302
45.60329428939
582523507576377
140, 058136,064
30, 712
74
78
586551
72. 530
109. 979686600
1,280
385278
48 51346409876
618577529548379
129, 622127, 66831,995
73
75
618553
71.460
120.104681616
1,345
530353
50.99420455841
723685598569410
139, 779140,45732,146
78
82
631544
' 67. 790
r 130. 683693640
1,398
540357
52.71534536839
529646584586374
148, 027143, 295
35, 591
78
82
565449
r 65. 694
-130.683726660
1, 464
449247
54. 69653559933
••544595
'604'607
397
r 142, 070r 141, 491' 35, 618
METALS AND MANUFACTURES
IRON AND STEELForeign trade: §
Iron and steel products:Exports (domestic), total short tons.
Scrap do. . .Imports, total _ _ do___
Scrap _ do.-_
Iron and Steel ScrapConsumption, total* thous. of short tons.
Home scrap*... _ do. . .Purchased scrap* _ _do___
Stocks, consumers', end of month, total* .do. . .Home scrap* __.do___Purchased scrap* _do_._
OreIron ore:
All districts:*Production thous. of long tons.Shipments . . .do. . .Stocks, end of month do...
Lake Superior district:Consumption by furnaces doShipments from upper lake ports doStocks, end of month, total _do.
At furnaces do.On Lake Erie docks _ do.
Imports§ do.Manganese ore, imports (manganese content) §..-do.
Pig Iron and Iron Manufactures
Castings, gray iron:*Shipments, total. ..short tons._
For sale _ .doUnfilled orders for sale do
Castings, malleable iron:d*Orders, new, for sale _ doOrders, unfilled, for sale doShipments, total doFor sale do
6,50011, 45721, 74619, 5942,152
1,038,356"6,874
2,710,918
31, 972248, 79878, 52445, 291
394, 38218,56864,9693,409
4,2142,0742,1404,1101,2692,841
8,8509,9145,367
4,9958,65426,26523,2473,01817334
757, 268442,4732,640,430
39,388275,84561,65035,468
11,620131,022
103
4,4762,3822,0943,6601,2672,393
11,61212,2154,764
6,46010,84830,43927,1313,30734072
840,004487,4582,708,385
34,157271,98164,44638.021
513,59510,893119,664
763
4,6702,5942,0763,3241,1422,182
11,09011,0834,770
6,7389,77434,06730,4503,61737162
973, 232567,1642,814,430
41,935272,57167,90341,345
9,244124,4531,896
4,4492,4671,9823,2581,1922,066
10,74210,5464,966
6,3809,63637,57333,4644,10940270
937, 401540, 6492,897,105
44, 369277, 30969,50739,631
293,4517,187
110,767207
4,9072,7052,2023,1631,1841,979
9,9179,9654,860
6,6259,20940,43535,7624,67438669
1,077,838626, 2732,952,705
50,140280,97279,20746, 477
480,75216,258143,3781,159
4,5792,5352,0442,9921,1211,870
6,6056,8304,607
6,1316,70141,91937,0634,85732977
987, 069561, 6262,940,199
36,802278,44668,98739,328
509,44415,671102, 6861,018
4,2392,1932,0463,0341,1581,876
2,2741,1935,688
5,516247
37,46533,0564,40923755
909,195514,4152,979,658
28, 542267, 66168, 31439, 327
549,1988,381
137, 5561,690
4,9002,7172,1832,8861,0631,823
2,6981,2517,135
7,0240
30, 51426, 7443,77022376
1,077,820632,7893,021,141
34, 517259, 76475,89842,414
480,9754,694
129, 9941,511
4,5032.4062,0973,0321,0611,971
2,5911,3228,404
6,2640
24, 31720,9383,37919845
1,009,970583, 2522,986,741
55, 938274. 01874,71641, 684
637,4469,082
162,1503,058
5,1362,6892,4473,3661,1092,257
2,8461,4259,825
6,9790
17, 41114, 7552,65623332
641, 72310.160239,1543,478
6,5757,2169,212
6,5794,448
13, 55511, 7381,816
26364
1,089,828 1,097,150633,844 636, 708
2,979,326 2,907,694
50,194280, 72476,614
41, 994275,415
81, 89047, 303
657, 85218,175
137, 6042,184
10, 98111, 7558,438
6,88510, 37317,61815, 5412,078
43946
1,097,307633, 013
2,782,706
28, 996262, 117
75, 47842, 294
f Revised.c? Since May 1944 the coverage of the malleable iron castings industry has been virtually complete; see note in the February 1947 Survey for further information.§ Data continue series shown in the 1942 Supplement but suspended during the war period (it should be noted that data for iron and steel are shown in long tons in that volume);
data for October 1941-February 1945 will be published later.* New series. For data beginning September 1941 for softwood plywood see p. 16 of the September 1944 Survey. For description of the series on scrap iron and steel and 1939-40
data, see note marked "•" on p. S-29 of the November 1942 Survey. The series for iron ore, all districts, are from the Department of the Interior, Bureau of Mines, and cover theentire industry, monthly data beginning 1943 and earlier annual totals will be shown later. Data for 1943-45 for gray iron castings are shown on p. 24 of the January 1947 Survey.
1 Revised series. See notes marked "f" on p. S-31 of the February 1947 Survey and p. S-29 of the April 1946 issue regarding unpublished revisions in data prior to 1945 for theindicated series on lumber production, shipments, orders, and stocks; new orders, production and shipments have been further revised beginning 1945 to conform with Bureau of theCensus production data for that year; all revisions through April 1946 will be published later. The Southern pine price series are shown on a revised basis beginning in theFebruary 1946 Survey; see note in that issue.
Digitized for FRASER http://fraser.stlouisfed.org/ Federal Reserve Bank of St. Louis

S-32 SURVEY OF CUEEENT BUSINESS August 1947
Unless otherwise stated, statistics through 1941and descriptive notes may be found in the1942 Supplement to the Surrey
1947
June
1946
June July AugustSep-
temberOcto-ber
Novem-ber
Decem-ber
1947
Janu-ary
Febru-ary March April May
METALS AND MANUFACTURES—Continued
IRON AND STEEL—Continued
Pig Iron and Iron Manufactures—Continued
Pfg iron:Consumnt'on* thous of short tonsPrices, wholesale:
Basic (furnace). _ ._ dol. per long ton..Composite doFoundry, No. 2, f. o. b. Neville Island* do
Production* thous. of short tons. _Stocks (consumers and suppliers'), end of month*
thous of short tonsSteel castings :f
Shipments total > short tonsFor sale total do
Railway specialties - do .8teel forgings:*
Orders, unfilled, for sale, total doDrop and upset - do _Press and open hammer _ _ _. . . do . . _
Shipments total doDrop and upset, total . _. do __
For sale doPress and open hammer, total do
For sale doSteel consumed in production of forgings do
Steel ingots and steel for castings:Production ._ -thous. of short tons. .
Percent of capacity § - ._*..Prices, wholesale:
Composite, finished steel dol. perlb__Steel billets, rerolling (Pittsburgh) dol. per long ton..Structural steel (Pittsburgh) dol per lbSteel scrap (Chicago) - dol. per long ton
Steel, Manufactured Products
Barrels and drums, steel, heavy types:®Orders, unfilled, end of month... thousands..Production._ _ _ _ __ do _.Shipments doStocks, end of month do
Boilers, steel, new orders:!Area ._.. thous. of sq.ft..Quantity . . ._ _. _. _ . number
Cans, metal (in terms of steel consumed):*Shipments (for sale and own use), total...short tons..
Food _ _ __ do __Nonfood doShipments for sale _ do _
Commercial closures, production* _ .millions .Crowns, production* thousand grossPorcelain enameled products, shipments:}:*
thous. of dol_.Snrinff washprs shinrnpnts r\nSteel products, net shipments:©
Total thous of short tonsMerchant bars doPipe and tubes doPlates doRails doSheets doStrip—Cold rolled do
Hot rolled doStructural shapes, heavy doTin plate and terneplate doWire and wire products do
NONFERROUS METALS AND PRODUCTS
Aluminum:Imports, bauxitel long tonsPrice, wholesale, scrap castings (N. Y.)__dol. per lb . .
Aluminum fabricated products, shipments, total*mil of lb
Castings* doWrought products, total* do
Plate, sheet, and strip* . doBrass sheets, wholesale price, mill dol. per lbCopper:
Exports, refined and manufactures! short tons__Imports, total! _ . do
For smelting, refining, and export! doFor domestic consumption, totals do
Unrefined, including scrap! doRefined! do
Price, wholesale, electrolytic (N. Y.) dol. per lb._
33. 0033.8133. 504,810
139,031103,88831,879
638, 535522, 096116, 439200, 656152, 66482,10047, 99229,948
290, 018
6, 95293
.032942.00.025030.88
13,6122,2442,242
23
1,9251,346
232,972168, 43664, 536
193, 635845
24, 266
7,182
. 0444
91.870.5.300
.2135
3,623
28.0028.6728. 503,682
821
121,52289, 53325, 529
635, 004512, 272122,732164,921117, 29959, 70547,62233, 457
226, 864
' 5, 6°^74
.030339.00.023518.75
9,7631,7861,782
28
1,7971,895
240,089204, 97735,112
205, 4621,279
20,422
r5,233399
3,68837233428413387710888
274247318
65, 356.0523
' 121.0'30 .9
90.165.6.237
7,34120, 5105,058
15, 452819
14,633.1406
4,560
28.0028.7328.504,705
810
117,52882, 97522, 405
661, 277532, 401128, 876168, 319124, 71859,94143, 60126, 640
230, 238
'6,61985
.030539.00.023518.75
9,9602,0312,019
40
2,0001,480
306, 798267,43439,364
276, 4591,196
22,900
' 5, 095455
4,259455427399180960
92105313262297
77,110.0525
' 136.1'31 .2105.080.3.237
7,48935, 7555,486
30,26912,31917, 950.1415
4,696
28.0028.7328.504,898
771
129,66694, 06324, 712
666, 360537, 815128, 545184, 286136,12473, 33848,16235, 086
259,158
' 6, 92589
.030539.00.023518.75
10, 3182,3932,405
28
1,4241,588
343, 338302, 75640,582
300,8701,391
25, 439
' 6, 277506
4,965501501421217
1,116124137351295387
88, 606.0550
' 151. 2' 36. 4114.888.8.237
9,17321, 2722,950
18, 32218, 272
50.1415
4,571
28.0028.7328.504,687
830
126,47190, 56725,910
670, 523543,831126,692173, 934132, 54472,13641, 39029, 851
247, 234
' 6 , 5 r 687
.030539.00.023518.75
12, 2022,0392,036
30
1,6461,682
318,304282, 07536, 229
277,8291,340
25,159
' 5, 874543
4,590452446397199
1,076115137347244365
95, 038. 0575
' 148. 7' 34 .6114.291.9.237
5,38625,1822,656
22, 52619,3153,211.1415
4,812
28.0028.7328.504,815
881
137,30498, 26525, 619
736,482603, 833132,649203,410154, 27782, 79649,13335, 901
289, 518
' 6, 95289
.030539.00.023518.75
13,0712,3542,351
33
1,9731,890
258, 763215, 247
43, 516222,307
1,57428, 901
' 7, 062580
5,261549498467226
1,233133158387253410
29,811.0575
' 181. 8' 43 .0138.8110.1.237
2,13132, 503
1,22531, 27823, 929
7, 349.1415
4,424
28.0028.7328.504,435
687
130,60693, 87827, 425
726, 733595, 359131, 374183,856134, 36373,12449,49334, 988
254, 026
' 6, 45885
.030539.00.023523.13
13, 6122,1982,213
19
1,4531,441
192,134151,88240, 252
161,9511,401
25, 196
' 6, 668
5,020507482466210
1,220132144356248391
93, 752.0682
' 163.1' 3 8 . 2124.999.5.259
10,56433,1826,809
26, 37312, 93313,440.1704
3,888
29.6030.1230.503,992
668
123,90788, 13622,108
707, 060579, 778127, 282187, 375138, 56775, 36048,80834, 986
259, 953
' 5, 76174
.031239.00.023527.25
15, 0142,0912,093
17
1,4521,462
198, 406157,03041, 376
167, 6371,323
24, 307
' 5, 823
4,533460418386174
1,081123135310265392
113,445.0775
' 156. 9' 37 .5119.492.7.275
14,16845,4319,298
36,13323, 62512, 508.1928
5,037
30.0030.8630. 505,087
674
139,029101,14028, 699
723,158591, 558131, 600199,589145, 94379, 06153, 64637, 013
294, 594
7,21393
.032942.00.025029.75
15, 5012, 3272,317
27
1, 4211,393
174, 890129, 91444, 976
138, 203' 1,4:627. 603
r i 752
5,063525467468227
1,202126146362248420
108, 795.0775
' 174. 4' 40 .7133.7103.9.275
14, 92125, 13812, 34012, 7988,5924,206. 1927
4,467
30.0030.8630.504,550
735
125, 61292, 82228, 212
713,909581, 337132, 572195,681148,16678,56047, 51532, 444
286, 656
6,42292
. 032942.00.025031.63
15, 8672,0642,066
25
1,3401,265
157, 758111, 15446,604
123, 761' 1,15424, 136
' 6, 968
4,626474428445191
1, 093116136334229364
166, 616.0755
' 157. 7' 3 7 . 8120.092.9.275
11,01826,1148,784
17, 3307,8059,525.1935
5,015
33.0033.5533.505,123
777
134,90999, 70127,125
717,428586, 992130, 436205,085156, 72483, 74348, 36131, 713
296,377
7,30794
.032942.00.025036.69
14, 9762,2912,292
25
' 1, 4211,348
180, 256125, 86754,389
142, 8371,176
26,265
'7,516
5,304558502527181
1,275132144390293396
157, 437.0725
' 155. 3' 42 .3113.088.0.289
13,46226, 2916,944
19,34712,1587,189.2091
33.0033.8133. 504.830
144.175106,12729,185
698, 615570,130128,485223, 787170. 99390, 07652, 79431,399
324, 949
7,04394
.032942.00.025033.05
14, 5422, 4552, 455
25
1,3771,337
205, 024139,71865. 306
160, 245' 1, 08627, 219
8,092
5,446549518555206
1,274141151
'392318425
129, 133.0719
' 152. 6' 41 .7110.983.8.289
11.72123, 2047,989
15,2159, 7555, 460.2123
33.0033.8133. 505,081
140, 874103,77C28, 850
662, 579544, 058118,521210,772158,99985, 72951,77330,014
301, 358
'7,32995
.032942.00.025029.25
14, 37C2, 3032,306
21
1,42?1,212
207, 571146,015'61,556165, 448
98625, 058
' 7, 628
5, 4425fil53.c
57C20'
1, 27414C15(3&30.42-
189, 6L.066'
143. '37.^
' 106.' 8 1 .
.29
14,0241,65
3,2338,4225, 0913,32.221
' Revised. <g>Beginning 1943, data have covered the entire industry.t Based on information recently available it is believed that data beginning 1945 represent substantially the entire industry; in prewar years the coverage was about 90 percent.• Data for 1946 and 1947 have been revised to exclude the value of finished plumbing ware; January-May-1946: Shipments—4,821; 4,355; 4,750; 5,876; 5,242.O Total shipments less shipments to members of the industry for further conversion; data prior to 1944 were production for sale.IData continue series published in the 1942 Supplement but suspended during the war period; data for October 1941-February 1945 will be published later.§For 1947, percent of capacity is calculated on annual capacity as of January 1, 1947, of 91,241,000 tons of steel; 1946 data are based on capacity as of January 1,1946,91,891,000 tons.•New series. For pig iron consumption and stocks for 1939-40 and a description of the series see note marked "•" on p. S-29 of the November 1942 Survey. The series on pig iron
production is approximately comparable with data in the 1942 Supplement (data in that volume are in short tons instead of long tons as indicated); see p. S-30 of the May 1943 Surveyfor further information and data for 1941-42. The pig iron price series replaces the Pittsburgh price shown in the Survey prior to the April 1943 issue. See note marked " • " on p.S-33 of the February 1947 Survey for a brief description of the data on aluminum fabricated products and reference to 1945 figures for the total; separate data prior to 1946 for the detailwill bo published later. The series for closures, including plastic closures, crowns, and metal cans, are compiled by the Bureau of the Census and cover all producers; data prior to1946 will be shown later. For a brief description of the series for steel forgings, which are also compiled by the Bureau of the Census, and available data for 1945, see note on p. S-32of the March 1947 Survey.
tRevised series. Data for steel castings are estimated industry totals; see note on p. S-32 of the July 1946 Survey for comparable figures beginning January 1945.
Digitized for FRASER http://fraser.stlouisfed.org/ Federal Reserve Bank of St. Louis

August 1947 SURVEY OF CURRENT BUSINESS S-33
Unlessand1942
otherwise stated, statisticsdescriptive notes may beSupplement to the Surrey
throughfound in
1941t h e
1947
June
METALS
June
AND
1946
July August Sep-tember
Octo-ber
Novem-ber
Decem-ber
MANUFACTURES—Continued
1947
Janu-ary
Febru-ary March April May
NONFERROUS METALS AND PRODUCTS—Con .Copper—Continued
Production:^Mine or smelter (incl. custom intake)..short tons.-Refinery -do
Deliveries, refined, domestic^ _ . . .doStocks, refined, end of months do
Lead:Imports, total, except mfrs. (lead content)^ doOre (lead content):
Mine production* do.Receipts by smelters, domestic orercf do
Refined:Price, wholesale, pig, desilverized (N. Y.)
dol. per !b_-Production, total c? short tons.-
From domestic orecf do__ __Shipmentscf do...Stocks, end of monthcf . do...
Tin:Imports:^
Ore (tin content) long tons.Bars, blocks, pigs, etc do._.
Price, wholesale, Straits (N. Y.)~ _dol. per lb.Zinc:
Imports, total (zinc content)*! ...short tons__For smelting:, refining, and export^ doFor domestic consumption:^
Ore (zinc content) _ do.Blocks, pigs, etc do
Mine production of recoverable zinc* -doSlab zinc:
Price, wholesale, prime Western (St. Louis)dol. per lb
Production cf short tons_-Shipmentsd" do
Domesticd1 doStocks, end of monthd* . . .do
HEATING APPARATUS, EXCEPT ELECTRICBoilers, radiators and con vectors, cast iron:§
Boilers (round and square):Production thous. of lb_Shipments do__.Stocks, end of month. do.-.
Radiation:Production -thous. of sq. ft.Shipments do.._Stocks do--.
Boilers, range, shipments* number-Oil burners:©
Orders, new, net .do. . .Orders, unfilled, end of month do.. .Shipments do.. .Stocks, end of month do._.
Stoves and ranges, domestic cooking, exc. electric:*Production, total do
Coal and wood do.. .Gas (incl. bungalow and combination) do.. .Kerosene, gasoline, and fuel oil _do--.
Stoves, domestic heating, production, total* do-..Coal and wood* do_-_Gas* do._.Kerosene, gasoline, and fuel oil* do_-.
Warrn air furnaces (forced air and gravity air flow),shipments, total* number-
Gas* do.Oil* .doSolid fuel* do.
Water heaters, nonelectric, shipments* do_
MACHINERY AND APPARATUSBlowers, fans and unit heaters:
Blowers and fans, new orders thous. of dol_.Unit heater group, new orders do
Electric overhead cranesj:Orders, new doOrders, unfilled, end of month doShipments do
Foundry equipment:New orders, net, total 1937-39=100.-
New equipment-. doRepairs do
Machine tools, shipments* thous. of dol—
i 81,854i 98, 738116, 6521 76, 629
. 150045, 23541, 50554. 62737. 836
.8000
.105070, 99063, 52752,390
174,327
25, 83826,34250, 824
4,4724,6982,909
649.9658.9620.7
24, 720
32, 78523, 87095, 26779,145
5,217
23, 66021, 801
18, 58417, 45025,17332,969
3,2422,073.5200
15, 729878
7. 6167,235
42, 524
.082558,81260, 49251.101239,953
20,98621, 34841, 611
3,3863,3554,375
85, 704
106, 579806,18136, 7455,852
219,97031, 415144, 20544, 350282,358106, 60893,09182, 659
49,53615,9144,33929,283181,424
16, 6047,628
1,45615,132
694
491.7492.8488.2
28, 580
56,90643, 60697, 527101,183
5,046
25, 04432, 977
.092534. 02932; 62235, 59131,396
5, 6652,172.5200
31, 0575,287
19,9825, 788
33, 218
.092359, 01469, 22058, 321
229, 747
21,18820, 22242, 577
3,1963,5594,012
90, 636
102, 438862,91245, 707
202, 51728, 459133,67940, 379
304, 007115, 42186,334102, 252
49,12216,2065,34527,571187,569
2,36016, 242
802
453.4444.8481.1
22, 360
64, 46259, 591118,38194,669
12,909
28, 61031,373
. 082535,69033.99432,81134, 275
3,5932,542.5200
21, 2413,476
14, 0073,758
45, 893
.082559, 75251, 88643, 522237,613
25,38026, 88141,076
3,8784,4693,421
113, 524
101, 818907,30457, 4265,543
263, 21534, 520181.19047, 505
376, 557135.191104,037137,329
62,24620,1926,34535,709213,789
1,56516, 5491,252
538.7555.5484.126,911
69, 74867,803113.158
9,477
27, 22928, 054
. 082540, 72039, 01234, 04740, 944
153581
.5200
25, 4243,637
17, 2424,545
48, 433
.082558, 47565, 92760,130230,161
25, 71327, 02139, 769
3,4943,7643,151
104,169
81,888931, 85357, 3395,198
249, 54234,142169, 92945, 471
377,803146, 901116, 405114,497
72,30323,1639,112
40,028209,415
17, 38210,193
1,08215,8111,192
424.4415.4453.5
25, 468
72, 80777,947136,48191,161
19, 295
25,87527, 324
.082543, 06241,21741, 00842,992
7832, 462.5200
14, 425742
8,8994,784
51, 517
.088764,13873,91571, 667
220, 384
30,06632, 24337, 591
4,5234,8582,816
103, 837
99,009956,96673,8966,407
296,87442, 232204,19050, 452528,984206, 873155,945166,166
83,50227,5459,53746,420
264,989
2,34616, 7751,348
469.2407.1672.029,140
73, 02475, 066129,20690,896
8,345
27, 87226,180
.104440, 04138, 28734, 76448, 262
4,9041,195.6452
27,3315,441
15, 2786,612
48,993
.101266, 87391, 42975, 781195,828
28, 45130, 95435.088
4,3214,3692,768
94, 274
105, 689990,35072, 3057,588
254, 26133,175172,05449, 032
466, 854163,115151, 271152, 468
89,00529.08912,29647,620
260,569
477.4421.0661.526,176
78, 67477, 578141, 21880, 832
24,427
28, 06531, 307
.121940, 44838,94340, 61348, 088
4151,991.7000
32, 0413,624
18, 6089,80949, 891
.105070,17690, 20477,904175, 800
19, 85623,69432,173
3,2504,2861,732
84,457
86,1961.002,38074.1667,039
226, 29131, 701153, 97240, 618457, 360151,979162, 518142, 863
78.16726,29214,38537,490
253,621
15, 29210,113
430.9379.0600.3
27, 587
78, 25680,144143,69276,680
21,105
31, 47630,907
.129345, 62942, 50644,88848, 826
3,0111,285.7000
48, 6275,441
29,89613, 28954, 925
.105072, 33274, 79567,211173, 337
27,98224, 29435,861
4,6194,0652,25678,400
87,8721,008,81381, 43910,487
302,80939,317206,13057,362467,577131,053160,936175, 588
76,53728,95414,98032,603293,315
513.4466.9665.0
26, 542
74, 47477, 591117, 734
12, 405
29, 85732,157
.131844,05341,21049, 63843, 233
1,774419
.7000
57,39622, 482
29, 2755, 639
51, 085
.105065,19876, 07465, 356
162, 461
26, 00323, 78238,082
4,1684,2002,254
60, 821
118, 3081,045,87681, 24511, 903
281, 51040,411188, 38752, 712360,15089, 049139, 879131, 222
66,30823,94417,55224,812
270, 843
521.9472.5682.9
26, 765
84, 356r 87,141120,820r 71, 507
18,898
31,11636,328
.149651, 23946, 69952,46541,990
0'60
.7000
25,7535,842
12,8237,08855,134
.105075, 376' 75,78867, 325162, 049
29, 45226, 07341, 461
4,8624,4412,675
67,140
11,7951, 077,832
14, 745
305,40646,175203, 63155, 600
388,95797,264159,496132,197
60,19614,56222,68322,951
282,408
14,9077,216
573.8532.3709.5
29,012
188,927 i '91, 203•'104.430 ''"108,464•'•115,379 > 118, 048••85,293 i '83, 980
18, 585
'31.65837, 581
.150053, 42448, 99550, 56844, 834
3, 93733
.8000
43, 93510,082
28, 9304, 923
56, 827
. 105073,89172, 24361, 715
163, 697
28,84925,32644, 984
4,8204,597
66, 597
no, 338968,114' 99,380r 13,337
313, 694r 49, 288210, 406
54, 000••416,216
95, 063-•175,282
145, 871
55, 29714,20922, 05019, 038
••244, 711
512.1445.9727.9
26, 857
18,113
30, 852• 34, 269
. 150053, 82249, 98450, 4S247, 233
1,40954
.8000
33,5820, 367
20, 3066, 909
57,181
. 105073, 97070, 80358, 827
166,864
r 29, 528r 23,185r 51, 327
4,9844,7463,137
66, 745
5,083874, 787
98, 41015, 432
288, 69944,837
194,18249, 680
410, 64892,349
157, 720160, 579
54,9169,928
24, 66420,324
209,800
548.6525.9623.0
25, 791r Revised. J Data continue series published in the 1942 Supplement but suspended during the war period; data for October 1941-February 1945 will be published later.
Beginning April 1947, data include copper from all sources; earlier data relate to domestic and duty-free foreign copper except that deliveries included deliveries of duty-paidforeign copper for domestic consumption. Stock figure for April 1, 1947, comparable with later data, is 80,522 short tons.
2 Cancellations exceeded new orders. JData cover 9 companies since September 194;4 earlier data back to March 1943 covered 8 companies.cf For data for January 1942-April 1944 for the indicated copper, lead, and zinc series, see p. 24 of the June 1944 Survey. Total shipments of zinc include through September 1946
shipments for Government account in addition to shipments to domestic consumer and export and drawback shipments.§See p. 24 of the January 1947 Survey for available data for 1942-45 for cast-iron boilers and radiation; these series continue data in the 1942 Supplement.0Data are based on reports of 150 companies for 1946 and around 160 for 1947, covering almost the entire industry; it is believed that concerns added after 1945 had little or no pro-
duction in that year and data for 1945 were practically complete; in prewar years reports covered about 90 percent of the industry.*New series. Data for mine production of lead and zinc are from the Department of the Interior, Bureau of Mines, and are practically complete; monthly figures beginning July
1941 and carier annual totals will be shown later. Data for range boilers, stoves and ranges, warm-air furnaces and water heaters are compiled by the Bureau of the Census and arepractically complete; data for 1943-45 for domestic heating stoves are shown on p . 20 of the April 1947 Survey; data prior to 1946 for the other series will be shown later (data beginning1944 for total shipments of warm-air furnaces are available in the May 1945 and later issues of the Survey. The data shown for gas cooking stoves and ranges were revised in theApril 1947 Survey to include combination ranges, or ranges designed to use two different fuels; gas is one of the fuels used in most of these ranges. For source of data on machine toolshipments and reference for 1940-42 data, see note on p. S-34 of February 1947 Survey.
Digitized for FRASER http://fraser.stlouisfed.org/ Federal Reserve Bank of St. Louis

S-34 SUEVEY OF CURRENT BUSINESS August 1947
Unless otherwise stated, statistics through 1941and descriptive notes may be found in the1942 Supplement to the Survey
1947
June
1946
June July August Sep-tember
Octo-ber
Novem-ber
Decem-ber
1947
Janu-ary
Febru-ary March April May
METALS AND MANUFACTURES—Continued
MACHINERY AND APPARATUS—Continued
Mechanical stokers, sales:!Classes 1, 2, and 3 .number..Classes 4 and 5:
Number , . . . . -Horsepower -
Pumps and water systems, domestic, shipments:c?Domestic hand and windmill pumps number..Water systems, including pumps, total _do.__.
Jet* do. . . .Nonjet* do
Pumps, steam, power, centrifugal and rotary, neworders _. thous. of dol_.
Scales and balances (except laboratory), shipments,quarterly:*... thous. of dol._
Sewing machines, heads, production:*Domestic. _ _..number..Industrial do
ELECTRICAL EQUIPMENT
Battery shipments (automotive replacement only),number* _ ..thousands..
Domestic electrical appliances, shipments:Vacuum cleaners, total • number..
Floor doHand . . . . . do
Washers • doElectrical products:?
Insulating materials, sales billed 1936=100..Motors and generators, new orders § do
Furnaces, electric, industrial, sales:Unit ...kilowatts..Value thous. of dol_.
Laminated fiber products, shipments .doMotors (1-200 hp):
Polyphase induction, billings doPolyphase induction, new orders doDirect current, billings doDirect current, new orders. do
Rigid steel conduit and fittings, shipments!-.short tonsVulcanized fiber:
Consumption of fiber paper ..thous. of lb__Shipments _. thous. of dol..
5, 851
27063,168
36,94654, 29021,55132,739
2,999
314,705
4,150
22, 218
4,7711,625
13,893
30975,074
27,74146,15523,04223,113
2,648
7,150
33,8388,909
1,377
184,182178,8415,341
172,195
227465
9,099606
2,878
5,87313,095
9731,73516,129
3,247824
17,503
33083,958
22,66354,53127,42127,110
4,014
34,59610,788
1,161
199,722192,6557,067
168,500
252432
9,379771
3,268
6,15413,377
9871,58915,705
3,1831,056
20,354
42770,827
25,00360,25128,88931,362
3,789
27,2967,364
1,471
234,148226,0608,088
189,778
284501
2,1043,507
7,51915,4451,2342,06721,471
3,7901,288
19,437
45063,055
24,08255,48526,73728,748
3,223
7,751
35,2499,695
1,318
223,039216,2196,820
184,215
294471
8,240714
3,761
7,87113,8081,0111,74118,683
4,1251,330
17,269
45478,454
30,55268,28934,72833,561
3,581
50,04212,760
1,355
266,062259,1536,909
247,816
351508
4,869647
4,328
8,62114,7561,3442,20420,742
5,0591,765
14, 946
35758,495
28,91757,98630,10327,883
3,260
43,22010,832
1,150
268,432260,5727,860
216,634
331438
4,227600
4,074
8,43711,9621,2221,215
20,533
4,7411,640
7,594
33949,903
23,43462,31934,141
28,178
3,035
9,86443,84310,764
1,213
272,949265,3647,585
190, 770
337533
3,615322
4,168
9,86113,8751,8253,62024, 252
4,2411,701
4,282
21554, 852
26, 73759, 54531,12528, 420
3,428
47, 06312, 506
1,509
265,790258,8926,898
259,233
7,528789
4,550
18,297
5,0041,942
2,306
17752, 705
28,31064, 45533,93030, 525
3,506
46,06811,368
1,601
279,219272,9276,292
•255,611
373
5,060476
4,471
18, 757
4,4881,744
28056,661
36,26162, 58632,77329,813
3,464
10,100
51,38411,687
1,798
327, 528321,5156,013
•290,397
405
6,514551
4,859
i 29, 589i 38,33214,359,
i 5,31820,0884,5981,757
4,061
17457, 563
36, 57870, 79235,67135,121
3, P38
14,002
1,868
320,969
405
8,8541,0794,687
21,110
4,8241,791
5,281
17052, 981
r 38, 745•61,045' 29,173' 31,872
2,973
11,835
1,873
313,724
3,586389
4,092
22,141
5,0861,758
PAPER AND PRINTING
PULP WOOD AND WASTE PAPER
Pulpwood:*Consumption thous. of cords (128 cu. ft.)__Receipts, total _ . . .doStocks, end of month do
Waste paper:*Consumption... short tons..Receipts _ doStocks do
WOOD PULPExports, all grades, total} short tons.Imports, all grades, total} do
Bleached sulphate} do.. .Unbleached sulphate} do.. .Bleached sulphite} do._.Unbleached sulphite} _do__.Soda} _ do.. .Groundwood} . .do. . .
Production:fTotal, all grades _ do...
Bleached sulphate do.._Unbleached sulphate do.. .Bleached sulphite.. _ do.. .Unbleached sulphite do._.Soda do._.Groundwood do.. .Defibrated, exploded, etc.* do...
Stocks, end of month:fTotal, all grades do.. .
Bleached sulphate .do. . .Unbleached sulphate do_._Bleached sulphite do._.Unbleached sulphite do.. .Soda do...Groundwood _. _do
1,6321,6963,815
642, 650649, 812477,944
1,5141,6042,942
578, 075606, 548426, 750
6,057150.21610, 58426,48237,75749,8181,928
23,647
900,62977,336
323, 722138, 98665, 45538,386149, 84058, 955
85, 3136,2918,01314, 36311, 8002,329
39, 252
1,4231,7233,241
558, 257596, 609464,831
4,780212,6979,75764,10937,43978,1761,249
21,967
829,37871.931309,614132, 57556, 67537, 583133, 61441, 706
83,1786,6846,77317, 93311,0432,448
34, 940
1,5581,9203,639
635,827635, 567460,946
3,591147,4173,26333,86433,98849,5741,529
25,199
915,09980,170331, 586143,18469, 27242, 655140, 02756, 589
77, 6066, 0216,43017,18513, 6052.72628,230
1,5031,8213,956
607, 231604,136453,896
4,334133,1416,34832,89328,10449, 8221,55614,418
880,19876,008
314,645135,18564, 40738,947132, 78771, 548
71,9167,1938,35016,71312,1542,69021,381
1,6281,7054,034
680,047707,738481,398
2,302152,7077,56229, 29231,11362, 4591,41020,871
980,65379, 811343,457152, 65475, 73242,010159,87375, 279
72, 4327,5897,86517, 62015, 3992,48117,943
1,5851,3823,818
651.974636,387464,676
1,947135,001
7,81828,05126,93851,986
1,07019,138
947,33577, 472
336,697144,60571,71140, 717
158, 71469, 915
76, 5906,2188,765
18,61515, 294
2,61121, 423
1,4731,4383,780
596,247634,491515,361
2,737136, 4289,27120, 73535, 29750,6361,770
18, 719
886,56775,135304,130141,35867,04739,154149,55866, 796
70,6096,8367,222
20,3269,5132,088
22, 897
1,6661,7093,814
678, 241657.165492, 702
6,475167, 97715, 53738, 92139, 66153, 0751,318
19, 465
997. 64587,764350,101159, 57175, 06042, 343
164, 70373, 111
74, 8877,5428, 54519, 5008,6102,43125,971
1,5231,8614,153
620,667587, 481458,826
9,534160,79120, 56726,61538,31854, 5961,69918,996
913,07979, 766
321,127146, 90768, 90137,696150.58765,485
74,4656,9907,80917,7479,9382,80827,188
1,7021,8194,255
684,637667, 975435, 411
15,150141, 99514,13217, 87239, 61048,1901,597
20, 594
1,012,85889, 792
354, 293162,27073, 96742, 092167,99576,061
79, 6947,4477,043
21, 00411,1282,422
28, 630
1,6471.4304,035
668, 727711, 509475, 915
13,140•148,92113, 40221,67343, 417
r 44,0221,621
24, 786
984, 62287,175337, 047160, 22374,13141. 655
167, 72774, 712
83, 7866,9268,331
20, 56410, 645?-, 052
32, 046
'1,714' 1,465' 3, 767
693,879697,152473,917
14,161175, 067
19,98828, 66940, 33059,488
1, 59225, 000
1,038,34192, 484
366, 873164, 791
79,13343, 324
171,905r 76, 000
9?, 7607,0797,545
26, 28413,5272,709
35, 452r Revised. (i) Data are for January-March. d"It is believed that data shown currently and also earlier data for recent years are substantially complete.1 Data cover almost the entire industry; in prewar years the reporting concerns represented over 95 percent of the total.}Data continue series published in the 1942 Supplement but suspended during the war period; data for October 1941-February 1945 will be published later.§The monthly index of orders received of motors and generators will be released quarterly beginning with the second quarter of 1947.• Data for washers are from the American Ironer and Washer Manufacturers' Association and cover electric and gasoline washers, excluding small or midget types; the 1946 data
are as reported by companies representing around 97 percent of the industry according to comparison of the January-September total with data for that period collected by the Bureauof the Census; 1947 data are revised estimated industry totals. Data for vacuum cleaners are from the Vacuum Cleaner Manufacturers Association and cover total sales, excludingrebuilt cleaners, by the industry; data for hand type are comparable with figures in the 1942 Supplement: data for floor type shown in that volume include rebuilt cleaners and aretherefore not entirely comparable with figures shown above (comparable monthly average for 1941, 139,177).
•New series. See note in the February 1947 Survey for source of data for automotive replacement battery shipments, pulpwood and waste paper; all series are industry totals. Datafor 1939-45 for jet and nonjet water systems will be shown later. Data for scales and balances and sewing machines are from the Bureau of the Census and are practically complete,data prior to 1946 will be shown later (collection of data on the production of domestic sewing machines has been discontinued). Data beginning 1941 for production ofdefibrated,exploded, etc., wood pulp also will be shown later.
fRevised series. See note in February 1947 Survey regarding unpublished revisions in the indexes of new orders for motors and generators and sales of insulating materials. Datafor rigid steel conduit and fittings were revised in the July 1946 Survey (see note in that issue for explanation). Revised wood pulp production for 1940-43 and sulphite stocks for 1943are shown on p. 20 of the December 1944 Survey and revised 1942 stock figures for all series are on pp. 30 and 31 of the June 1943 issue; revisions in the 1943 data for groundwood andtotal production shown in the December 1944 Survey and unpublished revisions in the 1944 production data for these two series will be shown later; beginning in the May issue, datafor total production of wood pulp include defibrated, exploded, etc., pulp, shown separately above, which was not included previously; stocks of such pulp are comparatively smalland are not included in the stock figures; stock data are stocks of own pulp at mills.Digitized for FRASER
http://fraser.stlouisfed.org/ Federal Reserve Bank of St. Louis

August 1947 SURVEY OF CURRENT BUSINESS S-35
Unless otherwise stated, statistics through 1941and descriptive notes may be found in the1942 Supplement to the Survey
1947
June
1946
June July August Sep-tember
Octo-ber
Novem-ber
Decem-ber
1947
Janu-ary
Febru-ary March April May
PAPER AND PRINTING—Continued
PAPER AND PAPER PRODUCTSAll paper and paperboard mills:*
Paper and paperboard production, total..short tons..Paper .doPaperboard doBuilding board... -do
Paper, excl. building paper, newsprint, and paperboard(American Paper and Pulp Association) :f
Orders, new short tons..Production doShipments do
Fine paper:Orders, new doOrders, unfilled, end of month _ _doProduction doShipments dpStocks, end of month do
Printing paper:Orders, new _doOrders, unfilled, end of month do^..Price, wholesale, book paper, " B " grade, English
finish, white, f. o. b. mill ___dol. per 100 lb_.Production _ short tons..Shipments... doStocks, end of month.. do
Wrapping paper:Orders, new doOrders, unfilled, end of month doProduction doShipments doStocks, end of month do
Newsprint:Canada:
Production doShipments from mills .doStocks, at mills, end of month do
United States:Consumption by publishers. doImports 1 _- _ . . .doPrice, rolls (N. Y.) dol. per short ton..Production short tons..Shipments from mills .doStocks, end of month:
At mills.— . . . . d o . . . .At publishers _ doIn transit to publishers.._ do
Paperboard (National Paperboard Association):!Orders, new doOrders, unfilled, end of month .doProduction do
Percent of activityWaste paper, consumption and stocks: §
Consumption short tons..Stocksat mills, end of month do
Paper products:Shipping containers, corrugated and solid fiber, ship-
ments* mil. sq. ft. surface area..Folding paper boxes, value:*
New orders 1936=100..Shipments 1 do
PRINTINGBook publication, total no. of editions..
New books doNew editions.. _ do
1,729,087883,163726, 304119,620
691,780704, 830692, 237
106, 080158, 250100, 20097,20550, 500
235,125270, 793
9.80248,180242, 03275,802
255, 575170, 575260, 500256, 50065,875
355, 606375, 49890, 431
292, 664
90.0067, 26866, 743
11,951228, 79371,664
715, 054461, 226737, 551
101
424, 391299, 507
4,662
343.8447.6
531426105
1,596,773820,090677,68199,002
669, 564671,335677, 096
108,191175, 43797, 79099,68459,500
214, 214252, 603
8.00226,110288, 04953, 512
254, 258194, 966254, 348256, 63065,970
334, 207322,805123,161
259, 284276,95967.00
61, 24161,671
6,416209, 78452,155
682,472568, 733687,700
97
374, 295283,996
4,730
362.7331.3
679556123
1,474,261766,906635,30472,051
659, 247613,822613, 441
100, 854187,92489,32085, 82456,150
225,529258, 456
8.00206, 408206,95853,225
247, 518197,977237, 498237,17065, 867
357, 027364, 591115, 597
243, 072326, 39971.08
62, 74260, 249
8,909226, 57761, 735
729,294632,141675,600
369,803315, 236
4,763
361.0300.5
536422114
1,684,906864,982729, 44590,479
646,889704,694701,343
85,449161, 480103,16199, 59253, 504
202,087229,328
8.28236, 530237,85755,331
261,804193, 693266,987267, 25464,162
370, 676356, 572129, 701
257,303295,93473.8065,12967, 206
6,832243,33164,331
742,918575,021768,200
439, 696313,975
5,233
381.0368.3
510401109
1,596,187799,698687,473109,016
681,582648,551632,877
101,055176, 28892,57388, 03759,081
234,622241,498
8.55219,460213,13759,320
253, 345213, 506248,021243, 72872,263
330, 063335, 874123, 890
265, 583293, 22874.00
61, 02555, 587
12, 270240,60260, 634
712,650580,228692,200
96
299, 218
4,919
414.6351.5
656532124
1,751,147888,293737,648125,206
745, 909721, 964736,737
109,332174,098102,908112, 53754,635
254, 603248, 257
8.55246, 718249,93362, 013
278, 773214, 298274, 416276,00571,230
376,436387, 294113, 032
292,205305,77780.00
67, 248
12, 552217,30382,167
806,828613,221781,700
420,867309,990
5,512
440.2409.4
848675173
1,674,107845,207708,949119,951
640,569690,813695,803
81, 565159, 403100,943104, 24552, 578
212, 033221,908
8.55230,394235,02850, 504
252, 261197,134264,614264, 765
364,304391, 38885,948
291, 517323,45784.00
64, 73962,107
15,184217,43879,676
703,825555,398750, 900
474, 317304,100
5,242
363.8397.0
863704159
1,577,751803,350659,340115,061
644,338654, 939649,478
84,304161,50294,87093,03752,970
223,580
9.30223,860215,96755,100
245,954191, 210248,937252,87467,131
341,951340,12587,774
294,835318, 57684.0062,08862,054
15,218219,47873,328
697,357542,896688,646
92
397,478321,434
421.4405.9
846621225
1,764,493892,871752, 393119, 229
809,564728,303726,511
114,900166,112105,100107, 50447,939
314,706290,502
9.30252,360250,42957,113
279,440186,735272,357272,05064,128
370, 000344, 543113, 231
266, 422294, 04284.0068,63469,492
14, 360231, 69475,602
802,016586,121774,667
450, 740313, 398
5,475
490.3474.5
470372
1,629,117820, 583701,075107,459
671,294666,630667,801
93,388161,08597,60898,09547, 596
235,764296,114
230,039226,67660, 440
249,396184,065249,470252,12761,972
341, 268319,831134,668
258,424260,81584.0062,80265, 226
11, 936224, 45369,466
713,834577, 777718,072
103
416,935274,850
5,289
445.6439.7
557436121
1,800,239901,973773,441124,825
738, 255732,863721,800
119,009166, 788106,484105,15347,880
252,988292, 367
256, 045249,86267,234
270,461182,985271,949269,49759,211
372, 482373, 769133,381
302,672322, 35784.0067,91668, 872
10,980206,06473,699
747,358549, 774747,115
103
456,127266,879
5,566
414.5470.9
1,027808219
1,754,410885, 366751,198117, 846
'692,057r 711, 517r 709, 453
' 102,900'165,340' 102, 434' 100, 644r 48, 985
'238,918281,212
9.80• 252, 348• 252, 770' 63, 943
'252,330'178, 430•256,878"256, 026' 59, 788
369,490376, 305126, 5P-6
297, 461315, 33490.0071,93373,988
8, 925215,99568, 773
770,304582, 603765, 026
100
445,180289, 297
5,438
414. 4483.0
852678174
1,835,620931,506•776,381127,733
•715,757750,396744, 357
' 90, 518148,310107,591108,356r 49, 285
260, 627273,275
9.80263,677257, 570' 68, 516
263,424161, 563276,941275,131r 60, 225
384, 520400, 763110, 323
302.994328. 74790.00
73, 49870,997
11,426212, 72464, 985
760, 236511,918805, 744
101
464, 323293, 347
'5,245
399.7458.9
8116-50161
PETROLEUM AND COAL PRODUCTS
COALAnthracite:
Exports^ thous. of short tonsPrices, composite, chestnut:
Retail dol. per short ton..Wholesale.. do
Production thous. of short tons_.Stocks, producers' storage yards, end of mo.© .do
Bituminous:Exportsf _ doIndustrial consumption and retail deliveries, total©
thous. of short tons..Industrial consumption, total _. do
Beehive coke ovens __ doByproduct coke ovens _ . . doCement mills doElectric power utilities doRailways (class I) . . . . doSteel and rolling mills doOther industrial _ _ . do
r 16.1713. 520
4, 597
Retail deliveries _._ do i
366
15.2812. 7263,636
63
3,245
34, 01229, 548
5716,309
5755,0248,257
5828,2304,464
657
16.5513.6225,263
83
5,418
39,23532, 744
7167,551
6325,7148,720
6718,7406,491
761
16.5613. 5845,444
94
5,874
41, 56533,958
7887,781
6756,3149,092
7608,5487,607
717
i 16.8113.5935,048
132
5,070
42, 42434,041
7297,578
6566.2808,790
7259,2838,383
546
116.7813.5935,409
200
4,185
46,69836,714
8677,814
6936,7089,571
85010,2119,984
556
i 16.8013. 5974,990
236
3,644
44,51635, 401
5626,992
6946,4478,879
79911,0289,115
957
i 16.6313.6205,080
251
1,712
45,94037,281
5996,757
6766,7329,515
87112,1318,659
577
16.8713. 7685,155
284
3,253
55, 78842, 843
8777,964
6587,158
10,104943
15,13912, 945
406
16.8413.7534,240
292
3,233
52,39939, 855
7987,245
6076,5949,431
90414, 27612, 544
528
i 16. 8313. 7674,967
321
4,168
52, 48741,498
8958,025
6516,938
10,137947
13, 90510,989
880
116. 8213. 6524,279
4, 555
831
r 1 10. 1713. 460
4, 549
7,546
r Revised. ^[Data continue series in the 1942 Supplement; data for October 1941-Febmary 1945 will be published later.§Estimatcd; see note in April 1946 Survey for basis of estimates.i The comparability of the data is affected by a gradual reduction m the number of cities, or changes in the number of dealers or the number of quotations included in the aver-
ages from August 1946 to date; averages for August, September, November, and December 1946 and January 1947 comparable in each case with data shown above for the followingmonth are $16.54, $16.80, $16.62, $16.60, and $16.85, respectively; data for February-June 1947 are directly comparable; in other months comparability was affected only slightly.
©Publication of anthracite stocks has been discontinued and collection of data for consumption of bituminous coal has been indefinitely discontinued.JFor revisions for January 1942-March 1943, see note for paperboard at bottom of p. S-35 of July 1944 Survey; small revisions for January 1944-April 1946 are available on request.f Revised series. The series from the American Paper and Pulp Association beginning in the August 1944 Survey are estimated industry totals and are not comparable with data
in earlier issues; there have been further small revisions in the 1943-44 data as published prior to the June 1945 issue; these revisions and earlier data will be published later.•New series. The new paper series are from the Bureau of the Census and cover production of all mills including producers of building paper and building boards; for 1942 monthly
averages and data for the early months of 1943, see p. S-32 of the August 1944 issue. For data beginning 1934 for shipping containers, see p. 20 of the September 1944 SurveyFor data beginning June 1943 for folding paper boxes, see p. S-32 of the August 1944 Survey; earlier data will be published later. Minor revisions in the January-May 1944 figures fofolding paper boxes and January 1943-May 1944 data for shipping containers are available on request.Digitized for FRASER
http://fraser.stlouisfed.org/ Federal Reserve Bank of St. Louis

S-36 SURVEY OF CURRENT BUSINESS August 1947
Unless otherwise s ta ted , stat ist ics th rough 1941and descriptive notes may be found in t he1942 Supplement to t h e Survey
1947
June
1946
June July August Sep-tember
Octo-ber
Novem-ber
Decem-ber
1947
Janu-ary
Febru-ary March April May
PETROLEUM AND COAL PRODUCTS—Continued
COAL—Continued
Bituminous coal—ContinuedOther consumption:
Vessels (bunker)§ thous of short tonsCoal mine fuel©
Prices, composite:Retail (34 cities) dol. per sh(Wholesale:
Mine runPrepared sizes
do
)rt ton_.
dodn
Production!© - thous. of short tonsStocks, industrial and retail dealers, end of month,
total© thous. of short tons..Industrial, total <^n
Byproduct coke ovensCement millsElectric power utilitiesRailwavs (class I)Steel and rolling mills _Other industrial
Retail dealers, total
dododododododn
COKE
Exports § thous of short tonsPrice, beehive, Connellsville (furnace)
dol. per short ton_.Production:
Beehive thous. of short tonsByproductPetroleum coke
Stocks, end of month:Bvproduct plants, total
At furnace plantsAt merchant plants
Petroleum coke
PETROLEUM AND PRODUCTS
Crude petroleum:Consumption (runs to stills)t -thous.Exports^Imports§Price (Kansas-Okla.) at wells . . . . . . do l . iProduction! thousRefinery operations pet of caStocks, end of month:
Refinablein XT. S.f.. thousAt refineries _ _ .At tank farms and in pipe linesOn leasesf
Heavy in California
dodo
dodododo
ofbbl..dodo
)erbbl__ofbbl,.pacity..
ofbbl..do .dodo
Wells completed! - numberRefined petroleum products:
Gas and fuel oils:Domestic demand :§
Distillate fuel oil thousResidual fuel oil
Consumption by type of consumer:Electric power plantsf -Railways (class I)Vessels (bunker oil)§
Exports: §Distillate fuel oilResidual fuel oil
ofbbl..do
dododo
dodo
Price, fuel oil (Pennsylvania) . . .dol. per gal._Production:
Distillate fuel oil thous. of bbl_.Residual fuel oil fin
Stocks, end of month:Distillate fuel oilResidual fuel oil
Motor fuel:Domestic demand§___ _ .thousExports§
dodo
of bbl__dn
Prices, gasoline:Wholesale, refinery (Okla.) .dol. per galWholesale, tank wagon (N. Y.) . . do.Retail, service stations, 50 cities _ do _
Production, totalf thous. of bbl__Gasoline and naphtha from crude oil • doNatural gasoline and allied products*! do
Sales of 1 p. g. for fuel and chemicals doTransfer of evele products -Used at refineriesf
Retail distributiond* _ mil.Stocks, gasoline, end of month:
Finished gasoline, total .thousAt refineries
Unfinished gasoline _ -Natural gasoline
dodo
of gal. . .
. ofbbL.do
..do
. . d o . . . .
i12.10
6.3686.581
9.562
*>450
1,810
.075
.080
.172
.171
88222
10.93
5.8326.094
50, 579
37, 77735, 2133,630
48211, 4307,297
62411,7502,564
82
7.500
3674,418
159
61636025685
145,0693,4016,2681.210
146,89096
223,14055,119
152, 78615, 2354,9211,396
14,85039,283
2,8516,8595,967
3,684351
.058
23,32036, 569
38,82441,492
63,2212,555
.058
.149
.14264, 34556.705
9,5011,752
1094,9402,619
83, 72650,9118,2457,343
138223
11.23
5.9496.186
51, 350
43,61140, 4503,871
59112, 5947, 641
64215, 1113,161
113
8.750
4685,323
168
709361348
78
150,5414,2917,8131.260
152, 58698
224,35153, 532
155,65615,1634,9681,241
15,09836,734
2, 5126,9035,547
2,540578
.058
24,58936,060
46, 43945, 446
69,0442,321
.060
.151
.15167,44559,921
9,5581.928
1065,2292,856
79,38448,0778,3947,334
146240
11.23
5.9726.194
54,686
47, 99044, 5675,230
76813, 9078,117
84315, 7023,423
97
8. 000
5245,462
186
807398409
72
150, 5504,6027,6311.460
149, 91096
224,15754,785
154, 50114,8715,0661,425
13,82837,925
2,9636,9505,374
2,715321
.062
23, 70335, 942
54,06848,186
66,7013,604
.068
.158
.15569. 70762,079
9,8212.085
1085,7742,784
78,83347, 3477,9126,943
134224
U1.10
5.9766.199
51, 922
52, 36748. 965
5,924891
14, 5638,800
85517, 9323,402
93
8.750
4855,345
190
949503446
89
145,1813,6878,1541.460
143, 70896
222, 41753, 894
153,46915,0545,4011,333
14,52033, 509
2,9146,7293,695
1,992730
.062
23,87734,512
62,01954,012
62,2163,608
.070
.159
.15566,28458,9149,5742,082
1225,3902,555
78, 84847,0218,1737,060
140237
l11 . 08
5.9896.200
57, 485
54, 92451,5326,5931, 046
15,6389,274
88818, 0933,392
76
8.750
5575,512
212
1,120653467
96
146, 8164,6227,1491.460
148, 32394
222,17752,074
155,43414,6695,4831,434
18,13137,014
3,2807,2492,367
891550
.062
24,43233, 777
67,87055, 580
66,5982,386
.070
.159
.15567,30559.60710,2752,444
1336,0232,701
77,62846, 2448,3246,312
135158
U1.14
5.9986.212
37, 501
52, 42949, 5466,3551,054
14, 5497,587
87719,1242,883
78
8.750
3614,925
191
1,034602432
93
140, 5143,7946,1761.485
144, 67493
226, 45353,344
158, 20714,9025,3351,314
23,11041,497
4,3727,3075,002
758316
.062
23, 74133,015
68,14552,735
61,3153,068
.070
.159
.15666,07258,63610,1552,604
1156,2322,498
79,98047, 5818,6075,487
88179
i 11. 22
6 0446.305
43, 746
47,15744, 453
5,222887
13,0446,959
78517, 5562,704
49
8.750
3814,769
197
92957135890
148,1713,5428,4221.560
146, 47195
224, 47353,113
156, 23815,1225,7031,248
32,45047, 405
5,3137,6075,579
1,273831
.066
24,97035,937
59,62047,094
61,0433,688
.070
.161
.15769, 02861,38710, 6512,870
1405,8132,518
84,53451,9278,2084,981
77249
i 11.82
6 2176 498
58,970
49,16946, 003
5,919861
13, 2087,673
90917, 4333,166
49
8.812
5625,619
203
79752327494
146,8972,5298,9561.560
144,80094
223,84855,833
152,98815,0275,5841,453
35, 29448, 299
4,4267,4605,818
876733
.070
24,13136, 390
48,19741, 550
57,0572,892
.070
.161
.15865, 90458, 56010,6513,148
1595,8592,319
90, 30057,0669,3234,794
91214
U1.97
6 2306 518
51,400
49, 47147 3406.645
88113, 4537,682
98517, 6942,131
38
8.875
5145,129
178
71652718977
134, 9532,6108,1721.560
134, 69395
225,12157,106
153,16014, 8555,7901,196
31, 68743, 308
3,6966, 5375,710
1,751713
.070
21, 74634, 390
36, 90138, 480
50, 5514,832
.070
.161
.15960, 48553, 5919,9442,931
1194.9082,173
94, 98561, 3328,6875,010
125233
i 11.99
6.2526.524
54,995
51,67449, 5477,429
93514,0598,2621,141
17, 7212,127
69
8. 875
5805,658
209
67650417291
150,1203,2578,9161.710
152,16094
228,98159,310
154,63715,0345,9991,358
29, 27945,852
3,5647,1386,164
2,093672
.071
25, 57737,876
31,42337,403
59,9474,091
.076
.167
.17166,70159,06911,0333,252
1495,2712,449
96,95263, 0898,7275,265
150
i 12. 00
6.3346.561
41,120
76
9.062
4295,383
195
65246019189
141,2103,9997,8461,810
149,22894
235, 71060,386
160,48414,8405,9531,247
21,32142,140
3,4626,6756,132
2,766635
.073
22,92534,438
30, 26836,455
' 63, 4063,358
.080
.172
.17163,37455, 50210,8032,797
1345,6182,605
' 92, 719r 58, 852
9,0055,604
200
112.09
6. 3346.565
98
9.125
5935,531
218
67144522684
153,3484,7898,3611,810
156,02495
237,76859,013
163,74015,0155,8251,626
19,26240,057
3,2646,6536,470
2,189593
.075
24,95437,328
34, 27939, 992
70,8653,480
.080
.172
.17168, 53560,68110,3922,396i 142
5,300
86, 72754,7528,4825,566
••Revised, d1 See note in April 1946 Survey. • Combined total of data formerly shown as straight run gasoline and cracked gasoline.1 The comparability of the data is affected in some months by a reduction in the number of cities or by a change in the sample; averages for August, September, November, and
December 1946 and January 1947 comparable in each case with data shown above for the following month are $10.93, $11.07, $11.12, $11.40, and $11.94, respectively; February-June 1947are directly comparable and cover 30 cities.
©Collection of data for the indicated coal series has been indefinitely discontinued.§Data continue series published in the 1942 Supplement but suspended during the war period; data for October 1941-February 1945 will be published later.fRevised series. For source of 1939-41 revisions for bituminous coal production, see note marked "f" o n P. s~32 of the April 1943 Survey; revisions for 1942-43 are shown on
p. S-33 of the April 1945 issue; revisions for 1945 are shown on p. S-36 of the March 1947 Survey. For 1941 revisions for the indicated series on petroleum products see notes marked" t " on p. S-33 of the March and April 1943 issues (correction for crude petroleum production January 1941, 110,446); 1942-43 revisions are available upon request.
tlncludes natural gasoline, cycle products, liquefied petroleum gases at natural gasoline plants, and benzol; sales of liquefied petroleum gas for fuels and for chemicals and trans-fers of cycle products are deducted before combining the data with gasoline and naphtha to obtain i otal motor fuel production.
Digitized for FRASER http://fraser.stlouisfed.org/ Federal Reserve Bank of St. Louis

August 1947 SURVEY OF CURRENT BUSINESS S-37
and descriptive notes may be found in the1942 Supplement to the Survey
1947
June
1946
June July August Sep-tember
Octo-ber
Novem-ber
Decem-ber
1947
Janu-ary
Febru-ary March April May
PETROLEUM AND COAL PRODUCTS—Continued
PETROLEUM AND PRODUCTS—Continued
Refined petroleum products—ContinuedKerosene:
Domestic demand§ thous. of bbL.Exports§ doPrice, wholesale, water white, 47°, refinery (Penn-
sylvania) dol. per gal..Production thous. of bbl.Stocks, refinery, end of month do
Lubricants:Domestic demand§ doExports§ d°Price, wholesale, cylinder, refinery (Pennsylvania)
dol. per gaL.Production thous. of bbL.Stocks, refinery, end of month _do
Asphalt:Imports§ short tons..Production _..doStocks, refinery, end of month do
Wax:Production thous. of lb._Stocks, refinery, end of month do
Asphalt prepared roofing, shipments:!Total thous. of squares..
Smooth-surfaced roll roofing and cap sheet-..doMineral-surfaced roll roofing and cap sheet.-_doShingles, all types do
.082
.330
5,1851,566
.0708,3769,063
2,7151,054
.1603,8397,635
8,588738, 200907,600
65, 52081,760
5,0451,5751,0992,371
5,339976
.0718,43510,490
3,049910
.1603,6207,293
9,052851,800819,600
60,48073,920
5,2131,6531,1052,456
4,321767
.0748,17912,382
3,2361,135
.2004,0967,030
18,772871,300691,800
69,16073,360
5,5161,8371,1282,550
5,284701
.0747,82513, 442
3,095694
.2144,0167,244
27,811827,800626, 500
68,60083,160
5,2641,6331,1462,486
7,502312
.0748,56613,926
3,536706
.2484,3277,338
8,253806,500577,800
74,48084,840
5,6461,7601,2372,649
414
.0747,89312,734
2,900906
.2503,8577,384
0670,400622, 200
79, 240
5,3281,7251,1682,435
11, 513664
.0758,7829,772
2,9001,063
.2744,1357,564
615,800702,000
79,80086,240
5,2311,6911,1342,407
12, 325394
.0769,4157,299
2,9511,104
.2984,2047,773
11,389540, 500781, 800
83, 72082, 040
5,8271,9421,2872,598
10, 532930
.0769,2436,126
1, 258.
.3003,9257,753
19,144532,400888, 200
81, 76085,120
5,3001,8861,1622,252
10, 0781,017
.0789,4765,260
2,9291,273
.3084,4808,015
12, 022602, 7001,001,800
93, 52091, 560
5,8091,9691,2732,567
8,082889
.0818,8544,870
3,0661,259
.3104,2677,936
21, 923606, 7001,028,500
80, 08085, 680
6,0971,9971,3262,775
6,068202
.0829,2847,328
3,1041,361
.3104,6088,070
20, 323789,3001,063,100
89,60089,320
5,9681,7981,3992,771
RUBBER AND RUBBER PRODUCTS
RUBBERNatural rubber:
Consumption^ long tons..Imports, including latex and Guayule § doStocks, end of months - do
Synthetic rubber:*Consumption doExports doProduction _ doStocks, end of month... do
Reclaimed rubber:^Consumption doProduction doStocks, end of month do
TIRES AND TUBES
Pneumatic casings:§Exports .thousands-Production do.. .Shipments do._.
Original equipment- do._.Stocks, end of month do.. .
Inner tubes:§Exports do___Production __ doShipments do.. .Stocks, end of month ___do.__
16,4669,545
176,768
62,8995,36763,38894,095
21,72524,88235, 295
2356,3236,503937
3,276
2055,9175,9424,404
21,99821,627169,490
54,5623,16663,176101,007
21, 35022,61935,603
2485,9856,3041,5342,819
1925,8266,1703,907
28,40535,731185, 580
61,4862,188
64, 300103,076
24, 56625,79835,742
2647,0546,8251,689
1937,0346,9183,929
31,12341,737199, 591
58,7982,60363, 765108,840
23, 71523,95635,404
1557,2336,9471,6363,372
1097,1486,7024,433
35,42146,887200, 799
60, 729487
62, 086110,913
26, 70626, 32234,261
1988,1978,4251,8743,041
1258,187
4,106
37,32359, 266
218, 672
57,7941,786
60, 305113, 556
24, 38524, 74833,516
3587,5957,4781,6563,112
2587,6807,2604,483
38, 80246, 658237,467
53,4531,877
114, 963
23, 59725, 25433,666
4137,5118,1371,8392,448
3137,4027,9233,820
45, 32892, 779294,191
58, 7643,45062,103115, 655
27, 71525, 54530, 053
4118,5087,4991,9223,328
3348,7197,1885,075
40, 98360, 678
283, 479
53, 3212,43459,125119,912
25, 48423, 99027, 417
3537,9157,3602,1383,865
2827,8416,2896,621
43,10436,088
280, 812
55,514710
57, 478121,322
26,15726, 20931,940
3638,5777,8922,4574,516
2977,9216,4668,050
43, 81846,011
292, 970
54,333665
50,117116, 829
25, 06626, 69633, 527
4198,3337,2731,8945,608
3377,0935,7319,480
43,09893,026
331, 781
48, 663441
39,069106,848
21, 69725,39237, 223
5028,1047,2832,0056,426
4755,7525,5719,772
STONE, CLAY, AND GLASS PRODUCTS
ABRASIVE PRODUCTS
Coated abrasive paper and cloth, shipments reams. _
PORTLAND CEMENT
Production _ thous. of bbl__Percent of capacity
Shipments 1 __.thous. of bbl._Stocks, finished, end of month doStocks, clinker, end of month do
CLAY PRODUCTS
Brick, unglazed:Price, wholesale, common, composite, f. o. b. plant
dol. per thous..Production* thous. of standard brick..Shipments* doStocks, end of month*. __do
Structural tile, unglazed:*Production _ short tons..Shipments .doStocks _do
Vitrified clay sewer pipe:*Production doShipments doStocks do
134,834
15,97181
18,18817,0925,744
19. 550
147,807
14,48973
14, 56411,8944,928
17. 932376,587354,086235,490
104,10799, 70652, 285
92, 36998, 634
129,427
140,813
15,42075
16. 24911,0644,788
18.074481,547447,614263,564
119,041117,72356, 608
107,901104.072134,529
161,631
16, 21379
17,9559,3084,580
18. 218501,287481,377286,534
125,352124,29356,923
108,042108,446133,143
150,726
16, 45083
17,1538,6123,898
18. 519470,998443,647310,814
116, 845115, 474
57, 664
99, 000106, 518125, 491
166,649
16, 41081
17, 7217,298
18. 551509,839480,121339,129
128, 276122,157
62, 633
116. 567110, 751131, 330
164, 733
15,33578
14,8037,8303,512
19. 010455,676424,705368,953
123,976107,83380, 497
102,85798, 495
134, 560
145, 383
14, 55771
11,49410, 9213,886
19.095381,146354,782383, 824
113,682102, 27887, 580
103,135103, 313137,887
151,364
13,40666
8, 39515,9314,693
19. 270376, 848324, 868448, 752
112,11997, 764101, 950
112,992103, 896143,194
143, 017
12, 61868
8,43420,1125,354
19. 292334,624268, 460509,022
97, 42182, 505116, 503
104, 50493, 241154,653
158,716
14, 20569
12,13322,1785,996
19.400339, 963326,776522, 627
97,44396,050118, 075
109, 254107, 758156,061
155,873
14, 56674
15,414r 21,331r 6,338
19. 412377,586382,610515,806
107,543107,101118,637
101,914107,851150,033
146,352
13,38966
• 15,328• 19,308' 6,326
19. 416410, 744400, 530526, 649
104, 978104,863115, 773
117,071114, 545152, 410
r Revised. §Data continue series published in the 1942 Supplement but suspended during the war period. Data for 1941-45 for tires and tubes and imports of natural rubber areshown on pp. 22 and 23 of the December 1946 Survey. Data for October 1941-February 1945 for other series will be published later.
\ For source of the indicated series and 1941-45 data, see p. 23 of December 1946 Survey; these data continue similar series published in the 1942 Supplement.* New series. Data for 1943-45 for exports of synthetic rubber and for 1941-45 for other synthetic rubber series are shown on p. 23 of the December 1946 Survey. For September
1942-December 1943 data for brick see p. 24 of the February 1945 Survey and for 1939-45 data for clay sewer pipe, p. 23 of December 1946 issue; data for September 1942-February 1945for unelazed structural tile are shown on p. 20 of the April 1947 Survey.
tData for asphalt roofing have been published on a revised basis beginning in the April 1945 Survey; see note in that issue.
Digitized for FRASER http://fraser.stlouisfed.org/ Federal Reserve Bank of St. Louis

S-38 SURVEY OF CURRENT BUSINESS August 1947
Unlessand1942
otherwise stated, statisticsdescriptive notes may beSupplement to the Survey
through 1941found in the
STONE
1947
June June
, CLAY,
July
AND
August
GLASS
1946
Sep-tember
Octo-ber
Novem-ber
Decem-ber
PRODUCTS—Continued
1947
Janu-ary
Febru-ary March April May
GLASS PRODUCTSGlass containers :f
Production.. thous. of gross.Shipments, domestic, total - do...
General use food:Narrow neck food doWide mouth food (incl. packers tumblers) __do..-
Beverage- _-. do...Beer bottles do...Liquor and wine do...Medicinal and toilet doGeneral purpose (chem., household, indus.)__do.._Dairy products _ do...Fruit jars and jelly glasses .do...
Stocks, end of month... _ do...Other glassware, machine-made:
Tumblers :fProduction thous. of doz.Shipments . , . ._ . . .do.. .Stocks .do.—
Table, kitchen, and householdware, shipments tthous. of doz.
Plate glass, polished, production.. thous. of sq. ft.
GYPSUM AND PRODUCTS
Crude gypsum:Importsd1.. short tons.Production do...
Calcined, production. doGypsum products sold or used:
Uncalcined doCalcined:
For building uses:Base-coat plasters .do...Keene's cement do...All other building plasters do...Lath _ thous. of sq. ft_Tile do...Wallboarde do...
Industrial plasters short tons.
9,6198,316
9281,6501,0931,616663
1. 309'433305320
6,854
6,2105,2617,729
3, 33121,026
8,991
8652,502
653415
1,0591,899
663280346
3,729
962i 2,629
595374
1,1461,975
676284
13603,911
7,3896,3474,920
3,84716,316
300,8151,306,845946,851
408,263
331, 2378,295
91, 524281, 7504,055
443,32752,320
9,4269,001
6,0705,9844,997
3,55318,409
10,65910,406
1,287i 3, 217
615417
1,2522,221717332
»3473,917
7,8917,9464,784
4,33516,803
9,8159,633
1,3092,864
529460
1,2162,051
582314309
3,940
6,7116,0785,352
3,64521,142
571, 8711,522,4551,172,746
389,021
422,0258,392
103, 442295,620
4,508557,53749,941
10, 53310, 376
971i 3,204
571576
1,4082,491
687364
U053,906
7,7637,6575,326
5,00023, 271
9,6109,332
7442,978
517573
1,3722,099
65831873
3,905
6,8486,5276,544
3,16820, 781
9,3449,352
72312,881
513639
1,3422,227
651331144
3,591
6,4706,2424,879
2,29818, 411
541, 7331,642,0301,249,901
472,603
482,3069,871
115, 806328, 491
5,138589,374
55, 484
11,15310,101
74313,078
623832
1,4202,295
725359125
4,167
7,5866,3525,095
4,48921,980
9,2818,650
679i 2, 445
569804
1,2621,947
620286138
4,554
4,8354,7366,478
2,66820, 268
10, 5829,645
9182,481760
1,1401,2931,906658356133
5,141
6,2725,9755,575
2,21322,605
186,1991,557,1621,163,981
519, 788
11,833109,089364,6755,464
517, 45858, 577
10,3589,637
1,0502,307853
1,342993
1,967610354161
5,475
6.3396,1406,262
3,45421, 419
TEXTILE PRODUCTS
CLOTHINGHosiery:
Production thous. of dozen pairs.Shipments.. do_..Stocks, end of month ___do...
COTTONCotton (exclusive of linters):
Consumption.. _ bales..Exportsd" doImportscT doPrices received by fanners f dol. per lb__Prices, wholesale, middling, i^e", average, 10 markets
dol. per lb__Production:
Ginnings§ thous. of running balesCrop estimate, equivalent 500-lb. bales
thous. of bales.-Stocks, domestic cotton in the United States, end of
month :JWarehouses thous. of bales..Mills.. do_._.
Cotton linters:Consumption doProduction _ doStocks, end of month do
COTTON MANUFACTURESCotton cloth:
Cotton broad woven goods over 12 inches in width,production, quarterly* mil. of linear yards..
Cotton goods fiinished, quarterly:*Production, total do
Bleached _ doPlain dyed doPrinted do
Exportsd* thous. of sq. yds_.Importscf - - -doPrices, wholesale:
Mill margins. ...cents per lb_.Denims, 28-inch dol. peryd_.Print cloth, 64 x 60* do.Sheeting, unbleached, 36-inch, 56 x 56© do.
728, 251
.341
.372
1,1681,599
7323
382
46.46.338.228.232
13, 00213,14015, 971
792,317409,926
16, 355.260
.292
5,3202,179
8415
2,299
1,788878467443
68, 3103,607
22.01.256.114.138
11, 98411,00816, 854
729,603366,51027,694
.308
.334
162
4,4142,179
9414
347
57. 3825,443
< 24. 97.280.126.138
13, 54512,13518,129
855,611413,39517,896
.336
.355
632
3,7851,983
8726
285
59,4443,581
25.93.312.134.165
13, 20413, 51917, 720
818,449242,17740,984
.353
2,334
4,2801,865
7574
292
2,190
1,604765449390
41,1092,311
27.40.323.140.172
14,55415,13817, 087
931,229103, 78136,201
.377
.361
5,725
5,8451,928
79162349
41, 2012,459
30.86.338.146.180
13, 28913, 58316, 722
877,461455,34251,218
.292
6,1612,019
82169
68,9071,792
40.78'.338.147.180
12,12211, 95316,802
774,177361, 37014,630
.300
.324
7,783
5,9392,125
79129437
2,359
1,810897492421
99,8722,190
47.72.338.185
14,59213,39418, 464
947,036289,672
10, 543
.297
.319
8,166
5,1922,159
94136472
86,3381,687
51.60.338.192
13,17112,52918, 642
840, 463385, 050
10,381.306
.333
4,2432,161
97485
1,123
52.36.338.248.240
12,92112, 71118,853
875,124382,909
12,083
.319
.352
' 8, 513
28,637
3,3192,135
8768
483
2,470
1,792901
402123, 375
53.37.338.255.245
13,02912, 53519, 346
882,880275,104
9,898.323
.351
2,4692,040
8551
466
138,196907
51.25.338.227.232
r Revised. i Jelly glasses included with wide mouth food containers. * Total ginnings of 1946 crop. 3 Not available.* Based on cloth prices for July 24,1946, from the "Textile Apparel Analysis" for first 3 weeks of the month and O. P. A. ceilings for last week.• Data continue the series shown in the Survey through the October 1943 issue; this construction was discontinued during the war period.0 This series was substituted in the November 1943 Survey for the price of 56 x 60 sheeting, production of which was discontinued during the war period.§ Total ginnings to end of month indicated. © Includes laminated board reported as component board; this is a new product not produced prior to 1942.cf Data continue series published in the 1942 Supplement but suspended during the war period; data for October 1941-February 1945 will be published later.t See note in February 1947 Survey for source of August 1941-March 1942 revisions and total cotton stocks in the United States July 31,1946.•New series. For a brief description of the data for cotton broad woven goods and 1943 figures see p. S-35 of August 1944 Survey and for 1939-45 data for cotton goods finishing
p. 23 of August 1946 issue.t Revised series. See note on p. S-34 of the July 1944 Survey regarding changes in the data for glass containers and comparable figures for 1940-42 and note in May 1946 Survey
for changes in the reporting companies for other machine-made glassware; glass container data since October 1945 are from the Bureau of the Census. For revisions for August 1937-July 1942 for farm price ©f cotton, see p. S-35 of June 1944 Survey.
Digitized for FRASER http://fraser.stlouisfed.org/ Federal Reserve Bank of St. Louis

August 1947 SURVEY OF CURRENT BUSINESS S-39
Unless otherwise stated, statistics through 1941and descriptive notes may be found in the1942 Supplement to the Survey
1947
June
1946
June July August Sep-tember
Octo-ber
Novem-ber
Decem-ber
1947
Janu-ary
Febru-ary March April M a y
TEXTILE PRODUCTS—Continued
COTTON MANUFACTURES—Continued
Cotton cordage, rope, and twine production, quarterly*thous. of lb.
Cotton y am:Produc tion (sale yarn), total* -do—
Carde d and combed yarns:Weaving _ do—Machine knitting - _do_-_.Thread do—All ot her carded and combed d o —
Cotton-rayon and other mixed fiber -doPrices, wholesale:
Southern, 22/1, cones, carded, white, for knitting(mill)t - dol. perlb>._
Southern, 40s, single, carded (mill) doSpindle activity:
Active spindles thousands.Active spindle hours, total .mil. of hr_
Average per spindle in place hours..Operations... - Pet. of capacity..
RAYON AND MANUFACTURESYarn and staple fiber:
Consumption:Filament yarn mil. of lb .Staple fiber -—do
Imports§ thous. of lb_.Prices, wholesale:
Yarn, viscose, 150 denier, first quality, minimumfilament —dol. perlb..
Staple fiber, viscose, 1H denier doStocks, producers', end of month:
Filament yarn mil. of lb._Staple fiber —do
Rayon goods, production, quarterly:*Broad woven goods ...thous. of linear yards...Finished, total do
White finished — do.—Plain dyed doPrinted -—do
31,488
217,783
79,87473,6149,272
42, 80212, 221
29,201
212,941
81,25469,8789,478
40,99811,333
29,855
218, 508
84,83573,0059,472
40,11211, 084
.706
21,3249,103
382113.6
53.815.4
.6C0
.320
8.46.1
.543
.672
21,9448,807
115.4
51.814.1
3,428
.550
.250
7.31.8
439,178454,32251,659299,498103,165
.672
21,9848,007
33695.3
52.015.6
3,653
.550
.250
8.72.2
.643
.756
22,0199,449
396112.4
57.315.0
.550
.250
8.42.3
WOOLConsumption (scoured basis):J
Apparel class — _thous. of lb_.Carpet class . . . do .
Imports! do.Prices, wholesale:
Raw, territory. 64s, 70s, 80s, fine, scoured*.dol. per lb_.Raw, bright fleece, 56s, greasy* doAustralian, 64-70s, good top making, scoured, in bond
(Boston)*. dol. per l b . .Stocks, scoured basis, end of mo., totalf...thous. of lb__
Apparel, totalf - - do.Domesticf - do_Foreignf ___do.
Carpetf do.
1.225.565
1.002
49,60410,26873, 717
.465
.745567, 349466, 489264,897201, 592
60,7509,135
103, 453
.995
.465
.745
49,78810,30889, 723
.995
.465
.745
WOOL MANUFACTURESMachinery activity (weekly average) :
Looms:W^oolen and worsted:
Broad thous. of active hours—Narrow do
Carpet and rug:Broad doNarrow do
Spinning spindles:Woolen ___doWorsted .-do
Worsted combs doWoolen and worsted woven goods (except woven felts) :*
Production, quarterly, total._.thous. of lin. yards.-Apparel fabrics do
Men's wear ..doWomen's and children's wear. . . . . .doGeneral use and other fabrics do
Blankets doOther nonapparel fabrics .do
Wool yarn:Production total*1 --..thous. of lb . .
Knitting*! — do. . . -
100,860
2,640
10794
123,986114, 293
220
154,414134,01758,093
2,159
f7870
98,19189,145
177
84
10694
123,886110,807
217
60, 73415,19012,077
Weaving*i _ doCarpet and other*} do.
Price, wholesale, worsted yarn, 2/32s (Boston)dol. per lb_.
MISCELLANEOUS PRODUCTSFur, sales by dealers thous. of doL.Pyroxylin-coated fabrics:J
Orders, unfilled, end of month thous. lin. ydPyroxylin spread _ _.-thous. of lb . .Shipments, billed thous. lin. yd.
1.950
7,7784,5576,034
8,320
75,25512,98751, 67610, 592
1.900
4,236
13,4685,7487,653
.671
.804
21,6399,037379
114.4
54.214.02,423
.550
.250
9.12.6
408,204384,57441,669267,18575,720
49,90010,26085,658
.995
.465
.745597, 502490, 847297,499193,348106,655
2,59286
105
120,847112,153
223
146, 588127,20155,02656,85915,31611,8337,554
.834
21,75410,143
424116.2
59.615.73,108
.550
.250
9.72.6
1.819
21,5249,499397
119.6
58.013.0
3,708
.585
.265
9.72.5
1.819
21, 6888,671362
107.8
55.912.94,277
.620
6.01.6
428,131439, 91250, 587299, 59589,730
».819
21,91910,588
444123.3
62.415.1
5,770
.620
.280
7.32.7
.6991.819
21, 9549,590402
125.6
56.314.9
4,326
.320
6.92.3
63,37513,43570, 236
1.037.480
.757
48,15611,49266,177
1.106.490
.789
46,65611,75256,553
1.145.530
.850544, 729
57,75014,25073, 614
1.155.530
.850
48,94413, 08857, 705
1.165.545
.850
2,68786
113101
122, 605118,212
230
2,55185
110100
117,164112,384
221
73,31612,96850, 7449,604
1.900
3,103
13,8005,6517,371
75,38312,87151,86410,648
1.900
4,813
13, 5896,9728,552
72,96812,42050, 34810,200
1.900
7,553
13,2816,2877,151
92,93815,50963, 59113,838
1.900
4,640
12,9147,4809,867
71,30811,49548,41511,398
1.900
3,332
12,3547,2059,217
442, 224273, 916168, 308102,505
2,54777
113102
112, 558114,515
226
156,907137,35861,30961,03715,01212,2117,338
68,30310, 56846,48611,249
1.900
1.819
21,95310,030
421125.4
60.016.24,350
.690
.320
7.03.1
462,579465,26064,123299,072102,065
45,72413, 67667,528
1.195.555
.872497,732
.7151.882
21,80510,243
428121.7
60.0'18.34,233
.320
7.72.9
52,97015, 99563, 291
1.225.565
.939
2,50375
109101
114,434227
2,63270
118114
108, 936123,186
245
404,228244,579159,64993,504
2,51666
127114
122,115245
144, 286125, 73361,14349, 27015,32011,126
2 -2,32247
131'117
' 88,402118,421
'236
7,427
82,91512,49556,61513,805
1.950
68, 7689,71246,62412, 432
1.950
65, 2768,75643,62412,896
1.950
73,355' 8,84549,42515,085
1.950
13,1947,0589,135
12,5317,7549,423
12,1527,201
11,4586,5347,897
9,9286,6678,419
.715
21,6249,928415
119.7
'59.5'18.42,501
.320
'8.53.8
38,46813,46462.112
1.225.565
.990
2 2,19846
130117
83,102112,346
223
55,8486,31237,01212, 524
1.950
8,1775,7267,121
' Revised. * Quotations are for cotton yarn twisted, 40/1, carded, and are not comparable with data prior to November 1946; comparable October 194R figure $0 8192 Data exclude operations of pile and Jacquard looms amounting to 91,000 (revised) and 81,000 hours (weekly average) for April and May respectivelyIData for April, July, and October 1946 and January and April 1947 are for 5 weeks; other months 4 weeks.§Data continue series published in the 1942 Supplement but suspended during the war period; data for October 1941-February 1945 will be published later.JSee note in the April 1946 Survey with regard to changes in these series; data related to cotton fabrics only prior to August 1945.fRevised series. See p. S-35 of the November 1942 Survey for 1941 data for the yarn price series and p. S-35 of the May 1943 issue regarding a change in the coverage of the wool
stocks series; stocks were revised in the March 1947 Survey to include corrections and to transfer wool 40s and below to apparel class; revised data for 1942-45 will be shown laterstocks include wool held by Commodity Credit Corporation but exclude foreign wool held by Defense Supplies Corporation. '
•New series. For 1939 and 1943-45 data for rayon goods finishing, see p. 23 of the August 1946 Survey. Data for rayon wo
g p c e f ustraia wool is from the Department of Agriculture; prices are before payment of duty; data beginning 1936 will be shown later; 1939-43other wool price series are on p. 24 of the February 1945 Survey. For available data for 1937-43 for woolen and worsted goods production, see p. 19 of May 1945 Survey.Digitized for FRASER
http://fraser.stlouisfed.org/ Federal Reserve Bank of St. Louis

S-40 SURVEY OF CUEEENT BUSINESS August 1947
Unless otherwise stated, statistics through 1941and descriptive notes may be found in the1942 Supplement to the Survey
1947
June
1946
June July August Sep-tember
Octo-ber
Novem-ber
Decem-ber
1947
Janu-ary
Febru-ary March April May
TRANSPORTATION EQUIPMENT
MOTOR VEHICLES
Exports, assembled, total§ ___.number-Passenger cars§ doTrueks§ do . . .
Factory sales. total§ doCoaches, totaL.. do_._
Domestic . doPassenger cars, total do___
Domestic. d o . . .Trucks, total do . . .
Domestic. . . . d o . . .Production:*
Passenger cars do . . .Trucks and truck tractors, total (incl. military), do. _.
Civilian, total do . . .Heavy _ . do . . .Medium d o . . .Light. _ -do. . .
Truck trailers, production, total* do . . .Complete trailers . . d o . . .
Vans do___All other do . . .
Chassis shipped as such do . . .Registrations:§
New passenger cars do . . .New commercial cars do___
RAILWAY EQUIPMENT
American Railway Car Institute:Shipments:
Freight cars, total number..Domestic do
Passenger cars, totalt doDomestic! -do
Association of American Railroads:Freight cars, end of month:
Number owned thousands..Undergoing or awaiting classified repairs..do
Percent of total on lineOrders, unfilled cars..
Equipment manufacturers doRailroad shops .do
Locomotives, end of month:Steam, undergoing or awaiting classified repairs
number..Percent of total on line
Orders unfilled:Steam locomotives, total number.
Equipment manufacturers doRailroad shops do
Other locomotives, total* doEquipment manufacturers* doRailroad shops* do
Exports of locomotives, total § doSteam§ doOther§ .do. . .
INDUSTRIAL ELECTRIC TRUCKS ANDTRACTORS
Shipments, total.. .number.Domestic do.. .Exports. do__.
401, 5521,6281,409
305,943281,867
93, 9S173, 693
5,2434,230
6763
1,73477
4.793,15968,67524, 484
2,7357.6
23, 6447,013
16, 631201, 902
774751
141,090131, 28460, 03850, 247
142, 31358, 73958, 7394,06618, 60836, 0655,0334,4591,9832,476574
493, 29946, 488
2,6622,094
5656
1,749784.7
36,05828,6837,375
3,1798.3
7016
52951514
27326013
23, 69410, 51813,176
297, 633862833
209,180195,15887, 59172,102
220, 32193,45893, 4585,995
49, 52937, 9345,9665,6542,2873,367312
172,96153, 657
3,0982,570
6161
1,748804.7
41,41734,6096,808
3,2988.7
76601652851414
22717453
25824711
32, 20314, 93717, 266
346, 2091, 067867
247, 261229, 08397, 88178, 283
241, 302105,516105, 5164,84057,06243, 6147,6507,2073,0914,116443
199,31662,820
4,6254,234
1,748744.4
42,71435,3677,347
3,2178.5
695514
48747314
23614096
26524520
27, 37112, 47714, 894
328, 795833758
232, 280218, 64595, 68277, 501
239,41292, 01492, 0146, 07144,55941,3846, 5786,1432,6793,464435
219, 28169, 565
3,9153,244
6934
1,746734.3
53,72737, 21316, 514
3,1958.5
655312
4904900
11466
229220
23, 01711.83211,185
391, 727975923
283, 586263,236107,16688, 207
285, 606109, 953109,9538,94051,17549, 8388,7318,1533,9874,166578
225,18074, 708
5,9573,057
4545
1,743674.0
52,81736,94215,875
3,1478.4
675710
5065060925834
31129318
47, 70822, 49625, 212371,156
1,1461,102
269, 081250, 379100,92979,138
261, 007100, 552100, 5528,40150,15841,9937,4497,0513,1473,904
230,42463,978
7,1882,442
6060
1,742674.0
54, 41339,17915, 234
3,2048.5
65578
4994990
253141112
27625818
41,15816, 25724,901
375, 7191. 4381, 339
266, 665244,931107,61682, 774
262, 076101, 484101, 4847,69151,82541,9686,8866,5063,4613,045380
274, 73569,453
6,7372,056
6060
1,740674.0
54, 77838, 71616,062
3,1378.4
64577
5405400
19249143
33030624
40,26819, 74220. 526347,696* 1, 273r 1,115246,605226,695' 99,818'77,434
252,100102, 727102, 72710. 45848,97843,2917,5237,2063,7623,444317
209.06362,477
6,9912,265
5858
1,740664.0
60,52944,14416, 385
3,1758.6
53485
6865860
195
320294
41,67819.32122. 357373,360r 1, 303'1,090267,015245,081105,042
r 83,276
263, 998114,909114, 909
9,25057, 75747, 9026,5706,2363,2582,978
334
214,33363, 752
7,5751,784
69
1, 73868
4.166, 35349, 93416, 419
3,1318.5
45423
635635
018812761
27325122
54,76525,66629, 099
421,1801,4211,272
301.525280,018118,234
r 92,082
302, 954117,217117, 21711,44556,13749,6355,9425,5682,6622,906374
264,71479, 344
8,8162,439
5353
1,736694.2
78,08060,44617,634
3,0458.3
52511
018673113
32028337
57, 29126,71130,580423,3991, 6501,465
314,765291,953106,984' 83, 515
5,277r 4,9732,106
r 2, 867304
8,8733,489
7373
1,736724.3
84, 28863, 93520, 353
3,0118. 3
06266260
1437172
42037743
CANADIAN STATISTICSPhysical volume of industrial production, adjusted:
Combined indexf 1935-39=100.Electric powerf do. . .Manufacturing! do___Miningf do. . .
Distribution, combined indexf do. . .Agricultural marketings, adjusted:!
Combined index do. . .Grain. _ doLivestock do.. .
Commodity prices:Cost of living . . .do . . .Wholesale prices 1926=100.
R ail ways:Carloadings , _.thous. of cars.Revenue freight carried 1 mile... ...mil. of tons.Passengers carried 1 mile mil. of passengers.
134.9127.8
156.4164.5165.4100.5178.0
97.192.9115.4
123.6109.3
2914,055420
153.5168.2161.768.5
178.6
146.6148.4138.7
125.1109.7
3054,048484
149.7164.3157.895.5
183.4
132.8133.2131.0
125.6109.3
3254,406
501
152.1155.2160.5102.7175.0
97.296.568.5
125.5109.2
3245,142
373
157.6155.3167.8100.9168.1
106.8103.2122.5
126.8111.0
3715,467292
165.6154.0177.6104.1183.6
121.7115.1150.5
127.1111.6
3495,267279
167.9158.3179.2109.5200.2
108.298.1152.2
127.1112.0
2954,814341
173.8173.5184.9110.4208.2
134.7140.4109.5
127.0114.2
3024,743287
176.3172.5189.0106.8181.9
77.770.2103.7
127.8118.1
2703,963241
177.1174.2188.5113.3179.7
96.597.691.4
128.9120.4
5,259268
177.6174.6188.9115.3
130.6122.9
3114,972276
«• Revised. * Total for January-June; monthly data not available.JData for October 1945-January 1946 and April 1946 include converted troop kitchens and troop sleepers.§Data continue series published in the 1942 Supplement, except that changes have been made in the classifications in some instances. Data for exports of "total locomotives" and
"other locomotives" were revised in the May 1946 Survey (see note in that issue); data through February 1945 for the revised series and for October 1941-February 1945 for the otherexport series will be published later. In the factory sales data, coaches were formerly included with trucks and changes have been made in the classification of certain special typevehicles; revised monthly figures for 1940-41 and annual totals for 1942-45 are shown on p. 24 of the June 1947 Survey; the factory sales figures include certain types of vehicles (forexample, half-tracks) not included in the production figures above. Revised figures for new car registrations beginning 1940 for commercial cars and 1941 for passengers cars throughMarch 1942 will also be published: R. L. Polk Co., source of these data, did not report registrations for April 1942-December 1945.
later. Data for truck trailers are from the Bureau of the Census and are industry totals; annual total production for 1939-41 and monthly figures for 1942-45 will be published later.t Revised series. The Canadian index of industrial production has been completely revised beginning 1935; earlier data are in process of revision. The number of industries and
products represented in the index has been greatly increased and the construction component has been omitted in view of the inadequacy of current data. Revised indexes for dis-tribution and agricultural marketings have been shown beginning in the December 1942 issue.
U. S. GOVERNMENT PRINTING OFFICE: 1 9 4 7
Digitized for FRASER http://fraser.stlouisfed.org/ Federal Reserve Bank of St. Louis

INDEX TO MONTHLY BUS5NESS STATISTICS, Pages S1-S40Pages marked S
brasive paper and cloth (coated) 37rids - - - -— 23Ivertising 6, 7?ricultural income, marketings 1»ricultural wages, loan* 14,15r-line operations 21rcraft industry.. 10, 11, 12, 13, 14cobol, denatured, ethyl, and methyl 23cohoiic beverages 1, 2, 26uminum 32limal fats, greases 24,25ithracite 2,4,11,12,13, 14,35Dparcl, wearing.... 4, 6, 7, 8,10,11,12,13,14,38,39•med forces 9tphalt.. . . . 37ltomobiles 1, 2, 6, 7,10,11,12,13,14,17
inking . 15u-ley — 27jrrels and drums 32sttery shipments 34;ef and veal 28averages, alcoholic 1,2,26tuminous coal 2,4,11,12,13,14,35,36>ilers _ 33>nds, issues, prices, sales, yields 18, 19>ok publication 35ass 32ick 4,37okers' loans 15, 18lilding contracts awarded 5lilding costs 5, 6lilding construction (see Construction).lilding materials, prices, retail trade 4,7,8,9isinesses operating and business turn-over._ 3ltter 26median statistics 16,17,40mdy 28ms, metal 32ipital flotations 18For productive uses 18irloadings 22ittlf and calves 27, 28'llulose plastic products 25>ment 1,2,4,37Teal and bakery products 4lain-store sales 8leese 26lemicals 1, 2,3, 4,10,11,13,14,17, 23gars and cigarettes 29vil-service employees 11ay product? (see also Stone, clay, etc.) 1, 2, 37othing 4,6, 7,8, 10, 11, 12, 13, 14,38>al 2,4,11, 12,13,14,35,36>coa 28>ffee 28>ke 2,36mimercial and industrial failures 3instruction:New construction, dollar value 5Contracts awarded 5Costs 5,6Dwelling units started m 5Highway 5, 11Employment, wage rates, earnings, hours 9,
11,12,14msumer credit 15, 16msumer expenditures, consumers' price index . 4,7>pper 32, 33>pra and coconut oil 24>rn __ 27>st-of living index. (See Consumers' price
index) 4>tton, raw, and manufactures 2,
4, 10,11,12,13, 14,38,39ittonseed, cake and meal, oil 24anes, electric overhead 33ops 1, 24, 26, 27irrency in circulation 17siry products 1, 2,3,4, 26•bits, bank 15:bt, short-term, consumer 15, 16;bt, United States Government 17apartment stores, sales, stock*, collections.. 7, 8, 9?posits, bank 15, 17sputes, industrial 12stilled spirits 26vidend payments and rates 1, 19ug store sales 7, 8veiling units started 5
trnings, weekly and hourly 13, 14;gs and chickens 1, 3, 4, 28ectrical equipment 2,3,7,34ectric power production, sales, revenues 25nployment estimates . 9, 10nployment indexes:Factory, by industries 10, 11Nonmanufacturing industries 11nployment security operations 12nigration and immigration 22igineering construction 5:change rates, foreign 16:penditures, United States Government 17:plo«jive8 23:ports (see also individual commodities) 20, 21ctory, employment, pay rolls, hours, wages. 9,
10,11, 12,13,14lilures, industrial and commercial 3[irchild's retail price index 4rm marketings and income ._ 1rm wages 14irm products, farm, and wholesale prices 3, 4its and oils _ ._ 4, 24, 25
Pages marked SFederal Government, finance 17, 18Federal Reserve banks, condition of 15Federal Reserve reporting member banks 15Fertilizers 4, 23Fire losses 6Fish oils and fish __ 24,28Flaxseed 24Flooring „ 30Flour, wheat 27Food products 2,
3, 4, 7,10,11,12,13,14,17, 26, 27, 28, 29Footwear 2,4,7,8, 10,12, 13,14,30Foreclosures, real estate 6Foreign trade, indexes, shipping weight, value
by regions, countries, economic classes andcommodity groups 20, 21
Foundry equipment 33Freight cars (equipment) 40Freight carloadings, cars, indexes 22Freight-car surplus and shortage 22Fruits and vegetables 2, 3, 4, 26Fuel equipment and heating apparatus 33Fuels _ 2,4,35,36,37Furnaces 33, 34Furniture 1,4,10, 11,12, 13, 31Gas, customers, sales, revenues 25Gas and fuel oils 36Gasoline 36Glass and glassware (see also Stone, clay, etc.). 38Gelatin ___ ___ 23Gloves and mittens 30Glycerin 23Gold _ 16Goods in warehouses 7Grains _ 3, 27Gypsum 38Heating and ventilating equipment 33Hides and skins 4, 29Highways 5, 11Hogs 27, 28Home-loan banks, loans outstanding 6Home mortgages 6Hosiery 4,38Hotels — - 11, 13, 22Hours of work per week 11, 12Housefurnishings 4, 6, 7, 8Housing 4, 5Immigration and emigration 22Imports... 20, 21Income, personal 1Income-tax receipts 17Incorporations, business, new 3lodustrial production indexes 1, 2Instalment loans 15, 16Instalment sales, department stores 8, 9Insurance, life 16Interest and money rates 15Inventories, manufacturers' and trade 3,8Iron and steel, crude and manufactures 1,
2, 4, 9, 10, 11, 12, 13, 17, 31, 32Kerosene.. 37
Labor force 9Labor disputes, turn-over 12Lamb and mutton 28Lard. - 28Lead - 33Leather and products 2, 4,10, 11, 12, 13, 29, 30Linseed oil, cake, and meal 24Livestock _-- 1,3,27,28Loans, real estate, agricultural, bank, brokers'
(seeslso Consumer credit) 6,15,18Locomotives ^ 40Looms, woolen, activity 39Lubricants 37Lumber 1, 2, 4, 10,11, 12, 13, 30, 31Machine activity, cotton, wool 39Machine tools 10, 11, 12, 13, 33Machinery 1, 2, 10, 11, 12, 13, 17, 34Magazine advertising 7Mail-order houses, sales 8,9Manufacturers' orders, shipments, inventories. 2, 3Manufacturing production indexes 1, 2Meats and meat packing-_ 1, 2, 3, 4,10, 12, 13, 14, 28Metals 1, 4, 10, 11, 12, 13,17, 32, 33Methanol 23Milk. - - - 26Minerals _ 2, 10, 11, 12, 14Money supply 17Mortgage loans 6, 15Motor fuel 36Motor vehicles.. 7,40Motors, electrical 34Newspaper advertising 6, 7Newsprint 35New York Stock Exchange _ . - 19Oats 27Oil burners 33Oils and fata 4,24,25Oleomargarine 25Operating businesses and business turn-over. _ 3Orders, new, manufacturers' 2Paint and paint materials . . . 4, 25Paper and pulp 2, 3, 4, 10, 11, 13,14, 35Paper products 35Passports issued 22Pay rolls, manufacturing and nonmanufactur-
ing industries 12, 13Personal income 1Petroleum and products 2,
3,4,10,12,13,14,17,36,37
Pages marked SPig iron _ _ 32Plant and equipment expenditures 3Plywood 31Porcelain enameled products 32Pork 28Postal business _. 7Postal savings 15Poultry and eggs , 1,3,28Price* (see also individual commodities):
Consumers' price index 4Received and paid by farmers 3Retail price indexes 4Wholesale price indexes 4
Printing 2,10,11,13,14,35Profits, corporation 17Public assistance 14Public utilities 4,5,11,12,13,14,17,18,19, 20Pullman Company.PulpwoodPumpsPurchasing power of the dollar-Pyroxylin coated fabrics
Radio advertisingRailways, operations, equipment, financial sta-
tistics, employment, wages12,13,14,17,18,19,20,
Railways, street (see Street railways, etc.).Rayon, and rayon manufactures- 2,4,10,12,13,Receipts, United States GovernmentReconstruction Finance Corporation, loansRents (housing), indexRetail trade, all retail stores, chain stores,
department stores, mail order, rural sales,general merchandise
RiceRoofing, asphalt „Rosin and turpentineRubber, natural, synthetic and reclaimed,
tires, and tubesRubber industry, production index, employ-
ment, pay rolls, hours, earnings3,10,12,
Savings depositsSewer pipe, claySewing machines «Sheep and lambs .Shipbuilding _ 10,11,12,Shipments, manufacturers'Shoes 2,4,7,8,10,12,13,ShorteningsSilverSkinsSlaughtering and meatpacking- 2,10,12,13,14,Soybeans, and soybean oilSpindle activity, cotton, woolStee! ingot* and steel manufacture* (see also
Iron and steel)Steel, scrapStocks, department stores (see also Manufac-
turers' inventories)Stocks, issues, prices, sales, yieldsStokers, mechanicalStone, clay, and glass products
2,10,11,12,13,14,StovesStreet railways and busses 11,Sugar -—SulphurSulfuric acidSuperphosphate - - —
Tea _Telephone, telegraph, cable, and radio-tele-
graph carriers 11,12,14,Textiles 2,3,4,10,11,12,13,14,Tile.Tin -Tires and inner tubesTobacco 2,10,11,13,Toois, machine.. 10,11,12,13,Trade, retail and wholesale 7,8,9,11,Transit lines, localTransportation, commodity and passengerTransportation equipment
2,9,10,11,12,13,14,Travel ,.Truck trailersTrucks and tractorsTurpentine and rosin
223434
539
11,22,40
14,3917184
7,8,9273724
37
2,13,14
153734
27,2813,14
214,30
251729
27.2824,25
39
3231,32
919,20
341,
37,3833
12,1428,29
232323
29
17,2238,39
383337
14,2914,3313,14
2121,23
17,4021,22
404024
Unemployment 9United States Government bonds 17,18,19United States Government, finance 17,18Utilities 4,5,9,12,13,14,17,18,19, 20
Variety stores 7,8Vegetable oils.. . — 24,25Vegetables and fruits 2,3,4,26Vessels cleared in foreign trade >, 22Veterans' unemployment allowances 12
Wages, factory and miscellaneous 13,14War expenditures 17War Savings Bonds 17Warehouses, apace occupied 7Water heaters 33Water transportation, employment, pay rolls__ 11,13Wheat and wheat flour 27Wholesale price indexes 4Wholesale trade 9Wood pulp -- - - 4,34Wool and wool manufactures.. 2,4,10,12,13,14,39
Zinc. 33Digitized for FRASER http://fraser.stlouisfed.org/ Federal Reserve Bank of St. Louis

NEW AND REVISED ESTIMATES OF THE
National Income and Gross National
Product of the U. S.
Beginning with the July 1947 issue, the
SURVEY OF CURRENT BUSINESS will show
revised national income and gross national
products statistics differing in many respects
from those previously published.
All data prior to July 1947 are subject to
this revision, which extends back to the be-
ginning of the series in 1929.
The completely revised 1929-46 series, with
detail for all component segments, have
been published in a separate NATIONAL
INCOME SUPPLEMENT to the Survey of
Current Business. Thus, this publication
furnishes to business managers and analysts,
economists, and students the new basic
data to which all subsequently published
national income and gross national product
figures will be related.
The SUPPLEMENT contains, in addition
to extensive statistical tables incorporating
the revisions, an explanation of important
changes in fundamental concepts and pro-
cedures underlying the data. It has been
prepared by the National Income Division,
Office of Business Economics which com-
piles the official national income and gross
national product data for the United States.
Now Available in the
NATIONAL INCOME SUPPLEMENTto the SURVEY OF CURRENT BUSINESS
JULY 1947
For sale by the Superintendent of Documents t Price 25 cents. Order direct from the Superintendent of Documents,U. S. Government Printing Office, Washington 25, D. C.
Digitized for FRASER http://fraser.stlouisfed.org/ Federal Reserve Bank of St. Louis