scenario modelling and analysis report section 4.5 ... · scenario modelling and analysis report ....
TRANSCRIPT

Humber River Watershed Scenario Modelling and Analysis Report
Section 4.5
Terrestrial System

TABLE OF CONTENTS
4.5 TERRESTRIAL SYSTEM ................................................................................. 4.5-1 4.5.1 Key Indicators .......................................................................................... 4.5-14.5.2 Terrestrial Natural Heritage Analysis Methods ........................................ 4.5-24.5.3 Development of a Target Terrestrial Natural Heritage System ............... 4.5-54.5.4 Scenarios of Focus for Terrestrial Natural Heritage Evaluation .............. 4.5-74.5.5 Baseline Conditions ................................................................................. 4.5-84.5.6 Effects of Conventional Urban Development ........................................ 4.5-114.5.7 Effects of End-of-Pipe Stormwater Retrofits .......................................... 4.5-164.5.8 Effects of Expanded Natural Cover ....................................................... 4.5-164.5.9 Effects of Sustainable Communities ..................................................... 4.5-224.5.10 Effects of Climate Change ..................................................................... 4.5-254.5.11 Summary and Conclusions ................................................................... 4.5-264.5.12 Management Considerations ................................................................ 4.5-274.5.13 References ............................................................................................. 4.5-29
LIST OF FIGURES Figure 4.5-1: Land Cover in the Humber Watershed, 2002 Conditions (Scenario 1) . 4.5-8Figure 4.5-2: Results of the LAM habitat quality analysis for Humber watershed – 2002 Conditions (Scenario 1) ................................................................... 4.5-9Figure 4.5-3: Subwatershed histograms of area of patches by total quality score rank – 2002 Conditions (Scenario 1) ................................................................. 4.5-10Figure 4.5-4: Land Cover in the Humber Watershed, Official Plan Build-out (Scenario 2)
................................................................................................................ 4.5-11Figure 4.5-5: Subwatershed histograms of area of patches by total quality score rank
Official Plan Build-out (Scenario 2) ........................................................ 4.5-12Figure 4.5-6: Land Cover in the Humber Watershed, Full Build-out (Scenario 5) .... 4.5-13Figure 4.5-7: Results of the LAM habitat quality analysis for Humber watershed – Full
Build-out (Scenario 5) ............................................................................. 4.5-14Figure 4.5-8: Subwatershed histograms of area of patches by total quality score rank
Full Build-out (Scenario 5) ...................................................................... 4.5-15Figure 4.5-9: Land Cover in the Humber Watershed, Official Plan Build-out with
Expanded Natural Cover (Scenario 4) ................................................... 4.5-16Figure 4.5-10: Subwatershed histograms of area of patches by total quality score rank
Official Plan Build-out with Expanded Natural Cover (Scenario 4) ....... 4.5-17Figure 4.5-11: Results of the LAM habitat quality analysis for Humber watershed -
Official Plan Build-out with Expanded Natural Cover (Scenario 4) ....... 4.5-18Figure 4.5-12: Results of the LAM habitat quality analysis for the Humber River watershed final target terrestrial natural heritage system 4.5-21 Figure 4.5-13: Land Cover in the Humber Watershed, Sustainable Communities
(Scenario 6) ............................................................................................ 4.5-22Figure 4.5-14: Results of the LAM habitat quality analysis for Humber watershed -
Sustainable Communities (Scenario 6) ................................................. 4.5-24

LIST OF TABLES Table 4.5-1: Terrestrial System Objectives, Indicators and Targets ............................ 4.5-2Table 4.5-2: Natural Cover Patch Total Quality Score Rating Criteria ........................ 4.5-4Table 4.5-3: Humber River Watershed Scenario Comparison – (A) Percent Natural Cover
and (B) Percent Urban Cover ................................................................... 4.5-7Table 4.5-4: Landscape Analysis Model results showing quality of habitat patches under
Baseline (2002) Conditions (Scenario 1) ............................................... 4.5-10Table 4.5-5: Landscape Analysis Model results showing quality of habitat patches under
the land use in Official Plan Build-out (Scenario 2) ............................... 4.5-12Table 4.5-6: Landscape Analysis Model results showing quality of habitat patches – Full
Build-out (Scenario 5) ............................................................................. 4.5-13Table 4.5-7: Landscape Analysis Model results showing quality of habitat patches –
Official Plan Build-out with Expanded Natural Cover (Scenario 4) ....... 4.5-17Table 4.5-8: Comparison of LAM results for quality of habitat patches between Scenario 4 and the final targeted system recommended for the Humber River watershed 4.5-20 Table 4.5-9: Landscape Analysis Model results showing quality of habitat patches under
Sustainable Communities (Scenario 6) ................................................. 4.5-23
Humber River Watershed Scenario Modelling and Analysis Report
4.5-1
Section
4.5
TERRESTRIAL SYSTEM
4.5 TERRESTRIAL SYSTEM In the Toronto Region, terrestrial natural heritage cover consists of forests, wetlands, meadows (including prairies, savannahs) and coastal habitat (including beach, bluff). These features represent one component of the overall terrestrial natural heritage system, which also includes natural processes (functions) and the linkages between features and functions. While this study focuses on an analysis of the terrestrial system within the Humber River watershed, it is important to understand that this system is an interdependent part of a broader regional terrestrial natural heritage system. The Toronto Region Conservation Authority’s (TRCA) Toronto and Region Terrestrial Natural Heritage System Strategy (TRCA, 2007a) defines the regional system for its jurisdiction and provides guidance toward achieving the Authority’s objective for regional biodiversity which is: to protect and restore a regional system of natural areas that provide habitat for plant and animal species, improve air quality and provide opportunities for enjoyment of nature. The objective for regional biodiversity is critical to other Living City objectives in its contribution to water management and liveable communities. The Strategy represents a new approach to terrestrial systems analysis and management. It is in response to decreasing trends in the abundance and diversity of species within Toronto watersheds and recognition that “business as usual” has not resulted in the protection of ecological function and biodiversity. The framework of indicators, analytical approaches and tools used in the Humber River watershed scenario modelling and analysis are drawn from the TRCA’s Terrestrial Natural Heritage System Strategy (TNHSS) and are described in the following sections. 4.5.1 Key Indicators The terrestrial system objectives, indicators and targets developed for the Humber River watershed are summarized in Table 4.5-1. The condition of the existing terrestrial natural heritage system and predicted changes in that system in response to future land use and management scenarios can be described using indicators of, quantity, quality and the distribution of quality of natural cover. These indicators contribute to an assessment of overall biodiversity.
Humber River Watershed Scenario Modelling and Analysis Report
4.5-2
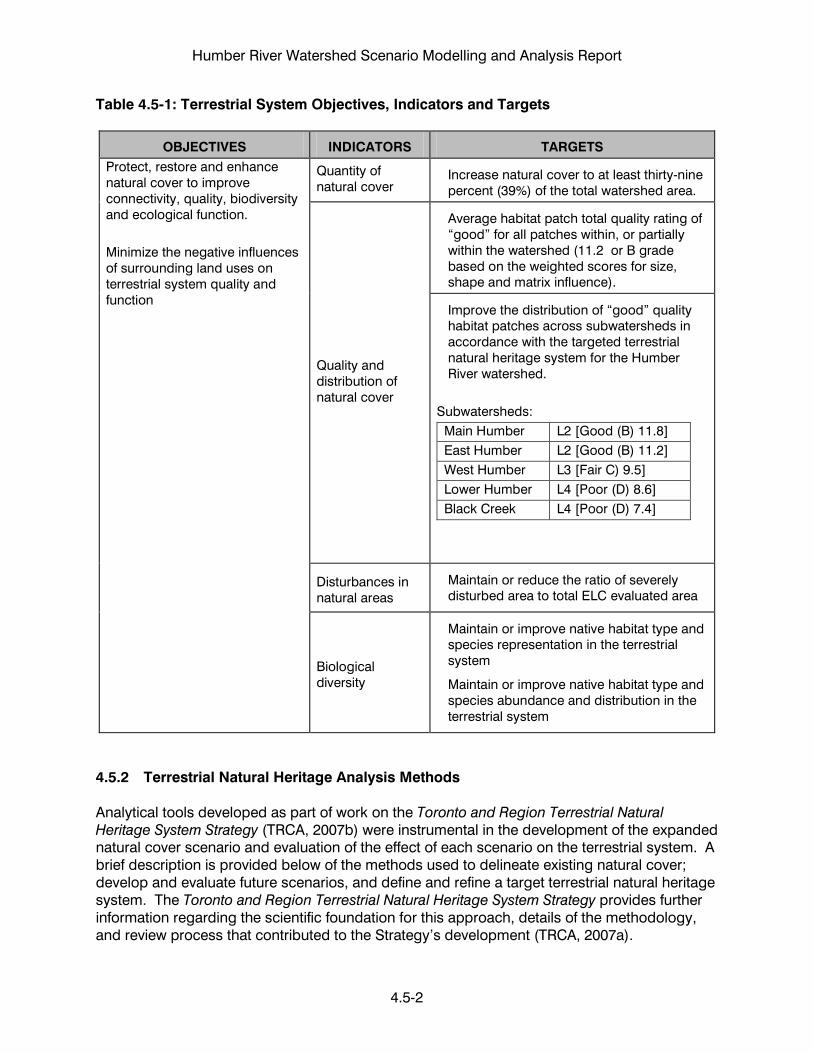
Table 4.5-1: Terrestrial System Objectives, Indicators and Targets
OBJECTIVES INDICATORS TARGETS Protect, restore and enhance natural cover to improve connectivity, quality, biodiversity and ecological function. Minimize the negative influences of surrounding land uses on terrestrial system quality and function
Quantity of natural cover
Increase natural cover to at least thirty-nine percent (39%) of the total watershed area.
Quality and distribution of natural cover
Average habitat patch total quality rating of “good” for all patches within, or partially within the watershed (11.2 or B grade based on the weighted scores for size, shape and matrix influence).
Improve the distribution of “good” quality habitat patches across subwatersheds in accordance with the targeted terrestrial natural heritage system for the Humber River watershed.
Subwatersheds:
Main Humber L2 [Good (B) 11.8] East Humber L2 [Good (B) 11.2] West Humber L3 [Fair C) 9.5] Lower Humber L4 [Poor (D) 8.6] Black Creek L4 [Poor (D) 7.4]
Disturbances in natural areas
Maintain or reduce the ratio of severely disturbed area to total ELC evaluated area
Biological diversity
Maintain or improve native habitat type and species representation in the terrestrial system
Maintain or improve native habitat type and species abundance and distribution in the terrestrial system
4.5.2 Terrestrial Natural Heritage Analysis Methods Analytical tools developed as part of work on the Toronto and Region Terrestrial Natural Heritage System Strategy (TRCA, 2007b) were instrumental in the development of the expanded natural cover scenario and evaluation of the effect of each scenario on the terrestrial system. A brief description is provided below of the methods used to delineate existing natural cover; develop and evaluate future scenarios, and define and refine a target terrestrial natural heritage system. The Toronto and Region Terrestrial Natural Heritage System Strategy provides further information regarding the scientific foundation for this approach, details of the methodology, and review process that contributed to the Strategy’s development (TRCA, 2007a).
Humber River Watershed Scenario Modelling and Analysis Report
4.5-3
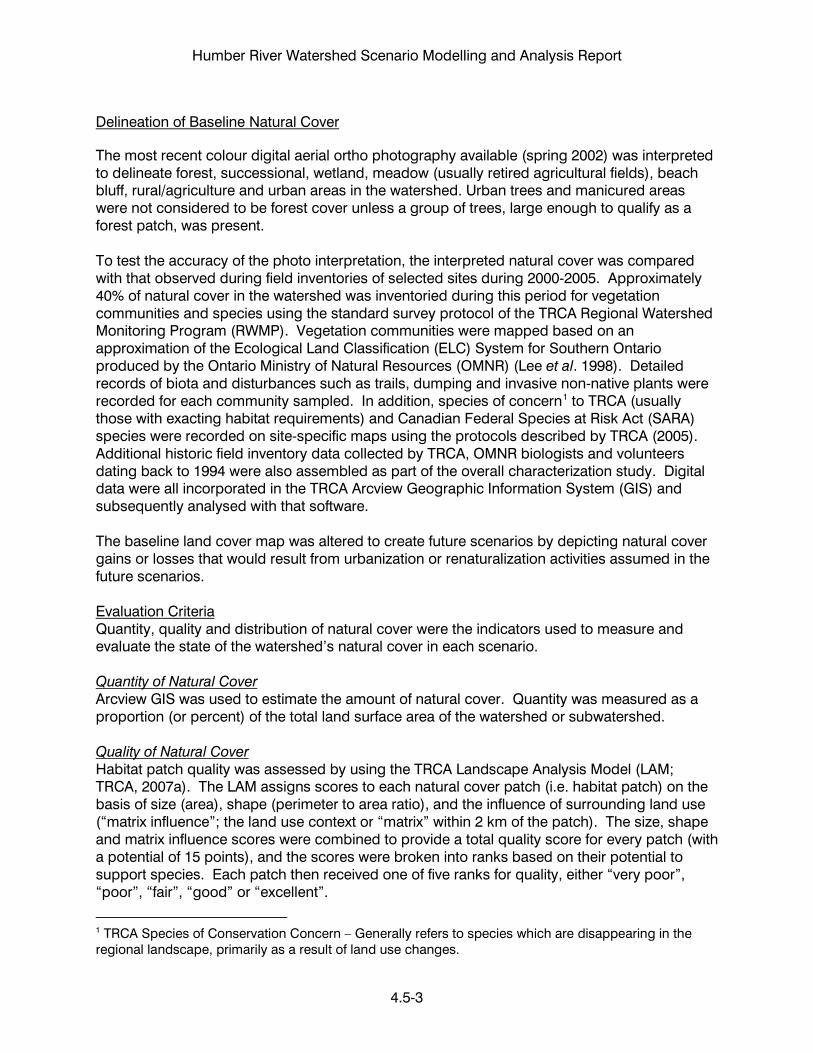
Delineation of Baseline Natural Cover
The most recent colour digital aerial ortho photography available (spring 2002) was interpreted to delineate forest, successional, wetland, meadow (usually retired agricultural fields), beach bluff, rural/agriculture and urban areas in the watershed. Urban trees and manicured areas were not considered to be forest cover unless a group of trees, large enough to qualify as a forest patch, was present. To test the accuracy of the photo interpretation, the interpreted natural cover was compared with that observed during field inventories of selected sites during 2000-2005. Approximately 40% of natural cover in the watershed was inventoried during this period for vegetation communities and species using the standard survey protocol of the TRCA Regional Watershed Monitoring Program (RWMP). Vegetation communities were mapped based on an approximation of the Ecological Land Classification (ELC) System for Southern Ontario produced by the Ontario Ministry of Natural Resources (OMNR) (Lee et al. 1998). Detailed records of biota and disturbances such as trails, dumping and invasive non-native plants were recorded for each community sampled. In addition, species of concern1
to TRCA (usually those with exacting habitat requirements) and Canadian Federal Species at Risk Act (SARA) species were recorded on site-specific maps using the protocols described by TRCA (2005). Additional historic field inventory data collected by TRCA, OMNR biologists and volunteers dating back to 1994 were also assembled as part of the overall characterization study. Digital data were all incorporated in the TRCA Arcview Geographic Information System (GIS) and subsequently analysed with that software.
The baseline land cover map was altered to create future scenarios by depicting natural cover gains or losses that would result from urbanization or renaturalization activities assumed in the future scenarios.
Quantity, quality and distribution of natural cover were the indicators used to measure and evaluate the state of the watershed’s natural cover in each scenario.
Evaluation Criteria
Arcview GIS was used to estimate the amount of natural cover. Quantity was measured as a proportion (or percent) of the total land surface area of the watershed or subwatershed.
Quantity of Natural Cover
Habitat patch quality was assessed by using the TRCA Landscape Analysis Model (LAM; TRCA, 2007a). The LAM assigns scores to each natural cover patch (i.e. habitat patch) on the basis of size (area), shape (perimeter to area ratio), and the influence of surrounding land use (“matrix influence”; the land use context or “matrix” within 2 km of the patch). The size, shape and matrix influence scores were combined to provide a total quality score for every patch (with a potential of 15 points), and the scores were broken into ranks based on their potential to support species. Each patch then received one of five ranks for quality, either “very poor”, “poor”, “fair”, “good” or “excellent”.
Quality of Natural Cover
1 TRCA Species of Conservation Concern – Generally refers to species which are disappearing in the regional landscape, primarily as a result of land use changes.

Humber River Watershed Scenario Modelling and Analysis Report
4.5-4
Past observations and analysis of biota distribution suggest that there is a range of species-specific responses to habitat fragmentation and urban development that ranges from tolerant (i.e. well adapted) to intolerant (i.e. averse). The TRCA has classified species and vegetation communities along that continuum into classes L5 (tolerant) to L1 (intolerant). Based on the LAM, a few species can live in “poor” quality patches, however most Species of Concern require at least “fair” quality habitat (Table 4.5-2). This information suggested that if the system supported a full range of quality, but emphasized “good” quality patches (11-12 points), then most Species of Concern (and associated ecosystem benefits) would be protected throughout the system, notwithstanding potential influences from climate change. This information guided the evaluation of habitat conditions in each scenario.
Distribution of quality habitat was considered across the landscape. For a watershed to have and maintain a complex, dynamic and more sustainable terrestrial system, good quality habitat should be distributed evenly. For the purposes of the watershed study, the distribution of quality habitat was considered by subwatershed.
Quality Distribution of Natural Cover
Table 4.5-2: Natural Cover Patch Total Quality Score Rating Criteria
Total Score Rating Rank Description
13 + Excellent (A)
Local Rank 1 (L1) Habitat
Habitat that is of the highest quality and supports both regional species and vegetation communities of conservation concern that are the most sensitive and the most threatened.
11 - 12.99 Good (B) Local Rank 2 (L2) Habitat
Habitat of good quality that supports both regional species and vegetation communities of conservation concern.
9 - 10.99 Fair (C) Local Rank 3 (L3) Habitat
Habitat of a fair quality that supports or is on the cusp of supporting both regional species and vegetation communities of conservation concern.
6 - 8.99 Poor (D) Local Rank 4 (L4) Habitat
Habitat of a poor quality that generally will not support regional species or vegetation communities of concern, but will support urban species and vegetation communities of conservation concern.
0 - 5.99 Very Poor (F)
Local Rank 5 (L5) Habitat
A patch of very poor quality which will generally only support those species and vegetation communities that are the most common, and not of either regional or urban concern.

Humber River Watershed Scenario Modelling and Analysis Report
4.5-5
4.5.3 Development of a Target Terrestrial Natural Heritage System Scenario 4 (Official Plan Build-out with Expanded Natural Cover) warrants explanation regarding its development, because the tools and methodology used to develop the terrestrial natural heritage component of the scenario are related to those used to evaluate natural system condition under each of the scenarios. It should be noted that the terrestrial system in scenario 4 was also the foundation for the development of scenario 6 (Sustainable Communities).
Scales of Targeted Systems
Having evaluated the existing regional terrestrial natural heritage system throughout the TRCA jurisdiction and determined that it did not meet objectives, the TRCA applied their System Design Model to design a more robust regional terrestrial system. The model was used to develop a scenario that would achieve quality and distribution targets, but with as little land as possible, recognizing competing land use interests. As a starting point, projected long range urban growth was mapped so that the target system could be evaluated in the context of the future matrix.
Regional Targeted System
The model used GIS raster analysis to assign scores to each 10 x 10 m cell throughout the jurisdiction, in terms of its potential to contribute to the target system, using a number of ecological criteria (e.g. distance from natural areas) and planning criteria (e.g. protective policy designations (e.g. environmentally significant areas, TRCA ownership etc.). Cells with the highest potential (highest score) were identified for inclusion in the target system. Through preliminary modelling and literature research it was determined that a minimum of 30% of the TRCA jurisdiction would need to be natural cover in order to achieve targets for habitat quality and biodiversity. Subsequent evaluation of habitat quality of the expanded system, using the LAM described above, confirmed that the target system achieved the objective of having average natural cover patch quality total scores of “fair” to “good” thus suggesting it would be capable of supporting species of concern. Further refinement of the regional target system is intended to be carried out at more detailed scales, such as through watershed planning studies as described below.
The Humber watershed portion of TRCA’s interim regional target terrestrial natural heritage system
Refined Targeted System for the Humber River Watershed
2
2 An interim regional target terrestrial natural heritage system (dated fall 2005) was refined for the Humber watershed for use in the scenario modelling and analysis study. This interim target was based on a modification of the TRCA’s draft 1999 Terrestrial Natural Heritage System Strategy, but preceded final system recommended in the final Strategy, as published in 2007. The interim target represents about 1% more natural cover throughout the Humber watershed overall, as compared to the Humber watershed component of the final regional target terrestrial natural heritage system in the 2007 Strategy. This difference is considered to have relatively insignificant effects on the final study outcome.
underwent further refinement with the aid of more detailed land use planning information, local field data, and other current information. This refined targeted system for the Humber watershed formed the basis for scenarios 4 (Official Plan Build-out with Expanded Natural Cover) and 6 (Sustainable Communities). This refinement process was repeated using

Humber River Watershed Scenario Modelling and Analysis Report
4.5-6
the Humber watershed portion of the TRCA’s final regional target terrestrial natural heritage system to produce the final target terrestrial natural heritage system that is recommended for the Humber River watershed. In preparation for the refinement processes, ArcReader files were created using ArcMap to assemble digital data layers of the following reference information for the Humber watershed:
• TRCA Regional Target Terrestrial Natural Heritage System; • Digital colour aerial photography (2002) and up to date imagery from Google Earth©; • Detailed 2002 land cover • Approved official plan land use (as of January 2006); • Oak Ridges Moraine Conservation Plan (2002) and Greenbelt Plan (2005) boundaries
and designations; • Detailed field information/data on the locations of species and communities of
conservation concern and species at risk (where available); • Existing locations of forest, wetland, meadow, and beach/bluff habitat types,
watercourse, roads and other land features; and • Information from development applications approved since 2002.
The refinement processes involved the following steps: 1. The targeted terrestrial system was carefully inspected to correct instances where urban
cover or incompatible land use designations were incorrectly classified as natural and these patches were removed from the target terrestrial system. When this occurred the cover that was removed was replaced manually in equal area in a location nearby.
2. Known locations of species and communities of conservation concern and species at
risk were captured in the watershed target system. The target system boundary was increased around the locations when sensitive species and communities of concern were outside of the modelled target area.
3. Gaps between areas of the regional target system were filled in to ensure the target
system was as contiguous as possible. 4. In some cases, such as within the Greenbelt Natural Heritage System area, additional
core areas were created to improve the distribution of high quality habitat patches throughout the watershed. These areas included locations that are largely suitable for the restoration of swamps or tableland forest.
5. Connections and linkages in the system were improved wherever possible.
The final target terrestrial natural heritage system recommended for the Humber River watershed represents approximately thirty-nine percent (39%) of the total watershed area (see boxes on pages 4.5-20 and 4.5-21).

Humber River Watershed Scenario Modelling and Analysis Report
4.5-7
4.5.4 Scenarios of Focus for Terrestrial Natural Heritage Evaluation The evaluation of natural cover, using the LAM, focused on Scenario 1 (Baseline Conditions, 2002), Scenario 2 (Official Plan Build-out), Scenario 4 (Official Plan Build-out with Expanded Natural Cover), Scenario 5 (Full Build-out), and Scenario 6 (Sustainable Communities), as these five scenarios represented ones with substantially different natural and urban land cover configurations (Table 4.5-3). Scenario 3 (Official Plan Build-out with End-of-Pipe Stormwater Retrofits) did not involve any change in land cover, as compared to Scenario 2. The LAM is not capable of evaluating the effects of climate change (Scenarios 5A, 5B, 6A, and 6B). Therefore, LAM results were extrapolated and additional considerations identified in the discussion for the “unmodelled” scenarios. It was not possible to adjust the LAM inputs to reassess matrix influence for the urban portions of Scenario 6 (Sustainable Communities), although it could be assumed that more sustainable community design and behaviours would pose less negative influence on the natural heritage system. With improvements in the science and data inputs it is possible that this consideration could be added in future assessments. Therefore, the results for Scenario 6 (Sustainable Communities) represent a conservative assessment of the likely negative matrix influence on the terrestrial natural heritage system.
Table 4.5-3: Humber River Watershed Scenario Comparison – (A) Percent Natural Cover and (B) Percent Urban Cover
A: Percent Natural Cover Subwatershed Scenario 1* Scenario 2 Scenario 4 Scenario 5 Scenario 6 Main Humber 46% 44% 60% 43% 60% East Humber 35% 33% 51% 32% 51% West Humber 17% 15% 26% 14% 26% Lower Humber 15% 15% 12% 15% 12% Black Creek 12% 12% 9% 12% 9% Humber Watershed 32% 30% 42% 30% 42% B: Percent Urban Cover Subwatershed Scenario 1* Scenario 2 Scenario 4 Scenario 5 Scenario 6 Main Humber 12% 21% 19% 28% 24% East Humber 18% 25% 23% 36% 32% West Humber 21% 39% 37% 73% 65% Lower Humber 83% 83% 86% 83% 86% Black Creek 87% 88% 91% 88% 91% Humber Watershed 27% 36% 35% 49% 45% *based on 2002 aerial photo interpretation
The following sections summarize and compare results of the evaluation of the terrestrial natural heritage system under each scenario.

Humber River Watershed Scenario Modelling and Analysis Report
4.5-8
4.5.5 Baseline Conditions This scenario represents baseline conditions (i.e., Scenario 1) that existed in 2002 (Figure 4.5-1). Approximately 32% of the watershed area is in some form of natural cover, although that cover has been significantly modified in the past two centuries. Of this, about 18% is forest, 11% cultural meadow3
Figure 4.5-1: Land Cover in the Humber Watershed, 2002 Conditions (Scenario 1)
and less than 2% wetland and beach/bluff communities. The terrestrial system that existed in 2002 was, and remains extremely fragmented and much reduced from its historical state. The result of this reduction has been the loss of many native terrestrial and wetland species since European settlement. Inventories that have been conducted over the past 30 years show that habitat losses continue despite habitat protection efforts (see Humber River State of the Watershed Report – Terrestrial System; TRCA, 2008).
Humber River Watershed General Land Use/CoverBaseline Conditions (Scenario 1)
(as % of total watershed area)
40%
26%
32%
1%
1%
RuralUrbanNaturalOpen WaterVacant
The quality of the majority of habitat patches rank “fair” under the LAM analysis, largely because of their irregular shape and the highly urbanized matrix in a large part of the watershed (Figure 4.5-2, Table 4.5-4 and Figure 4.5-3) Conditions do vary considerably from one subwatershed to the next with the distribution of quality being poor in the West Humber, Lower Humber and Black Creek subwatersheds. Typically, the most abundant and highest quality habitats are located on the Oak Ridges Moraine and in the areas associated with the East and Main Humber River valleys extending south to the confluence of the two rivers (i.e., Main Humber and East Humber subwatersheds). The Main Humber not only contains the most natural cover but also has the best quality of habitat patches. 3 Cultural meadow – usually retired agricultural fields; a general term to describe early successional communities that have regenerated from abandoned agricultural land (Lee et al., 1998)

Figure 4.5-2: Results of the LAM habitat quality analysis for Humber watershed – 2002 Conditions (Scenario 1)
Humber River Watershed Scenario Modelling and Analysis Report
4.5-10
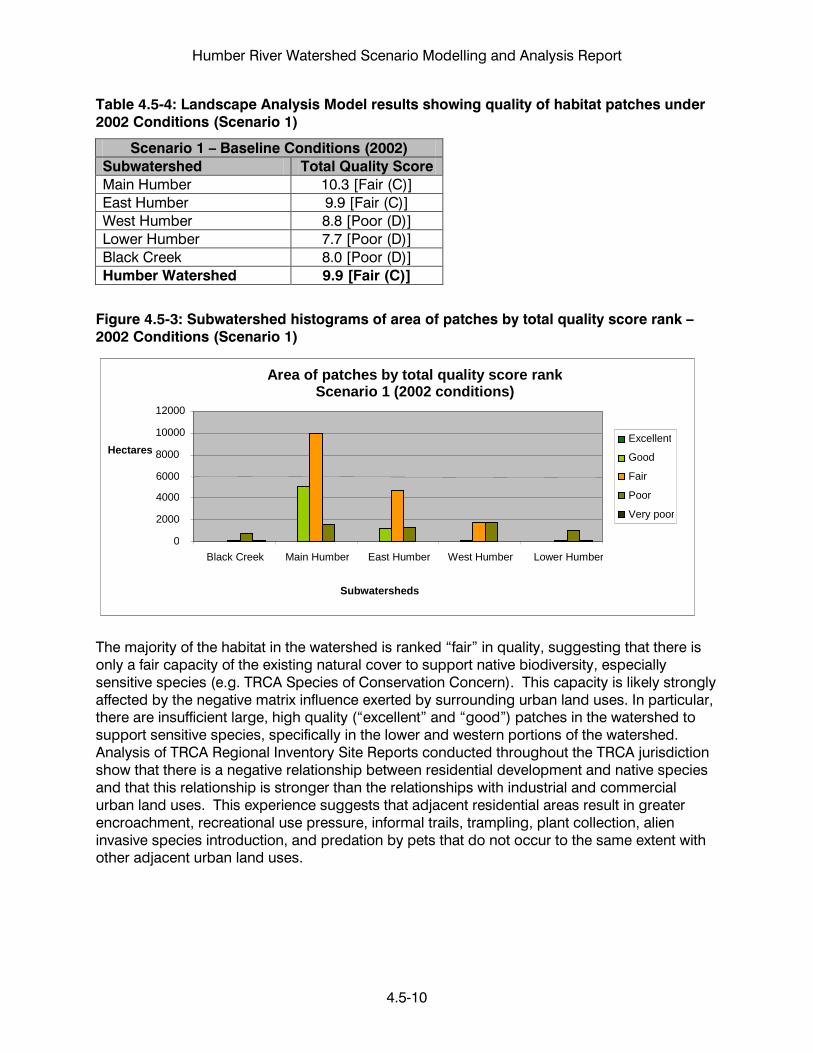
Table 4.5-4: Landscape Analysis Model results showing quality of habitat patches under 2002 Conditions (Scenario 1)
Scenario 1 – Baseline Conditions (2002) Subwatershed Total Quality Score Main Humber 10.3 [Fair (C)] East Humber 9.9 [Fair (C)] West Humber 8.8 [Poor (D)] Lower Humber 7.7 [Poor (D)] Black Creek 8.0 [Poor (D)] Humber Watershed 9.9 [Fair (C)]
Figure 4.5-3: Subwatershed histograms of area of patches by total quality score rank – 2002 Conditions (Scenario 1)
The majority of the habitat in the watershed is ranked “fair” in quality, suggesting that there is only a fair capacity of the existing natural cover to support native biodiversity, especially sensitive species (e.g. TRCA Species of Conservation Concern). This capacity is likely strongly affected by the negative matrix influence exerted by surrounding urban land uses. In particular, there are insufficient large, high quality (“excellent” and “good”) patches in the watershed to support sensitive species, specifically in the lower and western portions of the watershed. Analysis of TRCA Regional Inventory Site Reports conducted throughout the TRCA jurisdiction show that there is a negative relationship between residential development and native species and that this relationship is stronger than the relationships with industrial and commercial urban land uses. This experience suggests that adjacent residential areas result in greater encroachment, recreational use pressure, informal trails, trampling, plant collection, alien invasive species introduction, and predation by pets that do not occur to the same extent with other adjacent urban land uses.
Area of patches by total quality score rank Scenario 1 (2002 conditions)
0 2000
4000 6000 8000
10000 12000
Black Creek Main Humber East Humber West Humber Lower Humber
Subwatersheds
Hectares Excellent Good Fair Poor Very poor

Humber River Watershed Scenario Modelling and Analysis Report
4.5-11
4.5.6 Effects of Conventional Urban Development
Implementation of municipal official plan land use schedulesEffect of Official Plan Build-out (Scenario 2)
4
Figure 4.5-4
will result in an increase in urban cover from 27% to 36% of the watershed area (a 34% increase from what existed in 2002), with an estimated loss of natural cover of 2% of the watershed area (see ), which is a 6% decrease from what existed in 2002. This increase in urban cover has the potential for direct loss of habitat and reductions in habitat patch quality. Urban cover increases in the Main, East and West Humber subwatersheds with the greatest increase occurring in the West Humber.
Figure 4.5-4: Land Cover in the Humber Watershed, Official Plan Build-out (Scenario 2)
Humber River Watershed General Land Use/CoverOfficial Plan Build-out (Scenario 2)
(as % of total watershed area)
33%
36%
30%
1% 0%
RuralUrbanNaturalOpen WaterVacant
As shown in Table 4.5-5 no major decline was predicted in the average habitat patch total quality score over the whole watershed with the build-out of approved official plans. These results are intuitive considering much of the existing habitat is retained and much of the planned urban growth is located in areas with little existing habitat. However, there is little doubt that the natural system will be impacted by anticipated urban growth. These impacts include reductions in habitat size, impaired shape, increases in the negative influence from the larger surrounding urban land use matrix, as well as increased fragmentation. Landscape connectivity will also be further impaired reducing the ability for species to move through the watershed. These impacts will be most significant in the subwatersheds where urban growth is planned, specifically the West Humber, East Humber and Main Humber (particularly in the Rainbow Creek portion). As illustrated in Figure 4-5-5, significant decreases in the quantity of 4 Scenario 2 represents municipal official plan land use scheduled approved as of January 1, 2005.
Humber River Watershed Scenario Modelling and Analysis Report
4.5-12
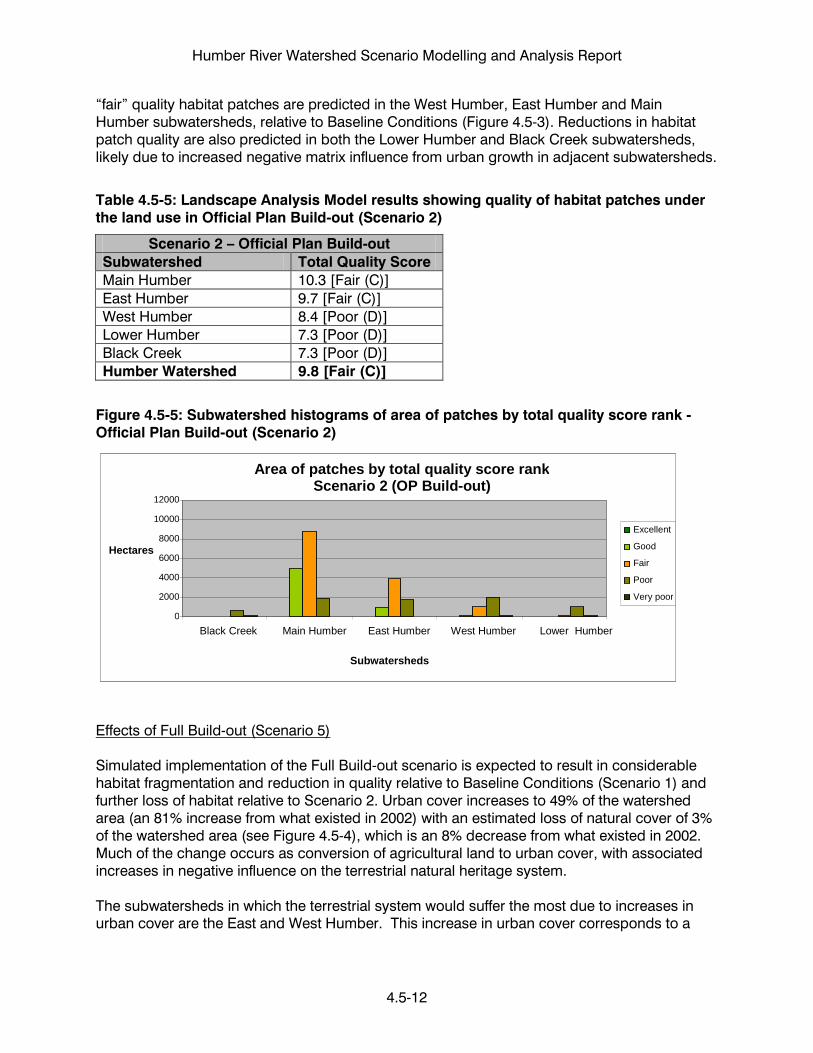
“fair” quality habitat patches are predicted in the West Humber, East Humber and Main Humber subwatersheds, relative to Baseline Conditions (Figure 4.5-3). Reductions in habitat patch quality are also predicted in both the Lower Humber and Black Creek subwatersheds, likely due to increased negative matrix influence from urban growth in adjacent subwatersheds.
Table 4.5-5: Landscape Analysis Model results showing quality of habitat patches under the land use in Official Plan Build-out (Scenario 2)
Scenario 2 – Official Plan Build-out Subwatershed Total Quality Score Main Humber 10.3 [Fair (C)] East Humber 9.7 [Fair (C)] West Humber 8.4 [Poor (D)] Lower Humber 7.3 [Poor (D)] Black Creek 7.3 [Poor (D)] Humber Watershed 9.8 [Fair (C)]
Figure 4.5-5: Subwatershed histograms of area of patches by total quality score rank - Official Plan Build-out (Scenario 2)
Effects of Full Build-out (Scenario 5)
Simulated implementation of the Full Build-out scenario is expected to result in considerable habitat fragmentation and reduction in quality relative to Baseline Conditions (Scenario 1) and further loss of habitat relative to Scenario 2. Urban cover increases to 49% of the watershed area (an 81% increase from what existed in 2002) with an estimated loss of natural cover of 3% of the watershed area (see Figure 4.5-4), which is an 8% decrease from what existed in 2002. Much of the change occurs as conversion of agricultural land to urban cover, with associated increases in negative influence on the terrestrial natural heritage system. The subwatersheds in which the terrestrial system would suffer the most due to increases in urban cover are the East and West Humber. This increase in urban cover corresponds to a
Area of patches by total quality score rank Scenario 2 (OP Build-out)
0 2000 4000 6000 8000
10000 12000
Black Creek Main Humber East Humber West Humber Lower Humber
Subwatersheds
Hectares
Excellent Good Fair Poor Very poor

Humber River Watershed Scenario Modelling and Analysis Report
4.5-13
direct loss in agricultural lands in the watershed. This also represents a potential loss of opportunity for terrestrial natural heritage system expansion and restoration.
Figure 4.5-6: Land Cover in the Humber Watershed, Full Build-out (Scenario 5)
Humber River Watershed General Land Use/CoverFull Build-out (Scenario 5)
(as % of total watershed area)
21%
48%
30%
1%0%
RuralUrbanNaturalOpen WaterVacant
Table 4.5-6: Landscape Analysis Model results showing quality of habitat patches – Full Build-out (Scenario 5)
Scenario 5 – Full Build-out Subwatershed Total Quality Score Main Humber 10.3 [Fair (C)] East Humber 9.6 [Fair (C)] West Humber 7.9 [Poor (D)] Lower Humber 7.3 [Poor (D)] Black Creek 7.3 [Poor (D)] Humber Watershed 9.6 [Fair (C)]
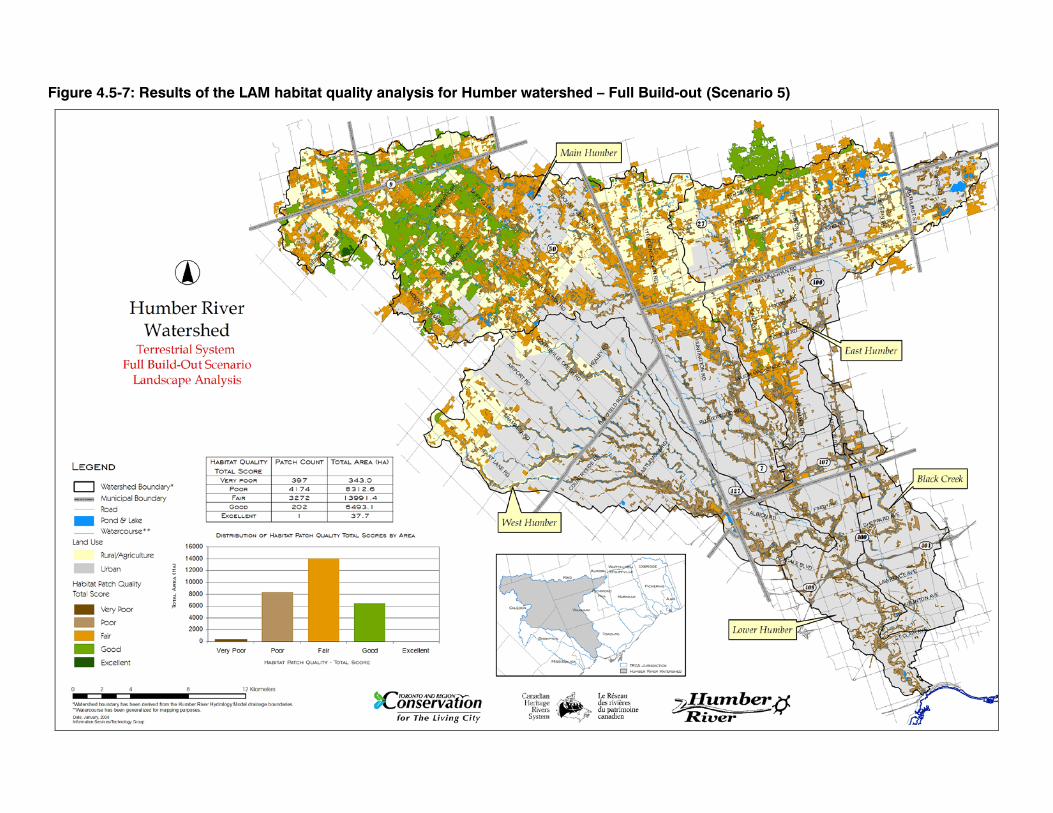
Figure 4.5-7: Results of the LAM habitat quality analysis for Humber watershed – Full Build-out (Scenario 5)
Humber River Watershed Scenario Modelling and Analysis Report
4.5-15
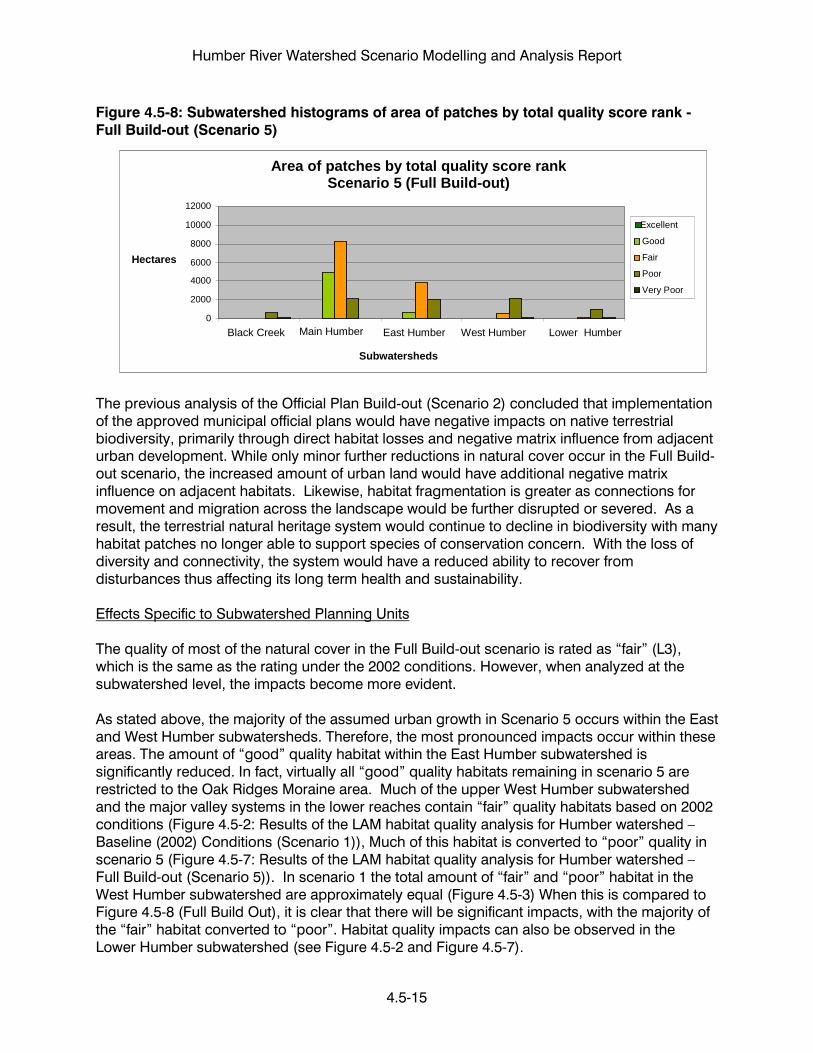
Figure 4.5-8: Subwatershed histograms of area of patches by total quality score rank - Full Build-out (Scenario 5)
The previous analysis of the Official Plan Build-out (Scenario 2) concluded that implementation of the approved municipal official plans would have negative impacts on native terrestrial biodiversity, primarily through direct habitat losses and negative matrix influence from adjacent urban development. While only minor further reductions in natural cover occur in the Full Build-out scenario, the increased amount of urban land would have additional negative matrix influence on adjacent habitats. Likewise, habitat fragmentation is greater as connections for movement and migration across the landscape would be further disrupted or severed. As a result, the terrestrial natural heritage system would continue to decline in biodiversity with many habitat patches no longer able to support species of conservation concern. With the loss of diversity and connectivity, the system would have a reduced ability to recover from disturbances thus affecting its long term health and sustainability.
Effects Specific to Subwatershed Planning Units
The quality of most of the natural cover in the Full Build-out scenario is rated as “fair” (L3), which is the same as the rating under the 2002 conditions. However, when analyzed at the subwatershed level, the impacts become more evident. As stated above, the majority of the assumed urban growth in Scenario 5 occurs within the East and West Humber subwatersheds. Therefore, the most pronounced impacts occur within these areas. The amount of “good” quality habitat within the East Humber subwatershed is significantly reduced. In fact, virtually all “good” quality habitats remaining in scenario 5 are restricted to the Oak Ridges Moraine area. Much of the upper West Humber subwatershed and the major valley systems in the lower reaches contain “fair” quality habitats based on 2002 conditions (Figure 4.5-2: Results of the LAM habitat quality analysis for Humber watershed – Baseline (2002) Conditions (Scenario 1)), Much of this habitat is converted to “poor” quality in scenario 5 (Figure 4.5-7: Results of the LAM habitat quality analysis for Humber watershed – Full Build-out (Scenario 5)). In scenario 1 the total amount of “fair” and “poor” habitat in the West Humber subwatershed are approximately equal (Figure 4.5-3) When this is compared to Figure 4.5-8 (Full Build Out), it is clear that there will be significant impacts, with the majority of the “fair” habitat converted to “poor”. Habitat quality impacts can also be observed in the Lower Humber subwatershed (see Figure 4.5-2 and Figure 4.5-7).
Hectares
Area of patches by total quality score rank Scenario 5 (Full Build-out)
0 2000 4000 6000 8000
10000 12000
Hectares
Very Poor Poor Fair Good Excellent
Black Creek East Humber West Humber Main Humber Lower Humber
Subwatersheds

Humber River Watershed Scenario Modelling and Analysis Report
4.5-16
4.5.7 Effects of End-of-Pipe Stormwater Retrofits Scenario 3 (Official Plan Build-out with End-of-Pipe Stormwater Retrofits) did not involve any change in land cover, as compared to Scenario 2 (Official Plan Build-out). Therefore, evaluation of the terrestrial natural heritage system in Scenario 2 was considered representative of this scenario and no further modelling was conducted. 4.5.8 Effects of Expanded Natural Cover The Expanded Natural Cover scenario (Scenario 4) explores the impact of implementation of a target terrestrial natural heritage system5
Figure 4.5-9: Land Cover in the Humber Watershed, Official Plan Build-out with Expanded Natural Cover (Scenario 4)
together with municipal official plan build-out. In this targeted system it is assumed that natural cover is increased from the baseline level of 32% of the watershed area to 42%. While it is clear that the quantity of natural cover significantly increases, the distribution of the habitat remains very unbalanced. The increases are concentrated in the Main, East and West Humber subwatersheds, where the most opportunities remain, with a decline in the Lower Humber and Black Creek subwatersheds. Connectivity is improved in the headwaters with better east-west connections but the system still lacks connections from the river valleys across tablelands in the middle reaches of the watershed.
Humber River Watershed General Land Use/CoverOfficical Plan Build-out with Expanded Natural Cover
(Scenario 4) (as % of total watershed area)
22%
35%
42%
1%
0%
RuralUrbanNaturalOpen WaterVacant
Along with the increase in the quantity of natural cover, there are obvious increases in the terrestrial system quality (see Table 4.5-7and Figure 4.5-10) compared to Baseline (2002)
5 As noted in section 4.5.3, this scenario was defined through refinement of an interim regional target terrestrial natural heritage system (See text box on page 4.5-20).

Humber River Watershed Scenario Modelling and Analysis Report
4.5-17
Conditions (Scenario 1). The average habitat patch total quality score for the Humber watershed goes from 9.9 to 11.2, or from “fair” to “good”.
Table 4.5-7: Landscape Analysis Model results showing quality of habitat patches – Official Plan Build-out with Expanded Natural Cover (Scenario 4)
Scenario 4 – OP Build-out with Expanded Natural Cover
Subwatershed Total Quality Score
Main Humber 11.7 [Good (B)]
East Humber 11.3 [Good (B)]
West Humber 10.0 [Fair( C)]
Lower Humber 8.3 [Poor (D)]
Black Creek 8.2 [Poor (D)]
Humber Watershed 11.2 [Good (B)]
Figure 4.5-10: Subwatershed histograms of area of patches by total quality score rank - Official Plan Build-out with Expanded Natural Cover (Scenario 4)
Area of patches by total quality score rank Scenario 4 (OP Build-out with Expanded Natural Cover)
0 2000 4000 6000 8000
10000 12000 14000 16000 18000 20000
Subwatersheds
Excellent Good Fair Poor Very poor
Hectares
Black Creek Main Humber East Humber West Humber Lower Humber
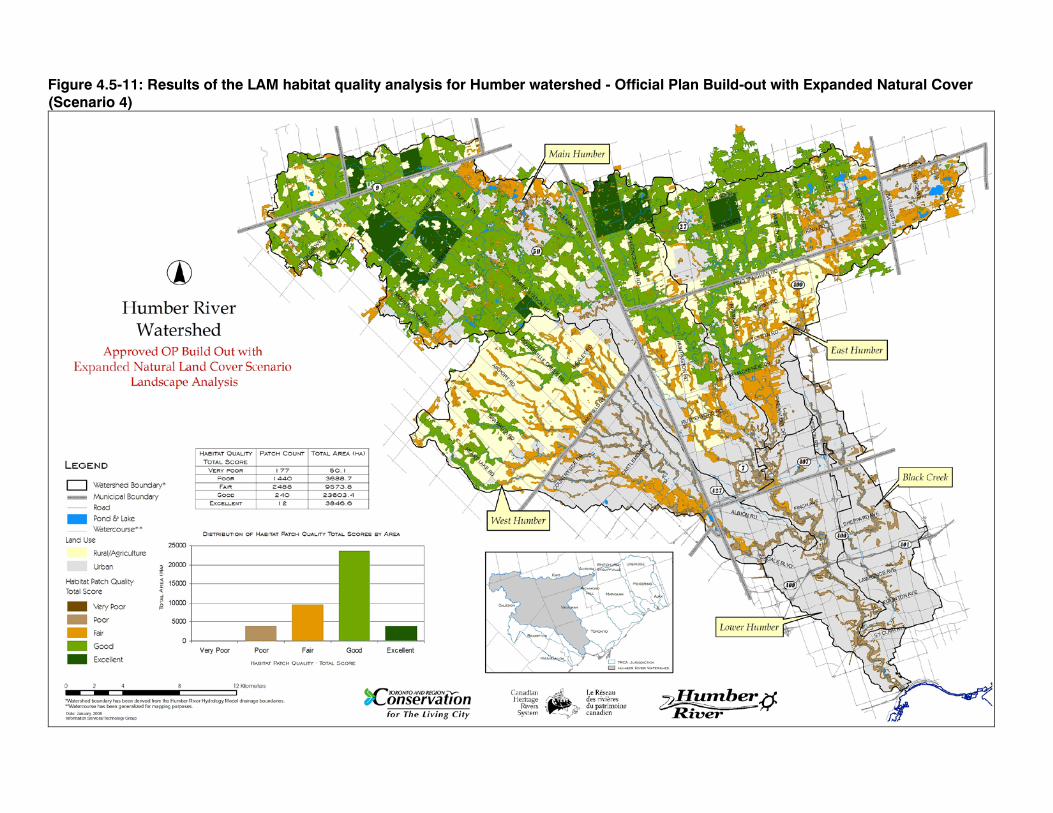
Figure 4.5-11: Results of the LAM habitat quality analysis for Humber watershed - Official Plan Build-out with Expanded Natural Cover (Scenario 4)
Humber River Watershed Scenario Modelling and Analysis Report
4.5-19
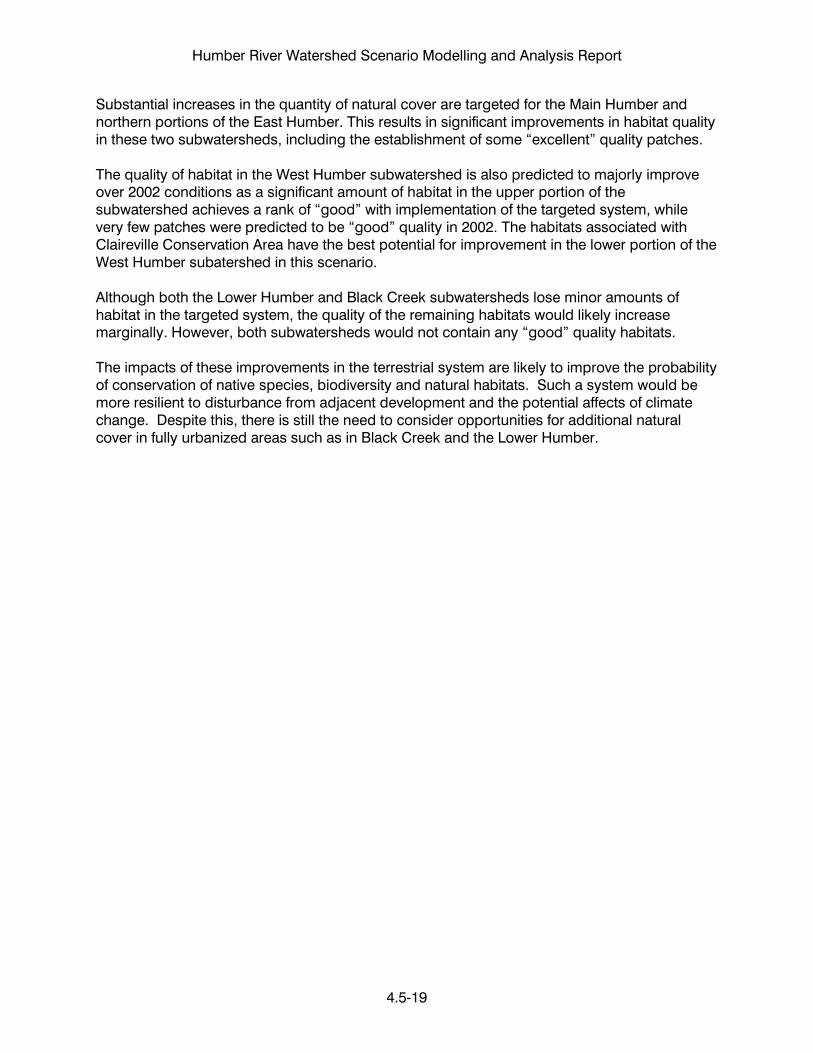
Substantial increases in the quantity of natural cover are targeted for the Main Humber and northern portions of the East Humber. This results in significant improvements in habitat quality in these two subwatersheds, including the establishment of some “excellent” quality patches. The quality of habitat in the West Humber subwatershed is also predicted to majorly improve over 2002 conditions as a significant amount of habitat in the upper portion of the subwatershed achieves a rank of “good” with implementation of the targeted system, while very few patches were predicted to be “good” quality in 2002. The habitats associated with Claireville Conservation Area have the best potential for improvement in the lower portion of the West Humber subatershed in this scenario. Although both the Lower Humber and Black Creek subwatersheds lose minor amounts of habitat in the targeted system, the quality of the remaining habitats would likely increase marginally. However, both subwatersheds would not contain any “good” quality habitats. The impacts of these improvements in the terrestrial system are likely to improve the probability of conservation of native species, biodiversity and natural habitats. Such a system would be more resilient to disturbance from adjacent development and the potential affects of climate change. Despite this, there is still the need to consider opportunities for additional natural cover in fully urbanized areas such as in Black Creek and the Lower Humber.

Humber River Watershed Scenario Modelling and Analysis Report
4.5-20
Comparison of Scenario 4 with Final Target Terrestrial Natural Heritage System recommended for the Humber River watershed
An interim regional target terrestrial natural heritage system (dated fall 2005) was used and further refined for the Humber watershed to define the natural land cover assumptions in the Expanded Natural Cover scenario (Scenario 4) and Sustainable Communities scenario (Scenario 6). The interim regional target preceded the final regional target terrestrial natural heritage system recommended in the Toronto and Region Terrestrial Natural Heritage System Strategy (TRCA, 2007a). The interim target represents about 1% more natural cover throughout the Humber River watershed, as compared to the Humber watershed portion of the final regional target terrestrial natural heritage system recommended in the 2007 Strategy. The difference is a result of refinements made to the System Design Model and input criteria subsequent to 2005. Changes made to the model related to how the model treated meadows and existing habitats within developed areas. The Greenbelt Plan boundary was also included as one of the criteria in the 2007 System Design Model. Subsequent to completion of scenario modelling and analysis work, the watershed scale refinement process was repeated using the Humber watershed portion of the final regional targeted system to produce the final target terrestrial natural heritage system recommended for the Humber River watershed. While the size of the targeted system assumed in Scenario 4 was 42% of the watershed area, the final targeted system arrived at through this refinement process, and that is recommended for the Humber watershed, is 39% of the watershed area. The Landscape Analysis Model (LAM) was used to evaluate the final targeted system for the Humber watershed and the results were compared with results for Scenario 4. This comparison revealed slight reductions in average habitat quality scores in each of the subwatershed areas, as shown in the table below. However, the reductions in scores did not translate into any changes in quality rankings (“L” rank) for any of the subwatersheds, nor the overall rank for the entire watershed. Such reductions in quality scores are intuitive as the total size of the final targeted system for the watershed is slightly smaller than what was assumed in Scenario 4, and additional urban growth in the East and Main Humber subwatersheds, approved after January 2006, was assumed in the assessment of the final targeted system. Table 4.5-8: Comparison of LAM results for quality of habitat patches between Scenario 4 and the final targeted system recommended for the Humber River watershed Subwatershed Scenario 4 Total Quality
Score Final Watershed Target Total Quality Score
Main Humber 11.7 (L2) good (B) 11.6 (L2) good (B) East Humber 11.3 (L2) good (B) 11.1 (L2) good (B) West Humber 10.0 (L3) fair (C) 9.5 (L3) fair © Lower Humber 8.3 (L4) poor (D) 7.9 (L4) poor (D) Black Creek 8.2 (L4) poor (D) 7.0 (L4) poor (D) Humber Watershed* 11.2 (L2) good (B) 11.0 (L2) good (B)
*It should be noted that the overall watershed mean is not a mean of the subwatersheds combined, but is calculated for all habitat patches within, or partially within the watershed.

Figure 4.5-12 Results of the LAM habitat quality analysis for the Humber River watershed final target terrestrial natural heritage system

Humber River Watershed Scenario Modelling and Analysis Report
4.5-22
4.5.9 Effects of Sustainable Communities In the Sustainable Communities scenario (Scenario 6) urban cover is assumed to increase to 42% of the watershed area (Figure 4.5-13), which represents a 69% increase from what existed in 2002. The quantity and distribution of natural cover assumed in the Sustainable Communities scenario is very similar to that assumed in Scenario 4. A slight increase in the quantity of natural cover was assumed, representing a 0.5% increase over what was assumed in Scenario 4 (an additional 180 hectares). This very minor increase in natural cover was based on the assumption that small streams (those not captured by TRCA’s regulated areas criteria) in urbanizing areas would remain natural and regenerate back to forest cover if urbanizing areas were developed according to sustainable community design principles.
Figure 4.5-13: Land Cover in the Humber Watershed, Sustainable Communities (Scenario 6)
Humber River Watershed General Land Use/CoverSustainable Communities (Scenario 6)
(as % of total watershed area)
12%
45%
42%
1%
0%
RuralUrbanNaturalOpen WaterVacant
The critical changes in Scenario 6 that influence habitat quality are those associated with the increasing negative matrix influence from surrounding urban land uses, and to a lesser degree, changes in the size of patches. There is very little difference in terms of average habitat quality at the watershed scale between Scenario 6 and Scenario 4, even though much more urban cover is assumed (Table 4.5-9). However, a comparison of Figure 4.5-15 and Figure 4.5-11 show some changes in the quantity and distribution of “good” and “fair” quality habitat within the watershed are anticipated. The LAM predicts that the amount of “good” quality habitat in the watershed will decrease significantly, with accompanying increases in “fair” and “poor” quality habitats. These changes are generally in the “white-belt” area of the watershed, where Scenario 6 assumes urban growth up to the boundary of the Greenbelt Plan. In these areas,

Humber River Watershed Scenario Modelling and Analysis Report
4.5-23
where the habitats are narrow and mostly associated with stream corridors, the introduction of an urban matrix is predicted to result in a decrease in quality. This is particularly true in the upper reaches of the West Humber subwatershed.
Table 4.5-9: Landscape Analysis Model results showing quality of habitat patches under Sustainable Communities (Scenario 6)
Scenario 6 – Sustainable Communities Subwatershed Total Quality Score Main Humber 11.7 [good (B)] East Humber 11.2 [good (B)] West Humber 9.3 [fair (C)] Lower Humber 8.0 [poor (D)] Black Creek 7.7 [poor (D)] Humber Watershed 11.2 [good (B)]
A comparison of Figure 4.5-14 and Figure 4.5-2 shows that the quantity and distribution of “good” and “excellent” quality habitat within the watershed in the Sustainable Communities scenario will be a significant improvement over Baseline (2002) Conditions. Therefore, if the level of urbanization assumed in the Sustainable Communities scenario was accompanied by protection of a target terrestrial natural heritage system, and natural cover was restored on lands in the targeted system, the LAM predicts that the watershed objective to improve connectivity, quality, biodiversity and ecological function would still be achieved. Although one would expect that a “sustainable community” urban matrix might have lesser negative influence on the adjacent natural heritage system than a “conventional” urban matrix, it is not anticipated to have a positive influence on habitat quality, like natural cover or agricultural land does. Landscaping using native species and other sustainable practices that would part of the “sustainable community” urban matrix would complement the terrestrial system for many species, but no matter how “hospitable” the urban matrix is made for the safe travel or foraging, several species of concern, such as those ranking L1 and L2 will avoid urban areas and so, are best managed for in rural landscapes. The science to quantify differences in matrix influence associated with different types of urban uses (including “sustainable communities”) is not well advanced. The LAM assumes the same negative matrix influence for all urban areas. It is also important to recognize that the Humber watershed was modelled on its own and changes in matrix influence from land use changes anticipated in adjacent watersheds will affect habitat quality within the Humber and vice versa.
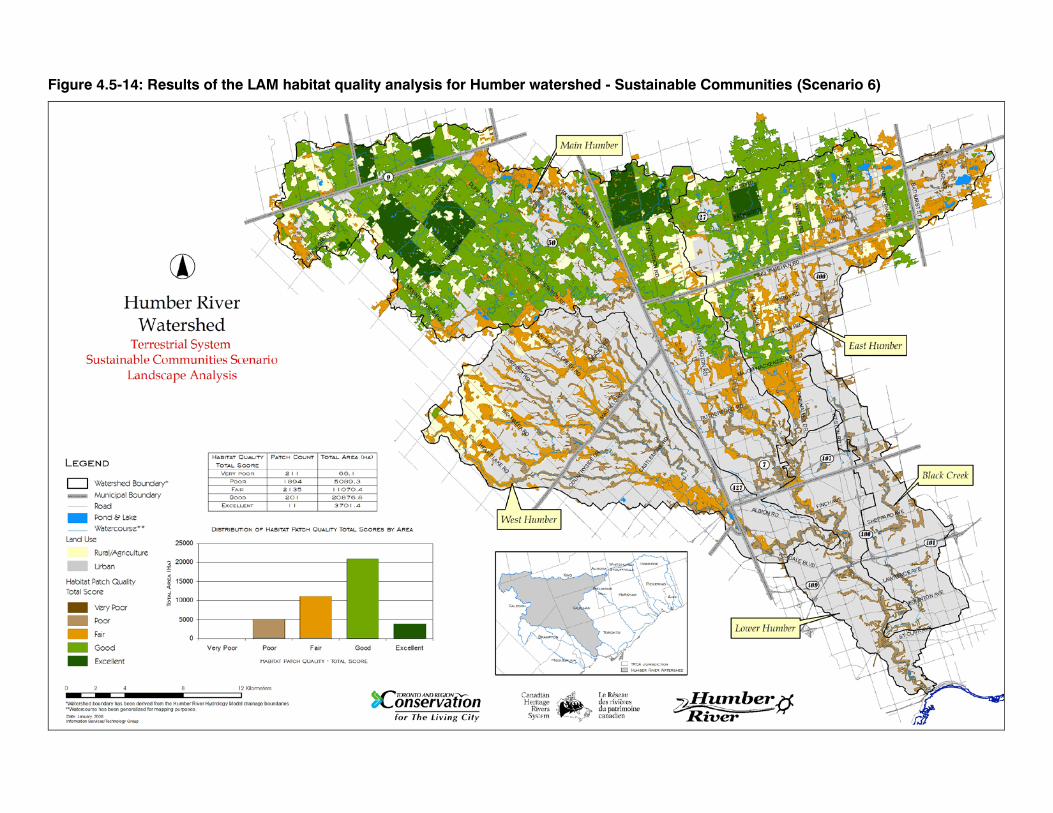
Figure 4.5-14: Results of the LAM habitat quality analysis for Humber watershed - Sustainable Communities (Scenario 6)
Humber River Watershed Scenario Modelling and Analysis Report
4.5-25
4.5.10 Effects of Climate Change Global climate change models generally predict a future climate that will be warmer and wetter than average present conditions in the Toronto Region (although some suggest that total annual precipitation will remain constant). Two climate change model scenarios that provide some of the most drastic climate change forecasts for Southern Ontario, generated by the second generation Canadian Global Climate Change Model (CGCM2 ) and British Hadley climate change model, predict average annual temperature increases of 5.3oC and 7.1o
C and annual precipitation increases of 5.9% and 18.9% respectively. Some researchers also predict a global increase in the frequency of extreme, intense precipitation events (e.g. Kharin and Zwiers, 2005). However, the above noted climate change models are not capable of predicting potential changes in the size or frequency of extreme storm events, such as storms with severe winds and rain, droughts, heat waves, ice storms or smog, at the regional scale (e.g. Southern Ontario or the Greater Toronto Area).
The Landscape Analysis Model used to evaluate the terrestrial natural heritage system was not designed for this type of application either. Therefore, a combination of information from scientific literature and professional judgment was used to evaluate the potential impacts of climate change on the terrestrial natural heritage system. The expectation is that terrestrial species will exhibit one of two general responses to climate change: they may adapt to the changed conditions without shifting location or they may adjust their geographical distribution (if possible) (Huntley et al 2006). There are suggestions that the impacts of urbanization and ongoing human impacts that fragment landscapes and disrupt natural ecosystems will be magnified by climate change (Kling et al, 2003, Duncan et al, 2001). Degradation of habitat quality or quantity can reduce population sizes and growth rates and elevate the chance of local extinction events (Puliam 1988), while reductions in landscape connectivity could constrain the ability of many species to move in response to climate change (Primack and Miao 1992, Iverson et al., 1999). It is likely that the existing fragmented system will be less resilient to climate change than a better connected system, because the abundance of ‘edge’ in a fragmented system provides good opportunity for invasion by range-expanding species (Puliam 1988; Primack and Miao, 1992; and Iverson et al., 1999). Encroachment in human dominated land uses also creates barriers to native plant species dispersal, but facilitates dispersal for invasive alien species (Hansen et al., 2001). While it is very difficult to accurately predict the impact on biodiversity, it is expected that the future species composition will be different than it is at present. It is likely that these impacts will be greatest in areas near residential developments, because these areas offer the greatest risks of introduction of invasive alien species and effects of encroachment. It is also difficult to predict how birds and animals might respond, but researchers believe that there will be a lag time between habitat changes and wildlife responses (see Huntley et al, 2006; Wilby and Perry, 2006). For example, changes in reproductive cycles may fall out of synchronicity with availability of food supply. As climate changes, the management of the Humber watershed terrestrial system, including habitat plantings, may need to change. Species used for restoration planting will need to be very adaptive and consider not only the potentially changing precipitation and temperature regimes but such things as ground level ozone that has been shown to affect a variety of
Humber River Watershed Scenario Modelling and Analysis Report
4.5-26
agricultural plants. It may be that seed/plant stock from more southerly jurisdictions and/or genotypes that are resistant to drought and other extreme weather events will be needed. There is still a great deal of uncertainty around what the changing climate will mean for the ecosystems within the Humber. The best we can do is to try and protect and restore a system that has the quantity, quality and distribution (connectivity) of habitats for a diverse array of native species (this is a fundamental objective of the target terrestrial natural heritage system that has been recommended for the Humber watershed). By protecting and restoring the targeted system, we hope that the terrestrial natural heritage system will have inherent ability to withstand the stressors of an urban matrix and adapt to changes in climate and weather patterns. It is important to continue to monitor the natural system and that we take an “adaptive management” approach. We need to be flexible and “nimble” enough to adjust our implementation and management strategies for the terrestrial system based on the results of monitoring and advances in the science around climate change and species responses. 4.5.11 Summary and Conclusions The current terrestrial natural heritage system in the Humber River watershed is fragmented and of a “fair” quality overall, meaning there is only a “fair” capacity to support native biodiversity, and insufficient high quality habitat to support sensitive species over the long term. Urban growth will continue to negatively impact the system, either through direct loss of habitat or through negative matrix influence on adjacent habitats, unless the system can be protected and expanded. Protection and restoration of a target terrestrial natural heritage system, coupled with implementation of sustainable community design and practices, offers the opportunity to achieve better quality habitat overall, with greater likelihood of increasing biodiversity and supporting species of conservation concern. The increased temperature and precipitation expected under climate change scenarios will likely change the growing season and life cycle conditions for plants and wildlife. These conditions may be more favourable to southern species and could provide conditions suitable for invasive alien species to expand their range. The latter will be exacerbated with an increase in the urban matrix and potential for human impacts on terrestrial system quality. An expanded natural heritage system with greater biodiversity and connectivity would provide greater resiliency to these impacts.
Humber River Watershed Scenario Modelling and Analysis Report
4.5-27
4.5.12 Management Considerations Based on the scenario assumptions and subsequent results of the scenario analysis, the following management considerations were proposed for review in the development of the watershed plan:
Priority should be given to securing existing features including higher quality forests and wetlands that are threatened by urban development as well as lands needed for expansion of the system.
Secure a target terrestrial natural heritage system:
Undertake integrated planning for restoration and management of the targeted system that considers available information regarding site conditions (soil, topography, hydrology, and hydrogeology), existing species/habitat features, presence of sensitive groundwater areas, objectives for the aquatic system, and other multiple benefits when developing site level prescriptions and designs;
Restore and Manage the Targeted System:
Restore native ecological communities that can support diverse communities of species and genotypes;
Optimize connectivity in the watershed, including east-west connections; and Control and manage the spread of invasive alien plants.
Improve Connectivity of the Natural Heritage System (Ecopassages)
Ensure provision of passage for wildlife as a priority for new roads or where road improvements are proposed;
Significantly reduce the use of de-icing salt along roads that amphibians cross; and Integrate studies being conducted on species movement and seek to incorporate
recommendations for recovery into the implementation of the target terrestrial natural heritage system.
Continue terrestrial inventories (both remote sensing and field inventories), under the Regional Watershed Monitoring Program;
Monitoring
Develop a temporal monitoring program and database to track abundance and distributional trends of terrestrial species populations, flowering/pollination times, fruit/seed production, breeding times, etc.; and
Track the advancements in science on terrestrial species and climate change, and adapt management recommendations and implementation actions accordingly.
Manage the Urban Matrix:
Improve our understanding of the functions of the urban tree canopy and ways to improve them;
Limit soil compaction and topsoil loss during development to improve the success of plantings and naturalization efforts;
Ensure the compatibility of above and below ground infrastructure with existing and planned urban tree canopy and natural areas;

Humber River Watershed Scenario Modelling and Analysis Report
4.5-28
In planning new communities, situate urban open space areas in locations that buffer the targeted system and provide connectivity between large habitat patches;
Encourage naturalization and use of native species in landscaping on public, residential, commercial and industrial lands;
Plan for corridors of suitable habitat and structures that allow for species movement and foraging in the urban matrix; and
Control encroachments into the terrestrial natural heritage system by adjacent property owners including identifying and rectifying sources of garbage and pollution, alien invasive species and soil erosion (e.g. unfenced parking lots in business districts that direct storm water run off and garbage into natural areas; Norway maples adjacent to woodlots, etc.).
Manage the Agricultural Matrix:
• Protect and buffer habitats from incompatible use (e.g. livestock grazing,) and restore wetlands and riparian corridors.
Manage Trails and Recreation:
Manage passive use in natural areas to minimize disturbance at critical times; Ensure proposals for trail development consider locations of sensitive communities and
species and mitigate all potential threats (e.g. trampling, invasive alien species vectors, plant collection);
Educate trail users on ways and means to minimize their impacts on species and habitats;
Provide opportunities for visitors to learn about the natural system to foster appreciation; and
Situate intensively used trails (e.g. mountain biking or ATV trails) and areas (e.g. off-leash pet areas) outside the target terrestrial natural heritage system.
Stormwater management:
Newly created stormwater management ponds should be located outside the target terrestrial natural heritage system;
Situate stormwater management facilities adjacent to the target terrestrial natural heritage system so they can act as buffers between urban areas and natural habitats;
Manage ground and surface waters from surrounding urban areas, so that the hydrology of natural habitats is maintained (both forests and wetlands); and
Use clean stormwater to feed newly created habitats nearby; (i.e. clean stormwater collected from roofs and foundation drains can be used to create habitat).
Humber River Watershed Scenario Modelling and Analysis Report
4.5-29
4.5.13 References Duncan, K., E. Gregorich, P. Groffman, P. Kovacs, V. Magana, D. McKnight, E. Mills and D.
Schimel. 2001. Impacts, Adaptation and Vulnerability. Edited by J. J. McCarthy, O. F. Canziani, N. A. Leary, D. J. Dokken and K. S. White. Contribution of Working Group II to The Third Assessment Report of The Intergovernmental Panel on Climate Change.
Hansen A. J., R. P. Neilson, V. H. Dale, C. H. Flather, L. R. Iverson, D. J. Currie, S. Shaffer, R.
Cook and P. J. Bartlein. 2001. Global Change In Forests: Responses of Species, Communities. Biomes. BioScience. Vol.51 (9), pp. 765-779.
Huntley, B., Y. C. Collingham, R. E. Green and G. M. Hilton. 2006. Potential Impacts of Climate
Change Upon Geographical Distributions of Birds. Ibis. Vol. 148(1). Iverson, L. R., A. M. Prasad, B. J. Hale,and E. K. Sutherland. 1999. An Atlas of Current and
Potential Future Distributions of Common Trees of The Eastern United States. Delaware, OH: USDA Forest Service, Northern Research Station. General Technical Report. NE-Vol. 265.
Kharin V. V. and F. W. Zwiers. 2005. Estimating Extremes in Transient Climate Change
Simulations. Journal of Climate. Vol. 18, pp. 1156–1173. Kling, G. W., K. Hayhoe, L. B. Johnson, J. J. Magnuson, S. Polasky, S. K. Robinson, B. J.
Shuter, M. M. Wander, D. J. Wuebeles, D. R. Zak, R. L. Lindroth, S. C. Moser and M. L. Wilson. 2003. Confronting Climate Change in the Great Lakes Region: Impacts on Our Communities and Ecosystems. Union of Concerned Scientists, Cambridge, Massachusetts and Ecological Society of America. Wahsington, D.C.
Lee, H. T., W. D. Bakowsky, J. Riley, J. Bowles, M. Puddister, P. Uhlig and S. McMurray. 1998.
Ecological Land Classification for Southern Ontario: First Approximation and Its Application. Ontario Ministry of Natural Resources.
Ontario Ministry of Municipal Affairs and Housing (MMAH). 2002. Oak Ridges Moraine
Conservation Plan. Ontario Ministry of Municipal Affairs and Housing. 2005. Greenbelt Plan. Primack, R. B.,and S. L. Miao. 1992. Dispersal Can Limit Local Plant Distribution. Conservation
Biology. Vol. 6, pp. 513-519. Puliam, H. R. 1988. Sources, Sinks and Population Regulation. American Naturalist. Vol.132,
pp. 652-661. Toronto and Region Conservation Authority (TRCA). 2007a. Toronto and Region Terrestrial
Natural Heritage System Strategy. Toronto and Region Conservation Authority (TRCA). 2007b. Evaluating and Designing
Terrestrial Natural Heritage Systems..
Humber River Watershed Scenario Modelling and Analysis Report
4.5-30
Toronto and Region Conservation Authority (TRCA). 2008. Humber River State of the Watershed
Report – Terrestrial System. Wilby R. L. and G. L. W. Perry. 2006. Climate Change, Biodiversity and The Urban
Environment: A Critical Review Based on London, UK Progress. Physical Geography Vol. 30(1), pp. 73.