scenarios developed in the baltic-c program filetable 1. scenarios and sensitivity studies in...
TRANSCRIPT

Scenarios developed in the Baltic-C program
Anders Omstedt and
the Baltic-C team

Aim to present some results from:
Omstedt, A., Humborg, C., Pempkowiak, J., Pertillä, M., Rutgersson, A., Schneider, B., and Smith, B. (2014). Biogeochemical Control of the Coupled CO2–O2 System of the Baltic Sea: A review of the results of Baltic-C. Ambio,43: 49-59. DOI 10.1007/s13280-013-0485-4
Edman, M., and A., Omstedt (2013). Modeling the dissolved CO2 system in the redox environment of the Baltic Sea. Limnol. Oceanogr., 58(1), 2013, 74-92
Omstedt, A., Edman, M., Claremar, B., Frodin, P., Gustafsson, E., Humborg, C., Mörth, M., Rutgersson, A., Schurgers, G., Smith, B., Wällstedt, T., and Yurova, A. (2012). Future changes of the Baltic Sea acid-base (pH) and oxygen balances. Tellus B, 64, 19586, http://dx.doi.org/10.3402/tellusb.v64i0,19586.

Modelling the Baltic Sea CO2 - O2 system
The Baltic Sea CO2 - O2 system needs to be considered when studying multiple threats due to eutrophication, acidification and climate change on the marine system.

pH and alkalinity change in the redox environment of the Baltic Sea
Edman and Omstedt (2013)
Alkalinity generation due to anoxicwater needs to be considered in modelling otherwise the models willoverestimate acidification

Modelled and observed partial CO2 pressure in the central Baltic Sea
Reasonable modelled Baltic Sea CO2partial pressure but mid-summer minimum missing due to lack of phosphorus. A source missing?
Omstedt et al (2014)

Baltic-C modelling system and scenario design
AtmosphericCO2
Global climatemodel data
Regionalclimate
model data
Land usechangescenario
data
Terrestialcarbon model
River runoffcarbon model
Baltic SeabiogeochemCO2 model
b)
Terrestrial model: LPG-GUESSRiver runoff model: CSIM
Baltic Sea model: PROBE-Baltic
GCM models: ECHAM5, HADCM3, CCSM3
RCM model: RCA3
Omstedt et al. (2012).
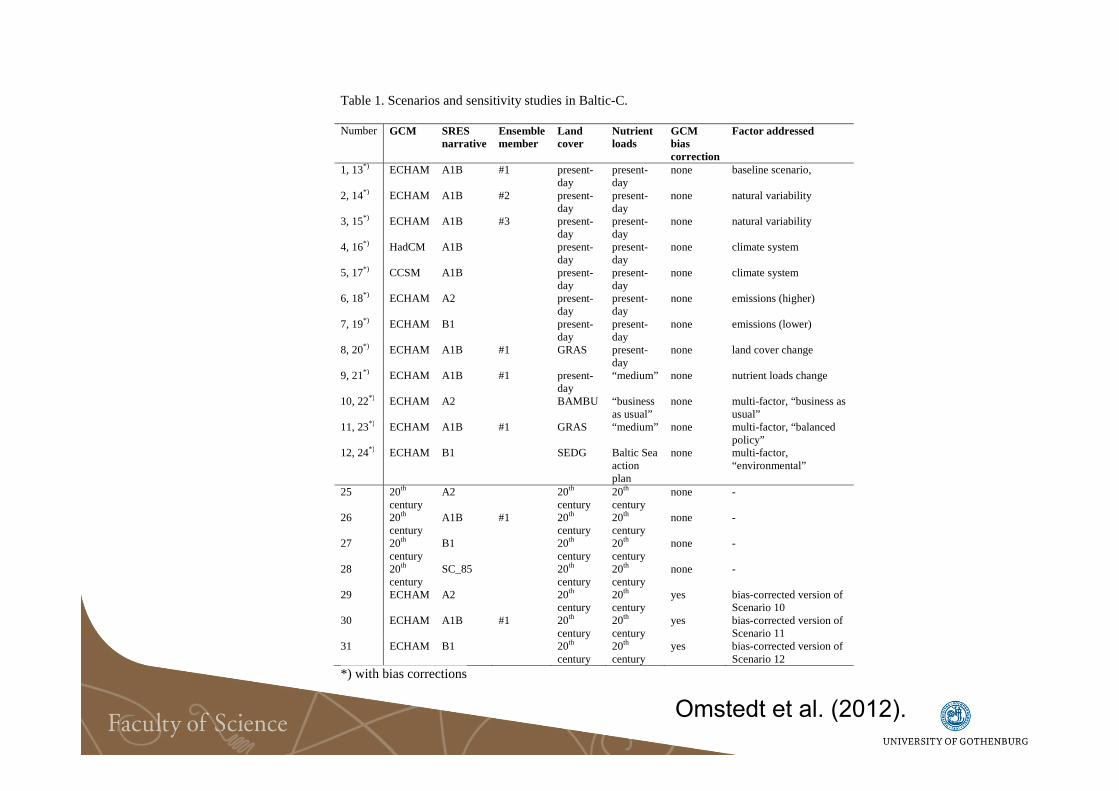
Table 1. Scenarios and sensitivity studies in Baltic-C. Number GCM SRES
narrative Ensemble member
Land cover
Nutrient loads
GCM bias correction
Factor addressed
1, 13*) ECHAM A1B #1 present-day
present-day
none baseline scenario,
2, 14*) ECHAM A1B #2 present-day
present-day
none natural variability
3, 15*) ECHAM A1B #3 present-day
present-day
none natural variability
4, 16*) HadCM A1B present-day
present-day
none climate system
5, 17*) CCSM A1B present-day
present-day
none climate system
6, 18*) ECHAM A2 present-day
present-day
none emissions (higher)
7, 19*) ECHAM B1 present-day
present-day
none emissions (lower)
8, 20*) ECHAM A1B #1 GRAS present-day
none land cover change
9, 21*) ECHAM A1B #1 present-day
“medium” none nutrient loads change
10, 22*) ECHAM A2 BAMBU “business as usual”
none multi-factor, “business as usual”
11, 23*) ECHAM A1B #1 GRAS “medium” none multi-factor, “balanced policy”
12, 24*) ECHAM B1 SEDG Baltic Sea action plan
none multi-factor, “environmental”
25 20th century
A2 20th century
20th century
none -
26 20th century
A1B #1 20th century
20th century
none -
27 20th century
B1 20th century
20th century
none -
28 20th century
SC_85 20th century
20th century
none -
29 ECHAM A2 20th century
20th century
yes bias-corrected version of Scenario 10
30 ECHAM A1B #1 20th century
20th century
yes bias-corrected version of Scenario 11
31 ECHAM B1 20th century
20th century
yes bias-corrected version of Scenario 12
*) with bias corrections
Omstedt et al. (2012).

The use of dimensionless skill metrics
The correlation coefficient: r
→ Do the model results and observations co vary?
The cost function : C
→ Are the model results within the std of observed data?
Omstedt et al. (2012).
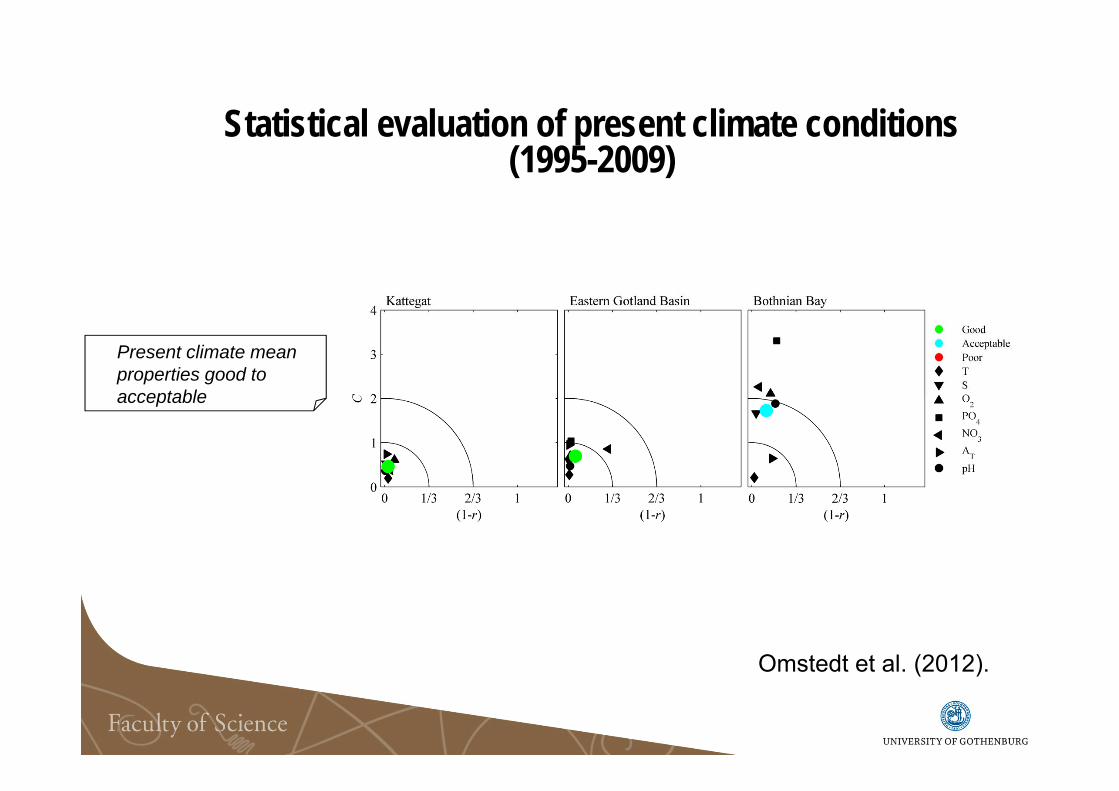
Statistical evaluation of present climate conditions(1995-2009)
Present climate meanproperties good to acceptable
Omstedt et al. (2012).

Statistical evaluation of climate forcing during control period (1971-2000)
Run 1-12 poor,Run 13-31 good to acceptableDelta change needed !
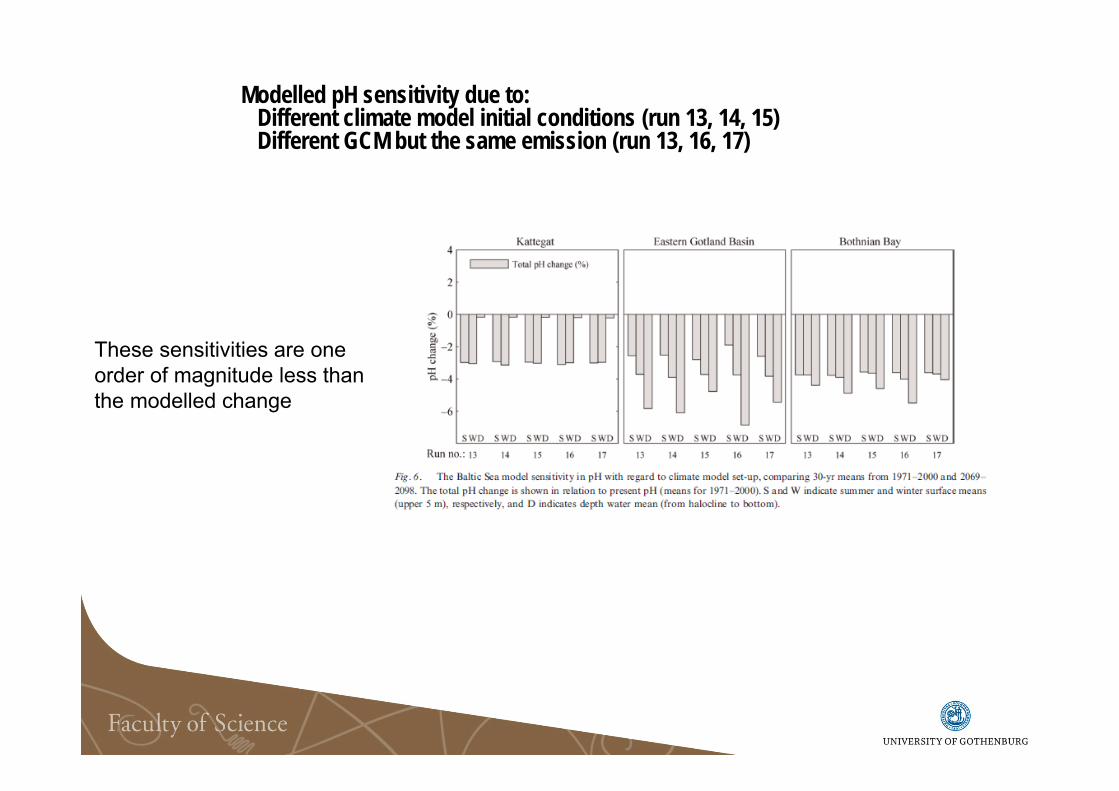
Modelled pH sensitivity due to:Different climate model initial conditions (run 13, 14, 15)Different GCM but the same emission (run 13, 16, 17)
These sensitivities are oneorder of magnitude less thanthe modelled change

Modelled pH sensitivity due to the same emissions but increasing model complexity:Run 26 the same climate as today but emissions as A1BRun 13 ECHAM +A1B no change in land-coverRun 21 as run 13 + Nutrient load changeRun 23 as run 21 + Land cover change
CO2 emission sets the scene. Climate change increases water temp. and the mineralization rates

Management options: Marine acidification and hypoxia or?
Baltic Sea will most likely become more acid in the future. Reduction needs in both nutrient loads and CO2 emissions.
Omstedt et al. (2012).

Two possible developments: BSAP-A2 and BAU-B1?pH distribution
Omstedt et al. (2012).
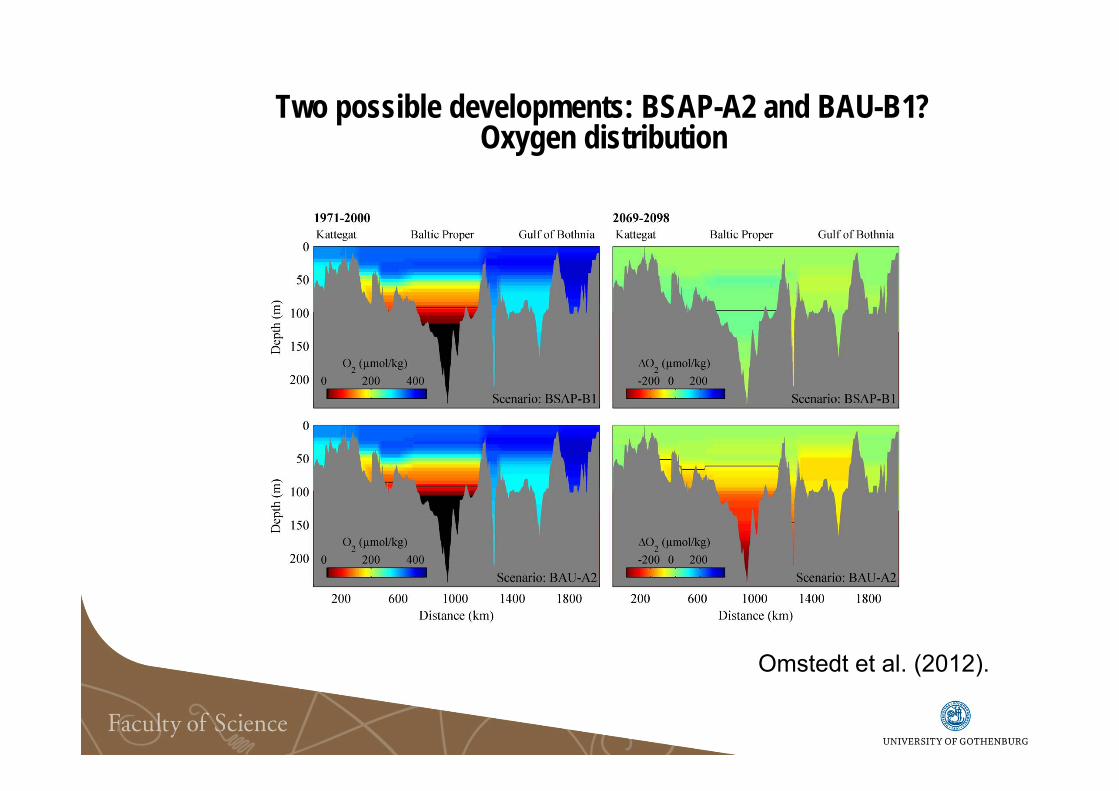
Two possible developments: BSAP-A2 and BAU-B1?Oxygen distribution
Omstedt et al. (2012).

Summary and conclusions• Marine acidification is influenced by increasing atmospheric CO2,
eutrophication, changes in alkalinity from rivers, changes in redox state and indirectly climate change.
• The acidification is not sensitive to GCM used or GCM initial conditions. Instead the main factor is the CO2 emissions. On that climate and river changes add modifications. Changes in hydrology may considerable change the Baltic Sea alkalinity distribution.
• Increased nutrient load will not inhibit future acidification in the Baltic Sea, but the seasonal pH cycle will become amplified due to increased biological production and mineralization. All examined scenarios indicate future acidification of the whole Baltic Sea and at all depth.
• Apart from decreasing pH, we also project a decreasing saturation state of calcium carbonate, a decreasing respiration index, and increasing hypoxic and anoxic waters, all of which will further threaten the marine ecosystem.
• The Baltic Sea will most probably become more acid in the future. Substantial reductions in fossil-fuel burning are needed and are not in conflict with the nutrient reductions suggested in the Baltic Sea Action plan.

Thanks for your interest!