scheduling guide for program managers · scheduling guide for program managers october 2001...
TRANSCRIPT

SCHEDULINGGUIDE
FORPROGRAM
MANAGERS
October 2001
PUBLISHED BY THEDEFENSE SYSTEMS MANAGEMENT COLLEGE PRESS
FORT BELVOIR, VA 22060-5565
For sale by the U.S. Government Printing OfficeSuperintendent of Documents, Mail Stop: SSOP, Washington, DC 20302-9328

ii

iii
FOREWORD
This guide provides an introduction to scheduling intended for use by governmentprogram managers and industry program of project managers and their respective staffs.It is the third version of a 1986 publication prepared by Mr. David D. Acker, Mr. J. StanleyBaumgartner, and Mr. Michael B. Patterson. A second version, published in 1994, wasprepared by Mr. William W. Bahnmaier and Mr. Paul T. McMahon.
This version addresses many of the topics contained in their earlier versions, especiallythose relating to the different types of scheduling techniques. The major differencebetween this and the previous versions is the treatment of scheduling as part of theacquisition process and the overall program management effort, particularly as it relatesto the planning and control functions of program management. Scheduling is discussedin the context of the development of integrated master plans and schedules, the riskmanagement process, and earned value management.
This guide is not intended as a detailed treatment of scheduling techniques. Instead, it ismore of a primer on the subject, addressing the importance of scheduling and theapplication of basic scheduling techniques. It is a compilation of information from varioussources, and hopefully will serve as a starting point for those who desire to delve deeperinto the various scheduling techniques.
The proliferation of microcomputers has greatly enhanced the capability of managers at alllevels to develop and analyze schedules. Chapter 9 provides an overview of the types ofautomated tools available and information on desirable features of scheduling softwareapplications.
This document reflects the efforts of many people. Mr. William W. Bahnmaier , Mr. PaulT. McMahon , Lt Col. David Bachman, USAF, and Mr. John Kelley of the DAU/DSMCfaculty provided invaluable guidance and advice. Mr. Gregory T. Caruth of the DAU/DSMC Press was very helpful in the composition of the guide. Frances M. Battle, provideddesktop publishing skills. Mr. Van Kinney, Ms. Joni Forman and Mr. Tom Parry of the OSDAcquisition, Resources and Analysis staff provided comments on the draft and overallsupport for the project. Special recognition also goes to the Institute for Defense Analysisteam of Mr. Lou Simpleman, Mr. Jim Lloyd, Mr. George Tolis, Ms. Patti Phillips, Ms. TinaHiggins, and Ms. Yolanda Prescott, who wrote, edited, and prepared the major portionsof the text.
Norman A. McDanielChairProgram Management and LeadershipDepartment
William W. BahnmaierEditorProgram Management and LeadershipDepartment

iv

v
CONTENTS
Chapter 1 INTRODUCTION ................................................................................................. 11.1 Overview ........................................................................................................................ 21.2 Purpose of This Guide .................................................................................................. 21.3 Guide Content ................................................................................................................ 21.4 Other Sources of Data ................................................................................................... 2
Chapter 2 PROGRAM MANAGEMENT AND THE ACQUISITION PROCESS .......... 32.1 Program Management Overview ................................................................................ 32.2 The Evolution of Program Management ................................................................... 42.3 The Acquisition Process and Scheduling .................................................................. 52.4 Risk Management and Scheduling ............................................................................. 6
Chapter 3 PROGRAM MANAGEMENT AND SCHEDULING ....................................... 73.1 Program Planning and Scheduling ............................................................................. 73.2 Work Breakdown Structure ......................................................................................... 8
3.2.1 Integrated Master Plans/Schedules .............................................................. 103.3 Program Controlling and Scheduling ........................................................................ 11
3.3.1 Earned Value Management ............................................................................ 113.4 Schedule Preparation .................................................................................................... 13
3.4.1 Activity Definition ........................................................................................... 133.4.2 Activity Sequencing ......................................................................................... 143.4.3 Activity Duration Estimating ......................................................................... 143.4.4 Schedule Development ................................................................................... 153.4.5 Schedule Control .............................................................................................. 15
3.5 Schedule Risk ................................................................................................................. 163.6 Summary ......................................................................................................................... 17
Chapter 4 SCHEDULE TYPES AND THEIR EVOLUTION ............................................. 194.1 Introduction .................................................................................................................... 194.2 Schedule Types .............................................................................................................. 19
4.2.1 Gantt and Milestone Charts ............................................................................ 194.2.2 Network Schedules .......................................................................................... 214.2.3 Production Schedules ...................................................................................... 23
4.3 Summary ......................................................................................................................... 24
Chapter 5 GANTT AND MILESTONE CHARTS ............................................................... 255.1 Description ..................................................................................................................... 255.2 Constructing Gantt and Milestone Charts ................................................................. 315.3 Gantt and Milestone Chart Advantages and Disadvantages .................................. 32
5.3.1 Advantages ....................................................................................................... 325.3.2 Disadvantages .................................................................................................. 32
5.4 How and When Gantt and Milestone Charts Are Employed ................................. 32

vi
5.5 Summary ......................................................................................................................... 33
Chapter 6 NETWORK SCHEDULING ................................................................................ 356.1 Description ..................................................................................................................... 35
6.1.1 PERT .................................................................................................................. 366.1.2 CPM .................................................................................................................... 376.1.3 PDM ................................................................................................................... 38
6.2 Network Scheduling Advantages and Disadvantages ............................................ 416.2.1 Advantages ....................................................................................................... 416.2.2 Disadvantages .................................................................................................. 41
6.3 How and When To Network Schedules Are Employed ......................................... 416.3.1 PERT Example .................................................................................................. 426.3.2 CPM Example ................................................................................................... 446.3.3 PDM Example ................................................................................................... 46
6.4 Network Scheduling When Resources Are Limited ................................................ 496.5 Summary ......................................................................................................................... 51
Chapter 7 PRODUCTION SCHEDULING .......................................................................... 537.1 Description ..................................................................................................................... 53
7.1.1 Objective Chart ................................................................................................. 547.1.2 Production Plan Chart ..................................................................................... 547.1.3 Program Status Chart ....................................................................................... 567.1.4 Line of Balance ................................................................................................. 56
7.2 How and When To Use the Line of Balance Techniques ........................................ 577.2.1 General ............................................................................................................... 577.2.2 Analysis ............................................................................................................. 57
7.3 Line of Balance Advantages and Disadvantages ...................................................... 587.3.1 Advantages ....................................................................................................... 587.3.2 Disadvantages .................................................................................................. 58
7.4 Summary ......................................................................................................................... 58
Chapter 8 TIME MANAGEMENT ....................................................................................... 598.1 Time Management and the Program .......................................................................... 59
8.1.1 Time Reserve .................................................................................................... 598.1.2 “Now” Schedule ................................................................................................ 598.1.3 Value of Time .................................................................................................... 60
8.2 Time Management and the Program Manager ......................................................... 628.3 Summary ......................................................................................................................... 63
Chapter 9 AUTOMATED SCHEDULING TOOLS ............................................................ 659.1 Automated Planning Aids ........................................................................................... 659.2 Functional Characteristics and Features .................................................................... 669.3 Evaluating Project Management Software Projects .................................................. 689.4 Finding Out More .......................................................................................................... 70

vii
APPENDIX A INTEGRATED MASTER SCHEDULE ..................................................... 71
APPENDIX B TIME ROBBERS ........................................................................................... 77
APPENDIX C GLOSSARY .................................................................................................. 79
APPENDIX D BIBLIOGRAPHY ......................................................................................... 83
FIGURES3-1 Generic Aircraft System WBS ....................................................................................... 93-2 IMP/IMS Sample ........................................................................................................... 104-1 Gantt Chart Example ..................................................................................................... 204-2 Milestone Chart Example ............................................................................................. 214-3 Network Schedule Example ........................................................................................ 225-1 Example Gantt Chart Symbols ..................................................................................... 255-2 Example Gantt Chart ..................................................................................................... 265-3 Example Milestone Chart Symbols ............................................................................. 275-4 Example Milestone Chart ............................................................................................. 285-5 Example Combination Chart ....................................................................................... 295-6 Gantt Chart with Amplifying Information ................................................................. 306-1 Beta Distribution with PERT Time Estimates ........................................................... 376-2 Example PDM Relationships/Constraints ................................................................ 396-3 Example PDM Constraints with Lag Time ................................................................ 406-4 Example PDM Activity Node ...................................................................................... 406-5 PERT Example ............................................................................................................... 426-6 PERT Example with Slack Time .................................................................................. 436-7 CPM Example ................................................................................................................ 446-8 PDM Example ................................................................................................................ 476-9 PDM Example—Example and Late Start and Finish Times ................................... 476-10 PDM Example with Lag Time ..................................................................................... 486-11 Network Schedule with Constrained Resources ...................................................... 496-12 Personnel Loading Chart .............................................................................................. 506-13 Revised Personnel Loading Chart .............................................................................. 516-14 Revised Network Schedule with Constrained Resources ....................................... 527-1 Line of Balance Technique ........................................................................................... 558-1 Total Cost Analysis for Selecting “Optimum” Program Duration ........................ 609-1 On-Screen Data Entry Using Gantt Chart Feature (AEC Software Fast Track Schedule) 68
TABLES6-1 CPM Example Time Estimates .................................................................................... 469-1 Project Management Software Functions and Criteria ............................................ 69

viii

ix

1INTRODUCTION
1.1 OVERVIEW
In its simplest form, a schedule is a listingof activities and events organized by time.In its more complex form, the process ex-amines all program activities and their re-lationships to each other in terms of realis-tic constraints of time, funds, and people,i.e., resources. In program managementpractice, the schedule is a powerful plan-ning, control, and communications tool that,when properly executed, supports timeand cost estimates, opens communicationsamong personnel involved in program ac-tivities, and establishes a commitment toprogram activities.
A key aspect of program management plan-ning, scheduling is integral to a program’sacquisition strategy and to risk manage-ment, financial, and technical managementplans. In addition, scheduling is an impor-tant element of the other management func-tions: organizing, staffing, controlling, andleading. For example, controlling is per-formed to keep abreast of program execu-tion. To achieve this goal, it is necessary toknow whether the program is behind, on,or ahead of schedule, and what adjust-ments are necessary to keep the programon schedule once it’s back on track.
Why do Program Managers (PMs) sched-ule? The simple answer is they need a roadmap for all program players. In reality,scheduling can accomplish far more thanproviding a list of activities and times.
1
Effective scheduling supports the follow-ing key program management activities:
• Provides the basis for effective com-munications within the government teamand with contractors,
• Identifies a baseline for program statusmonitoring, reporting, and program control,
• Facilitates management, and
• Provides the basis for resource analysisand leveling, exploration of alternatives,and cost/time tradeoff studies.
On the other hand, poor scheduling canadversely impact a program in a numberof areas. Haphazard schedules make itdifficult, at best, to determine a realisticcompletion date and to efficiently allo-cate resources to the entire program. Thiscreates financial problems—escalation ofcosts, increased support costs, delayedreturn on investment, funding cuts, orprogram termination.
Since scheduling is a powerful planning,control, and communications tool avail-able for program management, PMs musthave a good working knowledge of sched-uling practices and applications (such asGantt, milestone, and network schedules)in order to achieve program goals. PMswill not always have to construct detailedschedules, but they must be able to under-stand and analyze schedules created by

others (e.g., contractors) to successfullymanage a program. Since scheduling is anintrinsic and indispensable element of themanagement process, it is treated withinthe context of program management.
1.2 PURPOSE OF THIS GUIDE
This guide is an introduction to sched-uling. It is meant for people who alreadyhave some experience in program man-agement and those who seek to learn moreabout the subject. It is not a detailedtreatment of the subject, but instead, ex-plains how scheduling fits into the overallprogram management effort and how toaccomplish schedule planning. It also il-lustrates different scheduling conceptsand techniques and how they can be ap-plied and analyzed to manage effectively.Finally, it is intended as a road map toother useful and more comprehensivedocuments and texts on the subjects ofproject management, planning, and sched-uling that are available in the literature.
1.3 GUIDE CONTENT
In order to provide a suitable context forthe topic of scheduling, Chapter 2 pro-vides an overview of both program man-agement and the acquisition process andthe role scheduling plays in each.
Chapter 3 expands on the role of schedul-ing in program management and addressesthe following topics: work breakdownstructure, integrated master plans andschedules, and earned value management.It concludes with a discussion of schedulepreparation and schedule risk.
Chapter 4 introduces the topic of schedul-ing techniques with a general discussion of
the various types of schedules and howand why they evolved. This chapter is aprecursor for Chapters 5, 6, and 7, whichpresent a more detailed discussion ofthe key schedule types. These chaptersfocus on Gantt and milestone schedules,network schedules, and productionschedules.
Chapter 8 introduces the concept of timemanagement as it relates to the programand to the PM. Chapter 9 presents thesubject of automated project planning toolsand summarizes some of the desirable fea-tures of currently available software prod-ucts. In addition to an overview describingthe types of automated tools available, thischapter provides some suggestions on howto find and evaluate the latest products.The chapter concludes with a summary ofinformation sources that will be useful forfurther inquiry.
1.4 OTHER SOURCES OF DATA
As previously noted, this guide is intendedas a primer. There is a considerable body ofliterature on the subject of scheduling.Much of it is of an academic nature notspecifically keyed to defense acquisition.A number of these texts are listed in theBibliography Appendix of this guide. Ad-ditionally, an enormous amount of rel-evant information can be secured by search-ing the web using some of the popularsearch engines.Of particular use to PMs is the DefenseAcquisition Deskbook, available on theInternet (http://www.deskbook. osd.mil).The Deskbook includes a database contain-ing mandatory and discretionary policydocuments, Department of Defense andcomponent discretionary practices, soft-ware tools and descriptions, front-line wis-dom and advice, and sample formats.
2

2PROGRAM MANAGEMENT AND
THE ACQUISITION PROCESS
2.1 PROGRAM MANAGEMENT OVERVIEW
The Department of Defense (DoD) consid-ers program management to consist of thetasks and activities that must be done inorder to design, develop, field, and sup-port a weapons system. DoD directivesdescribe an Acquisition Program as: “Adirected, funded effort that is designed toprovide a new, improved, or continuingweapons system or automated informa-tion system (AIS) capability in response toa validated operational need.”1 DoD con-siders the “program” to include the ele-ments of the acquisition process, such asthe planning, programming, and budget-ing process, and the design, development,and production of the system. Practicallyspeaking, a DoD program consists of acombination of organizational resources,assembled to create a weapons system tomeet a specific operational requirement.
Four key considerations typically involvedin a program are:
• Cost to produce the system,
• Time required to complete the effort,
• Capability/technical performance re-quired to meet needs, and
• Contribution of the system to the over-all defense operational and strategic plans.
For purposes of this guidebook, ProgramManagement consists of the planning, or-ganizing, staffing, controlling, and leading(POSCL) management functions. Otherfunctions sometimes included in a pro-gram management context are scheduling,budgeting, monitoring, directing, andmaintaining consensus and support. Forthis guidebook, these latter functions areconsidered subcategories of the basic fivefunctions, when appropriate.
• Planning addresses the program mis-sion, objectives, goals, and strategy andincludes all management activities that re-sult in selection of a course of action.
• Organizing considers the resources in-volved and how are they related. This func-tion addresses the alignment of people,funds, equipment, facilities, etc., and thestructure of the organization in order tomeet program goals; it identifies:
− Authority—The power to make finaldecisions
− Responsibility—The obligation to per-form assignments
− Accountability—The state of beinganswerable for the completion of anassignment.
• Staffing addresses the qualificationsand special skills that may be required
3

for persons assigned to each position inthe program and the time phasing of as-signments.
• Controlling is the function during whichthe manager monitors, measures, evalu-ates, and corrects program activities to en-sure that actual operations conform toplans.
• Leading is the process whereby oneindividual exerts his/her influence overothers in a group. Directing, an element ofleadership, is the process of implement-ing, through the talents of others, the plansto meet program objectives. This includestraining, supervising, delegating, motivat-ing, counseling, and coordinating.
In a broad sense, the planning phase in-cludes the tasks associated with definingthe work requirements, specifying the quan-tity and quality of work, identifying re-sources, and organizing them to best carryout the program. Likewise, the manage-ment or execution phase includes the tasks ofmonitoring progress, comparing actual topredicted outcomes, analyzing the impactof differences between planned and actualachievements, and adjusting the programas necessary.
2.2 THE EVOLUTION OFPROGRAM MANAGEMENT
Formal program management came to theforefront in the late 1950s. The need todevelop and implement a managementapproach to manage large-scale militarysystems, both weapons and support sys-tems, stimulated the government and aero-space industry to devise the means to planand execute complex programs. As thecost of weapons systems increased and theintensity of the Cold War grew, DoD also
felt the need to predict the cost, schedule,and performance of its new systems. Mili-tary organizations (predecessors of cur-rent “acquisition” organizations), in conjunc-tion with defense contractors, developedmuch of the early theory and practices ofprogram management as new technolo-gies emerged.
The use of “task teams” or program teamsand other organizational entities led to theemergence of a program management phi-losophy for integrating activity in organiza-tions. As the program management disci-pline evolved, organizations developedspecial techniques for planning, organiz-ing, staffing, controlling, and leading pro-grams to integrate those activities from afocal point in the organizational structure.Moreover, program management ad-dressed the elements of technical perfor-mance, cost, and schedule on a continualrather than one-time basis in the evolutionof a program and considered them withinthe context of an organization’s operational(short-term) and strategic (long-term)objectives.
DoD has recently improved managementwith the introduction of the concept ofIntegrated Product and Process Develop-ment (IPPD) and Integrated Product Teams(IPTs). IPPD integrates all acquisition ac-tivities to optimize system development,production, and deployment. Key to thesuccess of this concept are the IPTs, com-posed of qualified and empowered repre-sentatives from all appropriate functionaldisciplines who work together to identifyand resolve issues. IPTs are the founda-tion for program management. One of thetenets of IPPD is the use of event-drivenscheduling, which relates program eventsto their accomplishment and accomplish-ment criteria. Its use reduces risk by
4

ensuring that product and process matu-rity is incrementally demonstrated prior tobeginning follow-on activities.
2.3 THE ACQUISITION PROCESSAND SCHEDULING
For the management of programs, the DoDacquisition process provides a frameworkthat consists of a series of phases and mile-stones. The phases are a logical means ofprogressively translating broad missionneed statements into well-defined system-specific requirements and ultimately intooperationally effective, suitable, and sur-vivable systems. Each phase is designed,among other things, to manage/reduce therisks, ensure affordability, and deliver thesystem to the user as soon as possible.Milestones are the points in time wheredecision makers evaluate the status of theprogram and determine if the programshould proceed to the next phase. Prudentconsideration of schedule implications isimportant in all phases of a program.
Milestone Decision Authority (MDA) andService acquisition officials are encouragedto tailor programs to eliminate phases oractivities that result in little payoff in termsof fielding time or cost. To effectivelytailor a program, managers must under-stand scheduling, resource availability andallocation, and the risk associated with thetailoring.
An acquisition strategy defines the busi-ness and technical management approachto meet objectives within schedule andprogram constraints. A primary goal is tominimize the time and cost of satisfying avalid need, consistent with common senseand sound business practices. A PM pre-pares a preliminary acquisition strategy atMilestone 0 and updates the strategy to
support each milestone decision by de-scribing activities and events planned forthe upcoming phase and relating the ac-complishments of that phase to theprogram’s overall, long-term objectives.The acquisition strategy is first formallyapproved and published at MSI, ProgramInitiation. It provides a master schedule forresearch, development, test, production,fielding, and other activities essential toprogram success. This master schedulealso serves as the basis for formulatingfunctional plans and schedules.
As a program evolves through subsequentphases, new information becomes avail-able that permits refinement of schedulesand assignment of resources. Understand-ing of program risk becomes more specificas the system under development is de-fined, thereby allowing identification ofrisk-handling initiatives and their effect onschedule. Schedule considerations are anintegral part of any Source Selection pro-cess, from preparation of the Request forProposal (RFP) through proposal evalua-tion. After contract award, the scheduleserves as a basis to determine progress andassess the need for management action.
Government developers should design theircontracts with industry to allow time formilestone decisions, permit demonstrationof exit criteria in time to support milestonereviews and to reflect expenditure of moneywith the program’s funding profile. A goodacquisition strategy allows fiscal controlwithout delaying the acquisition decisionsor contracts while adequately consideringrisk. In other words, it reflects thoughtfulschedule and resource planning.
As a key element of the planning proess, PMsmust update the schedule as more is learnedabout the program and as changes occur.
5

With each new update, program cost, time,and requirements may change. PMs mustrespond by changing the mix and level ofresources and continuously updating theprogram plan and the schedule as needed.
2.4 RISK MANAGEMENT AND SCHEDULING
DoD defines risk management as “the actor practice of controlling risk. It includesrisk planning, assessing risk areas, devel-oping risk-handling options, monitoringrisks to determine how risks have changed,and documenting the overall risk manage-ment program.”2 As part of their responsi-bility to manage risk, PMs must considerrisk in their planning and scheduling prac-tices. Risk management is concerned withthe identification of uncertainties thatthreaten cost, schedule, and performanceobjectives, and the development and imple-mentation of actions to best deal with thoseuncertainties.
6
ENDNOTES
Risk management and scheduling areclosely tied. Consideration of one requiresa reassessment of the other. For example,in creating the strategy and plans to handleprogram risk, a PM must con-sider how the approach affects the pro-gram schedule. Similarly, any tradeoffsbetween cost and performance must takeinto account schedule implications. Con-versely, any change to the program sched-ule must consider the impact on the overallprogram objectives and on cost and perfor-mance. The challenge is to develop a planthat balances risk, cost, schedule, and per-formance.
Schedule risk is defined as the likelihoodand consequences of failing to meet theprogram schedule, and it is an integral partof program risk. This topic is covered inChapter 3.
1DoDD 5000.1, Defense Acquisition, March 15, 1996. (Being revised and updated as of 1 January 2000)
2Ibid.

3PROGRAM MANAGEMENT AND SCHEDULING
7
As discussed in the previous chapters,scheduling is one of the most powerfultools available to the PM, and its effectiveapplication is essential to program suc-cess. While it is a key element in perform-ing all program management functions, itis also critical to the accomplishment ofplanning and controlling managementfunctions. This chapter discusses schedul-ing in the context of these two functionsand addresses the essential elements andconsiderations in schedule planning.
3.1 PROGRAM PLANNING ANDSCHEDULING
Program planning is the process of deter-mining what needs to be accomplished, bywhom, when, and under what resourceconstraints. It is arguably the most impor-tant of the program management functions.Without a sound and comprehensive plan,it is virtually impossible to develop a mean-ingful budget, effectively organize and staffthe program office, direct the actions of theprogram office, or monitor and control theprogram. In addition to determining the“what, where, who, with what, and when”of a program, planning also helps to iden-tify risk areas and ways to handle the risk,and establishes the program baselines.
There are a number of products of theplanning process. Among them are:
• Acquisition Strategy—This is the com-prehensive, integrated plan the programwill follow. It provides an overall concept
of the program that functional plans willlay out in greater detail and reflects thestrategy that will be followed to meet pro-gram objectives and to handle risk in theprogram. The acquisition strategy in-cludes a program structure/schedulewhich depicts a visual overview and pic-ture presentation of the acquisition strat-egy. This schedule is a single diagramsimilar to the diagram shown in Figure 3-3,and defines the relationship among acqui-sition phases, decision milestones, solici-tations, contract awards, systems engineer-ing design reviews, contract deliveries, testand evaluation activities, production re-leases, and operational deployment objec-tives. It includes quantities to be procuredand delivered by fiscal year by phase interms of prototypes, engineeringdevelopmemt models, low-rate intitial pro-duction and full-rate production. The pro-gram structure/schedule is a key decisionreview/milestone document; it summa-rizes the program and is built from manyother more detailed schedules found infunctional plans such as test and evalua-tion, contracting, etc. It is sometimes re-ferred to as the Master Program Schedule(MPS). In addition to this top level struc-ture/schedule, the PM may deem it neces-sary to have more detailed program man-agement Integrated Master Plans (IMP) andIntegrated Master Schedules (IMS) pre-pared and submitted by the contractorduring the proposal process. See the DSMCAcquisition Strategy Guide1 for informationon structuring, developing, and executingan acquisition strategy.

• Functional Plans—These are the de-tailed plans that lay out the approach tobe taken in the different functional areas.Examples include: the Test and Evalua-tion Master Plan (TEMP) and Command,Control, Communications, Computers, andIntelligence (C4I) Support Plan, which arerequired; and the Systems EngineeringMaster Plan (SEMP), Logistics SupportPlan (LSP), etc., which are optional.
• Work Breakdown Structure (WBS)—The WBS provides a basic framework foridentifying each element of a project inincreasing levels of detail. In essence, itdescribes the way work is performed. TheWBS also provides a coherent method forreporting progress toward plan goals.
• Integrated Master Plan (IMP)—TheIMP is an event-based plan depicting theoverall structure of the program and thekey processes, activities, and milestones.It defines accomplishments and criteria foreach event.
• Integrated Master Schedule (IMS)—The IMS shows the detailed tasks andtiming for events in the IMP and depictsthe logical progression of events through-out the program. These tasks should bedirectly traceable to the IMP and the WBS.
• Schedules—A series of schedules aredeveloped during the planning process,all of which are derived from the IMS.These schedules are developed to showthe details required to complete key activi-ties and milestones.
• Budget—The budget reflects the costof the integration of the scope, schedule,and resource plan for accomplishing thework.
Scheduling is a critical element in the plan-ning process. In addition to being an out-put of the process as discussed above, italso contributes to the development of theother outputs. The early involvement ofpeople who are knowledgeable and experi-enced in scheduling techniques can contrib-ute to the effective translation of strategicconcepts and ideas into detailed logic dia-grams, depicting the program activitiesand relationships among activities. Thiscan be very useful in developing budgetand detailed functional plans, especiallyin identifying the required resources andleveling them throughout the activities.
The WBS and the IMP/IMS are importantconcepts used in the scheduling processand are described in more detail in thefollowing sections.
3.2 WORK BREAKDOWN STRUCTURE
During the 1960s, the impetus to develop atool to help project managers define aproject in a cohesive way gave rise to thedevelopment of the WBS. WBS use has notbeen confined to the DoD and its contrac-tors; rather, it is now used in many com-mercial enterprises. Several years after theemergence of the WBS concept, DoD pub-lished a WBS standard for DoD acquisitionorganizations as well as their contractors touse: MIL-STD-881B. This standard has beensuperseded by a handbook, MIL-HDBK-881, dated 2 January 1998. It contains muchof the same information as its predecessorbut is not directive in nature and is forguidance only.
MIL-HDBK-881defines a WBS as:
• A product-oriented family tree com-posed of hardware, software, services, data,and facilities. The family tree results from
8

high cost or high risk. In that case, the WBSshould be taken to a lower level ofdefinition.
WBS's apply to seven specific categories ofdefense materiel systems: aircraft; elec-tronic/automated software; missile, ord-nance; ship; space; and surface vehicle.The WBS should be developed and main-tained based on the systems engineeringefforts throughout the system’s life cycle.
Figure 3-1 is an example of a level 3 program
systems engineering efforts during the ac-quisition of a defense materiel item.
• A WBS displays and defines the prod-uct, or products, to be developed and/orproduced. It relates the elements fo workto be accoomplished to each other and tothe end product.
• A WBS can be expressed down to anylevel of interest. However, the top threelevels are as far as any program or contractneeds to go unless the items identified are
9
Figure 3-1. Generic Aircraft System Program WBS
Level 1 Level 2 Level 3Aircraft System Air Vehicle
Systems Eng/Program MgmtSystem Test andEvaluation
Training
Data
Peculiar SupportEquipment
Common SupportEquipment
Operational/SiteActivation
Industrial Facilities
Initial Spares &Repair Parts
AirframePropulsionA/V Application S/WA/V System S/WNavigation/GuidanceCentral ComputerFire ControlData Display and ControlsSurvivabilityReconnaissanceAutomatic Flight ControlCentral Integrated CheckoutAntisubmarine WarfareArmament Weapons DeliveryAuxiliary Equipment
Development Test and EvaluationOperational Test and EvaluationMock-upsTest and Evaluation SupportTest Facilities
EquipmentServicesFacilities
Technical PublicationsEngineering DataManagement DataSupport DataData Depository
Test and Measurement EquipmentSupport and Handling Equipment
Test and Measurement EquipmentSupport and Handling Equipment
System Assembly, Installation andCheckout on SiteContractor Technical SupportSite ConstructionSite/Ship/Vehicle Conversion
Construction/Conversion/ExpansionEquipment Acquisition orModernizationMaintenance (Industrial Facilities)
Initial Spares and Repair Parts
Prime Mission System

10
WBS for an aircraft system. The WBS ap-proach provides a powerful technique forscoping a project in a manner that providesmanagement with insight into project re-quirements and performance from thevery top, or systems level, to the lowestlevel of definition of a work product. Plan-ning work using the WBS approach servesas the basis for both estimating and sched-uling resource requirement.
3.2.1 Integrated Master Plans/Schedules
The IMP is a very effective tool of programmanagement. It is the contractor's event-based plan for accomplishing the State-ment of Objectives (SOO) and Statement ofWork (SOW). It identifies the key activi-ties, events, milestones, and reviews thatmake up the program. A program IMP isprepared initially by the contractor and
provides the basis for development of sub-ordinate IMPs and other functional plans.It also identifies those events and activitiesthat will be included in the IMS.
The IMS is a networked multi-layeredschedule generated by the contractor thatbegins with all identified IMP events, ac-complishments, and criteria. It shows theexpected start and finish dates of theseevents. It contains all contractually re-quired events/ milestones such as reviews,tests, completion dates, and deliveriesspecified in the program WBS.
The IMP is prepared by the contractorduring the proposal process. It is main-tained by the government program officeand contractor through a collaborative ef-fort involving all the program “stakehold-ers.” In some cases, a preliminary IMPmay be developed by the government,
Figure 3-2. IMP/IMS Sample
Detailed Tasks1. Preliminary Design Complete2. Duty Cycle Defined
Requirement WBS Elements SOW Task
Integrated Master Plan
Integrated Master Schedule
3.1 Air Vehicle (WBS 1000)Design, develop, produceand verify, complete airvehicles, defined as airframepropulsion, avionics andother installed equipment.
Management Plan EventsPDR
Accomplishment Criteria1. a. Duty Cycle Defined b. Preliminary Analysis Complete
1. Preliminary Design2. Review
19XX 19XY 19XZProgram Events PDR CDR
1000 Air Vehicle1100 Airframe
1110 Wing
11n
System Specification
1000 Air Vehicle
1100 Airframe
Wing

with industry input, during pre-solicita-tion. The IMP defines contract requirementsstated in the RFP and contractors use it todevelop the IMS and detailed functionalschedules. These integrated schedules tietogether all program tasks by showing theirlogical relationships and any constraintscontrolling the start or finish of each task.This process results in a hierarchy of re-lated functional and layered schedulesderived from the WBS that can be used formonitoring and controlling programprogress. An example (suggested format)of an IMP/IMS for an aircraft developmentprogram is depicted in Figure 3-2. The IMSshould be expanded down to the level ofdetail appropriate for the scope and risk ofthe program. Programs with high riskshould show more detail in the IMS toprovide the visibility necessary to managerisk. A more detailed discussion of IMS's iscontained in Appendix A. A Data ItemDecription (DID) has been developed by theDepartment of Defense for the IMS; the iden-tification number is DI-MISC-81183A. ThisDID is at Tab 1 to Appendix A.
3.3 PROGRAM CONTROLLINGAND SCHEDULING
The controlling function contains all thoseactivities that a program manager under-takes in attempting to ensure that the ac-tual program conforms to the developedplan, to include the implementation of nec-essary action to get the program back onthe plan if possible. To control a program,the PM needs the means to monitor pro-gram progress against the established plan,or the program baseline. In its simplestform, the program schedule can serve as abaseline against which to measure progress.If there are indications that an activity isfalling behind schedule, this informationcan be used by the manager as a basis for
corrective action. However, consideringschedule information alone can be mis-leading. Successful management requiresthe integration of the technical, schedule,and cost aspects of a program. Thus, someform of integrated performance measure-ment is needed for monitoring and control-ling a program. The concept of earned valuemanagement provides such a capability.
3.3.1 Earned Value Mangement
Earned Value Management (EVM) is theuse of an integrated management systemthat coordinates work scope, schedule, andcost goals and objectively measures pro-gress toward these goals.2 The purpose ofEVM is to provide contractor and gov-ernment PMs with accurate data to moni-tor program execution. It is also intendedto provide an adequate basis for soundcontractor and government decision mak-ing by requiring that the contractor’s inter-nal management control systems producedata that: (1) indicate work progress; (2)properly relate cost, schedule, and techni-cal accomplishments; (3) are valid, timely,and able to be audited; and (4) provideDoD component managers with informa-tion at a practical level of summarization.
The DoD earned value process holds thecontractor responsible for effective imple-mentation of an EVM system. DoD does notprescribe a specific EVM system for con-tractors to use; instead, it has established aset of criteria that the contractors’ systemsmust meet to be acceptable. The require-ment to use an EVM system that meets thecriteria is dependent on the type and sizeof the contract. DoD Regulation 5000.2-Rdefines the contracts that must use such anEVM system as well as the criteria for anacceptable system. For contracts that do
11
not meet these thresholds, contractor man-agement information is provided to thegovernment using a Cost/Schedule StatusReport (C/SSR). This report should bebased on an underlying management sys-tem that uses an earned value approach fortracking progress. Such a system does nothave to meet the EVM criteria of DoD5000.2-R; however, the government shouldnegotiate with the contractor to ensure thatthe system does emphasize earned valuemethodology.
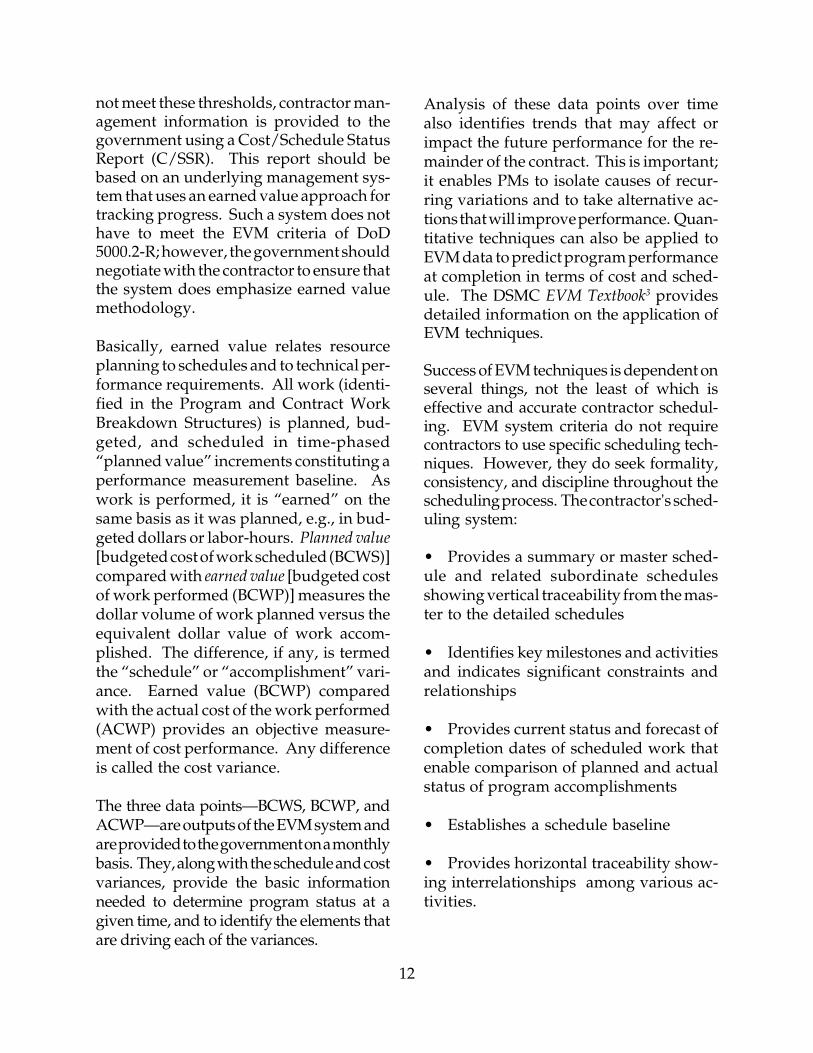
Basically, earned value relates resourceplanning to schedules and to technical per-formance requirements. All work (identi-fied in the Program and Contract WorkBreakdown Structures) is planned, bud-geted, and scheduled in time-phased“planned value” increments constituting aperformance measurement baseline. Aswork is performed, it is “earned” on thesame basis as it was planned, e.g., in bud-geted dollars or labor-hours. Planned value[budgeted cost of work scheduled (BCWS)]compared with earned value [budgeted costof work performed (BCWP)] measures thedollar volume of work planned versus theequivalent dollar value of work accom-plished. The difference, if any, is termedthe “schedule” or “accomplishment” vari-ance. Earned value (BCWP) comparedwith the actual cost of the work performed(ACWP) provides an objective measure-ment of cost performance. Any differenceis called the cost variance.
The three data points—BCWS, BCWP, andACWP—are outputs of the EVM system andare provided to the government on a monthlybasis. They, along with the schedule and costvariances, provide the basic informationneeded to determine program status at agiven time, and to identify the elements thatare driving each of the variances.
Analysis of these data points over timealso identifies trends that may affect orimpact the future performance for the re-mainder of the contract. This is important;it enables PMs to isolate causes of recur-ring variations and to take alternative ac-tions that will improve performance. Quan-titative techniques can also be applied toEVM data to predict program performanceat completion in terms of cost and sched-ule. The DSMC EVM Textbook3 providesdetailed information on the application ofEVM techniques.
Success of EVM techniques is dependent onseveral things, not the least of which iseffective and accurate contractor schedul-ing. EVM system criteria do not requirecontractors to use specific scheduling tech-niques. However, they do seek formality,consistency, and discipline throughout thescheduling process. The contractor's sched-uling system:
• Provides a summary or master sched-ule and related subordinate schedulesshowing vertical traceability from the mas-ter to the detailed schedules
• Identifies key milestones and activitiesand indicates significant constraints andrelationships
• Provides current status and forecast ofcompletion dates of scheduled work thatenable comparison of planned and actualstatus of program accomplishments
• Establishes a schedule baseline
• Provides horizontal traceability show-ing interrelationships among various ac-tivities.
12

The scheduling baseline usually con-sists of a hierarchy of vertically inte-grated schedules, with each lower-levelschedule more fully identifying and ex-panding the tasks necessary to meet theprogram’s objectives. Generally, three setsof schedules are prepared:
• Master Schedule (MS)—The top-levelschedule that summarizes key programactivities and milestones and depicts thelogical progression of events throughout acontract. Program Structures/Master Pro-gram Schedules developed by the govern-ment PM reflect information contained inthe contractor's Master Schedule.
• Intermediate Schedules—The sched-ule that ties the MS to the detailed sched-ules. It allows for rollup of detailed sched-ules to summary levels that are useful formanagement.
• Detailed Schedules—The schedules atthe control account or work package level.Work packages must be distinguishablefrom each other and must include definitestart and completion dates. They are pre-pared by the contractor with governmentconcurrence.
3.4 SCHEDULE PREPARATION
As stated earlier, scheduling is a criticalelement of the planning process. Con-versely, planning is critical to the devel-opment of effective schedules. Near-termscheduling can and should be accom-plished in sufficient detail to supportmanagement at each level. Far-term, orrolling-wave, scheduling will be less pre-cise, accounting for the alternative pathsthat the program may take. As the pro-gram approaches each phase, the sched-ule for that phase will be fleshed out with
more detailed schedule information. Theschedule for the out-year phases will beadjusted based on the most current infor-mation. However, this should not be takenas a license to make easy changes in theschedule. Every effort should be made tomaintain the original schedule.
In all programs, there will always be arequirement to make tradeoffs betweencost, schedule, and performance. Cost in-cludes all resources—people, money,equipment and facilities. Performance in-cludes quality and supportability param-eters. The best schedule supports the besttradeoff between these competing de-mands, taking into account the risks thatare associated with each tradeoff and theimpact on the overall program.
The preparation of program schedulesshould be done within a formal structure.The procedures to be followed should bespecified, to include such things as soft-ware applications to be used, the formatsfor displays, and the type of symbols to beused. Also, clear lines of authority andresponsibility should be established. Theremainder of this section discusses the logi-cal steps that should be followed in pre-paring schedules, to include sources ofinformation, tools and techniques, and theoutputs of the steps. These steps are basedon those described in the Program Man-agement Institute’s Guide to the ProgramManagement Body of Knowledge.4 While theypresent a somewhat different approachthan the IMP/IMS method, they have ge-neric applicability over the range of plan-ning methods.
3.4.1 Activity Definition
This step involves the identification anddefinition of those activities that must be
13

accomplished to achieve the objectives.The WBS is a logical source for suchdescriptions. If a WBS is not available,more planning must be done in order toidentify project activities clearly. Otherinputs to the definition step are the pro-gram scope, historical information, pro-gram constraints and assumptions, andevents required by the Planning, Program-ming, and Budgeting System (PPBS), therequirements generation system, and DoDacquisition management process.
Decomposition and templates are tech-niques commonly used in activity defini-tion. Decomposition involves the succes-sive breakdown of program elements intosmaller, more manageable components,which eventually describe the activities tobe scheduled. This technique is essen-tially the same used in WBS development.A template is an activity list or WBS ele-ment from another similar program thatcan serve as a model for the current pro-gram and provide a starting point for de-fining specific activities.
The primary output of this step is the activ-ity list, which should contain a completedescription of each of the activities neces-sary to complete the program. This listshould be linked to the WBS, which shouldbe reviewed and revised/clarified as nec-essary to incorporate changes resultingfrom the activity definition process. Sup-porting details for each activity, such asconstraints and assumptions, should alsobe developed and documented.
3.4.2 Activity Sequencing
This step involves the accurate identifica-tion of constraints/relationships among ac-tivities and establishing the order in whichthe activities will be accomplished.
There are several inputs to this step:
• The activity list developed in the activ-ity definition step,
• The product description and character-istics,
• Mandatory constraints/dependencies,such as the fact that a prototype must befabricated before it can be tested,
• Discretionary constraints/depend-encies developed by the program manage-ment team based on “best practices” orspecific sequences desired by management,
• External dependencies, such as avail-ability of test sites, and
• Other constraints and assumptions.
A number of tools and techniques are use-ful in developing the logic diagrams thatreflect the desired activity sequencing.They include various network schedulingtechniques that are discussed in Chapters 4and 6. In addition, a number of schedulingsoftware programs develop activity se-quencing. Their selection and use are dis-cussed in Chapter 9.
The output of this step is a network dia-gram that reflects the sequence of activitiesbased on the inputs described above. Thisdiagram should be augmented with anarrative description of the sequencing ap-proach and a detailed discussion of anyunusual or complex sequences. Activitylists should be reviewed and revised toreflect any changes necessitated by activitysequencing.
3.4.3 Activity Duration EstimatingActivity duration estimating is the determi-
14

nation of the time required to complete theactivities that make up the program. Thisis one of the most difficult aspects of sched-ule development and should be performedby people who are most familiar with theactivity. Two key inputs to the estimationprocess are the resources required and as-signed for the activity and the capabilitiesof the resources assigned. Historical infor-mation from other programs and from com-mercial databases can also be helpful indeveloping accurate estimates.
The following techniques are commonlyused in estimating activity durations:
• Expert judgment guided by historicalinformation,
• Analogous estimating based on expe-rience of similar programs,
• Parametric estimating based on formu-las describing relationships among pro-gram parameters and time, and
• Use of simulation to develop distri-butions of probable duration of eachactivity.
The output of this step is an estimate of thelikely amount of time to complete eachactivity. These estimates should also in-clude a range of possible values, e.g., 3weeks ± 1 week, and a clear statement ofthe assumptions made in the estimationprocess.
3.4.4 Schedule Development
This step involves the development ofrealistic start and finish dates for eachactivity. An iterative process, scheduledevelopment takes into account activitysequencing, duration estimates, resource
requirements and availability, calendarsthat show when work can be performed,constraints, assumptions, and risk.
The output of this step is a set of sched-ules for the program. These include themaster program schedule and the support-ing detailed schedules, which should re-flect the best balance possible between com-peting demands of time and resources.They should also take into account the riskassociated with time, cost, and performancetradeoffs and the impact on the overallprogram.
A number of techniques and tools are usefulin developing schedules, many of which arecontained in various scheduling softwareapplications. Many of these applicationscontain the capability to perform varioustypes of mathematical analyses to calculatetheoretical start and finish dates for eachactivity based on the overall sequencing ofthe program activities. Two of the morecommonly known analysis techniques arecritical path method (CPM) and the Pro-gram Evaluation and Review Technique(PERT). They are discussed in greaterdetail in Chapter 6.
Other scheduling development techniquesthat are commonly used focus on scheduledevelopment in light of resource (time,people, funds, material) constraints. Thesetechniques provide the means to manage theaffect of these constraints through the com-pression of activity duration and the levelingof resources throughout activities. Schedulecompression and resource leveling are dis-cussed in more detail in Chapter 6.
3.4.5 Schedule Control
The final step in the schedule preparation
15

process is to identify schedule variations andto manage actual changes to the developedschedules. A schedule change control sys-tem that defines the procedures by whichchanges can be made should be establishedand integrated into the program’s overallchange control system. The schedulechange control system should address suchthings as the methods of schedule perfor-mance tracking and the approval processfor authorizing changes. The need for sched-ule changes can be caused by a number offactors, to include:
• Failure to achieve planned dates forspecific activities or events,
• Internal program management assess-ment and replanning, and
• External direction, such as reallocationof funding.
When evaluating these factors, it is im-portant to determine what, if any, sched-ule change is necessary. For example, ifan activity that is not on the critical path isnot completed as planned, it may not haveany effect on the overall program sched-ule. Consequently, it may not require anysignificant schedule change.
The schedule change control systemshould also include procedures for imple-menting schedule changes. Such proce-dures should address the requirement tokeep all program stakeholders, especiallythe users, advised of any significant sched-ule changes. They should also address theprocess for adjusting the schedule baselineand the overall program plan when neces-sary schedule changes are severe. Thechange control system can also serve as agood database of lessons learned. Conse-quently, information concerning sched-
ule variations, their evaluation, and thedevelopment of corrective actions shouldbe documented and made readily avail-able to members of the program’s man-agement team, and to other programs.
3.5 SCHEDULE RISK
In Chapter 2, we discussed the relation-ship between risk management and pro-gram scheduling. In this section, we dis-cuss the risk associated with the programschedule. Uncertainty exists in everyschedule. It is impossible to predict, withcomplete confidence, the length of timenecessary to complete an activity, meet amilestone, or deliver a system. Little in-formation exists in the early phases of aprogram, and planners must rely on per-sonal experience and the estimates of ex-perts. As a program progresses throughthe acquisition cycle, more informationbecomes available. Schedules developedin the latter phases of a program are basedon more information and analyses, butthey still lack complete certainty. Uncer-tainty introduces the element of risk in theplanning process. Schedule risk is thelikelihood of failing to meet schedule plansand the effect of that failure.
When creating a schedule, or when deter-mining overall program risk, the PM mustassess the risk associated with the sched-ule. One technique for assessing this sched-ule risk involves estimate contributionsfor each activity’s duration and aggregat-ing these distributions using a Monte Carlosimulation or other analytical tools. Theresulting program-level schedule is thenanalyzed to determine the actual sched-ule risk and to identify the schedule riskdrivers.
This technique uses a range of times that itwill take to complete each activity instead
16

17
of single-point estimates. This approachresults in a more realistic estimate of sched-ule risk because it accounts for much of theuncertainty inherent in the use of single-point estimates. Their use invariably leadsto underestimating the time required tocomplete the program and, therefore,schedule overruns, primarily because thepoint estimates do not adequately addressthe uncertainty inherent in the individualactivities.
This range of values for each activity de-fines a probability distribution for the du-ration of the activity. These distributionsare then combined to determine the pro-gram-level schedule estimate. This ap-proach enables PMs to estimate early in aprogram if there is a significant likelihoodof overrunning the program schedule andby how much. It also identifies programactivities that are on the “highest risk path.”
This technique can be used in any acqui-sition phase beginning with the comple-tion of the first statement of work. Theschedule probability distribution functionfor each key activity should be developedas soon as the activity is included in themaster schedule. The distribution func-tions should be periodically reviewed andrevised, if necessary, at least once per phase.
The technique should be applied by a smallgovernment-industry team consisting ofschedule analysts and technical expertswho understand the significance of previ-ous risk performance assessments. See theDSMC Risk Management Guidebook5 or theDefense Acquisition Deskbook, Section 2.5.2.46
for more details on the application of thistechnique.
3.6 SUMMARY
Scheduling is critical to the successful exe-cution of the planning and controllingfunctions of program management. In theplanning phase, it contributes to thedevelopment of detailed functional plans
and budgets and to identification and allo-cation of required resources throughoutprogram activities. During this phase isdeveloped a set of integrated multi-lay-ered schedules that tie together all pro-gram activities, showing their logical rela-tionships and any constraints. The level ofdetail developed for these schedules de-pends on program scope and risk. Thisprocess provides a hierarchy of functionaland layered schedules that can be useful inmonitoring and controlling programprogress.
Effective program control depends on someform of integrated cost, schedule, and tech-nical performance management, such asthe earned value management system(EVMS). Effective scheduling is key to thesuccess of this technique. EVMS criteria donot dictate the use of specific schedulingtechniques. However, they do seek for-mality, consistency, and disciplinethroughout the scheduling process.
A five-step process for schedule prepara-tion that is commonly used in program/project management includes:
• Activity definition,
• Activity sequencing,
• Activity duration estimation,
• Schedule development, and
• Schedule control.
Risk is inherent in all programs, and sched-uling is one element of risk. Uncertaintyintroduced in estimating the duration ofeach activity causes most schedule risk.PMs must assess the likelihood of failingto meet schedule plans and the impact ofthat failure. Probabilistic techniques haveproven to be very useful in conductingthese assessments.

1 Defense Systems Management College, Acquisition Strategy Guide, Fort Belvoir, VA, January 1998.2 Defense Systems Management College, Earned Value Management Textbook, Fort Belvoir, VA, April 16, 1998,3 Ibid.4 Program Management Institute, A Guide to the Program Management Body of Knowledge, Newtown Square, PA,
1996.5 Defense Systems Management College, Risk Management Guidebook, Fort Belvoir, VA, May 1999.6 Information on schedule risk techniques is in the Risk Assessment Techniques of the Front Line Wisdom
& Advice portion of Section 2.5.2.4, Defense Acquisition Deskbook.
ENDNOTES
18
Figure 3-3. Program Schedule/Structure (Example)
PROGRAM STRUCTURE/SCHEDULE (EXAMPLE) FY01 FY02 FY03 FY04 FY05 FY06 FY07 FY08 FY09 FY10 FY11 FY12 FY13 FY14
ContractAward
RDT&EProcurementO&MMILCONTotal
C&TDCAD
Sys Int Sys DemoSystem Devel & Demo
A DecRev
B
PrototypeCompetition
IPR
FRPC IOC
B FRP IOC
FRP IOCCB
SD LRIP PROD Blk IIPROD
Blk IIISD
Blk IIIPROD
C
MilestoneReviews& Phases
TechnicalReviews
Developmental& Operational
Testing
DeliveriesOT FOT&E
EDM
EOA
LRIP Production
LRIP Prod & Deployment Operations & Support
Block II
Block III
(eng dev models)
DT&E
IOT&E
Full-RateCE
LFT&E
C&TD SI
ASR SRR PDRSFR CDR FCA/SVR
PCA CDR PCA CDR PCA
Blk IISD

19
4SCHEDULE TYPES AND THEIR EVOLUTION
4.1 INTRODUCTION
Previous chapters of this guide stress thepoint that scheduling is an intrinsic, indis-pensable part of program management anda key output of the planning function ofthat process. They also describe the rela-tionship between the program Work Break-down Structure and scheduling, and intro-duce the concepts of the Integrated MasterPlan and the Integrated Master Schedule.Properly prepared and accurate schedulesare invaluable tools in the overall manage-ment of programs. They provide a roadmap of where the project is going, theresources required to accomplish the vari-ous project tasks, a means to determineprogress, and an effective way to presentstatus information. This chapter containsinformation on the various types of sched-ules generally in use today, their character-istics, advantages and disadvantages, andhow they have evolved. Subsequent chap-ters provide more detailed information oneach of the schedule types, along with in-formation on the selection and use ofscheduling software.
4.2 SCHEDULE TYPES
Schedules can be presented in a variety ofways. Regardless of how they are dis-played, schedules essentially convey in-formation concerning one (or a combina-tion) of the following categories:
• Activities or tasks to be accomplishedover a period of time, and
• Events or milestones, that take place ata point in time, such as a Defense Acquisi-tion Board (DAB) milestone review.
Dependencies or constraints among activi-ties or events.1
Currently, four types of schedules are incommon use and depict the categories ofinformation described above. They are theGantt or bar chart, the milestone schedule/chart, the network schedule, and the pro-duction schedule. The evolution, character-istics, and uses of each of these schedulesare described in the following paragraphs,and a more detailed treatment of each ofthem is contained in subsequent chapters.
4.2.1 Gantt and Milestone Charts
Gantt charts and milestone charts are nor-mally combined to show a program’sschedule; therefore, they are discussed inthis context. The Gantt chart is used toprovide information concerning activities.It is commonly referred to as a bar chart,since it depicts an activity as a horizontalbar imposed over a time-line, or calendar.It shows the planned start and finish datesfor the activity and may provide informa-tion about task progress, including sched-ule slips or gains. Figure 4-1 is an exampleof a simple Gantt chart that shows theplanned schedule for four activities.Progress in accomplishing each activitycan be shown on each of the bars, as shownby the shaded portions of activities 1 and 2.

Activity
Identify User Requirements
Identify Performance Requirements
Identify Interface Requirements
Prepare SW Requirements Spec
Jan Feb Mar Apr May Jun
Legend
PlannedActual
20
The Gantt chart was the first formal sched-uling technique developed. It dates backto the early 20th century when Henry L.Gantt first introduced it while working atthe Frankford Arsenal during World WarI. It was developed to provide a moreformal and systematic way to scheduletasks when time was an imprtant factor.
The Gantt chart has survived in its basicform to this day and continues to bewidely used as a scheduling tool at alllevels within organizations. Its valuelies in its simplicity and its ability toconvey considerable information in aclear and concise manner. In the past, theprincipal shortcoming of the traditionalGantt chart was its inability to clearlydepict dependencies or constraintsamong activities, making it difficult toanalyze schedules and optimize the allo-cation of resources to the activities. Somescheduling software programs now makeit possible to show relationships, thereby
improving its utility. The Gantt chart isvery useful in reporting project status andin managing individual activities or simpleprojects with few tasks.
Subsequent to the development of the Ganttchart, planners and managers used a simi-lar approach to depict information aboutsignificant project events, focusing on spe-cific points in time. These events repre-sented project milestones—hence the in-troduction of the milestone chart. The mile-stone chart shows when an event is sched-uled and when it is actually accomplished.Figure 4-2 is an example of a milestonechart showing the status of four events;each of these events represents the comple-tion of the four activities shown in theexample Gantt chart in Figure 4-1.
Like the Gantt chart, the strength of thismilestone chart as a scheduling techniquelies in its relative simplicity and its abilityto concisely display project information,
Figure 4-1. Gantt Chart Example
Now

21
especially at the “big picture” level. How-ever, it does have shortcomings that limitits effectiveness in day-to-day project man-agement. As shown in Figure 4-2, the mile-stone chart can depict the events corre-sponding to the completion of an activity.
However, it does not reflect the progress inaccomplishing the activity. In this case, amanager relying on this milestone chartinformation could be surprised if theplanned completion date is not achieved.With no warning or indicators of scheduleslippage, the manager loses any flexibilityin attacking the underlying problems caus-ing the slippage. This shortcoming can becompensated for by the addition of interme-diate events or through the use of combinedGantt and milestone charts. This is discussedin more detail in the next chapter.
Another weakness of the milestone chart isthe difficulty to clearly visualize therelationships, dependencies, and con-straints among the various project/pro-gram activities and events. In spite of theseshortcomings, the milestone chart can bean effective way of presenting the projector program status at higher levels of man-agement review.
Perhaps the biggest shortfall of the Ganttand milestone charts is that neither ofthem, nor the combination of both, allowdetailed schedule analysis. However,every PM must know and understandGantt and milestone charts for two simplereasons: everybody uses them, and nor-mally, one of the first steps in the planningprocess is to construct a schedule using aGantt chart.
4.2.2 Network Schedules
Network scheduling was developed toovercome the primary shortcoming of theGantt and milestone charts—the inabilityto clearly portray the relationships, depen-dencies, and constraints among the projectactivities and events. A network scheduleis a graphical display of a project, includ-ing a representation of these relationships.Figure 4-3 shows an example of a networkschedule for a simple project.
In this example, the lines represent projectactivities A through H; the nodes repre-sent the events associated with the begin-ning and end of the activities. The net-work shows the following constraints
Figure 4-2. Milestone Chart Example
Event
User Requirements Identified
Performance Requirements Identified
Interface Specs Identified
SW Requirements Spec Completed
Jan Feb Mar Apr May Jun
Legend
PlannedActual

among the activities: activity A must becompleted before activities B, C, or D canbegin; B must be completed before E canbegin; F cannot begin until D is completed;G cannot begin until C and E are done, andH cannot begin until F and G are com-pleted. In addition to showing this type ofsequencing constraints, network schedulescan also show the time and resourcesplanned for each activity and thus providemanagers with a mechanism to monitorand control the project. A later chaptercovers network schedules in detail.
The advent of network schedules can betraced back to the 1920s and the evolu-tion of operations research. Analysts re-alized the inability to depict dependen-cies and constraints was a major short-coming of existing scheduling techniques,and attempted to solve the problemthrough the application of network theory.The translation of this theory into a usablescheduling tool was hindered by the in-ability to process network-related datain a timely fashion. The development ofthe computer provided the means to au-tomate this data processing and, by the1950s, the concept of network scheduling
was being applied to large, complex pro-grams. The first major network schedul-ing technique developed was the Pro-gram Evaluation and Review Technique,or PERT, which was used as a manage-ment tool for scheduling and controllingthe Navy’s Polaris missile program. PERTenables managers to visualize the entireprogram, see interrelationships and de-pendencies, and recognize when andwhere delays are acceptable. One of thekey features of PERT is the use of prob-ability techniques to develop a set oftime estimates for each program activity,making it particularly well-suited for pro-grams where it is difficult to make accu-rate estimates with high confidence. Con-current with the development of PERT,the construction industry developed anetwork scheduling system based on theconcept of critical path. A project’s criti-cal path is the most time-consuming routethrough the network activities that mustbe completed in order to finish the project.This approach, named Critical Path Method(CPM), was designed to focus on perfor-mance time and total program cost. Somepublications refer to CPM as the ArrowDiagram Method (ADM).
Figure 4-3. Network Schedule Example
22
A
B
C
D
E
F
G H

PERT and CPM scheduling techniques havemany similarities. For example, each showsthe relationships among activities andevents, both include the project’s criticalpath, and the structure of each allows analy-sis of the tasks to be done, resources as-signed to do them, and the time associatedwith each task. Both techniques use nodesto represent events (beginning and end ofactivities) and lines to represent the activi-ties.
A third network scheduling technique is thePrecedence Diagram Method (PDM), whichwas developed subsequent to the PERT/CPM techniques. Its function is to permit amore accurate depiction of relationshipsamong various activities than is possibleusing the other two techniques. PERT/CPM techniques are essentially limited to“finish-start” relationships (i.e., activity Bcannot start until activity A is completed).The PDM technique can depict other rela-tionships that permit a more accurate andrealistic portrayal of the program’s activi-ties, such as “start-start” (i.e., activity B can-not start until activity A starts). The tech-nique accomplishes this through the use ofnodes to depict activities and lines to depictrelationships. These three techniques arediscussed in greater detail in Chapter 6.Network scheduling techniques providemanagers with a powerful tool for schedul-ing and controlling their programs/projects.In general, they permit the graphic por-trayal of project activities and relationshipsamong the activities. This provides thebasis for determining the project’s criticalpath, predicting shortages, and identifyingpossible reallocation of resources to solveproblems. Through the use of readily avail-able software, network schedules are fairlyeasy to update and rework, thus providingmanagers with current program/project sta-tus information and control over activitiesand schedules.
In spite of the strengths of network schedul-ing techniques, there are some limitations.The value of network schedules is directlydependent on the validity of the time esti-mates for each activity. In addition, it issometimes difficult to accurately portrayall activities and relationships, especiallyfor very large, complex programs. Thus,considerable “up front” work is requiredto develop an effective network schedule.Detailed networks, once developed, tendto be the focus of management attentionwhen, in fact, there will undoubtedly beother factors not on the display that willrequire management attention.
4.2.3 Production Schedules
Production scheduling involves the plan-ning, execution, and control of repetitiveactivities, such as the manufacture of alarge number of identical items. Efficientproduction requires the proper balance ofmaterials, facilities, and personnel skills.It also requires a means to monitor theproduction process.
The Line of Balance (LOB) technique, whilenot truly a scheduling tool, is such a moni-toring technique that can provide earlywarning of potential problems that canaffect program schedule. It is especiallyuseful for monitoring repetitive processeswhere it is essential to balance inventoryacquisition with the production processand delivery requirements. The LOB tech-nique consists of four elements: (1) objec-tives of the program, i.e., contract sched-ule and actual deliveries; (2) productionplan; (3) current program status or inven-tory; and (4) a comparison between wherethe program is and where it’s supposed tobe, (that is, program inventories versusthe LOB). These elements are discussedin more detail in Chapter 7.
23

The origin of LOB is not clear, but it isbelieved it was developed to help managedefense-related contracts in the 1940s and50s. It is still used today in both defense andcommercial industry. While governmentPMs or their staffs will probably not need todirectly develop or apply the LOB tech-nique, they should understand it and real-ize that it can be a valuable tool for contrac-tors to monitor the status of productioncontracts and to present status information.
This technique can point out problems be-fore their impact on finished product deliv-eries shows up, thereby allowing managersto make corrections. It also allows manag-ers to see, in the middle of a contract, whetherthey can meet the contract schedule if theycontinue working as they have been. An-other advantage of LOB is that it focusesattention on the production activities wherethere are problems, thereby facilitating ini-tiation of corrective action.
There are some limitations with the LOBtechnique. First, it is best suited for produc-tion and/or assembly-type processes thatare stable. The activities that make up theproduction plan must be definable and wellunderstood. Second, while this techniquepinpoints where a problem exists, it cannotidentify the specific problem.
4.3 SUMMARY
Each scheduling method has strengths andlimitations. Program Mangers must be fa-miliar with all of the techniques and choose
the method that allows them to meet theirgoals. The choice of schedule type dependson a number of factors, such as, the purposeof the schedule, its intended use, and thedecisions to be made from the informationpresented. For example, day-to-day man-agement of a project consisting of a numberof related and complex activities may re-quire a schedule that depicts the tasks, theirplanned duration, dependencies, progress,and resources allocated to each of them. If aPM must do detailed schedule analysis ofthis type of project, then the PM will mostlikely use a network schedule. This methodis the only way to use probability distribu-tions for time estimates rather than complet-ing an activity and project in a certain time.
On the other hand, the management of asingle activity may require a schedule thatreflects only the time planned for accom-plishing the task and the current status.Schedules showing only events, such as thecompletion dates of planned activities, orbar charts may be sufficient in those caseswhen the audience may not be concernedwith the details of the activities.
As a rule of thumb, Gantt and milestonecharts are useful to present information andsummarize program activities. They arealso usually the starting points for detailedplanning and creating a network schedule.Network schedules are usually created fordetailed planning and analyses. They arenecessary to determine the feasibility ofmeeting program goals, assessing risk, andconducting sensitivity analyses.
24
1Quentin W. Fleming, John W. Bronn, and Gary C. Humphries, Project and Production Scheduling, Chicago,IL, Probus Publishing Co., 1987, p. 45.
ENDNOTES

5GANTT AND MILESTONE CHARTS
25
Planned activity schedule
Status of activity
Forecasted completion behind schedule
Forecasted completion ahead of schedule
Symbol Meaning
Figure 5-1. Example Gantt Chart Symbols
5.1 DESCRIPTION
As discussed in Chapter 4, the Gantt chartis one of the oldest planning tools inexistence and is still used today at alllevels of project management. For ex-ample, PMs use Gantt charts to reportinformation concerning program activi-ties at milestone decision briefs, whileengineers may use them to manage thetasks associated with design activities.Because PMs often use Gantt and mile-stone charts to report information to re-view groups, they are treated jointly inthis chapter.
In its simplest form, a Gantt chart is aschedule that shows the start/stop datesof a program’s individual activities. Ituses symbols superimposed on a calen-dar to provide information about theoriginal plan, the status of the activity,and any forecasted changes to the plan.
There is no standard set of Gantt chart sym-bols. Planners should define them and con-sistently use them throughout the chart. Fig-ure 5-1 shows an example of the symbols thatcould be used in Gantt charts.
The schedule is displayed as a series ofhorizontal bars representing the duration ofactivities. A manager may show actualprogress against the schedule by shading ineach bar as activity progresses or may use acolored bar that is parallel to the schedulebar. Figure 5-2 shows a simple Gantt chartthat illustrates activities involved in devel-oping components of a weapons system.This type of display can be useful for convey-ing information about the program to thoseinvolved in its review or those charged withits day-to-day management.
From this example, we can see that as of lateMarch, the design, fabrication, and assemblyof the payload are ahead of schedule, [A].

Payload Design
Payload Fabrication
Payload Assembly
Test & Rework
Guidance & ControlDesign
Guidance & ControlFabrication
Guidance & ControlAssembly
Guidance & ControlTest & Rework
System Integration
System Test & Rework
Activity J F M A M J J A S O N D
[A]
[A] [B]
[A] [C]
[D] [E]
[E]
Figure 5-2. Example Gantt Chart
Based on this information, and an analysisof the activities, the PM has revised theplanned completion date for the payloadfabrication, [B]. In analyzing the currentstatus, the PM has determined that much ofthe work in payload assembly will have tobe done toward the end of the plannedactivity period. (In other words, the work isnot uniformly distributed throughout theperiod.) Thus, even though this activity isahead of schedule now, the PM has de-cided not to revise the planned completiondate for assembly and test, [C]. This Ganttchart also shows that development of the
guidance and control subsystem is not go-ing as well as planned. As of late-March,the fabrication is well behind schedule,[D]. After reviewing the progress and re-maining work, the PM has slipped theplanned completion dates for the fabrica-tion and assembly activities, [E]. They be-lieve that it is too early to revise the plannedcompletion dates for test and rework, andthe system integration and test activities.However, the slippage already experiencedshould serve as a warning that this entiredevelopment effort may be in trouble andwill require close monitoring.
26
Now

While the Gantt chart focuses on activitiesand their duration, the milestone chart fo-cuses on planned significant events sched-uled to occur at specific times in the pro-gram. Such events could be the initiationor completion of a particularly importantor critical activity, equipment deliveries,reviews, or approval dates. Like the Ganttchart, the milestone chart uses symbolsimposed on a calendar to provide informa-tion about planned and actual completiondates and any revisions to the milestoneschedule. There is no standard set of sym-bols for milestone charts. Figure 5-3 showsthe symbols prescribed for reporting mile-stone information within the Air ForceMaterial Command. Different schedulingsoftware will often use unique symbols.
The important thing is that the symbols beclearly defined and consistently applied.
Figure 5-4 shows an example milestonechart for the program described in the Ganttchart in Figure 5-2. Note that events dis-played correspond to the beginning ofsome activities and the completion of all ofthem. Other events displayed representimportant occurrences and key decisionpoints within each of the activities, e.g.,preliminary and critical design reviews,“make or buy” decision, etc. In this ex-ample, we see that as of late-March pay-load design has progressed on schedule,[A], and that planned completion date forfabrication has been revised ahead of theoriginal schedule, [B]. As discussed in the
Figure 5-3. Example Milestone Chart Symbols
27
Standard symbols have been adapted for Air Force milestoneschedules. The most common symbols used and their meanings areshown below.
Basic Symbol Meaning
Schedule Completion
Actual Completion
Previous Scheduled Completion—Still in Future
Previous Scheduled Completion—Date Passed
Representative Uses Meaning
Anticipated Slip—Rescheduled Completion
Actual Slip—Rescheduled Completion
Actual Slip—Actual Completion
Actual Completion Ahead of Schedule
Time Span Action
Continuous Action

28
J F M A M J J A S O N D
Payload DesignBegin Payload Design
Payload Preliminary Design Review (PDR)Payload Critical Design Review (CDR)
Complete Payload Design
Payload Fabrication
Make or Buy DecisionTooling Complete
Fabrication Complete
Assemble Payload
Begin AssemblyDelivery of Parts Complete
Assembly Complete
Payload Test & Rework
Test Plan CompleteTest Readiness Review
Test & Rework Complete
Guidance & Control Design
Begin G&C DesignG&C PDR
G&C CDR
Complete G&C Design
Fabricate G&CMake or Buy Decision
Tooling Complete
Fabrication Complete
Assemble G&CBegin AssemblyDelivery of Parts Complete
Assembly Complete
Test and ReworkTest Plan CompleteTest Readiness Review
Test & Rework Complete
Integrate Payload and G&C
Begin IntegrationComplete Integration
Test & Rework
Test Plan Complete
Test Readiness ReviewTest & Rework Complete
[A]
[B]
[C][D]
[D][D]
Figure 5-4. Example Milestone ChartNow

Figure 5-5. Example Combination Chart
29
J F M A M J J A S O N D
Payload Design
Payload Preliminary Design Review (PDR)Payload Critical Design Review (CDR)
Complete Payload Design
Payload Fabrication
Make or Buy Decision
Tooling CompleteFabrication Complete
Assemble Payload
Delivery of Parts Complete
Assembly Complete
Payload Test & Rework
Test Plan Complete
Test Readiness Review
Test & Rework Complete
Guidance & Control Design
G&C PDR
G&C CDRComplete G&C Design
Fabricate G&C
Make or Buy DecisionTooling Complete
Fabrication Complete
Assemble G&C
Delivery of Parts Complete
Assembly Complete
Test and Rework
Test Plan Complete
Test Readiness ReviewTest & Rework Complete
System Integration Payload and G&C
Complete Integration
System Test & Rework
Test Plan Complete
Test Readiness ReviewTest & Rework Complete

Figure 5-6. Gantt Chart with Amplifying Information
30
Jun ‘99 Jul ‘99
Activity Name Assign-ment 7 14 21 28 5 12 19 26 Budget Cost
Cost/Budget
RequirementsPlanning
Review existingsystems
Perform work flowanalysis
Model process
Identify userrequirements
Identifyperformancerequirement
Identify interfacerequirements
Prepare SWRequirements Spec
SoftwareRequirementsReview
Mary
James
Mary,James
Peter
Chris
James,Peter
All
All
$10,000
$10,000
$12,000
$15,000
$11,000
$15,000
$12,000
$10,000
$9,000
$12,000
$17,000
$9,500
$0
$0
100%
90%
100%
113%
86%
0%
0%
0%

31
As discussed in the Gantt chart example,there are problems in the fabrication of theguidance and control subsystem. One ofthe events selected as a milestone was thecompletion of the tooling necessary forfabrication. From the example, we see thatthis event experienced an actual slip ofapproximately one month, [C]; this, in turn,has caused the Program Manager to revisethe scheduled completion dates for fabri-cation, parts delivery, and assembly, [D].
Managers rarely use pure Gantt or mile-stone charts. Normally they integrate theinformation from these charts and displayit in a combination chart. Such a chart canbe useful in displaying the planned andactual duration of activities using the Ganttchart symbols and in monitoring theprogress for completing key events in theseactivities using the milestone symbols. Fig-ure 5-5 is a combination chart showing theactivities and events described in Figures5-2 and 5-4.
Whereas the simple Gantt, milestone, orcombination charts may be suitable forreporting program status, most managersneed additional information to plan, moni-tor, and control activities. New softwareapplications increase the utility of thesecharts by making it easy to add informa-tion, such as budget, cost, resources, etc.
Today’s programs use databases to storerelated schedule information and then al-low users to filter, sort, and display infor-mation in a variety of ways. They alsoallow users to tailor the software to theirneeds by adding customized informationto the database. Figure 5-6 shows how todisplay the relationship of one activity withanother by drawing lines between relatedactivities. The Budget column, in which themanager enters the budgeted cost for the
activity, is a standard feature of the par-ticular program used to create this Ganttchart.1 The Assignment, Cost, and Cost/Bud-get ratio columns are not standard featuresbut were added to the database to demon-strate how the charts may be customized tomeet individual needs. Note that the usermay create computation fields, such as thepercentage and totals fields shown in thefigure.
5.2 CONSTRUCTING GANTT ANDMILESTONE CHARTS
Gantt and milestone charts are relativelyeasy to construct when compared to thecomplexity of network charts. The firststep is to decide the level at which theproject is to be planned, tracked, and re-ported. This decision should consider suchthings as the needs of the entire projectteam, and the degree of risk associatedwith the various program activities. Mostlikely there will be a need to manage andtrack at a low level and report at a higherlevel. Current scheduling software has thecapability to handle activities at variousprogram levels allowing insight and man-agement at the lower levels and permittingroll up of information at higher levels forreporting purposes. To accomplish this,charts must be developed in a logical andconsistent manner.
The next step in constructing the charts isthe identification of activities and mile-stones to be displayed, tracked, and moni-tored. The WBS should be used as theprimary source for this identification. If aWBS is not available, or if it does not godown to the necessary level, additionalplanning must be done to clearly defineand identify activities to be managed,tracked, and reported. Other sources foridentifying activities and events include

32
the Acquisition Strategy, the AcquisitionProgram Baseline, the Risk ManagementPlan, and the Integrated Management Plan,and the Integrated Management Plan.
5.3 GANTT AND MILESTONECHART ADVANTAGES ANDDISADVANTAGES
Gantt and milestone (or combination) chartsprovide a simple, effective means topresent project information, and a way tomonitor and control smaller projects. Us-ing these charts as scheduling tools hasmany advantages, but also limitations thatshould be understood. These pros andcons are presented below. Evolving sched-uling software includes features that over-come some of the shortcomings to varyingdegrees.
5.3.1 Advantages
(1) Simple to prepare and update,
(2) Information portrayed in easily un-derstood format,
(3) Relatively inexpensive to prepareusing software tools,
(4) Relate activities and calendar dates,
(5) Easy to roll up information intosummary form,
(6) Useful first step for preparation ofmore complex type schedules
(7) Reliable estimates can be developedwhen the work is repetitive and when theproduct is easy to measure quantitatively.
5.3.2 Disadvantages
(1) Difficult to use for detailed sched-ule analysis
(2) Do not show the effects of late orearly activity starts
(3) Do not represent dependenciesamong activities as well as other schedul-ing methods
(4) Do not reflect the uncertainty in theplanned activity duration or event date
(5) Only as reliable as the estimates onwhich they are based; looking at the chartdoesn’t indicate which estimates are themost reliable
(6) Do not allow quick or easy explora-tion of the consequences of alternative ac-tions.
5.4 HOW AND WHEN GANTT ANDMILESTONE CHARTS AREEMPLOYED
Gantt and milestone charts are best usedfor displaying the planned activities andevents of a project and the progress inmeeting them. This makes them very use-ful for presenting schedule and programstatus information in a concise simple for-mat at such things as programor activityreviews.
Because of its simplicity and ease of inter-pretation, it is a particularly good tool forcommunicating to higher managementwhen information must be presentedquickly and efficiently. These charts may

also be sufficient for management and con-trol of simple projects. However, theyhave limited utility for managing morecomplex projects, since they do not easilycapture interrelationships among activi-ties and events or reflect the uncertaintyassociated with time and resource esti-mates. Generally, they do not provide thelevel of information necessary for the effec-tive monitoring and control of such projects.
5.5 SUMMARY
As scheduling tools, Gantt and milestonecharts provide a simple and effective meansfor displaying actual versus plannedprogress of a program and for showingschedule changes that have occurred. Themajor drawback of Gannt and milestonecharts is the limited degree fo detail anddependency information they can portray.However, recently developed softwarescheduling applications now make it pos-sible to show more of the relationshipsamong project activities and events.
33

1This figure is an adaptation of sample charts from Fast Track Schedule sample charts.
ENDNOTES
34

35
6.1 DESCRIPTION
Driven by the increase in project complex-ity, managers developed the need for betterschedule and control methods than thoseprovided by Gantt and milestone charts.The shortcomings of these charts gave rise tonetwork scheduling. Over time, differentapplications of network theory were devel-oped to address the needs of managers.Today, essentially three networking tech-niques are in use: the Program Evaluationand Review Technique (PERT); the CriticalPath Method (CPM) [these two techniquesare also known as Arrow Diagram Methods(ADM)] and the Precedence DiagramMethod (PDM). Each is discussed later inthis chapter.
All of these techniques provide the managerwith powerful tools to plan, analyze, moni-tor, and control the project and to managethe resources necessary to accomplish projecttasks. They can help the manager answerthe following questions:
• When is each activity or task of theprogram scheduled to begin and end?
• Which activities must be finished ontime to avoid missing the scheduled pro-gram completion date?
• Can resources be shifted to criticalparts of the program (those that must becompleted on time) from non-critical parts(those that can be delayed) without affect-
ing the overall scheduled completion datefor the program?
• Among program tasks, where shouldmanagement efforts be concentrated atany particular time?
Networks are a graphical portrayal of theactivities and events of a project. They showhow each activity relates to others in theproject, the sequence of activities, and theneed to perform some tasks before others.Figure 4-3 is an example of an ADM networkschedule. Networks also facilitate the deter-mination of the impact of early or late startsor finishes, provide information about theallocation of resources, and allow managersto do “what if” analyses. With this informa-tion, managers may view the status of theplan, analyze progress, and evaluate alter-natives.
To apply these networking techniques, thefollowing conditions must exist:
• All program activities must be clearlydefined, including identifiable start andcompletion points.
• A logic diagram showing the sequenceand interrelationships of activities must bedeveloped.
• The time to complete each activitymust be estimated as accurately as pos-sible.
6NETWORK SCHEDULING

36
Accomplishing these things may requireconsiderable effort and the involvement ofpeople familiar with the overall project andthose responsible for executing variousgroups of activities. This up-front effortprovides an understanding of project re-quirements and early identification of po-tential problem areas.
6.1.1 PERT
In 1958, the U.S. Navy introduced the con-cept of network scheduling techniques bydeveloping PERT as a management controlsystem for the development of the Polarismissile program. The focus of PERT was togive managers the means to plan and con-trol processes and activities so the projectcould be completed within the specified timeperiod. The Polaris program involved 250prime contractors, more than 9,000 subcon-tractors, and hundreds of thousands of tasks.
PERT was introduced as an event-oriented,probabilistic technique to increase a PM’scontrol in projects where time was the criti-cal factor and time estimates were difficultto make with confidence. The events used inthis technique represent the start and finishof the activities. PERT uses three time esti-mates for each activity: optimistic, pessi-mistic, and most likely. From these esti-mates, an expected time is calculated basedon a beta probability distribution for eachactivity. The developers of PERT chose thebeta probability distribution because it couldaccommodate nonsymmetrical situations.They assumed that the probability of anestimate being too optimistic would not beequal to the probability that the same esti-mate would be too pessimistic. That is, if
estimated times could be compared againstactual completion times in a number of cases,the variation would look like the curve inFigure 6-1.
The expected time, t is the weighted aver-age, or mean time, for an activity based onthe beta distribution and is determined fromthe following formula:
Using the expected times and other statisti-cal properties of the beta distribution foreach activity, it is possible to determine anexpected time for completion of the projectand the likelihood (probability) that this ex-pected completion time will be met. It is alsopossible to determine the critical path for theproject—the most time-consuming paththrough the network activities and events toproject completion. Any delay on this pathwill delay the completion of the project.
PERT is most useful when it is difficult toeither accurately estimate the time requiredfor project activities or to determine the per-centage of work accomplished within anactivity. The percentage of work accom-plished can be especially important whenanalyzing the adequacy of resources appliedto an activity. Projects best suited for PERTare one-of-a-kind complex programs thatinvolve new technology or processes andresearch and development.
Fllowing the success of the Polaris program,PERT became widely used throughout thesystems acquisition community, to includeattempts to combine it with cost data or
6
4 bma ++=t

37
other non-scheduling aspects of programmanagement. As a result, PERT became socumbersome that the cost of maintaining itfar outweighed the benefit. Consequently,the use of PERT declined and, by the 1970s,it was only occasionally employed in de-fense system programs. Over the last fewyears, it has again become relatively popu-lar, particularly in the private sector. Thisresurgence is due, in part, to the develop-ment of PERT software or other networkingsoftware programs that can be run on micro-computers.
In spite of misuses that have occurred inPERT applications, the technique can be avery useful tool because it enables the man-ager to visualize the entire program, seeinterrelationships and dependencies, andrecognize when delays are acceptable. Thus,
the manager is better able to assess problemsas the program evolves.
6.1.2 CPM
The CPM scheduling technique was intro-duced at approximately the same time asPERT. It was developed by J. E. Kelly ofRemington-Rand and M. R. Walker ofDuPont to aid in scheduling maintenanceshutdowns in chemical processing plants.Over the years, CPM has enjoyed more usethan any other network scheduling tech-nique. It is based on the concept of criticalpath and was designed to focus on the timeand resources, particularly cost, necessaryto complete the activities of a project.
Although CPM and PERT are conceptuallysimilar, some significant differences exist,
Figure 6-1. Beta Distribution with PERT Time Estimates
a m b
Most
Optimistic
Time
Most
Likely
Time
Most
Pessimistic
Time
Probability
of Meeting
Schedule

38
most as a result of the type of projects bestsuited for each technique. As discussedearlier, PERT is better to use when there ismuch uncertainty and when control overtime outweighs control over costs. PERThandles uncertainty of the time required tocomplete an activity by developing threeestimates and then computing an expectedtime using the beta distribution. CPM isbetter suited for well-defined projects andactivities with little uncertainty, where ac-curate time and resource estimates can bemade, and the percentage of completion ofan activity can be determined. In CPM,because of the greater certainty, a singletime estimate is used. This estimate is thetime planned for the activity under normalconditions; it approximates the most likelytime estimate in PERT. The normal costestimate is the cost associated with finishingthe program in the normal time. A secondtime and cost estimate, the crash estimate, isalso used in the CPM technique. The crashtime estimate is the time that will be re-quired to finish an activity if a special effortis made to reduce program time; crash costis the cost associated with performing theeffort on a crash basis so as to reduce the timeto completion. This is discussed in moredetail with a later example.
CPM is activity-oriented, concentrating onactivity start (early start, late start) and fin-ish times (early finish, late finish); whereasPERT is event-oriented, concentrating onearly event time and late event time. Thenetwork diagrams used for CPM and PERTare essentially the same (see Figure 4-3), asare the procedures for using them. As dis-cussed earlier, certain actions are essential toapplying network scheduling techniques.The activities/events composing the project,the relationships among them, and their timeestimates must be identified, and a networkdiagram developed. Once the diagram is
completed, the following procedures areapplied:
• Complete and annotate the cumula-tive time required to reach each node alongthe paths—This will indicate the earliesttime work can start on the next activity. Thefinal number will indicate total time requiredto complete a particular path.
• Identify the critical path—This is thesequence of events, or route, taking the long-est time to complete.
• Starting at the program completionnode on the right side of the diagram, beginworking backward and compute the latesttime an activity can start without delayingthe overall program—For example, if thetotal program takes 40 weeks and the finalactivity requires 5 weeks, this activity can-not begin later than week 35. For CPM, thedifference between the latest and earlieststart of an activity is the slack or float. Thecritical path contains no slack or float time.For PERT, the difference between the earli-est event time and the latest event time ateach event is the slack/float time.
The use of these procedures is illustrated ina later example.
6.1.3 PDM
PDM is an activity-oriented technique thatwas developed subsequent to PERT andCPM. The impetus behind this develop-ment was the need for greater flexibility indealing with relationships and constraintsbetween project activities.
PERT/CPM, or the arrow diagram method(ADM), essentially treats all relationships as“finish-to-start” constraints; that is, ActivityA must be completed before Activity B can

39
begin. There are ways within PERT/CPM tocircumvent this limitation, but they are cum-bersome and add more complexity to thetechnique.
The PDM technique provides the capabilityto treat other types of relationships that oc-cur in complex projects. Figure 6-2 showsexamples of these types of relationships orconstraints.
In addition to depicting different rela-tionships between activities, PDM alsohandles time lags that would normally oc-cur as the project progresses. Examples of
such lags are the time required for the move-ment of parts or components from one activ-ity site to another, or the time involved inthe reallocation of resources—people, equip-ment, and facilities. Figure 6-3 shows ex-amples of constraint lags and how they canbe depicted. These lags could be repre-sented as activities in the ADM technique,but this could add needless complexity tothe schedule. The use of lags in the PDMtechnique is much less complicated.
PDM uses the same underlying principles asthe other networking techniques: clearlydefined activities, accurate time estimates,
Figure 6-2. Example PDM Relationships/Constraints
Finish-to-Start
B cannot start until A is finished—
normal PERT/CPM constraint
Finish-to-Finish
B cannot finish until A is finishedA
B
A
B
A
B
70%40%
Symbols Constraint
Start-to-Start
B cannot start until A starts
Start-to-Finish
B cannot finish until A is started
(Rarely used)
Percent Complete
Remaining 40% of B cannot be
started until 70% of A is completed
BA
A
B

40
critical path, etc. The difference betweenPERT/CPM (ADM) and PDM is in the waythe network is portrayed. In PERT/CPM,the network nodes represent the events as-sociated with activities (i.e., the beginningand end of activities), and the connectinglines represent the activities and the rela-tionship/constraints. Activity time and re-source estimates are normally shown on the
lines. In PDM, the nodes represent theestimates, early and late start and finishdates, and other appropriate informationare normally shown in the boxes. Figure 6-4 is an example of an activity node. The linesconnecting the nodes represent the relation-ships between the activities, e.g., finish-to-start, start-to-start, etc. The use of PDM isdemonstrated in a later example.
Figure 6-3. Example PDM Constraints with Lag Time
Resource
Requirements
Duration
3 Days
Early Start Time
7/12/99
Early Finish Time
7/15/99
Late Start Time
7/14/99
Late Finish Time
7/17/99
Activity Identification
Information
Finish-to-Start with Lag
B cannot start until 5 days after A
is completed
Start-to-Start with Lag
B cannot start until 7
days after A has started
BA
A
B
Symbols Constraint
Finish-to-Start with Negative Lag
B cannot start until 5 days before A
is completedBA
Lag + 7 days
Lag - 5 days
Lag + 5 days
Figure 6-4. Example PDM Activity Node

41
• Show resources associated with ac-tivities and time.
6.2.2 DISADVANTAGES
• Network construction can be diffi-cult and time consuming.
• Only as sound as the activity timeand resource estimates.
• Sometimes difficult to portraygraphically—too many lines, nodes andintersections.
• Not particularly good for conveyinginformation in briefings/reviews.
• Complex networks, once sketched outon a large wall chart, tend to become thefocus of management attention when, infact, a manager should be paying attentionto factors not on the chart, such as manage-ment/labor relations.
6.3 HOW AND WHEN NETWORKSCHEDULES ARE EMPLOYED
Network scheduling techniques can be veryuseful in complex projects that involve newtechnologies or processes and that are notrepetitive, such as production. They are notparticularly easy to use for presentationsbecause of their complexity; however, theycan be used as the basis for other schedulingtechniques that are more suitable for presen-tation of information, i.e., Gantt or mile-stone charts.
Government managers may not use net-work techniques in the day-to-day manage-ment of their programs. However, theyshould have an understanding of the tech-niques to ensure that contractors are usingthem when appropriate.
6.2 NETWORK SCHEDULINGADVANTAGES ANDDISADVANTAGES
Network scheduling techniques provide themechanisms necessary to conduct a system-atic, disciplined, and thorough review ofwhat will be required to conduct and com-plete a project. Such an approach is essentialfor large, complex projects and is also usefulin managing smaller, less complicatedprojects. The advantages and disadvantagesof these techniques are identified below.
6.2.1 ADVANTAGES
• Provide graphical portrayal of pro-ject activities and relationships/con-straints
• Force communications among teammembers in identifying activities
• Organize what would otherwise beconfusing material, making it easier for man-agers to make tradeoffs and develop alter-native plans
• Provide capabilities to evaluateprogress and control project
• Allow managers to predict shortagesand act on them early
• Once prepared, permit easy updateand rework
• Give managers more control overactivities/events and schedules
• Facilitate “what if” exercises
• Provide the basis for Gantt andmilestone chart information

42
The different types of network schedulingtechniques have many similarities. How-ever, each of them provides different typesof information that can be useful to manag-ers in evaluating progress, developingalternatives, and managing the allocation ofresources within their projects. The follow-ing examples show the types of informationresulting from each technique and how man-agers may use them.
6.3.1 PERT EXAMPLE
Figure 6-5 shows a PERT network for aproject containing 8 activities (A-H), withthe nodes 1-7 representing the beginningand end of the activities. The three timeestimates discussed earlier in this chapterare shown for each activity. For example, forActivity A, the time estimates are optimistictime=1 week, most likely time=2 weeks, andpessimistic time=3 weeks. The expectedtime estimate for each activity, t, as derivedfrom the formula associated with Figure 6-1,is also shown. From this information, theproject critical path can be computed byadding the time estimates along all pathsleading to project completion. In this ex-ample, the critical path is determined asfollows:
Path A-B-E-H=2+3+2+4=11 weeks
Path A-C-F-H=2+4+3+4=13 weeks
Path A-D-G-H=2+8+9+4=23 weeks
Thus, path A-D-G-H is the critical pathsince it requires the greatest time. Anydelay along this path will cause a delay inproject completion. The other paths areshorter completion. The other paths areshorter than the critical path and, therefore,contain activities that can be completed be-fore they are required. Therefore, delaysalong these paths may not result in delays inproject completion. In the above example,critical path activities, D and G, will require17 weeks to complete. On path A-B-E-H,activities B and E will require 5 weeks tocomplete. Thus, there will be 12 weeks ofslack along that path. Actually, this slack isonly along path B, E since A and H are on thecritical path. Likewise path C-F has 10 weeksof slack time. This concept of slack time,sometimes called float time or path slack/float, is important because it allows manag-ers to reschedule activities not on the criticalpath to use resources efficiently.
1
3
A
B
C
D
E
F
G
H2 6
5
4 7(1, 2, 3)
t=2
(2, 3, 4)
t=3
(2, 3, 4)
t=3
(1, 2, 3)
t=2
(3, 4, 5)
t=4
(3, 4, 5)
t=4
(8, 9, 10)
t=9
(7, 8, 9)
t=8
Figure 6-5. PERT Example

43
Figure 6-6. PERT Example with Slack Time
The following description of how slack timeis computed is intended to illustrate theconcept that managers can use it to theiradvantage. Fortunately, software programscompute slack time and managers do nothave to make these calculations.
Slack time should be computed for eachactivity in the network. One way of doingthis is by comparing the earliest time anactivity can begin, TE, to the latest time theactivity can begin, TL. The difference is theactivity slack time. For all activities on thecritical path, TE and TL have the same value.To determine the values of TE and TL for eachactivity, start with the node representing thebeginning of the first activity and assign it avalue of TE=TL=0. Follow the critical pathand add the activity time estimate to thevalue of TE of the preceding node to get thevalue of TE for the next node. For example,the node at the completion of Activity A andthe beginning of Activity D has a value ofTE=TL=2. Figure 6-6 shows how TE and TLcan be depicted on a network chart. Con-tinue along the critical path to node 7, whichhas a value of TE=TL=23, the time required tocomplete the project. Next, compute thevalues for TE for the remaining activities andnodes not on the critical path. The value of
TE for node 3 is the value of TE from node 2(TE=2) plus the duration of Activity B; fornode 3, TE=5.
To determine the latest starting times foreach activity, begin at the completion of theproject and work backward through the ac-tivities. Since Activity H is on the criticalpath, its value of TL=19. Activity E is not onthe critical path so its value of TL (shown onnode 3) is the difference between TL at node6 and the time estimate for Activity E, TL=19-2=17. The activity slack is the differencebetween TE and TL at each node. For ActivityE, the slack is TL-TE=17-5=12 weeks. Thisactivity could start anytime between weeks5 and 17 without any adverse impact on thecritical path. Activity B is not on the criticalpath so its value of TL is the difference be-tween TL at node 3 and the time estimate forActivity B (17-3=14). This is not shown atnode 2, since that node also represents thestart of Activity D, which is on the criticalpath. The slack for Activity B is TL-TE=14-2=12. (The same approach is used to deter-mine the slack for Activity C.) Slack is notadditive along a path; it must be shared byall activities on the path. Thus, if Activity Bstarts at week 5 instead of week 2, Activity Ewould have only 9 weeks of slack available.
1
3
A
B
C
D
E
F
G
H2 6
5
4 7(1, 2, 3)
t=2
(2, 3, 4)
t=3
(2, 3, 4)
t=3
(1, 2, 3)
t=2
(3, 4, 5)
t=4
(3, 4, 5)
t=4
(8, 9, 10)
t=9
(7, 8, 9)
t=8
TE=0
TL=0
TE=5
TL=17
TE=2
TL=2
TE=6
TL=16
TE=10
TL=10
TE=19
TL=19
TE=23
TL=23

44
Similarly, Activities C and F have a slack of10 weeks.
The concept of slack and TE and TL can bevery useful to managers, providing the basisfor resource allocation and also providingthe means to determine the probability ofmeeting the project schedule. This lattertopic is beyond the intended scope of thisguidebook; however, a number of availablebooks provide detailed discussion of theapplication of PERT techniques. (See thebibliography in Appendix D.)
6.3.2 CPM EXAMPLE
As discussed earlier, PERT and CPM areconceptually similar, in that both techniquesuse the same type of network structure, andthe concepts of critical path and slack time.The following example will be used to illus-trate basic application of the CPM technique.Figure 6-7 shows the same project as used inthe PERT example, with the single time esti-mates for each activity. Table 6-1 shows the
time and crash estimates for each of theactivities.
The critical path for the CPM approach isdetermined in the same way as in the PERTexample. While the concept of slack timeis essentially the same as in PERT, it is nor-mally calculated in a different manner usingfour different values for each activity:
••••• Earliest time the activity can start, ES
••••• Earliest time the activity can finish, EF
••••• Latest time an activity can start, LS
••••• Latest time an activity can finish, LF.
To compute ES, start at the first activity andmove forward through the network paths.The earliest Activity A can start is at t=0.The earliest that it can finish is ES plus theactivity duration; thus for A, ES=0 and EF=2.The earliest start for subsequent activities isthe EF of the preceding activity. For Activity
Figure 6-7 CPM Examples
1
3
2 6
5
4 7A (ES=0, EF=2)
2 (LS=0, LF=2)
B(2, 5)
3 (14, 17)
F (6, 9)
3 (16, 19)
E(5, 7)
2 (17, 19)
C (2, 6)
4 (12, 16)
H (19, 23)
4 (19, 23)
G(10, 19)
9 (10, 19)D
(2, 10)8 (2, 10)

45
B, ES=2. The earliest finish time for eachactivity is the earliest start time plus the activ-ity duration. For Activity B this is EF=2+3=5.When activities converge, such as E, F, and Gat node 6, the earliest starting time for the nextactivity is the latest value of EF of the preced-ing converging activities.
To compute the latest times, make a back-ward pass through the network, beginningwith the last activity. The date to begin thepass can be either an established requireddate or the early finish date for the projectcompletion. The latest starting date for thefinal activity is determined by subtracting theactivity duration from the date used to beginthe pass. For subsequent activities, the latestfinish date is the same as the latest startingdate for the preceding activity. In the back-ward pass, the value of LF for an activity thatprecedes a set of diverging activities in thenetwork (activity A in the example) is theearliest of the values of LS of the divergingactivities (B, C, D).
The values of ES, EF, LS, and LF for all activi-ties are shown in Figure 6-7. With this infor-mation, one can determine the slack for eachactivity. Slack is determined using the fol-lowing formula: Slack=LF-EF=LS-ES.
The relative certainty of time and resourceestimates enables managers to determine thepercent of work completed in each activity asthe project progresses. Being able to estimatethe percent of completion provides manag-ers with the means to redistribute resources ifan activity is falling behind schedule. Forexample, if an activity has fallen behind sched-ule, it is possible to estimate the work remain-ing and the cost of applying additional re-sources to complete the activity on schedule.Network scheduling techniques, particularlyCPM, used on projects with relatively cer-tain time and cost estimates can provide
managers with information to effectivelymanage their projects. Using percent ofwork completed or that is remaining onongoing activities, they can compare theprogress at a certain time with the originalplan. Based on this information, they candevelop revised time and cost estimates forthese activities and forecast new start andcompletion dates for remaining activitiesand a new project completion date. Theycan then use the new forecast dates to deter-mine action that can be taken and the appro-priate resource planning and reallocation, ifnecessary.
The CPM technique provides managers withthe means to investigate ways and impactsof speeding up, or crashing, the schedule.As part of the planning process, a set of crashestimates should be developed if possible.The estimates for this example are shown inTable 6-1.
This table shows the time and cost estimatesand the crash cost per week. To crash aschedule, some key points must be consid-ered:
••••• Crash only along the critical path.
• When an activity is shortened, one ormore new critical paths may emerge.
• Parallel critical paths increase riskdramatically.
• Generally, least additional cost is thecriterion used to select which activity tocrash, but other considerations (e.g., per-sonnel hours) could be used.
In this example, assume that the project mustbe crashed by 4 weeks at the least additionalcost. Looking at the activities on the criticalpath, select the one with the lowest weekly

46
crash cost; in this case it is Activity D, whichcan be crashed from 8 to 6 weeks for anadditional $6,000. Next, crash Activity G by2 weeks at a cost of $10,000. Reducing bothof these activities does not change the criti-cal path.
6.3.3 PDM EXAMPLE
The PDM technique focuses on programactivities and the meaning of the constraintsamong activities. This technique is used inmany scheduling software applications, andit relies on the same concepts—critical path,slack time, etc., as the other network sched-uling techniques.
Figure 6-8 shows a PDM network for a projectwith Activities A–I. (Assume that the unit ofworking time (duration) is one week.) Notethat Activity B cannot start until Activity Astarts, and Activity D cannot end until Ac-tivity C ends. The critical path is determinedin essentially the same way as in other net-works. In PDM, however, one must accountfor the different types of constraints. In thisexample, Activities B (duration=4) and D
(duration=2) will require 6 weeks to com-plete. However, Activity D can not be com-pleted until Activity C is finished, which is 9weeks (5 weeks for Activity A and 4 weeksfor C). The difference between the 9 and 6weeks (i.e. 3 weeks) must be added to thetime to complete Activity D when determin-ing the critical path. This is shown below inthe parenthetical term for Path B-D-G-I. Thecritical path for this example is determinedas follows:
Path A – C – F – I = 5 + 4 + 5 + 3 = 17 weeks
Path B–D–G–I = 4+(2+3)+2+3 = 14 weeks
Path B–E–H–I = 4+5+2+3 = 14 weeks
Thus, Path A-C-F-I is the critical path.
The slack times for the activities are deter-mined in the same way as in the CPM tech-nique, using earliest and latest start andfinish times, ES, EF, LS, LF. Earliest times arecomputed by making a forward pass throughthe networks paths, and latest times aredetermined making a backward pass. Fig-
T a b l e 6 . 1 " C r a s h i n g " t h e N e t w o r k
A
B
C
D
E
F
G
H
2
3
4
8
2
3
9
4
3 5
Y e s
N o
N o
Y e s
N o
N o
Y e s
Y e s
$ 4 , 0 0 0
$ 2 , 0 0 0
$ 3 , 0 0 0
$ 5 , 0 0 0
$ 1 , 5 0 0
$ 2 , 5 0 0
$ 2 0 , 0 0 0
$ 8 , 5 0 0
$ 6 , 0 0 0
$ 6 0 0
$ 4 0 0
$ 3 , 0 0 0
$ 7 0 0
$ 6 5 0
$ 5 , 0 0 0
$ 6 , 0 0 0
2
3
2
6
2
3
7
3
1 s t( - 2 d a y s x$ 3 , 0 0 0 p e r d a y )= $ 6 , 0 0 0
2 d ( - 2 d a y s x$ 5 , 0 0 0 p e r d a y )= $ 1 0 , 0 0 0
N o t e : E x a m p l e s a m e a s F i g u r e 6 - 7
T i m eP e r
A c t i v i t y( w k s )
A c t i v i t yN u m b e r
C r i t i c a lP a t h
C o s t ( $ )P e r
A c t i v i t y / w k
C r a s hE s t i m a t e s
( A c c e l e r a t e da d d ' l
c o s t / w e e k )
M i nt i m e r e q d
p e r A c t i v i t y C r a s h
P r i o r i t y

47
ure 6-9 shows the PDM network with thesevalues, using the activity format shown inFigure 6-4. The values of ES, EF, LS, and LFin Figure 6-9 represent the beginning of theunit of work time, in this case a week; e.g., ESfor Activity A is the beginning of week 1,while EF is the beginning of week 6. (Thebeginning of week 6 corresponds to the endof week 5.) The earliest and latest finishdates for this project , Activity I, is the begin-ning of week 18, or the end of week 17. Usingthe formula for slack,
Slack = LS – ES = LF – EF,
we see that on path B – D – G – I, activities B,D, and G each have a slack of 3 weeks. Thisslack is not additive; if Activity D starts atweek 9 vice week 8, then Activity G has only2 weeks of slack remaining. We also see thatActivities B, E, and H have 3 weeks of slack
Figure 6-8. PDM Example
A
5
B
4
C
4
F
5
D
2
G
2
I
3
E
5
H
2
on their path. If Activity B uses 3 weeks ofslack, none will be left for either path.
The above example assumes that progress-ing from one activity to the next requireszero time, which in most projects is unreal-istic. The concept of lag time can be used toincorporate the time required to transitionfrom one activity to another, such as ma-chine set-up time or movement of material,parts, or components from one site to an-other. Lag time can be shown on the net-work and must be accounted for in deter-mining critical path and values of ES, EF, LSand LF. Figure 6-10 shows that in movingfrom Activity D to Activity G, there will be alag of 1 week. The figure also shows theeffect of this lag time on the earliest andlatest start times and on finish times. Theresulting slack for Activities D and G is now2 weeks. This example shows that the PDM

48
Figure 6-9. PDM Example—Early and Late Start and Finish Times
Figure 6-10. PDM Example with Lag Time
A
5
B
4
C
4
F
5
D
2
G
2
I
3
E
5
H
2
1 6 6 10 10 15
1 6
1 5
6 10
4 8
8 10
11 13
5 10
8 13 13 15
10 12
13 15
10 12
10 15
15 18
15 18Duration
LS LF
ES EF
Legend
A
5
B
4
C
4
F
5
D
2
G
2
I
3
E
5
H
2
1 6 6 10 10 15
1 6
1 5
6 10
4 8
8 10
10 12
5 10
8 13 13 15
10 12
13 15
11 13
10 15
15 18
15 18Duration
LS LF
ES EF
Legend
LAG+1
FOOTNOTESNote: The numbering convention used in this PDM network is similar to the CPM network in Figure 6-7; it isdescribed on page 46. Each computer scheduling program uses one (or gives a choice) of methods to relateduration to the time unit.

49
technique provides considerably greater flex-ibility in handling different types of con-straints than does ADM (PERT and CPM).Consequently, it is better suited for use incomplex projects, particularly those withmany parallel activities and constraints otherthan finish-to-start.
6.4 NETWORK SCHEDULING WHENRESOURCES ARE LIMITED
In the previous discussion, the assumptionwas that a new activity could start as soon asany constraints were satisfied because suffi-cient resources were available to performthe work. In practice, however, resources toproceed are not always available.
In those situations, Program Managers cantake one or more different actions to reducethe adverse impact on the program. Thoseactions include:
• Adding additional resources
• Reducing the scope of the program
• Adjusting the schedule to accommo-date the resource shortfall
In this section, we show how network sched-ules and the concepts of critical path andslack (float) can be applied to make betteruse of limited resources. Figure 6-11 showsa PDM network with activities A through J.Each node of the network shows the numberof people required to complete the activityalong with the activity duration (in weeks)
and earliest and latest start and finish times,represented as the beginning of the unit ofwork time (week).
To determine the adequacy of resources(people in this example), assume that eachactivity will start as early as possible anddetermine the resource requirements overtime. Figure 6-12 shows the personnel load-ing requirements by time for the duration ofthe program. During week one, 11 peopleare required to work on activities A, B, andC. Now, let’s suppose only nine peopleare available to work during this 11 weekperiod. The chart shows there will not besufficient workers during the first, fourth,and fifth weeks. There will be sufficientworkers to perform the workscheduledduring the second and sixth week.During the third and seventh throughouteleventh weeks, there will be a surplus ofworkers for the work scheduled. The taskbecomes one of rearranging the schedule sothat, insofar as possible, the peaks and val-leys are evened out without scheduling morework than nine people can do. In this ex-ample, this rearrangement can be accom-plished quickly by hand. However, withmany activities, it becomes very difficult tofind the optimum answer. Fortunately,scheduling software applications are avail-able to assist in solving the problem. Re-gardless of the approach used (manual orautomated), the resource-leveling process isan iterative step-by-step process using a setof rules to establish the priority of the activi-ties requiring the constrained resource, andthe actions to be taken.
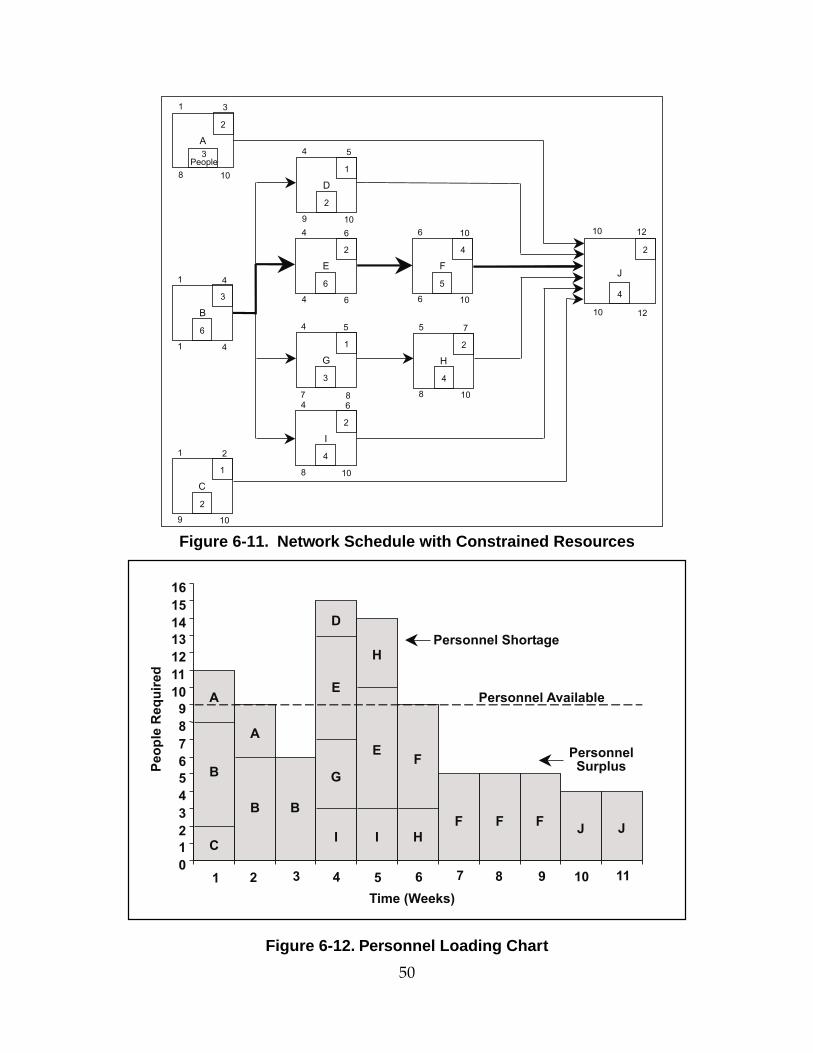
50
Figure 6-12. Personnel Loading Chart
Figure 6-11. Network Schedule with Constrained Resources
0
1
2
3
4
5
6
7
8
9
10
11
12
13
14
15
16
Time (Weeks)
Peo
ple
Req
uir
ed
1 2 3 4 5 6 7 8 109 11
A
B
C
A
B B
D
E
G
I I
H
EF
H
F F FJ
Personnel Shortage
Personnel Available
PersonnelSurplus
J
A
2
1 3
8 10
C
1
1 2
9 10
B
3
1 4
1 4
D
1
4 5
9 10
I
2
4 6
8 10
F
4
6 10
6 10
G
1
7 8
4 5
E
2
4 6
4 6
J
10 12
10 12
3People
2
6
3
4
5
H
2
8 10
5 7
4
6
2
2
4
51
As discussed earlier, the concept of float (orslack) can be useful in the efficient allocationof resources, and it should be considered inestablishing the rules to be followed. Thefloat demonstrated in earlier examples iscommonly called path float. Another typeof float that is particularly useful in resourceallocation is free float. Free float is the slackthat a single activity can experience withoutaffecting any other activity.1 The free float ofa given activity is defined as the differencebetween earliest start of the succeeding ac-tivity and earliest finish of the given activity.In our example, the free float for Activity Dis FF(D)=ES(J)-EF(D)10-5=5.In this example, the approach is to findactivities having the most free float and tryto delay them as long as possible withoutdelaying the entire program. By delayingthe start of Activity C for 2 weeks (to thebeginning of week 3), Activities A and B canbegin simultaneously without exceeding thelimit of nine workers. Similarly, ActivitiesD, H, and I can be delayed, resulting in therevised personnel loading chart shown inFigure 6-13.
Figure 6-14 shows the revised schedule us-ing lag times to reflect the delays. Note thatActivity A has a start-start relationship withActivity B. The “Lag 0” constraint indicatesthat A should start when B starts. Any delayin starting Activity A will result in a person-
nel shortage as the project progresses. It maynot always be possible to rearrange the sched-ule to stay within the resource constraints.In those cases, other steps, such as addingmore resources or extending the schedule,will have to be taken to minimize the ad-verse impact on the program.
6.5 SUMMARY
Network scheduling techniques (PERT,CPM, and PDM) are much alike in provid-ing such things as interdependencies, depthof detail, a critical path, and slack. Thechoice among these three techniques de-pends primarily on the type of program andmanagerial objectives. The PERT method isparticularly useful if there is considerableuncertainty in program activity times and ifcontrol of the program schedule outweighsother factors. On the other hand, CPM ismore appropriate when activity times canbe adjusted readily and when it is importantto plan an appropriate tradeoff between pro-gram time and cost. The PDM technique isbest suited for complex projects with differ-ent types of relationships/constraints be-tween activities. In reality, the proliferationof scheduling software has blurred many ofthe differences among network schedulingtechniques as well as Gantt and milestonetechniques.

52
6-14. Revised Network Schedule with Constrained Resources
Figure 6-13. Revised Personnel Loading Chart
0
1
2
3
4
5
6
7
8
9
10
11
12
13
14
15
16
Time (Weeks)
Peo
ple
Req
uir
ed
1 2 3 4 5 6 7 8 109 11
A
B
CA
B B
DG
E E
IH
F F F F J
H I
J
A
2
1 3
8 10
C
1
3 4
9 10
B
3
1 4
1 4
D
1
5 6
9 10
I
2
8 10
8 10
F
4
6 10
6 10
G
1
6 7
4 5
E
2
4 6
4 6
J
10 12
10 12
3People
2
6
3
4
5
H
2
8 10
6 8
4
6
2
2
4
Lag+1
Lag+4
Lag+1
Lag+2
Lag 0

53
1 Fleming, Bonn, and Humphreys, Project and Production Scheduling, Probus Publishing Co.,
Chicago, IL, 1987, Chapter 8.
ENDNOTES

53
7PRODUCTION SCHEDULING
7.1 DESCRIPTION
The scheduling techniques discussed inthe previous chapters are best suited forone-time development projects. Produc-tion scheduling, as its name implies, fo-cuses on the planning, execution, and con-trol of repetitive activities, such as thoseinvolved in the manufacture of several iden-tical items using the same processes. Theobjective of production scheduling is tobalance the materials required to producethe items with the production process andthe delivery schedule. Such scheduling isessential to the efficient use of all resourcesand facilities involved in the manufactur-ing process.
While the principles of planning and sched-uling are essentially the same for both situa-tions, there are differences that should beconsidered. For example, in the develop-ment phase, planning and schedulingshould reflect the uncertainty inherent indevelopment of the product and processesused. Consequently, planning and sched-uling should permit sufficient flexibility toallow for redesign and retest when inevi-table problems arise. In production, thereis less uncertainty; the design is relativelystable and the processes to be used arefairly well-defined. In general, more de-finitive constraints exist in productionscheduling, such as quantities to be pro-duced, required delivery dates, and ca-pabilities and availability of productionassets.
Production planning and schedulingshould be very detailed. A top-level projectschedule should serve as the productionbaseline. It should reflect the integration ofactivities that different organizations in-volved in the production process conduct—tooling, material procurement, etc. Lowertier schedules should be developed foreach of the manufacturing activities, withspecial attention to those having potentialimpact on the delivery schedule, e.g., ma-terial procurement; tool design, fabrica-tion, and prove-out; test equipment prove-out; and capital equipment procurement.Thorough planning and integration of allproduction process activities are essentialto manage risk in the manufacturing ap-proach. This also provides assurance thatnecessary resources will be available whenneeded, that no resources will be over-loaded or completely expended duringexecution of any manufacturing task, andthat product delivery dates are achievable.
An understanding of the production pro-cesses, to include such things as the se-quence of operations, make or buy deci-sions, inspection methods, tooling, etc., iscritical to effective production planningand scheduling. The planning and sched-uling of all activities must be fully inte-grated and reflect a synchronized flow ofevents that result in product or processcompletion when required. The produc-tion schedule describing and integratingsuch things as the acquisition of requiredmaterials, fabrication flow, process times,

54
plant facilities to be used, and personnelskills required should be developed asearly as possible in the development pro-cess and included in the manufacturingplan.
Once the planning and scheduling are com-plete and production begins, managersneed the means to monitor progress and toidentify problem areas in the process thatcould adversely affect the delivery sched-ule. A technique that is commonly used forthis purpose is the Line of Balance (LOB)technique. It graphically portrays the keyactivities of the production plan relative toa required delivery schedule and providesa view of the progress being made in eachactivity. This enables managers to focustheir attention on specific problem areas inthe process.
Government PMs, except those associatedwith an activity that builds or re-buildsequipment, will never be responsible fordeveloping a production schedule. How-ever, they should understand the processof creating one because the success of aprogram is very dependent upon the pro-ducer to plan, schedule, and implement aproduction plan.
The ensuing discussion provides a basisfor understanding the fundamentals ofproduction planning and monitoring. Mostcompanies have tailored planning softwareprograms to fit their needs, however theprinciples are the same as those used in theLOB approach. For that reason, LOB is thesubject of discussion.
The LOB technique consists of four ele-ments as described below and shown inFigure 7-1. The application and use of thistechnique is demonstrated in a later sec-tion of this chapter.
7.1.1 Objective Chart
An Objective Chart (Figure 7-1A) is a dis-play of the cumulative contract deliveryschedule over time. It shows cumulativeunits on the vertical scale and dates ofdelivery along the horizontal scale. It alsoshows actual cumulative deliveries to date.
7.1.2 Production Plan Chart
This chart (Figure 7-1B) shows the majorproduction process activities and events(control points) that are to be monitoredusing this technique. It also shows the lead-time associated with each of the controlpoints.
The more steps that are monitored, the moresensitive and more complicated the chartbecomes. Generally, control points on asingle chart should be limited to 50. If thereare more than 50, subsidiary productionplans can be used to feed the top plan. Thus,each chart can be kept simple and easy tounderstand. The shipping date of subsid-iary charts is the point at which a subpro-gram must be ready to join the overallschedule.
On the production plan chart, each moni-tored step is numbered, left to right. Step 1has the longest lead time; the shipping dateis the highest-numbered step. When twosteps are done at the same time, they arenumbered from top to bottom, such as steps8, 9, and 10. These control points can also begiven symbols that show whether they in-volve purchased items, subcontracted parts,or parts and assemblies produced in-house.Assemblies break down into subassemblies,which break down into parts or operations.Thus, one can develop a production planfor any part or level of assembly.

Figure 7-1. Line of Balance Technique
55

The production plan chart shows theinterrelationships and the sequence ofmajor steps, as well as lead times requiredfor each step. An understanding of themanufacturing processes involved andsound judgment are required to knowwhich step and how many steps must bemonitored. Slack or float times for activi-ties are not considered when plotting theproduction/lead-time chart; only the esti-mated time (and latest finish point) foreach activity is used.
The 12 control points in the productionplan chart shown in Figure 7-1B representkey tasks in manufacturing one lot of mis-siles. The plan indicates that control point(1), fabricate ballistics shell, must begin 24workdays before 1 January to meet the firstscheduled delivery of five units by the endof December (see the objective chart). Thelead time for other control points can berelated to the scheduled delivery in a simi-lar manner. Time for in-house transfer andstorage must be allowed in addition to theprocessing time.
7.1.3 Program Status Chart
This chart (Figure 7-1C) shows the cumula-tive inventory status at each control point inthe process at a given time (in this case, 1May). Looking at control point 12, we seethat the government has accepted 14 units ofthe product. The bar for control point 9 showsthat 40 units of the guidance section havebeen assembled, and the bar for control point4 shows that in-house fabrication has begunon 60 fins.
The cumulative numbers of units throughevery control point can and should be meas-ured monthly. Final deliveries (governmentacceptances) are shown month-by-month onthe objective chart as actual deliveries.
7.1.4 Line of Balance
The LOB represents the number of units thatshould have passed through each controlpoint (cumulatively) to satisfy the contractdelivery schedule. Managers use it to ana-lyze how the status of each control point on agiven date will affect future schedules. ThisLOB is drawn on the Program Status Chart(Figure 7-1C) using the following procedures:
(1) Select a control point; for example, 7.
(2) From the production plan/lead-timechart (Figure 7-1B), determine the lead time—the time from control point 7 to the shipmentpoint, Government Acceptance (12workdays).
(3) Using this number, determine the datethat the unit now at control point 7 should becompleted. (May 1 + 12 workdays = just overhalfway through a 22-workday month.)
(4) Find the point corresponding to thisdate, approximately May 17, on the contractschedule line and determine how many unitsscheduled for completion this represents bymoving horizontally from the objective chartto the program status chart (they share thesame vertical scale).
(5) Draw a line on the program statuschart (Figure 7-1C) at the level (43 units) overcontrol point 7.
(6) Repeat the above for each controlpoint and connect the horizontal lines overthe control points. The resulting line is theLOB, indicating the quantities of (1) unitsthat should have passed through each con-trol point on the date of the study or inven-tory (1 May) if the contract delivery schedulewere being met.
56

57
The difference between the LOB and thetop of the bar for each control point is thenumber of units behind or ahead of sched-ule as of 1 May. Thus, control point 12 is 16units behind schedule, control point 9 is 5units ahead of schedule, and control point7 is 21 units behind schedule. The mainimpact of control point 7 being behindschedule will be felt in 12 workdays, whichis the lead time for control point 7. As of 1April, an insufficient number of air vehiclecomponents (shell, fins, engine) had passedinto the assembly (air vehicle body) phase.This will adversely affect final deliveries12 workdays hence. All other control pointscan be analyzed in the same way.
7.2 WHEN AND HOW TO USE THE LINE OF BALANCE TECHNIQUES
7.2.1 General
The LOB technique should be consideredfor use in any project requiring the manu-facture of a specific quantity of a productusing repetitive processes. It is an effectivetechnique for identifying those activitiesthat require attention and possibly correc-tive action and can also be used for report-ing the status of the manufacturing processand delivery schedule to higher manage-ment. The LOB charts should be updatedon a periodic basis (weekly or monthly,depending on such factors as the size of theproduction run, the number of activities/control points, and the level of automateddata management).
Government managers will probably notbe involved with the LOB technique in theday-to-day management of their programs.However, they should have a basic under-standing of the technique, the type of infor-mation it can convey, and its applicability.
7.2.2 Analysis
Using the LOB charts in Figure 7-1, man-agement can tell at a glance how actualprogress compares with planned progress.Analysis of the charts can pinpoint prob-lem areas. Delays at control point 7 in theexample may have been causing final de-livery problems throughout the contract.However, the purpose of LOB analysis isnot to show what caused the slippage inthe shipping date, but to detect potentialfuture problems.
In the example, the Government accep-tance point is control point 12. The bardoesn’t reach the LOB; therefore, deliver-ies are behind schedule. Control points 10and 11 are short. However, point 9 is onschedule. Since point 10 depends on points8 and 9, we know control point 8 is theoffender. Both points 7 and 8 are short, butthere are more than enough purchaseditems (engines) at control point 6.
What’s the problem with control point 8?Trace it back to control point 7, which isseriously short. It is obvious that not hav-ing enough completed fins is holding upthe whole process. Control points 2, 3 and5 are short, but are not directly responsiblefor the failure to meet the delivery sched-ule since 9 is ahead of schedule. Neverthe-less shortages at 2, 3, and 5 could sooncause problems at 9. The problem with thefins 7 should be addressed before manage-ment attention is devoted to other shortoperations. The overages at control points1 and 6 may be examined from the point ofview of inventory control. Updating thecharts requires a good status-reporting sys-tem, which can be mechanized if the pro-gram is large and complex.

58
7.3 LINE OF BALANCE ADVANTAGES AND DISADVANTAGES
7.3.1 Advantages
(1) Points out problems before theirimpact on finished product deliveries showup, thereby allowing managers to correctproblems earlier.
(2) Allows managers to see, in themiddle of a contract, whether they can meetthe contract schedule if they continue work-ing as they have been.
(3) Focuses attention on those pro-duction control points where there are prob-lems; this allows a senior manager to pin-point responsibility for slippages.
7.3.2 Disadvantages
(1) People working on a project maynot grasp what the LOB is measuring.
(2) Limited to production and/orassembly-type processes.
(3) Shows only where the problem is,not what it is.
(4) A monitoring device; not as easyto use as a planning device.
7.4 SUMMARY
The LOB is a monitoring technique thatgives prior warning of problems within acontinuous production process. The key isto catch problems in a production processearly; otherwise, the schedule is lost. TheLOB technique provides that warning.
Think of the production process as a natu-ral gas pipeline. If a bubble of air getsinto the pipeline, it will eventually becarried to the gas users, and the userswill find their burners extinguished asthe nonflammable air reaches them. Themanager of the pipeline company or thenatural gas utility doesn’t want clients tosuffer blowouts from air bubbles in theirlines. The same holds true for the manag-ers of a continuous production process.Waiting for problems to show up at theend of the line is a mistake. Problemsneed to be detected when they begin socorrections are faster, before too muchdamage (to cost, performance, or sched-ule) is done, and production schedulesfall too far off contract.
To do LOB, the following is needed: (1) acontract schedule, or objective chart; (2) aproduction plan or lead-time chart forthe production process itself; (3) controlpoints cumulative inventories; and (4) aprogram status chart on which to plotLOB and the cumulative quantities ofunits that have passed through the con-trol points of the assembly/productionprocess. If the objective and programstatus charts are given the same verticalscale, the LOB can be plotted graphicallyfrom the former to the latter.
Remember that the shape of the LOB willchange over time, especially if theproduction process has a beginning andan end. Remember, too, that LOB chartsshow where a problem is, but not neces-sarily why the problem exists or what thesolution is.
In most programs, especially in DoD anddefense-related industries, time is a re-source that must be carefully managed. Ifit is not, it can become a serious constraintthat can threaten the success of the pro-gram. This chapter addresses time man-agement from two perspectives: first, as itrelates to a program, and second, as itrelates to the PMs use of time.
8.1 TIME MANAGEMENT ANDTHE PROGRAM
This section concerns three aspects of timemanagement related to programs:
(1) Time reserve
(2) “Now” schedule
(3) Value of time.
8.1.1 Time Reserve
In contractor performance measurement,much emphasis is placed on “managementreserve,” the reserve budget controlled bythe industry PM. What isn’t always recog-nized is that a time reserve is also needed inorder to accommodate unknowns in the pro-gram. However, use of a time reserve shouldbe approached with caution, because mem-bers of a program office team may be temptedto fall back on it prematurely.
Literature describing time reserve is scarce.However, there are some aspects of a timereserve that are clear.
(1) Most PMs establish a time reserve ofabout 10 percent. On a 40-month program,for example, a 4-month time reserve wouldbe established.
(2) The time reserve must be held closelyby the PM. Otherwise, every manager onhis/her program may think “I know there’sa time reserve; therefore, I don’t really haveto meet my schedule.” The PM may placethis reserve under “additional system tests”or another downstream activity. The pointis, it shouldn’t be visible. (A built-in safetyfactor between the manufacturing sched-ule and the delivery schedule is often used.)
(3) A tough and disciplined approach tomeeting the published schedule is requiredfrom the start of a program in order tomaintain the reserve and, consequently, tomeet the program schedule in spite of slip-pages caused by the unknown unknowns(unk-unks) that inevitably arise.
8.1.2 “Now” Schedule
There is a direct relationship between timeand cost for any activity. This relationshiptakes into account the people, resources,and method used. It also considers theefficiency achieved. Generally, the leastcostly schedule is the current one. Speed-ing up the schedule costs more; stretchingout the schedule also costs more.
The sum of the direct and indirect costsgives a U-shaped total program cost curve.
8TIME MANAGEMENT
59

The optimum schedule for implementingthe program is the schedule correspond-ing to the minimum point on this curve.The relationship among direct, indirect,and total program cost is shown graphi-cally in Figure 8-1.
Because schedule stability affects programcosts, which may, in turn, affect technicalperformance, it is clear that schedule sta-bility has a great deal to do with whetherthe program meets its cost and technicalobjectives. Unfortunately, budget con-straints and other factors, like changes inquantities (items over which the PM has nocontrol), have often been imposed on aprogram with the comment, “Do the bestyou can.”
When a schedule must be revised, thesuperseded schedule is often discarded. Ifthe new schedule is superseded, the pro-cess is repeated. However, there is somevalue in retaining an obsolete schedule.
Often, the organization causing a slip inschedule becomes a repeat offender. Theprincipal value of retaining a former sched-ule lies in being able to hold the offender’sfeet to the fire, thus making scheduleslips less palatable.
The significance of maintaining a stableschedule is becoming more widely recog-nized. Appendix A describes the develop-ment of a master schedule and the impor-tance of maintaining schedule discipline.
8.1.3 Value of Time
According to the late John H. Richardson,president of Hughes Aircraft Company,“A basic reason for adopting project (orprogram) management, when tackling thedifficult and unique tasks associated withdeveloping and producing a system, is toeliminate unnecessary delays in accom-plishing the job at hand. Time is a resourcein systems management, to be treated with
Figure 8-1. Total Cost Analysis for Selecting“Optimum” Program Duration
Pro
gra
mC
ost
OptimumTime
Total ProgramCost
Indirect Cost
Direct Cost
60

indifference or used well like any otherresource. For projects not yet in full swing,it is important to recognize that time haseconomic value, and that we may be takingtime too much for granted.”1
(1) Funding could create a problem. Inhungry years, the schedule is oftenstretched because of reduced funding.
(2) A better product could be developedif it were more thoroughly debugged andtested. However, a system does not reallyget wrung-out until it is in the user’s hands,regardless of advance debugging.
(3) Cost of concurrency (overlap of devel-opment and production) might lead to adecision not to overlap program phases.Such a decision might be popular in manycases, but it could never be tolerated whenthe pendulum swings toward the impor-tance of time; that is, when top manage-ment says, “Get the system out the door,never mind what it costs.”2
Stretched-out schedules incur cost penal-ties because of inflation, additional engi-neering changes, and changes in key pro-gram management office positions. An-other near-term cost is due to the increasedchance that a program will be canceledbecause of obsolescence or competing tech-nology. Stretch-outs invite cancellation.Also, long schedules with no opportuni-ties for incorporation of improvements area negative factor when considering a newstart.
Delayed decisions increase costs. Accord-ing to R. W. Peterson, former DuPont execu-tive, “All businessmen are concerned, andproperly so, about the long time it takes tomove a new development from its incep-tion to a profit status. But frequently
forgotten is the fact that a month’s delay in theearly stages of development is exactly aslong as a month’s delay in the later stages.While it may seem innocuous to put off adecision for a month or two in the early yearsof a project (or program) with an uncertainfuture, that delay may turn out to be just ascostly as is procrastination when the finaldecisions are made. In short, a sense of ur-gency is essential to decision making in allstages of a new venture, not just the laterstages.”3
The useful life of a defense system must betaken into consideration. Concentration onthe system or product often overlooks a keypoint: whether the buyer obtains value upondelivery. The most costly product is one thatappears when it no longer fulfills a usefulpurpose, even though it has been producedat minimum cost. Each month added to thedevelopment and production of a new high-technology system or product tends to re-duce by 1 month the operational life of thesystem or product.
In spite of the 10-20 percent cost premiumthat may be paid for tight scheduling (ascompared to orderly but stretched-out sched-uling), the resulting longer operational lifemay provide greater economic value. This islooking at time only from the viewpoint ofeconomics, i.e., acquisition cost per year ofoperational availabil survival insurance.
Consideration of alternative plans and sched-ules will also help; e.g., if event so-and-sooccurs, proceed with plan A; if event such-and-such occurs, proceed with plan B and soon. Anticipation and preparation for most-likely events, along with the tools described,and coupled with effective communicationof the plans, can change the managementstyle from crisis management to skillfulmanagement.
61

8.2 TIME MANAGEMENT AND THE PROGRAM MANAGER4
PMs are busy people. They have the re-sponsibility for the management of amyriad of activities and the resources thatmake up the program. In addition, they areoften required to perform specific programactivities, especially in smaller programs.Thus, it is important that they manage theirtime well. Some managers could be moreproductive, perhaps as much as 20-40 per-cent, by better managing their time. A ma-jor difficulty in accomplishing this is thefailure to realize that there is a time man-agement problem and that solutions arepossible. This section discusses variousaspects of time management and identifiesways to better accomplish it.
In the early 1980s, a time management sur-vey was conducted to identify the prob-lems in achieving effective time manage-ment. More than 300 project managers in 24industries, including the government, par-ticipated in the survey, which investigated15 different areas. The survey identifiedseveral time management problem areas.Among the most common were time rob-bers and meetings.
Time robbers are simply those things thatcan occur on a day-to-day basis that cantake away from the PMs ability and time toaccomplish his/her work. There are liter-ally dozens, if not hundreds, of such things,such as incomplete work, delayed deci-sions, poor communications channels, ca-sual visitors, lack of effective programmanagement tools, etc. Appendix B con-tains a list of common time robbers. Thesurvey found that delayed decisions andpoor communications were the most com-monly cited time robbers. Another com-mon problem that affects a PMs time is the
inability or reluctance to say no. If a subor-dinate brings a problem to the PM, theManager must be alert to make sure not toassume responsibility for the problem,unless, of course, the situation warrantssuch action. If subordinates believe thatPMs will assume responsibility for theirproblems, needless demands on the PM’stime will increase.
Meetings are a fact of life in program man-agement. However, unless they are effec-tively planned and conducted, they can bea severe drain on time and resources. Anumber of common pitfalls, if not avoided,can turn meetings into a complete waste oftime. Among them are: not having a clearand focused agenda; spending too muchtime on trivial matters; having too many ortoo few meetings; not having the rightpeople at the meetings; and not keeping anaccurate record of decisions and actionsassigned.
To get the most value out of meetings, thefollowing actions should be considered:
(1) Understand the purpose of the meetingand what results are expected
(2) Minimize the number of people attend-ing the meeting
(3) Hold the meeting in a setting appro-priate for the meeting objectives
(4) Develop and distribute the agenda
(5) Start and finish on time
(6) Summarize meeting results and pre-pare and distribute minutes.
In addition to focusing on time robbersand the conduct of meetings, PMs should
62
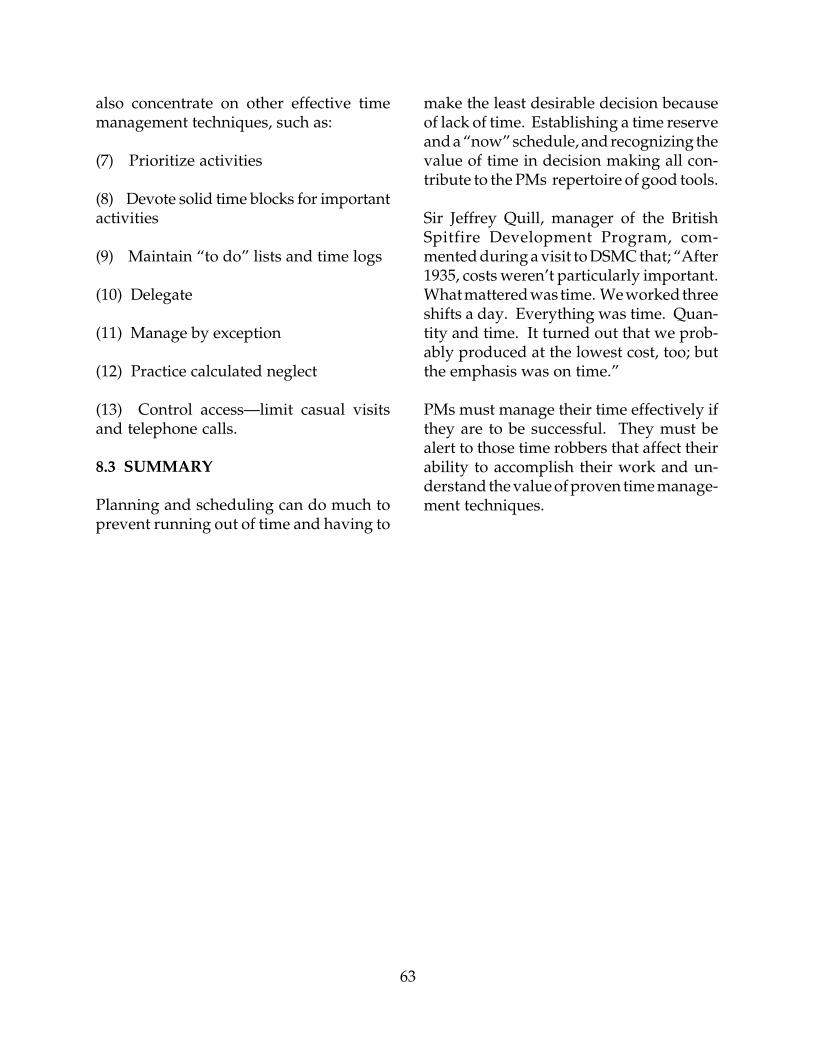
63
also concentrate on other effective timemanagement techniques, such as:
(7) Prioritize activities
(8) Devote solid time blocks for importantactivities
(9) Maintain “to do” lists and time logs
(10) Delegate
(11) Manage by exception
(12) Practice calculated neglect
(13) Control access—limit casual visitsand telephone calls.
8.3 SUMMARY
Planning and scheduling can do much toprevent running out of time and having to
make the least desirable decision becauseof lack of time. Establishing a time reserveand a “now” schedule, and recognizing thevalue of time in decision making all con-tribute to the PMs repertoire of good tools.
Sir Jeffrey Quill, manager of the BritishSpitfire Development Program, com-mented during a visit to DSMC that; “After1935, costs weren’t particularly important.What mattered was time. We worked threeshifts a day. Everything was time. Quan-tity and time. It turned out that we prob-ably produced at the lowest cost, too; butthe emphasis was on time.”
PMs must manage their time effectively ifthey are to be successful. They must bealert to those time robbers that affect theirability to accomplish their work and un-derstand the value of proven time manage-ment techniques.

1John H. Richardson, Time Defeats Technology, Hughes Aircraft Company, Culver City, Calif., date unknown.
2Ibid.
3Russell W. Peterson, former DuPont executive, Governor of Delaware and White House advisor, “NewVenture Management in a Large Company,” Harvard Business Review, May-June 1967, p. 72.
4Harold Kerzner, Project Management, Van Nostrand Reinhold, New York, 1998, Chapter 6.
ENDNOTES
64

9AUTOMATED SCHEDULING TOOLS
65
Previous chapters have shown that manag-ers use schedules in a variety of ways for awide range of purposes. Schedules are anintegral part of the program planning anddecision processes. Managers use them totrack progress, predict future work, man-age resources, analyze alternatives, iden-tify risk, and report program status. Inmost cases, it is the PMs responsibility toconstruct, revise, maintain, and reportschedule information.
The PM must do these things in a complexenvironment that cuts across contractor andgovernment boundaries and includes awide geographical area. The challenge iscomplicated even further by the need forinstant information that must be availableto a wide audience that usually requiresthe information in a specific format to suitunique needs.
It would be impossible to meet these chal-lenges without automated tools.Theremainder of this chapter discusses charac-teristics and features of some tools avail-able on the market today and suggestscriteria that anyone searching for a toolshould consider. The intent is to providean overview of the types of products thatare available and the range of functionsthese products support. The level of detailpresented is keyed to what would be use-ful to know about the program manage-ment software tools that would likely beused in a mid-to-large Program Office.
9.1 AUTOMATED PLANNING AIDS
The idea to use the power of the computerto assist in the planning and tracking pro-cess is not new. Industry has used auto-mated scheduling software for at least thepast 30 years. Early versions of these tools,however, usually employed a mainframecomputer that batch processed data off-line and spewed reams of information formanagers to analyze when they arrived atwork on a Monday morning. Despite theautomated tools, the process of creating,maintaining, and reporting schedule infor-mation was a daunting task.
The advent of PCs/workstations and net-work technologies has made life easier formanagers. The market encourages soft-ware vendors to develop a wide range ofprograms readily available to P Ms to aidthem in effectively and efficiently dealingwith the details involved in creating a pro-gram plan, then tracking progress.
The introductory paragraph of this chap-ter lists many uses of a “schedule.” Soft-ware developers have responded to themanagers’ needs by creating programsthat build schedules and support pro-gram management functions. Even thesimplest program includes some programmanagement features. The focus of thefollowing discussion, therefore, is on thebroad category of Program (often calledProject) Management Software.

66
The focus is on providing a brief descrip-tion of the functionality of these products,highlighting some of the desirable featuresthat are available to support programmanagement, and identifying sources thatmay be useful in determining what prod-ucts are available and how their featuresand performance might be assessed.
9.2 FUNCTIONAL CHARACTERISTICS AND FEATURES
Most of the Program Management Soft-ware that is available today is based on arelational database design and is thereforeable to support a broad range of programmanagement activities including:
(1) Scheduling/Tracking
(2) Resource Planning/Management
(3) Risk Management
(4) Cost/Performance/Analysis
(5) Reports and Graphics.
The extent to which the different programssupport these activities varies from prod-uct to product. For example, some prod-ucts provide the capability to create onlyGantt charts whereas others provide thetools to make Gantt and network charts.
Program features, the way in which activi-ties are implemented, are an importantfactor in considering the usefulness of aprogram. A convenient way to profile thefunctional characteristics and associatedfeatures of automated program manage-ment tools is to do so from these threeperspectives:
(1) System-Level Characteristics
(2) Project Management/SchedulingCharacteristics
(3) Ease of Use.
System-level features have a generalapplicability, independent of any of thespecific project-management activities sup-ported, that add to the overall capabilityand desirability of the product. These fea-tures include, but may not be limited to:
• Collaboration/Workgroup—Enablesmanagers/team members to use a com-mon system of communication and allowaccess to common databases for the pur-pose of assigning tasks, updating projectdata, assigning resources, and reportingstatus.
• Integral e-mail—Allows exchange ofmessages and file attachments to otherproject team members from within theproject management application.
• Multiple Project/Multiple Tasks—Sup-ports multiple programs and tasks withina project.
• Security—Limits access to certain databy individual or class of user, as well aspassword protection for the system.
• Open Data Base Connectivity(ODBC)—Enables users to import datafrom other data sources and in variousformats into their scheduling applications(e.g., data from your contractor’s projectdatabase). This is a Microsoft-developedstandard for exchanging data with a vari-ety of databases.

Most programs include features that focuson program management and schedulefunctions. Some features offered are:
• Project Scheduling/Tracking—DataEntry Templates facilitate the entry of theinitial task, time, and resource data. On-Screen Tracking facilitates comparison ofactual performance versus the planned andallows tracking of progress by cost, time,or achievement.
• Resource Planning/Management—Re-source Leveling is a capability that resolvesresource conflicts by delaying tasks andassignments as well as by task splitting,which entails dividing tasks into segmentswith time gaps as necessary. Resource Cal-endars provide insight into the availabilityof a particular resource by showing work-ing and non-working times. Free/Total SlackTime is a feature that is useful for adjustingunder-or-over allocated resources.
• Cost/Performance Analysis—EarnedValue Tools are essential for comparing ac-tual performance with expected perform-ance. Cost Analysis Tool Kits are tools foranalyzing data and making forecasts. Thisfeature may be integral to the product oravailable by virtue of “exporting” data toanother application with this capability.
• Reports and Graphics—Pre-Defined Re-ports facilitate the presentation of projectdata. Customization Controls provide userswith a convenient way to format reports totheir own specifications. Filters enable theuser to screen information, e.g., tasks orresources, before capturing a screen-viewor preparing a report. Embedded Graphicsand Text capability allows a user to importdata from other applications for inclusionin a project report.
• Import/Export—Import/Export datafrom/to an external source, such as an-other database or spread sheets, facilitatesthe ability to create custom reports or con-duct analyses.
Finally, ease of use or user friendliness, isthe set of qualities that represent the de-gree in which people can employ the soft-ware without an inordinate amount of train-ing or regular reference to user’s manuals.User friendliness is an important consider-ation because program management soft-ware products can be complicated. Re-gardless of how powerful a program maybe, if it is difficult to use, managers prob-ably will not spend the time to learn it.Consequently, PM software is likely to beeffective and desirable if users can easilylearn to use it.
The following features typify user-friendlysystems:
• Graphical User Interfaces (GUIs)—These are the screens in which a user inter-acts with the program. The operating envi-ronments in use today have led to thedevelopment of interface screens that en-able the user to interact with the software inan intuitive way, using a variety of but-tons, menu lists, and wizards.
• On-Screen Data Entry—The capabilityto create schedule information by usingtools to create an on-screen graph. See Fig-ure 9-1 for an example.
• Help Function—On-screen docu-mentation as well as “context-sensitive”help in which the software displays theapplicable text based on the functions be-ing performed. This is a particularly usefulfeature for someone learning to use it.
67
• Tutorials—Program instruction on per-forming certain functions and guidancethrough a “canned” demonstration.
• Wizards—Templates that guide theuser through various project setup, dataentry, and report formatting procedures.The features discussed above are a sampleof the characteristics of various programmanagement products. Moreover, there isno common “feature list” or set of defini-tions that defines the various characteris-tics. Nonetheless, the summary should givea sense of what is available and provide thebasis for a more exhaustive review asneeded.
9.3 EVALUATING PROJECTMANAGEMENT SOFTWAREPRODUCTS
Choosing a software program from thewide range of available products can becomplex and time consuming. The selec-tion process should begin with an analysisof what managers want to do with thesoftware to identify the functions that areneeded. Other factors that should be partof the assessment process are consider-ation of personnel skill levels/training re-quirements, integration with enterprise(organizational) systems, hardware/sys-tem requirements, and cost.
Figure 9-1. On -Screen Data Entry Using Gantt Chart Feature(AEC Software Fast Track Schedule)
68

Table 9-1. Project Management Software Functions and Criteria
USER FRIENDLINESS
Feature Consideration
Graphical User Interfaces (GUIs) Logical, intuitive, all inclusive, windows compliant
Robust Help Function Complete, easy to access, context based, examples
Wizards Exist for major functional areas, intuitive, tailorable results
Tools Exist for major functional areas, intuitive
Tutorials Complete and examples
On-Screen Data Entry Simple, logical, complete, intuitive
SYSTEM LEVEL FEATURES
Collaboration/Workgroup Support Desired capabilities available, non-proprietary
Integral e-mail Exists, simple, compatibility with existing e-mail
Multi-Project & Task Support Roll-up to higher levels, supported by reporting features
Security Meets specific security needs, compatible w/ existing system
Open Data Base Connectivity Data transfer with other program management S/W
PROJECT MANAGEMENT/SCHEDULING FUNCTIONS
Project Scheduling/Tracking
Multiple Schedule Methods Create Gantt, network charts, and go from one to the other
Roll-Up Display and report different levels
Ability to Tailor to Specific Needs Add/delete/modify activity and event information
Relationships Display and report dependencies among events/activities
Progress Tracking Compare and display plans and actual progress
Critical Path Display Highlight critical path
Interoperability w/ Other Programs Import and export data from other programs
Total Free/Slack Time Compute and display free and slack time
Time Estimates Use probability distributions to compute time to complete
Time Roll-Up Use statistical methods to compute roll-up times
Resource Planning/Management
Resource Determination Assist in determining resources needed
Resource Assignment Allow assignment and notification of assignment to activities
Interoperability w/ Other Programs Import and export resource data
Resource Leveling Easy to access, permits “what if” excursions
Resource Calendars Display resources over time
Task Assignment Filter and display assignment of responsibility
Analysis
Schedule Analysis Allow analysis and comparison of alternative schedules
Earned Value Analysis Assist in complete and accurate EV analysis
Cost Analysis Includes tool kits for analysis of program cost
Resource Analysis Compute resource utilization, identify conflicts
Reports
Pre-Defined Report Formats Automatically create reports based on program data
Customization Controls Allow reports to be tailored for specific purposes
Embedded Graphics and Text Add text and graphics to reports
69

Analyses of requirements and softwareevaluation are beyond the scope of thisdiscussion. However, Table 9-1 showssome of the functions that are available inavailable program management softwareand lists some ideas for consideration whensearching for the right software.
9.4 FINDING OUT MORE
The best method of gaining informationabout a potential project management toolis to talk to someone who is using theproduct. A PM in the next office may havea perfectly acceptable and proven productthat he/she is using. The company undercontract may have a product that it uses. Ifthe government and contractor program
70
offices are going to share information, it isprudent to use the same software, if pos-sible. At the very least, compatibility andinteroperability must be demonstrated be-fore making a decision to buy a particularproduct.
There is a considerable information onproject management and scheduling soft-ware from a variety of sources. The DefenseAcquisition Deskbook (DAD) has a list of toolsthat are being used by program offices.From a commercial aspect, specific prod-uct information is available on most com-panies’ World Wide Web home pages.Virtually all developers provide informa-tion about their products on a web site andshow links/contact to additional sources.

71
The Integrated Master Schedule (IMS) for aprogram should be a time referencebaseline for the activities and events thatmake up the program. It should be incor-porated into the program plan and linkedto approved performance and cost objec-tives. The IMS is developed by the contrac-tor from the Integrated Master Plan (IMP),which documents all the tasks required todeliver a high quality product and to facili-tate success throughout the product’s lifecycle. In an Integrated Product and ProcessDevelopment (IPPD) environment, whichis the standard approach for all DoD pro-grams, the IMP and IMS provide anoverarching framework against which theIntegrated Product Teams (IPTs) can func-tion, helping them understand their workwithin the context of the total program.
The IMP and IMS evolve as the programmatures. During the initial stages of Con-cept Exploration, the integrated plan ispreliminary and its purpose is to providean understanding of the scope of workrequired and the likely structure of theprogram. It is constructed to depict a likelyprogression of work through the remain-ing phases, with the most emphasis on thecurrent and/or upcoming phase (especiallythe period to be contracted for next). As theprogram is defined, the IMP is iteratedseveral times, each time increasing the levelof detail and confidence at which all essen-tial work has been identified. The specificformat for this plan is not critical; however,it usually reflects an Event/Accomplish-ment/Criteria hierarchical structure—a
format that greatly facilitates the trackingand execution of the program.
In some cases, a preliminary IMP and itscorresponding IMS may be developed bythe government but include industry in-puts obtained through open communica-tions with potential sources during thepre-solicitation phase of the acquisition.Contractors are normally required to sub-mit formal IMP and IMS with their propos-als and to develop more detailed IMP/IMS versions after the contract is awarded.
The IMS is event driven and is developedwith participation of all program stake-holders. It should identify all tasks thatneed to be accomplished, their logical or-der, and the input conditions necessary tocomplete each task. When documented ina formal plan and schedule, this event-driven approach can help ensure that alltasks are integrated properly and that themanagement process is based on signifi-cant events in the acquisition life cycle andnot on arbitrary calendar events. Develop-ing the program schedule presents an op-portunity to identify critical risk areas. AsIPT members estimate the times to com-plete specific tasks, events that may causedelays will become apparent. These eventsare potential areas of risk that the IPTshould consider for further analysis.
The IMS begins as an IMP with dates—thestarting points are the events, accomplish-ments, and criteria that make up the plan.At a minimum, an IMS shows the expected
APPENDIX A
INTEGRATED MASTER SCHEDULE DESCRIPTION

72
start and stop dates for each activity in theplan, but each activity may be broken downinto lower-level tasks that will be used tomanage the program on a day-to-day ba-sis. The schedule can be expanded down-ward to the level of detail appropriate forthe scope and risk of the program. Pro-grams with high risk show much lowerlevels of detail in the integrated masterschedule in order to give the visibilitynecessary to manage risk. The more de-tailed the IMS, however, the greater thecost to track and update the schedule.Under acquisition reform initiatives, thedates in the IMS usually are not madecontractually binding so as to allow theflexibility to take full advantage of event-driven scheduling.
Additional information on the developmentof IMSs can be found in various sections ofthe Defense Acquisition Deskbook and in theDoD Integrated Product and Process Develop-ment Handbook dated August 1998. Com-mercial standards EIA 632 and IEEE 1220-1994 can also be consulted for more infor-mation on developing master plans andschedules. See http://www.eia.org/eng/p u b l i s h e d . h t m a n d h t t p : / /standards.ieee.org for information onhow to obtain these standards. A DoDData Item Descriptor (DI-MISC-81183A)has been developed for IMS guidance;it is attached to this Appendix as Tab 1.
USE OF INTEGRATED MASTERSCHEDULES
The primary purpose of the IMS is to trackschedule variations. By linking the IMS tothe IMP, it can also be used to track theactivities that provide functional and life-cycle inputs to product development. Inthis role it provides a crosscheck not onlythat the inputs were obtained, but also that
they were obtained at the right time. Inaddition, the IMS can be useful for thefollowing events/activities that are com-mon to all programs.
PROGRAM REVIEWS
The IMS can be a framework for periodicprogram reviews within the program man-agement office (PMO). If constructed prop-erly, the schedule will illustrate the vari-ous levels of the program and will be com-patible with the program cost/schedulecontrol system reports.
Program reviews can be an excellent forumfor resolution of schedule conflicts and thegenesis for controlled changes to the sched-ule from within the PMO. Most key mem-bers of the PMO team are present at thesereviews; therefore, proposed schedulechanges or slips can receive wide dissemi-nation within the organization.
WHAT IF” EXERCISES
The IMS can serve as the framework for“what if” exercises imposed on programsfrom outside the PMO. Schedule changescan be plotted manually by using over-lays. Using the same grid coordinates onan overlay allows the PMO team to see,clearly and graphically, the effect of thecompressions or extensions of sub-mile-stones on the program. It may be eveneasier (and more productive) for the PMOteam to run “what if” exercises on a com-puterized schedule. Without a masterschedule as a baseline, these exercises cantake longer to accomplish and they mayoverlook important variances from theprogram’s established baseline scheduleor plan.

73
PROGRAM BRIEFINGS
The IMS can serve as a baseline for pro-gram reviews at higher headquarters andother reviews or briefings outside the PMO.Most programs have key milestones takenfrom the master schedule and presented insummary form on viewgraphs or slides. Ifthese do not show the detail required tomake a point, the time span shown can bereduced to the point where the detailsbecome visible.
SCHEDULE DISCIPLINE
To be effective, an IMS must be kept up-to-date and accurate. Maintenance of theIMS requires a process similar to thatinherent in configuration control—onethat establishes discipline through a set ofrigorous procedures for managing sched-ule change. The degree of schedule disci-pline imposed within the PMO can be amajor factor in the success of a program.The underlying philosophy of the sched-ule control process should reflect central-ized control of the IMS. That is, changes tothe IMS baseline should be made onlywith the approval of the P2M or his/herdesignated representative and with full
justification and an understanding of theimpact of the changes on the overall pro-gram. Following are examples of somesimple procedures that, if practiced, willinstill discipline and prevent the unautho-rized release of schedule information thathas not been approved for inclusion in theIMS.
• Program changes, whatever the source,should start as proposals and, if approved,grow into a firm plan. Eventually, they areincorporated into the IMS as changes. Thequestion of when to plot these changes is amatter of judgment and should reflect thePM's policy. Each change should be plot-ted as a proposed or tentative change untilapproved.
• A permanent record of each changeshould be maintained. If the programschedule slips, it should be documenteduntil documentation no longer serves auseful purpose.
• Whenever copies of the IMS are made,they should be dated and authenticated bythe signature of the PM or the appointedschedule manager. Undated and unauthen-ticated schedules should not be releasedoutside the PMO.

74
DATA ITEM DESCRIPTION Form ApprovedOMB NO. 0704-0188
Public repor ting burden for this collection of information is estimated to average 110 hours per response, including the time for reviewing instructions, searching existing data sources, gathering and maintaining thedata needed, and completing and reviewing the collection of information. Send comments regarding this burden estimate or any other aspect of this collection of information, including suggestions for reducing thisburden, to Department of Defense, Washington Headquarters Services, Directorate for Information Operations and Reports, 1215 Jefferson Davis Highway, Suite 1204, Ar lington, VA 22202-4302, and to the Off ice ofManagement and Budget, Paperwork Reduction Project (0704-0188), Washington, DC 20503.1. TITLE
Integrated Master Schedule (IMS)2. IDENTIFICATION NUMBER
DI-MISC-81183A3. DESCRIPTION/PURPOSE
The IMS is an integrated schedule developed by logically networking detailed programactivities. The contract Integrated Master Plan (IMP)is the foundation of the programschedule and provides a hierarchy for schedule traceability and summarization. IMP events,accomplishments, and criteria are included in the schedule to monitor progress. Thisinformation will be used to verify attainability of program objectives, evaluate the progressof the government and contractor team toward meeting the program objectives, and to integrateprogram schedule among all related components.4. APPROVA L DATE (YYMMDD)
9602095. OFFICE OF PRIMARY RESPONSIBIL ITY (OPR)
F/ASC/FMCS6a. DTIC APPLICABLE 6b. GIDEP APPLICABLE
7. APPLICATION/INTERRELATIONSHIP
7.1 This Data Item Description (DID) contains the format and content preparationinstructions for the data product generated by the specific and discrete task requirement asdelineated in the contract.
7.2 This DID may be applied to programs which utilize the Work Breakdown Structure (WBS)during the concept exploration, demonstration and validation, engineering and manufacturingand development, and production phases.
7.3 This DID supersedes DI-MISC-81183.
8. APPROVA L L IMITATION 9a. APPLICABLE FORMS 9b. AMSC NUMBER
F718010. PREPARATION INSTRUCTIONS
10.1 Format . This precedence logic diagram shall be in the contractor’s format in the formof a network, milestone, and Gantt chart. This diagram shall be provided in digital format.
10.2 Content . The schedule shall contain all of the contract IMP events and milestones,accomplishments, criteria, and activities from contract award to the completion of thecontract. The schedule shall be an integrated, logical network-based schedule thatcorrelates to the program WBS, and is vertically and horizontally traceable to thecost/schedule reporting instrument used to address variances (such as Cost Performance Report(CPR), Cost/Schedule Status Report (C/SSR), etc.) It shall have a numbering system thatprovides traceability through the IMP and Statement of Work (SOW). It shall contain programevents and milestones and definitions, summary, intermediate and detailed schedules, andperiodic analysis of progress to date. It shall be possible to access the information byproduct, process, or organizational lines. Descriptions of the key elements are as follows:
10.2.1 Program milestones and definitions. Key programmatic events defined by IMP, thecontracting agency or weapon system contractor which define progress and completion in eachWBS element along with the definition for successful completion of the milestone.
10.2.2 Summary master schedules. A graphical display of top-level program activities andkey events and milestones of the IMP which depict major work activities in an integratedfashion at the summary level of the WBS, e.g. level 1-3 of the WBS.
10.2.3 Intermediate schedules. A graphical display of top-level program activities and keymilestones which includes all associated accomplishments of the IMP, traceable to the WBSelement as necessary to display the work effort at the intermediate level of summarization,e.g. level 3-5 of the WBS as appropriately tailored.
10.2.4 Detailed schedules. A graphical display of detailed activities and milestones whichdepict work activities in a particular work breakdown structure element, to include thecriteria associated with each accomplishment of the WBS element as well as any additionalactivities necessary to display the work effort to detailed WBS levels, e.g. level 4-8 of theWBS as appropriately tailored.
11. DISTRIBUTION STATEMENT
Distribution Statement A: Approved for public release; distribution is unlimited.
DD Form 1664, APR 89 Previous editions are obsolete Page 1 of
3

75
Block 10, Preparation Instructions (Continued)
10.2.5 Periodic analysis. A brief summary which identifies progress to date, variances to the plannedschedule, causes for the variance, potential impacts and recommended corrective action to avoidschedule delays. For each program milestone planned, forecasted and actual completion dates shall bereported. The analysis shall also identify potential problems and a continuing assessment of the networkcritical path. Thresholds for impact reporting shall be identified on the DD Form 1423, CDRL.
10.2.6 Integrated program network. Logical diagram of all activities in the program. The key elements ofthe integrated network to be constructed in the diagram are as follows:
a. Milestone or event - A specific definable accomplishment in the program/project network, recognizableat a particular point in time. Milestones are numbered and may be contained within an activity box.
b. Activity or task - A time consuming element, e.g. work in progress between interdependent events,represented by an activity box.
c. Duration - Planned length of time needed to accomplish an event/activity.
d. Relationships - A line that defines how two activities or events are logically linked. It can take up tofour (4) forms:
(1) FS (finish to start) - An activity must finish before another can start.
(2) SS (start to start) - An activity depends on the start of another activity.
(3) FF (finish to finish) - One activity cannot finish until another activity is finished.
(4) SF (start to finish) - An activity cannot finish until another activity starts.
e. Slack or Float - Extra time available on an activity before it will impact an activity on the critical path.
f. Lag - The delay or wait period between two tasks.
g. Critical Path - A sequence of activities in the network that has the longest total duration through theprogram or project. Activities along the critical path have zero or negative slack/float. It should be easilydistinguished on the report formats, e.g. a thick line, patterned or in red ink. This should be calculated bycomputer-based software.
h. Target Start (TS) - A program defined date of when an activity should start. This is an operator-defined date rather than a computer-calculated date.
i. Target Complete (TC) - A program defined date of when an activity should finish. This is an operator-defined date rather than a computer-calculated date.
j. Actual Start (AS) - Actual start date of an activity.
k. Actual Finish (AF) - Actual finish date of an activity.
l. Early Start (ES) - The earliest start date an activity can begin the precedence relationships. Computer-calculated date.
m. Early Finish (EF) - The earliest finish date an activity can end. Computer-calculated date.
n. Late Start (LS) - The latest start date an activity can start without delaying the program or projecttarget completion date. Computer-calculated date.
04/15/91 DI-MISC-81183
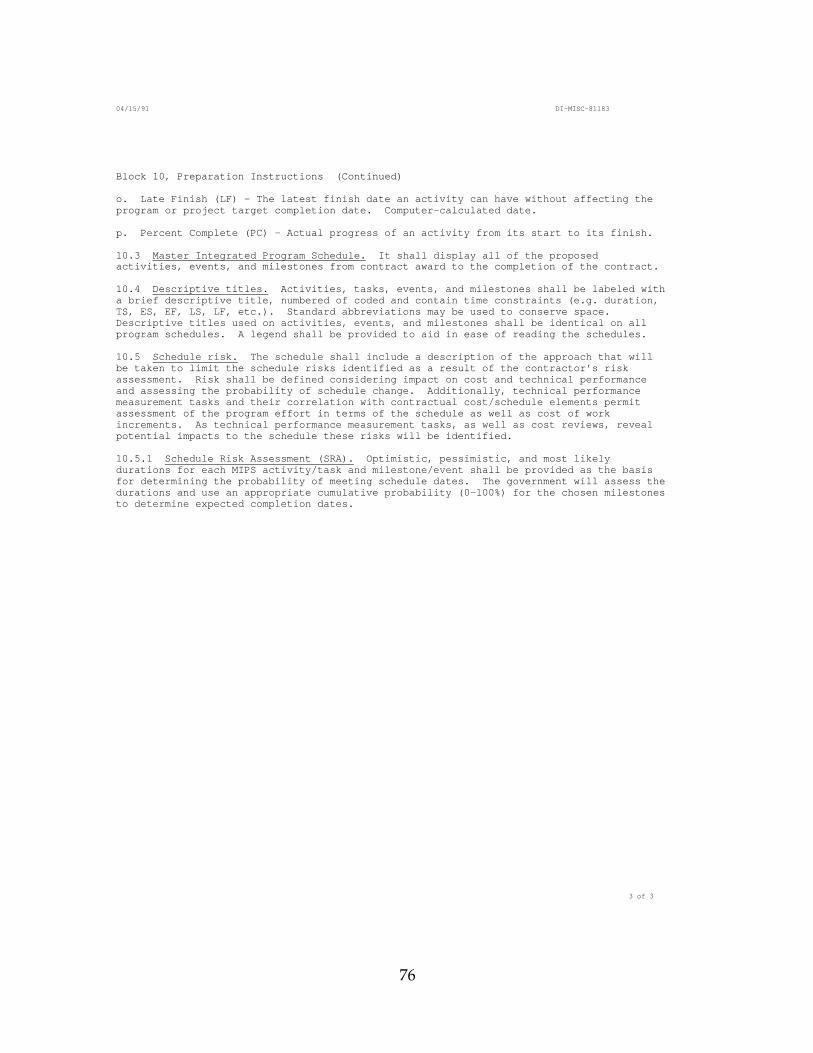
76
04/15/91 DI-MISC-81183
3 of 3
Block 10, Preparation Instructions (Continued)
o. Late Finish (LF) - The latest finish date an activity can have without affecting theprogram or project target completion date. Computer-calculated date.
p. Percent Complete (PC) - Actual progress of an activity from its start to its finish.
10.3 Master Integrated Program Schedule. It shall display all of the proposedactivities, events, and milestones from contract award to the completion of the contract.
10.4 Descriptive titles. Activities, tasks, events, and milestones shall be labeled witha brief descriptive title, numbered of coded and contain time constraints (e.g. duration,TS, ES, EF, LS, LF, etc.). Standard abbreviations may be used to conserve space.Descriptive titles used on activities, events, and milestones shall be identical on allprogram schedules. A legend shall be provided to aid in ease of reading the schedules.
10.5 Schedule risk. The schedule shall include a description of the approach that willbe taken to limit the schedule risks identified as a result of the contractor’s riskassessment. Risk shall be defined considering impact on cost and technical performanceand assessing the probability of schedule change. Additionally, technical performancemeasurement tasks and their correlation with contractual cost/schedule elements permitassessment of the program effort in terms of the schedule as well as cost of workincrements. As technical performance measurement tasks, as well as cost reviews, revealpotential impacts to the schedule these risks will be identified.
10.5.1 Schedule Risk Assessment (SRA).
Optimistic, pessimistic, and most likelydurations for each MIPS activity/task and milestone/event shall be provided as the basisfor determining the probability of meeting schedule dates. The government will assess thedurations and use an appropriate cumulative probability (0-100%) for the chosen milestonesto determine expected completion dates.

77
• Incomplete work
• A job poorly done that must be doneover
• Poor communications channels
• Uncontrolled telephone calls
• Lack of adequate responsibility andcommensurate authority
• Poor functional performance andstatus reporting
• Changes without direct notification/explanation
• Casual visitors and conversations
• Waiting for people
• Failure to delegate, or unwisedelegation
• Poor retrieval systems
• Lack of information in a ready-to-useformat
• Day-to-day administration
• Spending more time than anticipatedin answering questions
• Late appointments
• Impromptu tasks
• Having to explain “thinking” tosuperiors
• Too many levels of review
• Too many people in a small area
• Misplaced information
• Record keeping
• Shifting priorities
• Indecision or delaying decisions
• Procrastination
• Setting up appointments
• Too many meetings
• Monitoring delegated work
• Unclear roles/job descriptions
• Unnecessary crisis intervention
• Need to get involved in details to getjob done
• Not enough proven or trustworthymanagers
• Vague goals and objectives
• Too many people involved in minordecision making
• Lack of technical knowledge
• Lack of authorization to makejudgment decisions
• Unreasonable time constraints
• Lack of commitment from higherauthorities
• Too much travel
• Lack of adequate project managementtools
APPENDIX B
Common Time Robbers1

• Poor functional communications/ writing skills
• Inability to relate to peers in a personalway
• Rush into decisions/beat the deadline
• Lack of reward (“a pat on the back cando wonders”)
• Expecting too much from one’s staffand oneself
• Going from crisis to crisis
• Conflicting directives
• Fire drills
• Lack of privacy
• Lack of challenge in job duties
• Bureaucratic roadblocks (“ego”)
• Empire-building line managers
• Too much work for one person to handleeffectively
• Excessive paperwork
• Lack of clerical/administrative support
• Workload growing faster than capacity
78
• Dealing with unreliable subcontractors
• Personnel not willing to take risks
• Demand for short-term results
• Lack of long-range planning
• Being overdirected
• Overreacting management
• Poor lead time on projects
• Documentation (reports/red tape)
• Large number of projects
• Inadequate or inappropriate requirements
• Desire for perfection
• Lack of dedication by technical experts
• Lack of project organization
• Constant pressure
• Constant interruptions
• Project budget problems
• Shifting of functional personnel
• Lack of qualified manpower
1Harold Kerzner, Project Management, Van Norstand Reinhold, New York, NY, 1998, Chapter 6.
ENDNOTES

ACQUISITION STRATEGY — A busi-ness and technical management approachdesigned to achieve program objectiveswithin the resource constraints imposed. Itis the framework for planning, directing,contracting for, and managing a program.It provides a master schedule for research,development, test, production, fielding,modification, postproduction manage-ment, and other activities essential for pro-gram success. Acquisition strategy is thebasis for formulating functional plans andstrategies [e.g., test and evaluation masterplan (TEMP), acquisition plan (AP), com-petition, prototyping, etc.].
ACTIVITY — A task or measurableamount of work to complete a job or part ofa project.
ACTUAL COST OF WORK PER-FORMED (ACWP) — The costs actuallyincurred and recorded in accomplishingthe work performed within a given timeperiod.
ARROW DIAGRAM METHOD (ADM)— A type of network diagram that labelsthe activities on the lines connecting nodes.
BAR CHART — The detailed graphicalworking plan of a part providing sequenceand time for the job scheduled ahead andprogress to date.
BUDGETED COST OF WORK SCHED-ULED (BCWS) — The sum of the budgetsfor all work (work packages, planning pack-
79
ages, etc.) scheduled to be accomplished(including in-process work packages), plusthe amount of level of effort and appor-tioned effort scheduled to be accomplishedwithin a given time period. (Planned Value)
BUDGETED COST OF WORK PER-FORMED (BCWP) — A measurement ofwork performed in cost/schedule controlsystems criteria (C/SCSC) terminology.BCWP is a measurement of work per-formed as compared to the original plan.(Earned Value)
BUDGETING — The process of translat-ing resource requirements into a fundingprofile.
CRITICAL PATH METHOD (CPM) — Atechnique that aids understanding of thedependency of events in a project and thetime required to complete them. Delayedactivities that have an impact on the totalproject schedule are critical and said to beon the critical path.
EARNED VALUE MANAGEMENT SYS-TEM (EVMS) — An integrated manage-ment system that coordinates work scope,schedule, and cost goods and objectivelymeasures progress toward these goals. Itis based on an industry-developed set of32 guidelines adopted for use by DoD in1999 for evaluation of contractor manage-ment systems. A complete listing of theguidelines is contained in DoD 5000.2-R,Appendix VI.
APPENDIX C
GLOSSARY
FLOAT — The period of time that an activ-ity may be delayed without becoming acritical activity. Also known as slack orpath float/slack.
FREE FLOAT — The float that a singleactivity can experience without affectingany other activity.
GANTT CHART — A graphic portrayal ofa project which shows the activities to becompleted and the time to complete repre-sented by horizontal lines drawn in pro-portion to the duration of the activity. SomeGantt charts will be able to show the floatfor the activity.
INTEGRATED MASTER PLAN (IMP) —An event-based plan that depicts the over-all structure of the program and the keyprocesses, activities, and milestones. It de-fines the accomplishments and criteria foreach event in the plan.
INTEGRATED MASTER SCHEDULE(IMS) — The detailed task and timing ofthe work effort in the IMP. A networkedschedule that identifies all IMP events,accomplishment, and criteria, and the ex-pected dates of each.
INTEGRATED PRODUCT AND PRO-CESS DEVELOPMENT (IPPD) — A man-agement technique that simultaneouslyintegrates all essential acquisition activi-ties through the use of multidisciplinaryteams to optimize the design, manufactur-ing, and supportability processes. IPPDfacilitates meeting cost and performanceobjectives from product concept thoughteamwork through Integrated ProductTeams (IPTs).
INTEGRATED PRODUCT TEAM (IPT)— Team composed of representatives fromall appropriate functional disciplines work-ing together to build successful programs,identify and resolve issues, and makesound and timely recommendations to fa-cilitate decision making. There are threetypes of IPTs: overarching IPTs (OIPTs)focus on strategic guidance, program as-sessment, and issue resolution; workingIPTs (WIPTs) identify and resolve programissues, determine program status, and seekopportunities for acquisition reform; andprogram-level IPTs focus on program ex-ecution and may include representativesfrom both government and after contractaward industry.
LINE OF BALANCE (LOB) — A graphicdisplay of scheduled units versus actualunits produced over a given set of criticalschedule control points on a particular day.
MASTER PROGRAM SCHEDULE(MPS)—The top-level schedule for the pro-gram. It is prepared by the governmentand includes all policy and contractualevents/activities. It is derived from theProgram WBS and provides the baselinefor all subordinate schedules. It some-times is called the program structure/schedule.
MILESTONE (MS) — The point when arecommendation is made and approvalsought regarding starting or continuing(proceeding to next phase) an acquisitionprogram. Milestones are: 0 [Approval toConduct Concept Studies], I [Approval toBegin a New Acquisition Program], II [Ap-proval to Enter Engineering & Manufac-turing Development (EMD)], and III [Pro-duction or Fielding/Development andOperational Support (PF/DOS) approval].A significant event that marks certain
80

81
progress, such as completion of a phase ofthe project.
MILESTONE CHART — A graphicportrayal of a program/project that showsthe events to be completed on a timeline.
NETWORK SCHEDULE — A schedulingtechnique that provides the means for de-fining task relationships and relationshiplags. These may include such precedencerelationships as “Start to Start,” “Finish toFinish," and "Start to Finish."
PERT — See Program Evaluation ReviewTechnique.
PERT Chart — A graphic portrayal of mile-stones, activities, and their dependencyupon other activities for completion anddepiction of the critical path.
PRECEDENCE DIAGRAM METHOD —A network diagram in which the activitiesare labeled in the nodes, usually boxes.
PRODUCTION SCHEDULES — Chrono-logical controls used by management toregulate efficiently and economically theoperational sequences of production.
PROGRAM EVALUATION REVIEWTECHNIQUE (PERT) — A technique formanagement of a program from inceptionthrough to completion by constructing anetwork model of integrated activities andevents and periodically evaluating thetime/cost implications of progress.
RESOURCE LEVELING — A processwhereby resources are sorted out amongtasks and activities to identify and avoidconflicts between scheduling and avail-ability.
RISK — A measure of the inability toachieve program objectives within definedcost and schedule constraints. Risk is asso-ciated with all aspects of the program, e.g.,threat, technology, design processes, workbreakdown structure (WBS) elements, etc.It has two components: the probability offailing to achieve a particular outcome andthe consequences of failing to achieve thatoutcome.
RISK MANAGEMENT — All plans andactions taken to identify, assess, mitigate,and continuously track, control, and docu-ment program risks.
SCHEDULE — Series of things to be donein sequence of events within given period;a timetable.
SCHEDULE RISK — The risk that a pro-gram will not meet its acquisition strategyschedule objectives or major milestonesestablished by the acquisition authority.
SCHEDULE VARIANCE — A metric forthe schedule performance of a program. Itis the algebraic difference between earnedvalue (BCWP) and planned value (BCWS)(Variance = BCWP - BCWS). A positivevalue is a favorable condition while anegaive value is unfavorable.
SCHEDULING — The prescribing of whenand where each operation necessary to themanufacture of a product is to be per-formed.
WORK BREAKDOWN STRUCTURE(WBS) — An organized method to breakdown a project into logical subdivisions orsubprojects at lower and lower levels ofdetails. It is very useful in organizing aproject. See MIL-HDBK 881 for examplesof WBSs.

82

Q. W. Fleming, J. W. Bronn, and G. C.Humphreys, Project and Production Schedul-ing, Probus Publishing Co., Chicago, IL,1987.
H. Kerzner, Project Management: A SystemsApproach to Planning, Scheduling, and Con-trolling, Van Nostrand Reinhold, New York,NY, 1998.
M. D. Rosenau, Jr., Successful Project Man-agement: A Step-by-Step Approach With Prac-tical Examples (2nd Edition), Van NostrandReinhold, New York, NY, 1992.
D. C. Cleland, Field Guide to Project Manage-ment, Van Nostrand Reinhold, New York,NY, 1998.
J. J. Mayer, Time Management for Dummies(2nd edition), IDG Books Worldwide, Inc.,Foster City, CA, 1999.
Defense Systems Management College,Acquisition Strategy Guide, DSMC, FortBelvoir, VA, 1998.
APPENDIX D
BIBLIOGRAPHY
Defense Systems Management College,Earned Value Management Textbook, DSMC,Fort Belvoir, VA, April 16, 1998.
Office of the Under Secretary of Defense(Acquisition and Technology), DoD Inte-grated Product and Process Development Hand-book, DoD, Washington, DC, 1998.
D. T. Hulett, “Project Schedule Risk As-sessment,” Project Management Journal,March 1995.
PMI Standards Committee, A Guide to theProject Management Body of Knowledge,Project Management Institute, NewtonSquare, PA, 1996.
J. R. Knutson, How To Be A Successful ProjectManager, IEEE Successful ManagementSeries, Undated.
J.P. Lewis, Project Planning, Scheduling &Control, McGraw-Hill, New York, NY, 1995.
83

ii
DSMC PRESSWANTS TO HEAR FROM YOU
Please rate this publication in various ways using the following scores:4—Excellent 3—Good 2—Fair 1—Poor O—Does not apply
Name of this publication—Scheduling Guide for Program Managers
This publication:A._____ is easy to read.B._____ has a pleasing design and format.C._____ successfully addresses acquisition management and reform issues.D._____ contributes to my knowledge of the subject areas.E._____ contributes to my job effectiveness.F._____ contributes to my subordinate’s job effectiveness.G._____ is useful to me in my career.H._____ I look forward to receiving this publication.I._____ I read all or most of this publication.J._____ I recommend this publication to others in acquisition workforce.
How can we improve this publication? Provide any constructive criticism for us toconsider for the future.
What other DSMC publications do you read?
OPTIONALName/Title____________________________________________________________________Company/Agency______________________________________________________________Address______________________________________________________________________________________________________________________________________________________Work Phone ( )_________________DSN_________________FTS____________________Fax_____________________________Email________________________________________
_____Please mail me a brochure listing other DSMC publications._____Please send a free subscription to the following at the address above. _____Acquisition Review Quarterly _____Acquisition Reform Today Newsletter
Copy this form and fax it to DSMC Press at (703) 805-2917.
84

iii
Back to DAU Publications
Back to DSMC Publications