scheduling traffic signal maintenance - purdue university
TRANSCRIPT

Scheduling Traffic Signal Maintenance
T horold G. Smith Research Assistant
J. C. Oppenlander Research Engineer
Joint Highway Research Project Purdue University
IN T R O D U C T IO N
A major responsibility of highway engineers is to provide for the public a highway system capable of accommodating vehicle and pedestrian travel in a safe, efficient, and economic manner. In developing this highway system, the engineer is responsible for the planning, design, construction, operation, and maintenance of that system.
In many instances the maintenance function is relegated to a minor position. Limitations in the available resources, coupled with the expansion of the planning, design, and construction operations to keep pace with the increasing traffic demands, have resulted in a situation where funds and efforts, which are necessary for the maintenance of existing facilities, have been diverted to other tasks. In addition, past experiences indicate some difficulty in interesting engineers in the area of maintenance operations. The result is a shortage of qualified men and other resources in a field on which the continued operation of the highway system is predicated.
In the past maintenance engineers have used rule-of-thumb warrants, personal experience, or component analysis to determine the maintenance program that utilizes the expected budget allowances. Recent advances in the fields of systems analysis and computer technology have provided the engineer with the tools necessary to analyze various maintenance situations. A complete analysis of all related factors enables the maintenance engineer to optimize the use of available men, money, and equipment and to insure the proper and safe operation of the system.
The traffic engineer is concerned with a maintenance program applicable to traffic signals and flashers. Signal reliability is a necessity because failures create hazards to life and property and increase the maintenance costs by requiring men and equipment for emergency repairs.
180
181
A preventive maintenance program reduces the number of traffic signal failures and insures the accurate operation of the controllers. However, the formulation of such a program is beyond the intuitive comprehension of any individual because of the number and locations of the traffic signals involved. Systems analysis techniques and high-speed electronic computers permit the formulation of a traffic signal and flasher maintenance program that relates each component to the total operation of the system.
The purpose of this investigation was to develop a comprehensive traffic signal and flasher maintenance program that was both economical and practical for a typical maintenance district in a state highway department. All phases of the emergency and preventive maintenance operations were analyzed to determine the best maintenance program. The optimum lamp replacement, involving the determination of the proper time intervals for scheduling group lamp replacements and the most economic lamp life, was ascertained. The shortest routes for preventive maintenance operations were determined for several maintenance alternatives, and by comparing the anticipated annual costs, the most economic option was revealed. The staff necessary for effective traffic signal and flasher operation was ascertained for the maintenance activities performed by state personnel. (6)*
A scientific maintenance program enables the traffic engineer to discharge his principal assignment of providing safe, efficient, and economic travel by insuring that the traffic signals and flashers are dependable and operating in accordance with the predetermined schedules. The investment in traffic control devices is protected by eliminating the deterioration of equipment and the resulting costly failures caused by a policy of neglect. Traffic signals that are clean, well painted, and in proper working condition provide the traffic engineering profession with a medium for establishing good public acceptance.
R EV IEW OF L IT E R A T U R E
The subject of maintenance appears frequently in industrial trade magazines but rather infrequently in traffic engineering literature. This literature review is confined to those articles which apply directly to the problems of traffic signal and flasher maintenance.
Traffic Signal Maintenance ProceduresSeveral papers and reports have been written on the subject of
traffic signal maintenance. These publications have generally been
* Numbers in parentheses refer to items listed in the Bibliography.

182
prepared as guides or suggestions in the formulation of routine maintenance programs.
A primary concern of most maintenance programs is determining the optimal period for the replacement of traffic signal lamps. The American Association of State Highway Officials (A.A.S.H.O.) recommends a regular lamp replacement schedule that is less than the rated (average) lamp life. The factors involved in the economic determination of scheduling group lamp replacements are:
1. Failure probabilities for lamps with different rated lives,2. The effect on lamp life of the difference between the voltage at
the lamp socket and the rated voltage for the lamp, and3. The reduction of lamp life expectancy due to the vibrations in
normal operation and lamp handling. (4)F. J. Meno concurs with the A.A.S.H.O. policy and reports that if
the optical units (lenses, lamps, and reflectors) are regularly cleaned, it is possible to apply up to five volts less than the rated lamp voltage without suffering poor visibility. This policy has the effect of lengthening the actual rated lamp life under field conditions. (5) The relationship of voltage to lamp life, wattage, and lumens of outputs is illustrated in Fig. 1. (3)
The controller is the next item to be considered in a comprehensive traffic signal maintenance program. Controllers must be periodically serviced to assure effective operation. The American Association of State Highway Officials stipulates that controllers shall be carefully cleaned and serviced at least as frequently as specified by the manufacturers and more frequently if experience proves it necessary. (4) Each unit in the signal system including all master controllers should receive a yearly in-shop overhaul. This complete renovation includes cleaning, lubricating, and replacing all worn parts. The controllers are then tested to determine their reliability and operating characteristics. (2) Controllers are most reliable when cleaned and checked for wear at least every six months. (5)
To maintain the effectiveness of the traffic signal as a traffic control device, it is necessary to consider periodic cleaning of the lamps, reflectors and lenses. Optical units that are not regularly cleaned have a 60 to 80 percent reduction in visibility over a period of years. (5) In air that is relatively free from dust and corrosive industrial exhausts, the loss of light may be considered similar to the performance of closed street light fixtures. A.A.S.H.O. suggests that the optical units should be cleaned at least once every six months and that the lenses and reflectors should always be cleaned when the lamps are replaced, unless the last regular cleaning has been very recent. (4)

183
Fig. 1. Effect of voltage on incandescent lamp life, lumens and wattage. (From: Lighting Maintenance Manual, Champion Lamp Works)
The last phase in a comprehensive maintenance program is to schedule periodic painting of the traffic signal equipment at intersection locations. Painting is necessary to protect the traffic signal from rust and corrosion and to assure that the traffic signal appears clean and well maintained. All traffic signal appurtenances above the ground should be painted at least once every two years, and the painting should be more often if it is needed to prevent corrosion and to maintain a good appearance. (4)
Minimum Path Algorithms
To find the best maintenance program for traffic signals in a maintenance district, it is necessary to plan and schedule preventive maintenance operations to minimize the total travel distance. The most common method of optimizing travel distance is to use minimum path algorithms.

184
Until recent years mathematical approaches to the minimum path problem were abandoned because numerous calculations were necessary. In most cases the vast number of calculations required negated any benefits derived from knowing the minimum path. However, the use of computers and data processing equipment permits a feasible determination of optimum routes.
Before an optimum path can be determined, criteria for measuring the path must be established. Although the desired objective is to maximize economic and social benefits as well as road user good will and satisfaction, it is presently not possible to evaluate these criteria. The elements recommended for determining the minimum path are distance, time, or travel cost.
Routing problems are classified into two groups. The first category involves point-to-point paths; that is, the shortest route between two points is determined. The location of the shortest route is only a problem where there are a number of paths and the shortest route is not obvious.
The second class of minimum path problems involves visiting a number of points connected by the shortest possible route. This situation is analogous to the problem of a salesman who has to call on a number of customers in different locations before returning home. A salesman starting in one city wishes to visit each of n-1 other cities once and then return to the original city while traveling the shortest possible distance for the entire tour. This travel can be accomplished in (n-1) ! possible tours, one or more of which is a minimum solution.
PRO CED U RE
The traffic signal maintenance activities in a selected maintenance district were observed to determine the time patterns of maintenance characteristics. Maintenance of traffic signals was formulated into a system of related components to permit the development of an optimum traffic signal maintenance program in the study district. Statistical estimations and various statistical tests were used to appraise the findings and to develop the necessary relationships.
Site SelectionThe Crawfordsville maintenance district in the State of Indiana
was selected for this problem of scheduling traffic signal maintenance. This maintenance district contains the three principal urban centers of Terre Haute, Lafayette, and West Lafayette. The remainder of this district is predominantly rural with a number of small cities and towns. Both preventive and emergency maintenance activities are performed

185
in the three major cities by contractors, except in West Lafayette where state forces are responsible for the preventive maintenance.
The distribution of traffic control devices in this maintenance district is presented in the following outline and is illustrated in Fig. 2:
Fig. 2. Traffic signal locations in the Crawfordsville maintenance district.
186
1. Lafayette—21 signals and 1 flasher,2. Terre Haute—40 signals and 4 flashers,3. West Lafayette— 13 signals, and4. Remainder of the district—56 signals and 42 flashers.
Data CollectionBecause little information was available on the maintenance of
traffic signals, data were collected on the personnel and equipment used, the distance traveled, the work performed, the type and number of parts replaced, and the time required for the daily maintenance of traffic signals in the Crawfordsville district. These data were analyzed to give estimates of the observed maintenance conditions for this study area. Models approximating the actual maintenance were formulated, and the optimum traffic signal maintenance program was determined by using these mathematical representations.
Lamp ReplacementTwo steps were involved in building a model that predicts the
optimal lamp replacement time. A probabilistic expression was first developed to approximate the expected traffic signal lamp operation. Several assumptions were made to formulate this expression. All traffic signal lamps, regardless of the rated life, have the same type of failure curve. Therefore, lamp mortality curves that are based on percentage of rated life can be used for all traffic signal lamps.
The actual life of a lamp used in the field was assumed to have a service life that is 10 percent less than the rated life. These ratings are based on lamp tests conducted under ideal laboratory conditions, which vary considerably from those experienced in the field. Power surges and vibrations caused by handling, wind, and traffic are the principal causes of the differential between the rated lamp life and the actual life. To account for this variation, the rated lamp life is often reduced by 20 percent if the field conditions are very severe and by 10 percent if these conditions are normal.
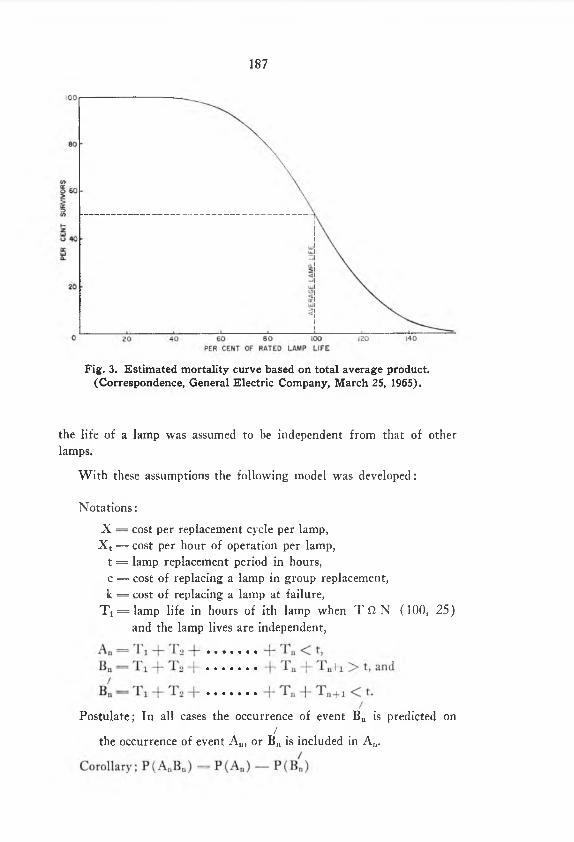
The mortality curve, as developed by the General Electric Company and shown in Fig. 3, was assumed to be normally distributed with a mean of 100 percent for the rated life and with a standard deviation of 25 percent. A Chi-square test was used to determine if this curve followed a normal distribution. The results of this test produced a calculated Chi-square of 0.0043. This value is not significant at the 5-percent level with 27 degrees of freedom. Therefore, the mortality curve of traffic signal lamps was considered as a normal distribution in the rest of this investigation. In addition to the assumption of normality,
187
Fig. 3. Estimated mortality curve based on total average product. (Correspondence, General Electric Company, March 25, 1965).
the life of a lamp was assumed to be independent from that of other lamps.
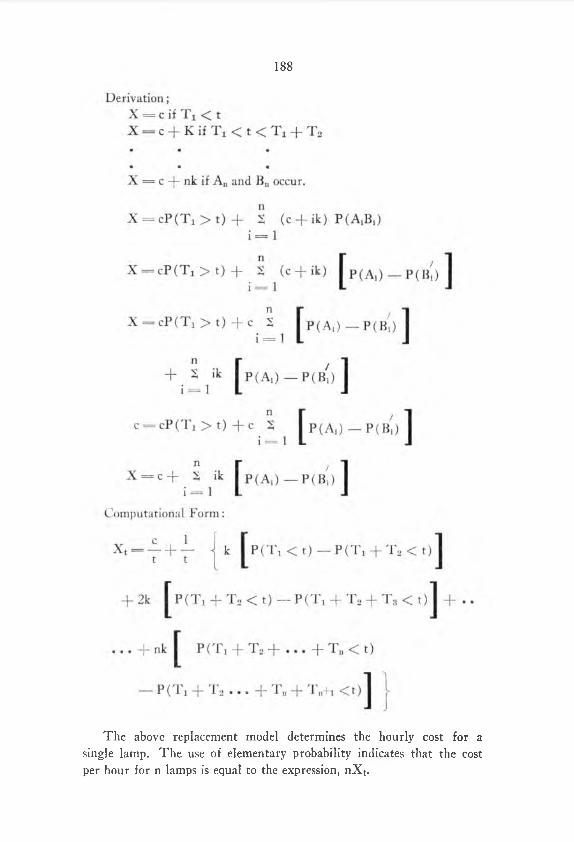
W ith these assumptions the following model was developed:
Notations:
X = cost per replacement cycle per lamp,X t = cost per hour of operation per lamp,
t = lamp replacement period in hours, c = cost of replacing a lamp in group replacement, k = cost of replacing a lamp at failure,
Tj = lamp life in hours of ith lamp when T f i N (100, 25) and the lamp lives are independent,
Postulate; In all cases the occurrence of event Bn is predicted on
the occurrence of event An, or Bn is included in An.
188
The above replacement model determines the hourly cost for a single lamp. The use of elementary probability indicates that the cost per hour for n lamps is equal to the expression, nXt.
189
The second step in the formulation of the replacement model is to determine the group and the failure replacement costs. The cost of traffic signal lamps is an important consideration in calculating the replacement costs. Lamps in the 60- to 69-watt range with rated lives of 2000 to 8000 hr are of primary interest to the maintenance personnel in the Crawfordsville district. The prices of these lamps vary linearly with the rated lamp life as shown by the function:
Y = 0.00 IX + 28.5where Y = cost per lamp in cents, and
X = rated lamp life in hours.Governmental agencies are given a discount of about 50 percent
when large quantities of traffic signal lamps are purchased. As a result of this discount, the function estimating the lamp cost for the State of Indiana can be expresesed as:
Y — 0 .0005X + 14.25The cost of replacing a lamp in a group replacement program was
then determined. In the Crawfordsville maintenance district 1896 lamps are presently maintained by state personnel. The total time required to change lamps on a group replacement program, including travel time, is 130 hr. The development of this group replacement program is presented in the “Results.” The cost of replacing a lamp in a group replacement program for the Crawfordsville maintenance district is shown in Table 1.
The cost of changing a lamp at failure is the next step in preparing information for the lamp replacement model. The mean distance of the lamps from the district maintenance office was calculated. In determining the average distances for the Crawfordsville district, the lamps were classified by their uses. The average distance from Crawfordsville is 36.26 miles for the lamps used in flashers. The mean distance of the lamps used in traffic signals is 30.66 miles from Crawfordsville. A weighted mean of 31.20 miles was calculated by pooling all lamps used to estimate the average distance of lamps from the maintenance headquarters in Crawfordsville.
An estimation of the travel time is required to determine the costs for lamp replacement at failure. The relationship expressing the distance traveled in minutes is :
Yc = 1.437X + 7.775where Yc = travel time in minutes, and
X = distance traveled in miles.
The development of this function is presented in the “Optimal Sequencing for Preventive Maintenance” section of the “Procedure.”
190
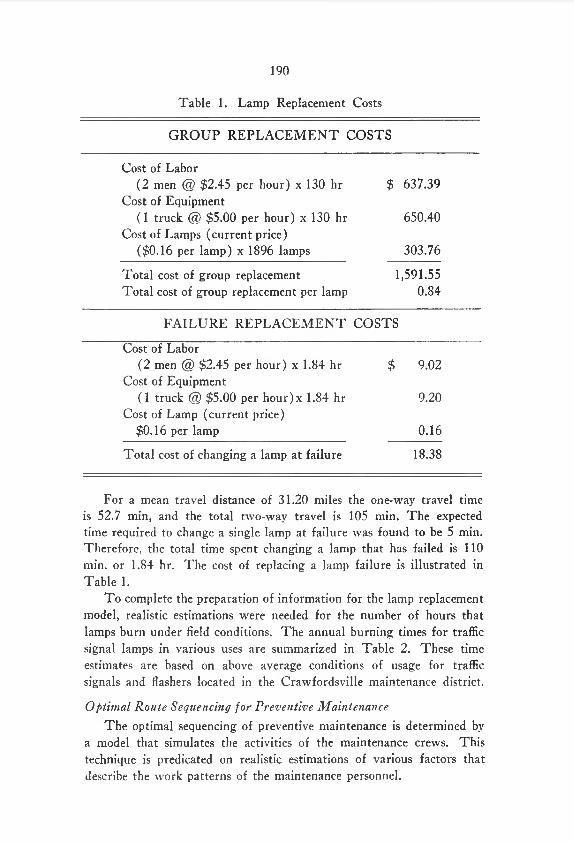
Table 1. Lamp Replacement Costs
G R O U P R E PL A C E M E N T COSTS
Cost of Labor(2 men @ $2.45 per hour) x 130 hr
Cost of Equipment(1 truck @ $5.00 per hour) x 130 hr
Cost of Lamps (current price)($0.16 per lamp) x 1896 lamps
$ 637.39
650.40
303.76
Total cost of group replacement Total cost of group replacement per lamp
1,591.550.84
FA ILU RE R E PL A C E M E N T COSTS
Cost of Labor(2 men @ $2.45 per hour) x 1.84 hr
Cost of Equipment(1 truck @ $5.00 per hour)x 1.84 hr
Cost of Lamp (current price)$0.16 per lamp
$ 9.02
9.20
0.16
Total cost of changing a lamp at failure 18.38
For a mean travel distance of 31.20 miles the one-way travel time is 52.7 min, and the total two-way travel is 105 min. The expected time required to change a single lamp at failure was found to be 5 min. Therefore, the total time spent changing a lamp that has failed is 110 min. or 1.84 hr. The cost of replacing a lamp failure is illustrated in Table 1.
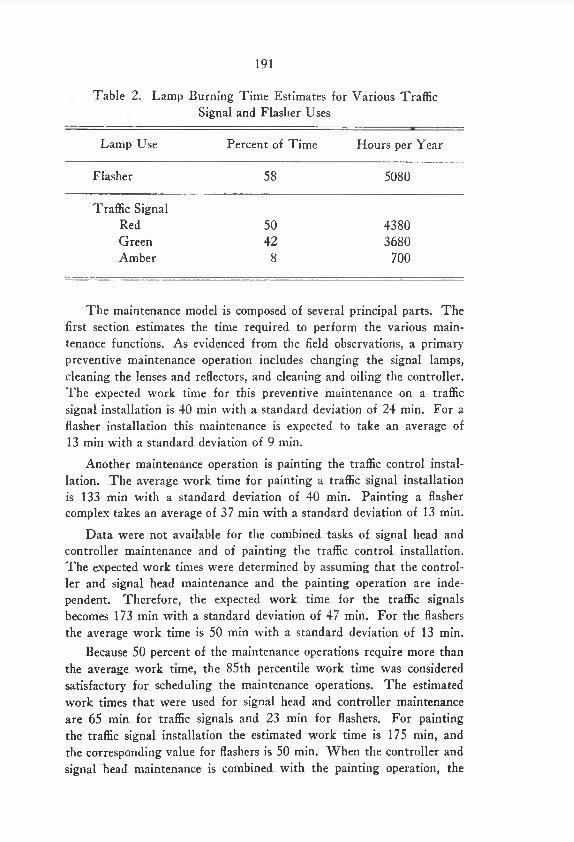
To complete the preparation of information for the lamp replacement model, realistic estimations were needed for the number of hours that lamps burn under field conditions. The annual burning times for traffic signal lamps in various uses are summarized in Table 2. These time estimates are based on above average conditions of usage for traffic signals and flashers located in the Crawfordsville maintenance district.
Optiriial Route Sequencing for Preventive MaintenanceThe optimal sequencing of preventive maintenance is determined by
a model that simulates the activities of the maintenance crews. This technique is predicated on realistic estimations of various factors that describe the work patterns of the maintenance personnel.
191
Table 2. Lamp Burning Time Estimates for Various Traffic Signal and Flasher Uses
Lamp Use Percent of Time Hours per Year
Flasher 58 5080
Traffic SignalRed 50 4380Green 42 3680Amber 8 700
The maintenance model is composed of several principal parts. The first section estimates the time required to perform the various maintenance functions. As evidenced from the field observations, a primary preventive maintenance operation includes changing the signal lamps, cleaning the lenses and reflectors, and cleaning and oiling the controller. The expected work time for this preventive maintenance on a traffic signal installation is 40 min with a standard deviation of 24 min. For a flasher installation this maintenance is expected to take an average of 13 min with a standard deviation of 9 min.
Another maintenance operation is painting the traffic control installation. The average work time for painting a traffic signal installation is 133 min with a standard deviation of 40 min. Painting a flasher complex takes an average of 37 min with a standard deviation of 13 min.
Data were not available for the combined tasks of signal head and controller maintenance and of painting the traffic control installation. The expected work times were determined by assuming that the controller and signal head maintenance and the painting operation are independent. Therefore, the expected work time for the traffic signals becomes 173 min with a standard deviation of 47 min. For the flashers the average work time is 50 min with a standard deviation of 13 min.
Because 50 percent of the maintenance operations require more than the average work time, the 85th percentile work time was considered satisfactory for scheduling the maintenance operations. The estimated work times that were used for signal head and controller maintenance are 65 min for traffic signals and 23 min for flashers. For painting the traffic signal installation the estimated work time is 175 min, and the corresponding value for flashers is 50 min. When the controller and signal head maintenance is combined with the painting operation, the
192
expected work times are 220 and 64 min, respectively, for traffic signal and flasher installations.
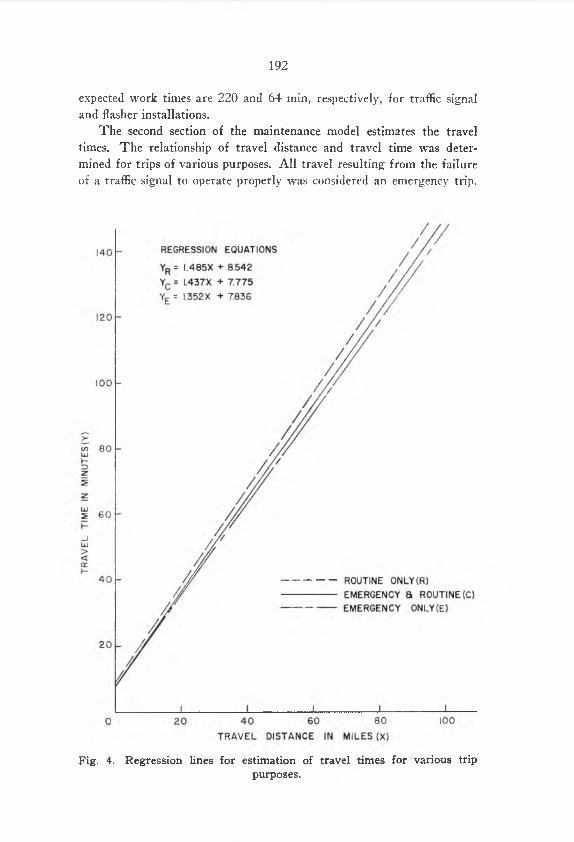
The second section of the maintenance model estimates the travel times. The relationship of travel distance and travel time was determined for trips of various purposes. All travel resulting from the failure of a traffic signal to operate properly was considered an emergency trip.
Fig. 4. Regression lines for estimation of travel times for various trippurposes.
193
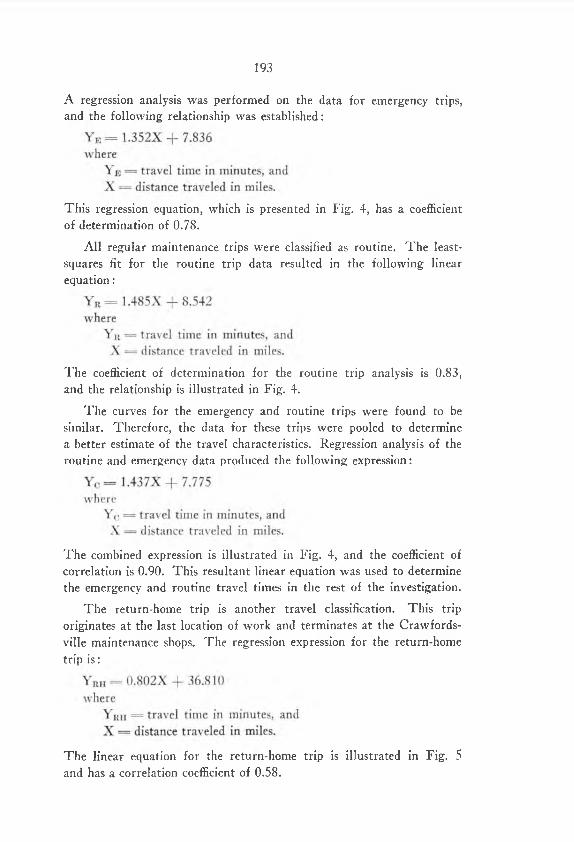
A regression analysis was performed on the data for emergency trips, and the following relationship was established:
This regression equation, which is presented in Fig. 4, has a coefficient of determination of 0.78.
All regular maintenance trips were classified as routine. The least- squares fit for the routine trip data resulted in the following linear equation:
The coefficient of determination for the routine trip analysis is 0.83, and the relationship is illustrated in Fig. 4.
The curves for the emergency and routine trips were found to be similar. Therefore, the data for these trips were pooled to determine a better estimate of the travel characteristics. Regression analysis of the routine and emergency data produced the following expression:
The combined expression is illustrated in Fig. 4, and the coefficient of correlation is 0.90. This resultant linear equation was used to determine the emergency and routine travel times in the rest of the investigation.
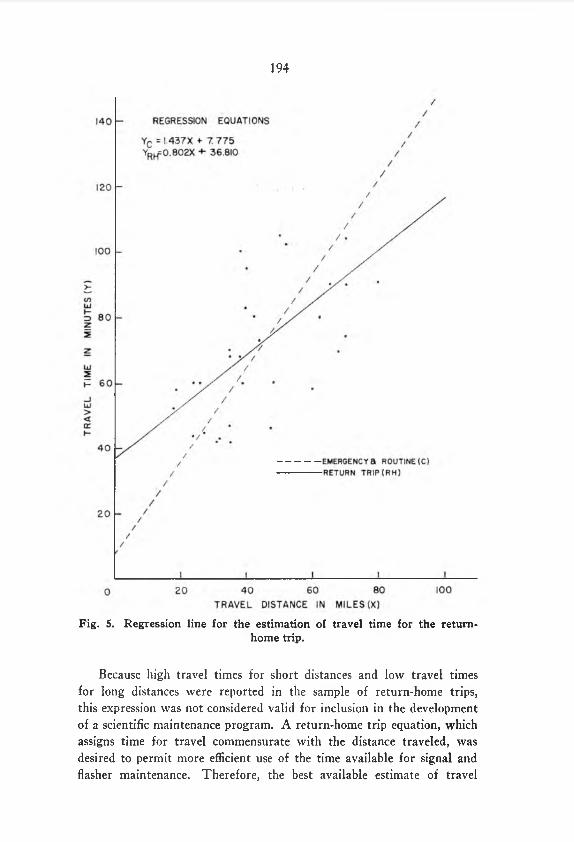
The return-home trip is another travel classification. This trip originates at the last location of work and terminates at the Crawfords- ville maintenance shops. The regression expression for the return-home trip is:
The linear equation for the return-home trip is illustrated in Fig. 5 and has a correlation coefficient of 0.58.
194
Fig. 5. Regression line for the estimation of travel time for the return-home trip.
Because high travel times for short distances and low travel times for long distances were reported in the sample of return-home trips, this expression was not considered valid for inclusion in the development of a scientific maintenance program. A return-home trip equation, which assigns time for travel commensurate with the distance traveled, was desired to permit more efficient use of the time available for signal and flasher maintenance. Therefore, the best available estimate of travel
195
time is the expression determined for the pooled emergency and routine trip data. This relationship is shown by the dashed line in Fig. 5. Reasonable agreement is evident with the data collected on travel times and distances for the return-home travel.
The third phase of the maintenance model involves the selection of the minimum path for a proposed routine maintenance schedule. Preparation of information for the minimum path algorithm is predicated on several conditions. The locations of all traffic signals and flashers within the study area must be known. These locations were identified, and those signals clustered in a city or town were grouped to form a node (signal node) with signals and flashers. This grouping wTas performed because the signals in a community are so close that any attempt to find an optimal routing within the city would produce only marginal benefits. The order of maintaining the signals within a town is left to the discretion of the work crew. However, the number of signals that are maintained in a day are specified to permit the maximum utilization of the working day. The isolated traffic signal and flasher locations were considered as signal nodes with either one traffic signal or one flasher.
The output of the minimum path analysis was divided in two parts. A series of minimum path trees from each signal node to every other node in the district was first obtained. These trees were used to determine the shortest routes among signal nodes. Isotime lines were computed from these trees to provide time estimates from nodes of interest. The minimum path tree and isotime lines emanating from Crawfordsville are geographically illustrated in Fig. 6 for the signal and flasher locations in the study area.
The second part of the output was a matrix of the shortest distances to and from all signal nodes. A traveling salesman algorithm, using the matrix of shortest distances, considered each proposed tour and determined the best routing sequence for the signal maintenance programs that were investigated in this operational study. The first program schedules signal head and controller maintenance at six-month intervals. Painting is planned as a separate operation on a two-year schedule. The second alternative schedules signal head and controller maintenance three times in a two-year period. A fourth routine maintenance cycle in this two-year period combines painting with signal head and controller maintenance.
Several trial solutions were made for the alternative signal maintenance programs. All possible combinations of signals and flashers were not tested because of the large number of required calculations. Although optimality is not guaranteed for the maintenance alternatives, the results of this testing procedure approach optimal solutions because the minimum

196
Fig, 6. Minimum path tree and isotime lines for travel emanating fromCrawfordsville.
path tree and isotime lines emanating from Crawfordsville were used to guide the selection of signal node groups. The groups of signal nodes, called daily tours, constituted the numbers and locations of traffic sig
197
nals and flashers that are maintained in a single day for a proposed maintenance schedule. A complete maintenance schedule is composed of all daily tours.
After the analysis of the daily tours was completed, the proposed solutions were altered to optimize more fully the available working time. This process was continued until the feasible solution could no longer be improved. The best solution for each maintenance alternative was selected using the following criteria:
1. The work was completed in the minimum number of days,2. The distance traveled was a minimum, and3. Maintenance was scheduled to utilize the available time in a
work day.Then, the total cost for each alternative was determined and compared on an annual-cost basis.
StaffingA vital part of a comprehensive signal maintenance program involves
the determination of the staff necessary to insure proper signal operation. The optimal lamp replacement periods and the maintenance sequencing can be determined, but if there is an insufficient maintenance staff, the proposed maintenance program is not utilized to its fullest advantage.
The staffing was determined for those locations within the Craw- fordsville maintenance district which are maintained by State personnel. Lafayette, Terre Haute, and West Lafayette were not included because the signal maintenance is performed in these cities by contractors. If the maintenance responsibilities are delimited in this manner, it is reasonable to assume that the traffic signals and flashers are uniformly distributed throughout that portion of the maintenance district being considered. The average distances of signal installations from Crawfordsville were used to estimate the travel distances for the emergency operations. The mean distance from Crawfordsville for traffic signals is 30.66 miles, and the average distance is 36.26 miles for flashers.
The average times required for travel to the site of a failure were computed from the derived formula as 52.7 min for traffic signals and 60.1 min for flashers. Two-way travel times were used in this investigation for two reasons. First, the travel to and from the failure site is part of the total time required for the emergency maintenance operation. Second, when two failures are corrected without returning to Crawfordsville between the operations, the total travel time is approximated by two round trips. Therefore, the round-trip travel times assigned for the traffic signal and flasher repair operations are 105.4 and 102.2 min, respectively.
198
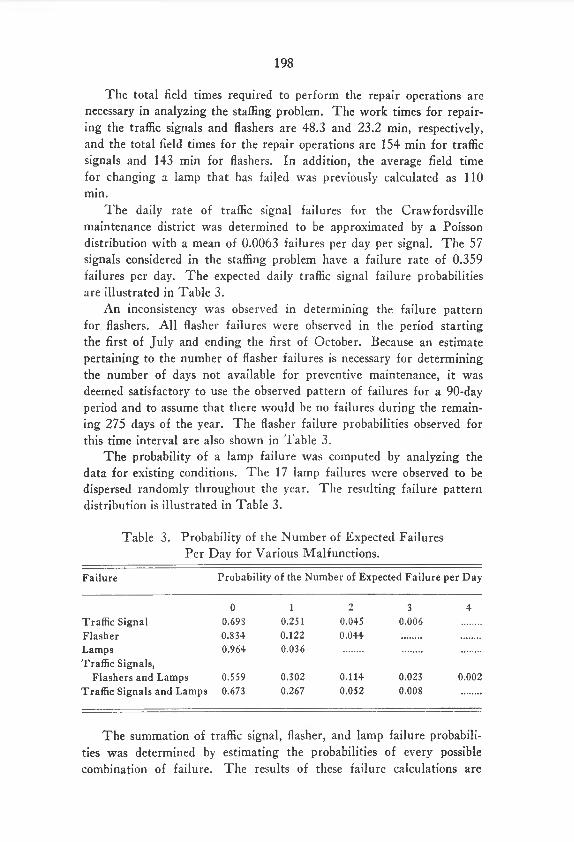
The total field times required to perform the repair operations are necessary in analyzing the staffing problem. The work times for repairing the traffic signals and flashers are 48.3 and 23.2 min, respectively, and the total field times for the repair operations are 154 min for traffic signals and 143 min for flashers. In addition, the average field time for changing a lamp that has failed was previously calculated as 110 min.
The daily rate of traffic signal failures for the Crawfordsville maintenance district was determined to be approximated by a Poisson distribution with a mean of 0.0063 failures per day per signal. The 57 signals considered in the staffing problem have a failure rate of 0.359 failures per day. The expected daily traffic signal failure probabilities are illustrated in Table 3.
An inconsistency was observed in determining the failure pattern for flashers. All flasher failures were observed in the period starting the first of July and ending the first of October. Because an estimate pertaining to the number of flasher failures is necessary for determining the number of days not available for preventive maintenance, it was deemed satisfactory to use the observed pattern of failures for a 90-day period and to assume that there would be no failures during the remaining 275 days of the year. The flasher failure probabilities observed for this time interval are also shown in Table 3.
The probability of a lamp failure was computed by analyzing the data for existing conditions. The 17 lamp failures were observed to be dispersed randomly throughout the year. The resulting failure pattern distribution is illustrated in Table 3.
Table 3. Probability of the Number of Expected Failures Per Day for Various Malfunctions.
Failure Probability of the Number of Expected Failure per Day
0 1 2 3 +Traffic Signal 0.698 0.251 0.045 0.006Flasher 0.83+ 0.122 0.0+4Lamps 0.96+ 0.036Traffic Signals,
Flashers and Lamps 0.559 0.302 0.11+ 0.023 0.002Traffic Signals and Lamps 0.673 0.267 0.052 0.008
The summation of traffic signal, flasher, and lamp failure probabilities was determined by estimating the probabilities of every possible combination of failure. The results of these failure calculations are
199
presented in Table 3. In a similar manner, the failure probabilities were obtained for the situation when only traffic signal and lamp failures are expected, and the results of these calculations are also summarized in Table 3.
A weighted mean which represents the daily average repair time was determined by using the failure probabilities shown in Table 3 and the expected field repair times of 154 min for traffic signals, 143 min for flashers, and 110 min for lamps. The results of these calculations are tabulated as follows:
Daily Average Repair Times Traffic Signals, Flashers 85.9 min
and Signal LampsTraffic Signals and Signal 58.8 min
LampsThe stall required to correct the expected signal failures could be
determined by an economic analysis if a failure penalty were determined. However, no penalty was assessed because of the difficulty in assigning realistic costs for accidents and delays caused by signal failures. The staff required to satisfactorily perform the necessary maintenance operations was determined by considering the following factors:
1. The failure probabilities expressed in Table 3.2. The average daily repair times,3. The anticipated time required to perform the preventive main
tenance operations, and4. The suitability of certain seasons for preventive maintenance
operations.The total time available for the preventive maintenance operations was calculated, and a decision was made concerning the stall required to perform the maintenance operations in the time allocated.
R E S U L T SAll phases of the emergency and preventive maintenance operations
for the Crawfordsville district were analyzed to determine the optimal maintenance program. The optimum lamp replacement program, involving the determination of the proper time intervals for scheduling group lamp replacement and the most economic lamp life, was ascertained from the results of the lamp replacement model. The shortest routes for preventive maintenance operations were determined for several maintenance alternatives, and by comparing the anticipated annual costs, the most economic option was revealed. The staff necessary for effective traffic signal and flasher operation was obtained for those installations maintained by State personnel.
200
Lajnp ReplaceinentThe lamp replacement model was designed to produce results ap
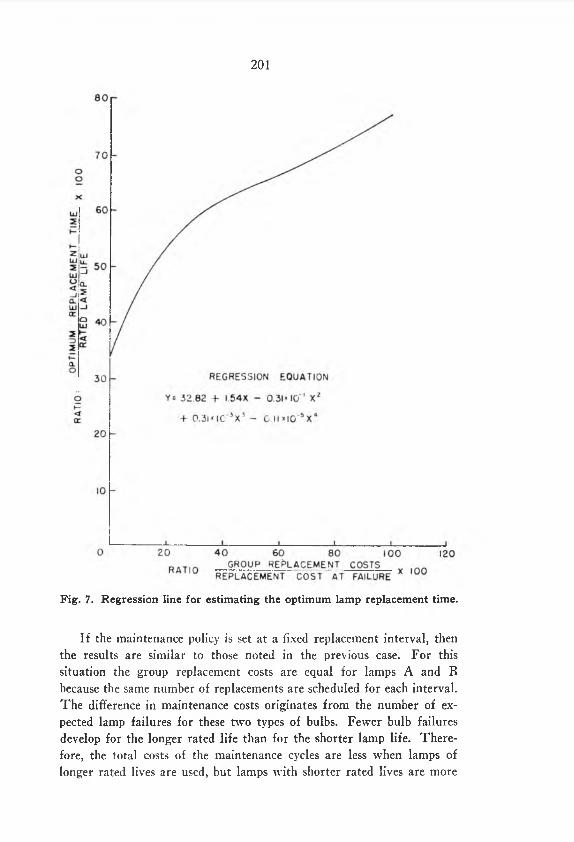
plicable to both the general lamp replacement problem and the conditions observed for the Crawfordsville maintenance district. The optimal lamp replacement periods were determined for various ratios of replacement costs (group replacement versus replacement at failure). The optimal lamp replacement times were analyzed by regression methods to determine a curve that estimates the observed conditions. The optimum lamp replacement intervals were best predicted by the significant terms in the following relationship:
Y = 32.82 + 1.54X — 0.31 X l O ^ + O Jl X 10'-»x8— o .ii x io~5x4
whereY = (the ratio of optimum replacement time to rated lamp life)
x 100, andX = (the ratio of group replacement cost to replacement cost at
failure) x 100.This regression curve, which is graphically illustrated in Fig. 7, was fitted to the observed data with a standard error of estimate equal to 1.10 percent.
The relationship expressing the optimum replacement period as a function of the ratio of replacement costs can be used to determine the best group replacement time for lamps used in traffic signals and flashers. The general usage of this function is restrained by the manner in which the lamp failures are corrected. The assumption concerning lamp failures used in this analysis is that lamps are immediately replaced upon failure.
Annual cost calculations were performed for various rated lamp lives using the replacement model developed in the procedural section on Lamp Replacement. The lamps with longer rated lives have lower annual maintenance costs than those with shorter rated lives. The following example demonstrates the validity of the observed results concerning annual maintenance costs.
1. Compare two lamps where lamp A has twice the rated life of lamp B.
2. Change all lamps at 50 percent of the rated lamp life.
If the costs per replacement cycle for lamps A and B are equal, a valid comparison of the maintenance costs is obtained by prorating these costs for each lamp type over a given unit of time. Therefore, the maintenance costs using lamp B are twice those of lamp A, because bulb B requires two maintenance cycles for every cycle of bulb A.
201
Fig. 7. Regression line for estimating the optimum lamp replacement time.
If the maintenance policy is set at a fixed replacement interval, then the results are similar to those noted in the previous case. For this situation the group replacement costs are equal for lamps A and B because the same number of replacements are scheduled for each interval. The difference in maintenance costs originates from the number of expected lamp failures for these two types of bulbs. Fewer bulb failures develop for the longer rated life than for the shorter lamp life. Therefore, the total costs of the maintenance cycles are less when lamps of longer rated lives are used, but lamps with shorter rated lives are more
202
economically employed when the anticipated burning times are very short. This finding is based on the fact that the anticipated savings in lamp failure costs resulting from using longer life lamps are not offset by increased purchase prices of these bulbs.
The analysis of the maintenance conditions was performed for several lamp replacement alternatives. Two rated lamp lives of 6000 and 8000 hr were considered in this investigation. The 8000-hr lamp was studied because it has the longest rated lamp life that concurred with the voltage and wattage requirements of the study district. The 6000-hr lamp was included in the analysis because the 8000-hr lamp is not acceptable by A.A.S.H.O. standards. The lamp in question was rated at 575 lumens, and the American Association of State Highway Officials indicates that 665 lumens are necessary for 8000-hr bulbs. (1)
These lamps were applied to several group replacement programs. The first lamp replacement alternative closely approximates replacing the individual lamps used in traffic signals (red, green, and amber) and flashers at the optimum intervals determined by the curve in Fig. 7. Analysis of this replacement option necessitated the reappraisal of the group replacement costs which were established in the procedure for estimating the total cost of replacing all lamps in the same preventive maintenance cycle. Certain elements of the group replacement program, which includes travel time and controller maintenance, are performed regardless of the number of lamps replaced at a signal location. Because the optimal replacement period for lamps used in flashers and in the red position of traffic signals was approximately the same, the total travel time for the best routing sequence was used for every maintenance cycle. However, the computations were performed by distributing the total travel time in proportion to the number of traffic signals and flashers in the study district.
The times for changing lamps and for controller maintenance were allocated in a manner consistent with the anticipated work for each maintenance cycle. The maintenance time for flashers was unchanged because the complete maintenance operation was performed for each scheduled cycle. The traffic signals required allocations of maintenance times because all lamps are not scheduled for replacement in each preventive cycle. Controller maintenance was allotted as 55 percent of the work time, and 15 percent was apportioned to each lamp use changed (red, green, and amber). Therefore, the work times required for each traffic signal operation were computed by adding the controller maintenance times to the total for the lamp uses replaced.
The total costs for the preventive maintenance operation were calculated by adding the proper travel times to the anticipated work times,
203
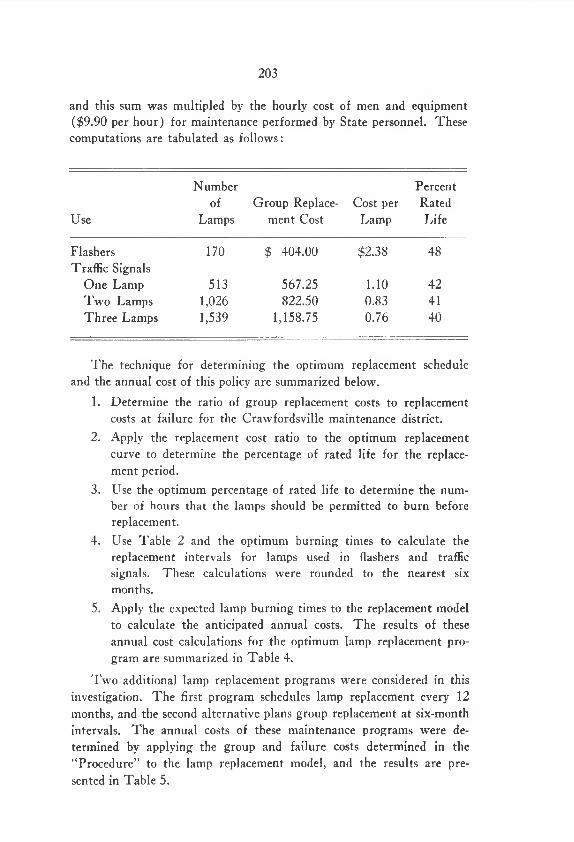
and this sum was multipled by the hourly cost of men and equipment ($9.90 per hour) for maintenance performed by State personnel. These computations are tabulated as follows:
Use
Numberof
LampsGroup Replace
ment CostCost per
Lamp
PercentRatedLife
Flashers 170 $ 404.00 $2.38 48Traffic Signals
One Lamp 513 567.25 1.10 42Two Lamps 1,026 822.50 0.83 41Three Lamps 1,539 1,158.75 0.76 40
The technique for determining the optimum replacement schedule and the annual cost of this policy are summarized below.
1. Determine the ratio of group replacement costs to replacement costs at failure for the Crawfordsville maintenance district.
2. Apply the replacement cost ratio to the optimum replacement curve to determine the percentage of rated life for the replacement period.
3. Use the optimum percentage of rated life to determine the number of hours that the lamps should be permitted to burn before replacement.
4. Use Table 2 and the optimum burning times to calculate the replacement intervals for lamps used in flashers and traffic signals. These calculations were rounded to the nearest six months.
5. Apply the expected lamp burning times to the replacement model to calculate the anticipated annual costs. The results of these annual cost calculations for the optimum lamp replacement program are summarized in Table 4.
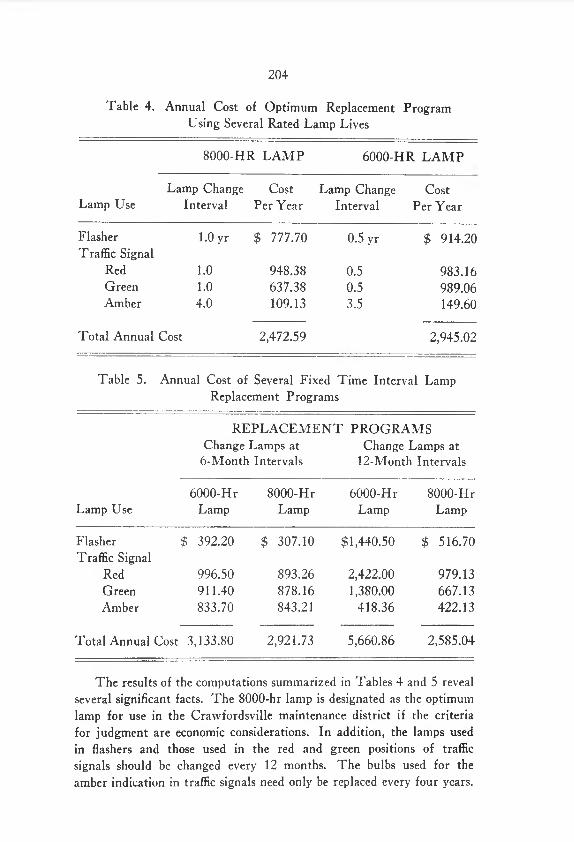
Two additional lamp replacement programs were considered in this investigation. The first program schedules lamp replacement every 12 months, and the second alternative plans group replacement at six-month intervals. The annual costs of these maintenance programs were determined by applying the group and failure costs determined in the “Procedure” to the lamp replacement model, and the results are presented in Table 5.
204
Table 4. Annual Cost of Optimum Replacement Program Using Several Rated Lamp Lives
8000-HR LAM P 6000-HR LA M P
Lamp UseLamp Change
IntervalCost
Per YearLamp Change
IntervalCost
Per Year
Flasher Traffic Signal
1.0 yr $ 777.70 0.5 yr $ 914.20
Red 1.0 948.38 0.5 983.16Green 1.0 637.38 0.5 989.06Amber 4.0 109.13 3.5 149.60
Total Annual Cost 2,472.59 2,945.02
Table 5. Annual Cost of Several Fixed Time Interval Lamp Replacement Programs
R E PL A C E M E N T PROGRAM SChange Lamps at
6-Month IntervalsChange Lamps at
12-Month Intervals
Lamp Use6000-Hr
Lamp8000-Hr
Lamp6000-Hr
Lamp8000-Hr
Lamp
Flasher $ 392.20 $ 307.10 $1,440.50 $ 516.70Traffic Signal
Red 996.50 893.26 2,422.00 979.13Green 911.40 878.16 1,380.00 667.13Amber 833.70 843.21 418.36 422.13
Total Annual Cost 3,133.80 2,921.73 5,660.86 2,585.04
The results of the computations summarized in Tables 4 and 5 reveal several significant facts. The 8000-hr lamp is designated as the optimum lamp for use in the Crawfordsville maintenance district if the criteria for judgment are economic considerations. In addition, the lamps used in flashers and those used in the red and green positions of traffic signals should be changed every 12 months. The bulbs used for the amber indication in traffic signals need only be replaced every four years.
205
However, if the lamps used in the amber position are changed each year, the annual cost is increased by only 0.42 percent.
The best replacement program for the 6000-hr lamp is recommended because the 8000-hr lamp does not meet A.A.S.H.O. specifications. The lamps used in the red and green positions of traffic signals and those used in flashers should be replaced at six-month intervals. The lamps used in the amber indication are most economically replaced every 42 months. However, the annual cost of the group replacement program is increased by 6.38 percent when amber replacements are scheduled every six months.
The actual determination of the optimal lamp replacement policy involves more than economic considerations. The following factors must be considered, and their importance must be carefully weighed with respect to the final results on the system of traffic control.
1. As the period between lamp replacements increases, the number of expected failures becomes greater.
2. Fewer failures are expected per unit of time for increasing lamp lines.
3. Hazards to the motorist increase as the number of signal failures increase.
4. W ith longer burning times less light is emitted because of the condensation of filament vapors on the lamp envelope.
5. Less light is emitted with increasing time between the cleaning of the optical units.
6 . As less light is emitted from the signal, the potential hazard to the motoring public becomes more pronounced. This factor is critical for the red position because it indicates the stop condition and eye sensitivity is lower in that portion of the light spectrum.
Optimal Route Sequencing for Preventive MaintenanceThis portion of the maintenance problem is concerned with the
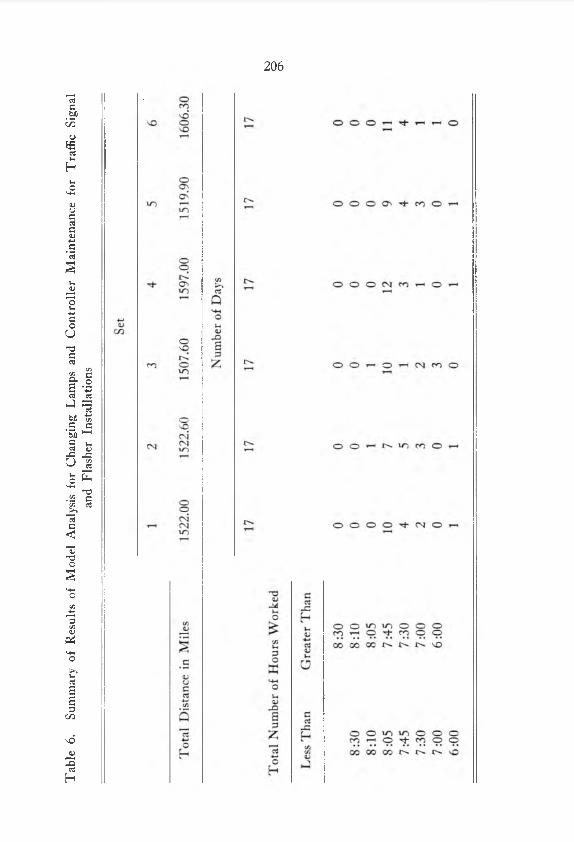
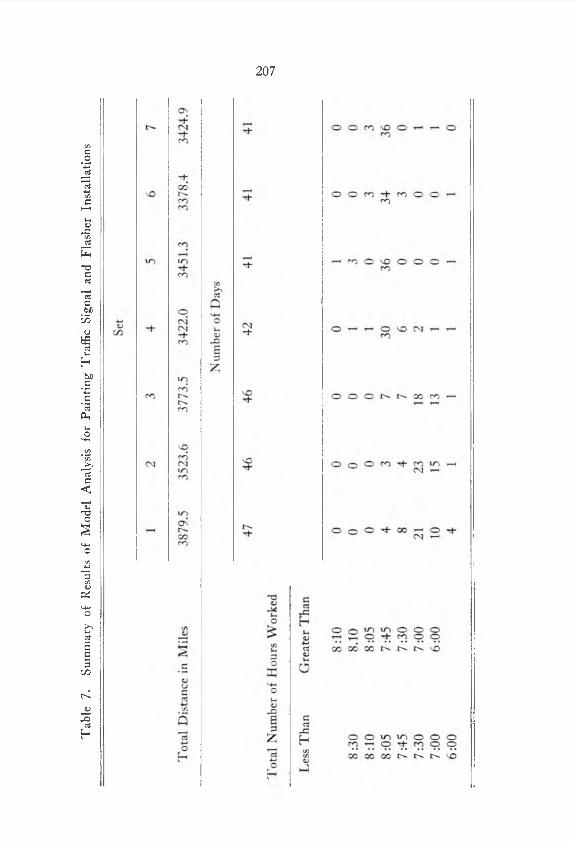
optimal scheduling and sequencing of routine preventive maintenance operations. The model analysis was separated into three parts to consider several possible alternatives. The first phase considered the optimal routing for preventive tasks concerned only with signal lamp and controller maintenance. Then, the shortest sequence of signal nodes was developed for the painting operation. The last alternative necessitated the selection of the shortest route for scheduling signal lamp, controller, and painting maintenance. The results of the model analysis for the three preventive maintenance operations are summarized in Tables 6 , 7, and 8, respectively.
206T
able
6.
Sum
mar
y of
Res
ults
of
Mod
el A
naly
sis
for
Cha
ngin
g La
mps
and
Con
trol
ler
Mai
nten
ance
for
Tra
ffic
Sig
nal
and
Flas
her
Inst
alla
tions
207T
able
7.
Sum
mar
y of
Res
ults
of
Mod
el A
naly
sis
for
Pain
ting
Traf
fic S
igna
l an
d Fl
ashe
r In
stal
latio
ns

208T
able
8.
Sum
mar
y of
Res
ults
of
Mod
el A
naly
sis
for
Cha
ngin
g La
mps
, C
ontr
olle
r M
aint
enan
ce,
and
Pain
ting
Traf
ficSi
gnal
and
Fla
sher
Ins
talla
tions

209
The best group of tours for each maintenance alternative was selected using the following criteria:
1. The work was completed in the minimum number of days;2. The distance traveled was a minimum; and3. Maintenance was scheduled to utilize the available time in a
working day.The optimal selection for changing the lamps and for controller maintenance is Set 5, in wThich the total time required to perform the maintenance operation is 121 hr and 52 min. Set 6 is the best routing for painting the traffic signal and flasher installations. This option requires 322 hr and 3 min to complete the maintenance cycle. Set 5, which requires 405 hr and 8 min per cycle, is the optimum schedule for combining the lamp and controller maintenance with the painting operation.
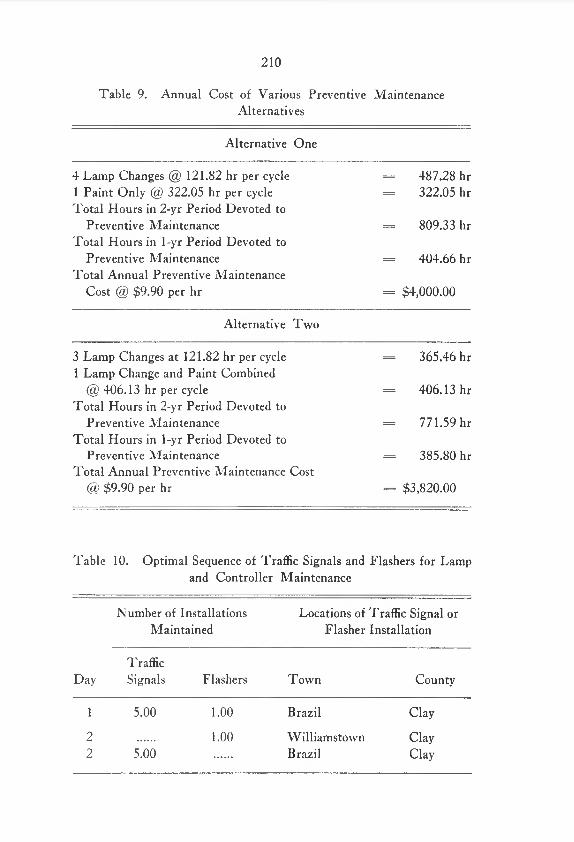
The three optimum maintenance sets were combined in accordance with A.A.S.H.O. preventive maintenance specifications. The American Association of State Highway Officials recommends that lamps and controllers be maintained every six months and that the traffic signal and flasher installations be painted at two-year intervals. (4) Two maintenance alternatives result from the A.A.S.H.O. policy. One routine schedules signal head and controller maintenance at six-month intervals while painting is planned as a separate operation on a two-year schedule. The other arrangement requires that signal head and controller maintenance be performed three times in a two-year period. A fourth maintenance cycle in this two-year interval combines painting with lamp and controller maintenance. Annual costs were calculated for the two alternatives by multiplying the anticipated hours required annually for each option by the hourly costs of men and equipment. The results of these computations are presented in Table 9.
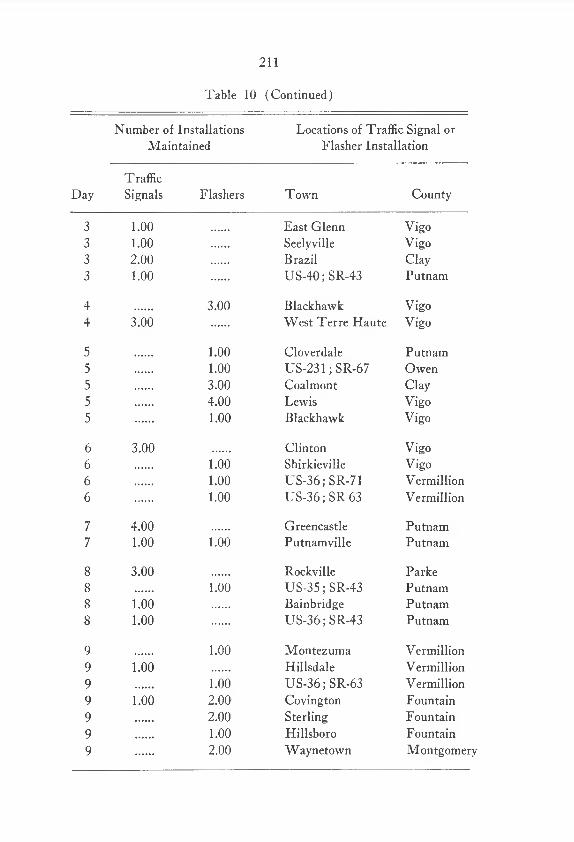
The annual cost of alternate two is slightly less expensive than the first alternative. However, alternative two is not recommended because it lacks sufficient flexibility for use in a system where failures occur randomly and where good weather cannot be guaranteed. When the painting operation is scheduled separately from the lamp and controller maintenance, the time required for painting can reduce the slack time in the work load if weather conditions are satisfactory. The painting operation can be scheduled during these slack periods because the continued and accurate operation of the traffic control devices is not critically dependent on this phase of maintenance. Therefore, the optimal sequencings of the more flexible first alternative are presented in Table 10 for the routine signal head and controller maintenance and in Table 11 for the painting operation.
210
Table 9. Annual Cost of Various Preventive Maintenance Alternatives
Alternative One
4 Lamp Changes @ 121.82 hr per cycle = 487.28 hr1 Paint Only @ 322.05 hr per cycle Total Hours in 2-yr Period Devoted to
= 322.05 hr
Preventive Maintenance Total Hours in 1-yr Period Devoted to
= 809.33 hr
Preventive Maintenance Total Annual Preventive Maintenance
= 404.66 hr
Cost @ $9.90 per hr — $4,000.00
Alternative Two
3 Lamp Changes at 121.82 hr per cycle 1 Lamp Change and Paint Combined
— 365.46 hr
@ 406.13 hr per cycle Total Hours in 2-yr Period Devoted to
= 406.13 hr
Preventive Maintenance = 771.59 hrTotal Hours in 1-yr Period Devoted to
Preventive Maintenance Total Annual Preventive Maintenance Cost
= 385.80 hr
@ $9.90 per hr = $3,820.00
Table 10. Optimal Sequence of Traffic Signals and Flashers for Lamp and Controller Maintenance
Number of Installations Maintained
Locations of Traffic Signal or Flasher Installation
DayTrafficSignals Flashers T own County
i 5.00 1.00 Brazil Clay
2 1.00 Williamstown Clay2 5.00 Brazil Clay
211
Table 10 (Continued)
Number of Installations Maintained
Locations of Traffic Signal or Flasher Installation
DayTrafficSignals Flashers Town County
3 1.00 East Glenn Vigo3 1.00 Seelyville Vigo3 2.00 Brazil Clay3 1.00 US-40 ;SR-43 Putnam
4 3.00 Blackhawk Vigo4 3.00 West Terre Haute Vigo
5 1.00 Cloverdale Putnam5 1.00 US-231 ;SR-67 Owen5 3.00 Coalmont Clay5 4.00 Lewis Vigo5 1.00 Blackhawk Vigo
6 3.00 Clinton Vigo6 1.00 Shirkieville Vigo6 1.00 US-36; SR-71 Vermillion6 1.00 US-36; SR 63 Vermillion
7 4.00 Greencastle Putnam7 1.00 1.00 Putnamville Putnam
8 3.00 Rockville Parke8 1.00 US-35 ;SR-43 Putnam8 1.00 Bainbridge Putnam8 1.00 US-36; SR-43 Putnam
9 1.00 Montezuma Vermillion9 1.00 Hillsdale Vermillion9 1.00 US-36 ;SR-63 Vermillion9 1.00 2.00 Covington Fountain9 2.00 Sterling Fountain9 1.00 Hillsboro Fountain9 2.00 Wayne town Montgomery

212
Table 10 (Continued)
Number of Installations Maintained
Locations of Traffic Signal or Flasher Installation
DayTrafficSignals Flashers Town County
10 1.00 Odell Tippecanoe10 2.00 Attica Fountain10 1.00 Williamsport W arren10 1.00 Boswell Benton10 1.00 US-52; US-41 Benton10 1.00 Montmorenci Tippecanoe10 1.00 Klondike Tippecanoe
11 6.00 West Lafayette Tippecanoe
12 6.00 West Lafayette Tippecanoe
13 1.00 West Lafayette Tippecanoe13 1.00 Rossville Clinton13 1.00 Frankfort Clinton13 1.00 Pike Boone13 1.00 Lebanon Boone
14 6.00 Frankfort Clinton
15 4.00 Lebanon Boone15 1.00 Lizton Hendricks15 1.00 Jamestown Boone15 2.00 New Ross Montgomer
16 1.00 Pittsboro Hendricks16 1.00 Brownsburg Hendricks16 3.00 Plainfield Hendricks
17 2.00 Danville Hendricks17 1.00 Avon Hendricks17 1.00 Belleville Hendricks17 1.00 Stilesville Hendricks
NOTE: The 9 traffic signals in Crawfordsville are used as safety valves.

213
Table 11. Optimal Sequence of Traffic Signals and Flashers for Painting Operations
Number of Installations Maintained
Locations of Traffic Signal or Flasher Installation
DayTrafficSignals Flashers Town County
i 3.00 Coalmont Clayi 2.50 Lewis Vigo
2 1.50 Lewis Vigo2 4.00 Blackhawk Vigo
3 2.00 Plainfield Hendricks
4 1.00 Jamestown Boone4 1.00 Lizton Hendricks4 1.00 Plainfield Hendricks4 2.00 New Ross Montgomer
5 1.00 Belleville Hendricks5 1.00 Stilesville Hendricks
6 1.00 Hillsdale Vermillion6 1.00 US-36; SR-71 Vermillion6 1.00 US-36 ;SR-63 Vermillion6 1.00 Montezuma Vermillion
7 1.00 US-36; SR-43 Putnam7 1.00 US-36; SR-43 Putnam7 1.00 Bainbridge Putnam
8 2.00 Clinton Vigo
9 1.00 Clinton Vigo9 1.00 Rockville Parke
10 1.00 Rockville Parke10 1.00 SR-63; Hillsdale Vermillion
11 1.00 West Lafayette Tippecanoe11 1.00 Montmorenci Tippecanoe11 1.00 Klondike Tippecanoe11 1.00 Rossville Clinton
214
Table 11. (Continued)
12 2.10 Frankfort Clinton
13 2.10 Frankfort Clinton
14 2.10 Frankfort Clinton
15 1.00 Pike Boone15 0.70 Frankfort Clinton15 1.20 Lebanon Boone
16 0.80 Lebanon Boone16 1.00 Hillsboro Fountain
17 2.00 1.00 Lebanon Boone
18 2.00 1.00 Greencastle Putnam
19 2.00 Greencastle Putnam
20 1.00 US-40 ;SR-43 Putnam20 1.00 Danville Hendricks
21 1.00 Waynetown Montgomery21 1.00 Avon Hendricks21 1.00 Danville Hendricks
22 1.00 2.00 Covington Fountain22 2.00 Sterling Fountain22 1.00 Waynetown Montgomery
23 1.00 1.00 Putnamville Putnam23 1.00 Cloverdale Putnam23 1.00 US-231 ;SR-67 Owen
24 2.25 West Lafayette Tippecanoe
25 2.25 West Lafayette Tippecanoe
26 2.25 West Lafayette Tippecanoe
27 2.25 West Lafayette Tippecanoe
215
Table 11. (Continued)
Number of Installations Maintained
Locations of Traffic Signal or Flasher Installation
DayTrafficSignals Flashers Town County
28 2.25 West Lafayette Tippecanoe
29 0.75 West Lafayette Tippecanoe29 1.00 US-52; US-41 Benton29 1.00 Boswell Benton29 1.00 Williamsport Warren
30 2.00 Attica Fountain30 1.00 Odell Tippecanoe
31 1.75 West Terre Haute Vigo
32 1.25 West Terre Haute Vigo32 0.50 East Glenn Vigo
33 0.50 East Glenn Vigo33 1.00 Seelyville Vigo33 1.00 Brazil Vigo
34 2.00 Brazil Vigo
35 2.00 Brazil Vigo
36 2.00 Brazil Vigo
37 2.00 Brazil Vigo
38 2.00 Brazil Vigo
39 2.00 Brazil Vigo
40 1.00 Rockville Parke40 1.00 Shirkieville Vigo40 1.00 Williamstown Vigo
41 1.00 Pittsboro Hendricks41 1.00 Brownsburg Hendricks
NOTE: The 9 traffic signal installations in Crawfordsville are used as safety valves.
216
The proper operation of the maintenance sequencing presented in this section is predicated on two procedural techniques. The nine traffic signals in Crawfordsville are necessary to absorb the unused work times because the maintenance scheduling has been performed with 85th percentile work times. Scheduling maintenance operations with the 85th percentile work times increases the possibility of the daily activities being completed in less than 8 hr. If this situation arises, the maintenance crews finish the work day by maintaining the traffic signals in Crawfordsville. At the end of the maintenance cycle those traffic signals in Crawfordsville that have not been maintained receive scheduled preventive maintenance.
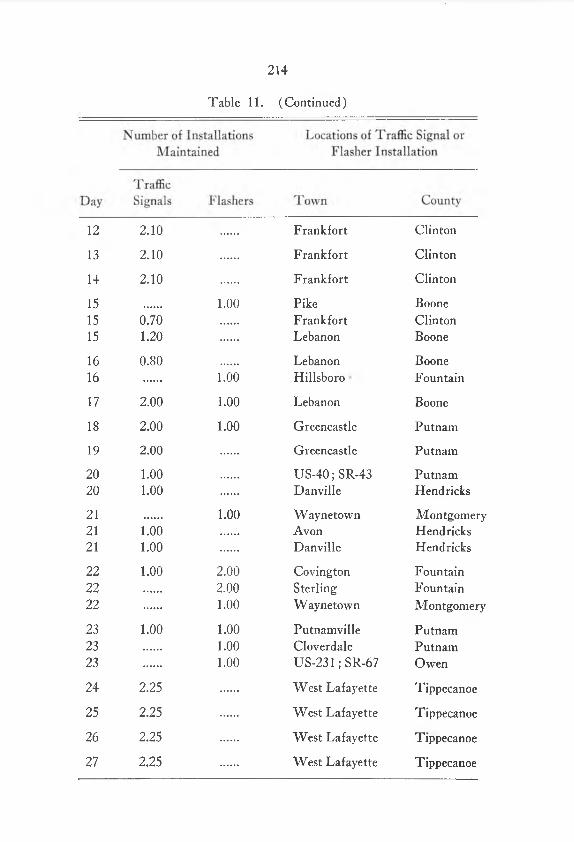
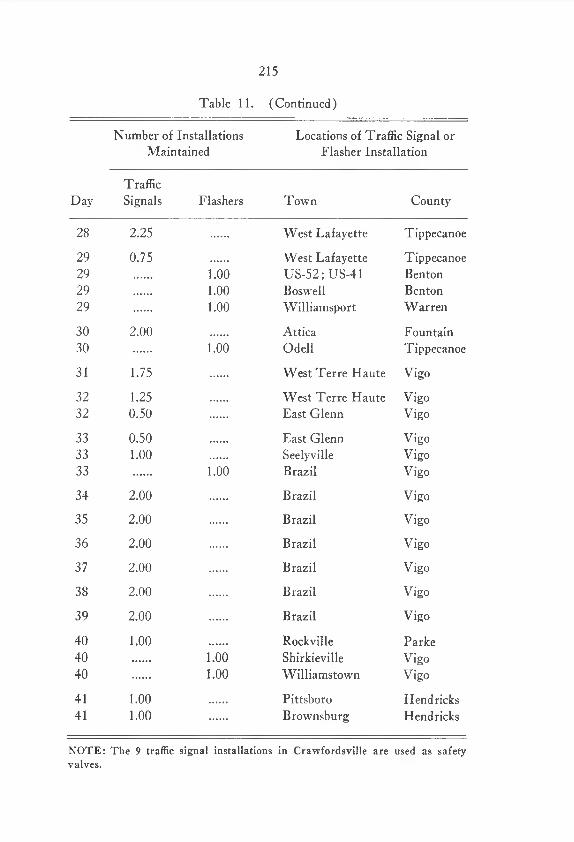
The other consideration for the maintenance sequencing is concerned with the use of fractions of traffic signal and flasher installations for the painting operation. The lengthy work time required for the painting operation necessitated this procedure for scheduling work to insure that the time available each day is fully utilized. Because the signal operation is not dependent upon the painting operation, it is possible to leave a signal installation partially painted and to return the next working day for the completion of this task.
StaffingThis part of the maintenance problem is concerned with determining
the size of the State maintenance staff necessary for effective traffic signal and flasher operation. The traffic signal and flasher maintenance operations in Lafayette, Terre Haute, and West Lafayette were not included in the staffing analysis because the maintenance operations in these communities are handled on a contract basis.
The analysis of the staff necessary to provide adequate traffic signal and flasher maintenance was determined by considering the following factors:
1. The failure probabilities expressed in Table 3,2. The average daily repair times,3. The anticipated time required to perform the preventive main
tenance operations, and4. The suitability of certain seasons for preventive maintenance.
The days available per year for preventive maintenance were calculated by multiplying the probabilities of no failures occurring in a day times the number of days expected for each failure condition. For the situation when flasher failures are expected, the probability of no failures is0.559, and the length of the observed period of flasher failures was 90 days. Therefore, 40 days in this 90-day interval are not available for routine maintenance operations. For the remaining 275 days of the
217
year, 90 additional days were subtracted because the winter season, extending from the first of December through the first of March, was not considered satisfactory for preventive maintenance operations. The number of failures was not calculated for the winter season, because the entire period has been removed from consideration for preventive maintenance operations. Therefore, the probability of no failures per day is 0.674 for the remaining 185 days of the year, and the time not available for preventive maintenance was calculated as 61 days. To complete the determination of the time available for routine or preventive maintenance, all failures wTere assumed to be corrected during the working day in the five-day work week. Any day in which a failure occurred was not considered available for preventive maintenance operations. The result of these limitations is to reduce the work year to 260 days, of which only 69 days are available for preventive maintenance.
The preventive maintenance operations require 17 days per cycle (Table 6 ) for changing the lamps and cleaning the controller and 21 days per year (Table 7) for the painting operations if a two-year painting cycle is employed. Depending on the lamp replacement policy of one or two cycles per year, 38 or 55 days are required per year, respectively, for the preventive maintenance operations. One maintenance crew can successfully perform the preventive and emergency maintenance operations for the Crawfordsville district.
Because the traffic signal maintenance personnel are also responsible for traffic signal modernization, installation of new traffic signals and flasher complexes, and rebuilding controllers and other signal appurtenances, a single two-man crew is not totally sufficient. A three-man maintenance team would provide the most effective maintenance crew. One man is charged with the responsibility of rebuilding the controllers and the other repair tasks requiring a high degree of technical skill. The remaining two men are assigned the preventive maintenance operations and the less difficult repair tasks.
SUM M ARY OF RESULTS AND CONCLUSION S
The following results and conclusions were derived from the analysis of traffic signal and flasher operations for the Crawfordsville maintenance district in the State of Indiana. The findings were classified under the categories of general conclusions and of results applicable to the Crawfordsville maintenance district.
1. General conclusionsa. A scientifically determined maintenance program was formu
lated for traffic signals and flashers using systems analysis
218
techniques. This program includes determining the optimal lamp replacement interval, calculating the shortest route for performing the preventive maintenance, and staffing the work crew necessary to insure proper signal operation.
b. The use of a preventive maintenance program affords certain economic advantages and improves the safety of an intersection because the probability of a signal failure is reduced.
c. Lamps with long-rated lives are recommended because their operation is less costly and the anticipated numbers of failures per unit time are smaller than for bulbs with short lamp lives.
d. An adequate maintenance record system is mandatory for the economic and efficient scheduling of realistic traffic signal and flasher maintenance.
2. Results applicable to the Crawfordsville maintenance district.a. The relationship expressing the distance traveled in minutes
for a typical maintenance trip in the district is:Yc = 1.437X + 7.775 whereYc = travel time in minutes, and X = distance traveled in miles
b. The average work times for various preventive maintenance operations are :
Traffic signal Flasher
Change lamps 40 min 13 minPaint 113 min 37 minChange lamps
and paint 173 min 50 minc. The average lamp replacement costs are $0.84 for replacing a
lamp in a group replacement program and $18.38 for replacing a lamp at failure.
d. The failure rate for traffic signals was reasonably represented by a Poisson distribution with a mean of 0.0063 failures per day per signal.
e. The optimum lamp replacement curve was used to indicate the proper interval for scheduling group lamp replacements.
f. In concurrence with the specifications of the American Association of State Highway Officials, the use of 6000-hr lamps with a group replacement schedule of six months is recommended for the most economical preventive maintenance program.

219
g. The painting and the lamp replacement and controller maintenance are scheduled as separate maintenance operations to provide sufficient flexibility in the scheduled preventive maintenance for unpredictable occurrence of failures and poor weather conditions.
h. The staff required in the Crawfordsville district for traffic signal and flasher maintenance should consist of one signal technician qualified to make major controller repairs and two technicians who perform the preventive maintenance and minor-repair tasks.
BIBLIO G RA PH Y
1. Adjustable Face Traffic Control Signal Head Standards, Washington, D. C., Institute of Traffic Engineers, 1958.
2. Hartley, J. E., Preventive Traffic Signal Maintenance Works in SpringfieldIII., The American City, November 1958, pp. 143-144.
3. Lighting Maintenance Manual, Lynn, Mass., Champion Lamp Works, 1958.
4. Manual on Uniform Traffic Control Devices for Streets and Highway, Washington, D. C., U. S. Department of Commerce, Bureau of Public Roads, U. S. Government Printing Office, June 1961.
5. Meno, F. J., Economical Maintenance of Traffic Signal Systems, Traffic Engineering, Volume 25, February 1953, pp. 157-158.
6 . Smith, Thorold G., Optimization Model for the Maintenance of Traffic Signals, a Thesis submitted to Purdue University for the degree of Master of Science in Civil Engineering, January 1966.