school accountability and teacher mobility€¦ · · 2012-12-27institute for policy research...
TRANSCRIPT
2040 Sheridan Rd. Evanston, IL 60208-4100 Tel: 847-491-3395 Fax: 847-491-9916 www.northwestern.edu/ipr [email protected]
Institute for Policy Research Northwestern University Working Paper Series
WP-10-06
School Accountability and Teacher Mobility
Li Feng
Finance and Economics Texas State University
David Figlio Faculty Fellow, Institute for Policy Research
Education and Social Policy, School of Education and Social Policy Northwestern University
Research Associate, National Bureau of Economic Research
Tim Sass Economics
Florida State University
Version: June 1, 2010
DRAFT © 2010 by Li Feng, David Figlio, and Tim Sass. All rights reserved. Short sections of text, not to exceed two paragraphs, may be quoted without explicit permission provided that full credit, including © notice, is given to the source.
Abstract
This paper presents the first causal evidence on the effects of school accountability
systems on teacher labor markets. The researchers exploit a 2002 change in Florida's
school accountability system that exogenously shocked some schools to higher
accountability grades and others to lower accountability grades, and measure whether
teachers in shocked schools are more or less likely to move. Using microdata from the
universe of Florida public school teachers, they find strong evidence that accountability
shocks influence the teacher labor market; specifically, teachers are more likely to leave
schools that have been downward shocked—especially to the bottom grade—and they are
less likely to leave schools that have been upward shocked. They also find that
accountability shocks influence the distribution of the measured quality of teachers (in
terms of value added measures) who stay and leave their school, though the average
differences are not large.
Acknowledgments: We are grateful to the U.S. Department of Education, National
Science Foundation and National Institutes of Child Health and Human Development for
research support, and to the Florida Department of Education for providing the data for
this analysis. Seminar participants at Northwestern, Oregon, Wisconsin, and the Swedish
Research Institute for Industrial Economics, as well as conference participants at the
American Education Finance Association, Association for Public Policy Analysis and
Management, Society for Research on Educational Effectiveness, and Southern Economic
Association meetings, for helpful comments. We alone are responsible for any errors in
analysis or interpretation. The results reported herein do not necessarily reflect the views
of the Florida Department of Education, or our funders, or the National Bureau of
Economic Research.
1
I. Introduction
School accountability -- the process of evaluating schools on the basis of the performance
of their students and holding them responsible for this performance -- is becoming increasingly
prevalent around the world. Accountability systems are intended to solve the principal-agent
problem in education, and the incentives that they provide to educators to improve student
efficiency take several forms. These systems provide direct incentives, in the form of explicit
rewards or sanctions associated with good or poor performance. In addition, many of the
mechanisms for improvement involve social pressure, since a school’s constituents have both
educational and financial reasons to influence low-performing schools to improve. The financial
reasons derive from the fact that school accountability ratings tend to be capitalized into housing
values (Figlio and Lucas, 2004). In addition, school accountability affects a school's ability to
raise voluntary contributions (Figlio and Kenny, 2009). This paper makes use of detailed data at
the individual teacher level to gauge the degree to which teachers respond to these direct and
indirect forms of accountability pressure by leaving the high-pressure school.
There is certainly reason to believe that educators respond to accountability pressure in
the ways in which they carry out their jobs. Early evidence concerning the effects of these
accountability systems on student performance indicates they tend to improve the outcomes of
low-performing students (see, e.g., Chakrabarti, 2006; Chiang, 2009; Figlio and Rouse, 2006;
Jacob, 2005; Rouse et al., 2007; West and Peterson, 2006).1 However, Krieg (2008), Neal and
Schanzenbach (2008) and Reback (2008) argue that the benefits of accountability pressures are
concentrated in the more marginal students rather than the students whose performance would be
1 Recent nationwide studies by Carnoy and Loeb (2002) and Hanushek and Raymond (2005) also find significant improvement in student outcomes as a result of standards-based accountability, whereas the results from some specific state systems have been less positive (see, e.g, Koretz and Barron, 1998; Clark, 2003; and Haney, 2000, 2002).
2

far above or far below the performance thresholds set for the purposes of school accountability.
That said, the weight of the evidence suggests that accountability systems have led schools to
become more productive, at least along some measurable dimensions. Rouse et al. (2007)
document a number of the ways in which accountability pressure has changed school
instructional policies and practices in Florida’s low-performing schools, and relate these
instructional policy and practice changes to increased student performance.
In addition to actively changing policies and practices to improve student outcomes,
schools have also responded to accountability pressures by engaging in apparently strategic
behavior with questionable educational benefit. For instance, some schools have responded by
differentially reclassifying low-achieving students as learning disabled so that their scores will
not count against the school in accountability systems (see, e.g., Cullen and Reback, 2007; Figlio
and Getzler, 2007; Jacob, 2005).2 Figlio and Winicki (2005) suggest that Virginia schools facing
accountability pressures altered their school nutrition programs on testing days to increase the
likelihood that students will do well on the exams, and Figlio (2006) indicates that schools
differentially suspend students at different points in the testing cycle in an apparent attempt to
alter the composition of the testing pool. Jacob and Levitt (2003) find that teachers are more
likely to cheat when faced with more accountability pressure. And the distributional effects
documented by Neal and Schanzenbach (2008) and others are also evidence of strategic behavior
on the part of schools. In sum, school accountability systems cause schools to behave
differently, and school personnel almost certainly are very responsive to increased accountability
pressure.
2 Chakrabarti (2006), however, does not find that schools respond in this way.
3
Of course, the individuals implementing the changes in instructional policies and
practices are teachers, and school accountability therefore has the potential to influence the
desirability of certain teaching jobs. Likewise, accountability may influence the willingness of
schools to retain certain teachers. From a theoretical perspective, the effects of accountability
pressures on the teacher labor market are ambiguous. On the demand side, in order to avoid
sanctions and/or the stigma associated with being designated as a “failing” school, schools could
increase their efforts to identify low performing teachers and remove them from their
classrooms. In this case, it is difficult to call these personnel changes a “job choice,” at least
from the perspective of the teacher. On the supply side, accountability pressure and associated
changes in school policies could lower the net benefit of teaching in a school by reducing teacher
discretion over curriculum or teaching methods. Likewise, the potential stigma from teaching in
a “failing” school could lead some teachers to seek employment at other schools. On the other
hand, the resources that often accompany sanctions (e.g. reading coaches, training for teachers,
etc.) could reduce the non-monetary costs associated with working in low-performing schools
and actually increase teacher retention.
Similar patterns could be possible in the case of schools receiving high accountability
marks. Schools that perform well under accountability systems face the pressure to maintain
their high scores or to improve upon them. In Florida, for instance, schools receive extra bonus
money for maintaining a top accountability score or for improving from one year to the next.
Given that the housing market capitalization effects of school accountability are strongest in
more affluent school areas (Figlio and Lucas, 2004), coupled with the fact that measurement
error in test scores introduces a significant degree of randomness into the school accountability
ratings (Kane and Staiger, 2004), it is reasonable to believe that relatively high-performing
4

schools may face as much or more real accountability pressure as do low-performing schools.
Goldhaber and Hannaway (2004), in a case study of schools in Florida, find that teacher and
administrator anxiety levels due to school accountability were highest in the high-performing
schools, where school personnel felt the most pressure to maintain their accountability marks.
Hence, while teaching in a highly-rated school has its advantages, the extra accountability
pressure may deter teachers as well. And, just as with the low-rated schools, highly-rated schools
may engage in more teacher selection as a consequence of accountability. Therefore, the
theoretical expectations of how accountability pressures influence teacher job choice/placement
are ambiguous for both highly-rated and low-rated schools.
A number of recent papers have analyzed the determinants of teacher mobility and
attrition (Boyd et al., 2005a, 2006, 2007; Clotfelter et al., forthcoming; Feng, 2009; Hanushek et
al., 2004; Imazeki, 2004; Krieg, 2006; Podgursky et al., 2004; Scafidi et al. 2007). However, the
literature relating accountability pressures to teachers’ labor market decisions has been much
spottier. Boyd et al. (2005) explore the responses of teachers to the introduction of mandated
state testing in New York State. They find that teacher turnover in fourth grade, the critical
accountability year in New York, decreased following the introduction of testing, and that
entrants into fourth grade were more likely to be experienced than had previously been the case.
Clotfelter et al. (2004) evaluate how North Carolina’s accountability system has influenced the
ability of schools serving low-performing students to attract and retain high-quality teachers.
They find that the introduction of the accountability system has exacerbated teacher turnover in
these schools, though it is less evident that accountability has led to lower qualifications of the
teachers serving low-performing students. Both of these papers carefully describe the
5

accountability systems in their states, but because they evaluate accountability systems that
affected all schools within a state, it is difficult to derive causal inference from their analyses.
In this paper, we exploit a major rule change in Florida’s school accountability system
that took place in the summer of 2002 to identify the effects of changing school accountability
pressures on teacher job changes. Florida had graded every school in the state on a scale from
“A” to “F” since the summer of 1999, based on proficiency rates in reading, writing and
mathematics. In 2002, the state dramatically changed its grading system to both recalibrate the
acceptable student proficiency levels for the purposes of school accountability and to introduce
student-level changes as an important determinant of school grades. Using student-level micro-
data to calculate the school grades that would have occurred absent this change, we demonstrate
that over half of all schools in the state experienced an accountability “shock” due to this grading
change, with some schools receiving a higher grade than they would have otherwise received and
other schools receiving a lower grade than would have otherwise occurred. Furthermore, some
schools were shocked downward to receive a grade of “F”, which no school in the state had
received in the prior year of grading. These grading shocks provide the vehicle for identification
of accountability effects in this paper.
We apply these accountability shocks to data on the universe of public school teachers in
Florida. We measure the effects of accountability pressures on teachers’ decisions to stay at a
given school, move to another school in the same district, move to another school district in the
state or leave public school teaching. Since Florida has had statewide achievement testing in all
grades 3-10 since 1999/2000 we are also able to compute “value-added” measures of teacher
quality and determine whether teacher mobility engendered by accountability pressures tends to
increase or decrease teacher quality. We find strong evidence that accountability shocks
6

influence the teacher labor market; specifically, teachers are more likely to leave schools that
have been downward shocked -- especially to the bottom grade -- and they are less likely to leave
schools that have been upward shocked. We also find that accountability shocks influence the
distribution of the measured quality of teachers (in terms of value added measures) who stay and
leave their school, though the average differences are not large. The results, therefore, suggest
that school accountability can have quite consequential effects for professional educators.
II. The Florida School Accountability Program
Education reform, and specifically a system of school accountability with a series of
rewards and sanctions for high-performing and low-performing schools, was the policy
centerpiece of Jeb Bush’s 1998 gubernatorial campaign in Florida; the resulting A+ Plan for
Education was Bush’s first legislative initiative upon entering office in 1999. The A+ Plan
called for annual curriculum-based testing of all students in grades three through ten, and annual
grading of all traditional public and charter schools based on aggregate test performance. As
noted above, the Florida accountability system assigns letter grades (“A,” “B,” etc.) to each
school based on students’ achievement (measured in several ways). High-performing and
improving schools receive rewards while low-performing schools receive sanctions as well as
additional assistance, through Florida’s Assistance Plus program. The most famous and
publicized provision of the A+ Plan was the institution of school vouchers, called “Opportunity
Scholarships,” for students attending (or slated to attend) chronically failing schools – those
receiving a grade of “F” in two years out of four, including the most recent year. Opportunity
Scholarships allowed students to attend a different public school, or an eligible private school.
7

School grading began in May 1999, immediately following passage into law of the A+
Plan. In each year from 1999 through 2001, a school would earn a grade of “F” if fewer than 60
percent of students scored at level 2 (out of 5) or above in reading, fewer than 60 percent of
students scored at level 2 (out of 5) or above in mathematics, and fewer than 50 percent of
students scored at level 3 (out of 6) or above on the Florida Writes! writing evaluation, known
from 2001 onward as the FCAT Writing examination. A school could avoid the “F” label by
meeting any one of these three standards in 1999; the same was true in 2000 and 2001 provided
that at least 90 percent of the test-eligible students took the examination (or that the school could
provide the state with a “reasonable explanation” for why fewer than 90 percent of students took
the test.) All schools in the distribution were subject to accountability pressure, and according to
Goldhaber and Hannaway (2004), schools throughout the distribution apparently felt pressure to
perform in measurable ways.
Thus, between 1999 and the summer of 2001, schools were assessed primarily on the
basis of aggregate test score levels (and also some additional non-test factors, such as attendance
and suspension rates, for the higher grade levels) and only in the grades with existing statewide
curriculum-based assessments,3 rather than on progress schools make toward higher levels of
student achievement. Starting in summer 2002, however, school grades began to incorporate test
score data from all grades from three through ten, and were also the first to evaluate schools not
just on the level of student test performance but also on the year-to-year progress of individual
students. In our analysis, we take advantage of the fact that during the 2001-02 school year
teachers would not have been able to anticipate their school grade in summer 2002 because of
the changes in the formula and because the changes were not decided until the last minute.
3 Students were tested in grade 4 in reading and writing, in grade 5 in mathematics, in grade 8 in reading, writing and math, and in 10 in reading, writing and math.
8

By the beginning of the 2001-02 school year several things were known about the school
grades that were to be assigned in summer 2002. First, the school grades were to have been
based on the test scores of all students in grades three through ten in reading and mathematics,
and in the fourth, eighth and tenth grades in writing. Second, the standards for acceptable
performance by students were to be raised from level 2 to level 3 in reading and mathematics.
Third, some notion of a “value-added” system was to be established, though little was known
about the specific nature of this system except that it would augment the levels-based grading
system and would focus principally on the lowest-performing students. These elements would
be combined to give each school a total number of “grade” points. The school’s grade would be
determined by the number of points. However, the specifics of the formula that would put these
components together to form the school grades were not announced until March 5, 2002, leaving
teachers entering the 2001-02 school year with virtually no information with which to anticipate
their school’s exact grade.
Table 1 shows the distribution of schools across the five performance grades for the first
six rounds of school grading, for all graded schools in Florida. As is apparent from the variation
across years in the number of schools that fall into each performance category, there are
considerable grade changes that have taken place since the accountability system was adopted.
Most notable is the fact that while 70 schools received an F grade in the first year (1998-99) only
4 did so the subsequent year and none did by the summer of 2001. At the same time, an
increasing number of schools were receiving A’s and B’s. This is partly due to the fact that
schools had learned their way around the system: A school had to fail to meet proficiency
targets in all three subjects to earn an F grade so as long as students did well enough in at least
one subject the school would escape the worst stigma. Hannaway and Goldhaber (2004) and
9

Chakrabarti (2006) find evidence that students in failing schools made the biggest gains in
writing which is viewed as one of the easier subjects in which to improve quickly. When the
rules of the game changed, so did the number of schools caught by surprise: For instance, 60
schools earned an "F" grade in the summer of 2002. The number of schools that received an A
grade also increased, due in large measure to the shift to the “grade points” system of school
grading, which allows schools that miss performance goals in one area to compensate with
higher performance in another area. Finally, note that as schools have adapted to the new
grading system, the number of failing schools has decreased. 4
In this paper, we seek to exploit the degree to which schools and teachers were
“surprised” by the change in school grading. Using an approach to identification introduced by
Rouse et al. (2007), we measure the “accountability shock” to schools and teachers by comparing
the grades that schools actually received in the summer of 2002 with the grade that they would
have been predicted to receive in 2002 based on the “old” grading system (that in place in 2001).
We have programmed both the old and new accountability formulas and, using the full set of
student administrative test scores provided us by the Florida Department of Education, we have
calculated both the actual school grade that schools received in 2002 with the grade that they
would have received given their realized student test scores had the grading system remained
unchanged. It is essential that we make this specific comparison, rather than simply comparing
year-to-year changes in school grades, because year-to-year changes in school grades could
4 Note that in Table 1 there are 68 elementary schools that received a grade of “N” in 2002. These were new schools in that year. As such, they were not given a formal grade although the state did calculate their accountability points. Rouse et al. (2007) experimented with imputing what their grades would have been, and found that there would have been an additional 9 "F" graded schools and 10 additional "D" graded schools, for instance, had the state graded these schools in 2002. Rouse et al. (2007) found that their results regarding test scores were completely insensitive to the treatment of these schools. For the purposes of the present analysis, we exclude them from the analysis of teacher job changes.
10

reflect not just accountability shocks, but also changes in student demographics, changes in
school policies and practices, changes in school staffing, and other changes in school quality.
Given that understanding school staffing is the point of this paper, it is clearly inappropriate to
compare grade changes per se.
Table 2 compares realized school grades to predicted school grades (based on the old
grading system but the new student test scores) for the set of schools in the state of Florida.5 We
demonstrate that 51 percent of schools experienced a change in their school grade based on the
changing parameters of the grading system itself. Most of these schools (42 percent)
experienced an upward shock in their school grades, while 9 percent of all schools experienced a
downward shock in their school grades, receiving a lower grade than they would have expected
had the grading system remained unchanged. Twenty percent of schools that might have
expected to receive a “D” under the old system received an “F” under the new one, while 38
percent of these schools received a grade of “C” or better. Meanwhile, 59 percent of schools that
might have expected to receive a “B” under the old system received an “A” under the new one,
while 9 percent of these schools received a grade of “C” or worse. It is clear that the grading
system change led to major changes in the accountability environment, and provides fertile
ground for identification.
5 The number of observations in Table 2 does not exactly match that in Table 1 because we rely on administrative data on students provided by the Florida Department of Education to simulate each school’s grade in 2002. This administrative dataset does not include some students in charter schools, “alternative” schools, and, of course, schools that do not have any students in the accountability grades.
11

III. Data and Empirical Approach
We are interested in modeling the effects of school accountability shocks on teacher
mobility. The most natural way to estimate this relationship is to consider year-to-year changes
in teacher employment at a school. In this paper, we estimated log-odds ratios generated from
logit models in which the dependent variable is the likelihood that a teacher in year t leaves his
or her school before year t+1, and our key independent variables are indicators for whether the
school was upward or downward shocked in the 2002 school grading regime -- a change in
accountability pressure that is exogenous to the school and its teachers. As we observe teacher
mobility decisions in the years before and after the school grading change, we can estimate
difference-in-difference models in which we condition on school and time effects. Our models
are estimated at the individual teacher level, but since our treatment is a school-level treatment,
all standard errors are clustered at the school level. We report the results of models both
including and excluding school and student body characteristics.
The primary source of our data is the Florida Department of Education's K-20 Education
Data Warehouse (FL-EDW), an integrated longitudinal database covering all Florida public
school students and school employees from pre-school through college. Like statewide
administrative databases in North Carolina and Texas, the FL-EDW contains a rich set of
information on both individual students and their teachers which is linked through time. Unlike
other statewide databases, however, the FL-EDW links both students and teachers to specific
classrooms at all grade levels.
Statewide data, as opposed to data from an individual school district, are particularly
useful for studying teacher labor markets since we can follow teachers who move from one
district to another within Florida. We cannot, however, track teachers who move to another
12

state. Due to population growth and a constitutionally mandated maximum class size, Florida is
a net importer of teachers. Thus, unlike many Northern states where the school-age population is
shrinking, there is relatively little outflow of teachers from Florida during the period under
study.6 Using national data from the Schools and Staffing Survey and associated Teacher
Follow-Up Survey (SASS/TFS) which track teachers across state lines, Feng (2010) finds that
there are relatively fewer teachers moving into or out of state of Florida compared to other
Southern states, such as North Carolina and Georgia.
The FL-EDW contains teachers’ data from the 1995/96 school year to the 2004/05 school
year, though our primary analyses are based on data through 2002/03, the first year following the
school accountability shock. Teachers’ school affiliation and status can be identified for the
universe of all classroom teachers. In some of our specifications we condition on student test
performance (or measure teachers' value added based on student performance); student test score
records for all grades 3-10 are only available from the 1999/2000 school year forward. We also,
in some specifications, we control for average test scores, disciplinary incidents and socio-
economic status and demographics of the students in a teacher's school and district in an attempt
to control for other factors that might affect teacher mobility.
IV. Accountability Shocks and Teacher Mobility
We begin by investigating the number of relevant teachers who faced different
accountability conditions during the accountability shock of summer 2002. Table 3 presents a
descriptive summary of teacher job change before and after the accountability shock, broken
6 With the recent sub-prime mortgage crisis after 2008, one might expect more of a teacher exodus out of state of Florida than has occurred previously.
13
down by the type of shock a school received.7 Independent of the type of accountability shock,
teacher mobility was increasing over the time period. This general increase in teacher job
change could be due to the general expansion in the number of teachers employed; relatively
inexperienced teachers tend to be more mobile than veteran teachers. Prior to the accountability
shock, downward shocked schools have the highest teacher departure rate (18.2 percent), with
slightly lower rates in no-shock schools (16.6 percent) and upward shocked schools (15.9
percent). There is little difference in the inter-temporal change in teacher job change between
upward-shock and no-shock schools. The fraction of teachers leaving non-shock schools was 0.7
percentage points higher in the post-accountability-shock period and for upward-shock schools it
was 1.0 percentage points higher. However, there is a relatively large and statistically significant
difference in the change in teacher departures between no-shock and downward-shock schools.
Teacher job change increased by 2.8 percentage points in schools that received lower grades
under the new accountability regime, whereas schools that did not experience a change in their
grade as a result of the change in the accountability system had only one percentage point
increase in teacher mobility. This 1.8 percentage point difference in the rate of teacher departure
is statistically significant at better than a 99.9 percent confidence level.
The simple descriptive evidence suggests that schools experiencing downward shocks see
more of their teachers depart after the implementation of the accountability formula change than
do schools that did not experience an accountability shock. In contrast, there is no significant
difference in teacher departure from schools that receive higher grades under the new
7 Since 2002 school grades were announced in mid-June 2002, too late for most teachers to make a job change before the start of school in August, we define the pre-shock period as job changes that occurred between the three school-year pairs, 1999/00-2000/01, 2000/01-2001/02 and 2001/02-2002/03. The post-shock period is the transition between school years 2002/03 and 2003/04.
14
accountability system relative to schools that experience no change in their grade as a result of
the change in the accountability formula. It is possible that any improvement in teachers’
perceptions of their work environment engendered by an unexpected increase in the school grade
is offset by increased pressure to maintain a higher grade. Of course these descriptive results do
not directly account for other time-varying factors that may influence teacher mobility and which
could be correlated with the type of shock a school receives. Further, the descriptive
comparisons are based on teacher job changes occurring between the pair of school years
following the accountability shock (ie. differences between the 2002/03 and 2003/04 school
years). If teacher job changes occur over a longer time frame, our results may underestimate the
behavioral response to an accountability shock.
To account for other time varying factors that may affect teacher mobility, we first
estimate logit models of the likelihood of leaving the current school, conditional on the
characteristics of the teacher's current school. Results are presented in Table 4. For ease of
interpretation, the table reports the parameters in terms of the odds ratio, relative to the reference
group of teachers (those whose schools did not face an accountability shock.) An odds ratio of
one indicates that a teacher whose school is shocked has equal odds of leaving the school as a
teacher whose school is not shocked. An odds ratio of less than one implies that the odds of
leaving for a teacher whose school is shocked is lower than for the reference group of teachers.
Our key variable of interest is the accountability shock faced by the cohort of teachers. Because
we observe multiple cohorts of teachers from schools, before versus after the accountability
shock, we report differences-in-differences estimates in which we compare, say, teachers'
decisions to move before versus after the policy shock from schools experiencing a downward
15

shock to those from schools that are un-shocked. All standard errors are adjusted for clustering
at the school year level.
The first column of Table 4 presents the key parameter estimates of this model,8 in a
specification that includes no covariates except for year indicators, a post-shock indicator, and
shock-type fixed effects for upward and downward shocked schools. Similar to the descriptive
statistics reported above, we find that teachers who are teaching in schools with an unexpected
increase in accountability pressure (downward accountability shock) are about 11 percent more
likely to leave their schools, and those with an unexpected decrease in accountability pressure
(upward accountability shock) are 2.3 percent less likely to leave their schools, than are teachers
facing no accountability shock. These estimated effects are statistically distinct from one another
and the downward-shocked estimate is statistically different from the no-shock status at a 90
percent confidence level. Therefore, this simplest specification provides some initial evidence
that teachers may respond to the information conveyed by accountability shocks.
The remaining columns of Table 4 include increasing numbers of control variables. The
second column controls for time-varying district-level demographics and FCAT math score level
variables, and the third column controls for both district-level and school-level time-varying
demographic variables. These include disciplinary incidents, percent of minority students (Black,
Hispanic) and percent of students receiving subsidized lunches, in addition to time effects and
shock-level fixed effects.9 The fourth column further controls for school-level FCAT math score
levels, and the fifth column controls for both school-level FCAT math score levels as well as
math score gains. The point estimates are essentially constant across specifications, with the
8 For the sake of presentation parsimony we report only estimates of the key parameters of interest, but all coefficient estimates are available on request from the authors. 9 Because we are conceiving of the accountability shock as a school-level treatment, we do not condition on teacher characteristics.
16

precision of the shock effect estimates generally increasing with the number of controls in the
model. Given the stability of our findings across model specifications, we focus on the fully
specified model -- the model that controls for school and district student characteristics and
school-level test score levels and gains (model 5) in the tables that follow. The descriptive results
and parsimonious model 1 results are both supported by our preferred specification, model 5.
Teachers teaching in downward shocked schools are 11 percent more likely to leave their schools
compared to teachers in no-shock schools post reform. Differences between upward shocked
schools and no-shock schools are not statistically significant throughout various specifications,
suggesting teachers in these schools are just as likely to leave their schools as their counterparts
in no-shock schools.
In the last two columns of Table 4 we report two conditional logit specifications. The first
conditional logit model is similar to logit model 5 with the exception that shock-level indicators
are now replaced by school fixed effects to better control for time-invariant school factors that
may affect teacher mobility. Schools and teachers may react differentially to upward and
downward accountability shocks that lead to different school grades. Figlio et al. (2007), for
instance, find that test scores for "F" graded schools change more than test scores for other
downward-shocked schools following the accountability policy change, and test scores decrease
in "A" graded schools relative to those in other upward-shocked schools. We are interested in
finding out whether teachers respond differently to being accountability-shocked to different
portions of the grading distribution as well. The final column of Table 4, therefore, presents an
augmented version of our most preferred specification broken out to reveal differences in
teachers’ responses by grade status.
17

Estimates in the final column of Table 4 show that teachers do indeed respond differently
when shocked to different portions of the school grading distribution. Teachers in schools whose
school grade unexpectedly falls to a "B", "C" or "D" are no more likely to leave their school than
are teachers in schools that did not experience a change in grade due to the new accountability
system. However, teachers in schools that experienced an unexpected drop into the failing
category are 42 percent more likely to leave their school than are teachers in schools that did not
experience an accountability shock. Once the difference between downward shock to "F" and
downward shocks to higher grades are taken into account, teachers in schools that were upward
shocked are found to be 6.5 percent less likely to leave their schools than teachers in no-shocked
schools. However, the impact on teacher job change from being upwardly shocked to a school
grade of “A” is not statistically different from that resulting from being upwardly shocked to a
“B” or “C” (there were no “F” schools in the pre-shock year).10 Hence, it appears that teachers
who receive unexpected good news about the rating of their school are moderately more likely to
stay in their current school whereas teachers are much more likely to depart their school if it is
unexpectedly hit with a failing grade.
Prior research on general teacher mobility distinguishes between moves between schools
within a district, moves between districts and exit from public school teaching and finds that
different factors can affect the type of move (c.f. Hanushek et al., 2004; Boyd, et al., 2005a;
Scafidi, et al., 2007; Feng, 2009). These studies show that working conditions have a large
impact on teacher mobility within a district, but inter-district moves and exits are more likely to
10 The coefficient of the differential effect of upward shock to "A" versus upward shock in general is actually positive, though statistically insignificant. While the sign of this differential relationship may seem surprising, it is consistent with the qualitative findings of Goldhaber and Hannaway (2004) that suggest that educators in "A" schools felt more under pressure to maintain their high grades than did educators in lower-rated schools.
18

be affected by factors other than working conditions, such as salary differentials and geographic
preferences. The accountability pressure under study here can be considered as a characteristic of
teachers’ working conditions and thus we would expect there be differential effects of
accountability pressure on the type of move. In particular, we would expect accountability
pressure to have a greater effect on within district moves and exits than on cross-district job
changes.
In Table 5 we present a set of conditional logit models by three possible transition
destinations: intra-district move, inter-district move, and exit Florida public school teaching.
The results are consistent with our general findings on the effect of accountability on teacher job
change as well as the evidence in the general teacher mobility literature on the differential effects
of working conditions on alternative types of teacher transitions. Schools shocked downward to
"F" grades tend to lose teachers to other schools in the same district. Specifically teachers in
these schools are nearly 67 percent more likely to move to a new school within the same district
than are teachers in schools that experienced no accountability shock. Not surprisingly,
movement of teachers between Florida’s countywide school districts is not significantly affected
by downward accountability shocks, including receipt of an “F” grade. Most likely such
relatively long-distance moves are governed primarily by external factors such as spousal job
changes or other significant family events, rather than a desire to change one’s work
environment. Being shocked down to a failing grade does increase the likelihood that a teacher
will exit the Florida public school system entirely. Although the exit effect is smaller, the
evidence suggests that teachers are both more likely to switch schools and to give up on public
school teaching when their school is designated as “failing.”
19
In contrast to downward accountability shocks, receipt of a higher school grade or
upward movement to an “A” grade does not have a statistically significant effect on either
within-district teacher mobility or on the probability of remaining as a public school teacher,
though the estimated effects on leaving teaching in the school district (or entirely) are on the
margin of statistical significance at conventional levels. Thus it appears that movements to the
left tail of the school grade distribution have the greatest consequences for both the total supply
of teachers and the distribution of teachers across schools.
VI. Teacher Quality and Differential Mobility
As numerous authors (e.g., Rivkin, Hanushek and Kain, 2005; Aaronson, Barrow and
Sander, 2007) have demonstrated, there exists dramatic within-school variation in the level of
teacher quality. The degree to which teacher mobility engendered by accountability pressures
affects the level and distribution of teacher quality across schools depends critically on which
teachers within a school stay or go. If relatively high-quality teachers depart schools facing
accountability pressure this could mitigate any direct benefits to student learning brought about
by the accountability system. In contrast, if increased pressure leads to (either voluntary or
involuntary) exit of the least capable teachers this could reinforce the direct positive effects of
accountability pressure.11
While teacher quality is multidimensional, for the purposes of this paper we simply
define teacher quality in terms of a teacher’s individual contribution to her student’s test scores.
This is possible in the state of Florida because of the ability to link individual teachers to the
11 For analyses of the effects of teacher mobility on teacher quality in non-accountability contexts see Goldhaber, Gross and Player (2007) and Feng and Sass (2008).
20
students for whom they are responsible on a classroom basis. Specifically, we estimate a so-
called “restricted value-added” model of student achievement of the following form:12
(8)
The gain in student achievement, ΔAit is a function of student/family inputs (Z), classroom-level
peer characteristics (P), a vector of teacher experience indicators (T),13 school-level inputs (S)
and a year-specific teacher effect, δ. The subscripts denote students (i), classrooms (j), teachers
(k), schools (m) and time (t).14 The model is estimated for both math achievement and for
reading achievement in all grades 3-10 over the period 1999/2000 – 2004/05.15 Only students
with a single teacher in the relevant subject area are included in the analysis.
The estimated value of the year-specific teacher effect, δkt, is our measure of teacher
quality. The teacher-by-year estimates are re-centered to have a mean value of zero in each
school level (elementary, middle, high) within each year. The estimates represent the average
achievement gain of a teacher’s students, for all classes taught in the relevant subject in a year,
controlling for student, peer and school characteristics as well as for teacher experience. Student
achievement is measured by year-to-year gains in the normalized-by-grade-and-year FCAT-NRT
12 We also produced teacher quality estimates from two alternative models: an “unrestricted” value-added model whereby current achievement is regressed on lagged achievement and the same set of controls as in equation (8) and a “restricted” value-added model like (8) in which student fixed effects were used to control for student heterogeneity. We obtain very similar results for the relationship between accountability pressure and teacher quality using these alternative specifications. Results using these alternative value-added specifications are available from the authors. 13 We control for teacher experience, but not other teacher characteristics, because we are interested in identifying measured teacher quality for a given level of experience. We have also estimated models in which teacher experience levels are excluded, and the results are fundamentally similar to those reported herein. 14 For a derivation of the value-added model and its implicit assumptions, see Todd and Wolpin (2003). 15 Details of the estimation sample and estimation procedures are provided in Harris and Sass (2007).
21
score. Thus the teacher effects are calibrated in standard deviation units. Since there are no
school-level fixed effects in the calculation of teacher effects, our year-specific teacher effect can
be interpreted as the effectiveness of a given teacher relative to all other teachers teaching the
same subject with the same level of experience at the same type of school.16 The teacher quality
measure can only be constructed for teachers who are responsible for teaching courses in the
subjects and grades covered by achievement testing, reading and math. In the following
discussion we focus on the quality and mobility of math teachers. Results for reading teachers
are very similar, and are available on request from the authors.
Table 6 reports the average teacher value added for stayers versus leavers in schools that
were negatively shocked, those that were positively shocked, and those that were un-shocked
when the accountability system changed. It appears that in the case of positively shocked and
un-shocked schools, the average quality of teachers did not change following the change in
school accountability. However, in the case of negatively shocked schools, the average teacher
quality of leavers and stayers both improved after the shock. While the average quality of
teachers who depart improved more that the average teacher quality of stayers the difference in
the quality of leavers and stayers as a result of downward accountability shocks is not
statistically significant.
In addition to comparing stayers and leavers within a given type of school, we also
compare the average quality of leavers between accountability-shocked schools and unshocked
schools in Table 7. The sample size is smaller than in Table 3 since some teachers are teaching
in non-tested subjects or grade levels or can’t be reliably matched to the performance of their
students. As a consequence, results must be interpreted with some caution. For schools
16 We also analyzed teacher quality measured not conditioned on experience and obtained similar results.
22

experiencing either no shock or an upward shock, the average quality of leavers does not change
significantly over time. In contrast, teachers who departed upwardly shocked schools were of
significantly higher measured quality than those who left downwardly shocked schools before
the accountability change. As a result, the difference between the quality of teachers who leave
downwardly shocked schools and those who depart no-shock schools increased over time. Thus
unexpected worsening of a schools grade lead to increases in both the number of teachers
departing and the average quality of teachers who leave, relative to schools that did not
experience a change in their school’s grade.
In Table 8 we make a similar comparison between the quality of stayers in shocked and
un-shocked schools. The average quality of stayers improved in downward shocked schools by
about 0.05 standard deviations in student achievement while there was no significant change in
the quality of teacher who stay in un-shocked schools. This is consistent with the findings of
Rouse et al. (2007), suggesting that downward-shocked schools experience larger test score gains
the year after the accountability shock. The apparent increase in stayer quality could be due to
positive effects of accountability (either increased resources like reading coaches or increased
pressure to perform) that improve teacher quality.
Table 9 demonstrates that the effects of downward accountability shocks on the quality of
teachers who stay and leave essentially balance out. Unexpected declines in a school’s grade
lead to higher quality teachers departing but also lead to improvements in the quality of teachers
who stay. The net result is that the difference between the quality of stayers and leavers in
downward-shock schools and the difference between the quality of stayers and leavers in no-
shock schools is unchanged. Thus it appears that increased accountability pressure has both
23
positive and negative effects on average teacher quality and that schools receiving unexpected
decreases in school grades do not lose ground on the teacher quality margin.
The mean changes in teacher value added might mask changes in the distribution of
movers and stayers. In order to understand the impact of accountability pressure on the
distribution of teacher quality, we plot kernel density estimates of the distribution of teacher
quality. Figure 1 illustrates the distribution of mathematics teacher quality before and after the
accountability shock by move status for schools that received no change in accountability and for
schools that experience increased pressure (downward shock) as a result of the change in the
school grading system. In zero-shock schools there is little difference in the quality distributions
of leavers and stayers, but the quality distribution of leavers shrinks after the accountability
system change. Un-shocked schools experience fewer instances of teachers leaving at both ends
of the quality spectrum. In schools with increased accountability pressure there are more
pronounced differences in the quality distributions of teachers who stay and those that leave.
Prior to the accountability system change, the quality distribution of movers is to the left of the
stayer distribution and the right tail of the stayer quality distribution is longer. Following the
accountability change, the right tail of the quality distribution of teachers staying in negatively-
shocked schools is truncated to become nearly equal to the right tail of the leaver quality
distribution. Further, the quality distribution of leavers shifts to the right while the distribution
of stayers remains relatively constant over time.
VII. Conclusion
This paper provides new evidence of the effects of school accountability systems on
teacher mobility. While prior papers on the subject analyzed the introduction of an
24
accountability system within a state, and therefore had no natural counterfactual, this study is the
first to exploit policy variation within the same state to study the effects of accountability on
teacher job changes.
Taking advantage of exogenous changes in accountability pressure for schools, we find
that schools that are downward-shocked – receiving a lower accountability grade post-change
than would have happened before – are less likely to retain their teachers than are schools that
received no accountability shock. While downward-shocked schools in general lose more
teachers, the effects are strongest for those shocked downward to a grade of "F". Teachers in
schools who unexpectedly receive a grade of "F" are over 40 percent more likely to leave their
school and are nearly 70 percent more likely to move to another school in the same district than
are teachers in schools that did not receive an accountability shock. We also find some evidence
the upward-shock schools are better able to retain their teachers than no-shock schools, though
the measured effects are smaller and less precise than for downward-shock schools.
The mobility caused by school accountability also has significant effects on the
distribution of teacher quality within and across schools. We find that downward accountability
shocks lead to an increase in the quality of teachers who leave. However, increased
accountability pressure also leads to improvements in the quality of teachers who remain in
downwardly shocked schools. In contrast, schools that are not hit with an accountability shock
do not experience any significant change to the quality of teachers that leave or stay. While the
quality differential between stayers and leavers does not change as a result of increased
accountability pressure, we do find that downward shocked schools experience changes to the
distribution of the quality of their teachers. The upper tail of the quality distribution of teachers
staying in negatively-shocked schools is truncated as a result of increased accountability
25
pressure. Further, the quality distribution of teachers who move shifts to the right while the
distribution of those who stay remains relatively constant. It may be the case that the distribution
of teachers staying or leaving schools shocked to "F" grades may be different, but we are hesitant
to make those comparisons given the relatively small number of "F" school teachers for whom
we have data to conduct the teacher quality analysis.
The results have strong implications for public policy. Struggling schools that come
under increased accountability pressure face many challenges in terms of changing instructional
policies and practices to facilitate student improvement. We have discovered that (in the case of
those facing the highest accountability pressure) they also face the challenge of having to replace
more teachers, and particularly, their higher-quality teachers (measured in terms of contribution
to value-added). On the positive side, schools facing increased accountability pressure also see a
rise in the average quality of the teachers who stay. It may be that those who stay respond work
harder as a result of increased accountability pressure or they may appear to be more productive
as a result of increases in complementary inputs like reading coaches. The findings presented in
this paper suggest that if these schools were able to retain more of their high-quality teachers
(perhaps through increased incentives to remain in the school), the accountability gains could be
greater still. This last argument, of course, is still speculative.
26

References
Aaronson, Daniel, Lisa Barrow, and William Sander (2007). “Teachers and Student Achievement in the Chicago Public High Schools,” Journal of Labor Economics 25(1): 95–135.
Boyd, Donald, Hamilton Lankford, Susanna Loeb, and James Wyckoff (2005). “Explaining the
Short Careers of High-Achieving Teachers in Schools with Low-Performing Students,” American Economic Review 95(2): 166-171.
Boyd, Donald, Hamilton Lankford, Susanna Loeb, and James Wyckoff (2008). “The Impact of
Assessment and Accountability on Teacher Recruitment and Retention: Are There Unintended Consequences?” Public Finance Review 36(1): 88-111.
Boyd, Donald, Hamilton Lankford, Pamela Grossman, Susanna Loeb, and James Wyckoff
(2006). “How Changes in Entry Requirements Alter the Teacher Workforce and Affect Student Achievement,” Education Finance and Policy 1(2): 176-216.
Carnoy, Martin and Susanna Loeb (2002). “Does External Accountability Affect Student
Outcomes? A Cross State Analysis,” Education Evaluation and Policy Analysis 24(4): 305-331.
Chakrabarti, Rajashri (2006). “Vouchers, Public School Response and the Role of Incentives:
Evidence from Florida,” Working Paper, Federal Reserve Bank of New York. Clark, Melissa (2002). “Education Reform, Redistribution, and Student Achievement: Evidence
from the Kentucky Education Reform Act,” Working paper, Princeton University. Clotfelter, Charles, Helen Ladd, and Jacob Vigdor (2006). “Teacher-Student Matching and the
Assessment of Student Effectiveness,” Journal of Human Resources 41(4): 778-820. Clotfelter, Charles, Helen Ladd, Jacob Vigdor, and Roger Aliaga Diaz (2004). “Do School
Accountability Systems Make It More Difficult for Low Performing Schools to Attract and Retain High Quality Teacher?” Journal of Policy Analysis and Management 23(2): 251-271.
Cullen, Julie Berry and Randall Reback (2007). “Tinkering Toward Accolades: School Gaming
Under a Performance Accountability System,” In: Gronberg, Timothy J., Jansen, Dennis W. (Eds.), Advances in Applied Microeconomics 14 (Improving School Accountability), Elsevier.
Feng, Li (2009). “Opportunity Wages, Classroom Characteristics, and Teacher Mobility,”
Southern Economic Journal 75(4), 1165-1190. Feng, Li (2010). “Hire Today, Gone Tomorrow: New Teacher Classroom Assignments and
Teacher Mobility,” Education Finance and Policy 5(3).
27

Feng, Li and Tim R. Sass (2008). “Teacher Quality and Teacher Mobility,” working paper,
Florida State University. Figlio, David (2006). “Testing, Crime and Punishment,” Journal of Public Economics 90(4):
837-851. Figlio, David and Lawrence Getzler (2007). “Accountability, Ability and Disability: Gaming the
System?” In: Gronberg, Timothy J., Jensen, Dennis W. (Eds.), Advances in Applied Microeconomics vol. 14 (Improving School Accountability), Elsevier.
Figlio, David, Dan Goldhaber, Jane Hannaway, and Cecilia Rouse (2007). “Accountability
Shocks and the Distribution of Student Achievement,” Working paper, University of Florida.
Figlio, David and Lawrence Kenny (2009). "Public Sector Performance Measurement and
Stakeholder Support," Journal of Public Economics 93(9-10): 1069-1077. Figlio, David and Maurice Lucas (2004). “What’s in a Grade? School Report Cards and the
Housing Market,” American Economic Review 94(3): 591-604. Figlio, David and Cecilia Rouse (2006). “Do Accountability and Voucher Threats Improve Low-
Performing Schools?” Journal of Public Economics 90(1-2): 239-255. Figlio, David and Joshua Winicki (2005). “Food for Thought? The Effects of School
Accountability Plans on School Nutrition,” Journal of Public Economics 89(2-3): 381-394.
Goldhaber, Dan, Bethany Gross, and Daniel Player (2007b). “Are Public Schools Really Losing
Their “Best”? Assessing the Career Transitions of Teachers and Their Implications for the Quality of the Teacher Workforce.” Working Paper #12. Washington DC: National Center for Analysis of Longitudinal Data in Education Research.
Goldhaber, Dan and Jane Hannaway (2004). “Accountability with a Kicker: Preliminary
Observations on the Florida A+ Accountability Plan,” Phi Delta Kappan 85(8): 598-605. Greene, Jay (2001). “An Evaluation of the Florida A-Plus Accountability and School Choice
Program,” Education Policy and Governance Occasional Paper: Harvard University. Haney, Walt (2000). “The Myth of the Texas Miracle in Education,” Education Policy Analysis
Archives 8(41). Haney, Walt (2002). “Lake Woebeguaranteed: Misuse of Test Scores in Massachusetts, Part I,”
Education Policy Analysis Archives 10(24). Hanushek, Eric, John Kain, and Steven Rivkin (2004). “Why Public Schools Lose Teachers,”
28
Journal of Human Resources 39(2): 326-354. Hanushek, Eric and Margaret Raymond (2005). “Does School Accountability Lead to Improved
Student Performance?” Journal of Policy Analysis and Management 24(2): 297-327. Harris, Douglas and Tim Sass (2007). “Teacher Training, Teacher Quality and Student
Achievement,” Working paper, Florida State University. Imazeki, Jennifer (2005). “Teacher Salaries and Teacher Attrition,” Economics of Education
Review 24(4): 431-449. Ingersoll, Richard (2001). “Teacher Turnover and Teacher Shortages: An Organizational
Analysis,” American Educational Research Journal 38(3): 499–534. Jacob, Brian (2005). “Accountability, Incentives and Behavior: The Impact of High-Stakes
Testing in the Chicago Public Schools,” Journal of Public Economics 89(5-6): 761-796. Jacob, Brian and Steven Levitt (2003). “Rotten Apples: An Investigation of the Prevalance and
Predictors of Teacher Cheating,” Quarterly Journal of Economics 118(3): 843-877. Koretz, Daniel and Sheila Barron (1998). “The Validity of Gains on the Kentucky Instructional
Results Information System (KIRIS),” Santa Monica, CA: RAND. MR-1014-EDU. Krieg, John (2006). “Teacher Quality and Attrition,” Economics of Education Review 25(1): 13-
27. Krieg, John (2008). “Are Students Left Behind? The Distributional Effects of the No Child Left
Behind Act,” Education Finance and Policy 3(2): 250-281. Lankford, Hamilton, Susanna Loeb, and James Wyckoff (2002). “Teacher Sorting and the Plight
of Urban Schools. A Descriptive Analysis,” Educational Evaluation and Policy Analysis 24(1): 37–62.
Neal, Derek and Diane Whitmore Schanzenbach (2010). “Left Behind by Design: Proficiency
Counts and Test-Based Accountability,” Review of Economics and Statistics 92(2): 263-283.
Podgursky, Michael, Ryan Monroe and Donald Watson (2004). “The Academic Quality of
Public School Teachers: An Analysis of Entry and Exit Behavior,” Economics of Education Review 23(5): 507-518.
Reback, Randall (2009). "Teaching to the Rating: School Accountability and the Distribution of
Student Achievement," Journal of Public Economics 93(1-2): 352-353. Rivkin, Steven, Eric Hanushek, and John Kain (2005). "Teachers, Schools, and Academic
Achievement," Econometrica 73(2): 417-458.
29

Rockoff, Jonah (2004). "The Impact of Individual Teachers on Student Achievement: Evidence
from Panel Data," American Economic Review 94(2): 247-252. Rouse, Cecilia, Jane Hannaway, Dan Goldhaber and David Figlio (2007). “Success Under
Pressure? How Low-Performing Schools Respond to Voucher and Accountability Pressure,” Working paper, Princeton University and University of Florida.
Scafidi, Benjamin, David Sjoquist, and Todd Stinebrickner (2007). “Race, Poverty and Teacher
Mobility,” Economics of Education Review 26(2): 145-159. Todd, Petra and Kenneth Wolpin (2003). “On the Specification and Estimation of the Production
Function for Cognitive Achievement,” Economic Journal 113(485): F3-F33.
West, Martin and Paul Peterson (2006). “The Efficacy of Choice Threats Within School Accountability Systems: Results from Legislatively Induced Experiments,” Economic Journal 116(510): C46-C62.
30

Table 1: The Distribution of School Grades, by Year
School Year
School Grade
Summer 1999
Summer 2000
Summer 2001
Summer 2002
Summer 2003
Summer 2004
A 183 552 570 887 1235 1203
B 299 255 399 549 565 515
C 1180 1115 1074 723 533 568
D 565 363 287 180 135 170
F 70 4 0 60 31 34
N 0 0 76 102 2 0
Total 2297 2289 2330 2501 2501 2490 Source: Authors’ calculations from state data.
31

Table 2: Transition Matrix in Predicted Grades Based on 2002 Grade Change (row fractions)
Grade in 2002 based on new (summer 2002) grading system
A B C D F
A 0.90 [284]
0.11 [33]
0.00 [0]
0.00 [0]
0.00 [0]
B 0.59 [390]
0.32 [209]
0.09 [61]
0.00 [1]
0.00 [0]
C 0.18 [206]
0.26 [301]
0.49 [567]
0.06 [69]
0.00 [3]
D 0.02 [4]
0.01 [3]
0.37 [92]
0.41 [103]
0.20 [49]
Simulated grade in 2002 based on old
(summer 2001)
grading system
F 0.00 [0]
0.00 [0]
0.00 [0]
0.29 [2]
0.71 [5]
Notes: All row fractions are student-weighted. The number of schools is in brackets. Simulated grade changes are generated by applying both the old grading system and the new grading system to 2002 student test scores, using the approach introduced by Rouse et al. (2007). They are therefore generated based on precisely the same student tests; the only differences in the calculations are the formulas used to convert these same tests into school grades.
32
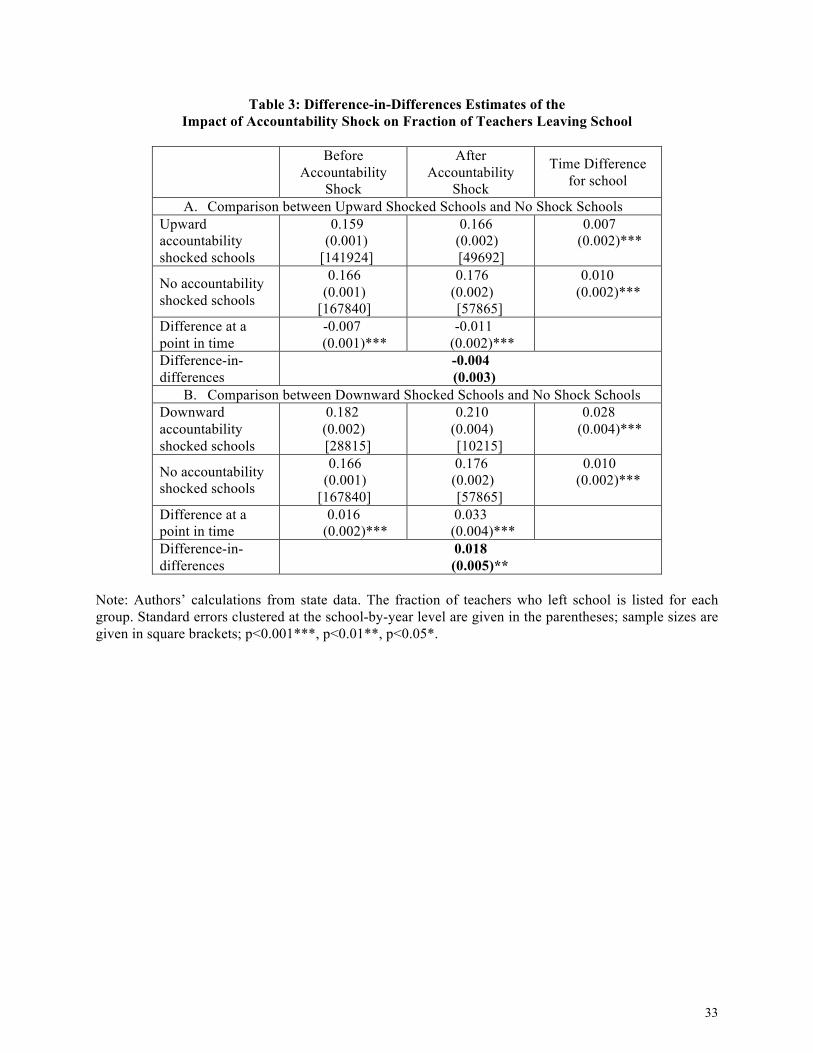
Table 3: Difference-in-Differences Estimates of the Impact of Accountability Shock on Fraction of Teachers Leaving School
Before
Accountability Shock
After Accountability
Shock
Time Difference for school
A. Comparison between Upward Shocked Schools and No Shock Schools Upward accountability shocked schools
0.159 (0.001)
[141924]
0.166 (0.002)
[49692]
0.007 (0.002)***
No accountability shocked schools
0.166 (0.001)
[167840]
0.176 (0.002)
[57865]
0.010 (0.002)***
Difference at a point in time
-0.007 (0.001)***
-0.011 (0.002)***
Difference-in-differences
-0.004 (0.003)
B. Comparison between Downward Shocked Schools and No Shock Schools Downward accountability shocked schools
0.182 (0.002)
[28815]
0.210 (0.004)
[10215]
0.028 (0.004)***
No accountability shocked schools
0.166 (0.001)
[167840]
0.176 (0.002)
[57865]
0.010 (0.002)***
Difference at a point in time
0.016 (0.002)***
0.033 (0.004)***
Difference-in-differences
0.018 (0.005)**
Note: Authors’ calculations from state data. The fraction of teachers who left school is listed for each group. Standard errors clustered at the school-by-year level are given in the parentheses; sample sizes are given in square brackets; p<0.001***, p<0.01**, p<0.05*.
33

Table 4: Logit/Conditional Logit Estimates of the Effect of Accountability Shocks in Summer 2002 on the Odds of Teacher Job Change Between the 2002-03 and 2003-04 School Years
Logit Conditional Logit
Model 1 Model 2 Model 3 Model 4 Model 5 Model 5 Model 6
Effect of downward accountability shock (downward shocked schools after policy shock)
1.111 (0.072)
[p=0.10]
1.110 (0.072)
[p=0.11]
1.116 (0.068)
[p=0.07]
1.124 (0.067)
[p=0.05]
1.121 (0.069)
[p=0.06]
1.103 (0.073)
[p=0.14]
0.981 (0.051)
[p=0.71]
Effect of upward accountability shock (upward shocked schools after policy shock)
0.977 (0.031)
[p=0.48]
0.975 (0.031)
[p=0.42]
0.971 (0.031)
[p=0.35]
0.972 (0.031)
[p=0.36]
0.965 (0.032)
[p=0.29]
0.962 (0.029)
[p=0.20]
0.935 (0.036)
[p=0.08]
Effect of being downward shocked to grade F
1.424
(0.220) [p=0.02]
Effect of being upward shocked to grade A
1.051
(0.047) [p=0.27]
Year and post-shock indicators, shock-type fixed effect (logit) or school fixed effect (conditional logit)
District-level demographics
School-level demographics
School-level FCAT math score
School-level math score gains
Number of teacher year observations 456,342 456,342 438,245 438,071 384,637 384,598 384,598
Note: The parameter estimates presented above are expressed in terms of odds ratios relative to the un-shocked set of teachers. Standard errors clustered at the school-by-year level are in parentheses beneath parameter estimates. The dependent variable for the logit models is the probability that a teacher will leave a school between year t and t+1. The logit models also include indicators for year, the post-shock period, an upward shocked school fixed effect, a downward shocked school fixed effect and school and district characteristics such as percent of minority students (Black, Hispanic), percent of students on free
34

or reduced lunch program, average math score on the Sunshine Standards FCAT, disciplinary incidents, and school-level math FCAT raw score gains. The dependent variable for conditional logit models are the probability that a teacher will leave a school within the school district between year t and t+1. In the conditional logit model school fixed effects replace the shock level fixed effects in logit model.
35
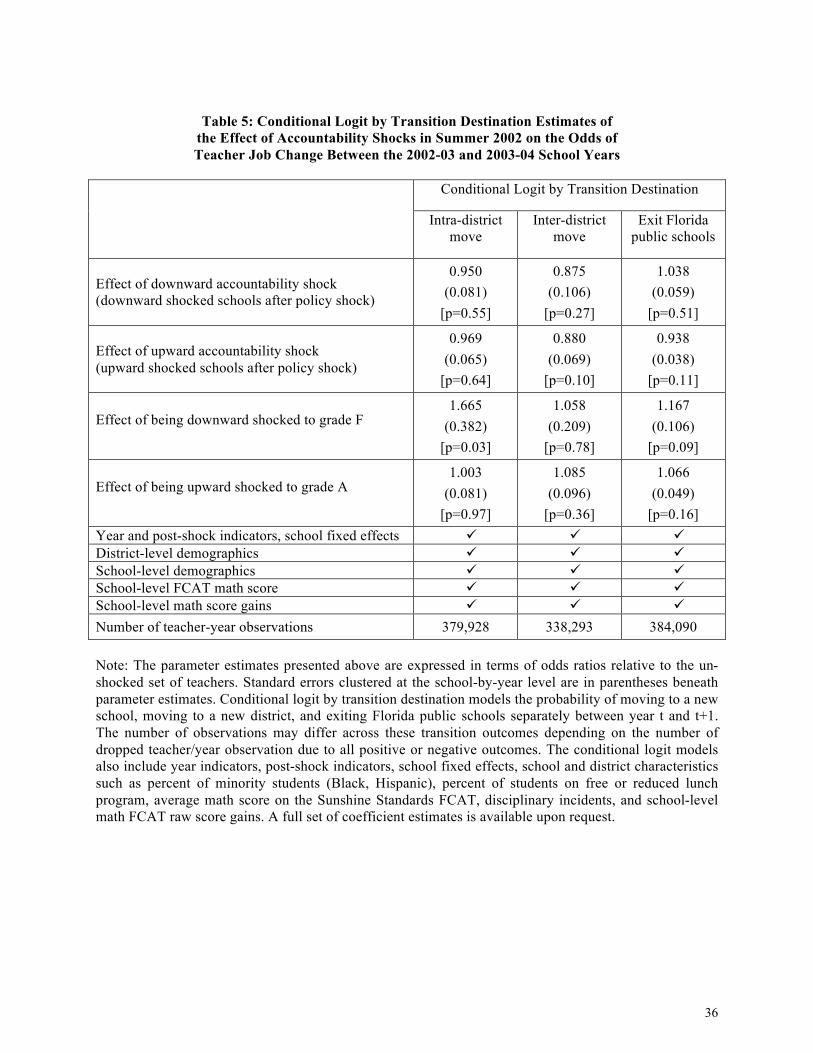
Table 5: Conditional Logit by Transition Destination Estimates of
the Effect of Accountability Shocks in Summer 2002 on the Odds of Teacher Job Change Between the 2002-03 and 2003-04 School Years
Conditional Logit by Transition Destination
Intra-district move
Inter-district move
Exit Florida public schools
Effect of downward accountability shock (downward shocked schools after policy shock)
0.950 (0.081)
[p=0.55]
0.875 (0.106)
[p=0.27]
1.038 (0.059)
[p=0.51]
Effect of upward accountability shock (upward shocked schools after policy shock)
0.969 (0.065)
[p=0.64]
0.880 (0.069)
[p=0.10]
0.938 (0.038)
[p=0.11]
Effect of being downward shocked to grade F 1.665
(0.382) [p=0.03]
1.058 (0.209)
[p=0.78]
1.167 (0.106)
[p=0.09]
Effect of being upward shocked to grade A 1.003
(0.081) [p=0.97]
1.085 (0.096)
[p=0.36]
1.066 (0.049)
[p=0.16] Year and post-shock indicators, school fixed effects District-level demographics School-level demographics School-level FCAT math score School-level math score gains Number of teacher-year observations 379,928 338,293 384,090 Note: The parameter estimates presented above are expressed in terms of odds ratios relative to the un-shocked set of teachers. Standard errors clustered at the school-by-year level are in parentheses beneath parameter estimates. Conditional logit by transition destination models the probability of moving to a new school, moving to a new district, and exiting Florida public schools separately between year t and t+1. The number of observations may differ across these transition outcomes depending on the number of dropped teacher/year observation due to all positive or negative outcomes. The conditional logit models also include year indicators, post-shock indicators, school fixed effects, school and district characteristics such as percent of minority students (Black, Hispanic), percent of students on free or reduced lunch program, average math score on the Sunshine Standards FCAT, disciplinary incidents, and school-level math FCAT raw score gains. A full set of coefficient estimates is available upon request.
36
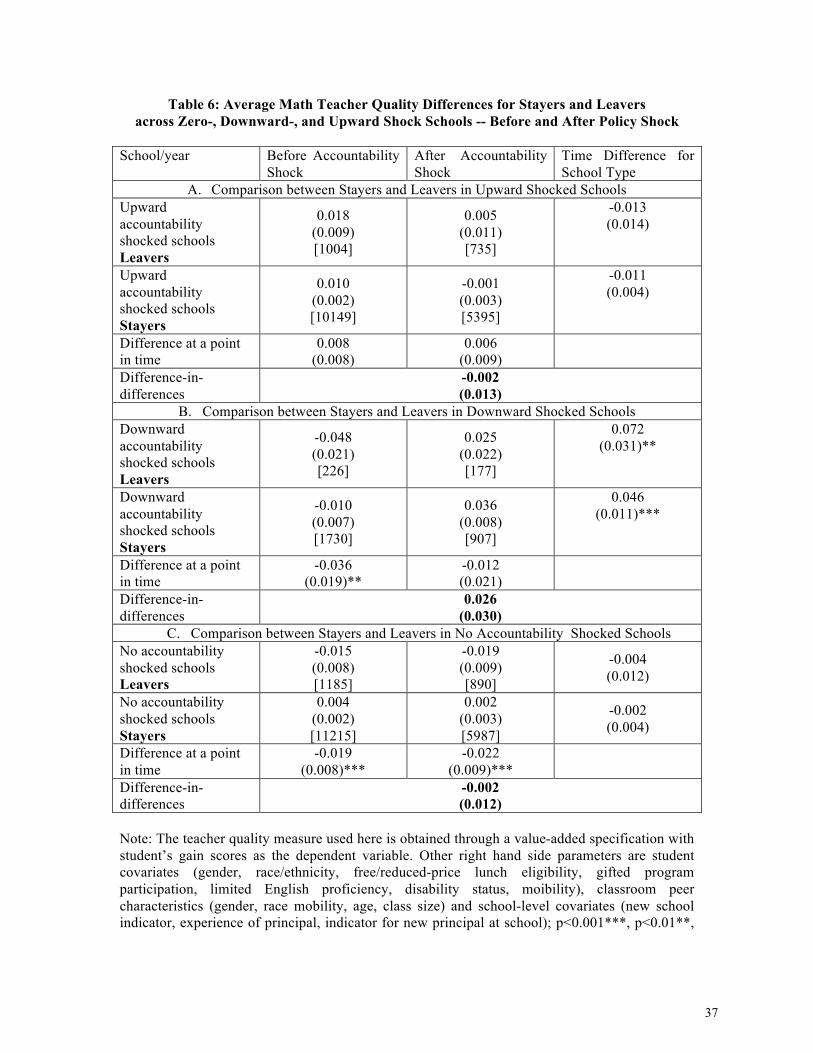
Table 6: Average Math Teacher Quality Differences for Stayers and Leavers across Zero-, Downward-, and Upward Shock Schools -- Before and After Policy Shock
School/year Before Accountability
Shock After Accountability Shock
Time Difference for School Type
A. Comparison between Stayers and Leavers in Upward Shocked Schools Upward accountability shocked schools Leavers
0.018 (0.009) [1004]
0.005 (0.011) [735]
-0.013 (0.014)
Upward accountability shocked schools Stayers
0.010 (0.002) [10149]
-0.001 (0.003) [5395]
-0.011 (0.004)
Difference at a point in time
0.008 (0.008)
0.006 (0.009)
Difference-in-differences
-0.002 (0.013)
B. Comparison between Stayers and Leavers in Downward Shocked Schools Downward accountability shocked schools Leavers
-0.048 (0.021) [226]
0.025 (0.022) [177]
0.072 (0.031)**
Downward accountability shocked schools Stayers
-0.010 (0.007) [1730]
0.036 (0.008) [907]
0.046 (0.011)***
Difference at a point in time
-0.036 (0.019)**
-0.012 (0.021)
Difference-in-differences
0.026 (0.030)
C. Comparison between Stayers and Leavers in No Accountability Shocked Schools No accountability shocked schools Leavers
-0.015 (0.008) [1185]
-0.019 (0.009) [890]
-0.004 (0.012)
No accountability shocked schools Stayers
0.004 (0.002) [11215]
0.002 (0.003) [5987]
-0.002 (0.004)
Difference at a point in time
-0.019 (0.008)***
-0.022 (0.009)***
Difference-in-differences
-0.002 (0.012)
Note: The teacher quality measure used here is obtained through a value-added specification with student’s gain scores as the dependent variable. Other right hand side parameters are student covariates (gender, race/ethnicity, free/reduced-price lunch eligibility, gifted program participation, limited English proficiency, disability status, moibility), classroom peer characteristics (gender, race mobility, age, class size) and school-level covariates (new school indicator, experience of principal, indicator for new principal at school); p<0.001***, p<0.01**,
37
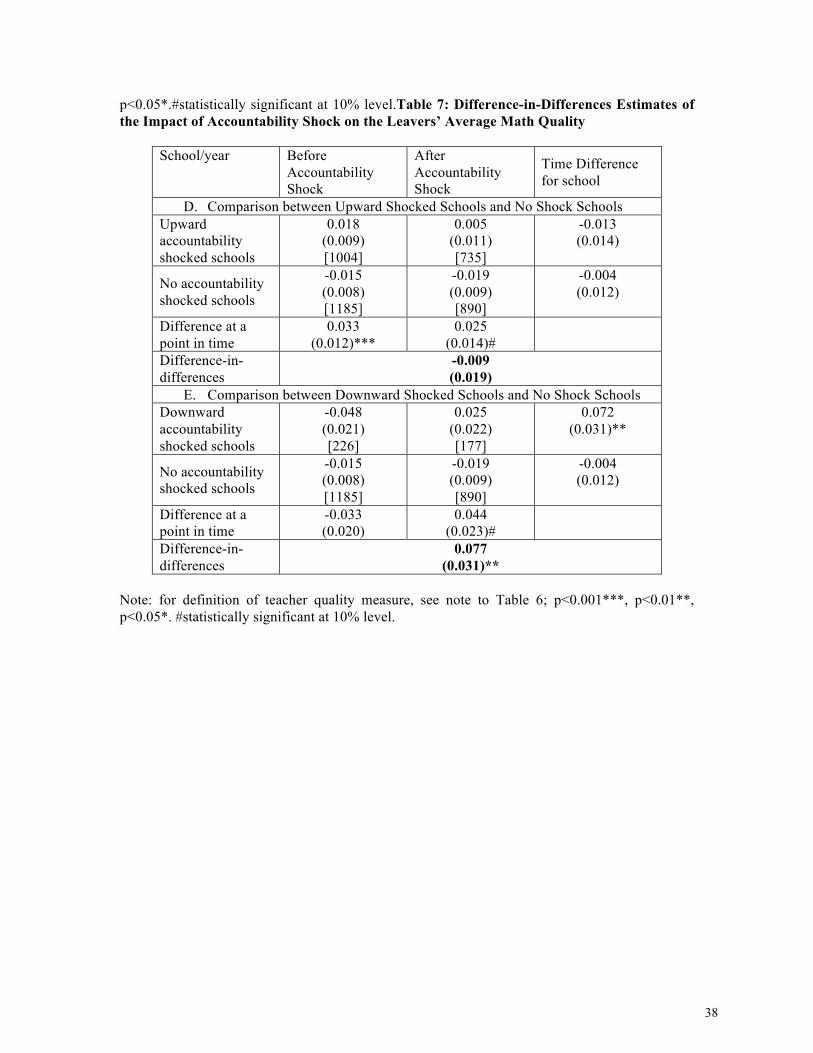
p<0.05*.#statistically significant at 10% level.Table 7: Difference-in-Differences Estimates of the Impact of Accountability Shock on the Leavers’ Average Math Quality
School/year Before Accountability Shock
After Accountability Shock
Time Difference for school
D. Comparison between Upward Shocked Schools and No Shock Schools Upward accountability shocked schools
0.018 (0.009) [1004]
0.005 (0.011) [735]
-0.013 (0.014)
No accountability shocked schools
-0.015 (0.008) [1185]
-0.019 (0.009) [890]
-0.004 (0.012)
Difference at a point in time
0.033 (0.012)***
0.025 (0.014)#
Difference-in-differences
-0.009 (0.019)
E. Comparison between Downward Shocked Schools and No Shock Schools Downward accountability shocked schools
-0.048 (0.021) [226]
0.025 (0.022) [177]
0.072 (0.031)**
No accountability shocked schools
-0.015 (0.008) [1185]
-0.019 (0.009) [890]
-0.004 (0.012)
Difference at a point in time
-0.033 (0.020)
0.044 (0.023)#
Difference-in-differences
0.077 (0.031)**
Note: for definition of teacher quality measure, see note to Table 6; p<0.001***, p<0.01**, p<0.05*. #statistically significant at 10% level.
38

Table 8: Difference-in-Differences Estimates of the Impact of Accountability Shock on the
Stayers’ Average Math Quality
School/year Before Accountability Shock
After Accountability Shock
Time Difference for school
A. Comparison between Upward Shocked Schools and No Shock Schools Upward accountability shocked schools
0.010 (0.002) [10149]
-0.001 (0.003) [5395]
-0.011 (0.004)
No accountability shocked schools
0.004 (0.002) [11215]
0.002 (0.003) [5987]
-0.002 (0.004)
Difference at a point in time
0.006 (0.003)#
-0.003 (0.005)
Difference-in-differences
-0.009 (0.006)
B. Comparison between Downward Shocked Schools and No Shock Schools Downward accountability shocked schools
-0.010 (0.007) [1730]
0.036 (0.008) [907]
0.046 (0.011)***
No accountability shocked schools
0.004 (0.002) [11215]
0.002 (0.003) [5987]
-0.002 (0.004)
Difference at a point in time
-0.015 (0.007)*
0.034 (0.009)***
Difference-in-differences
0.048 (0.011)***
Note: for definition of teacher quality measure, see note to Table 6; p<0.001***, p<0.01**, p<0.05*. #statistically significant at 10% level.
39

Table 9: Difference-in-Differences Estimates of the Impact of Accountability Shock on the
School Average Math Teacher Quality Difference between Stayers and Leavers
School/year Before Accountability Shock
After Accountability Shock
Time Difference for school
A. Comparison between Upward Shocked Schools and No Shock Schools Upward accountability shocked schools
-0.011 (0.011) [685]
-0.017 (0.014) [483]
-0.006 (0.017)
No accountability shocked schools
0.015 (0.011) [801]
0.021 (0.011) [575]
0.006 (0.016)
Difference at a point in time
-0.026 (0.015)*
-0.039 (0.018)*
Difference-in-differences
-0.012 (0.024)
B. Comparison between Downward Shocked Schools and No Shock Schools Downward accountability shocked schools
0.042 (0.026) [145]
0.041 (0.027) [107]
-0.001 (0.039)
No accountability shocked schools
0.015 (0.011) [801]
0.021 (0.011) [575]
0.006 (0.016)
Difference at a point in time
0.027 (0.027)
0.019 (0.031)
Difference-in-differences
-0.007 (0.041)
Note: for definition of teacher quality measure, see note to Table 6; p<0.001***, p<0.01**, p<0.05*. #statistically significant at 10% level.
40

Figure 1: Kernel Density Estimates of Teacher Quality Distribution by School Type and Move Status, Before and After Accountabiltiy Shock
41