school construction strategies for universal primary
TRANSCRIPT

AFRICA HUMAN DEVELOPMENT SERIES
School Construction Strategiesfor Universal Primary Educationin AfricaShould Communities Be Empowered to Build Their Schools? Serge Theunynck
48898P
ublic
Dis
clos
ure
Aut
horiz
edP
ublic
Dis
clos
ure
Aut
horiz
edP
ublic
Dis
clos
ure
Aut
horiz
edP
ublic
Dis
clos
ure
Aut
horiz
edP
ublic
Dis
clos
ure
Aut
horiz
edP
ublic
Dis
clos
ure
Aut
horiz
edP
ublic
Dis
clos
ure
Aut
horiz
edP
ublic
Dis
clos
ure
Aut
horiz
ed


School ConstructionStrategies forUniversal Primary Education in Africa


Washington, DCTHE WORLD BANK
School ConstructionStrategies for Universal PrimaryEducation in Africa
SHOULD COMMUNITIES BEEMPOWEREDTO BUILD THEIR SCHOOLS?
Serge Theunynck

© 2009 The International Bank for Reconstruction and Development / The World Bank1818 H Street, NWWashington, DC 20433Telephone 202-473-1000Internet www.worldbank.orgE-mail [email protected]
All rights reserved.
1 2 3 4 12 11 10 09
This volume is a product of the staff of the International Bank for Reconstruction and Development /The World Bank. The findings, interpretations, and conclusions expressed in this volume do not necessarily reflect the views of the Executive Directors of The World Bank or the governments theyrepresent.
The World Bank does not guarantee the accuracy of the data included in this work. The boundaries,colors, denominations, and other information shown on any map in this work do not imply any judgment on the part of The World Bank concerning the legal status of any territory or the endorsementor acceptance of such boundaries.
Rights and Permissions
The material in this publication is copyrighted. Copying and/or transmitting portions or all of this workwithout permission may be a violation of applicable law. The International Bank for Reconstructionand Development / The World Bank encourages dissemination of its work and will normally grant permission to reproduce portions of the work promptly.
For permission to photocopy or reprint any part of this work, please send a request with complete information to the Copyright Clearance Center Inc., 222 Rosewood Drive, Danvers, MA 01923, USA; telephone: 978-750-8400; fax: 978-750-4470; Internet: www.copyright.com.
All other queries on rights and licenses, including subsidiary rights, should be addressed to theOffice of the Publisher, The World Bank, 1818 H Street NW, Washington, DC 20433, USA; fax: 202-522-2422; e-mail: [email protected].
ISBN: 973-0-8213-7720-8eISBN: 973-0-8213-7721-5DOI: 10.1596/973-0-8213-7720-8
Cover photo: Arne Hoel / World Bank
Library of Congress Cataloging-in-Publication Data
School construction strategies for universal primary education in Africa : should communities be empowered to build their schools? / World Bank.
p. cm.Includes bibliographical references.ISBN 978-0-8213-7720-8 (paper pack) — ISBN 978-0-8213-7721-5 (e-book)
1. School buildings—Design and construction—Africa. 2. Education , Primary—Aims and objectives—Africa. 3. Education—Parent participation—Africa. 4. Community organization—Africa.5. Rural development projects—Africa. I. World Bank.
LB2319.A4S36 2009372.16096
2009018199
v
Preface xi
Acknowledgments xiiiAbbreviations xv
CHAPTER 1. THE CHALLENGES OF AFRICA’S PRIMARY SCHOOL INFRASTRUCTURE 1
The Growth Trend in Primary School Classrooms 1The Quality of Primary School Infrastructure 2Conclusion 12
CHAPTER 2. SCHOOL LOCATION PLANNING AND CONSTRUCTION NORMS 15
School Location Planning 15School Quality Norms 19Inefficiencies of Centralized Planning 24Conclusion 25
CHAPTER 3. CLASSROOM CONSTRUCTION TECHNOLOGY 29
The Classic Classroom 29The School Shelter 32Local Materials and Appropriate Technology Classrooms 35Industrialized Prefabrication 40Classroom Prefabrication 42The Modern Construction Model 45Conclusion 48
CHAPTER 4. TECHNOLOGY FOR SANITATION AND WATER 51
Sanitation in Schools 51Water Supply for Schools 53Conclusion 54
Contents

vi • Contents
CHAPTER 5. PROCUREMENT AND CONTRACT MANAGEMENT 55
Procurement Managed by Central Administration 55Delegation of Contract Management 66Decentralization of Contract Management 88Conclusions 106
CHAPTER 6. SETTING UP COMMUNITY MANAGEMENT 111
Accountability 112Community Empowerment 116
CHAPTER 7. SCHOOL MAINTENANCE 125
CHAPTER 8. CORRUPTION IN SCHOOL CONSTRUCTION 129
CHAPTER 9. THE DONOR FACTOR 135
CHAPTER 10. FRAMEWORK FOR ACTION 139
What Countries Should Do 142What Donors Should Do 147Areas for Further Research 148
APPENDIXES
1. School Infrastructure Matters: The Research Evidence 1512. Architectural Design of Primary Schools: Examples of 2- and
3-Classroom Blocks 1563. Examples of Appropriate Technology Schools 1594. Examples of Latrine Technology 1615. A Brief History of Industrialization in the Construction Industry Worldwide 1626. Unit Costs of Some Contract Management Agencies
in School Construction 1647. Implementation Schemes for School Construction Projects
Sponsored by NGOS 1668. Decentralization of School Construction in Africa: Country Examples 1689. The CDD Implementation Process in Benin and Uganda 172
10. School Construction by Local Government Implementation Arrangements 17311. Stakeholder Roles for Primary School Construction in a CDD Approach 17512. Toolkits to Harmonize Norms and Standards and Implementation Strategies 17713. Illustrations from the Senegal Social Fund Community Handbook 179

Contents • vii
14. Detailed Projections of the Classroom Needs 18015. Summary of the Various Implementation Schemes 18316. The Situation of School Construction Programs in Selected African Countries:
Who Does What and How 18417. List of Projects Reviewed 215
REFERENCES 225
INDEX 247
BOXES
2.1 School Buildings as a Learning Aid at No Cost 223.1 School Construction Programs: A Chance for the Informal Sector 313.2 The Shelter Model in Ghana 353.3 Three Experiences with Prefabricated Classroom Construction 465.1 Contracting to NGOs—The Case of Guinea 785.2 Community Delegation in Mauritania 936.1 Norms to Be Established by MoEs 1146.2 Essentials for a Community Request 1156.3 Essential Elements of a Financial Agreement 1186.4 Community-based Procurement: Key Features 1196.5 Handbook Essentials 1207.1 Budgeting for School Maintenance in Pakistan 1278.1 Factors That Facilitate and Limit Corruption in School Construction 1318.2 Approach to Limit Corruption at the Community Level:
The Senegal Social Fund 1329.1 Characteristics of Sectorwide Approaches 137
10.1 Essential Elements of Stocktaking Exercise 14310.2 Technical Audit and Beneficiary Assessment: Key Features 147
TABLES
1.1 Growth in Classroom Stock, Needs versus Actual 21.2 Number and Condition of Primary Classrooms 31.3 Availability of Latrines and Water 41.4 Cost of Furniture per Classroom 61.5 Indicators of Overcrowding 91.6 School Construction Needs, 2005–2015, for 33 African IDA Countries 122.1 School Size and Minimum Village Population Required 182.2 Average Net Classroom Area (m2) Over Time 212.3 Office and Storage as Percentage of Classroom Area in 10 Selected Projects 232.4 Unit Cost of Teacher Housing in Selected Countries 243.1 Range in Unit Costs of the Classic Classroom Technology in Senegal 333.2 Unit Cost of Local Material Technology Compared to Informal Sector 383.3 Comparison of the Cost of Prefabricated Classrooms Compared with the Clas-
sic Model 43

viii • Contents
4.1 Unit Cost of Latrines in Selected Countries 524.2 Cost of Water Supply per School in Selected Countries 545.1 Costs of ICB Combined with Community Participation Compared to Other
Methods 605.2 Evolution of Gross Unit Costs of Classrooms Procured through
ICB and NCB 645.3 AGETIP Performance at Inception Compared to Previous Administrations 715.4 AGETIP Performance Compared to MoE Administration through Other
Arrangements 715.5 Unit Costs of Classrooms Built by NGOs (3 approaches) Compared with
Other Methods 765.6 Cost of Classrooms Built by Social Funds Operating as Contract Management
Agencies, Compared to Other Agencies 855.7 Cost of Classrooms Built by Social Funds with Community Implementation,
Compared to Other Agencies 865.8 Cost of Classrooms Built by Deconcentrated Branches of Administration
Compared with Other Agencies 915.9 Cost of Classrooms Built by Communities Compared with Other Management
Arrangements 955.10 Status of Decentralization of School Construction in Selected Countries 965.11 Cost of Classroom Construction Built by Local Government through Different
Modalities Compared with Other Agencies 985.12 Examples of Gross Unit Costs Obtained in Benin, Ghana, Senegal, and
Uganda 1005.13 Regression Estimates of the Impact of Project- and Country-Specific Variables
on the Classroom Construction Cost per Gross m2 from Various Classroom Construction Projects 102
5.14 Parallel Centralized and Decentralized Projects/Programs During 2000–04 inSelected African Countries 104
5.15 Local Government Expenditure as a Share of GDP and Government Expenditure, 1997–99 104
5.16 Status of Decentralization of School Construction in Selected Countries 1057.1 The Cost of Maintenance 128
10.1 School Construction Needs, 2005–15, for 33 African IDA Countries 14010.2 Financing Needs for EFA in 2015 in 33 African Countries 14110.3 Estimated Annual Cost of Maintenance of the Programs to Be Built in the 33
African Countries During 2005–15 14210.4 A Stock-taking Exercise on Who Does What and How in Primary School
Construction: Example with Ghana 145A12.1 Norms and Standards 177A12.2 Toolkit for Donor Harmonization in Implementation Strategies 178
FIGURES
1.1 Typical School Furniture in African Classrooms 51.2 Gross Enrollment Rates and Distance to School in Chad, Guinea,
Mali, and Niger 7

Contents • ix
1.3 Cross-Country Comparison of Randomness in the Allocation of Classrooms across Primary Schools 11
1.4 Primary Gross Enrollment Ratios in Ethiopia, Urban and Rural 112.1 Economies of Scale in Primary Education: Expenditure per
Student as a Function of School Enrollment 172.2 Distribution of Villages and Schools in Eastern Chad
(Mongo subprefecture) 182.3 Standard Classroom in Senegal in the 1990s 202.4 Minimum Area per Student 203.1 The Most Common Classic Classroom Type 303.2 The School Shelter Model: The Example of Niger 343.3 The Earth-built Literacy Center in Chical Built by the NGO Development
Workshop in 1980 363.4 A Typical Local Materials Classroom: Niger IDA-financed
Education II Project 363.5 Technologies Used in United States Home Construction, by Region, 2001 413.6 Prefabricated Classroom in Madagascar—The Steel Structure 423.7 Scheme of the Industrialized Prefabrication of Classrooms in Madagascar 443.8 The European Union Fund Model 473.9 A Simple and Modest Classroom: The Mauritanian Model 484.1 The Dry Pit Latrine: An Example from Mali 524.2 Handicap-Friendly Latrine: The Example of Uganda 525.1 Centralized Bulk Procurement Process 575.2 Scheme of Combining Bulk Procurement of Imported Materials with
Community Participation 595.3 Scheme of Combining Bulk Procurement of Imported Materials with
Microenterprises: The Example of Niger (1987–2001) 635.4 Centralized National Competitive Bidding 645.5 Cost per Gross m2 of Classroom Works Procured by Administration through
ICB and NCB 655.6 Management of School Construction by a Contract Management Agency 695.7 Cost per Gross m2 of Classroom Works Procured by Administration through ICB
and NCB, and by CMAs through NCB 725.8 Scheme of School Construction Implemented by NGOs 745.9 Cost per Gross m2 of Classroom Works Procured by Administration, CMAs,
and NGOs 755.10 Social Fund Operating as a Contract Management Agency for
Communities 815.11 Social Funds Operating as a Financer of Communities to Implement
Their Project 825.12 Cost per Gross m2 of Classrooms Procured by Administration (ICD and NCB),
CMAs, NGOs, and Social Funds When They Act as CMAs 845.13 Deconcentration of Implementation Responsibilities to Lower Levels
of Administration 895.14 Cost per Gross m2 of Classrooms Procured by Administration (ICB and NCB),
CMAs, NGOs, SF (as CMAs), and MoE Decentralized Offices 905.15 Delegation by Ministry of Education to Communities 92
x • Contents
5.16 Devolution of School Construction to Local Governments 975.17 Cost per Gross m2 of Classrooms Procured by Administration (ICB-NCB),
CMAs, NGOs, SFs (as CMAs) and MoE Decentralized, and Local Governments 97
5.18 Cost per Gross m2 of Classrooms Procured by Administrative CMAs, NGOs,SFs (as CMAs), Local MoEs Decentralized, Local Governments, and Communities 101
5.19 Simultaneous IDA-funded Projects Financing School Construction with Differ-ent Approaches in Senegal. 2005 106
6.1 The CDD Scheme for School Construction 1126.2 School Construction in a CDD Approach: Main Responsibilities of the Four
Actors 1136.3 Senegal Social Fund Handbook Illustration for Training Communities in
Establishing a Community Development Committee 1196.4 Deconcentrated Planning, Community Empowerment, and Financing through
Fiduciary Agency 12210.1 Total Classroom Construction Needs for 33 African IDA Countries 140A3.1 The Koranic School of Malika, Senegal 1978: Sand-Cement Vault
Technology 159A3.2 Rosso (Mauritania) 1979: School Built with Earth and Vault Technology by the
NGO ADAUA 159A3.3 Diaguily School, Mauritania, 1988: Sand-Cement Vault Technology by
UNESCO 159A3.4 Earth-built School in Niger (1986–87) by MoE with World Bank
Assistance 159A3.5 Primary Schools with Stabilized Earth Bricks, Senegal, 1984 160A3.6 Typical Implementation Scheme for International NGOs Using Local Materials
Construction 160A10.1 Devolution to Local Governments that Directly Implement School
Construction 173A10.2 Delegation to Local Government and Subsequent Delegation to CMAs 174A10.3 Devolution to Local Governments and Subsequent Delegation to Local
Communities 174A14.1 Additional Classrooms Needed for 33 African IDA Countries 180A14.2 Need for Replacement of Temporary Classrooms for 33 African
IDA Countries 181A14.3 Need for Replacement of Overaged Classrooms for 33 African
IDA Countries 181A14.4 Total Classroom Construction Needs for 33 African IDA Countries 182

According to 2005 estimates from the United Nations Education, Scientific andCultural Organization (UNESCO), an estimated 45 million children do notattend primary school in Sub-Saharan Africa. Yet over the past decade, African
countries have made significant progress in expanding access to primary education,and particularly since the year 2000. This progress was buoyed by a higher level ofpolitical will and better education policies within countries, and through a varietyof commitments, made between donors and country recipients, that promise toincrease aid for primary education and improve its effectiveness. These agreementsinclude, for example, the Education for All (EFA) goals adopted in 1990 and again in2000, the Millennium Development Goals (MDGs) adopted in 2000, the MonterreyConsensus of 2002, and the Rome and Paris Declarations on Alignment and Har-monization agreed to in 2003 and 2005, respectively.
In 2002, developing countries, donors, and other development partners also cre-ated a global partnership, the Education For All–Fast Track Initiative (EFA-FTI) tospecifically translate these international commitments into action on the ground insupport of the EFA and Millennium Development goals of complete, quality, pri-mary education for all children. As a result of these efforts, the World Bank’s 2006Global Monitoring Report concludes that since 2000, the number of countries thathave either achieved, or are on track to achieve, universal primary completionincreased significantly, and that faster rates of progress are observed in countries thathave joined the EFA-FTI.
These achievements, however, have placed great stress on school infrastructure,which is limited, is of poor quality, and is not growing fast enough. School infra-structure is a non-negligible cost for achieving the EFA goals and MDGs for primaryeducation. Infrastructure comprises a large share of aid to primary education and ofthe cost of providing quality primary education more generally to all children. Actu-alized infrastructure costs are estimated, in this study, at $32 dollars per student andper year, compared to an average recurrent unit cost of $60 (see chapter 9 for a more
Preface
xi

xii • Preface
thorough elaboration of this cost). Yet little information is available on infrastructurerequirements to achieve these goals, nor how to achieve them more cost-effectively.
The provision of education infrastructure involves six main elements: theschool planning and resource allocation norms and processes, the constructiontechnology applied, the management of the construction process, donor behavior,corruption, and maintenance. These elements impact on results in one or moreways: on the ability to scale up infrastructure provision and/or on the cost andquality of the infrastructure.
This book examines the scope of the infrastructure challenge in Sub-SaharanAfrica and the constraints to scaling up at an affordable cost. It assesses the expe-riences of African countries with school planning, school facility designs, con-struction technologies, and construction management over the past thirty years,and draws lessons on promising approaches to enable African countries to scaleup the facilities required to achieve the EFA goals and MDGs of complete qualityprimary education for all children at the lowest marginal cost.
The book is organized along the following lines. Chapter 1 reviews the natureand scope of the primary school infrastructure challenges. Chapter 2 reviews theexperience of African countries with school planning and resource allocationnorms and how they have affected the volume, functionality, and distribution ofprimary school facilities. Chapters 3, 4, and 5 examine the impact of constructiontechnology and approaches to construction management on the cost of schoolinfrastructure and the ability to scale up. Chapter 6 delves more deeply into howto set up one of the most cost- effective approaches to school provision—the community-based approach. Chapter 7 looks at maintenance issues. Chapter 8 dealswith corruption and chapter 9 with donors. Chapter 10 provides an estimate of theinfrastructure cost of the EFA challenge and recommendation for countries anddonors to improve the efficiency of the resources spent for school construction.
Data for a large part of the analysis in this book were collected on about 250individual projects in 30 different countries, 23 of which are in Sub-Saharan Africa,and 7 in Latin America, East Asia or South Asia. Most of the data are from the past10 years, but the database also includes cost data from as far back as the 1980s.Forty-five percent of the projects were financed by the World Bank, about 10 per-cent by governments, and the rest by other development partners. Unit cost infor-mation was mainly collected from World Bank project documents and consultantstudies on school construction financed by the World Bank or other donor agen-cies and were adjusted to 2006 prices.

This book would not have come into being without the interest and support ofthree persons in the World Bank: first, Robert Prouty, who in 2002 gave me theopportunity to write a working paper entitled “School Construction in Devel-
oping Countries: What Do We Know?” Some years later, Birger Fredriksen encouragedme to encapsulate my thoughts through a piece of analytical work on school con-struction strategies in Africa. These thoughts became the manuscript of this book.The work was completed thanks to the kind, close, and efficient supervision fromJee-Peng Tan, who provided me support, advice, and encouragement.
The initial drafts benefited from the inputs of Paud Murphy, Sverrir Sigurdsson,and Michael Wilson. The economic analysis, which gives robustness to the conclu-sions of the study, was carried out by Kirsten Majgaard.
The ideas presented in this study took shape over the years through my directexperience and work in African countries while I was on the staff of a nongovern-mental organization and United Nations agencies, and while I was a freelanceconsultant and researcher. After I joined the World Bank, the ideas were furthershaped through my involvement in numerous World Bank-financed operations ineducation and community-driven development (CDD) in African and Asiancountries. I owe an immense intellectual debt to the experts in the education sec-tor and elsewhere with whom I have had the pleasure and privilege to work. In theWorld Bank, I am deeply indebted to Rosemary Bellew, Robert Prouty, AlassanceDiawara, Mourad Ezzine, and Sajitha Bashir. Among my counterparts in Africancountries, I wish to acknowlege such experts as Khardiata Lo Ndiaye, Boubacar Ndi-aye, Abdel Wedoud Kamil, Nebghouha Mint Mohamed Vall, Frank Tigri, AbderrahimOuld Ahmed Salem, Hamoud Ould Cheikhna, and Ismail Ba, to cite a few. I alsolearned from the work of others including Carel Halfman, Douglas Lehman, HenkMeijerink, Lawrence Dowdall, Merten Treffers, Leo Sinke, Daniel Dupety, and Souley-man Zerbo. Last but not least, I am also intellectually obligated to the many expertsand nonexperts at the grassroots level: community leaders, villagers, farmers,masons, and others who taught me a great deal about the practical realities and
Acknowledgments
xiii

xiv • Acknowledgments
complexities of development challenges on the ground. They all deserve my deepest gratitude.
Editing with clarity the ideas expressed in this book was a challenge. It was sobecause the topic of this book cuts across several sectors, among them education,construction, technology, procurement, CDD, and decentralization. RosemaryBellew carried out invaluable editing improvements, clarifying the storyline, delet-ing nonessential text, and correcting my “Frenglish.” I also benefitted from the editorial support of Bruce Ross-Larson and Sean A. Tate. Efficient logistical supportwas provided by Mohamed Diaw and Amy Ba.
Peer reviewers of the study included Adriaan Verspoor, Bernard Abeillé, DavidWarren, Giacomina de Regt, Mourad Ezzine, Meskerem Mulatu, Robert Prouty, and Sundaram Krishnakumar. The review meetings were chaired by Yaw Ansu.
To all of the above, I express my deepest and sincere appreciation.
Serge TheunynckApril 1st 2009

ABUTIP Agence Burundaise des Travaux d’Intérêt PublicACA Agence Cooperation et AménagementADAUA Association pour le Développement d’une Architecture et d’un
Urbanisme AfricainsAfDB African Development BankAFVP Association Francaise des Volontaires du ProgrèsAFDS Association du Fonds de Développement SocialAGDS Agence de Gestion de la Dimension Sociale du DeveloppementAGECABO Agência Cabo-Verdiana de Promoção do Emprego e do
Desenvolvimento Local/Cabo Verdean Agency for Public WorksAGEFIB Agence de Financement des Initiatives de BaseAGETIP Agence d’Exécution des Travaux d’Intérêt PublicAGETIPA Agence d’Exécution des Travaux d’Intérêt Public (Madagascar)AMDU Mozambican Association for Urban Development AMEXTIPE Agences Mauritanienne d’Exécution des Travaux d’Intérêt Public
pour l’EmploiATETIP Agence Tchadienne d’Execution de Travaux d’Interet PublicBAD Banque Africaine de DéveloppementBADEA Banque Arabe pour le Développement Economique en AfriqueBCI Budget Consolidé d’InvestissementBEPS Basic Education and Policy SupportBESIP Basic Education Sector Investment ProgramBESSIP Basic Education Sub-sector Investment ProgramBID Banque Islamique de DéveloppementCBO community-based organizationsCDC Community Development CommitteeCDD community-driven developmentCMA contract management agency
xv
Abbreviations

xvi • Abbreviations
CRESED II Second Education Sector Development ProjectDANIDA Danish International Development AgencyDCES Direction des Constructions et des Equipements ScolairesDFID UK Department for International DevelopmentEDI Economic Development InstituteEdu-II Second Education ProjectEdu-III Third Education ProjectEdu-V Fifth Education ProjectEFA Education for AllEFA-FTI Education for All–Fast Track InitiativeESCP Education Sector Consolidation ProjectESP Education Sector ProjectESSIP Education Sector Strategic Investment PlanESSP Education Sector Strategic PlanEU European UnionFA financing agreementFDA French Development Agency (FAD)FCFA Franc Communauté Financière AfricaineFID Fonds d’Intervention pour le Développement FID-EPT Fonds d’Investissement pour le Développement—Education
pour TousFINNIDA Finnish International Development AgencyGEAI Groupement d’Etudes pour une Architecture IndustrialiséeGMT grassroots management trainingGRIP Grassroots Initiative ProjectGRZ Government of the Republic of ZambiaHIPC heavily indebted poor country HRDP Human Resources Development ProjectICB international competitive biddingIDA International Development AssociationIDB International Development BankILO International Labor OrganizationJICA Japan International Cooperation Agency Kf W Kreditanstalt für Wiederaufbau (German government–owned
development bank)LCB local competitive biddingLG local governmentLGDP Local Government Development ProjectLICUS low-income country under stressMASAF Malawi Social Action Fund
Abbreviations • xvii
MDG Millennium Development GoalsMINED Ministère de l’EducationMoE Ministry of EducationMoRD Ministry of Rural DevelopmentMPP Micro-project ProgramMPU Micro-project UnitMPW Ministry of Public WorksNCB national competitive biddingNGO nongovernmental organizationNIGETIPE Agence Nigerienne d’Exécution des Travaux d’Intérêt PublicNRIP National Rural Investment ProjectNUSAF Northern Uganda Social Action FundOECD Organisation for Economic Co-operation and DevelopmentOPEC Organization of Petroleum Exporting CountriesOPEP Organisation des Pays Exportateurs de PétroleOPSUP OPEC Primary School Upgrading ProjectOSEO Œuvre Suisse d’Entraide OuvrièrePAC Projet d’Appui aux CommunesPADEB Basic Education ProjectPAOEB Projet d’Appui à l’Organisation de l’Enseignement de BasePASE Projet d’Appui au Secteur de l’EducationPCPEP Projet de Construction de Prototypes d’Ecoles PrimairesPCPEPMRG Porjet de Construction de Prototypes d’Ecoles Primaires en Milieu
Rural de GuinéePCU Project Coordination UnitPDRH Projet de Développement des Ressources HumainesPEDP Primary Education Development ProjectPEQT Projet Education de Qualite pour TousPFDS Projet de Fonds de Développement SocialPIU Project Implementation UnitPMC Project Management CommitteePNDSE Programme National de Développement du Secteur EducationPNUD Programme des Nations Unies pour le DéveloppementPROMEF Projet de Consolidation et de Modernisation de l’Education et la
Formation PPTE Pays Pauvres Très EndettésPUSE Programme d’Urgence pour le Secteur de l’EducationPWECP Public Works and Employment Creation ProjectQUIPS Quality and Improvement in Primary SchoolsSESP Second Education Sector Project

xviii • Abbreviations
SF social fundSFG School Facility GrantSHRDP Second Human Resource Development Project SRP Social Recovery ProgramSSDP Social Sector Development ProjectSWAPs sector-wide approachesTESP Third Education Sector ProjectUNCDF United Nations Capital Development FundUNESCO United Nations Educational, Scientific, and Cultural OrganizationUSAID United States Agency for International DevelopmentVCSP Village Community Support ProjectZAMSIF Zambia Social Investment FundZEPIU Zambia Education Project Implementation Unit

1
The Challenges of Africa’s Primary School Infrastructure
CHAPTER 1
Primary school infrastructure in Africa has not been growing fast enough toaccommodate all school-age children, and a large share of the existing stockis unsafe and unsuitable for learning. At the same time, resources are often
inefficiently and inequitably allocated, allowing greater access for some popula-tions than for others. If these trends continue, the primary school infrastructureneeded to provide quality education for all children by 2015 will be grossly inad-equate in volume, quality, functionality, and distribution. These problems aredue not only to insufficient resources but also to inefficient planning norms andpractices, unsuitable construction technology, and inefficient construction man-agement processes.
THE GROWTH TREND IN PRIMARY SCHOOL CLASSROOMS
Table 1.1 shows some estimates of the average annual increase in the classroomstock for 10 African countries in recent years, compared with the annual growth inthe classroom stock required to accommodate all school-age children by 2015 with40 students per classroom.1 If we extrapolate the pace of actual classroom construc-tion during the late 1990s and early 2000s into the future, on average, the classroomstock is growing only half as fast (56 percent) as necessary. According to this meas-ure, in Burkina Faso, Burundi, Chad, and Rwanda the current increase in the class-room stock is less than 40 percent of the requisite volume. Only Guinea, Madagas-car, and Mauritania are experiencing an increase in their classroom stock that isconsistent with the Education for All (EFA) objective. Most of the school construc-tion programs submitted by African countries to access EFA-Fast Track Initiative(EFA-FTI) funds propose to multiply the construction rhythm by a factor rangingbetween two to four.2
These are estimates of the stock only, however, not of the total number of class-rooms that need to be constructed by 2015 to reach the capacity required—whichcan be significantly higher, depending on the quality of the existing buildings,which are generally poor in Africa.

2 • School Construction Strategies for Universal Primary Education in Africa
THE QUALITY OF PRIMARY SCHOOL INFRASTRUCTURE
A large number of primary schools throughout Africa fail to provide a healthfuland conducive learning environment for children. The quality of the primaryschool facilities, that is the package of facilities offered, their durability and func-tionality, is often abysmal. Many schools in Sub-Saharan Africa consist of class-rooms only, and temporary structures form a large share of the classroom infra-structure. There is no potable water. There are no working sanitary facilities, norany other school facility, such as an office or storage space for learning materials.Further, school furniture is often broken or lacking entirely. Research suggests thatthese conditions have a significant negative impact on whether children attendand complete primary school and whether teachers show up for work. (Refer toAnnex 1 for a review of the research literature.)
TEMPORARY STRUCTURES
Temporary structures represent a large share of classrooms in Africa. Many of theseclassrooms were built by communities themselves. Table 1.2 shows that across the15 countries for which data are available, 28 percent of classrooms are temporaryor substandard, reaching as high as 63 percent in Chad, where most classroomsare made of plant materials, such as millet stalks (secco) that require rebuildingevery year. For the most part, temporary classrooms, like those in Guinea, are builtof earth walls that erode easily, topped with a wooden roofing structure prone to
Table 1.1 Growth in Classroom Stock, Needs versus Actual
Annual growth inclassroom stock Growth inneeded 2005–15 classroom stock Actual vs.
Country (gap assessment) per year (actual) Growth period need (%)
Burkina Faso 4,194 1,577 1997–2003 38
Burundi 2,119 792 1999–2003 37
Chad 2,944 1,059 1996–99 36
Congo 960 593 1996–2001 62
Guinea 1,598 1,485 1996–99 93
Madagascar 2,848 2,770 1999–2004 97
Malawi 2,261 1,214 2000–05 54
Mauritania 445 519 1996–99 117
Rwanda 1,854 688 2000–03 37
Uganda 4,988 2,786 1993–2003 56
Average 2,421 1,348 56
Source: Author’s projections for 2005–15. The data on classroom stock growth are from statistical yearbooks of the ministries of education (Burundi, Malawi), from Group 5 2005, or from World Bank project documents. The gap assessment refers to Burns et al.(2003).

The Challenges of Africa’s Primary School Infrastructure • 3
termite attacks. Community-built classrooms are also small, typically limited inspace to a maximum of 20 to 30 students.3 Windows must necessarily be smallalso. A larger classroom space would require a foundation, a wall structure madeof modern materials, such as cement, and a roof structure made of squared woodor steel, which is often beyond the means of poor communities.
These facilities have significant drawbacks that jeopardize the achievement ofquality primary education for all. First, they are maintenance-intensive. Because ofthe limited durability of the materials used, the classrooms require regular rebuild-ing. Second, they are unhealthy for humans because they provide an insufficient min-imum of space, ventilation, and light. Third, the classrooms cannot be used in therain, which reduces the instructional and learning time children receive and, con-sequently, their level of achievement. For example, a review of the World Bank’sassistance to education in Ghana concluded that improvements in the availabilityand quality of school infrastructure had resulted in higher primary school enroll-ment and increases in English and math achievement. These achievement gainswere primarily due to the greater amount of instructional and learning time chil-dren received because more schools were able to function normally when it rained(World Bank 2004d). In another study, Glewwe and Jacoby (1994) estimate the
Table 1.2 Number and Condition of Primary Classrooms
Percent of classrooms listed as temporary,Number of classrooms in 2005 built from nonpermanent materials,
Country (actual or estimated) needing rehabilitation, or in poor condition
Benin 26,681 31
Burkina Faso 21,590 4
Chad 18,970 63
Congo 7,850 31
Ghana 62,110 12
Guinea 21,630 20
Madagascar 44,480 11
Malawi 36,700 21
Mauritania 10,160 28
Mozambique 45,880 46
Niger 26,220 47
Rwanda 30,420 44
Senegal 24,140 8
Uganda 113,920 38
Zambia 31,100 16
Average 28
Source: Statistical yearbooks, Group 5, and World Bank project documents. Note: Number of classrooms in Benin, Madagascar, and Malawi are actual; others are projections based on most recent dataavailable. Number of substandard classrooms is taken from most recent data.

4 • School Construction Strategies for Universal Primary Education in Africa
gains in learning achievement in Ghanaian middle schools due to repairing leak-ing roofs at 2.0 standard deviations in reading and 2.2 in math. In Mauritania, stu-dents attending classes in concrete buildings had statistically better scores in theend-of-primary exam than their peers learning in mud-built classrooms or under atent (World Bank 2001d).
WATER AND SANITATION
Table 1.3 shows the availability of latrines and potable water supply in sixAfrican countries. On average, only about half of all schools in these countrieshave latrines and water supply. Uganda is a notable exception where all schoolsreportedly have sanitary facilities.4 Further, where latrines exist, they are ofteninsufficient in number and out of service due to inadequate understandingamong users about how they function, and lack of maintenance and up-keep. InZambia, for instance, only half of the available toilet facilities are currently func-tioning (Group 5 2006e).
The backlog of water and sanitary facilities is rising every year because coun-tries still, today, do not consider them an integral and necessary part of a schoolfacility and, therefore, do not plan for them. For example, in Senegal, where only39 percent of schools have sanitation facilities and only 33 percent have access topotable water, between 2000 and 2004, the government’s school construction pro-gram built 6,600 classrooms but only 800 latrines, covering only 22 percent of thenew sanitation needs (World Bank 2000d, Dupety 2005a). Only in recent yearshave a few countries begun to incorporate water and sanitation as an essentialcomponent of school infrastructure. For example, Mauritania began to includewater and sanitation as an essential part of primary school facilities in 2001. Chaddid the same in 2002, and Guinea began to include these facilities in all newschools since 1989, while planning to retrofit the 4,300 schools without themover a 10-year period (World Bank 1995b, 2001c, 2001f, 2003b).
Table 1.3 Availability of Latrines and Water
Schools SchoolsCountry with latrines (%) with water (%) Year
Burkina Faso 55 38 2004
Chad 33 60 2003
Ghana 54 44 2004
Senegal 36 33 2000
Uganda 100 50 2004
Zambia 50 52 2002
Average 55 46
Source: Group 5 and World Bank project documents.

The Challenges of Africa’s Primary School Infrastructure • 5
The absence of these facilities poses not only a health hazard for the children,but also results in lower school attendance and higher teacher absenteeism.Numerous studies have found that the availability of potable water and sanitaryfacilities increased school enrollment and completion levels.5 For example, inEthiopia, Chaudhury, Christiaensen, and Asadullah (2006) found that the avail-ability of water in the nearest school increased the probability of boys’ schoolattendance by 15 percent, and the availability of latrines increased their atten-dance by 7 percent. In Pakistan, the construction of separate latrines for girls sig-nificantly increased their enrollment in primary schools (World Bank 2004o). InIndia, a UNICEF assessment estimated that the provision of potable water andsanitary facilities would increase girls’ enrollments from 47 to 66 percent in thetargeted schools (Sey et al. 2003). Further, studies on teacher absenteeism inBangladesh, Ecuador, India, Indonesia, Peru, and Uganda found that teacherabsenteeism was higher in schools with worse infrastructure. In particular, lack oftoilets was correlated with high rates of teacher absenteeism, which rangedbetween 11 and 27 percent. (Chaudhury, Hammer, et al. 2006).
SCHOOL FURNITURE
Furniture in most African schools is designed more for preventing theft or com-munity use than for pedagogical purposes.
The most common type of classroom furniture in African primary schools isthe traditional one-piece, two- or three-seater desk and bench model built of solidwood or of a combination of wood and tubular steel. The latter is common in theSahel, where wood is a scarce commodity. Figure 1.1 shows a typical example ofthe desk-bench made of solid wood. Because the desks and the benches are heavy,sturdy, and joined together, they are resistant to vandalism and can accommodatemore students in the given space. Malawi and Mozambique have introduced furniture made of concrete, a more extreme model that is virtually impervious tovandalism or theft. Mauritania requires that the desk-bench be anchored in the concrete floor. However,the design and immobility of the furniture is poorlysuited to modern classroom teaching strategies, suchas group work and multigrade teaching.
At the other end of the spectrum is furniture thatis lightweight, flexible, and easily moved within theclassroom. This consists of tables accommodatingone or several students with individual chairs. Thefurniture is made of tubular steel, wood, plywood, orplastic. Although the light weight of the furnituremakes it easily vulnerable to abuse when moved
Figure 1.1 Typical School Furniture inAfrican Classrooms
Source: Unesco 1990a.

6 • School Construction Strategies for Universal Primary Education in Africa
around in the classroom and its similarity todomestic furniture makes it more vulnerable totheft, it is more suitable to modern pedagogicalpractices and for multigrade teaching.
African schools often lack an adequate sup-ply of furniture. Shortage of seats amounts to14 percent in Burkina Faso (2002/03), 24 per-cent in Ghana, 33 percent in Lesotho (Group 52006a and 2006b, World Bank 2005a). InMalawi, only 35 percent of sixth grade pupilshad a desk to sit at in 2000 and a mere 29 per-cent had writing places (World Bank 2004e).However, furniture seems to play a role in students’ learning: Tan, Lane, and Coustere(1997) found that lack of adequate furniture inthe first grades in the Philippines was associ-
ated with a drop of �0.32 standard deviation in math and �0.29 standard devia-tion in reading. The absence of furniture is not always explained by the cost.Table 1.4 shows the cost of furniture per classroom in 10 African countries. Thecost of furnishing one classroom averages about US$1,600, ranging fromUS$1,110 in Uganda to US$2,200 in Mauritania where all materials are imported,i.e., 20 percent and almost 50 percent of classroom unit cost,6 respectively. Newschool construction programs sometimes neglect to include furniture even whenfinanced by foreign donors.7 Moreover, no African country has yet put in place afurniture replacement policy.
DISTANCE TO SCHOOL
Distance to school remains a problem for many children. Recent enrollmentsurges in several African countries have increased the stress on the slower-growinginfrastructure. Several indicators of this stress are large classes and an increasinguse of double and triple shifts, which shorten the effective instructional time thateach child receives.
The evidence is overwhelming and unambiguous. Schools must be located asclose as possible to children’s homes, preferably within the village. The closer theschool is to home, the more likely parents are to send their children to school andto do so at the appropriate age. Research shows that “the single most importantdeterminant of primary school enrollment is the proximity of a school to primary-age children” (Lockeed and Verspoor 1991). Long distances have a sizeable impacton enrollment (Filmer 2004). Long distances to school not only increase theopportunity cost of attending school, but also tax the stamina of children and can
Table 1.4 Cost of Furniture per Classroom
Country Average unit costa Year
Burkina Faso 1,833 2004
Gambia, The 1,623 1993
Ghana 1,250 2001–03
Madagascar 1,600 2004
Malawi 1,659 2006
Mauritania 2,015 2002
Mozambique 1,986 1999–2005
Senegal 1,572 2000–04
Uganda 1,110 2004
Zambia 1,400 2004
Average 1,605
Source: Group 5, Dupety, Theunynck. Note: Unit costs include the cost of furniture for a staff room. a. Per classroom in selected projects (US$)

The Challenges of Africa’s Primary School Infrastructure • 7
place them in vulnerable situations. Further, studies in Pakistan, Côte d’Ivoire,and Ghana find that distance poses a particularly acute barrier for girls to attendschool (Kane 2004, World Bank 2005m). In Ghana, Zambia, and Lesotho, gruel-ing distances to school also caused parents to defer schooling until their childrenwere older, which increased the probability of dropping out (Lavy 1993, Kane2004, World Bank 2005a). In Chad, Guinea, and Niger school enrollment dropsprecipitously when children are expected to attend school in a village other thantheir own, even if that village is nearby (Lehman et al. 2004). In Senegal, the dis-tance to school is inversely related to the probability to be in school (World Bank2008a). Similarly, in Pakistan, many families in villages without schools refuse tosend their girls to a school outside the community (World Bank 2005m).
Evidence from African countries suggests that enrollment and retention declinesignificantly beyond a distance of even 1 to 2 kilometers, or a 30-minute walk, par-ticularly for younger children. Figure 1.2 shows that in Chad, Guinea, Mali, andNiger, enrollment rates are 50 percent lower for boys and girls when the nearestschool is between 1 and 2 kilometers from home. These results are confirmed bynumerous other studies, although the size of the impact may vary across coun-tries.8 In Mali, the enrollment rate is almost 30 percentage points higher for chil-dren who live less than 30 minutes from school, compared with children who livemore than 45 minutes away (World Bank 2006d). In Côte d’Ivoire, a distancelonger than 2 kilometers has a strong negative impact on enrollment. In Burundi,the difference is 10 percentage points for the two groups. When the satellite schoolmodel is often used, this approach generates high dropout rates.9 For example, a2003 study in Chad found that enrollment dropped off steeply in satellite villagesthat were expected to send their children to consolidator schools: 80 percent ofenrolled children came from the 8 percent of the villages that had the schools andthe remaining 20 percent from the 92 percent satellite villages (Lehman 2004).Similar results were observed in Burkina Faso, wherethe satellite school model promoted in the mid-1990swith UNICEF support was abandoned in the mid-2000s, when each satellite was allowed to become asmall complete school (Bagayoko 2005). Retentionalso declines significantly with distance beyond 2 kilo-meters, or a 30-minute walk. In rural Benin, primaryschool children who walk more than 30 minutes dropout 1.8 times more than those who cover shorter dis-tances (World Bank 2008b). There is also a wealth ofevidence of the relation between distance to schooland enrollment and retention in such Asian countriesas India and Indonesia (Foster and Rosenzweig 1996,Duflo 2001). Data from Mauritania show that distance
Figure 1.2 Gross Enrollment Rates andDistance to School in Chad, Guinea,Mali, and Niger
satellite villageless than 2kmfrom school
satellite village2–3km from
school
distance to school
0
30
20
10
40
50
60
70
village withschool
gros
s en
rollm
ent r
ate
(%) boys girls
Source: Lehman et al., 2004.

8 • School Construction Strategies for Universal Primary Education in Africa
also affects performance. Students living less than 1 kilometer (km) from theirschool perform statistically better than those who walk farther (World Bank 2001d).
All these elements advocate for a habitation-to-school distance well below2 km or a 30-minute walk, which is significantly lower than the norm used inmost African countries for planning purposes, which can be as high as 5 km.Despite the evidence, in many countries children have to walk long distances toget to school. In Mali, 30 percent of rural children walk more than 45 minutes(World Bank 2006d).10 In Malawi, 34 percent of the children travel more than2 km (World Bank 2004e). In Uganda, only 54 percent of households were within2 km from a primary school in 2005 (Okidi and Guloba 2006). In Ethiopia,61 percent of the rural pupils walk more than 2 km and 33 percent more than 5,in 2000 (World Bank 2005f). In Rwanda, more than 53 percent of the pupils livemore than 30 minutes from a school; this percentage is 56 percent in Côte d’Ivoire(World Bank 2003c and 2005s). In Uganda, a country with a high enrollment ratebut a low completion rate, 57 percent of families live at a distance of 2 or morekilometers from a primary school and 22 percent live 4 or more kilometers away(Group 5 2006d). In Lesotho, 69 percent of children who have never been toschool live more than 30 minutes from a school (World Bank 2005a cited by Lewisand Lockheed). In Ghana, building a school in a community located at more than1 hour’s walking distance from the nearest school will increase enrollment in thatcommunity by 5 percent (OED 2004).
Distance is a particularly important constraint for physically disabled children.Physical disabilities that impair mobility constitute one of the most common disabilities among African children. The prevalence of mobility disability is esti-mated at 3 percent in the 6–14 age group in Rwanda, and at 1.2 percent in Benin,where 66 percent of the school-age children living with a handicap are not enrolledin schools (Christian Blind Mission and International Center for Eye Health 2006).The situation is even worse for girls, whose enrollment rate is three times lowerthan for handicapped boys (Jadin 2004). It is painfully obvious that mobility-impaired children must have easy access to school. The further the school, the morearduous and impossible the journey becomes.
OVERCROWDING AND MULTIPLE SHIFTS
Many classrooms are overcrowded. Table 1.5 shows the ratio of pupils to class-rooms in 14 countries for which recent data are available. On average, across thisgroup of countries, each primary school classroom accommodates 63 students,generally within one shift. The lowest average class sizes are found in Niger (38:1)and Ghana (40:1), whereas classrooms in Malawi and Uganda may pack in morethan 100 and 86 children, respectively. Within country, the variation is likely to beequally wide, with some schools more overcrowded than others.

The Challenges of Africa’s Primary School Infrastructure • 9
To address the problem of overcrowding when resources are limited, econo-mists and planners often advise the use of multiple shifts, whereby differentcohorts of students attend school during different hours of the day, so as to morefully use the existing infrastructure, rather than investing in new schools orexpanding existing ones. The cost savings can be significant. In Ethiopia, forinstance, 44 percent of the government’s schools operate in two shifts (WorldBank 2004o). In Burundi, as many as 61 percent of public primary school studentsused double shifts in 2003–04 (World Bank 2006c). In Rwanda, the use of dou-ble shifts is practiced in the first two grades of primary school, which representsthe difference between the need for 730 new classrooms per year and three timesas many if the use of double-shifts is phased out (Pichvai 2004a).
The savings, however, need to be balanced against the potential negative con-sequences of using double shifts. Studies of student achievement cast some doubton the educational effectiveness of this strategy. In an analysis of learning out-comes across 21 African countries, using double shifts is shown to have a strongnegative impact on student achievement due to the reduced number of hours dou-ble-shift students spend in school relative to their single-shift peers. This resultappears in countries such as Madagascar, which operates each shift with separateteachers, as well as in Senegal, where one teacher teaches both shifts (Michaelowa
Table 1.5 Indicators of Overcrowding
Ratio teachers Ratio pupils Ratio pupilsCountry to classrooms to classrooms to teachers
Burkina Faso 0.9 49 52
Chad 1.1 70 66
Congo 1.1 74 65
Ghana 1.2 37 31
Guinea 1 47 45
Madagascar 1.2 63 52
Malawi 1.2 86 72
Mauritania 1.1 44 41
Mozambique 1.1 73 67
Niger 0.9 38 42
Rwanda 1 60 60
Senegal 1.1 53 49
Uganda 2.1 112 53
Zambia 1.7 72 43
Average 1.2 63 53
Source: Pupil and classroom data are from School Census data, Group 5 2005, or from World Bank projectdocuments. Pupil teacher ratios are from UNESCO 2005. Note: Data are for the most recent year available (between 1999 and 2005).
10 • School Construction Strategies for Universal Primary Education in Africa
and Wechtler 2006). The difference in learning time between single- and double-shift students can be enormous, such as in the case of Burundi, where single-shiftstudents receive twice as many instructional hours as their double-shift peers(World Bank 2006c).
Numerous other studies show that students in classes with high student toteacher ratios, up to a threshold of 60 students per class perform just as well as stu-dents in smaller classes. However, beyond 60 students per class, learning outcomesdeteriorate (Mingat 2003). However, the physical space obviously sets an upperlimit on class size. Most schools in Africa today have been built to accommodatea maximum of 40–45 students. It would not be responsible policy advice to sug-gest cramming up to 60 students into an already minimal space designed for only45, or 20, in many cases. The space in the typical African classroom is already at abare minimum, generally only the minimum space required for proper ventilationand aisles to allow for entry and exit. Thus, if all children are to be accommodatedin a single shift, more classrooms are needed. How many more depends on thenumber of students the classrooms are expected to accommodate, while ensuringmaximum student-to-teacher ratios and minimum norms of public health andsafety. If more schools need to be built, it is necessary to build them in the mostcost- efficient manner without compromising learning outcomes.
INEFFICIENT RESOURCE ALLOCATIONS
The problems of poor infrastructure are often exacerbated by an inefficient andinequitable distribution of construction resources. Throughout Africa, it is notuncommon to encounter schools with empty classrooms coexisting with unmetneeds nearby. For example, in Guinea where the primary gross enrollment ratio isonly 81 percent, as many as 16 percent of the 15,600 classrooms available wererecorded as unused in 2000 (World Bank 2001c). In Madagascar the number ofunused classrooms declined sharply from 20 percent in 2000 but remains at 7 per-cent of the 50,000 classrooms in 2005 (MENRS 2007).
Indeed, throughout Sub-Saharan Africa, the geographical distribution ofschools seems to bear little relationship to the distribution of the students. Rather,the distribution appears to be quite random. In Burkina Faso, the enrollmentobserved in six-classroom schools ranges from 30 to 880 pupils, clearly inefficienton both tails of the distribution. Figure 1.3 compares the proportion of the varia-tion in the number of classrooms not accounted for by enrollments in six Africancountries. Of the six countries, Malawi has the highest randomness in the distri-bution of classrooms. More than 70 percent of the variation in the number ofclassrooms in Malawian schools cannot be explained by school enrollment. Inmost of the other countries, around 40 percent of the variation is not related toenrollment but to other factors.
The Challenges of Africa’s Primary School Infrastructure • 11
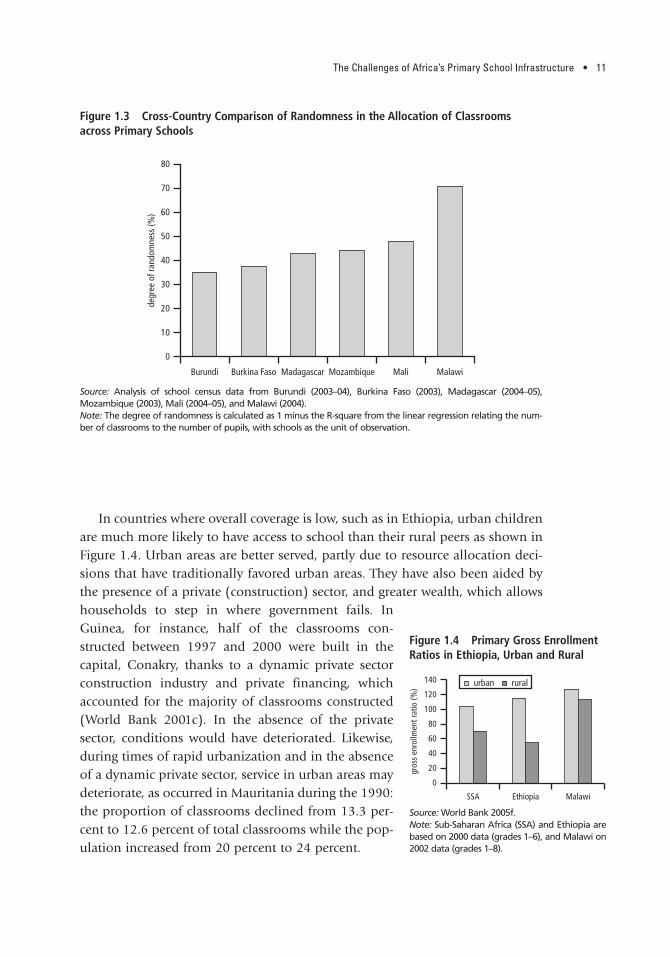
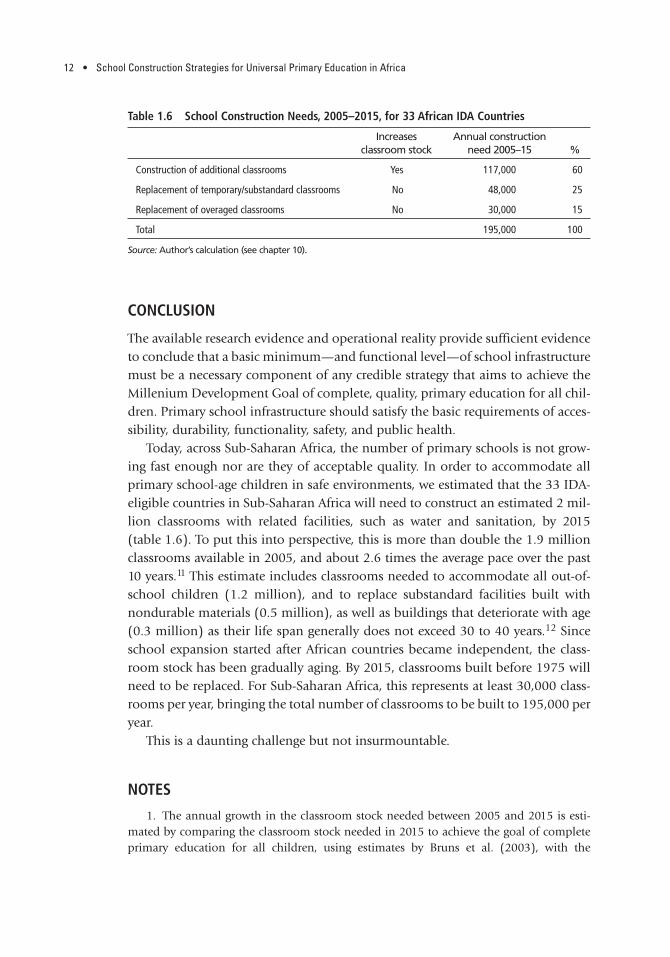
In countries where overall coverage is low, such as in Ethiopia, urban childrenare much more likely to have access to school than their rural peers as shown inFigure 1.4. Urban areas are better served, partly due to resource allocation deci-sions that have traditionally favored urban areas. They have also been aided bythe presence of a private (construction) sector, and greater wealth, which allowshouseholds to step in where government fails. InGuinea, for instance, half of the classrooms con-structed between 1997 and 2000 were built in the capital, Conakry, thanks to a dynamic private sectorconstruction industry and private financing, whichaccounted for the majority of classrooms constructed(World Bank 2001c). In the absence of the private sector, conditions would have deteriorated. Likewise,during times of rapid urbanization and in the absenceof a dynamic private sector, service in urban areas maydeteriorate, as occurred in Mauritania during the 1990:the proportion of classrooms declined from 13.3 per-cent to 12.6 percent of total classrooms while the pop-ulation increased from 20 percent to 24 percent.
Figure 1.3 Cross-Country Comparison of Randomness in the Allocation of Classroomsacross Primary Schools
0
30
20
10
40
50
60
80
70
Burundi Burkina Faso Madagascar Mozambique Mali Malawi
degr
ee o
f ran
dom
ness
(%)
Source: Analysis of school census data from Burundi (2003–04), Burkina Faso (2003), Madagascar (2004–05), Mozambique (2003), Mali (2004–05), and Malawi (2004).Note: The degree of randomness is calculated as 1 minus the R-square from the linear regression relating the num-ber of classrooms to the number of pupils, with schools as the unit of observation.
Figure 1.4 Primary Gross EnrollmentRatios in Ethiopia, Urban and Rural
0
60
40
20
80
100
120
140
SSA Ethiopia Malawi
gros
s en
rollm
ent r
atio
(%) urban rural
Source: World Bank 2005f.Note: Sub-Saharan Africa (SSA) and Ethiopia arebased on 2000 data (grades 1–6), and Malawi on2002 data (grades 1–8).
12 • School Construction Strategies for Universal Primary Education in Africa
CONCLUSION
The available research evidence and operational reality provide sufficient evidenceto conclude that a basic minimum—and functional level—of school infrastructuremust be a necessary component of any credible strategy that aims to achieve theMillenium Development Goal of complete, quality, primary education for all chil-dren. Primary school infrastructure should satisfy the basic requirements of acces-sibility, durability, functionality, safety, and public health.
Today, across Sub-Saharan Africa, the number of primary schools is not grow-ing fast enough nor are they of acceptable quality. In order to accommodate allprimary school-age children in safe environments, we estimated that the 33 IDA-eligible countries in Sub-Saharan Africa will need to construct an estimated 2 mil-lion classrooms with related facilities, such as water and sanitation, by 2015(table 1.6). To put this into perspective, this is more than double the 1.9 millionclassrooms available in 2005, and about 2.6 times the average pace over the past10 years.11 This estimate includes classrooms needed to accommodate all out-of-school children (1.2 million), and to replace substandard facilities built with nondurable materials (0.5 million), as well as buildings that deteriorate with age(0.3 million) as their life span generally does not exceed 30 to 40 years.12 Sinceschool expansion started after African countries became independent, the class-room stock has been gradually aging. By 2015, classrooms built before 1975 willneed to be replaced. For Sub-Saharan Africa, this represents at least 30,000 class-rooms per year, bringing the total number of classrooms to be built to 195,000 peryear.
This is a daunting challenge but not insurmountable.
NOTES
1. The annual growth in the classroom stock needed between 2005 and 2015 is esti-mated by comparing the classroom stock needed in 2015 to achieve the goal of completeprimary education for all children, using estimates by Bruns et al. (2003), with the
Table 1.6 School Construction Needs, 2005–2015, for 33 African IDA Countries
Increases Annual constructionclassroom stock need 2005–15 %
Construction of additional classrooms Yes 117,000 60
Replacement of temporary/substandard classrooms No 48,000 25
Replacement of overaged classrooms No 30,000 15
Total 195,000 100
Source: Author’s calculation (see chapter 10).

The Challenges of Africa’s Primary School Infrastructure • 13
estimated stock of classrooms that would exist in 2015 if the past years’ rate of growth inclassroom stocks were extrapolated into the future. A class size of 40:1, by 2015, is also usedin the simulations by Bruns et al.
2. Country Leadership and Implementation for Results, in the EFA-FTI Partnership,Tunis, December 3–6, 2007.
3. Because of the roofing technology and material limitation. When roofs are sup-ported by bush tree trunks, the maximum distance between walls is not more than 3 meters.
4. The number of sanitary facilities is not the only exceptional feature. In Uganda, theirquality is also exceptional because all sanitation blocks include one handicap-friendly box.
5. See also Mason 1994, Glewwe and Jacoby 1996, Lloyd et al. 2003. 6. In 1995, given the high cost of furniture compared with buildings, the Mauritanian
Government decided to exclude furniture and therefore was able to build 50 percent moreclassrooms with the same amount of resources. Such a radical tradeoff was maintained dur-ing 5 years. It was culturally acceptable because in the Saharan tradition, furniture is lim-ited to rugs and mattresses. However, since 2000, the government has reversed its positionand furniture is systematically included in the school construction package.
7. Such as the Third OPEP-financed project in Senegal during the period2000–04 (Dupety 2005a).
8. Country Status Reports: World Bank 2004h, 2005s, 2006c, 2006d.9. The satellite model combines lower primary education through satellite-schools in
small villages with upper primary in a consolidated school located in a larger village that isstrategically situated to attract upper primary students to one centrally located village.
10. In Mali, the average household distance to the nearest primary school was 6.6 kilo-meters in 1995–96 (DHS Mali).
11. The speed of new classroom construction in SSA is assessed in recent years basedon data for 10 countries (for each country we have collected data for at least 3 years withinthe period 1996–2005). Extrapolating from the 10 countries to the group of 33 low-incomeSSA countries, we roughly estimate that about 75,000 classrooms are built each year in the33 countries.
12. The estimate assumes a student per classroom ratio of 45. Based on the data inAnnex 1, we assumed (more conservatively) that 25 percent of the classroom stock in the33 countries is made of temporary/nondurable materials and will need to be replacedwithin the next 10 years.

15
School Location Planningand Construction Norms
CHAPTER 2
The poor condition of the primary school infrastructure in Africa, the slow paceof scaling-up provision, and the instances of inefficient resource allocations arepartly attributable to a lack of proper planning and of clear and appropriate
infrastructure norms and resource allocation criteria. Experience with school loca-tion planning in Africa suggests a widespread absence of planning norms, and whennorms do exist, they are often inappropriate or not applied. Centralized planningprocesses compound these inefficiencies, as do donors who introduce their ownnorms and specifications irrespective of the country’s standards and experience.
SCHOOL LOCATION PLANNING
School location planning was originally developed as a way to allocate scarceresources according to common technical criteria, or norms. Also known as schoolmapping, it became popular in Africa in the late 1960s. School mapping waslargely based on a process initiated in France in 1963 to aid in the implementa-tion of a major reform in secondary education—the introduction of the college, ormiddle school. School mapping was rolled out in many countries with the assis-tance of donors and other international agencies.
As a result of the work on school mapping, many countries have developedsome norms to guide the allocation of infrastructure resources while endeavoringto achieve more equitable access. School mapping norms are generally of threetypes—norms relating to accessibility and efficiency, those relating to the quality ofthe facility, and those related to the construction technology.
• Accessibility and efficiency norms include guidance and criteria to apply to deter-mine whether to establish a new school or expand an existing one, and where.Typically, school planners divide up the country into school catchment areas byapplying norms regarding the minimum population required to establish aneconomically viable school and a maximum distance that children should be

16 • School Construction Strategies for Universal Primary Education in Africa
expected to travel from home to school. The school size required depends on thepopulation in the catchment area. Increasingly, when determining size and spacerequirements, countries also factor in school management methods to maximizethe use of space through double shifts or multigrade teaching.
• School quality norms concern norms about space and auxiliary facilities that arerequired to attract and keep children in school in a positive and healthy learning environment at an economical cost. They include norms related toadjunct facilities, such as water and sanitation, offices, and storage, as well asthe functionality of each building, including accommodation for handicappedstudents.
• School construction technology relates to the materials, engineering, and work-manship that are needed for building functional and durable facilities. This isdiscussed in the next section.
Experience in school planning throughout the Africa region suggests that the distance norms applied are too high, particularly in mountainous areas where theterrain makes for a more arduous journey, and the school size norm is generallytoo large. The result is schools that are still too far from home, and the coexistenceof unused facilities in some locations with oversubscribed schools in others.
DISTANCE NORMS
The distance norm is the maximum distance children are expected to travel toschool; it defines the school catchment area. Combined with a norm of minimumpopulation in the catchment area to establish a school, the distance norm is at theheart of school mapping. The distance norm, adopted in the 1970s and com-monly applied, is to locate schools within a radius of 3 kilometers (km) fromhome, in line with the recommendations of the International Institute for Educa-tion Planning (IIEP) in Paris and the World Bank (Gould 1978). Some countrieswith low density, such as Chad, have larger distance norms that use a 5-km normto reach the normed threshold of population in the catchment area (Lehmanet al., 2004). However, research and experience clearly show that parents considera distance of 3 km too far for young children to walk. Reducing that distance nec-essarily implies the need for more and smaller schools, rather than fewer andlarger schools, for as distance decreases, the population in the catchment area falls.Multigrade teaching, then, must be an integral part of the school planning strat-egy to ensure the efficient utilization of facilities, although this has proven diffi-cult to achieve.
Countries exhibit a common tendency to plan for larger schools rather thansmaller schools, on the assumption that larger schools yield economies of scale,thereby lowering per student operating costs. Across African countries, a standard
School Location Planning and Construction Norms • 17
school is generally built of one or several blocks, eachcontaining two or three classrooms. Resources areallocated by classroom block, using the application ofsome minimum norms using a one-grade, one- classroom model of about 40–45 children per class-room. In Ethiopia, for example, the smallest primaryschool is a four-classroom model with one teacher foreach grade (1–4). In West Africa, the six-classroommodel where each of the six grades of primary school-ing can be taught in a separate classroom, is the mostcommon model.
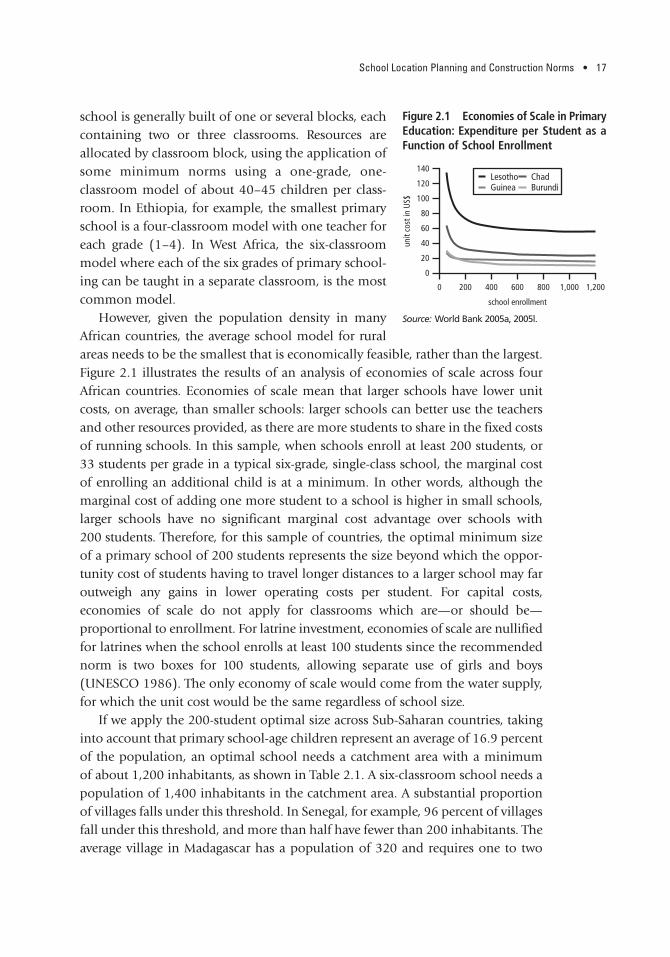
However, given the population density in manyAfrican countries, the average school model for ruralareas needs to be the smallest that is economically feasible, rather than the largest.Figure 2.1 illustrates the results of an analysis of economies of scale across fourAfrican countries. Economies of scale mean that larger schools have lower unitcosts, on average, than smaller schools: larger schools can better use the teachersand other resources provided, as there are more students to share in the fixed costsof running schools. In this sample, when schools enroll at least 200 students, or33 students per grade in a typical six-grade, single-class school, the marginal costof enrolling an additional child is at a minimum. In other words, although themarginal cost of adding one more student to a school is higher in small schools,larger schools have no significant marginal cost advantage over schools with200 students. Therefore, for this sample of countries, the optimal minimum sizeof a primary school of 200 students represents the size beyond which the oppor-tunity cost of students having to travel longer distances to a larger school may faroutweigh any gains in lower operating costs per student. For capital costs,economies of scale do not apply for classrooms which are—or should be—proportional to enrollment. For latrine investment, economies of scale are nullifiedfor latrines when the school enrolls at least 100 students since the recommendednorm is two boxes for 100 students, allowing separate use of girls and boys(UNESCO 1986). The only economy of scale would come from the water supply,for which the unit cost would be the same regardless of school size.
If we apply the 200-student optimal size across Sub-Saharan countries, takinginto account that primary school-age children represent an average of 16.9 percentof the population, an optimal school needs a catchment area with a minimumof about 1,200 inhabitants, as shown in Table 2.1. A six-classroom school needs apopulation of 1,400 inhabitants in the catchment area. A substantial proportionof villages falls under this threshold. In Senegal, for example, 96 percent of villagesfall under this threshold, and more than half have fewer than 200 inhabitants. Theaverage village in Madagascar has a population of 320 and requires one to two
Figure 2.1 Economies of Scale in PrimaryEducation: Expenditure per Student as aFunction of School Enrollment
0
60
40
20
80
100
120
140
0 200 400 600 800 1,000 1,200
school enrollment
unit
cost
in U
S$
Lesotho ChadGuinea Burundi
Source: World Bank 2005a, 2005l.

18 • School Construction Strategies for Universal Primary Education in Africa
classrooms.1 In Mauritania, the population of the average village in the three east-ern regions is 102 (Lehman et al. 2004). Population is scattered in villages andhamlets, often more than 3 km apart. Figure 2.2 displays the geographical distri-bution of villages in eastern Chad in 2004, showing that most villages are fartherthan 3 km from schools. In these circumstances the goal of providing all studentswith a place in school requires countries to plan for much smaller schools, organ-ized in multigrade classes, or by other methods, such as alternative year intakes.
Table 2.1 School Size and Minimum Village Population Required
Number of Population of a villageclassrooms Number of pupils Ratio of school-age adequately served byin a school in the school population (6–12) the school
1 40 16.9 237
2 80 16.9 473
3 120 16.9 710
4 160 16.9 947
5 200 16.9 1,183
6 240 16.9 1,420
Source: Author’s calculations.
Figure 2.2 Distribution of Villages and Schools in Eastern Chad (Mongo subprefecture)
Source: Lehman et al. 2004.Note: Points are villages. Dark circles are 1-km radius from existing schools, lighter circles are within a 2-km radius.

School Location Planning and Construction Norms • 19
In areas where the distance between villages is large, the provision of schoolswould logically be on a one-per-village basis to keep the school close to the homes(Gould 1978).
Table 2.1 shows the possible efficient school according to village population,based on a norm of 40 pupils per classroom and using multigrade teaching. Aone-classroom school providing six grades may effectively address the educationneeds of very small villages with a population below 240. In villages with po -pulations between 240 and 475, a two-classroom school, with each classroomaccommodating three grade levels, would cover the village needs. In villages of475 to 710 inhabitants, a three-classroom school, with each classroom accommo-dating two grade levels, can be used. Finally, in villages between 710 and 950inhabitants, a four-classroom school is necessary, with at least two classroomsfunctioning in multigrade.
Some countries have adopted such small-school models as part of their school-provision strategy, although this is rare to find in Africa, where countries have beenreluctant to adopt multigrade teaching. Yet, multigrade teaching is not a newinvention. It has been, and remains, a common strategy in developed countries toprovide basic education more efficiently in rural areas where the population iswidely dispersed. Further, considerable research evidence demonstrates multigradeteaching to be at least as effective as, and often more effective than, single-gradeteaching in terms of learning outcomes. India, for example, adopted a policy ofproviding schools within a maximum of 1 km from home. To achieve this, it wasnecessary to have a strategy to provide quality education in small schools, schoolsthat may have only one classroom.2 In 1999, the government of Rajasthan recog-nized that the majority of the schools to be built were in remote areas with pop-ulations under 200, or 30 primary school-age children (World Bank 2001h). Thegovernment decided to revise the state norm of two-classroom schools and adopta cost-effective, one-room building specifically designed to accommodate multi-grade teaching while being easily expanded to two rooms if the enrollment sorequired. This experience demonstrates that school buildings can be flexiblydesigned to convert a one-classroom school into a two-classroom school asdemand or population increases.
SCHOOL QUALITY NORMS
Few countries have school quality norms, and therefore a shared concept of a primary school. Although most countries have norms regarding how large a class-room should be, most have no norms for the provision of offices and storagespaces, libraries, or meeting and staff rooms. When such additional facilities exist,there are no rules regarding their composition and size. In the absence of suchnorms, most African countries have a plethora of construction projects, usually

20 • School Construction Strategies for Universal Primary Education in Africa
donor-financed, each following its own space norms and mix of facilities, depend-ing on the financier. These decisions are most often donor-driven.
CLASSROOM SIZE
Many primary school classrooms in Africa are too small for the number of stu-dents they end up accommodating, partly because the norms applied regardingclassroom space are too low. The norm for classroom size results from the combi-nation of two other norms: (a) the number of students per classroom and (b) theunit space per student.
• Regarding the first norm, the World Bank has long recommended 45 students(Gould 1978), but most classrooms built in recent years were constructed byMinistries of Education to accommodate 40–60 students, in desk-benches linedin rows, each seating at least two students as illustrated in the Senegal examplein figure 2.3. Despite the evidence that class size does not have an impact onstudent learning when it is less than 60 students (Mingat 2003), a student-teacher ratio of 40:1 is currently used by the World Bank for Education for All(EFA) estimates because this ratio is observed in the highest-performing coun-tries. (Mingat, Rakotomala, and Tan 2002).
• The second norm is related to the space needed bystudents and teacher to move in the classroom toperform learning/teaching activities. In the 1980s,the most common area norm was 1.0 m2 per stu-dent (UNESCO 1986) still used by countries suchas Senegal in the 1990s (figure 2.3). However, theunit space allocated by African countries increasedto 1.2 m2 per student, as recommended by IIEPand the World Bank as shown in figure 2.4(Beynon 1998, World Bank 1993b). This norm is,however, the basic minimum. It provides only thespace necessary for air flow, people flow, and rapidexit in case of emergency.3 It provides for no otherspace, such as materials storage or a library corner,the latter having a proven impact on students’achievements.4 It is not enough to manage multi-grade learning, in which students need to work inindependent groups while the teacher and his orher student-assistants circulate between groups.These requirements call for a norm of 1.4 m2 perstudent.
Figure 2.3 Standard Classroom in Senegal in the 1990s
900 cm
55 to 60 cm
4 rangs de 7 tables-banesAcces 500 cm
540 cm
CA50
B
A ?
?
?
Source: DECS 1997.Note: Used area: 56.95 m2; maximum capacity:60 students.
Figure 2.4 Minimum Area per Student
Source: World Bank 1993b.

School Location Planning and Construction Norms • 21
For classrooms built in recent years, the average size of the typical classroom isbetween 48–56 m2. Table 2.2 shows the actual range of classroom sizes foundamong 17 African countries. In the majority of countries (11), the average class-room size falls precisely in this range, suggesting the application of the same spacenorms. The exceptions are Ethiopia, which has much smaller classrooms, andBurundi and Malawi, which have significantly larger classrooms. However, if manyamong these countries (Chad, Burundi, Madagascar, Mozambique, Rwanda, andUganda) build classrooms to theoretically accommodate 45 students, in practice,they actually accommodate many more.
If the pedagogic value of the school facility and the efficient use of multigrade class-rooms drive the norm, rather than minimal air and security considerations exclusively,this would result in larger classrooms than the current standard.
AUXILIARY PURPOSE-BUILT FACILITIES
In countries that have planned for office and storage space, most have made pro-vision for one office and one storeroom for every three classrooms. This is a rea-sonable norm. The concept is often to take the opportunity of building a two- or
Table 2.2 Average Net Classroom Area (m2) Over Time
Average until Average Average Average Average1986 1986–90 1991–95 1996–2000 2001–06
Burkina Faso 56.0
Burundi 72.3
Chad 63.0 58.5
Ethiopia 40.5
Gambia, The 50.9
Ghana 40.0 58.5 55.5 52.0
Guinea 48.0 48.0 50.5 56.0
Madagascar 54.2 50.0
Malawi 77.0
Mali 63.0
Mauritania 49.5 49.5 51.5
Mozambique 62.1 56.2 56.6
Niger 60.9 56.0
Rwanda 48.0
Senegal 59.2 59.2 59.2 57.4 60.9
Uganda 48.2
Zambia 54.6 54.0 53.0 52.0
Average 49.6 56.2 56.0 54.3 56.1
Source: Data collected from about 100 projects.
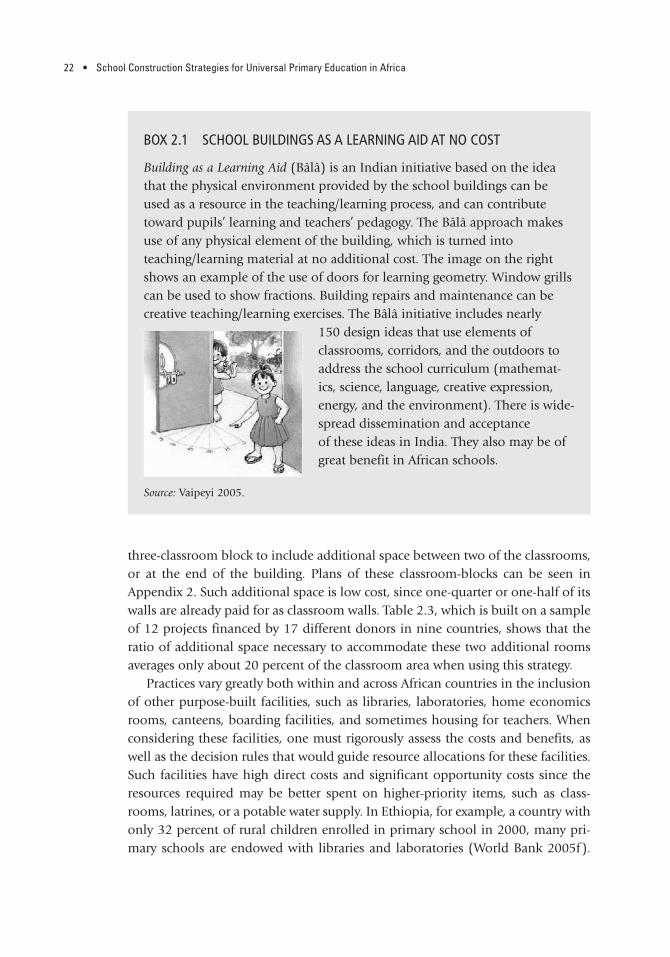
22 • School Construction Strategies for Universal Primary Education in Africa
three-classroom block to include additional space between two of the classrooms,or at the end of the building. Plans of these classroom-blocks can be seen inAppendix 2. Such additional space is low cost, since one-quarter or one-half of itswalls are already paid for as classroom walls. Table 2.3, which is built on a sampleof 12 projects financed by 17 different donors in nine countries, shows that theratio of additional space necessary to accommodate these two additional roomsaverages only about 20 percent of the classroom area when using this strategy.
Practices vary greatly both within and across African countries in the inclusionof other purpose-built facilities, such as libraries, laboratories, home economicsrooms, canteens, boarding facilities, and sometimes housing for teachers. Whenconsidering these facilities, one must rigorously assess the costs and benefits, aswell as the decision rules that would guide resource allocations for these facilities.Such facilities have high direct costs and significant opportunity costs since theresources required may be better spent on higher-priority items, such as class-rooms, latrines, or a potable water supply. In Ethiopia, for example, a country withonly 32 percent of rural children enrolled in primary school in 2000, many pri-mary schools are endowed with libraries and laboratories (World Bank 2005f).
BOX 2.1 SCHOOL BUILDINGS AS A LEARNING AID AT NO COST
Building as a Learning Aid (Bâlâ) is an Indian initiative based on the ideathat the physical environment provided by the school buildings can beused as a resource in the teaching/learning process, and can contributetoward pupils’ learning and teachers’ pedagogy. The Bâlâ approach makesuse of any physical element of the building, which is turned intoteaching/learning material at no additional cost. The image on the rightshows an example of the use of doors for learning geometry. Window grillscan be used to show fractions. Building repairs and maintenance can becreative teaching/learning exercises. The Bâlâ initiative includes nearly
150 design ideas that use elements of classrooms, corridors, and the outdoors toaddress the school curriculum (mathemat-ics, science, language, creative expression,energy, and the environment). There is wide-spread dissemination and acceptanceof these ideas in India. They also may be ofgreat benefit in African schools.
Source: Vaipeyi 2005.

23
Table 2.3 Office and Storage as Percentage of Classroom Area in 10 Selected Projects
Differencebetween
Net area Gross area extendedper class- per class-
Expanded gross area per classroomgross and
room m2 room m2 Classrooms Office Store 0ther m2 gross (%) Project name Financers
Burkina Faso 63.8 70.4 3 1 1 86.2 123 Panier commune Canada, the Netherlands, IDA
Gambia, The 54.9 59.4 3 1 1 75.3 127 Primary Education Project IDA
55.5 60.2 3 1 1 73.3 122 Future in Our Hands Sweden
Ghana 66.2 71.1 2 1 1 82.2 116 Microproject Program EU
Guinea 48.7 53.0 1 1 0 57.8 109 Primary School Project in KfWMedium and Low Guinea
56.0 60.6 1 1 0 69.9 115 Primary schools in forest region PlanGuinea
Mozambique 55.3 61.4 2 1 1 1 90.7 148 Education Sector Program, IDA, IDBRural Primary School Project
Niger 60.9 65.7 3 1 1 72.6 111 PADEB IDA
Senegal 57.0 63.4 2 1 1 74.5 117 PEQT World Bank, AfDB
Uganda 48.2 54.0 1 1 0 66.6 123 School Facility Grant FDID, United Kingdom,the Netherlands
Zambia 47.2 52.9 3 0 1 64.2 121 Social Recovery Fund World Bank
52.4 58.3 3 4 2 73.9 127 BESSIP Danida, DFID, Finland,Ireland, the Netherlands,Norway, GRZ
Average 1 55.5 60.9 73.9 122 12 projects, 17 donors
Average 2 55.5 60.9 72.4 119 Same as above without Mozambique
Source: Plans of the facilities provided by Group 5 and collected by Theunynck. Note: For a complete list of acronyms, see p. xv.
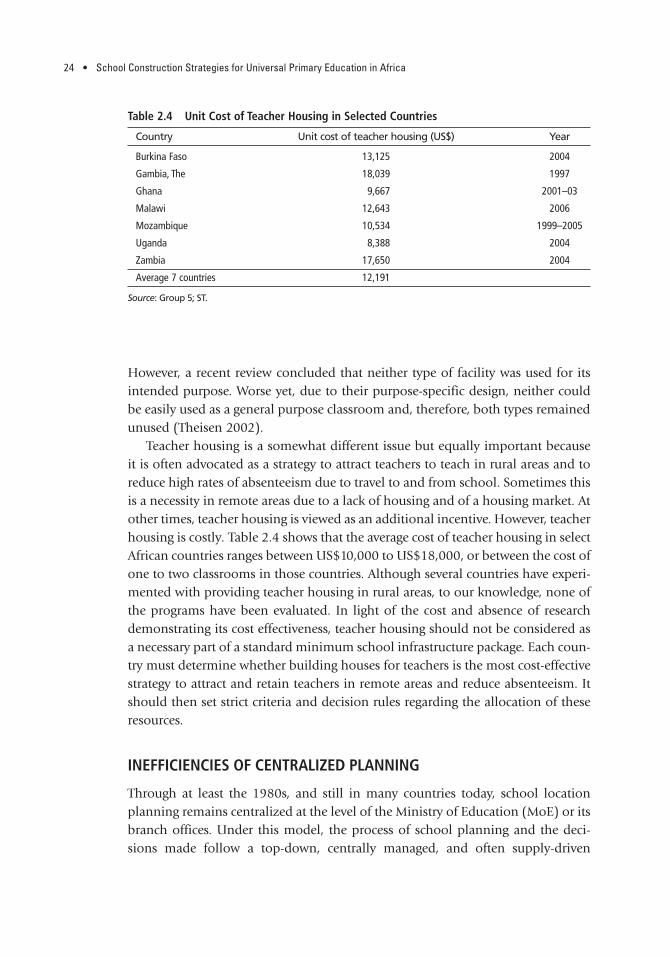
24 • School Construction Strategies for Universal Primary Education in Africa
Table 2.4 Unit Cost of Teacher Housing in Selected Countries
Country Unit cost of teacher housing (US$) Year
Burkina Faso 13,125 2004
Gambia, The 18,039 1997
Ghana 9,667 2001–03
Malawi 12,643 2006
Mozambique 10,534 1999–2005
Uganda 8,388 2004
Zambia 17,650 2004
Average 7 countries 12,191
Source: Group 5; ST.
However, a recent review concluded that neither type of facility was used for itsintended purpose. Worse yet, due to their purpose-specific design, neither couldbe easily used as a general purpose classroom and, therefore, both types remainedunused (Theisen 2002).
Teacher housing is a somewhat different issue but equally important becauseit is often advocated as a strategy to attract teachers to teach in rural areas and toreduce high rates of absenteeism due to travel to and from school. Sometimes thisis a necessity in remote areas due to a lack of housing and of a housing market. Atother times, teacher housing is viewed as an additional incentive. However, teacherhousing is costly. Table 2.4 shows that the average cost of teacher housing in selectAfrican countries ranges between US$10,000 to US$18,000, or between the cost ofone to two classrooms in those countries. Although several countries have experi-mented with providing teacher housing in rural areas, to our knowledge, none ofthe programs have been evaluated. In light of the cost and absence of researchdemonstrating its cost effectiveness, teacher housing should not be considered asa necessary part of a standard minimum school infrastructure package. Each coun-try must determine whether building houses for teachers is the most cost-effectivestrategy to attract and retain teachers in remote areas and reduce absenteeism. Itshould then set strict criteria and decision rules regarding the allocation of theseresources.
INEFFICIENCIES OF CENTRALIZED PLANNING
Through at least the 1980s, and still in many countries today, school locationplanning remains centralized at the level of the Ministry of Education (MoE) or itsbranch offices. Under this model, the process of school planning and the deci-sions made follow a top-down, centrally managed, and often supply-driven

School Location Planning and Construction Norms • 25
approach. Based on norms regarding distance, space, and minimum and maximumacceptable class sizes, the MoE determines whether a school should be built andwhere, often with inadequate consultation with communities themselves.
This centralized process matches the centralized nature of government in manyAfrican countries, and is convenient for donors, who generally transfer theirfinancing for school infrastructure through projects with the MoE rather thanthrough the government budget, as well. However, experience shows that thisapproach has resulted in numerous inefficiencies. First, it often results in inap-propriate decisions on school size and location that compromise the achievementof the EFA and Millennium Development Goals for education because MoEs tendto apply norms mechanically, to treat school mapping as a desk exercise, to usepoor and outdated information, to fail to consult with communities, and to usestaff that are often insufficiently qualified—generally, former teachers with onlyshort-term training in education planning. A further weakness of centralizedschool planning is its lack of transparency. Decision criteria are not well knownoutside the MoE, and allocation decisions can be more easily influenced by polit-ical intentions rather than relative need. As a result of these flaws, it should not besurprising to find schools that are inappropriately located, sometimes in the mid-dle of nowhere, schools that are under- or oversized, and some populations thatare better served than others.
CONCLUSION
The experience with school planning demonstrates that, in order to reach all chil-dren and efficiently utilize resources, countries must move away from largeschool models in rural areas in favor of a network of smaller multigrade schoolsthat are located in each village. When the school-age population in the villagefalls under 20, however, other methods of providing access to education for thesechildren—without construction—should be considered, such as distance educa-tion or correspondence.
To make this switch from planning for larger schools equidistant from com-munities to smaller schools close to home requires that countries change currentplanning and resource allocation norms and practices relating to distance andschool size. The distance norm must be reduced to under 2 km at a maximum, thenumber of classrooms should be determined on the actual population size in eachvillage, and the classroom size should allocate at least 1.4 m2 per student toaccommodate a resource corner and the management of multiple grades withinthe same classroom. Because one standard model will not suit all circumstances,MoEs should provide guidelines and a menu of models depending on the popu-lation size, rather than rigidly applying the same norms across all communities.Furniture models require similar flexibility.
26 • School Construction Strategies for Universal Primary Education in Africa
Community and local government input into the development of these normsand their direct involvement in school location decisions must become commonpractice.
Countries must also adopt minimum infrastructure requirements regarding themix of facilities and land requirements that constitute a productive, healthy, andsafe learning environment for children. Whereas it may be debatable whether thisminimum school facility package should include offices, enclosures, and otheradjunct facilities, it should include sanitary facilities, the availability of potablewater, and furniture as an integral part of the school design while providing guide-lines for the allocation of resources for these other facilities. Addressing the needfor water and sanitation will require the MoE to provide a menu of simple andeconomic water supply systems and latrines adapted to the different local condi-tions, and ensuring not only the provision of these facilities in new schools butalso retrofitting all existing schools that lack them.
These norms, once established, should be used by all infrastructure projects,whether they are financed by the government or by development partners. Sadly,this is not the case today. There is little evidence that governments and donors areharmonizing their approaches. Senegal provides an illustrative example wherethe MoE adopted a sector strategy in 2000 that was endorsed by the local donorcommunity. Nevertheless, donors continue to finance different menus of facilities.IDA, for example, finances a package of facilities that includes classrooms, officeand storage, a four-hole latrine, and a well. Multisectoral programs managed bylocal governments or communities finance latrines, a water supply, and some-times fencing. On the other hand, the government of Senegal, the African Devel-opment Fund and OPEC, which together represent 60 percent of the total numberof classrooms built during 2000–04, do not finance any nonclassroom facility(Dupety 2005a). Guinea, The Gambia, and Uganda provide useful counterexam-ples, but unfortunately they are not the norm. In Guinea, for example, a standardfacility package was promoted by UNESCO in 1990 and subsequently followed byall donors. The package includes a three-classroom bloc, an office, a storage area,a block of five latrines, and a well. Similar approaches were adopted in The Gam-bia and Uganda.
CHILDREN WITH SPECIAL NEEDS
In addition to distance barriers, school facility location and design often hinderthe accessibility of school to children with physical disabilities who cannot climbstairs or access classrooms with their wheelchairs. In some countries, children ofschool age living with mobility disability is estimated at 3 percent (Christian BlindMission and International Center for Eye Health 2006). Zambia, one of the few

School Location Planning and Construction Norms • 27
countries to track the information on pupils with disabilities, records that 1 per-cent of enrolled students have physical disabilities (Group 5 2006e). Yet solutionsare simple and not costly when built into the school planning process and schooldesign itself. Appropriate solutions include paying careful attention to the topog-raphy of the school site to provide accessible routes, minimizing stairs by avoid-ing multiple school levels, and providing wider door openings and buildingramps. Including these aspects in the planning and design of schools is far lesscostly than retrofitting existing schools (Lynch 1994, Baquer and Sharma 2005,Steinfeld 2005).
The latrine design should allow students with physical disabilities to use them.Almost no countries have specific disabled-friendly architectural designs forlatrines; Uganda is an exception. The cost of making one latrine per school acces-sible and usable to physically disabled children involves a larger internal area anddoor, with handles on inner walls. The cost with these additions is low comparedwith the overall cost of a latrine-block.
NOTES
1. This is in line with the current distribution of schools, which shows that half of theschools had one or two classrooms in 2006 and 71 percent had three classrooms or fewer(MENRS 2007).
2. Another interesting example is the United States where the Single Teacher Schools(STC) accounted for 63 percent of the schools in 1930 and 47 percent in 1950. The STCmodel gradually disappeared by the end of the century with the expansion of the schoolbus system, which made it possible to enroll most primary students in larger schools.
3. The minimum norm of 1.0 m2 is a mandatory security requirement in public places,such as theaters, where the public is seated in rows facing the screen or the stage (Neufert2006).
4. In OECD countries, the existence of library materials in schools explains2.5 percent of the variation in mathematics performance, whereas the quality of infrastruc-ture explains only 1 percent of the variation, according to the Program for International Student Assessment-PISA (Knapp et al.).


29
Classroom Construction Technology
CHAPTER 3
Whereas the planning and decision norms largely affect the efficiency andeffectiveness of school infrastructure investments, the school constructiontechnology employed influences the cost, durability, and ability to scale up
construction to the level required. By school construction technology, we mean thematerials, engineering, and workmanship that are needed for building functionaland durable facilities.
The vast experience of African countries over the past 30 years with various formsof school construction technology reveals two main patterns. First, “innovative”technologies that were intended to lower the cost of school infrastructure andincrease the volume have done neither. Yet, these technologies are continually resurrected at various times, mainly by donors, with the same results. Second, the useof the very same technology results in a wide range of costs, depending on the imple-mentation arrangements.
This section reviews the experience with construction technology in Sub- Saharan Africa and the lessons learned; the next section reviews the efficiency ofthe implementation arrangements when using the same technology.
Countries have built classrooms with five main types of technologies that weshall call (1) the classic classroom, (2) the shelter model, (3) the local materials andappropriate technology classroom, (4) the prefabricated classroom, and (5) the modernconstruction model.
THE CLASSIC CLASSROOM
The classic classroom accounts for the vast majority of today’s stock of long- lasting classrooms in Africa. This very popular architectural model has been used,with slight adaptations, in almost all school construction programs implementedby governments, communities, contract management agencies, and developmentpartners. Among 228 construction projects in our sample carried out over the past30 years, 91 percent involved construction of the classic classroom.

Figure 3.1 provides an illustration of the classicmodel from the Gambia. Additional examples fromother countries are in Appendix 2. The review of about100 projects shows that, typically, the floor is made ofconcrete with a smooth top screed. Walls are made ofcement-block masonry or fired-bricks, and are eitherload-bearing (60 percent of projects) or nonload-bearing with concrete columns (40 percent of proj-ects). A concrete ring-beam is essential for structuralstability and wind and earthquake resistance, althoughonly an estimated 66 percent of the projects reviewedhave them. Roofs are generally (80 percent) madeof modern materials, typically corrugated metal orasbestos-cement sheets, placed on steel or woodentrusses. The remaining 20 percent used concrete slabson concrete beams. Window spaces, suitable to any cli-
mate and lighting need, can be easily accommodated without technical constraints. The advantages of the classic classroom are several. First, the technology applied
in the classic classroom is similar to that applied by small- and medium-size con-tractors in the formal and informal sector in the country when building low-costhousing. Since the housing industry represents about 80 percent of the construc-tion industry in all countries, and a large share of housing is built by craftsmen inthe informal sector, most local contractors and craftsmen are familiar with modernbuilding materials and technology, such as cement blocks and corrugated iron roof-ing sheets.1
Second, by applying technologies that are broadly used in the country bysmall- and medium-size contractors and the informal sector, countries have beenable to significantly scale up classroom construction when the model is combinedwith an efficient procurement and contract management process.
Third, because they are built from modern and “classic” technology, the solid-ity and durability of classic classrooms can easily comply with national or inter-national technical norms—even in earthquake-vulnerable countries—and thecompliance of their design and construction process with these norms can bechecked by external controllers.
Fourth, the externalities of using the classic model are significant both in termsof growing the local construction industry and in improving standards and skillsmore generally in the industry. The school building can provide a model for otherbuildings, particularly houses for low- and moderate-income people, by demon-strating the effectiveness of a few inexpensive technical improvements, such as asolid foundation and concrete ring-beam, which are also desirable in homes. Fur-ther, as small contractors of the informal sector become increasingly familiar with
30 • School Construction Strategies for Universal Primary Education in Africa
Figure 3.1 The Most Common ClassicClassroom Type
• Floor: in concrete (100% of the projects)• Walls: in block masonry (100%) broken down in
load-bearing walls (60%) or non-load-bearingwalls with concrete columns (40%)
• Ring-beam in concrete (66% of the projects) • Roofs: generally in corrugated metal sheets
(80% of the projects) on steel trusses (45%) orwooden trusses (35%)
An example from The Gambia
Source: Synergy 1997a.
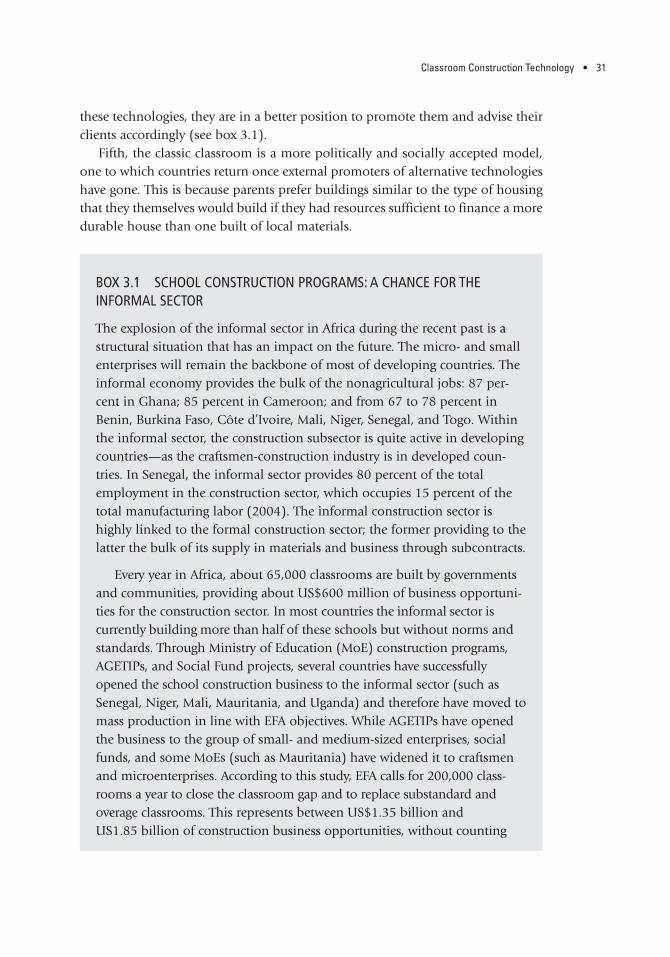
Classroom Construction Technology • 31
these technologies, they are in a better position to promote them and advise theirclients accordingly (see box 3.1).
Fifth, the classic classroom is a more politically and socially accepted model,one to which countries return once external promoters of alternative technologieshave gone. This is because parents prefer buildings similar to the type of housingthat they themselves would build if they had resources sufficient to finance a moredurable house than one built of local materials.
BOX 3.1 SCHOOL CONSTRUCTION PROGRAMS: A CHANCE FOR THE INFORMAL SECTOR
The explosion of the informal sector in Africa during the recent past is astructural situation that has an impact on the future. The micro- and smallenterprises will remain the backbone of most of developing countries. Theinformal economy provides the bulk of the nonagricultural jobs: 87 per-cent in Ghana; 85 percent in Cameroon; and from 67 to 78 percent inBenin, Burkina Faso, Côte d’Ivoire, Mali, Niger, Senegal, and Togo. Withinthe informal sector, the construction subsector is quite active in developingcountries—as the craftsmen-construction industry is in developed coun-tries. In Senegal, the informal sector provides 80 percent of the totalemployment in the construction sector, which occupies 15 percent of thetotal manufacturing labor (2004). The informal construction sector ishighly linked to the formal construction sector; the former providing to thelatter the bulk of its supply in materials and business through subcontracts.
Every year in Africa, about 65,000 classrooms are built by governmentsand communities, providing about US$600 million of business opportuni-ties for the construction sector. In most countries the informal sector is currently building more than half of these schools but without norms andstandards. Through Ministry of Education (MoE) construction programs,AGETIPs, and Social Fund projects, several countries have successfullyopened the school construction business to the informal sector (such asSenegal, Niger, Mali, Mauritania, and Uganda) and therefore have moved tomass production in line with EFA objectives. While AGETIPs have openedthe business to the group of small- and medium-sized enterprises, socialfunds, and some MoEs (such as Mauritania) have widened it to craftsmenand microenterprises. According to this study, EFA calls for 200,000 class-rooms a year to close the classroom gap and to replace substandard andoverage classrooms. This represents between US$1.35 billion andUS1.85 billion of construction business opportunities, without counting

32 • School Construction Strategies for Universal Primary Education in Africa
However, the increasing use of the classic technology did not translate into auniform cost of construction. Unit costs vary widely within a country, even whenthe architectural design and technology are the same. Table 3.1 shows an examplefrom Senegal, where a large array of government and donor-funded projects, usinga similar architectural design and technology, achieved costs ranging from a lowof US$6,700 to a high of US$48,000, more than seven times as expensive. This situation obtains in other countries as well. This suggests that the architecturaldesign and technology are only one determinant of the cost of classroom con-struction. The other determinants lie elsewhere, such as in the procurement andmanagement arrangements.
THE SCHOOL SHELTER
The shelter model can be an efficient way to drive down the costs of classroomconstruction. There are, however, a number of challenges associated with thismodel, and so far none of the experiments have ultimately taken root.
the business of building toilets, water supplies, and other school facilities.This represents between US$200 million to US$250 million per year ofsalary volume.* Only massive involvement of the informal sector wouldallow countries to face such a challenge. In addition, in most African coun-tries the formal construction sector is already overstressed, with increasingopportunities for large contracts resulting from the recent economic upturn.Such countries therefore have a tendency to subcontract school constructionto smaller contractors of the informal sector who execute the works.
Compared with all other buildings, a classroom is the simplest type ofbuilding to erect. Building normed classrooms is the best opportunity forsmall-scale informal contractors to learn the minimum technical specifica-tion to make a building durable. School construction programs are irre-placeable opportunities to improve the skills of the informal constructionsector, if they are given the opportunity to compete for local small con-tracts and receive adequate site supervision. Last but not the least, theinformal construction sector offers local job opportunities to postprimaryor postjunior secondary graduates.
Source: Charmes 2001; DIAL 2007; Haan 2001; ILO 2002a; Johanson and Adams 2004;Kante 2002. Note: *On the basis of about 15–16 percent of construction costs for salaries (AGETIP2004; Faso Baara 2006a).

33
Table 3.1 Range in Unit Costs of the Classic Classroom Technology in Senegal
General project data Technology Implementation/procurement arrangements Unit costs
Usual Number Gross Procure- Per US$ project of class- area Funding Executing Procurement ment classroom per
Project name acronym Years rooms m2 Materials agency agency agency method US$ m2 Index Source
Primary Education PEDP 1987–94 61.50 IDA MoE MPW ICB 13,200 215 2.0 aDevelopment Project
School Construction OPEP-III 2000–04 125 67.34 OPEP MoE MoE/DCES NCB 9,118 135 1.3 bProject III
School Construction Project BID 2000–04 500 67.34 IDB MoE PCU ICB 17,811 264 2.5 b
School Construction Project IV JICA-IV 2000–04 323 65.34 JICA/Japan JICA JICA/Japan In Japan 47,764 731 7.0 c
Education For All Project -1 EFA-1 2000–04 1,000 63.38 IDA MoE AGETIP NCB 9,190 145 1.4 d
National Rural NRIP 2000–04 67 63.38 IDA MoRD Local gov LCB 8,493 134 1.3 dInfrastructure Project
Education Supply PAOES 2000–04 345 65.17 DFA/France AGETIP AGETIP NCB 12,575 193 1.8 bImprovement Project
Communal Support Project PAC 2000–04 15 63.38 IDA Local gov AGETIP NCB 8,992 142 1.4 b
Social Development PFDS 2001–04 115 63.38 IDA AFDS Communities LCB 6,655 105 1 dFund Project
Government School BCI 2000–04 4,134 67.34 Gov/BCI MoE MoE/DCES NCB 8,392 125 1.2 bConstruction Program
Source: (a) World Bank 1995g; (b) Dupety 2005; (c) World Bank 2000d; (d) Diouf 2006.Note: For a complete list of acronyms, see p. xv.
cement block walls, corru- gated iron roof
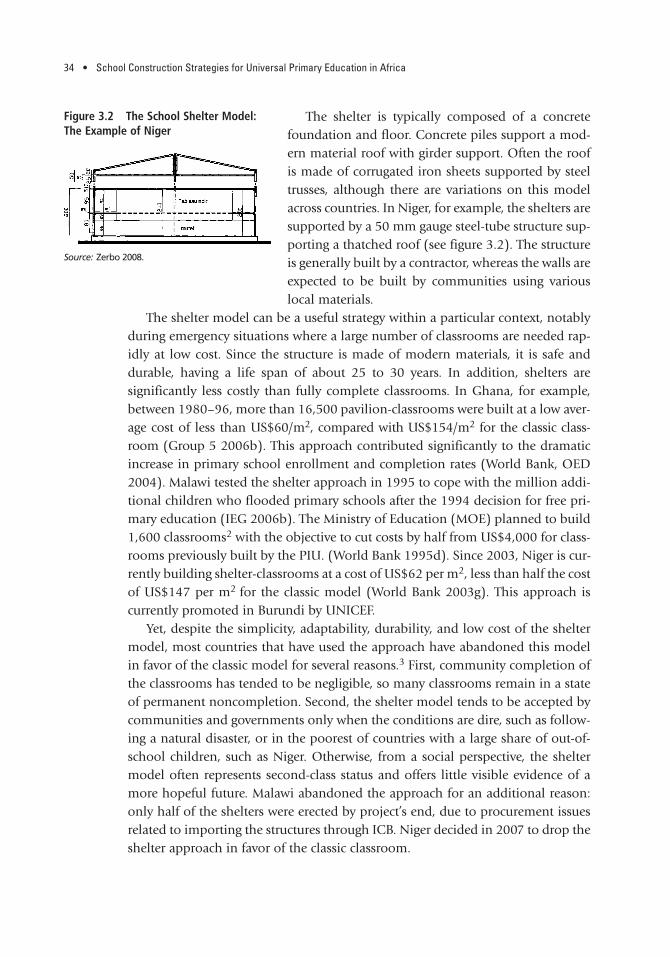
34 • School Construction Strategies for Universal Primary Education in Africa
The shelter is typically composed of a concretefoundation and floor. Concrete piles support a mod-ern material roof with girder support. Often the roofis made of corrugated iron sheets supported by steeltrusses, although there are variations on this modelacross countries. In Niger, for example, the shelters aresupported by a 50 mm gauge steel-tube structure sup-porting a thatched roof (see figure 3.2). The structureis generally built by a contractor, whereas the walls areexpected to be built by communities using variouslocal materials.
The shelter model can be a useful strategy within a particular context, notablyduring emergency situations where a large number of classrooms are needed rap-idly at low cost. Since the structure is made of modern materials, it is safe anddurable, having a life span of about 25 to 30 years. In addition, shelters are significantly less costly than fully complete classrooms. In Ghana, for example,between 1980–96, more than 16,500 pavilion-classrooms were built at a low aver-age cost of less than US$60/m2, compared with US$154/m2 for the classic class-room (Group 5 2006b). This approach contributed significantly to the dramaticincrease in primary school enrollment and completion rates (World Bank, OED2004). Malawi tested the shelter approach in 1995 to cope with the million addi-tional children who flooded primary schools after the 1994 decision for free pri-mary education (IEG 2006b). The Ministry of Education (MOE) planned to build1,600 classrooms2 with the objective to cut costs by half from US$4,000 for class-rooms previously built by the PIU. (World Bank 1995d). Since 2003, Niger is cur-rently building shelter-classrooms at a cost of US$62 per m2, less than half the costof US$147 per m2 for the classic model (World Bank 2003g). This approach is currently promoted in Burundi by UNICEF.
Yet, despite the simplicity, adaptability, durability, and low cost of the sheltermodel, most countries that have used the approach have abandoned this modelin favor of the classic model for several reasons.3 First, community completion ofthe classrooms has tended to be negligible, so many classrooms remain in a stateof permanent noncompletion. Second, the shelter model tends to be accepted bycommunities and governments only when the conditions are dire, such as follow-ing a natural disaster, or in the poorest of countries with a large share of out-of-school children, such as Niger. Otherwise, from a social perspective, the sheltermodel often represents second-class status and offers little visible evidence of amore hopeful future. Malawi abandoned the approach for an additional reason:only half of the shelters were erected by project’s end, due to procurement issuesrelated to importing the structures through ICB. Niger decided in 2007 to drop theshelter approach in favor of the classic classroom.
Figure 3.2 The School Shelter Model:The Example of Niger
Source: Zerbo 2008.

Classroom Construction Technology • 35
LOCAL MATERIALS AND APPROPRIATE TECHNOLOGY CLASSROOMS
The 1960s through the early 1980s was a period of increasing interest and experi-mentation in “appropriate technologies.” The concept of appropriate technologywas derived from Gandi’s ideas and action on self-reliance. In the world of devel-opment, the concept first appeared around 1957 with the establishment of theCanadian Brace Research Institute, which was set up to develop appropriate tech-nology concepts and applications. The movement picked up steam after 1965 withthe creation of the Intermediate Technology Development Group, established bythe economist Ernst Schumacher, to explore alternative technologies in agricul-ture, construction, water, and energy.4 This movement was fueled by the series ofoil crises and oil price hikes in the 1970s and early 1980s, which gave impetus tothe search for substitutes for oil-based materials, such as cement. Further, severalinfluential economists of the time began warning of the limits to the growth of
BOX 3.2 THE SHELTER MODEL IN GHANA
School enrollment in Ghana was about 1.3 million children in the early1980s and the status of facilities was very low. In 1986 the governmentembarked on an ambitious reform program to boost enrollment andadopted the shelter approach to build a large number of classroomsquickly. The IDA-financed projects (Education Sector Adjustment Credits),followed by the Primary School Development Project, spend 30 to 67 per-cent of their resources in school building.
A total of 16,500 shelters were built between 1986 and 1996, an aver-age of 1,650 per year. This was possible because of the very low unit cost ofthe shelters built at US$/m2 60, only 40 percent of the cost of a classicclassroom. This was, indeed, a highly cost-effective way to invest in facili-ties. The program is estimated to account for a 4 percent increase in enroll-ment by reducing distance to school, and to dramatically increasing thenumber of hours of instruction by reducing the number of classrooms notused under rain, from more than half to less than one-third.
Despite a huge remaining backlog of classes without classrooms (still19,000 in 1995–96 out of a total stock of 70,000), the government decidedin 1993 to abandon the shelter model in favor of the classic model, whichwas financed under the subsequent program (BESIP).
Source: OED 2004, Group 5 2006b.
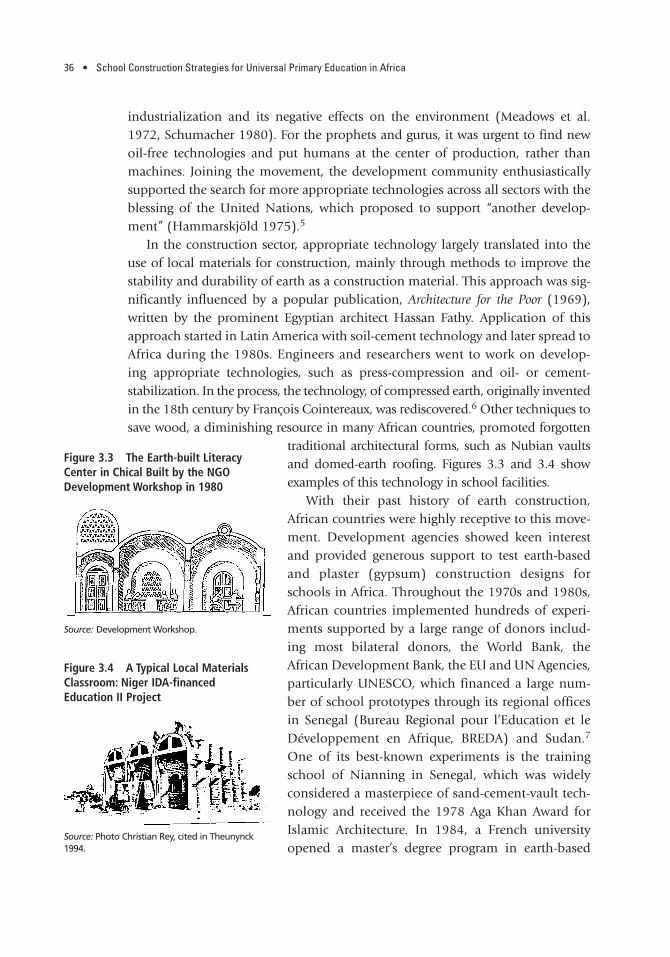
36 • School Construction Strategies for Universal Primary Education in Africa
industrialization and its negative effects on the environment (Meadows et al.1972, Schumacher 1980). For the prophets and gurus, it was urgent to find newoil-free technologies and put humans at the center of production, rather thanmachines. Joining the movement, the development community enthusiasticallysupported the search for more appropriate technologies across all sectors with theblessing of the United Nations, which proposed to support “another develop-ment” (Hammarskjöld 1975).5
In the construction sector, appropriate technology largely translated into theuse of local materials for construction, mainly through methods to improve thestability and durability of earth as a construction material. This approach was sig-nificantly influenced by a popular publication, Architecture for the Poor (1969),written by the prominent Egyptian architect Hassan Fathy. Application of thisapproach started in Latin America with soil-cement technology and later spread toAfrica during the 1980s. Engineers and researchers went to work on develop -ing appropriate technologies, such as press-compression and oil- or cement-stabilization. In the process, the technology, of compressed earth, originally inventedin the 18th century by François Cointereaux, was rediscovered.6 Other techniques tosave wood, a diminishing resource in many African countries, promoted forgotten
traditional architectural forms, such as Nubian vaultsand domed-earth roofing. Figures 3.3 and 3.4 showexamples of this technology in school facilities.
With their past history of earth construction,African countries were highly receptive to this move-ment. Development agencies showed keen interestand provided generous support to test earth-basedand plaster (gypsum) construction designs forschools in Africa. Throughout the 1970s and 1980s,African countries implemented hundreds of experi-ments supported by a large range of donors includ-ing most bilateral donors, the World Bank, theAfrican Development Bank, the EU and UN Agencies,particularly UNESCO, which financed a large num-ber of school prototypes through its regional officesin Senegal (Bureau Regional pour l’Education et leDéveloppement en Afrique, BREDA) and Sudan.7
One of its best-known experiments is the trainingschool of Nianning in Senegal, which was widelyconsidered a masterpiece of sand-cement-vault tech-nology and received the 1978 Aga Khan Award forIslamic Architecture. In 1984, a French universityopened a master’s degree program in earth-based
Figure 3.4 A Typical Local MaterialsClassroom: Niger IDA-financedEducation II Project
Source: Photo Christian Rey, cited in Theunynck1994.
Figure 3.3 The Earth-built Literacy Center in Chical Built by the NGO Development Workshop in 1980
Source: Development Workshop.

Classroom Construction Technology • 37
architecture with the support of CRATerre, a specialized research institutionestablished in 1979. (Refer to Appendix 3 for other prototypes, such as theKoranic school of Malika in Dakar, which also received an Aga Khan Award, andthe BREDA prototype of Diaguily in Mauritania.)
These hundreds of appropriate technology experiments were implemented byAfrican governments mainly through cooperation with international NGOs suchas the British Development Workshop, the Swiss Association pour le Développe-ment d’une Architecture et d’un Urbanisme Africains, the French AssociationFrançaise des Volontaires du Progrès, the Groupe de Recherche et d’Etudes Tech-nologiques, and CRATerre, operating under Memorandums of Agreement withconcerned governments.8 As contractors, their obligations included providingmaterials and tools, hiring labor, and training and supervising the workers.
Following three decades of investment in experimentation, from 1970–2000,the results failed to confirm the expected benefits in three main areas. The build-ings constructed in local materials, such as improved earth or gypsum-plaster, orwith vaulted or dome technology, proved more expensive and less durable thanthose built by the formal or informal sector with modern technologies (Wyss2005). The cost of walls built with compressed soil-cement blocks was 30 to100 percent higher per square meter than walls built with classic cement blocks(CRATerre 1989, Theunynck 1994, Wyss 2005). Waterproofing vaulted and domedroofs proved extremely difficult and costly. For example, the Institut Panafricainpour le Développement, which built such buildings with financing from the Swisscooperation had a 38 percent cost overrun because, after construction, the vaultsand domes needed to be waterproofed with a paxalumin cover. Even so, the build-ing remained beset by roof leaks (Theunynck 1994). The durability of the build-ings was also very limited; many lasted less than 10 years before crumbling.9 Suchweak resistance in normal conditions leads to strong recommendations to avoidsuch types of technologies in earthquake-vulnerable regions.
A 1993 study comparing the direct costs of construction by the informal sectorwith projects promoting improved local materials concluded that, on average, theinformal sector outperformed the local materials projects. Evaluation of recentexperiences of earth-vaulted rooms conducted in 2002–05 in Burkina Faso pro-vides similar conclusions (Wyss 2006b).10
Table 3.2 shows the typical range of unit costs associated with local materialstechnology pilots compared with the classic classroom. In three pilots, costs of thelocal materials and classic classroom were comparable. In all other cases, however,the local material classrooms were on average more than twice the cost of the classic classroom constructed by the formal and informal sectors, using moderntechnology based on cement-walling and modern roofing. Further, the transfer ofthe appropriate technology from promoters to users required costly technical assis-tance from international agencies, NGOs, and consulting firms for the training of
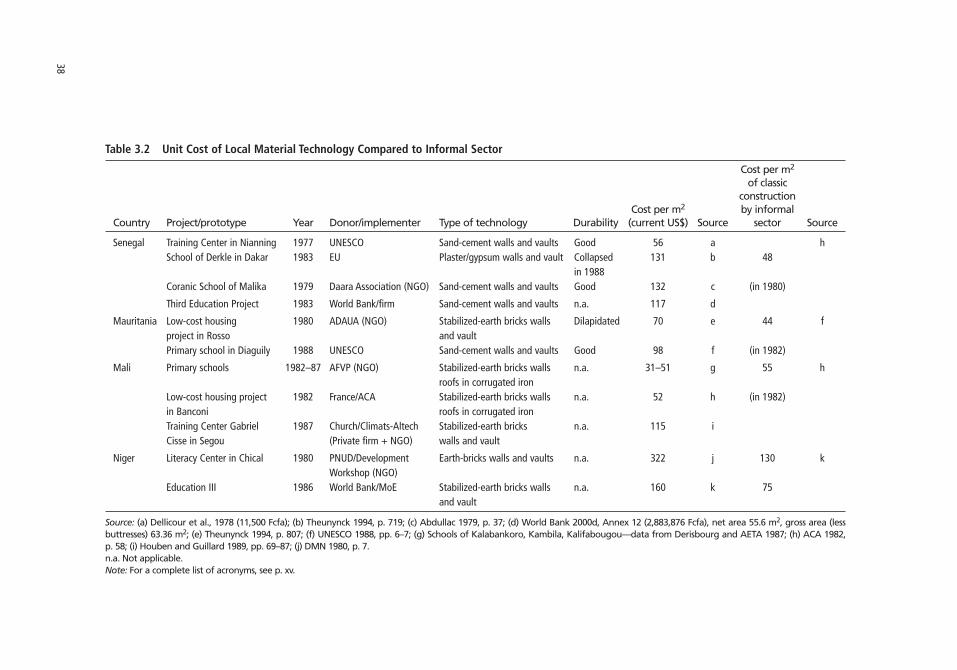
38
Table 3.2 Unit Cost of Local Material Technology Compared to Informal Sector
Cost per m2
of classic construction
Cost per m2 by informal Country Project/prototype Year Donor/implementer Type of technology Durability (current US$) Source sector Source
Senegal Training Center in Nianning 1977 UNESCO Sand-cement walls and vaults Good 56 a hSchool of Derkle in Dakar 1983 EU Plaster/gypsum walls and vault Collapsed 131 b 48
in 1988Coranic School of Malika 1979 Daara Association (NGO) Sand-cement walls and vaults Good 132 c (in 1980)
Third Education Project 1983 World Bank/firm Sand-cement walls and vaults n.a. 117 d
Mauritania Low-cost housing 1980 ADAUA (NGO) Stabilized-earth bricks walls Dilapidated 70 e 44 fproject in Rosso and vaultPrimary school in Diaguily 1988 UNESCO Sand-cement walls and vaults Good 98 f (in 1982)
Mali Primary schools 1982–87 AFVP (NGO) Stabilized-earth bricks walls n.a. 31–51 g 55 hroofs in corrugated iron
Low-cost housing project 1982 France/ACA Stabilized-earth bricks walls n.a. 52 h (in 1982)in Banconi roofs in corrugated ironTraining Center Gabriel 1987 Church/Climats-Altech Stabilized-earth bricks n.a. 115 iCisse in Segou (Private firm + NGO) walls and vault
Niger Literacy Center in Chical 1980 PNUD/Development Earth-bricks walls and vaults n.a. 322 j 130 kWorkshop (NGO)
Education III 1986 World Bank/MoE Stabilized-earth bricks walls n.a. 160 k 75and vault
Source: (a) Dellicour et al., 1978 (11,500 Fcfa); (b) Theunynck 1994, p. 719; (c) Abdullac 1979, p. 37; (d) World Bank 2000d, Annex 12 (2,883,876 Fcfa), net area 55.6 m2, gross area (lessbuttresses) 63.36 m2; (e) Theunynck 1994, p. 807; (f) UNESCO 1988, pp. 6–7; (g) Schools of Kalabankoro, Kambila, Kalifabougou—data from Derisbourg and AETA 1987; (h) ACA 1982, p. 58; (i) Houben and Guillard 1989, pp. 69–87; (j) DMN 1980, p. 7. n.a. Not applicable.Note: For a complete list of acronyms, see p. xv.
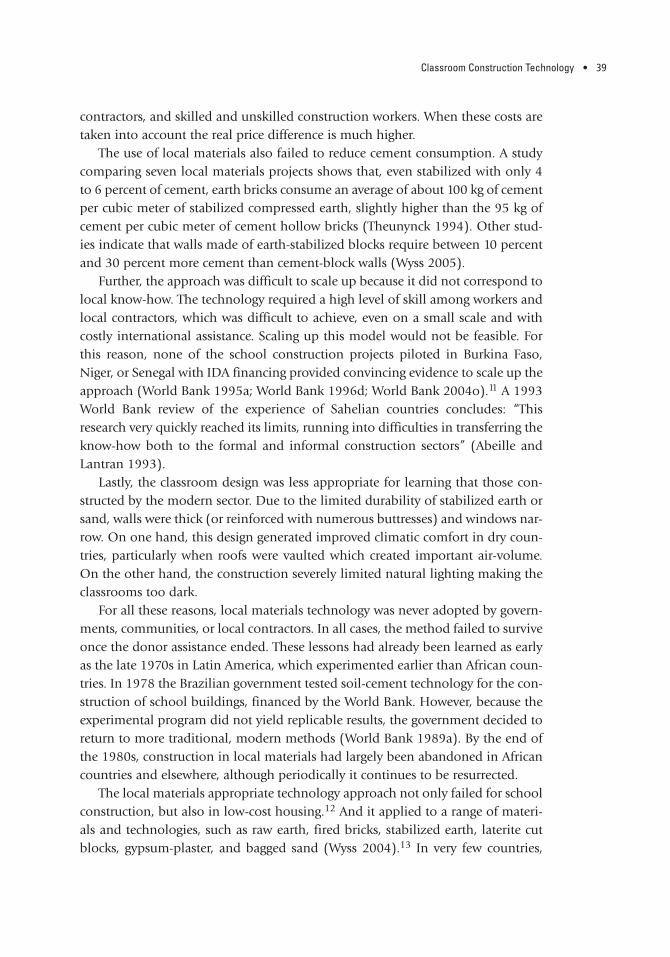
Classroom Construction Technology • 39
contractors, and skilled and unskilled construction workers. When these costs aretaken into account the real price difference is much higher.
The use of local materials also failed to reduce cement consumption. A studycomparing seven local materials projects shows that, even stabilized with only 4to 6 percent of cement, earth bricks consume an average of about 100 kg of cementper cubic meter of stabilized compressed earth, slightly higher than the 95 kg ofcement per cubic meter of cement hollow bricks (Theunynck 1994). Other stud-ies indicate that walls made of earth-stabilized blocks require between 10 percentand 30 percent more cement than cement-block walls (Wyss 2005).
Further, the approach was difficult to scale up because it did not correspond tolocal know-how. The technology required a high level of skill among workers andlocal contractors, which was difficult to achieve, even on a small scale and withcostly international assistance. Scaling up this model would not be feasible. Forthis reason, none of the school construction projects piloted in Burkina Faso,Niger, or Senegal with IDA financing provided convincing evidence to scale up theapproach (World Bank 1995a; World Bank 1996d; World Bank 2004o).11 A 1993World Bank review of the experience of Sahelian countries concludes: “Thisresearch very quickly reached its limits, running into difficulties in transferring theknow-how both to the formal and informal construction sectors” (Abeille andLantran 1993).
Lastly, the classroom design was less appropriate for learning that those con-structed by the modern sector. Due to the limited durability of stabilized earth orsand, walls were thick (or reinforced with numerous buttresses) and windows nar-row. On one hand, this design generated improved climatic comfort in dry coun-tries, particularly when roofs were vaulted which created important air-volume.On the other hand, the construction severely limited natural lighting making theclassrooms too dark.
For all these reasons, local materials technology was never adopted by govern-ments, communities, or local contractors. In all cases, the method failed to surviveonce the donor assistance ended. These lessons had already been learned as earlyas the late 1970s in Latin America, which experimented earlier than African coun-tries. In 1978 the Brazilian government tested soil-cement technology for the con-struction of school buildings, financed by the World Bank. However, because theexperimental program did not yield replicable results, the government decided toreturn to more traditional, modern methods (World Bank 1989a). By the end ofthe 1980s, construction in local materials had largely been abandoned in Africancountries and elsewhere, although periodically it continues to be resurrected.
The local materials appropriate technology approach not only failed for schoolconstruction, but also in low-cost housing.12 And it applied to a range of materi-als and technologies, such as raw earth, fired bricks, stabilized earth, laterite cutblocks, gypsum-plaster, and bagged sand (Wyss 2004).13 In very few countries,

40 • School Construction Strategies for Universal Primary Education in Africa
such as Mali where several large public buildings were erected using earth, such asthe Bamako museum, few local contractors learned and tested the technology.Local materials research or implementation is now confined to architectural her-itage and well-financed construction projects, such as hotels and restaurants. Thehuge volume of lessons learned from experience shows that one should not enter-tain any illusions about the capacity of local materials and appropriate technologyto scale up low-cost school construction. Nevertheless, the concept is regularlyrevived: between 1997 and 2005 not less than three guides for earth constructionwere published.14 It will probably regain support with the 2007 hike in oil price.
INDUSTRIALIZED PREFABRICATION
Prefabrication means that large portions of buildings, such as walls and roofs, arefactory produced off-site, delivered, and assembled on-site. Compared with moretraditional labor-intensive, on-site construction, prefabrication requires a largercapital investment to import building segments or to construct a plant to producethem. This higher cost is intended to be more than offset by savings in labor andmass production.
International experience with prefabrication dates to the 19th century. In theUnited States, prefabrication was introduced in the early 1800s to mass-produceaffordable housing for the middle classes. Business boomed during the main goldrushes (1829–55) when thousands of buildings were shipped to mushroomingtowns. At the turn of the 20th century, mass merchandisers, such as Sears and Roebuck, sold thousands of houses through catalogues. These shops closed duringthe Great Depression of the 1930s, and prefabrication on a mass scale died out inthe United States (Richman 1994). Ironically, at the same time that prefabricationdied out in the United States, it became popular in Europe, where architects inFrance, Germany, Sweden, and Great Britain experimented with the application ofprinciples of automobile manufacturing to mass-produce low-cost housing andimprove its quality. The movement started in Germany in the 1930s with theBauhaus, founded in 1919 by Walter Gropius and closed in 1933 by Mies Van derRohe, and expanded after World War II with the reconstruction challenge.15
History has shown that, despite these numerous attempts, the constructionsector is the unique production sector where industrialized mass-production hasnot taken root. In every country, even in the most industrialized, small construc-tion projects are still generally built by small- and medium-size contractors atcompetitive prices compared to prefabricated buildings. As a result, the construc-tion industry as a whole has remained labor intensive, composed of small- andmedium-size contractors or enterprises (Cassimatis 1969, Barthélemy 1986). InFrance, for example, where the construction industry amounted to €72 billionin 2006, nearly 50 percent of the 342,000 enterprises registered in 2004 were

Classroom Construction Technology • 41
family-owned with no employees, and 40 percent had fewer than 9 employees.They account for more than 60 percent of the construction sector’s production(INSEE 2004, Batiactu 2007).16 Data on the construction sector show that inJapan, small and medium-sized builders represented 99 percent of the 565,000construction firms in 1996 (Sugi 1998). In the United States, there are about2 million construction firms and their number has not changed since the 1970s.Most are one-person firms (Finkel 1997). Figure 3.5 shows that, in the UnitedStates, in 2001, less than 2 percent of the new houses were prefabricated, andonly about 4 percent were built with prefabricated modular elements (refer toAppendix 4 for a brief history of industrialization in the construction industryworldwide).
The industrialization failure is due to three main factors. First, studies showthat economies of scale are few in prefabricated buildings, particularly when theinfrastructure is small and widely dispersed (Carassus 1987, Finkel 1997, Koskelaand Vrijboeuf 2001). The exception is in situations where a large number of mul-tistory buildings are constructed on the same site and labor is in short supply (Kun2004).17 This is clearly not the case with primary schools in Africa. Second, a 2001ILO report concluded that prefabrication may be appropriate in economies wherelabor is expensive and there is full employment. However, in countries with low
Figure 3.5 Technologies Used in United States Home Construction, by Region, 2001
On site Modular Prefabricated and other
0
20
40
60
80
100
WestRegion
perc
enta
ge
Northeast Midwest South
Source: SCHL 2003.
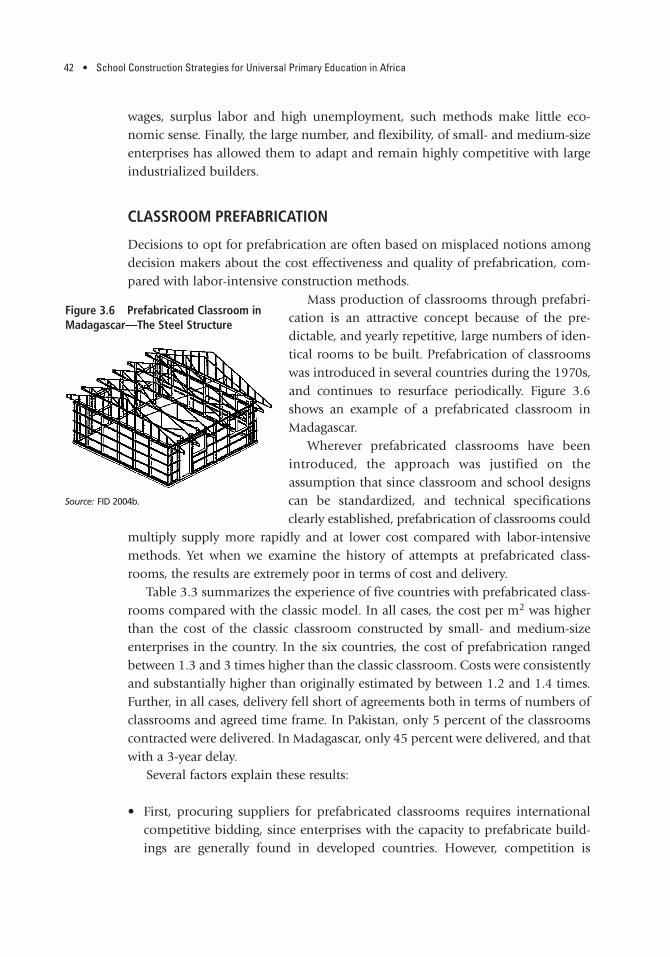
42 • School Construction Strategies for Universal Primary Education in Africa
wages, surplus labor and high unemployment, such methods make little eco-nomic sense. Finally, the large number, and flexibility, of small- and medium-sizeenterprises has allowed them to adapt and remain highly competitive with largeindustrialized builders.
CLASSROOM PREFABRICATION
Decisions to opt for prefabrication are often based on misplaced notions amongdecision makers about the cost effectiveness and quality of prefabrication, com-pared with labor-intensive construction methods.
Mass production of classrooms through prefabri-cation is an attractive concept because of the pre-dictable, and yearly repetitive, large numbers of iden-tical rooms to be built. Prefabrication of classroomswas introduced in several countries during the 1970s,and continues to resurface periodically. Figure 3.6shows an example of a prefabricated classroom in Madagascar.
Wherever prefabricated classrooms have beenintroduced, the approach was justified on theassumption that since classroom and school designscan be standardized, and technical specificationsclearly established, prefabrication of classrooms could
multiply supply more rapidly and at lower cost compared with labor-intensivemethods. Yet when we examine the history of attempts at prefabricated class-rooms, the results are extremely poor in terms of cost and delivery.
Table 3.3 summarizes the experience of five countries with prefabricated class-rooms compared with the classic model. In all cases, the cost per m2 was higherthan the cost of the classic classroom constructed by small- and medium-sizeenterprises in the country. In the six countries, the cost of prefabrication rangedbetween 1.3 and 3 times higher than the classic classroom. Costs were consistentlyand substantially higher than originally estimated by between 1.2 and 1.4 times.Further, in all cases, delivery fell short of agreements both in terms of numbers ofclassrooms and agreed time frame. In Pakistan, only 5 percent of the classroomscontracted were delivered. In Madagascar, only 45 percent were delivered, and thatwith a 3-year delay.
Several factors explain these results:
• First, procuring suppliers for prefabricated classrooms requires internationalcompetitive bidding, since enterprises with the capacity to prefabricate build-ings are generally found in developed countries. However, competition is
Figure 3.6 Prefabricated Classroom inMadagascar—The Steel Structure
Source: FID 2004b.

43
Table 3.3 Comparison of the Cost of Prefabricated Classrooms Compared with the Classic Model
Classic Model (comparator) Prefabrication of classrooms
Cost per classroom Procure- %/
Techno- Procurement (current ment classic Contrac-Country Years logy method US$) Technology method Expected Contracted Actual model ted Delivered Source
Pakistan 1985–86 ICB 4,500 Lightweight ICB 3,500 5,020 7,000 156 < 5% of awall panels contract
Philippines 1994–05 LCB by MPW 10,000 Full prefab ICB 9,200 10,000 100 < 75% bsteel classroom
Ethiopia 2001–02 ICB 9,000 Precast wall ICB 14,000 156 100% cpanels
Madagascar 2004–06 ICB by donors 11,400 Modular ICB for 10,000 9,500 11,400 100 1,400 45% three d(average) prefab materials years later
elements NCB forNCB-LCB by 8,500 work 134FID (average)
Mozambique 2000–02 ICB 8,900 Full prefab ICB 26,500 298 375 100% eclassroom
Source: (a) World Bank 1987b, pp. 15, 75, 113; World Bank 1995f, p.130; (b) Theunynck 1995; World Bank 1996e; (c) Theisen 2002; (d) MENRS 2007; (e) Group 5 2006c, pp. 19–20.Note: For a complete list of acronyms, see p. xv.
Cementblockwalls,corru-gatedironroof
Number of classroomsCost per classroom in US$

44 • School Construction Strategies for Universal Primary Education in Africa
limited because few firms specialize in prefabrication. This limited competitiondrives up the cost and largely explains the significant difference in the cost orig-inally estimated and the actual cost of production.
• Second, when the construction involves a large number of small buildings dis-persed throughout the country, as is the case for primary schools, the costof importing and transporting building segments to construction sites is muchhigher than that of transporting construction materials such as cement, lumber,tiles, or roofing sheets for on-site construction. Transport costs are amplifiedby the absence of usable roads. Indeed, transportation of building segmentsto many rural and remote areas is simply infeasible.
• Third, when industrialized classroom producers are foreign firms, they have lit-tle representation in the country and need to subcontract the on-site assemblywork to local firms. Coordination between timely shipment to the country ofindustrialized items, transport to the sites, and timely operation of subcon-tracted national firms is problematic. The complexity and length of the imple-mentation scheme are illustrated in figure 3.7.
Figure 3.7 Scheme of the Industrialized Prefabrication of Classrooms in Madagascar
Localgovernment
public private
supply of industrializedprefabricatedelementssubcontracting of
installation ofindustrializedprefabricated
elements
siteassembling
Localcommunity
Schoolcommunity
government semi public andNGO sectors
private sector communities
dec
entr
aliz
edce
ntr
aliz
ed
Largenational
contractor
Centralgovernment
Inter-nationalsupplier
Mediumcontractor
Village/neighbor-
hood
Schoolinstitution
ICB for very large contract
Schoolbuilding
Source: Author’s figure.

Classroom Construction Technology • 45
• Fourth, on-site assembly requires few but highly skilled, product- specific work-ers that are generally unavailable in the country (World Bank 1995f). Thisrequires importation of these skills to train the few local workers required. How-ever, even when training is provided, the transfer of skills and competencies toundertake this highly sophisticated work is difficult to achieve, given the currentskill level in many African countries.
• Fifth, the durability of prefabricated classrooms is low and maintenance is com-plicated because industrialized panels are light structures that are highly vul-nerable to shocks, and impossible to repair with the materials and technicalcapacity available. They cannot accommodate subsequent improvements, suchas new electrical wiring because the installation will damage the infrastructure.Further, they do not facilitate instructional use because nothing can be nailedto the walls.
• Finally, the main cost savings associated with prefabrication is the savings in thecost of labor, which, ironically, is in abundant supply in Africa. Indeed, prefab-rication does little to provide employment and to strengthen the local con-struction industry. In the absence of prefabrication, the local small- andmedium-size enterprises and workers in the informal sector would be con-tracted to build the schools, thereby generating employment in rural areas andhelping to improve the standards and quality of the local construction indus-try. Substituting prefabrication for local development can generate frustrationin the communities since the investment has no impact on local employment,as shown in the case of the Philippines. Box 3.3 illustrates these problems inschool construction in three countries that were early adopters of prefabricationfor school construction, and one country currently attempting it.
The experience with prefabricated classrooms clearly points to the conclusionthat prefabrication is not a viable solution to the challenge of scaling up the pro-vision of primary school infrastructure in Africa. Despite the multiple attemptsacross both developed and developing countries, prefabrication has never suc-ceeded in providing a solution to mass production of buildings and classrooms.The construction sector is the only sector that has stubbornly refused industrial-ization. Examples of prototypes of industrially prefabricated buildings are now ofincreasing interest for antiques dealers and collectors.18
THE MODERN CONSTRUCTION MODEL
During the 1970s and 1980s, modern technology for construction, suiting thetechnical capacity of the (often foreign) modern sector of construction, was pro-moted by European countries. For example, the European Union Fund promoteda model with a uniquely designed roof, consisting of welded metal frames, on the

46 • School Construction Strategies for Universal Primary Education in Africa
BOX 3.3 THREE EXPERIENCES WITH PREFABRICATED CLASSROOM CONSTRUCTION
Pakistan and the Philippines were among the early adopters of prefabri-cated classroom construction technology. Madagascar is an example of acurrent attempt to replicate this failed model.
Pakistan. In the mid-1980s, the government of Pakistan adopted pre-fabrication to significantly increase the number of primary school class-rooms, improve the quality of construction, and lower the average cost perclassroom by at least 20 percent (from US$4,500 to less than US$3,500).The construction of 6,000 classrooms in three provinces—Baluchistan,North West Frontier Province, and Sindh—were put out for internationalcompetitive bidding to produce all-weather lightweight panels to be assem-bled on site. Only one bid from a local firm for 3,000 classrooms inBaluchistan and NWFP was considered responsive, but the firm was unableto carry out more than 5 percent of the contract for several predictable rea-sons. First, the main contractor lacked the necessary industrial experienceand capital. Second, the transportation of prefabricated classrooms throughthe existing low standard routes and paths proved to be an insurmountablebarrier. Third, the prefabricated classrooms called for precision in thepreparation of the foundation and installation of the anchor bolts thatlocal contractors could not achieve. To remedy this problem, the biddingprocess excluded local village contractors from the bidding process. Thisexclusion resulted in local resentment and on-site labor problems. In theface of all these issues, the contractor eventually defaulted and the cost perclassroom ended up being at least double the cost initially estimated.
The Philippines. During the early 1990s, the Philippines constructedabout 10,000 classrooms a year. Around 1995, the government opted toprefabricate 26,300 classrooms as a result of a recent ban on logging, aswell as objectives to lower the cost of construction from US$10,000 toUS$9,200 per classroom and simplify management by reducing the number of construction contracts it would have to manage. Firms inManila prefabricated the steel buildings and delivered them to the siteswhere they were assembled in about two weeks. Although assembly time wasrapid, any cost savings was eliminated by the actual cost of site preparationby local governments. Further, due to poor road and land conditions, morethan 25 percent of the classrooms could not be transported to, or assem-bled on, the site. Finally, the sophisticated technology generated frustration

Classroom Construction Technology • 47
top of which bowed iron sheets were soldered (seefigure 3.8). The sophistication of the roof technologyrequired technical capacity only available from largecontractors in the modern construction sector. Theroofing was almost twice the cost of a concrete roofexecuted by small- and medium-size enterprises, andfour times the cost of a roof in corrugated metalsheets (Theunynck 1994). Overall, this model
in the communities because the investment had no impact on localemployment and required unavailable high-tech technology for mainte-nance. The Philippines subsequently abandoned prefabrication in favor of conventional classroom construction technology.
Madagascar. In 2004, Madagascar opted to prefabricate classrooms inorder to increase the gross primary school enrollment rate from 80 to88 percent in the 2005–06 school year. The MoE selected a Contract Management Agency, the Fonds d’Intervention pour le Développement(FID), to manage the process on its behalf. The agency launched a limitedinternational bidding process for the prefabrication of 1,400 classroomsamong 10 international firms from five continents. Only three submittedproposals. The contract was awarded to a U.S. firm that subcontractedassembly work to domestic medium-size contractors. The contract provided for the full completion of works in 5.5 months (4 months forindustrial production and shipment, and 1.5 months for on-site assembly)compared with 12 months for classrooms constructed by local contractors.The program was also expected to generate a 20 percent cost saving overthe prevailing price of per classroom achieved by local contractors. After3 years of implementation, less than half the classrooms had been deliv-ered at a (pretax) cost of US$11,400. This was not lower than traditionalclassroom construction classrooms financed by donors through ICB, butmore than one-third higher than the average of classrooms built by the FIDunder NCB through the CMA and community approaches, and 15 percenthigher than the expected costs.
Sources: Pakistan: World Bank 1987b; World Bank 1995f. Philippines: Theunynck 1995;World Bank 1996e. Madagascar: Group 5 2005; MENRS 2007, Theunynck 2006.
Figure 3.8 The European Union FundModel
Source: European Union.

48 • School Construction Strategies for Universal Primary Education in Africa
reached unit costs as high a US$500 per m2 (UNESCO 1984). Although it hadbeen built by the hundreds in every African country, countries abandoned thisdonor-driven model when the donor financing was discontinued.
CONCLUSION
No more testing is needed. The most “appropriate” technology for school con-struction is that which has the greatest potential of mass production at low cost onthe local market, using small- and medium-size enterprises in the formal andinformal sectors. This also means simple designs using technologies familiar tothe local construction industry and generally means modern techniques—cementblocks for walls, corrugated-iron roofs, and reinforced concrete structure.
Figure 3.9 shows an example of such a design inMauritania. The design has a life span of 25 years andis easily implemented by small-scale local contractorsfrom the formal or informal sectors. This is probablythe most modest model among all African classicmodels.19 Since the mid-1980s, many countries inAfrica have followed this approach and adopted theclassic model. In Burkina Faso, Senegal, Niger, andMali, reductions of construction costs by 30–50 per-
cent were therefore made possible (Abeillé and Lantran 1993). In terms of tech-nology, this route seems the most promising: it is consistent with historical con-struction trends, by which the informal sector moves fairly quickly, and it generallyleads to lower costs.
Sadly, much of this has mostly remained donor driven. Nevertheless, throughthe large array of past and current projects financed by donors and governments,all African countries have now acquired enough experience in classroom designto easily move toward a standard set of classroom models to be applied by all projects, regardless of origin of funds. Indeed, they know by their own experienceor that of others, what does not work: local materials and too-sophisticated modern technologies, including industrialized prefabrication. They may know thatthe approach of the shelter technology may be a solution, but not for the long term.They can also learn from their own experience that the simple modern technologyof the “classic model” allows them to scale up school construction programs ataffordable costs. Indeed, through the current extensive development of the infor-mal construction sector, capital requirements, logistics, and skills exist in everycountry to scale up construction of the classic model, albeit at different levels ofquality and cost. Success depends on strong cooperation with the local industryand the right choice of technology. It also depends on the willingness of govern-ments with their supportive donors to take stock of lessons learned and to move
Figure 3.9 A Simple and Modest Classroom: The Mauritanian Model
Source: PDEF Mauritania.
Classroom Construction Technology • 49
toward a harmonized model. The Fast Track Initiative supports this movementunder the Paris Declaration on harmonization.
NOTES
1. For example, in a 1992 survey in Burkina Faso, Yars (1999) finds that 71 percent ofhouses were built by craftsmen in the informal sector.
2. The shelter was called “shell” because of the shell-type steel structure test-piloted byUNICEF.
3. Ghana abandoned in 1996, Malawi in 2000, and Niger in 2007.4. The Intermediate Technology Development Group is an international NGO founded
in 1966 and registered in the U.K. that works in Latin America, Southern Africa, and SouthAsia. In 2006, it had 16,000 regular supporters specialized in helping people use technol-ogy for solutions to poverty.
5. In 1975, the UN Secretary General proposed “Another Development,” and the UNsupported the establishment of several centers for the research and promotion of appro-priate technologies in Africa, such as the Center for Adapted Technologies in Mali. Euro-pean universities and a large number of donors also provided support.
6. The technology of compressed earth bricks was first applied by François Cointereauin the 18th century, using a wine press. The appropriate technology efforts also renewedinterest in the CINVA-RAM press invented in 1952 by Paul Ramirez, at the Centro Inter-americano de Vivienda y Planeamiento in Bogota, Colombia.
7. For example, the World Bank financed 30 pilot schools with the technical support ofCRATerre in Burkina Faso, two prototypes made of earth-bricks with vaulted roofs in Niger,and Nianning-type schools in Senegal (World Bank 1979b, 1985c, 1986).
8. CRATerre is a French research laboratory created in 1979 the School of Architecture ofGrenoble (France) providing training and technical assistance in earth-built construction.
9. Several examples of this include the houses built in local materials by ADAUA in1983 in Fada N’Gourma; in Burkina Faso the Centre de Formation de Monitrices Rurales inKamboincé; housing Cité An II, a housing project built in 1986 in the same country; an EU-financed prototype of a classroom built with dehydrated gypsum in the school of Derkle(Dakar, Senegal) built in 1983, which collapsed in 1988; and low-cost housing also builtwith dehydrated gypsum by the NGO ADAUA in 1980 in Nouakchott (Mauritania), whichhad all collapsed and been replaced with classic construction by 1990 (Theunynck 1994).
10. The recent experience conducted in Burkina Faso in 2002-05 by the NGO “La VouteNubienne,” with technical support of CRATerre and French government financing, showsthat 100 percent of earth-roofed rooms built by the NGO are not competitive comparedwith corrugated-iron roofed rooms built by the informal sector in rural areas (Wyss 2006b).
11. In Niger, the Primary Education Development Project abandoned the local materialapproach after two prototypes (1986–87) and shifted to simple techniques mastered bylocal builders (World Bank 1996d). Burkina Faso abandoned it after 10 school prototypes(in Yagma, Noongandé, Zoetgomdé, Songa, and Loumbila) built in 1990–91, and only halfcompleted at the end of the Primary Education Development Project (World Bank 1995a).They are dilapidated at present (Wyss 2005a). In Chad, earth school prototypes were builtin the 1980s by NGOs with support of the Swiss cooperation, but also to no avail(Oumarou 1993, World Bank 2003b).

50 • School Construction Strategies for Universal Primary Education in Africa
12. An international forum held in Berlin in 1987 on low-cost housing and local devel-opment concluded that appropriate technology for construction never broke into the construction market (Habitat Forum Berlin 1987).
13. Fired bricks also have environmental drawbacks when they are fired with wood, asin Rwanda. In exceptional situations, such as in highlands of Madagascar, handcrafted firedbricks are an efficient low-cost material used on a large scale by the both formal and infor-mal construction sectors. In this country the firing energy is provided by rice-husk, ano-value by-product of rice production with no environmental drawback.
14. See Norton 1997; Gurney 2004; Wolfskill et al. 2005.15. In France, the Groupement d’Etudes pour une Architecture Industrialisée, GEAI,
was founded in 1945, led by the French architect Le Corbusier and engineers Marcel Lodsand Jean Prouvé, who adapted the methods of car and airplane construction to house con-struction. In Great Britain, there was a major push to construction industrialization throughthe Large Panel System–LPS (DTI 2001a).
16. The sector of small construction enterprises showed strong vitality by a 5 percentyearly business increase (FCGA 2007).
17. Hong Kong is the example of successful industrialization. 18. A prototype of an industrially prefabricated modular house—the “Tropical
House”—designed in 1951 by the engineer Jean Prouvé for tropical countries, shipped toand built in Brazzaville (Congo), has been recently rediscovered by an antiques dealer. Rec-ognized as a master piece of modern industrialized architecture, it was reassembled in NewYork City in 2007 and sold by Christie’s auction at US$5 million. Another prototype of thesame Tropical House is exhibited on the terrace of the Centre Pompidou, Paris. The HeraldTribune, May 20 and June 7, 2007.
19. This model has been built since 1990 through World Bank–financed projects: Edu-cation III and V, and PNDSE. However, this model is not friendly to the physically disabled,and should be adjusted to provide larger spaces and ramps for exit and entry in the case ofwheelchairs. It costs very little to incorporate such adjustments into new construction ofclassrooms and latrines (Social Fund Senegal).
51
Technology for Sanitationand Water
CHAPTER 4
SANITATION IN SCHOOLS
Three basic types of installations exist to neutralize human waste in schools. Twoare waterborne: the centrally operated wastewater treatment system and the septictank system. The third type is dry. The centrally operated waterborne system is typ-ically associated with urban settlements where the cost of connections and main-tenance is low. The septic tank is recommended in towns where central systems areunavailable. The septic tank is composed of a sealed tank in which bacteria asso-ciated with human waste are rendered harmless through fermentation. Theremaining effluent is drained away into the porous soil of septic fields called soak-aways. Investment costs are high, but maintenance is low. Both systems requireplentiful running water to function well.
Most of the school sanitation systems are of the third type: the dry-pit latrine,which is also the most maintenance intensive. Many dry-pit latrine designs havebeen field-tested in Africa because most sites are far from running water access.Figure 4.1 shows one example of dry-pit latrines that have been widely tested andproven efficient in diverse country contexts. Other examples are provided inAppendix 5. One of the better-known dry-pit latrine models is the VentilatedImproved Pit (VIP) latrine. The VIP has functioned well under controlled fieldtests, but has typically failed for lack of maintenance when implemented on alarge scale. VIP latrines have two chambers that must alternate in use. While onechamber collects human waste, the other must be inactive for about a year to allowthe waste to ferment and desiccate into a dry hazard-free substance that can besafely removed. Rainwater must be prevented from entering the fallow chamber.VIP latrines also include a natural ventilation shaft from the collection chambersthat helps reduce offensive odors. An insect screen at the top of the ventilationshaft prevents flying insects from spreading fecal matter. The insect screen mustremain unbroken and unclogged. VIP latrines work well only when regularlymaintained.
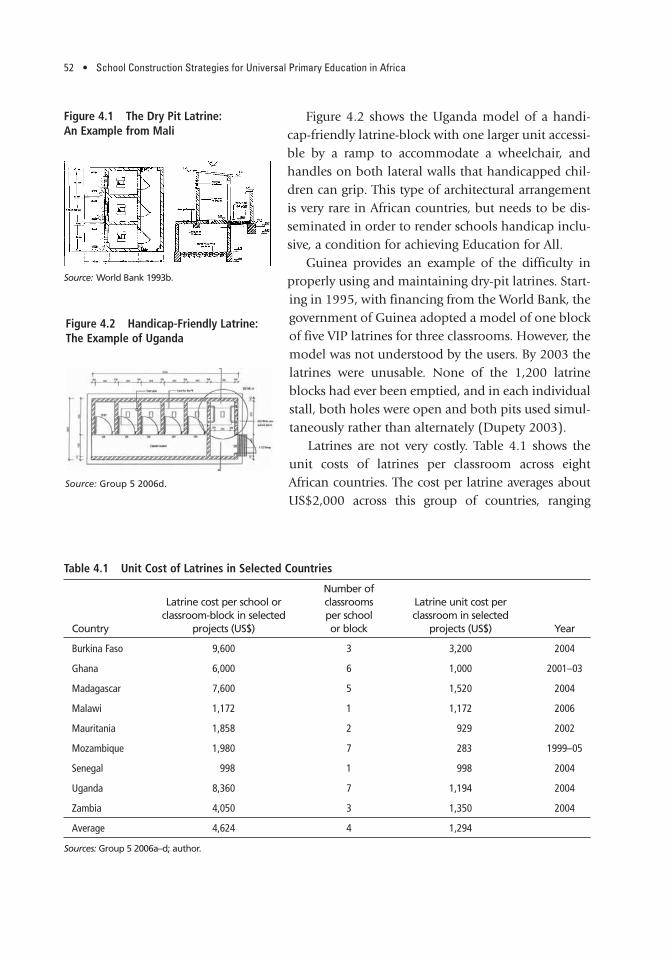
Figure 4.2 shows the Uganda model of a handi-cap-friendly latrine-block with one larger unit accessi-ble by a ramp to accommodate a wheelchair, andhandles on both lateral walls that handicapped chil-dren can grip. This type of architectural arrangementis very rare in African countries, but needs to be dis-seminated in order to render schools handicap inclu-sive, a condition for achieving Education for All.
Guinea provides an example of the difficulty inproperly using and maintaining dry-pit latrines. Start-ing in 1995, with financing from the World Bank, thegovernment of Guinea adopted a model of one blockof five VIP latrines for three classrooms. However, themodel was not understood by the users. By 2003 thelatrines were unusable. None of the 1,200 latrineblocks had ever been emptied, and in each individualstall, both holes were open and both pits used simul-taneously rather than alternately (Dupety 2003).
Latrines are not very costly. Table 4.1 shows theunit costs of latrines per classroom across eightAfrican countries. The cost per latrine averages aboutUS$2,000 across this group of countries, ranging
52 • School Construction Strategies for Universal Primary Education in Africa
Figure 4.1 The Dry Pit Latrine:An Example from Mali
Source: World Bank 1993b.
Figure 4.2 Handicap-Friendly Latrine:The Example of Uganda
Source: Group 5 2006d.
Table 4.1 Unit Cost of Latrines in Selected Countries
Number ofLatrine cost per school or classrooms Latrine unit cost per
classroom-block in selected per school classroom in selectedCountry projects (US$) or block projects (US$) Year
Burkina Faso 9,600 3 3,200 2004
Ghana 6,000 6 1,000 2001–03
Madagascar 7,600 5 1,520 2004
Malawi 1,172 1 1,172 2006
Mauritania 1,858 2 929 2002
Mozambique 1,980 7 283 1999–05
Senegal 998 1 998 2004
Uganda 8,360 7 1,194 2004
Zambia 4,050 3 1,350 2004
Average 4,624 4 1,294
Sources: Group 5 2006a–d; author.

Technology for Sanitation and Water • 53
between US$1,000 in Senegal and Uganda to more than US$3,000 in Mauritaniaand Burkina Faso. In comparative terms, the cost of one latrine averages 23 percentof the cost of one classroom, ranging between 11 percent in Madagascar to 34 per-cent in Mauritania, where sandy soils make the construction of underground pitstechnically difficult. Nevertheless, latrines are a necessity, and such countries asUganda have shown that when strong government commitment and reasonableunit costs are present, finances can be mobilized to provide all primary schools withlatrines. In Uganda, about 120,000 latrine stalls were operational in 2002, morethan 35,000 of them having been built within the past 5 years (Group5 2006d).Nevertheless, the remaining and stubbornly unresolved problem is maintenance.
WATER SUPPLY FOR SCHOOLS
There are five basic types of technology for potable water provision: rainwatertanks, a well, borehole, a water stream, or a pipe connection to a communal watersupply. Rainwater tanks collect and store rainwater runoff from classroom roofs,and are therefore appropriate in regions with difficult access to undergroundaquifers and enough rain to fill the tank for the school year. Rainwater tanks areoften used in such African countries as Rwanda and Madagascar also because thisis the less expensive means of supplying water; however, this advantage may beoffset by health risks when regular maintenance is not carried out to keep waterclean over time. Water wells have been used in schools with a shallow under-ground aquifer, as in The Gambia, for example. A well is an excavation dug downto access the underground aquifer to withdraw water by hand or with a pump,supplying water at a low cost. However, sound planning and careful maintenanceare required to prevent contamination of the water well and the undergroundaquifer. When the groundwater is too deep for a well, a borehole, equipped witha pipe and a pump, often manually operated, needs to be drilled toward thegroundwater. Boreholes are significantly more sanitary than open wells becausethe water source itself is protected from contamination by its depth. However, theyare found in very few schools because the machinery and techniques to drill themare costly and their maintenance requires technology skills that are far beyondusers’ capacity, making this technology hardly affordable by MoEs’ investment andrecurrent budgets.
Most wells do not function as intended (Dupety 2003). In the sample of ninecountries shown in table 4.2, unit cost ranges from less than US$1,800 in Senegalto almost US$19,000 in Madagascar. The average cost in this sample is aboutUS$8,000. The main reasons for such a wide range are probably the geological con-straints of accessing water in rural areas, the type of water supply, the type of pumpand tank if any, and the implementation arrangements to contract the works. Forexample, in The Gambia, the successful system of school water supply is a modern

54 • School Construction Strategies for Universal Primary Education in Africa
well that serves both the school and the village. Thewater supply is designed to be accessible from bothsides, well-protected against the risk of water stag-nation, and equipped with a side system of cattletroughs. Its high cost is not explained by geologicalcharacteristics—in this riverbed country, water iseasily accessible—but by the high standard of themultipurpose supply combined with the delegationof works to the ministry.
CONCLUSION
Ministries of Education (MoEs) have limitedknowledge of water and sanitation technology.They are not always aware of technical recommen-dations provided by the national strategies for
water and sanitation that are implemented under the responsibility of other min-istries. When resources are limited, they too often prioritize access to education,that is, classroom construction, to the detriment of water and sanitation; anddonors have too often followed suit. African schools are therefore very far frombeing adequately equipped. Providing adequate water and sanitation services toall new schools and retrofitting all existing ones—necessary to achieve EFA—require that MoEs not only include water and sanitation in the minimum infra-structure package for primary schools but also provide adequate resources forthem. They must also link up with sector ministries in charge of water and sanita-tion to choose the most adequate and affordable technology, possibly sharecosts, receive professional technical advice during implementation, and trainschool staff and the community in proper maintenance. Donors should notfinance any school construction programs that do not reduce the water and sanitation deficiencies.
Table 4.2 Cost of Water Supply per Schoolin Selected Countries
Cost of waterCountry per school (US$) Year
Burkina Faso 11,000 2004
Gambia, The 10,471 1993
Ghana 8,571 2001–03
Madagascar 18,750 2004
Malawi 4,975 2006
Mozambique 4,900 1999–05
Senegal 1,840 2002–04
Uganda 2,000 2004
Zambia 9,000 2004
Average 7,945
Source: Group 5 and ST.

55
Procurement and ContractManagement
CHAPTER 5
Services required to build schools involve the supply of materials and skilledworkers, site supervision to ensure technical quality, and management of thecontracts with the suppliers. Often, in large programs, a sample-based tech-
nical audit is also performed by an independent contractor as a further control onthe quality of construction. Several types of approaches have been used to securethese services for the construction of primary schools. These approaches involvedifferent procurement and management arrangements, each having an impact oncosts, delivery time, and ability to scale up and reach rural and remote areas.
This section reviews the strengths and weaknesses of procurement and man-agement approaches to securing construction services used over the past 30 years.On the procurement side, we review the experience with centralized internationaland national competitive bidding, and price quotations. On the managementside, we review the experience with management by public administrations, con-tract management agencies (CMAs), NGOs, social funds (SFs), and communities.We first describe these approaches and the rationale for their introduction andthen analyze their performance in terms of delivery and comparative cost. Onlycosts of schools built to last at least 25 years are considered in this chapter, exclud-ing technologies using local materials, either traditional or “appropriate.” Theissue of differences of quality of construction is not addressed in depth in the pres-ent study because there are not enough data to discuss it. However, when techni-cal audits are available, they provide relevant data on the quality of built facilities.
PROCUREMENT MANAGED BY CENTRAL ADMINISTRATION
THE FIRST MODEL: CENTRALIZED MANAGEMENT WITH PROCUREMENT THROUGHINTERNATIONAL COMPETITIVE BIDDING (ICB)
Centralized management by the MoE or Ministry of Public Works is an approachthat most, if not all, countries have traditionally used, whereby the central min-istry office allocates the resources for school construction, procures the works,

evaluates and awards the contracts through the National Tender Board, pays thecontractors, and supervises the construction work.
One of the earliest approaches to procuring construction services used central-ized management combined with international bulk procurement for the fulldelivery of classrooms, including the provision of materials, labor, and site super-vision. Centralized bulk procurement for the full delivery of classrooms involvespackaging a large number of individual school sites into one or a few large bid-ding packages, which are then put out for ICB. Management of the packaging andprocess is usually done by the central Ministry of Education or of Public Works.
Following the independence of many African countries in the 1960s, ICB wasnearly the sole procurement approach used for donor-financed school construc-tion programs. Most primary school infrastructure financed by the IDA, AfDB, andEEC, among others, continued to use this approach through the 1980s. At thetime, donors deemed this approach appropriate to the context. New governmentadministrations were just developing and management capacity was weak. Africanadministrations were highly centralized. In most African countries, followingindependence, the construction industry was highly concentrated in the hands ofa few foreign contractors (eventually with a local basis), which resulted in highprices and increased potential for corruption. National contractors were few, andsmall- and medium-size enterprises were even fewer. In addition, centralized bulkprocurement was considered specifically attractive for school construction becauseclassroom needs are large. Thus, the ICB approach seemed to match the context.It aimed to address capacity weaknesses of national administrations, lower thecost of construction, and contain corruption in several ways. First, bulk packagingwas seen as more compatible with weak procurement capacity of governmentagencies as it required fewer contracts for the procuring agency to manage. Fewerand larger contracts were also more compatible with limited donor responsecapacity. Second, reliance on large contractors with strong financial and technicalcapacity was seen as a way to compensate for weak technical monitoring and contract management capacity of government agencies. Third, the increased com-petition among private enterprises was expected to result in competitive prices.Finally, the use of the donor’s ICB procedures was seen as a way to safeguardagainst corruption since donors reviewed the procurement process and gave theirnonobjections at various stages.
Figure 5.1 illustrates the actors and steps involved in a typical ICB process. Usu-ally, large firms, whether foreign or national, subdivided the contract into smallerlots and subcontracted the works to smaller local enterprises, which were unableto gain access to public procurement due to the high turnover and investment cap-ital requirements. Thus, the large firms operated as contract management agencies,securing local contractors and supervising their work. However, such subcontract-ing was generally an informal practice, often illegal, thus limiting quality control
56 • School Construction Strategies for Universal Primary Education in Africa

Procurement and Contract Management • 57
by the contracting administration. This development also provided lessonslearned for the future creation of CMAs.
By the end of the 1980s, ICB procurement for the delivery of primary class-rooms showed clear limitations in its effectiveness to meet the scale of the needsrequired at a competitive price. Construction costs were high, averaging betweenUS$15,000 and US$30,000 per classroom in 1980 prices.1 The high costs resultfrom several factors. First, architectural design was sophisticated and followed theaforementioned modern construction model. Second, international competition waslimited because primary classrooms are small works dispersed throughout thecountry, which attracted the interest of few large firms. However, at the countrylevel, most enterprises were unable to meet the bidding requirements. Third, as aresult, the few interested and qualified contractors often formed cartels in order tofulfill the technical requirements, and divided up the public construction marketamong themselves, thereby driving up prices. Fourth, procurement procedureswere lengthy and cumbersome, resulting in prolonged delays, which further droveup costs. Finally, local construction industries were developing and becomingincreasingly competitive with international suppliers.
Figure 5.1 Centralized Bulk Procurement Process
builds theschool
buildsthe
school
subcontract(often hidden
procedure)
Large national
contractor
communities
Smallcontractor
Mediumcontractor
semi public andNGO sectors
government
ICB for large contract
private sector
dec
entr
aliz
ed
public private
Localcommunity
Schoolcommunity
cen
tral
ized
Centralgovernment
Localgovernment
Village/neighbor-
hood
Schoolinstitution School
building
Source: Author’s figure.

58 • School Construction Strategies for Universal Primary Education in Africa
Based on this experience, in the beginning of the 1990s, the IDA and EEC aban-doned the use of ICB procurement for primary school construction, whereas theAfDB and OPEC continued in the 2000s to finance school construction programsthrough ICB with similar results in, for example, Ghana and Zambia (Group 52006b and 2006e).2 As a whole, the review found that, on average across countriesand time, classrooms procured through ICB cost about US$480 per m2 in 2006prices. However, such very high average cost masks some differences over time.Prices were much higher in the past when ICB and foreign contractors were thenorm, and are lower—but still very high—nowadays, when it is an exceptionalmethod used in a much more competitive environment.
Variation 1: ICB with Community Participation
Another early approach to school construction in Africa, common during the1970s–1990s, combined ICB procurement of modern construction materials withcommunity contributions of labor and local materials. These programs were cen-trally managed by MoEs for the bulk purchase of imported materials, and oftenimplemented with the assistance of NGOs for the community-based aspects.
This approach was expected to yield cost savings on materials and labor. Sav-ings on materials would come from ICB procurement of imported materials thatindividual communities could not procure cost effectively. Savings would alsocome from community contributions in labor and local materials, such as sand,gravel, and water, to construct the building. Technical assistance was also providedto communities to help them organize and implement their part. In addition tothe cost savings, common arguments presented for community contributions arethat they reduce overall project costs and promote community empowerment andownership, which results in a greater willingness to maintain the building andultimately leads to sustainability (World Bank 2002c, Wilson 2006).
This approach proved inefficient, although saving costs compared with previousfull ICB, but no cost advantage compared to full national competitive bidding(NCB), and was generally abandoned at the end of the 1980s. However, communitycontributions continued to be incorporated into school construction programs.
Figure 5.2 illustrates the implementation path and points to one of the mainproblems with the approach—the difficulty of synchronizing the delivery of inputscoming through two separate channels. Similar to the experience with prefabrica-tion, it proved nearly impossible to coordinate the delivery of materials with theavailability of community labor. On the government side, bulk procurement ofimported materials resulted in long delays. Materials were delivered at unexpectedtimes, and at times when community labor was unavailable. From the communityside, the counterpart materials were also not always mobilized when they wereneeded, often owing to the community’s financial constraints. In Zambia, time

Procurement and Contract Management • 59
completion was not less than 2 years and often 4 years (Group 5 2000a). In BurkinaFaso, work sites faced major disruptions, leading the government to put an end tothe approach after 13 years of implementation (1985–98) and to turn the workto the contract management agency Faso Baara (World Bank 1991a and 1999a).3
In the Gambia (1990–99), coordination of community labor with the delivery ofimported materials resulted in 2- to 3-year delays. In Senegal, the approach wasalso experimented with during 12 years (1987–99) and was found extremely time-consuming, compared to the NCB approach (World Bank 1995g).
Unit costs proved lower than when works were fully procured through ICB, butsubstantially superior to those obtained by procuring the full package of materialsand works from local enterprises through national or local competitive bidding(table 5.1). Bangladesh, Burkina Faso, Senegal, The Gambia, and Zambia provideexamples. In Zambia, under a 1993 OPEC-financed project, the unit cost of class-rooms, including 25 percent community participation, was one-third higher than
Figure 5.2 Scheme of Combining Bulk Procurement of Imported Materialswith Community Participation
mobilizesschools
supplyimportedmaterials
cen
tral
ized
semi public andNGO sectors
private sector
dec
entr
aliz
ed
providessupport
provides
labor
provides supportto supervision
mobilizes the school community
ICB supply of imported materials
Centralgovernment
(MoE)
public private
Localcommunity
Schoolcommunity
government communities
Largenational
contractor
Localgovernment
Inter-nationalsupplier
Mediumcontractor
Smallcontractor
Village/neighbor-
hood
Schoolinstitution School
building
Source: Author’s figure.

60
Table 5.1. Costs of ICB Combined with Community Participation Compared to Other Methods
Performance of bulk procurement of imported materialscombined with community participation for works Performance of other methods
Project Project Procurement US$ Project Project Procurement Procurement US$Country Years name Financer agency agency per m2 Source name Financer agency agency method per m2 Source
Burkina Faso 1985–94 Education III IDA PIU/MoE PIU 50% a n.a. n.a. n.a. n.a. ICB 100% a
Gambia, The 1993–95 ESP phase 1 IDA PIU/MoE PIU 152 b ESP IDA PIU/MoE PIU NCB 110 bPhase 2
Senegal 1993–99 SHRDP ESCP PIU/MoE PIU 316 c n.a. donors n.a. PIU ICB 494 dPEDP-1 IDA PIU/MoE CMA NCB 233 c
Zambia 1993 OPSUP OPEC ZEPIU OPEP-ZEPIU 215 e SRP World Bank/ MPU Communities LCB 161 fEU
Source: (a) World Bank 1991a, 1995a; (b) Education Sector Project (Synergy 1997, World Bank 1999c); Synergy 1997; (c) World Bank 1995g; (d) World Bank 1993e; (e) World Bank 1995 OPEC PrimarySchool Upgrading Program (Group 5 2000) ; (f) Social Recovery Project/ZAMSIF (Group 5 2000).Notes: Unit costs are adjusted to 2006 prices using the U.S. GDP deflator. For a complete list of acronyms, see p. xv.n.a. Not applicable.

Procurement and Contract Management • 61
the unit cost achieved by a parallel community-based project that procured theworks inclusive of labor and materials for the same quality of classroom (Group 52000s). In The Gambia, construction costs were 38 percent higher than thoseachieved by the MoE using NCB procedures.4 In Senegal, the approach initiallyresulted in lowering costs from previous full ICB by 36 percent, although it wasfound 36 percent more costly compared with NCB approach without counting thecost of extensive technical assistance (World Bank 1995g and 1993e).
The Question of Community Participation
No country has, in practice, a standard rate of community cost recovery. Rather,community contribution rates are generally project specific. They vary widelyacross donor and type of project; that is, whether the project is an education proj-ect, a social fund, or an urban, rural, or local development project. Across projects,rates of community contributions for classroom construction generally rangebetween 0 and 25 percent. At the high end, an example is the community schoolconstruction program in Mauritania, which requires a 25 percent community con-tribution, and which built 3,000 classrooms in 15 years. The successful EuropeanUnion–financed microproject programs generally require a 15 percent contribu-tion. Many social fund programs use a 5 percent community contribution share.
Although these are all successful examples of communities contributing theirshare, the lack of a common and applied policy results in some communities hav-ing to contribute more than others, generally the rural communities. An illustra-tive example is Chad, where parent associations were expected to contribute10 percent of the construction cost under an IDA-financed project. In fact, contri-butions were not required when the construction was managed by a contract management agency (AGETIP), while it was between 5 and 10 percent when theconstruction program was managed by NGOs (Lecysyn 1997). Mauritania is asimilar case of double rules for urban and rural communities.5 Further, commu-nity participation policies propose contributions for health, water supply, electric-ity, and agricultural extension services, without consideration of the aggregateimpact on the poor.
Parent and community contributions are rarely recognized or captured in pub-lic accounts. Ironically, despite their significant help to complement the govern-ment’s budget, the contributors are rarely given any recognition. For example, inBenin, communities were not handed the keys to their schools until they had mettheir cash contributions to construction costs in full. Although receipts were keptat the Ministry of Finance, there was no attempt to publicize and thus encourageand reward their participation (World Bank 2000 ICR). Even rarer is any system-atic attempt to capture these contributions in public accounts.
Experience has also shown that community financial or in-kind contributions donot necessarily generate the commitment, nor capacity, to maintain the building.

62 • School Construction Strategies for Universal Primary Education in Africa
Examples of this include Guinea and Niger (Dupety 2003, World Bank 1996d, ADE2006). Further, financial or in-kind contributions are not an indicator of communityempowerment. Rather, empowerment is achieved when communities can managethe construction themselves.
Variation 2: ICB Combined with Microenterprises
An approach close to the previous one, also experimented with during the1980s–1990s, combined ICB procurement of modern construction materials (asin the previous approach) with procurement of labor from small local microen-terprises or masons selected through local competitive bidding (LCB).
This approach was also expected to generate cost savings for reasons similar tothe previous approach as regards the procurement through ICB of imported mate-rials that may not be easily available in the local market. Savings on labor wouldalso come from the use of local enterprises whose prices for labor are not compa-rable to these of large foreign or domestic enterprises. This approach was expectedto yield cost savings on local labor without involving the same volume of technicalassistance required when community has to perform all labor activities, althoughcommunities were nevertheless often invited to provide local materials. Anotherobjective was to support the development of the local construction industry byproviding business opportunities to small local firms that may be further easilycontracted for maintenance works.
This approach also proved inefficient. Although it produced cost savings com-pared with previous full ICB, it proved too difficult to implement and was gener-ally abandoned at the end of the 1990s. Figure 5.3 illustrates the implementationpath, and shows the complexity of the scheme resulting from the multiplicity ofdelivery channels that proved impossible to synchronize.
Niger is a good example of this approach. In 1987, the government decided toabandon the unsuccessful previous ICB approach for school construction, andshift to the aforementioned combined approach.6 The PCU managed ICB pro-curement of nonlocal materials, contracted local masons for the works, and mobi-lized communities for local materials. In 1995, units costs were half that of previ-ous ICB (Oumarou 1993, World Bank 1996d).7 The approach was continuedduring the subsequent education project until 2001, but with poor results—delays,below-standard quality, resulting in early deterioration, high risk of misuse ofimported materials, inability to mobilize community participation—and wastherefore abandoned (World Bank 1994, 2002e, 2003g). The Asia region had asimilar experience. For instance, in 1980, Bangladesh combined local labor con-tracts with large materials contracts procured through ICB. After paralyzing delays,Bangladesh rapidly shifted to contracts inclusive of labor and materials (WorldBank 1980, 1990b).

Procurement and Contract Management • 63
THE BIG SHIFT: CENTRALIZED MANAGEMENT WITH PROCUREMENTBY NATIONAL COMPETITIVE BIDDING
Following years of unsatisfactory experience with centralized ICB procurement—and various attempts to keep ICB through combined approaches—it becameincreasingly apparent for African countries, that if they were to meet the infra-structure required to provide all children with quality primary education, particu-larly in rural and remote areas, other strategies were needed.
To achieve larger scale and contain costs, ways had to be found to grow small-and medium-size contractors in the country by opening up opportunities, andincreasing both available capacity and competition over time. The approach,therefore, would need to procure services more compatible with what nationalenterprises in the formal and informal sector could deliver. That meant lesssophisticated technology and smaller bid packages and procurement of construc-tion services through NCB processes. This approach became common in the
Figure 5.3 Scheme of Combining Bulk Procurement of Imported Materials withMicroenterprises: The Example of Niger (1987–2001)
suppliesimportedmaterials
cen
tral
ized
semi public andNGO sectors
private sector
dec
entr
aliz
ed
provideslocal
materials
mobilizescommunityfor supply oflocal materials
contractsworkswith microenterprise
executeswork contract
ICB supply of imported materials
Centralgovernment
(MoE)
public private
Localcommunity
Schoolcommunity
government communities
Largenational
contractor
Localgovernment
Inter-nationalsupplier
Mediumcontractor
Microcontractor
Village/neighbor-
hood
Schoolinstitution School
building
Source: Author’s figure.

64 • School Construction Strategies for Universal Primary Education in Africa
1990s. Figure 5.4 illustrates the process. The only differences between the ICB andNCB process are national rather than international publicity of the invitation tobid, and lower technical qualification requirements that would allow smallerenterprises to compete.
The switch in procurement methods from centralized ICB to centralized NCB,along with the decrease in technology sophistication, resulted in significant cost
savings. Table 5.2 shows average costs across proj-ects managed by central administrations throughICB and NCB of the 193 projects of SSA countriesreviewed in the study. First, across time, the averagecost per gross m2 of classrooms procured throughICB decreased sharply. Costs were as high asUS$1,150 per m2 in the 1970s when classroomswere generally built in modern technology by for-eign contractors. They fell to an average of US$269per m2 in the last decade, presumably because ofthe combined effect of an increased reluctance of
Figure 5.4 Centralized National Competitive Bidding
buildstheschool
cen
tral
ized
semi public andNGO sectors
private sector
dec
entr
aliz
ed
procures worksthrough NCB
Centralgovernment
(MoE)
public private
Localcommunity
Schoolcommunity
government communities
Largenational
contractor
Localgovernment
Mediumcontractor
Smallcontractor
Village/neighbor-
hood
Schoolinstitution School
building
Source: Author’s figure.
Table 5.2 Evolution of Gross Unit Costs ofClassrooms Procured through ICB and NCB
Average gross unit costs
ICB NCB DifferenceDecades (US$/m2) (US$/m2) (%)
1970s 1,150
1980s 466
1990s 333 182 45
2000s 269 189 30
Source: Averages from list of prices in Appendix 15 in2006 prices.

Procurement and Contract Management • 65
foreign firms to bid in countries where large local firms are more competitive, andof the impact of increased competition in the developing construction industry,facilitated by the shift from modern technology to the less sophisticatedclassic classroom technology. Second, since the inception of NCB procurementfor classrooms in the 1990s, average costs of classrooms procured under NCB are comparatively lower, between US$180 and US$190 per m2, representing 30 percentcost savings in the last decade, presumably because medium-size local firms aremore competitive than the large ones.
In all countries, the shift from centralized ICB to NCB procurement translatedinto cost savings of similar magnitude. For example, in 1998, when Senegal allo-cated about US$2 million of its own budget annually for school construction, theMinistry of Education’s Department of School Construction procured the build-ings through NCB and achieved a unit cost of US$8,130 per classroom (US$9,600in 2006 prices), compared with an average of US$18,000 in 1982 (US$32,500 in2006 prices) under ICB procurement (World Bank 2000d). Unit costs per m2
resulting from ICBs in the 1980s were 2.5 times these from NCBs in the 1990s incurrent prices, thus more than three times in constant prices.
As a result of this cost advantage, by the early 1990s, countries and all majordonor agencies shifted from large procurement packages and ICB processes tosmaller bidding packages and NCB. Among donors, willingness to shift from ICBto NCB has been gradual and some donors still continue to recommend ICB,although not in all countries they sup-port. Figure 5.5 illustrates that during thepast two decades for which we have datafor both procurement methods, class-rooms built through ICBs remains 70 per-cent more costly than these built throughNCBs. For comparison purposes, we willuse in the following sections the averageunit costs resulting from ICBs conductedonly during the past two decades, forwhich we also have unit costs from otherprocurement methods.
One notable exception is that theJapan International Cooperation Agency(JICA), which does not finance NCBs,continues to manage procurement inJapan and limits competition to Japanesefirms at very high cost. Japanese-fundedschools are usually in urban areasand follow project-specific technical
Figure 5.5 Cost per Gross m2 of Classroom Works Procured by Administration through ICB and NCB
600
500
400
300
200
100
0
Cost
per
m2
(200
6 U
S$)
Total
Admin ICB (to 1989)Admin ICB (from 1990) Admin NCB
Procurement agency
Source: List of projects in SSA countries in Appendix 18.
66 • School Construction Strategies for Universal Primary Education in Africa
specifications. Procurement of works is bid in Japan to Japanese contractors, which,in turn subcontract to national contractors. Works supervision is generally done byJapanese consultants. As a consequence, unit cost is generally much higher thanthose of other projects. For example, in Zambia, JICA unit costs were 4.5 times thatof ZAMSIF (Group 5 2006e). Because this arrangement is unique, JICA-financedprojects are not included in the present comparative cost-analysis.
Although far less costly, centralized NCB procurement has shown several limi-tations. The approach has failed to deliver the quantity required and long delaysare the rule rather than the exception, mainly due to weak contract managementcapacity. For example, in Senegal, NCB procured construction programs haveshown long delivery delays (Dupety 2005a, World Bank 2001h). In Madagascar,less than 5 percent of the 2,028 classrooms planned to be built by the adminis-tration in 2004 through NCB were actually built by 2006 (MENRS 2007). InRwanda, centrally managed projects using NCB have been slow in producingresults, constructing only 240 classrooms per year between 2002–05 (Pichvai2004).8
DELEGATION OF CONTRACT MANAGEMENT
Along with smaller procurement packages and multiple suppliers comes a needfor greater management capacity to effectively manage the larger contract volume.To address this issue, many countries adopted a variety of strategies, sometimessimultaneously, to draw on all available capacity in the country. These strategiesinclude delegating contract management to agencies, such as CMAs, NGOs, andsocial funds, and decentralizing contract management to local MoE offices, tolocal governments, and to communities.
DELEGATION OF CONTRACT MANAGEMENT TO AGENCIES
We use the term “agencies” to mean nonprofit organizations that are created tomanage and implement public sector programs, but that work outside the gov-ernment and have no vertical hierarchical relationship with a line ministry (Laking 2006). Agencies of this nature were developed to manage public programsfor which the government lacked capacity and efficiency, owing to cumbersomeprocurement and financial management procedures, a lack of skilled staff withinthe civil service, political interference in technical issues, corruption, or lack ofaccountability mechanisms in public service delivery. Agencies are characterizedby their independent management and flexibility in management and procurement procedures.
In western countries, such agencies date back to the 16th century in Sweden, the19th century in Germany, and more recently, the 20th century in the United

Procurement and Contract Management • 67
Kingdom and the Netherlands. A good example of such an agency in the UnitedStates is the New York Port Authority, which built the network of bridges and tun-nels that link Manhattan to New Jersey—a task that exceeded the capacity of thestate or local government to manage.
In developing countries, three types of agencies have been introduced since the1980s: CMAs, social fund agencies, and independent service authorities, the latterbeing established in fragile states where governments are ineffective in spendingrevenues to deliver services.
Contract Management Agencies
We define CMAs as agencies specifically established to manage procurement andcontracts for the construction of social infrastructure, such as public schools,health facilities, and markets. In francophone Africa, CMAs are commonly knownas Agences d’Exécution des Travaux d’Intérêt Public (AGETIP), or Executing Agenciesfor Construction in the Public Interest. The World Bank was a chief proponent ofCMAs and supported their establishment in many countries throughout Africa.
AGETIPs were established to achieve several objectives. An overriding objectivewas to demonstrate that a private sector approach to the construction of publicinfrastructure was more efficient than management by government. Thus,AGETIPs were established to test procedures for the delegation of constructionmanagement from the public to a quasi-private sector. A second objective for theestablishment of CMAs was to alleviate poverty by providing temporary employ-ment for unskilled labor. To achieve this, the operating procedures of CMAs typi-cally specify that at least 20 percent of total construction costs must be allocatedto labor. Finally, CMAs were also expected to demonstrate the feasibility of labor-intensive construction practices promoted by ILO, and increase the number andcapacity of small- and medium-size contractors throughout the country by allow-ing them to compete for small public works contracts, and by providing timelyprofessional supervision and quick payment for work completed. (Wade 2004;Diou et al. 2007.)
The first AGETIP was founded in 1989 in Senegal, followed by 19 others in16 countries. All are linked through a professional network.9 Although largelyfinanced by public funds, the agencies have nonprofit status, are managed inde-pendently of government, and have an independent board that oversees theiroperations and governance. They also use simpler and more flexible procurementand disbursement procedures than those applied in the public sector, and recruitstaff from the private sector at a competitive salary. Accountability is safeguardedthrough independent technical and financial audits. AGETIPs were established tooperate initially in urban areas and demonstrate success before expanding to serverural areas.

68 • School Construction Strategies for Universal Primary Education in Africa
In a review of agencies in Organisation for Economic Co-operation and Devel-opment (OECD) countries, Laking (2006) concludes that agencies have improvedthe credibility and efficiency of public sector performance without lowering theoverall quality of public governance. He notes, however, that the OECD experiencealso shows the difficulty of insulating agencies from the surrounding environmentand government institutions. Laking concludes that when the overall environmentand public institutions are nonperforming and when corruption and patronage arepervasive, it is unlikely that agencies will be immune to such contagions. A com-mon cycle is discernible. Initially, agencies are successful and outperform govern-ment institutions, delivering on time and at lower cost and thereby providing a rolemodel for other institutions. However, because agencies are not isolated from theenvironment, they eventually adopt behaviors similar to those found in the publicsector and vice versa.
The experience of AGETIP in Africa is quite similar. Experience suggests thatagencies have permanently changed the rules of the game for the better in thedomestic construction industry. They have broken the monopoly of large contrac-tors by opening up the market of public contracts to previously excluded small-and medium-size enterprises, which therefore proliferated, thereby increasingcompetition and lowering construction costs.10 Most people agree that AGETIPshave played a key role in the birth of the construction industry (Frigenti and Harth1998, Diou et al. 2007). They have helped countries to fill the contract manage-ment capacity gap. They have also promoted minimum standards to raise thequality of construction executed by domestic contractors. On this basis, somecountries have recently issued laws to regulate the delegation of public works toCMAs.11 Administrations, in turn, have recognized the interest of some innova-tions promoted by CMAs and often adopted them, such as the outsourcing ofwork supervision to independent architectural/engineering firms (Cape Verde).
CMAs in School Construction
The construction of schools benefited from the overall improvements in thenational construction sector in African countries. Scattered small contracts, pro-cured through NCB or the comparison of three quotations, became the norm forthe procurement of school construction, and independent supervision by privatearchitectural and engineering firms became the norm for quality assurance. Min-istries of Education in at least six countries have delegated the management of sub-stantial primary school construction programs to AGETIPs with the support ofdonors, principally the World Bank, the AfDB, the Agence de Fonds de Développe-ment, and Kreditanstalt für Wiederaufbau.12 In Mauritania, the Ministry of Educa-tion delegated the management of lower-secondary school construction in largertowns to AMEXTIPE, while it scaled up a successful community-based approach forthe construction of primary schools. Figure 5.6 illustrates the CMA approach appliedto school construction.
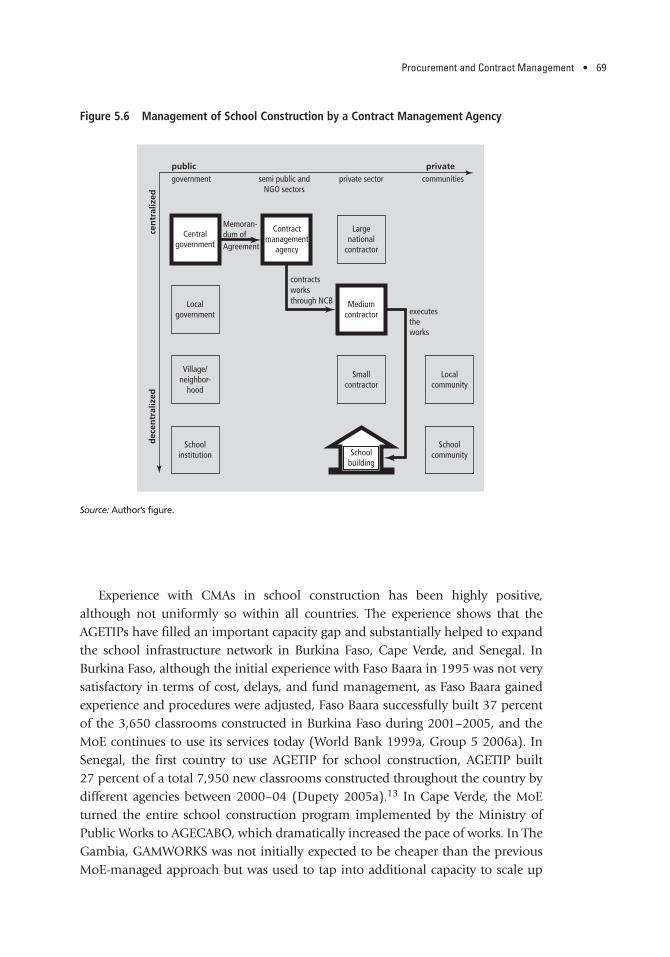
Procurement and Contract Management • 69
Experience with CMAs in school construction has been highly positive,although not uniformly so within all countries. The experience shows that theAGETIPs have filled an important capacity gap and substantially helped to expandthe school infrastructure network in Burkina Faso, Cape Verde, and Senegal. InBurkina Faso, although the initial experience with Faso Baara in 1995 was not verysatisfactory in terms of cost, delays, and fund management, as Faso Baara gainedexperience and procedures were adjusted, Faso Baara successfully built 37 percentof the 3,650 classrooms constructed in Burkina Faso during 2001–2005, and theMoE continues to use its services today (World Bank 1999a, Group 5 2006a). InSenegal, the first country to use AGETIP for school construction, AGETIP built 27 percent of a total 7,950 new classrooms constructed throughout the country bydifferent agencies between 2000–04 (Dupety 2005a).13 In Cape Verde, the MoEturned the entire school construction program implemented by the Ministry ofPublic Works to AGECABO, which dramatically increased the pace of works. In TheGambia, GAMWORKS was not initially expected to be cheaper than the previousMoE-managed approach but was used to tap into additional capacity to scale up
Figure 5.6 Management of School Construction by a Contract Management Agency
executestheworks
cen
tral
ized
semi public andNGO sectors
private sector
dec
entr
aliz
ed
Centralgovernment
public private
Localcommunity
Schoolcommunity
government communities
Largenational
contractor
Localgovernment
Mediumcontractor
Smallcontractor
Village/neighbor-
hood
Schoolinstitution School
building
Memoran-dum ofAgreement
contractsworksthrough NCB
Contractmanagement
agency
Source: Author’s figure.

70 • School Construction Strategies for Universal Primary Education in Africa
the national school construction program (World Bank 1998a). In fact, GAMWORKS built 72 percent of the thousands of classrooms built in 1999–05(World Bank 2005k).
Table 5.3 shows four examples of AGETIPs, which, at their inception, consis-tent with Laking analysis, outperformed by far the previous implementationarrangements for school construction that they replaced. In Senegal, from 1994 to1998, AGETIP built about 2,000 classrooms on behalf of the Ministry of Educa-tion and brought unit costs down by half—from between US$13,200 per class-room when procured by the MoE using NCB procedures, to $6,700 (World Bank2000d). By 2001, the cost per classroom had fallen further to US$6,400. In CapeVerde, AGECABO reduced costs by 25 percent from previous classroom construc-tion program managed by MoE through NCB (Theunynck 2005, Siri andGoovaerts 2002, World Bank 1999b).
However, AGETIPs also have their limitations. The cost advantage of AGETIPsmay not always be, or remain, competitive over time with other managementoptions within a particular country. Between 1994–1998, the Chadian AGETIPwas contracted by the MoE to build 150 classrooms under an IDA-financed proj-ect with an estimated budget of US$8,250 per classroom. It completed the workin 1996 for US$11,150 per classroom, an overrun of 35 percent, which triggeredthe discontinuation of its services midway through the project (World Bank2003b). In Mali, under the Education Sector Consolidation Project, a parallelapproach using a large NGO as an umbrella organization working with a group ofsmaller NGOs delivered classrooms at US$108/m2 lower than the US$133/m2
achieved by AGETIPE-Mali in 1989–96 (World Bank 1996b). Table 5.4 shows asample of six projects managed by AGETIPs in six counties where these agencieshave been operating for several years; in this sample, they achieve unit costs thatare higher than these achieved by the Ministry of Education through other agen-cies using NCB.
Samples in table 5.3 and 5.4 show mixed results. Figure 5.7 shows that, onaverage, classroom construction projects managed by the administration and byCMAs through the NCB procurement achieve comparable unit costs ofUS$180–190 per m2 (in 2006 prices).14 This result supports Laking’s last con-clusion: over time, CMAs and the public sector eventually adopt similar behav-iors leading to similar results. Actually, central administrations and CMAs tend toapply the same procedures, tend to target the same contractors through the samelevel of publicity for the invitation to bid and similar approaches to package theworks to be proposed for bid, and obtain the same unit costs.15 The differencebetween administrations’ and CMAs’ performances is not, indeed, in the unitcost; it is in the ability to deliver large programs and to deliver them on time, asevidenced by the experience in Senegal, The Gambia, Cape Verde, for example.
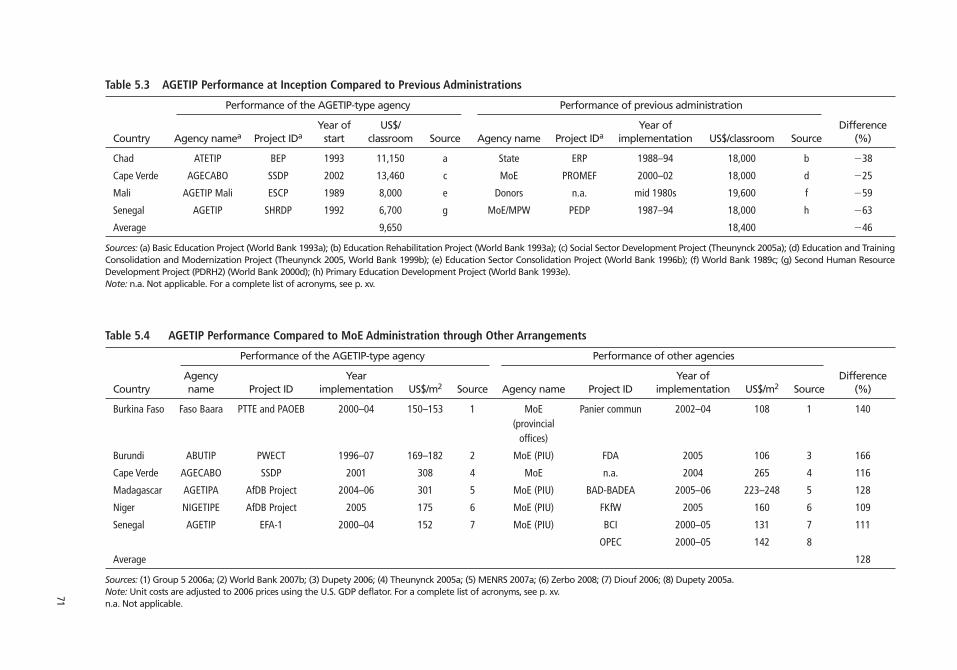
71
Table 5.3 AGETIP Performance at Inception Compared to Previous Administrations
Performance of the AGETIP-type agency Performance of previous administration
Year of US$/ Year of DifferenceCountry Agency namea Project IDa start classroom Source Agency name Project IDa implementation US$/classroom Source (%)
Chad ATETIP BEP 1993 11,150 a State ERP 1988–94 18,000 b �38
Cape Verde AGECABO SSDP 2002 13,460 c MoE PROMEF 2000–02 18,000 d �25
Mali AGETIP Mali ESCP 1989 8,000 e Donors n.a. mid 1980s 19,600 f �59
Senegal AGETIP SHRDP 1992 6,700 g MoE/MPW PEDP 1987–94 18,000 h �63
Average 9,650 18,400 �46
Sources: (a) Basic Education Project (World Bank 1993a); (b) Education Rehabilitation Project (World Bank 1993a); (c) Social Sector Development Project (Theunynck 2005a); (d) Education and TrainingConsolidation and Modernization Project (Theunynck 2005, World Bank 1999b); (e) Education Sector Consolidation Project (World Bank 1996b); (f) World Bank 1989c; (g) Second Human ResourceDevelopment Project (PDRH2) (World Bank 2000d); (h) Primary Education Development Project (World Bank 1993e). Note: n.a. Not applicable. For a complete list of acronyms, see p. xv.
Table 5.4 AGETIP Performance Compared to MoE Administration through Other Arrangements
Performance of the AGETIP-type agency Performance of other agencies
Agency Year Year of DifferenceCountry name Project ID implementation US$/m2 Source Agency name Project ID implementation US$/m2 Source (%)
Burkina Faso Faso Baara PTTE and PAOEB 2000–04 150–153 1 MoE Panier commun 2002–04 108 1 140(provincial
offices)
Burundi ABUTIP PWECT 1996–07 169–182 2 MoE (PIU) FDA 2005 106 3 166
Cape Verde AGECABO SSDP 2001 308 4 MoE n.a. 2004 265 4 116
Madagascar AGETIPA AfDB Project 2004–06 301 5 MoE (PIU) BAD-BADEA 2005–06 223–248 5 128
Niger NIGETIPE AfDB Project 2005 175 6 MoE (PIU) FKfW 2005 160 6 109
Senegal AGETIP EFA-1 2000–04 152 7 MoE (PIU) BCI 2000–05 131 7 111
OPEC 2000–05 142 8
Average 128
Sources: (1) Group 5 2006a; (2) World Bank 2007b; (3) Dupety 2006; (4) Theunynck 2005a; (5) MENRS 2007a; (6) Zerbo 2008; (7) Diouf 2006; (8) Dupety 2005a.Note: Unit costs are adjusted to 2006 prices using the U.S. GDP deflator. For a complete list of acronyms, see p. xv.n.a. Not applicable.

72 • School Construction Strategies for Universal Primary Education in Africa
Other limitations of CMAs are thefollowing:
• Many CMAs have not expanded theircapacity sufficiently to cover the ruralareas and thus continue to operatemainly in urban, or easily accessible,areas (Diou et al. 2007). Unless CMAsare able to scale up cost-effectively toaddress the needs of rural areas, it isunlikely that they will be in a positionto contribute significantly to meetingthe primary school infrastructureneeds in rural areas.
• In order to contain management costs,AGETIPs often resort to increasing bidpackages, thereby reducing the numberof contracts to manage. However,larger bid packages result in the selec-tion of contractors on the basis of theircapital and turnover, too large to beinterested in working in remote sites.
For example, in Senegal, the package proposed for bids was generally composedof 20 classrooms, whereas a bid package of this size effectively limits competi-tion to medium and large contractors and excludes the small contractor and theinformal sector. As a result, contractors tend to deliver on the schools locatednear main roads and neglect remote sites.
• AGETIPs have not been able to maintain their cost advantage over time. Thismay be because CMAs are successful role models and other institutions adoptsimilar practices, as initially intended, the need for the CMA is no longer appar-ent. In Cape Verde, for example, because of the success of AGECABO in lower-ing costs, the MoE adopted AGECABO’s procedures and achieved similarresults. The approach was later adopted by local governments as well.
• AGETIPs were set up as a solution to the lack of capacity of governments; however, they also appear as part of the perpetuation of low public governanceproblem because the countries in which they operate neglect to improve the per-formance of the administration. One of the reasons may be that the mandate tobuild governments’ capacity was given to agencies.16 In Senegal, the 2006 Pub-lic Expenditure Review notes that the mushrooming of 15 agencies following theAGETIP model has removed responsibilities of concerned ministries, which arebypassed by almost all decision-making processes (World Bank 2006b).
Figure 5.7 Cost per Gross m2 of Classroom Works Procured by Administration through ICB and NCB, andby CMAs through NCB
350
300
250
200
150
100
0
Cost
per
m2
(200
6 U
S$)
Total
50
CMAAdmin ICB (from 1990) Admin NCB
Procurement agency
Source: List of projects in SSA countries in Appendix 18.Note: Unit costs are adjusted to 2006 prices.

Procurement and Contract Management • 73
The use of CMAs, such as AGETIPs, is a proven sound approach to move expedi-tiously on urgent programs with minimum of fiduciary risks. In postconflict situ-ations, alternative service delivery, including CMAs, social funds, Community-Driven Development projects, and NGOs, has been used successfully to rapidlyimplement large physical reconstruction programs that generally include a largeshare of school facilities (IEG 2006). To speed up rapid responses to crises andemergencies, the World Bank has defined specific rules to facilitate the use of pro-curement and project management agents, such as CMAs.17
DELEGATION TO NGOs
The World Bank defines NGOs as “private organizations that pursue activitiesto relieve suffering, promote the interest of the poor, protect the environment, provide basic social services, or undertake community development” (World Bank1989b). NGOs vary widely in their size and activities, ranging from large-scale,northern-based charities, such as CARE or Plan International with a broad range ofactivities, to small, single- purpose, community-based organizations. Some focuson advocacy; others are operationally involved in implementing development programs. Operational NGOs can be classified in three main categories: Community-based organizations (CBOs), which are local groups of people who self-organize toachieve a specific development objective, such as a parent-teacher association;national NGOs, which are country-based service providers; and international NGOs,which are headquartered in developed countries. The OECD estimates the numberof international development NGOs at about 4,000, working with 10,000 to20,000 national NGOs and CBOs in developing countries (Hume 2004).
NGOs have been increasingly instrumental in delivering development assis-tance. On one hand, NGOs contribute resources that that they themselves raise,providing valuable incremental resources to bilateral and multilateral aid.Between 2001–2005, net grants by NGOs flowing to developing countriesincreased from US$4.7 billion to US$7.3 billion, representing an average of 5.7 percent of total net flows of Official Development Assistance from DAC coun-tries over the period (OECD 2007). On the other hand, NGOs have also played anincreasing role over time in channeling bilateral and multilateral project aid torecipient countries, particularly in weak or failed states. In the World Bank, forexample, between 1973–1988, only 6 percent of World Bank–financed projectsinvolved implementation by NGOs. This percentage grew to 28 percent by 200118
(World Bank 2002g).NGOs have been engaged in school construction for many years, whether
using private funds that they have raised, or using donor or government fundsthrough management delegation. A large number of NGOs use school construc-tion as an entry point to achieve more general community development objectives
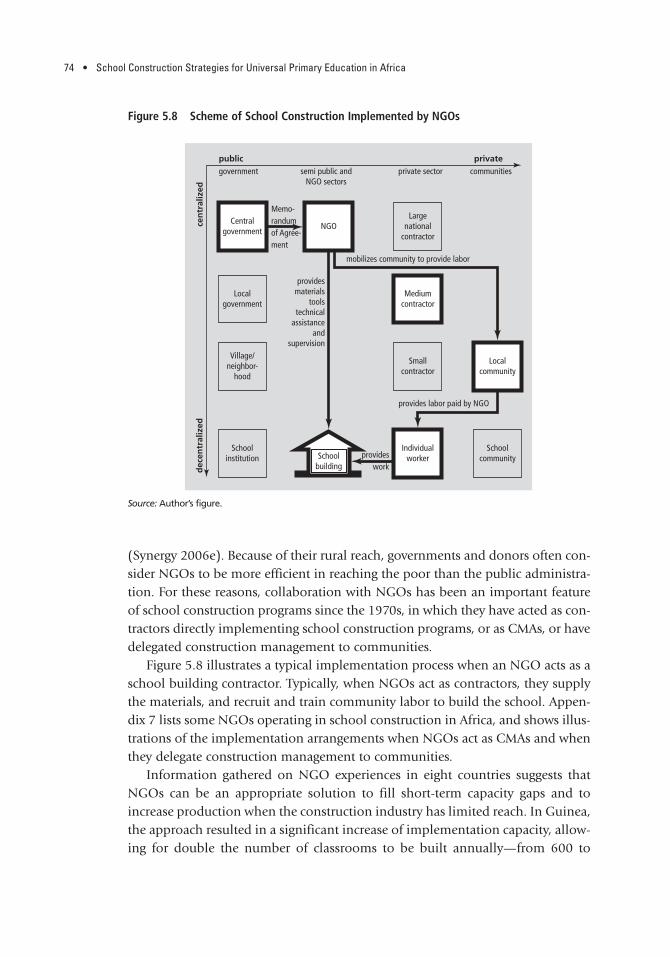
(Synergy 2006e). Because of their rural reach, governments and donors often con-sider NGOs to be more efficient in reaching the poor than the public administra-tion. For these reasons, collaboration with NGOs has been an important featureof school construction programs since the 1970s, in which they have acted as con-tractors directly implementing school construction programs, or as CMAs, or havedelegated construction management to communities.
Figure 5.8 illustrates a typical implementation process when an NGO acts as aschool building contractor. Typically, when NGOs act as contractors, they supplythe materials, and recruit and train community labor to build the school. Appen-dix 7 lists some NGOs operating in school construction in Africa, and shows illus-trations of the implementation arrangements when NGOs act as CMAs and whenthey delegate construction management to communities.
Information gathered on NGO experiences in eight countries suggests thatNGOs can be an appropriate solution to fill short-term capacity gaps and toincrease production when the construction industry has limited reach. In Guinea,the approach resulted in a significant increase of implementation capacity, allow-ing for double the number of classrooms to be built annually—from 600 to
74 • School Construction Strategies for Universal Primary Education in Africa
Figure 5.8 Scheme of School Construction Implemented by NGOs
cen
tral
ized
semi public andNGO sectors
private sector
dec
entr
aliz
ed
Centralgovernment
public private
Localcommunity
Schoolcommunity
government communities
Largenational
contractor
Localgovernment
Mediumcontractor
Smallcontractor
Individualworkerprovides
work
Village/neighbor-
hood
Schoolinstitution School
building
Memo-randumof Agree-ment
NGO
mobilizes community to provide labor
providesmaterials
toolstechnical
assistanceand
supervision
provides labor paid by NGO
Source: Author’s figure.
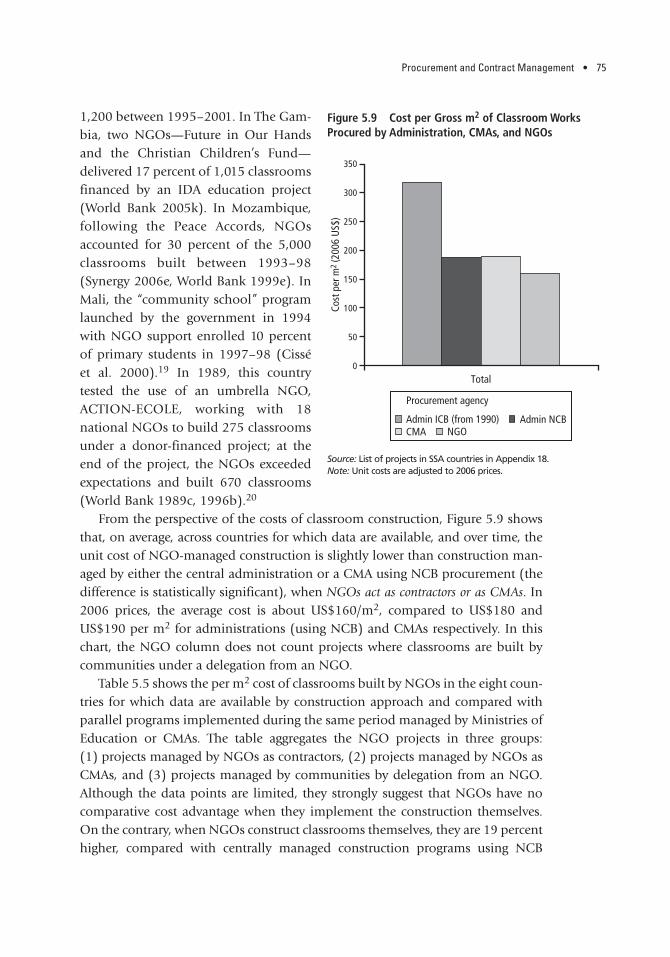
Procurement and Contract Management • 75
1,200 between 1995–2001. In The Gam-bia, two NGOs—Future in Our Handsand the Christian Children’s Fund—delivered 17 percent of 1,015 classroomsfinanced by an IDA education project(World Bank 2005k). In Mozambique,following the Peace Accords, NGOsaccounted for 30 percent of the 5,000classrooms built between 1993–98(Synergy 2006e, World Bank 1999e). InMali, the “community school” programlaunched by the government in 1994with NGO support enrolled 10 percentof primary students in 1997–98 (Cisséet al. 2000).19 In 1989, this countrytested the use of an umbrella NGO,ACTION-ECOLE, working with 18national NGOs to build 275 classroomsunder a donor-financed project; at theend of the project, the NGOs exceededexpectations and built 670 classrooms(World Bank 1989c, 1996b).20
From the perspective of the costs of classroom construction, Figure 5.9 showsthat, on average, across countries for which data are available, and over time, theunit cost of NGO-managed construction is slightly lower than construction man-aged by either the central administration or a CMA using NCB procurement (thedifference is statistically significant), when NGOs act as contractors or as CMAs. In2006 prices, the average cost is about US$160/m2, compared to US$180 andUS$190 per m2 for administrations (using NCB) and CMAs respectively. In thischart, the NGO column does not count projects where classrooms are built bycommunities under a delegation from an NGO.
Table 5.5 shows the per m2 cost of classrooms built by NGOs in the eight coun-tries for which data are available by construction approach and compared withparallel programs implemented during the same period managed by Ministries ofEducation or CMAs. The table aggregates the NGO projects in three groups: (1) projects managed by NGOs as contractors, (2) projects managed by NGOs asCMAs, and (3) projects managed by communities by delegation from an NGO.Although the data points are limited, they strongly suggest that NGOs have nocomparative cost advantage when they implement the construction themselves.On the contrary, when NGOs construct classrooms themselves, they are 19 percenthigher, compared with centrally managed construction programs using NCB
Figure 5.9 Cost per Gross m2 of Classroom Works Procured by Administration, CMAs, and NGOs
350
300
250
200
150
100
0
Cost
per
m2
(200
6 U
S$)
Total
50
Admin ICB (from 1990) Admin NCBCMA NGO
Procurement agency
Source: List of projects in SSA countries in Appendix 18.Note: Unit costs are adjusted to 2006 prices.
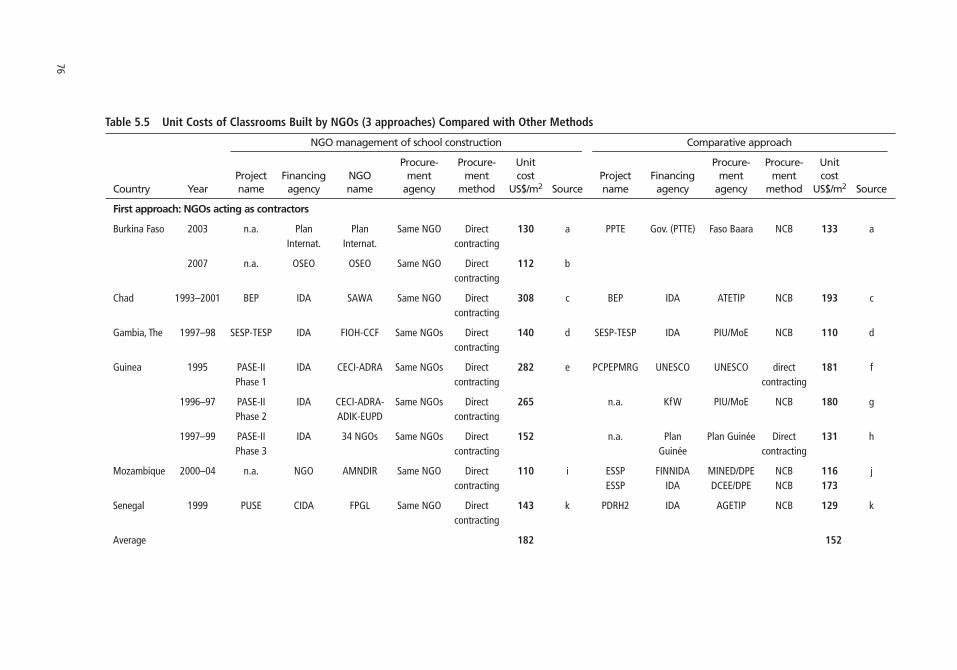
76
Table 5.5 Unit Costs of Classrooms Built by NGOs (3 approaches) Compared with Other Methods
NGO management of school construction Comparative approach
Procure- Procure- Unit Procure- Procure- Unit Project Financing NGO ment ment cost Project Financing ment ment cost
Country Year name agency name agency method US$/m2 Source name agency agency method US$/m2 Source
First approach: NGOs acting as contractors
Burkina Faso 2003 n.a. Plan Plan Same NGO Direct 130 a PPTE Gov. (PTTE) Faso Baara NCB 133 aInternat. Internat. contracting
2007 n.a. OSEO OSEO Same NGO Direct 112 bcontracting
Chad 1993–2001 BEP IDA SAWA Same NGO Direct 308 c BEP IDA ATETIP NCB 193 ccontracting
Gambia, The 1997–98 SESP-TESP IDA FIOH-CCF Same NGOs Direct 140 d SESP-TESP IDA PIU/MoE NCB 110 dcontracting
Guinea 1995 PASE-II IDA CECI-ADRA Same NGOs Direct 282 e PCPEPMRG UNESCO UNESCO direct 181 fPhase 1 contracting contracting
1996–97 PASE-II IDA CECI-ADRA- Same NGOs Direct 265 n.a. KfW PIU/MoE NCB 180 gPhase 2 ADIK-EUPD contracting
1997–99 PASE-II IDA 34 NGOs Same NGOs Direct 152 n.a. Plan Plan Guinée Direct 131 hPhase 3 contracting Guinée contracting
Mozambique 2000–04 n.a. NGO AMNDIR Same NGO Direct 110 i ESSP FINNIDA MINED/DPE NCB 116 jcontracting ESSP IDA DCEE/DPE NCB 173
Senegal 1999 PUSE CIDA FPGL Same NGO Direct 143 k PDRH2 IDA AGETIP NCB 129 kcontracting
Average 182 152

77
NGOs acting as contract management agencies
Mali 1990–95 ESCP IDA Large 18 small Direct 151 l ESCP Gov. AGETIPE- NCB 186 lUmbrella NGOs contracting Mali
NGO
Guinea 2000–04 EFA-I IDA 10 NGOs 250 small LCB or 116 m VCCP IDA Local NCB 215 oPhase 1 as CMAs NGOs 3-Q Governments
(VCSP)
2004–07 Phase 2 IDA 5 NGOs 5 NGOs NCB 125 nEFA-1 (CMA) (CMA)
Average 179 201
NGOs delegating to communities
Ghana 1998–2004 QUIPS USAID ILP Community Direct 68 p BESIP- IDA-AfDB MoE (FPMU) NCB 118 qcontracting PERP
Burkina Faso 2007 Prog Burk Action Aid Action Aid Community LCB 89 r PAOEB France Faso Baara NCB 150 s(FDA)
Average 79 134
Sources: (a) Group 5 2006a; (b) OSEO 2007; (c) Basic Education Project (Lecysyn 1997, World Bank 2003b); (d) Second and Third Education Sector Program (Synergy 1997), (e) Equity and School Improve-ment Project (Theunynck 2000); (f) Projet de construction de prototypes d’écoles primaires en milieu rural en Guinée (De Bosch, Kemper et al. 1990); (g) Lipsmeier 2000, World Bank 2001c Annex 13;(h) Plan Guinée 2001; (i) Education Sector Support Program–PASE (Group 5 2006c); (j) ESSP Education Sector Support Program (Group 5 2006c); (k) PUSE: Education Sector Support Emergency Program,FPGL Fondation Paul Gerin Lajoie (F2 Consultants 1999); (l) Education Sector Consolidation Project (World Bank 1989c, 1996b); (m) Dupety 2004 and 2005b; (n) cost information from Aide et Action2007; (o) VSCP 2007; (p) Quality and Improvement in Primary Schools (Group 5 2006b); (q) Education Sector Investment Plan, Group 5 2006b; (r) Aide et Action 2007; (s) Group 5 2006a.Note: Unit costs are adjusted to 2006 prices. For a complete list of acronyms, see p. xv.n.a. Not applicable.

78 • School Construction Strategies for Universal Primary Education in Africa
procurement. On the other hand, examples in Guinea and Mali show that, whenNGOs act as CMAs, they can achieve significantly lower costs than AGETIP CMAs.The most cost-effective of the three approaches is when NGOs delegate construc-tion management to communities. In Ghana, community implementation ofschool construction set up in 1998–2004 by an NGO resulted in a 48 percentlower unit cost per m2 compared with centrally managed construction using NCBto employ contractors. In Burkina Faso, when communities are empowered by theNGO program, they build classrooms at 38 percent less than the CMA Faso Baara.
However, experience suggests that heavy and exclusive reliance on NGOs isnot a long-term solution to the problem of scaling up for several reasons. NGOshave limited capacity, are generally not specialized in construction management,and their support is often geographically circumscribed. Most important, depend-ing on the scope, the strategy may be counterproductive to the development ofthe local construction industry. For example, the scheme in Guinea frustratedmany local contractors who were excluded from this market. They responded bycreating storefront NGOs to access the contracts (refer to box 5.1 for the experi-ence of Guinea). For all these reasons, NGOs can be a good short-term solutionto address capacity gaps, but cannot be relied upon as a long-term solution tothe problem of weak domestic construction capacity.
BOX 5.1 CONTRACTING TO NGOs—THE CASE OF GUINEA
In 1990, only 28 percent of children were enrolled in primary school; management capacity of the government was low; and the local constructionsector had almost no small- and medium-size construction contractors. Tomobilize all existing capacity and increase community participation in theconstruction process, the Ministry of Education fully delegated the manage-ment and execution of its school construction program to NGOs under aWorld Bank–financed project.
In a first stage, two NGOs (CECI, ADRA) were invited through solesource contracts in 1995 to build 15 classrooms. Although the NGOs deliv-ered the classrooms, the unit cost of construction at US$228/m2, includingthe cost of community participation, was high partly due to limited com-petition and partly to high NGO management fees of 18 percent. In a sec-ond stage, four NGOs (CECI, ADRA, ADIK, and EUPD) built 36 class-rooms at a similar average cost of US$218/m2. In a third phase, carried outin 1997–98, 34 NGOs were invited to build 570 classrooms at an estab-lished rate of US$127/m2, including the cost of community participation

Procurement and Contract Management • 79
(estimated at 12 percent of construction costs) and NGO contract manage-ment fees, which were capped at 10 percent of construction costs.
The program was a success. As a result, in 2000, the MoE delegated con-struction management of its entire school construction program to NGOs.A first layer of 10 large NGOs, mostly international with strong financialand technical capacity, were recruited to play the role of CMAs on behalf ofthe MoE. The 10 NGOs contracted the services of 250 smaller local NGOs,which competed for individual contracts of two to three classrooms. In2002–04, almost 700 classrooms were delivered on time using thisapproach, and unit costs fell to an average of US$106 per m2 owing toincreased competition. The costs were significantly lower than the US$158per m2 achieved by programs centrally managed by the MoE using NCBprocedures.
The program resulted in a significant increase in implementation capac-ity, which allowed for double the number of classrooms to be built annu-ally from 600 to 1,200. Several problems arose, however. First, NGOs hadlimited experience as CMAs and the quality of construction was uneven.Second, the approach presented the potential for conflicts of interestbecause NGOs acting as CMAs managed contracts with NGOs with whomthey had partnerships in other activities. Third, the arrangement createdperverse incentives for small local contractors, who became increasinglyfrustrated as they watched the escalating role of NGOs in the school con-struction business from which they were excluded. As a result, they estab-lished storefront NGOs to access the contracts.
To address these issues, in 2004 the MoE changed the approach byreducing the number of NGOs acting as CMAs to five with proven capacity,and gave them the authority to recruit small- and medium-size contractorsthrough NCB. This translated into a small increase in cost to US$118 perm2 in 2007, but was still much lower than previous MoE-managed pro-grams and lower than a Village Community Support Project implementedby local governments during the same period, which built 46 schools forthe MoE at a cost of US$215 per m2.
Although NGOs continue to play an important role in school construc-tion in Guinea, the government is considering a recentralization of man-agement to the MoE.
Sources: World Bank 1989c, 1998a; Synergy 1997; Ernst & Young 2001.
DELEGATION TO SOCIAL FUND AGENCIES
Increasingly, the provision of primary schools is carried out by actors other thanMinistries of Education, through multisector projects, such as Social Funds. In2005, for example, the World Bank financed 66 noneducation projects with edu-cation components, totaling almost 32 percent of total Bank lending to education,and a 75 percent increase over 2004.21 Education components in multisector proj-ects are especially prominent in the Africa region, where 41 percent of the projectsand 30 percent of all IDA financing is channeled through multisector projects inthe Social Protection Sector, and another 6 percent of operations and 20 percentof funding passes through multisector Poverty Reduction Support Credits (WorldBank 2004d, 2005j).
Social Funds were initially developed in the 1980s to mitigate the effects of thestructural adjustment and alleviate poverty, mainly by financing small-scale socialinfrastructure in rural areas to improve services and create employment. They werealso seen to be an effective way to provide basic services in short-term or emer-gency situations, such as in postconflict countries or in weak or failed states wheregovernance and private sector development are lacking. Social Funds offer manyflexible features to work effectively in this environment and contribute to governance/empowerment structures at a local level, as basic building blocks fordevelopment.
Similar to AGETIPs, Social Funds have nonprofit status, management inde-pendent of government, and an elected board of directors that oversees operationsand governance. The World Bank was a main promoter of Social Funds. The firstSocial Fund in Africa was created in 1989 in Guinea. By 2001, World Bank fund-ing had scaled up rapidly to 98 projects in 58 countries totaling US$3.5 billion,and by 2007 Social Funds had been established in 21 countries (Van Domelen andEl-Rashidi 2001).22
Social Funds differ from CMAs in several aspects. First, all social funds use a bot-tom-up, demand-driven, approach (Jack 200l). In contrast, CMAs are generally con-tracted by Ministries of Education or donors to deliver construction programs basedon top-down planning. Second, Social Funds do not have the promotion of small-and medium-size enterprises (SMEs) as an explicit objective (Frigenti and Harth1998). In practice, however, they have contributed to opening up the constructionmarket to SMEs, and in particular, they have opened it up to microenterprises,which constitute the reservoir of the future local construction industry. Third, SocialFunds have introduced targeting mechanisms to ensure that resources reach thepoorest. Finally, Social Funds have a well-developed administrative structure thatenables them to build schools, health centers, and water systems efficiently in poorand remote communities. They have typically outperformed the line ministries andCMAs in achieving these goals (World Bank 1998c).
80 • School Construction Strategies for Universal Primary Education in Africa

Procurement and Contract Management • 81
Similar to the involvement of NGOs in school construction, Social Fund Agen-cies have taken several forms. In some cases, Social Fund Agencies operate asCMAs, procuring construction services from SMEs on behalf of communitiesthrough competitive bidding. This approach is illustrated in figure 5.10 andhas been used by Social Funds in Angola (FAS), Ethiopia, Eritrea, Burundi (Twitezimbere), and Madagascar (FID). We refer to this approach as demand-driven financing coupled with centrally managed implementation.
In other countries, Social Funds channel resources directly to communitiesempowered through a contractual financing agreement to be the implementingagencies, and manage the construction process as shown in figure 5.11. In thisapproach, communities have full responsibility to procure and pay labor, works,and materials on the basis of simplified procedures for community participation.This approach has been used in Social Funds in Benin (Agence de Financementdes Initiatives de Base or AGeFIB), Malawi (MASAF), Madagascar (FID) Senegal(Agence de Fonds de Développement Social or AFDS), Uganda (Northern UgandaSocial Action Fund or NUSAF), and Zambia (Zambia Social Investment Fund or
Figure 5.10 Social Fund Operating as a Contract Management Agency for Communities
cen
tral
ized
semi public andNGO sectors
private sector
dec
entr
aliz
ed
Centralgovernment
public private
Localcommunity
Schoolcommunity
government communities
Largenational
contractor
Localgovernment
Mediumcontractor
Smallcontractor
executesthe works
contributesto the works
expressesneeds
Village/neighbor-
hood
Schoolinstitution School
building
Memo-randum of
AgreementSocialFund
contractsworks
throughNCB or
3-quotations
Source: Author’s figure.

ZAMSIF). We refer to this approach as demand-driven financing with community-managed implementation. In yet other situations, communities hire labor while theSocial Fund pays the invoices as done in Angola.
Experience shows that Social Funds have met an important gap in educationinfrastructure. Across many countries, communities have used Social Funds tofinance school construction more than any other social infrastructure.23 In Peru,between 1992 and 1998, communities used 25 percent of the FONCODES’ fundsto build 9,000 classrooms with a substantial impact on school attendance andcompletion (Paxson and Schady 1999). In Eritrea, 29 percent of the funds weredisbursed to rebuild education facilities destroyed during the conflict (World Bank2002b). In Nigeria, schools account for 30 percent of community projectsfinanced by the Social Fund, just behind water supply and far ahead of healthfacilities and roads (World Bank 2001g). In Zambia, primary schools representedmore than 70 percent of Social Fund projects in the 1990s, and 16 percent of theschool stock was rehabilitated (Group 5 2006e, World Bank 2000). In Benin, 73 percent of projects financed by the Social Fund were invested in the construction
82 • School Construction Strategies for Universal Primary Education in Africa
Figure 5.11 Social Funds Operating as a Financer of Communities to Implement Their Project
cen
tral
ized
semi public andNGO sectors
private sector
dec
entr
aliz
ed
Centralgovernment
public private
Localcommunity
Schoolcommunity
government communities
Largenational
contractor
Localgovernment
Mediumcontractor
Smallcontractor
contractsworks
executesthe works
contributesto the works
expressesneeds
Village/neighbor-
hood
Schoolinstitution School
building
Memo-randum
of Agree-ment
SocialFund
signsfinancing
agreementwith
communityand finances
community
Source: Author’s figure.

Procurement and Contract Management • 83
of primary schools, which accounted for more than half of the classrooms built inthe country during the period; and in the fourth Community Development Program (FID-IV) in Madagascar, more than 62 percent of community subprojectsfinanced by the FID during 2000–2006 were for school construction (World Bank2004c, Olivier 2004).
Ex-postevaluations of Social Funds indicate that they have been highly effectivein delivering small-scale infrastructure with more than proportional benefits tothe poorest. And they have produced visible results quickly. The evidence showsthat Social Fund investments improved not only classroom availability but also theprovision of furniture, water, and sanitation in the areas where they operate. Fur-ther, classrooms financed by Social Funds were generally higher-quality buildingscompared with schools that had not received a social fund investment. Primaryenrollment rates in the communities increased as a result, with a significantimpact on age-for-grade (Rawings et al 2001, OED 2002).
Social Funds are also very efficient. In 2001, a review of 17 Social Funds con-cluded that the efficiency of Social Funds is typically superior to other deliverymechanism measured by the share of overhead and the unit cost of investment(Van Domelen 2001). One reason for this efficiency is the special status providedby the government to Social Fund agencies to manage public funds for basic infra-structure investment. Like the AGETIPs, Social Fund agencies are exempt frompublic procurement, financial management, and civil service rules, which allowsfor greater flexibility. A second explanation for this higher level of efficiency is thegreater degree of accountability of Social Fund agencies to the beneficiaries whoare highly involved at all stages of subproject preparation and implementation.Even when communities are not empowered to manage the works, they are at leastempowered to monitor the works carried out by the contractor.
When we analyze the experience of Social Funds in school construction, com-pared with other delivery mechanisms, such as central governments, CMAs, andNGOs, we find, however, that the cost advantage applies only when the SocialFund supports community implementation.24 When Social Funds use centrallymanaged implementation, that is, when they act as CMAs on behalf of commu-nities, they generally do not achieve better cost results compared with other cen-tralized agencies. Figure 5.12 shows that across countries and periods, when SocialFunds apply the approach above referred as demand-driven financing coupled withcentrally managed implementation—that is, similar to CMAs—they achieve unit costsof about US$/m2 170, close to those achieved by other agencies using the sameprocurement methods.
Table 5.6 shows the costs of classroom construction by this type of Social Fundin Angola, Burundi, Eritrea, and Ethiopia, which act as CMAs, and compares themwith cost of classrooms built by other agencies. On average, there is no significant
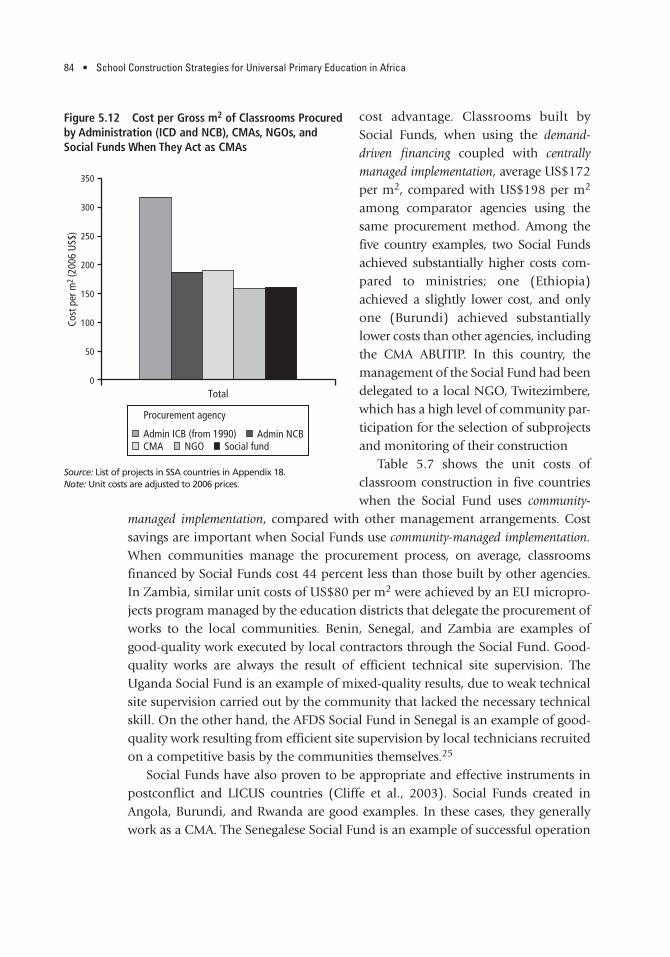
cost advantage. Classrooms built bySocial Funds, when using the demand-driven financing coupled with centrallymanaged implementation, average US$172per m2, compared with US$198 per m2
among comparator agencies using thesame procurement method. Among thefive country examples, two Social Fundsachieved substantially higher costs com-pared to ministries; one (Ethiopia)achieved a slightly lower cost, and onlyone (Burundi) achieved substantiallylower costs than other agencies, includingthe CMA ABUTIP. In this country, themanagement of the Social Fund had beendelegated to a local NGO, Twitezimbere,which has a high level of community par-ticipation for the selection of subprojectsand monitoring of their construction
Table 5.7 shows the unit costs ofclassroom construction in five countrieswhen the Social Fund uses community-
managed implementation, compared with other management arrangements. Costsavings are important when Social Funds use community-managed implementation.When communities manage the procurement process, on average, classroomsfinanced by Social Funds cost 44 percent less than those built by other agencies.In Zambia, similar unit costs of US$80 per m2 were achieved by an EU micropro-jects program managed by the education districts that delegate the procurement ofworks to the local communities. Benin, Senegal, and Zambia are examples ofgood-quality work executed by local contractors through the Social Fund. Good-quality works are always the result of efficient technical site supervision. TheUganda Social Fund is an example of mixed-quality results, due to weak technicalsite supervision carried out by the community that lacked the necessary technicalskill. On the other hand, the AFDS Social Fund in Senegal is an example of good-quality work resulting from efficient site supervision by local technicians recruitedon a competitive basis by the communities themselves.25
Social Funds have also proven to be appropriate and effective instruments inpostconflict and LICUS countries (Cliffe et al., 2003). Social Funds created inAngola, Burundi, and Rwanda are good examples. In these cases, they generallywork as a CMA. The Senegalese Social Fund is an example of successful operation
84 • School Construction Strategies for Universal Primary Education in Africa
Figure 5.12 Cost per Gross m2 of Classrooms Procuredby Administration (ICD and NCB), CMAs, NGOs, andSocial Funds When They Act as CMAs
350
300
250
200
150
100
0
Cost
per
m2
(200
6 U
S$)
Admin ICB (from 1990) Admin NCBCMA NGO Social fund
Procurement agency
Total
50
Source: List of projects in SSA countries in Appendix 18.Note: Unit costs are adjusted to 2006 prices.

85
Table 5.6 Cost of Classrooms Built by Social Funds Operating as Contract Management Agencies, Compared to Other Agencies
Social fund acting as CMA Comparative project
Financing Procurement Procurement Unit cost Project Financing Procurement Procurement Unit costCountry Year Social fund agency agency method US$/m2 Source name agency agency method US$/m2 Source
Angola 2000–04 FAS-II IDA FAS-II Materials: ICB 319 a n.a. Donors MPW NCB 296 aWorks: NCB
Burundi 1999–06 Twitezimbere IDA Twitezimbere NCB 115 b n.a. IDA ABUTIP NCB 169 b
Belgium Belg-Bur Fund NCB 174
Eritrea 1996–01 ECDF Belgium, Dutch, ECDF NCB 199 c n.a. n.a. MoE NCB 191 cItalian IDA
Ethiopia 1996–04 ESDRF IDA ESDRF NCB 141 d n.a. n.a. Non-ESDF NCB 147 d
Average 194 195
Sources: (a) Second Social Fund Project FAS-II (World Bank 2000a, 2004a); (b) Second Social Action Project (World Bank 2007); (c) World Bank 1996g, 2002a, 2002b; (d) Ethiopian Social Rehabilitationand Development Fund (World Bank 2005i).Note: Unit costs are adjusted to 2006 prices using the U.S. GDP deflator. For a complete list of acronyms, see p. xv.

86
Table 5.7 Cost of Classrooms Built by Social Funds with Community Implementation, Compared to Other Agencies
Social fund Comparative approach
Financing Procurement Procurement Unit cost Project Financing Procurement Procurement Unit costCountry Year Social fund agency agency method US$/m2 Source name agency agency method US$/m2 Source
Benin 200–01 AGeFIB IDA Community LCB 81 a AGDS Donors CMA, admin. NCB 126 b
Malawi 1998–06 MASAF IDA Community 3Q 66 c n.a. DANIDA MoE/PCU NCB 157 c
Mali 1999–04 GRIP IDA Community LCB 120 d ESCP IDA AGETIP NCB 186 e
Senegal 2000–05 AFDS IDA Community LCB 110 f NRIP IDA Local gov. LCB 140 fEFA-1 PTTE MoE NCB 141 fEFA-1 IDA AGETIP NCB 152 f
Urb. Proj. IDA LG/MCA NCB 149 g
Uganda 2000–07 NUSAF IDA Community LCB 83 h LGDP-2 IDA Local gov. NCB 90 i
Zambia 2000 ZAMSIF IDA Community Labor: dir. 125 j MoE IDA MoE NCB 150 k2005 Materials: shop 80 k MoE Gov-HPIC MoE NCB 125
Average 95 142
Sources: (a) AGeFIB 2001, p. 48; (b) Agence de Gestion de la Dimension Sociale du Développement, et Programme d’Investissement Public (AGeFIB 2001, p. 48); (c) EMC Jatula Associates 2003; (d) Grass-Roots Initiative Project; (e) Education Sector Consolidation Project (World Bank 1996b); (f) Diouf 2006; (g) Dupety 2005a; (h) NUSAF 2007; (i) Theunynck 2007; (j) Rawlings et al., 2001, Group 5 2000a;(k) Group 5 2006e, pp. 19–20.Note: Unit costs are adjusted to 2006 prices using the U.S. GDP deflator. For a complete list of acronyms, see p. xv.n.a. Not applicable.
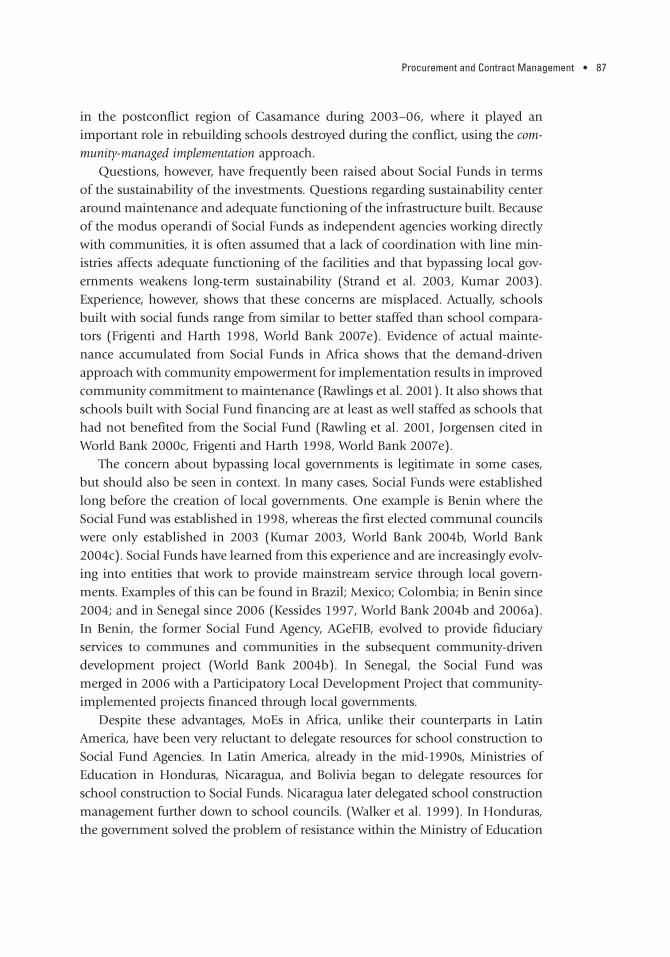
Procurement and Contract Management • 87
in the postconflict region of Casamance during 2003–06, where it played animportant role in rebuilding schools destroyed during the conflict, using the com-munity-managed implementation approach.
Questions, however, have frequently been raised about Social Funds in termsof the sustainability of the investments. Questions regarding sustainability centeraround maintenance and adequate functioning of the infrastructure built. Becauseof the modus operandi of Social Funds as independent agencies working directlywith communities, it is often assumed that a lack of coordination with line min-istries affects adequate functioning of the facilities and that bypassing local gov-ernments weakens long-term sustainability (Strand et al. 2003, Kumar 2003).Experience, however, shows that these concerns are misplaced. Actually, schoolsbuilt with social funds range from similar to better staffed than school compara-tors (Frigenti and Harth 1998, World Bank 2007e). Evidence of actual mainte-nance accumulated from Social Funds in Africa shows that the demand-drivenapproach with community empowerment for implementation results in improvedcommunity commitment to maintenance (Rawlings et al. 2001). It also shows thatschools built with Social Fund financing are at least as well staffed as schools thathad not benefited from the Social Fund (Rawling et al. 2001, Jorgensen cited inWorld Bank 2000c, Frigenti and Harth 1998, World Bank 2007e).
The concern about bypassing local governments is legitimate in some cases,but should also be seen in context. In many cases, Social Funds were establishedlong before the creation of local governments. One example is Benin where theSocial Fund was established in 1998, whereas the first elected communal councilswere only established in 2003 (Kumar 2003, World Bank 2004b, World Bank2004c). Social Funds have learned from this experience and are increasingly evolv-ing into entities that work to provide mainstream service through local govern-ments. Examples of this can be found in Brazil; Mexico; Colombia; in Benin since2004; and in Senegal since 2006 (Kessides 1997, World Bank 2004b and 2006a).In Benin, the former Social Fund Agency, AGeFIB, evolved to provide fiduciaryservices to communes and communities in the subsequent community-drivendevelopment project (World Bank 2004b). In Senegal, the Social Fund wasmerged in 2006 with a Participatory Local Development Project that community-implemented projects financed through local governments.
Despite these advantages, MoEs in Africa, unlike their counterparts in LatinAmerica, have been very reluctant to delegate resources for school construction toSocial Fund Agencies. In Latin America, already in the mid-1990s, Ministries ofEducation in Honduras, Nicaragua, and Bolivia began to delegate resources forschool construction to Social Funds. Nicaragua later delegated school constructionmanagement further down to school councils. (Walker et al. 1999). In Honduras,the government solved the problem of resistance within the Ministry of Education

to delegating to the Social Fund in 1996 by closing the School Construction Divi-sion in the Ministry of Education and absorbing its activities into the Social Fund.
DECENTRALIZATION OF CONTRACT MANAGEMENT
Decentralization is one of the most important institutional shifts in African coun-tries in recent years. Litvack et al. (1998) identify three types of decentralization—deconcentration, delegation, and devolution. Deconcentration occurs when centralgovernment allocates its responsibilities to its local-level branch offices, such aswhen the local level offices of the Ministry of Education manage school buildingprograms on behalf of the central government. Delegation occurs when central gov-ernment transfers responsibility for decision making and administration of pub-lic functions to local governments that may have some independence but are ulti-mately accountable to the central government. Devolution occurs when the centralgovernment transfers authority for decision making, finance, and management toquasi-autonomous local governments. Generally, these are municipalities thatelect their own mayors and councils, raise their own revenues, and have inde-pendent authority to make decisions.
In this section, we review the experience of deconcentration of school construc-tion management to local branch offices of the MoE on one hand, and decentral-ization to local government on the other, whether the local authorities fall underthe definition of delegation or devolution.
DECONCENTRATION TO LOCAL MoE BRANCH OFFICES
In most countries, MoEs have established local offices to improve planning andprovide better services. In the area of school construction, MoEs also considereddelegation to local branch offices as a way to increase the construction volume byexpanding capacity to manage many smaller contracts. This scheme is illustratedin figure 5.12.
Mozambique, Madagascar, Burkina Faso, Ethiopia, and Guinea have tested thisapproach. Mozambique tested the approach by delegating the management ofone-third of the school program financed by IDA in 2000–2004 to the provincialbranch offices while continuing to centrally manage the two other thirds, eitherthrough NCB or ICB. In Madagascar, the Ministry of Education delegated theresponsibility for the procurement of works to the education district branch officesto implement an IDA-funded project (CRESED II) and OPEC-funded projects.More recently, starting the Ten Year Plan for Basic Education (2002–10), BurkinaFaso delegated the management of its nation-wide multidonor funded program tothe provincial branch offices.
88 • School Construction Strategies for Universal Primary Education in Africa

Procurement and Contract Management • 89
Figure 5.14 shows that unit cost of classrooms procured by local branches ofMinistries of Education are, on average US$175 per m2; that is, slightly higher thanunits costs achieved by NGOs and Social Funds, and slightly lower than theseobtained by central administrations and CMAs using NCB.
Table 5.8 shows the current unit costs of local branches of MoEs in three countries, compared with programs centrally managed by the MoE or CMA usingNCB procurement in the same countries. In this sample, classrooms built bydeconcentrated offices of MoEs are less expensive than those built by the centraloffice of the MoE, CMA, or other comparable agencies, respectively by 24, 27, and9 percent.
Despite the overall positive performance of MoE-deconcentrated offices inthese countries in terms of costs, delivery capacity was highly problematic. InMadagascar, education district offices delivered only 7 percent of the programafter more than 3 years of implementation under the OPEC-financed project
Figure 5.13 Deconcentration of Implementation Responsibilities to Lower Levels of Administration
cen
tral
ized
semi public andNGO sectors
private sector
dec
entr
aliz
ed
Localoffice of(MoE)
Centralgovernment
(MoE)
public private
Localcommunity
Schoolcommunity
government communities
Largenational
contractor
Localgovernment
Mediumcontractor
Smallcontractor
executesthe works
Village/neighbor-
hood
Schoolinstitution School
building
delegates implementationresponsibility
procures works through NCB
Source: Author’s figure.
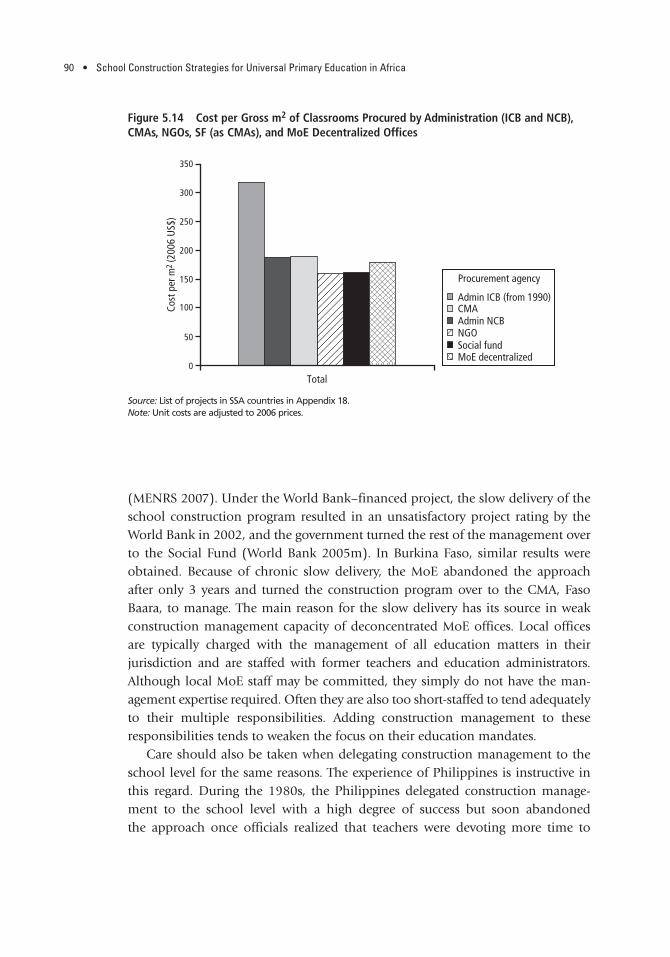
(MENRS 2007). Under the World Bank–financed project, the slow delivery of theschool construction program resulted in an unsatisfactory project rating by theWorld Bank in 2002, and the government turned the rest of the management overto the Social Fund (World Bank 2005m). In Burkina Faso, similar results wereobtained. Because of chronic slow delivery, the MoE abandoned the approachafter only 3 years and turned the construction program over to the CMA, FasoBaara, to manage. The main reason for the slow delivery has its source in weakconstruction management capacity of deconcentrated MoE offices. Local officesare typically charged with the management of all education matters in their jurisdiction and are staffed with former teachers and education administrators.Although local MoE staff may be committed, they simply do not have the man-agement expertise required. Often they are also too short-staffed to tend adequatelyto their multiple responsibilities. Adding construction management to theseresponsibilities tends to weaken the focus on their education mandates.
Care should also be taken when delegating construction management to theschool level for the same reasons. The experience of Philippines is instructive inthis regard. During the 1980s, the Philippines delegated construction manage-ment to the school level with a high degree of success but soon abandonedthe approach once officials realized that teachers were devoting more time to
90 • School Construction Strategies for Universal Primary Education in Africa
Figure 5.14 Cost per Gross m2 of Classrooms Procured by Administration (ICB and NCB),CMAs, NGOs, SF (as CMAs), and MoE Decentralized Offices
350
300
250
200
150
100
0
Cost
per
m2
(200
6 U
S$)
Admin ICB (from 1990)
Admin NCBCMA
NGOSocial fundMoE decentralized
Procurement agency
Total
50
Source: List of projects in SSA countries in Appendix 18.Note: Unit costs are adjusted to 2006 prices.

91
Table 5.8 Cost of Classrooms Built by Deconcentrated Branches of Administration Compared with Other Agencies
Government deconcentrated offices Comparative approach
Project Financing Procurement Procurement Unit cost Project Financing Procurement Procurement Unit costCountry Year name agency agency method US$/m2 Source name agency agency method US$/m2 Source
Burkina 2000–04 SBEL Canada, MoE NCB 108 a n.a. Gov/HPIC Faso Baara NCB 133 aFaso Netherlands provincial PAOEB France 150
IDA offices (FDA)
Madagascar 2000–04 CRESED II IDA MoE district NCB 157 b Edu AfDB MoE/PIU NCB 248 doffices (CISCO) 184 n.a. BADEA MoE/PIU NCB 223
2005 n.a. OPEP Regional NCB 141 c n.a. Gov FID-EPT NCB 189
n.a. Gov offices NCB 214 n.a. FDA AGETIPA NCB 301
Mozambique 2000–04 ESSP FINNIDA MoE NCB 116 e ESSP IDA MoE NCB 173 eESSP IDA provincial LCB 130 RPSP IDB Central NCB 149
offices NCB 149 Office
2002–06 ESSP DANIDA LCB 419 n.a. AMDU (NGO) NGO Dir. cont. 110
Average 180 196
Source: (a) Development of Basic Education and Literacy (Group 5 2006a); (b) Education Sector Development Project, CRESED-II, (d) World Bank 1998b, (Group 5 2005); (c) School ConstructionStrategy Paper (MENRS 2007); (e) Group 5 2006c.Note: Unit costs are adjusted to 2006 prices using the U.S. GDP deflator. For a complete list of acronyms, see p. xv.n.a. Not applicable.

92 • School Construction Strategies for Universal Primary Education in Africa
construction management than to teaching, which resulted in lower student learn-ing outcomes.
DELEGATION BY THE MoE DIRECTLY TO COMMUNITIES
Delegation of construction management by Ministries of Education or ofFinance to local communities has been implemented in Africa in Mauritania,Uganda, and Zambia and in Asia, in India, Laos, and Vietnam. Figure 5.15 illus-trates this arrangement.
Results of these experiences provide solid evidence that delegation of construc-tion management to communities can significantly increase production and lowerthe cost of construction, compared with centralized management approaches. In allinstances, the number of classrooms built exceeded expectations.
In Mauritania, which has one of the longest-running community-managedschool construction programs, initially communities built 1,000 classrooms com-pared with the 250 expected. The capacity was immediately multiplied four times.
Figure 5.15 Delegation by Ministry of Education to Communities
cen
tral
ized
semi public andNGO sectors
private sector
dec
entr
aliz
ed
Centralgovernment
(MoE)
public private
Localcommunity
Schoolcommunity
government communities
Largenational
contractor
LocalGovernment
Mediumcontractor
Smallcontractor
executesworks
contributesto work
procuresworks
providessupport
Village/neighbor-
hood
Schoolinstitution School
building
signsFinancingAgreementwith CBOfor theconstructionof the school
schoolcommunity
requestsfinancing
for itsschoolproject
Source: Author’s figure.

Procurement and Contract Management • 93
Cumulatively, since 1989, communities have built 5,000 classrooms throughcommunity contracting (see box 5.2). As in Mauritania, in 1998 the UgandanMoE delegated the school construction responsibility to local communities, whichbuilt 7,700 classrooms in one-and-a-half years, at a cost as low as US$52/m2
(Kisamba-Mugerwa 2001).26 Again, implementation capacity was immediatelymultiplied several times. In Zambia communities are responsible for the majorpart of the school construction programs. Under a basket-funding of seven donors
BOX 5.2 COMMUNITY DELEGATION IN MAURITANIA
Mauritania has one of the longest-running school construction programsusing community delegation. In 1989, the Ministry of Education decidedto fully delegate the management of school construction to parents’ associ-ations. An illustration of the implementation scheme is in Appendix 8.
Under this approach, communities were able to build 1,000 classroomsa year relative to the 250 planned. The approach is demand driven, and eli-gible projects are financed by the MoE through financing agreements mon-itored by a group of three engineers. Through this approach, communitieshave built more than 5,000 classrooms and the approach is still beingused. The World Bank and the French FDA jointly support this approach.
From the beginning, classroom costs were cut by almost two-thirds,from US$18,000 when managed by the Ministry of Public Works using ICBto US$5,600. By 2000, the unit cost fell further to US$4,600 as comparedto a cost of US$13,200 achieved by the CMA AMEXTIPE for the samebuilding (Synergy 2000), and the cost savings persisted over time. Further,the strategy created a dynamic that boosted demand for education, even inthe most remote villages, which was instrumental in increasing primaryschool enrolment from 49 percent of school-age children in 1989 to 98percent by 2004.
Surprisingly, the quality of construction increased with the distancefrom the capital, with classroom masterpieces being the most remote vil-lages because the greater social cohesion in remote communities has animpact on the governance of the school project and the management ofthe contractors’ contract. Overall, technical audits indicate that the averagequality of the construction is fair.
Sources: Mauritania: World Bank 1996c, 1998a, 2001d, 2001f; Theunynck 1993;Ould Cheikh 1994; Synergy 2000.
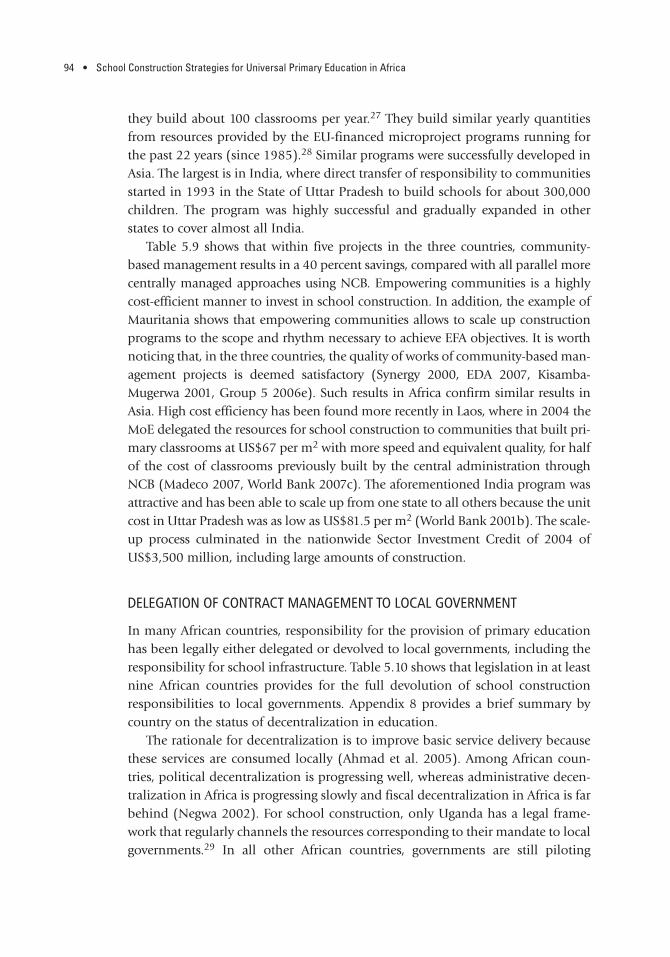
they build about 100 classrooms per year.27 They build similar yearly quantitiesfrom resources provided by the EU-financed microproject programs running forthe past 22 years (since 1985).28 Similar programs were successfully developed inAsia. The largest is in India, where direct transfer of responsibility to communitiesstarted in 1993 in the State of Uttar Pradesh to build schools for about 300,000children. The program was highly successful and gradually expanded in otherstates to cover almost all India.
Table 5.9 shows that within five projects in the three countries, community-based management results in a 40 percent savings, compared with all parallel morecentrally managed approaches using NCB. Empowering communities is a highlycost-efficient manner to invest in school construction. In addition, the example ofMauritania shows that empowering communities allows to scale up constructionprograms to the scope and rhythm necessary to achieve EFA objectives. It is worthnoticing that, in the three countries, the quality of works of community-based man-agement projects is deemed satisfactory (Synergy 2000, EDA 2007, Kisamba-Mugerwa 2001, Group 5 2006e). Such results in Africa confirm similar results inAsia. High cost efficiency has been found more recently in Laos, where in 2004 theMoE delegated the resources for school construction to communities that built pri-mary classrooms at US$67 per m2 with more speed and equivalent quality, for halfof the cost of classrooms previously built by the central administration throughNCB (Madeco 2007, World Bank 2007c). The aforementioned India program wasattractive and has been able to scale up from one state to all others because the unitcost in Uttar Pradesh was as low as US$81.5 per m2 (World Bank 2001b). The scale-up process culminated in the nationwide Sector Investment Credit of 2004 ofUS$3,500 million, including large amounts of construction.
DELEGATION OF CONTRACT MANAGEMENT TO LOCAL GOVERNMENT
In many African countries, responsibility for the provision of primary educationhas been legally either delegated or devolved to local governments, including theresponsibility for school infrastructure. Table 5.10 shows that legislation in at leastnine African countries provides for the full devolution of school constructionresponsibilities to local governments. Appendix 8 provides a brief summary bycountry on the status of decentralization in education.
The rationale for decentralization is to improve basic service delivery becausethese services are consumed locally (Ahmad et al. 2005). Among African coun-tries, political decentralization is progressing well, whereas administrative decen-tralization in Africa is progressing slowly and fiscal decentralization in Africa is farbehind (Negwa 2002). For school construction, only Uganda has a legal frame-work that regularly channels the resources corresponding to their mandate to localgovernments.29 In all other African countries, governments are still piloting
94 • School Construction Strategies for Universal Primary Education in Africa

95
Table 5.9 Cost of Classrooms Built by Communities Compared with Other Management Arrangements
Community empowerment Comparative approach
Financing Procurement Procurement Unit cost Financing Procurement Procurement Unit costCountry Year Project Ministry agency agency method US$/m2 Source Project agency agency method US$/m2 Source
Mauritania 1995–2000 Edu-V MoE IDA, FDA Community Direct 97 a Urban IDA AMEXTIPE NCB 277 c(France) contract. Project-1
2000–05 PNDSE MoE 148 b Urban KfW-IDA AMEXTIPE NCB 233 dProject-2
Uganda 1998–2000 SFG MoE IDA Community LCB 52 e LGDP-1 IDA LG LCB 54 fphase1
Zambia 1999–2003 BESSIP MoE 7 donors Community Labor: dir 134 g BSCP MoE MoE NCB 161 g2005 MPP MoF UE Community Materials: shop 84 MoE HPIC MoE NCB 131
Average 103 171
Sources: (a) Theunynck 1999; (b) data collected by Theunynck; (c) Synergy 2000; (d) Rosso US$7,463 and Nouadhibou US$6,936, data collected by Theunynck; (e) Kisumba-Mugerwa et al. 2001;(f) World Bank 2004n; (g) Synergy 2006e. Note: Unit costs are adjusted to 2006 prices using the US GDP deflator. For a complete list of acronyms, see p. xv.

decentralization by transferring limited amounts to local govern-ments for basic infrastructure invest-ment through specific projects, as in Senegal, Mauritania, Ghana, andBenin.
Across countries, local govern-ments have been involved in schoolconstruction through three differentimplementation arrangements:
• Direct implementation, by whichlocal governments, procure, con-tract and pay contractors and sitesupervisors. Ghana, Guinea, Mada-gascar, and Senegal have projectspiloting this approach, whereasRwanda and Uganda have greaterexperience.30 This approach is illus-trated in Figure 5.16.31
• Delegation of construction management from local government to CMAs iscurrently implemented in Senegal and Mauritania, in parallel with one or twoof the other approaches in urban areas under IDA-financed urban develop-ment and rural infrastructure projects.32
• Delegation from local governments to their local communities is also currentlyimplemented in Benin, Ghana, and Uganda. Illustrations of the implementa-tion arrangements for the second and third methods are in Appendix 11. In terms of costs, performances of local governments in school construction arequite similar to these of other agencies, such as central government, CMAs,NGOs, SFs, and local branches of MoEs, when they act by themselves or asCMAs or delegate to CMAs. Figure 5.17 illustrates that, on average, local governments—when they act by themselves—achieve slightly lower unit costscompared with contracting out the construction management to a CMA. How-ever, costs are lowest when local governments delegate the construction management to communities.
Table 5.11 shows the comparative cost of local government management com-pared with CMA or other centralized approaches in six countries.
In the first group of two countries, local governments are outsourcing con-struction management to CMAs and achieving an average cost that is more thantwice the average cost of comparator approaches. However, these averages mask
Table 5.10 Status of Decentralization of School Constructionin Selected Countries
Decentralization Devolution oflaw or local school construction
Countries government act (year) to LGs
Benin 2003 yes (2003)
Burkina Faso 1998 yes (1/3 LG)
Ethiopia 1991 no
Ghana 1992 yes
Guinea 1991 no
Mali 1995 yes (2002)
Malawi 1998 no
Mauritania 1986 yes (1986)
Senegal 1996 yes (1996)
Tanzania 1990 yes (1990)
Uganda 1997 yes (1997)
Zambia 1992 yes (2005)
Source: See Appendix 8.
96 • School Construction Strategies for Universal Primary Education in Africa

Procurement and Contract Management • 97
Figure 5.16 Devolution of School Construction to Local Governments
cen
tral
ized
semi public andNGO sectors
private sector
dec
entr
aliz
ed
Centralgovernment
public private
Localcommunity
Schoolcommunity
government communities
Largenational
contractor
Localgovernment
Mediumcontractor
Smallcontractorexecutes
works
procures work through NCB
FiscalTransfer
expressesneeds
Village/neighbor-
hood
Schoolinstitution School
building
Source: Author’s figure.
Figure 5.17 Cost per Gross m2 of Classrooms Procured by Administration (ICB-NCB), CMAs,NGOs, SFs (as CMAs) and MoE Decentralized, and Local Governments
350
300
250
200
150
100
0
Cost
per
m2
(200
6 U
S$)
Admin ICB (from 1990)
Admin NCBCMA
NGO
Social fundMoE decentralizedLG
Procurement agency
Total
50
Source: List of projects in SSA countries in Appendix 18.Note: Unit costs are adjusted to 2006 prices.

98
Table 5.11 Cost of Classroom Construction Built by Local Government through Different Modalities Compared with Other Agencies
Local government empowerment Comparative approach
Procure- Procure- Procure- Procure- UnitProject Financing Type of local ment ment Unit cost Project Financing ment ment cost
Country Year name agency government agency method US$/m2 Source name agency agency method US$/m2 Source
Local governments out contract school construction to contract management agency
Mauritania 1997–04 Urban IDA Urban LG AMEXTIPE NCB 277 a Edu V IDA/FDA Communities Direct 97 dProject 1 contracting
2005 Urban IDA/KFW Urban LG AMEXTIPE NCB 231 b PNDSE IDA/FDA Communities Direct 148 bProject 2 contracting
Senegal 2000–05 Urban IDA Urban LG AGETIP NCB 149 c EFA-1 Gov/HPIC MoE NCB 141 fProject 1
Average 219 129
Local governments directly procure works for school construction
Ghana 2002–05 ESSP/SU DFID Districts Districts NCB 86 g BESIP IDA MoE (FPMU) NCB 166 g
Guinea 1989–94 PASE-1 IDA Prefects Prefects NCB/LCB 349 h PCPEP UNESCO Donor Direct 181 h2006–07 EFA/VCSP IDA Rural LG Rural LG LCB 215 i EFA-1-2 IDA NGO (CMA) NCB 121 m
Senegal 2000–05 NRIP IDA Rural LG Rural LG LCB 140 j EFA-1 IDA CMA NCB 152 f
Madagascar 2004–07 FID-IV IDA Rural LGs Rural LG LCB 127 k OPEP OPEP MoE (PIU) NCB 141 n
Rwanda 2004–06 HRDP IDA Rural LGs Rural LG NCB 194 l Edu-III AfDB MoE (PIU) NCB 263 o
Uganda 2004–07 LGDP-2 IDA LGs LGs NCB 90 t ESSIP IDA MoE (SFD) NCB 141 u
Average 172 166
Local governments delegate school construction to communities
Benin 2006 NCDDSP Gov/IDA Rural and Local LCB 116 p MoE Gov MoE NCB 169 q2007 urban LG communities 118 q
Ghana 2000–03 MPP UE Rural LG Community Labor: dir 68 r BESIP IDA MoE (FPMU) NCB 166 rMaterials:
shop
Uganda 1997–07 ESIP (SWAP) MoE/SFG Rural LG Community LCB 81 s SWAP Gov/SFG Cent off for NCB 141 s2000–03 MPP UE Rural LG Community 3 Q 92 urban schools
Average 95 159
Sources: (a) Synergy 2000; (b) Rosso (KFW) US$11,843 and Nouadhibou (IDA) 12,500, data collected by Theunynck; (c) Urban Development and Decentralization Project (Dupety 2005a); (d) World Bank2001e; (f) Education For All Project (Diouf 2006); (g) Education Sector Investment Plan (Group 5 2006b); (h) De Bosch Kemper et al. 1990, World Bank 1995c; (i) VCSP 2007; (j) National Rural Infra-structure Project (Diouf 2006); (k) National Community-Driven Development Support Project, data collected by Serge Theunynck; (l) Kayumba 2006, Kabuga 2001, MESTRS 2006; (m) Dupety 2004 and2005c; (n) PNDCC 2007; (o) Kayumba 2006; (p) FID 2005a, 2005b, 2005c, 2007; (q) MENRS 2007; (r) Group 5 2006b; (s) Group 5 2006d; (t) Theunynck 2007a; (u) Group 5 2006d.Note: Unit costs are adjusted to 2006 prices using the U.S. GDP deflator. For a complete list of acronyms, see p. xv.

Procurement and Contract Management • 99
different results of individual countries. In one country (Senegal) local govern-ments are, through a CMA, performing just as well as the central government,while in the second country (Mauritania), local governments are building class-rooms, through a CMA, at a high unit cost that is more than double thoseachieved by communities. In this country, there is no other approach to include inthe comparison.
• In the second group of six countries (including one of the first group), localgovernments are doing procurement by themselves and achieving unit coststhat are, on average, slightly higher than those achieved in those countries bycentral administrations or CMAs, although with large differences within indi-vidual countries.
• In the third group of three countries (including one of the second group), localgovernments are delegating the management of school construction to theirlocal communities (four projects). In this group, all individual cases show thesame result: local governments, though delegation to their communities, achieveunits costs that are, on average, less than half those of the central governmentthrough NCB. The implementation scheme is illustrated in Appendix 8.
Although collected data are not sufficient to systematically compare the effi-ciency of construction management by local governments relative to other central-ized approaches in the same country, data from Guinea and Senegal in table 5.11suggest that local governments have no comparative advantage in terms of cost rel-ative to central MoE management, or to management by a CMA, whereas data fromGhana, Madagascar, Rwanda, and Uganda suggest the opposite conclusion.
Data from Benin, Ghana, and Uganda suggest also that when local govern-ments delegate the management of school construction projects to local commu-nities, the latter outperform all other construction management methods. In thesecountries, community management lowered the cost of construction by between20 to 30 percent, compared with direct management by central or local govern-ments or CMA. The Micro-Project Program in Ghana and the National CDD pro-gram in Benin are examples of good-quality works executed under communitymanagement, as a result of adequate supervision (Group 5 2006b, Bathys Consult2007). The Benin example shows that proper technical supervision is effectivewhen carried out by private sector technicians hired on a competitive basis by thecommunities.33 The second phase of the School Facility Grant in Uganda is anexample of a wide range of quality works, due to inadequate site supervision byLGs and the MoE.
However, similar to the results obtained in the Social Funds and the NGOexamples of Benin, Ghana, Senegal, and Uganda, the data in table 5.12 show thatcommunity delegation outperforms all other construction management methods.

This result is achieved whether communities receive responsibility by delegationfrom an SF, an NGO, or LGs, or from MoEs, as in the examples of Mauritania andZambia with equivalent quality of works.
COMMUNITY CONTRACTING
Of all the various management approaches, decentralized approaches to schoolconstruction management (whether by MoE branch offices, local governments, orespecially communities) are the most cost effective, compared with centralizedmanagement approaches, such as the central MoE, CMAs, NGOs, and SocialFunds when they act as CMAs.
Results from numerous countries—Benin, Burkina Faso, Ghana, Madagascar,Malawi, Mali, Mauritania, Senegal, Uganda, Zambia, India, Laos, and Vietnam—provide solid evidence that community delegation can significantly increase pro-duction and lower the cost of construction compared with other managementstrategies. They also show that community management provides good-qualityconstruction. When we combine all community management experiences together,figure 5.18 shows that, on average, community-managed school constructionachieved by far the lowest cost per classroom constructed. On average, communi-ties built their own classrooms at US$110/m2, a cost at least one-third lower thanclassrooms built by NGOs, CMAs, or central administration using NCB.
To further test the robustness of these results, a regression analysis was donebased on data from 215 school construction projects in 30 countries, 23 of whichare in Sub-Saharan Africa, and 7 in other regions (Latin America, East Asia &
100 • School Construction Strategies for Universal Primary Education in Africa
Table 5.12 Examples of Gross Unit Costs Obtained in Benin, Ghana, Senegal,and Uganda
Country Procurement agency US$/m2
Benin MoE 157MoE delegating to CMA 156Communities by delegation from LG 113
Ghana MoE 156LG 86Communities by delegation from NGO 68
Senegal LG 140MoE 141CMA by delegation from LG 152Communities by delegation from SF 110
Uganda MoE 141MPP by delegation to communities 83Communities by delegation from MoE (SFG-1) 52
Source: Preceding tables.
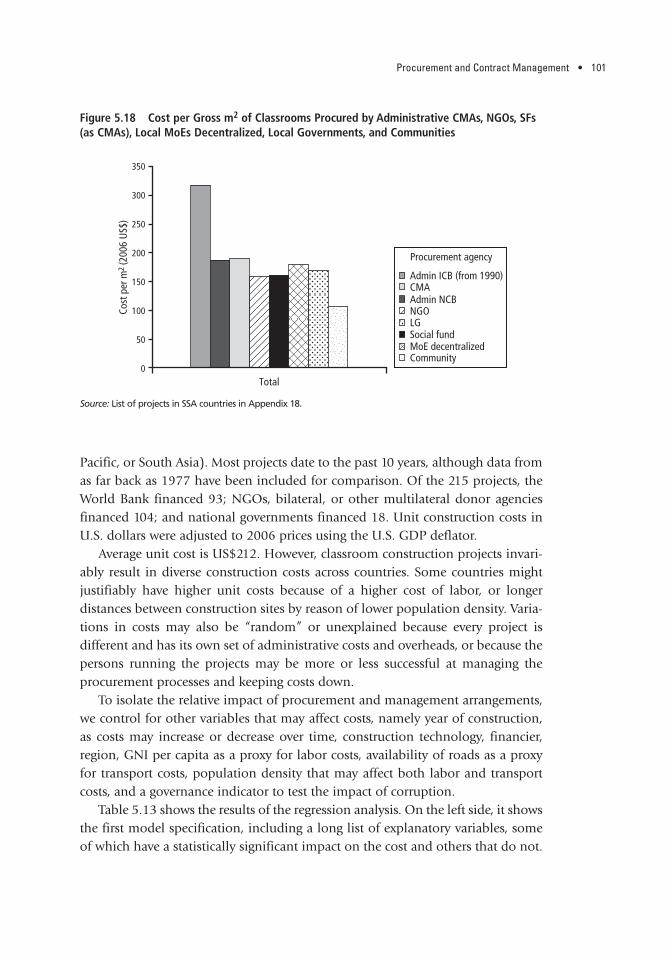
Procurement and Contract Management • 101
Pacific, or South Asia). Most projects date to the past 10 years, although data fromas far back as 1977 have been included for comparison. Of the 215 projects, theWorld Bank financed 93; NGOs, bilateral, or other multilateral donor agenciesfinanced 104; and national governments financed 18. Unit construction costs inU.S. dollars were adjusted to 2006 prices using the U.S. GDP deflator.
Average unit cost is US$212. However, classroom construction projects invari-ably result in diverse construction costs across countries. Some countries mightjustifiably have higher unit costs because of a higher cost of labor, or longer distances between construction sites by reason of lower population density. Varia-tions in costs may also be “random” or unexplained because every project is different and has its own set of administrative costs and overheads, or because thepersons running the projects may be more or less successful at managing the procurement processes and keeping costs down.
To isolate the relative impact of procurement and management arrangements,we control for other variables that may affect costs, namely year of construction,as costs may increase or decrease over time, construction technology, financier,region, GNI per capita as a proxy for labor costs, availability of roads as a proxyfor transport costs, population density that may affect both labor and transportcosts, and a governance indicator to test the impact of corruption.
Table 5.13 shows the results of the regression analysis. On the left side, it showsthe first model specification, including a long list of explanatory variables, someof which have a statistically significant impact on the cost and others that do not.
Figure 5.18 Cost per Gross m2 of Classrooms Procured by Administrative CMAs, NGOs, SFs(as CMAs), Local MoEs Decentralized, Local Governments, and Communities
350
300
250
200
150
100
0
Cost
per
m2
(200
6 U
S$)
Admin ICB (from 1990)
Admin NCBCMA
NGO
Social fundMoE decentralizedCommunity
LG
Procurement agency
Total
50
Source: List of projects in SSA countries in Appendix 18.

On the right side, the table shows a reduced model that includes only those vari-ables that have statistically significant coefficients. The coefficient estimates can beinterpreted as US$ increments in the unit cost. The analysis confirms the findingsthat ICB procurement is the highest-cost method of procuring construction serv-ices, whereas community management results in significantly lower costs. Theempirical analysis shows that:
• Classroom construction is less costly in countries with a high population density:The higher density allows the contractor to organize work more efficientlybecause of the shorter distances between construction sites, and more availability
102 • School Construction Strategies for Universal Primary Education in Africa
Table 5.13 Regression Estimates of the Impact of Project and Country-Specific Variableson the Classroom Construction Cost per Gross m2 from Various Classroom Construction Projects
Model specification 2:Model specification 1 reduced modela
Coefficient t-statistica Coefficient t-statistic
Intercept 121.4 192.2
Continuous variables
Project yearb �7.3 �4.4** �7.0 �4.6**
Log (pop. density per square km) �11.7 �1.5 �14.7 �2.1*
Log (GNI/capita) 10.3 0.5
CPIA indicator on governance (quintile) 2.5 0.3
Road to pop. ratio (km/m habitants) 0.0004 0.1
Dummy variables
Asia regions (EAP and SAS) �83.3 �2.1* �71.5 �2.1*
LAC region 180.1 2.1* 210.4 3.1**
Prefab �3.2 �0.1
Shelter �252.3 �4.0** �261.1 �4.3**
Bilateral or EU financing (except JICA) 69.1 3.4** 70.1 3.6**
JICA financing 346.5 7.1** 353.4 7.4**
Procurement agency � Admin ICB 80.6 2.0* 81.1 2.1*
Procurement agency � community �70.2 �2.6* �89.4 �4.1**
Execution of works � micro and small contractors �28.4 �1.3
Execution of works � large contractor 113.4 2.7** 119.7 3.4**
No. of observations 215 215
R-square for regression 60.0% 60.0%
Source: Kirsten Majgaards calculation. Notes: * indicates statistical significance at the 5 percent level, ** statistical significance at the 1 percent level. (a) The reduced modelonly includes explanatory variables when their coefficients are significant at the 5 percent level. (b) This variable is computed as theproject year minus 2006.

Procurement and Contract Management • 103
of labor and suppliers in the surroundings of each construction site. For example,the 2006 construction cost for a WB funded project in a country with a density of14 persons per km2 (like Zambia) would be US$153, compared to only US$121per gross m2 in a country with a density of 128 persons per km2 (for example,Uganda).
• The construction cost was found to have declined over time, by about US$7each year prior to 2006, reflecting the increased competition in the construc-tion sector in many countries. The regional dummies indicate that—comparedto Sub-Saharan Africa—costs are much higher in Latin America (the countriesin our sample are Mexico and Brazil, where per capita incomes are much higherthan in Africa), and a little lower in Asia (the countries included in our sampleare Bangladesh, India, Laos, Pakistan, and the Philippines).
• Other than the regional differences in costs, which may be related to differencein income, there appears to be no impact from GNI per capita on the con-struction cost. Thus, within Sub-Saharan Africa, the poorest countries have thesame structure of construction costs as the richer countries.
• No statistically significant difference was found between financing by the WorldBank or other multilateral agencies, the UN, governments, or NGOs. Bilateraldonors and the European Union were found to have higher costs, particularlyin the case of JICA, whose costs are much higher than those of other donors.
• Shelters, not surprisingly, are significantly less costly than classic construction,while no statistical difference was found in the construction costs of classictechniques versus prefabrication.
• The indicators for governance and availability of roads had no impact on con-struction costs.
• When controlling for these other factors, centralized management with ICBresults in significantly higher unit costs than other procurement methods—higher by US$81 per gross m2, whereas community-based management andprocurement result in significantly lower costs—lower by US$89 per gross m2.Similarly, execution of works by large contractors is related to higher costs—higher by US$120 per gross m2. Thus, the project design has more impact onthe cost than country- specific parameters such as income per capita, availabil-ity of roads, and public sector governance.34
Despite these highly positive results, and the encouraging legal landscape fordecentralization, the scope of decentralized management of school constructionremains limited. Centralized planning and management of school constructionremain the norm in most countries. Few African countries—Mauritania, Tanzania,Uganda, and South Africa being the exceptions—have devolved school construc-tion management to local governments or communities. Table 5.14 shows that ina sample of eight African countries, centralized construction management stillaccounts for two-thirds of all recent school construction projects.

Within government, the transfer of administrative and fiscal management hasbeen slow as shown by the small proportion of resources transferred to local gov-ernments, and the proportion of resources the latter spends compared to totalpublic spending. Table 5.15 shows that in 1999, in a sample of six countries thathave enacted decentralization laws, the percentage of public expenditure spentthrough local governments is no more than 8 percent, compared to an average of22.5 percent in developed countries, ranging between 40 percent in the Nordiccountries, 32 percent in OECD countries, and 10 to 20 percent in Asian and Latin
104 • School Construction Strategies for Universal Primary Education in Africa
Table 5.14 Parallel Centralized and Decentralized Projects/Programs During2000–04 in Selected African Countries
Number of Number of Total number ofCountry centralized projects decentralized projects projects
Burkina Faso 9 4 13
Madagascar 10 1 11
Mauritania 0 2 2
Mozambique 9 1 10
Niger 8 0 8
Senegal 6 4 10
Uganda 0 2 2
Zambia 3 8 11
Average 6 3 8
Sources: Dupety 2005b; Group 5 2006a, c–e; Zerbo 2008; author’s data.
Table 5.15 Local Government Expenditure as a Share of GDP and GovernmentExpenditure, 1997–99
Share of LG expenditure/Country Share of LG as % GDP total expenditure
Ghana 3 8
Senegal 1.8 7
Swaziland 0.6 2
Zambia 0.5 3
Zimbabwe 3 8
Uganda 4 21
Total 2.1 8
Nigeria 1.2 (6)* 5 (26)*
OECD 11 10–35
Source: Olowu 2003. Note: *All subnational expenditures, that is, state and local governments.
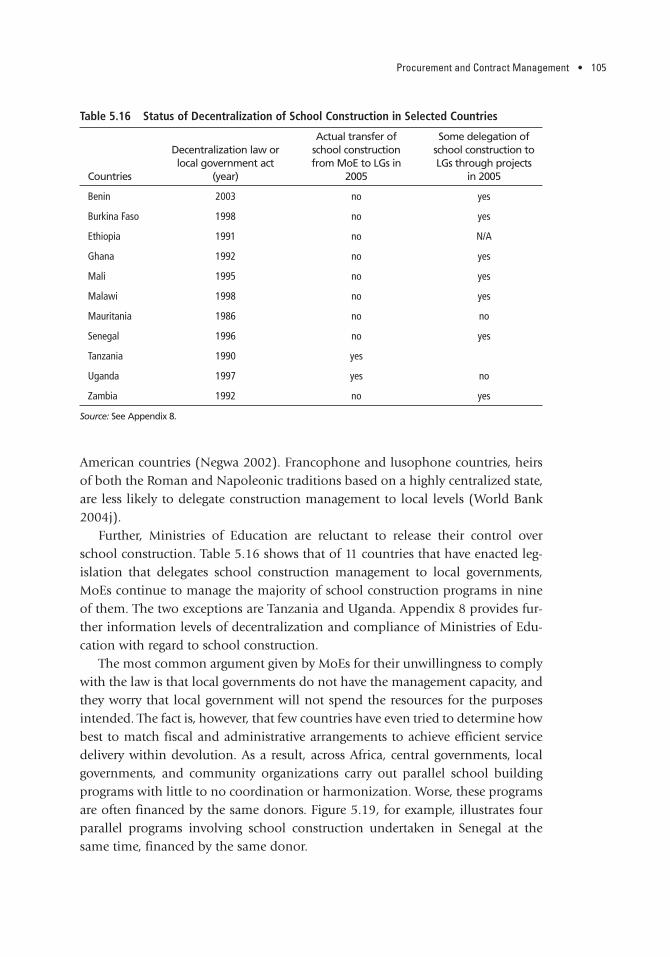
Procurement and Contract Management • 105
American countries (Negwa 2002). Francophone and lusophone countries, heirsof both the Roman and Napoleonic traditions based on a highly centralized state,are less likely to delegate construction management to local levels (World Bank2004j).
Further, Ministries of Education are reluctant to release their control overschool construction. Table 5.16 shows that of 11 countries that have enacted leg-islation that delegates school construction management to local governments,MoEs continue to manage the majority of school construction programs in nineof them. The two exceptions are Tanzania and Uganda. Appendix 8 provides fur-ther information levels of decentralization and compliance of Ministries of Edu-cation with regard to school construction.
The most common argument given by MoEs for their unwillingness to complywith the law is that local governments do not have the management capacity, andthey worry that local government will not spend the resources for the purposesintended. The fact is, however, that few countries have even tried to determine howbest to match fiscal and administrative arrangements to achieve efficient servicedelivery within devolution. As a result, across Africa, central governments, localgovernments, and community organizations carry out parallel school buildingprograms with little to no coordination or harmonization. Worse, these programsare often financed by the same donors. Figure 5.19, for example, illustrates fourparallel programs involving school construction undertaken in Senegal at thesame time, financed by the same donor.
Table 5.16 Status of Decentralization of School Construction in Selected Countries
Actual transfer of Some delegation ofDecentralization law or school construction school construction tolocal government act from MoE to LGs in LGs through projects
Countries (year) 2005 in 2005
Benin 2003 no yes
Burkina Faso 1998 no yes
Ethiopia 1991 no N/A
Ghana 1992 no yes
Mali 1995 no yes
Malawi 1998 no yes
Mauritania 1986 no no
Senegal 1996 no yes
Tanzania 1990 yes
Uganda 1997 yes no
Zambia 1992 no yes
Source: See Appendix 8.

Experience shows that reformers will have to manage resistance from MoE civilservants who fear a loss of power, or their jobs, from the shift to a community-based approach to school construction. This is clearly not the case, however. Decen-tralization and community empowerment do not mean chipping away at the MoE.Rather, they imply a mutually beneficial joint venture among different levels of thecentral government, local governments, and communities in which each has spe-cific roles to play according to their comparative advantage in a learning-by-doingapproach. Building this understanding is part of the development challenge.
CONCLUSIONS
The experiences of Benin, Burkina Faso, Ethiopia, Ghana, Madagascar, Malawi,Mali, Mauritania, Senegal, Uganda, and Zambia show that community delegationhas been the most effective. The notions that communities and local governmentsare unable to manage school construction are highly inaccurate. These experiencesshow that communities can organize themselves quickly to diagnose local prob-lems, identify priorities, develop solutions and action plans, and execute thoseplans. Communities can be trained efficiently and successfully to carry out pro-curement and financial management methods that ensure transparency, economy,and efficiency through adapted training methods. These experiences also showthat the quality of the works done by local contractors is—as in any other imple-mentation arrangement—heavily dependent on the efficiency of the technicalsupervision, which is always more efficient when the technical supervision serviceis competitively contracted out to private sector providers. This is true whether the
106 • School Construction Strategies for Universal Primary Education in Africa
Figure 5.19 Simultaneous IDA-funded Projects Financing School Constructionwith Different Approaches in Senegal. 2005
Educ
atio
n-Tr
aini
ngDe
velo
pmen
tPr
ojec
t (PD
EF)
Schoolbuilding
Nat
iona
l Rur
alIn
frast
ruct
ure
Proj
ect (
PNIR
)
Schoolbuilding
Urb
an L
ocal
Gov
ernm
ent
Supp
ort P
roje
ct (P
AC)
Schoolbuilding
Soci
alDe
velo
pmen
t Fun
dPr
ojec
t (PF
DS)
Schoolbuilding
Source: Author’s figure

Procurement and Contract Management • 107
contract is provided by communities or any other entity such as MoEs, LGs, CMAs,or SFs. Experiences in Senegal and Benin show that communities can procuregood technical supervision services and ensure good quality of the works.
Moreover, when communities are empowered with information, resources,and technical support they outperform all other construction managementarrangements in terms of cost for quality and delivery time.
NOTES
1. In Senegal, classrooms procured through ICB averaged around US$14,000 in 1982.In Niger the range of cost per classroom was about US$15,500 in 1984 (World Bank 1986).In Mauritania, the cost in 1984 ranged between US$17,000 to US$30,000 per classroom(World Bank 1988, UNESCO 1984).
2. For instance, AfDB-financed PERP in Ghana during 1998–2004 (Group 5 2006b); inZambia, the OPEC-financed Primary School Upgrading Project (Group 5 2006e).
3. The combined approach was implemented through the IDA-financed Education III(1985–94) and Education IV (1992–98).
4. The community participation strategy resulted in costs of US$120 per m2 in1993–1995 compared to US$93 per m2 achieved by the Ministry of Education in1993–1997 (World Bank 1999c, Synergy 1997).
5. Urban communities are served by the Urban Development Project, which requirescontributions from local government and not from communities, whereas rural communi-ties are served by the MoE-managed education programs whereby communities have tocontribute 30 percent of the estimated cost.
6. During the 1981–1990 period, the Ministry of Public Works managed the schoolconstruction program of the first Education Project and built 60 classrooms in 3.5 years(World Bank 1981, 1996d). The IDA-financed second Education project, the Primary Edu-cation Development Project (1987–95), abandoned the full ICB approach for the combi-nation of ICB for materials and LCB for labor by microenterprise.
7. From FCFA 4,370,000 in 1984 (Ministry of Public Works, ICB), to FCFA 2,178,000in 1994 under MoE management through the combined approach, and FCFA 3,000,000 in1995 after the devaluation
8. In Madagascar, AfDB- and OPEC-financed projects; in Rwanda, AfDB- and UNICEF-financed projects.
9. The 16 countries are Cape Verde (AGECABO), Chad (ATETIP), Benin (AGETUR,AGETIP, PRIMO), Burkina Faso (Faso Baara), Burundi (ABUTIP), Central African Republic,Djibouti, Gabon, Gambia (GAMWORKS), Guinea-Bissau, Madagascar, Mali (AGETIP-Mali), Mauritania (AMEXTIPE), Mozambique, Niger (NIGETIPE), and Togo. The networkis AFRICATIPE.
10. In Senegal after 7 years of AGETIP activities, the number of construction firmsincreased fivefold (World Bank 2006j). In Mali, after 5 years of AGETIP-Mali activities, thenumber of enterprises boomed from 400 to 1,280 enterprises in 1996 (Bigio 1998).
11. Madagascar (Law 99-023 dated July 30, 1999); Benin (Laws 2001–07 and 2005–07dated May 9, 2001); and Mauritania (Law 2005-020 dated January 30, 2005).

12. Burkina Faso (IDA funds), Cape Verde (IDA and AfDB funds), Chad (IDA funds),Senegal (IDA, KfW, and AfDB funds), The Gambia (IDA funds), and Madagascar (AfDBfunds).
13. AGETIP first became involved in primary school construction in 1992 under anIDA-financed primary education development project. This involvement was continuedunder subsequent projects financed by IDA and the KfW.
14. The list includes 19 projects managed by administration through ICBs, 37 projectsmanaged by administration through NCB, and 30 projects managed by CMAs.
15. Such results regarding comparable costs between AGETIPs and other actors are alsomentioned in Diou et al. 2007, p. 30.
16. This is a case of conflict of interest. See Diou et al. 2007.17. World Bank, Operation Manual, BP 800—Rapid Response to Crises and Emergen-
cies, March 1, 2007. 18. 179 of a total of 644 projects approved in 2001.19. NGOS included Save The Children, World Education, World Vision, Plan Interna-
tional, and 10 local NGOs.20. Education Sector Consolidation Project financed by IDA, USAID, Norway, the
French FAC and CIDA (World Bank 1989c). 21. Education components in noneducation projects totaled US$908.4 million in fis-
cal year 2005, compared with US$1.95 billion channeled through projects in the educationsector itself.
22. Social Funds were established in Guinea in 1989, in Sao-Tome & Principe andZambia in 1991, Madagascar and Rwanda in 1993, Comoros and Burundi in 1994, Angola,Eritea and Ethiopia in 1996, Malawi in 1997, Mali, Benin and Zimbabwe in 1998, Togo andGhana in 1999, Angola, Lesotho and Tanzania in 2000, Nigeria and Senegal in 2001,Uganda in 2002, Kenya in 2005, and in the Central Africa Republic in 2007.
23. This pattern is common to all demand-driven approaches. The demand-driven, EU-financed Micro-Projects Program also finds that education is the first sector, absorbing25 percent of the resources (EDA 2006).
24. The comparison is with central governments when they used NCB, and NGOs whenthey act as contractors or CMAs.
25. See World Bank Aide-memoires of the Project supervision missions. 26. During the first phase of the Ugandan School Facility Grant 1998–2002.27. Danida, DFID, Finland, Ireland, Netherland, Norway and the government are com-
monly financing the Basic Education Sub-Sector Plan—BESSIP (Group 5 2006a) 28. The EU-financed MPP started in 1985, joined with the IDA-financed Social Recov-
ery Project in 1991 and separated when it transformed into ZAMSIF in 2001. It disbursesdirectly to communities.
29. And also South Africa, but this country is not part of this study.30. In Uganda, delegation to LGs under the SGF started in 2002 after a community
empowerment phase in 1998–2002.31. In 2006, the MoE in Guinea delegated part of the school construction program to
rural local governments comprising 113 classrooms and other facilities under the VillageCommunities Support Program (World Bank 1999d). In Senegal, this approach was imple-mented between 2000–06 under the IDA-financed National Rural Infrastructure Project(World Bank 1999g).
108 • School Construction Strategies for Universal Primary Education in Africa

Procurement and Contract Management • 109
32. Local governments in Mauritania have delegated the management of infrastructureprograms to AMEXTIPE since 1997. School construction represented 28 percent of the 149projects managed by AMEXTIPE (World Bank 2002). In Senegal, under the IDA-financedUrban Development Projects, local governments have delegated their construction pro-grams to AGETIP.
33. The technical specialist is hired before the community launches the local competi-tive biding for works. He plays the role of community adviser for the procurement of works,including finalization of the bidding documents; subsequently, he controls the quality andcertifies the execution of the works before the community pays the contractor. The contractfor works includes provisions for laboratory tests of the quality of the concrete.
34. However, a relatively large proportion of the variation in unit cost is still unex-plained (R2 is 60 percent). This suggests that there may be additional factors—project- orcountry-specific—that affect the costs; factors that we have not been able to capture in theregression analysis owing to very limited project information (omitted variables) or the useof proxies that reflect poorly what we are trying to measure (measurement error). It couldalso indicate that a fair proportion of the variation in construction costs is random, ordepends on factors, such as the skills of the persons managing the processes, that are veryhard to measure.

111
Setting up Community Management
CHAPTER 6
The evidence shows that communities have a long history of self-help and havebuilt many of their own schools throughout the years. They are highly capableof doing much better, with some help and resource transfer.
Community-based programs can work under various management arrange-ments. Nevertheless, policy makers often believe that community-basedapproaches are too complicated to set up relative to centrally managed schoolconstruction programs and they worry about accountability and communitycapacity. Yet experience proves otherwise. When accountability mechanisms areadequate and when communities are empowered, community-based programsare highly successful. Experience across countries with the Community-DrivenDevelopment (CDD) approach provides useful lessons in how to set up community-based programs that address these issues.
Community-Driven Development is a term used by the World Bank to charac-terize investment programs that support decentralization. CDD programs aimto set up appropriate accountability mechanisms within a decentralized environ-ment and strengthen community choice and empowerment in implementingsmall-scale infrastructure programs. CDD projects give more responsibility tocommunities than Community-Based Development (CBD), particularly overresources and decisions in projects’ design and implementation. In the Bank, theproportion of CBD/CDD projects has increased from 2 to 10 percent of total lend-ing between 1989 and 2003, with more emphasis on CDD in recent years, andtheir outcome ratings have been better than those of non-CBD/CDD projects. Thelargest share of CDD projects is in Africa, and CDD projects in education do betterthan in other sectors (OED 2005c). The application of the CDD model to schoolconstruction provides considerable guidance on how to set up a CDD approachthat addresses the dual concerns of accountability and community empowerment.In a CDD approach, accountability is strengthened in two main ways—through aclear definition of the roles and accountabilities of the stakeholders involved, andthrough monitoring and evaluation and information flows. Empowerment is

fostered through community organization, full information, appropriate proce-dures, and capacity development. The implementation scheme is illustrated in fig-ure 6.1. Other specific type of implementation schemes in Uganda can be foundin Appendix 8.
The use of the CDD approach for the school construction program addressesissues that may be considered within a broader policy framework. The followingsection discusses the role of actors, organization and procedures, and capacitybuilding needed for this approach.
ACCOUNTABILITY
ROLES OF STAKEHOLDERS
The CDD approach considers that school construction is the coproduction offour actors—Ministries of Education (MoEs), local governments, communities,and the private sector, which is contracted by communities to build the schools
112 • School Construction Strategies for Universal Primary Education in Africa
Figure 6.1 The CDD Scheme for School Construction
cen
tral
ized
semipublic andNGO sectors
private sector
Finances Community Subproject
dec
entr
aliz
ed
Centralgovernment
public private
Localcommunity
Schoolcommunity
government communities
Largenational
contractor
Localgovernment
Mediumcontractor
Smallcontractor
contractworks
executesthe works
contributesto the works
expressesneeds
Village/neighbor-
hood
Schoolinstitution School
building
FiscalTransfer
Source: Author’s figure.

Setting up Community Management • 113
and provide technical supervision of the contracted works (figure 6.2). Eachhas its role to play in the project cycle as follows. Appendix 11 summarizesthese roles according to key stages in the project cycle.
The Ministry of Education plays a strategic, policy-setting, financing, capacity-building, and regulatory role. It
• establishes norms and criteria to allocate financial and human resources to relieveobstacles to primary education for all and reduce disparities;
• establishes school planning norms, school models, and architectural and construction norms that facilitate implementation by local governments andcommunities. Box 6.1 shows a list of essential norms;
• adjusts the roles of MoE branch office staff from construction implementers totechnical advisers of local governments and communities;
• mobilizes adequate funding for education as a whole, which requires success-ful negotiations with Ministries of Finance, parliaments, and donors;
• sets up reliable procurement and financial management procedures andaccountability mechanisms to be followed by all actors;
• establishes appropriate targeting strategies to reach disadvantaged communities;• establishes technical and financial norms for maintenance;
Figure 6.2 School Construction in a CDD Approach: Main Responsibilities of the Four Actors
Ministry ofEducation
Sets the rulesof the game
and monitors their application
Localgovernments
delegate schoolconstruction to
communities throughcontractualagreements
Communitiesimplementtheir schoolconstruction
project
Private sectorexecute the works,supplies materials
and services tocommunities
Schoolbuilding
Source: Author’s figure.
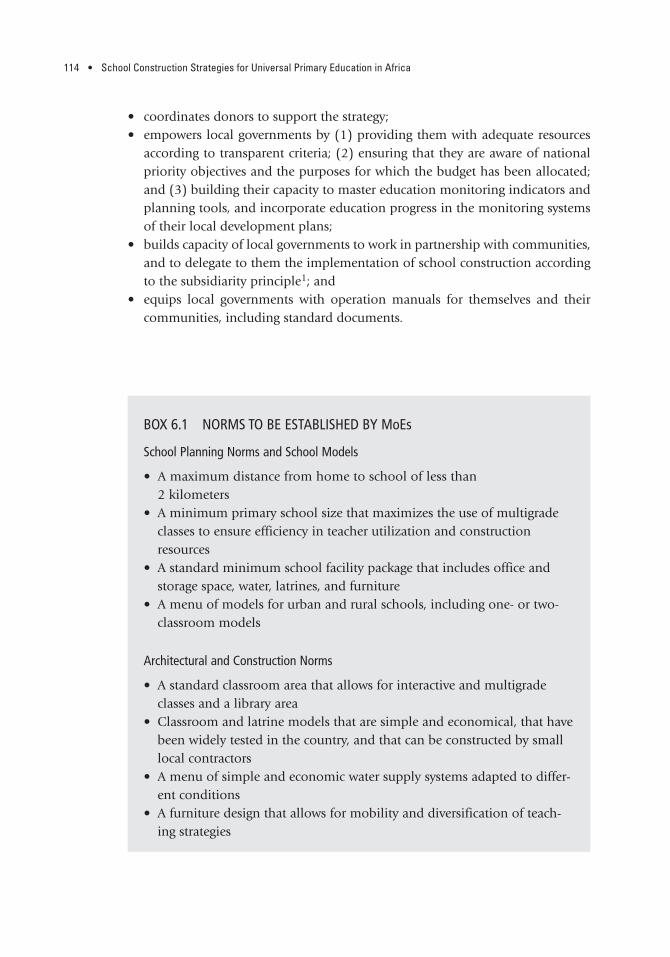
114 • School Construction Strategies for Universal Primary Education in Africa
• coordinates donors to support the strategy;• empowers local governments by (1) providing them with adequate resources
according to transparent criteria; (2) ensuring that they are aware of nationalpriority objectives and the purposes for which the budget has been allocated;and (3) building their capacity to master education monitoring indicators andplanning tools, and incorporate education progress in the monitoring systemsof their local development plans;
• builds capacity of local governments to work in partnership with communities,and to delegate to them the implementation of school construction accordingto the subsidiarity principle1; and
• equips local governments with operation manuals for themselves and theircommunities, including standard documents.
BOX 6.1 NORMS TO BE ESTABLISHED BY MoEs
School Planning Norms and School Models
• A maximum distance from home to school of less than2 kilometers
• A minimum primary school size that maximizes the use of multigradeclasses to ensure efficiency in teacher utilization and constructionresources
• A standard minimum school facility package that includes office andstorage space, water, latrines, and furniture
• A menu of models for urban and rural schools, including one- or two-classroom models
Architectural and Construction Norms
• A standard classroom area that allows for interactive and multigradeclasses and a library area
• Classroom and latrine models that are simple and economical, that havebeen widely tested in the country, and that can be constructed by smalllocal contractors
• A menu of simple and economic water supply systems adapted to differ-ent conditions
• A furniture design that allows for mobility and diversification of teach-ing strategies

Setting up Community Management • 115
In the CDD approach, local governments (LGs)
• develop and implement local development plans, incorporating the Millennium Development Goals and other national priorities in local plans;
• analyze essential information on education trends in the jurisdiction andassess the gaps;
• mobilize communities and build their capacity to identify, prepare, and sub-mit a request for financing, and to implement school construction projects;
• enter into a financing agreement (FA) with communities to build their schools; • appraise and approve the community projects against the norms established
by the MoE and against the eligibility criteria for inclusion in the local gov-ernment development plans;
• legally provide the land for the school as required;• monitor the execution of the FA by the communities;• incorporate the school facilities in a patrimonial accounting system; and• budget annually for maintenance.
Communities organize themselves, identify their education needs, and prepareand implement their school construction projects through an inclusive participa-tory approach. They submit a request for financing their school project, sign an FAwith the funding agency, manage the funds allocated, as well as the procurementof works, goods, and technical services for work supervision from the local privatesector, using simplified procurement procedures. The request for financing shouldbe based on a standard form provided by the MoE, and should include certainbasic elements listed in box 6.2. They sign, monitor, and pay the contracts forworks on the basis of the certification of good execution provided by the techni-cal site supervisor. They report to the local government on the FA execution.
BOX 6.2 ESSENTIALS FOR A COMMUNITY REQUEST
• Number of classrooms and other facilities for which financing isrequested
• Justifications (including estimates of need based on the school-age population), enrollment, distance to school, number of children perclassroom, status of existing facilities and use of multigrade or double-shift teaching, and community commitment to enroll all children
• Standard drawings with technical specifications and estimated cost• Composition of the Community Development Committee and the
Project Management Committee, with minutes of the decision meetingsfor their creation

116 • School Construction Strategies for Universal Primary Education in Africa
INFORMATION, MONITORING, AND EVALUATION
Maintaining an appropriate level of accountability in a CDD approach hinges toa great degree on information. First is the transparent information about the rolesand responsibilities, and how the program is intended to function. Second, mon-itoring and evaluation provide a second source of information critical to all stake-holders. Monitoring and evaluation (M&E) are also essential in a learning-by-doing approach to provide information on areas in need of improvement.
In a CDD approach, monitoring and evaluation involve both the MoE andlocal governments in an integrated system. MoEs need to help local governmentsuse education statistics and evaluate progress relative to established goals. Thisrequires that the MoE disaggregate its data to report on education performance ineach local government area and, if possible, at the ward or village level. Local gov-ernments also need to inform the MoE and communities regarding their per-formance. The M&E system should also track the flow of funds to local govern-ments and communities, and conduct cost-effectiveness analyses to determinewhether the government’s approach is more (or less) cost-effective than compara-ble interventions by other actors.
MoEs should promote quantitative and qualitative evaluation. The first groupshould include multivariate regression analysis to control for possible observablecharacteristics that distinguish participant communities in school construction programs and nonparticipant ones, or double difference analysis (or difference-in- difference analysis) to compare participating communities with comparison com-munities. Qualitative studies should use focus groups, participant observation, andcase studies to provide information on processes, behaviors, and conditions in par-ticipating communities.
COMMUNITY EMPOWERMENT
COMMUNITY ORGANIZATION
Community organization is a first critical step in the CDD process. To manage pub-lic resources, communities need to form legitimate community-based organizations(CBOs). CBOs may take various forms. In Mauritania, for example, this role has
• Community bank account information • Agreement to use simplified procurement procedures agreed upon by
the MoE and LGs, and a procurement plan• The community’s contribution to the project and for maintenance

Setting up Community Management • 117
been played by parents’ associations. In Social Fund projects, this role has beenplayed by preexisting CBOs, such as women farmers’ associations, even if educa-tion is not their main objective. Although the World Bank does not require legal-ization of the community group, national laws and regulations may require it toallow the CBO to receive and manage public funds (De Silva 2002).
In all countries, national legislation generally provides the formal rules thatlegitimate such organizations. These include decentralization laws, public workslaws, delegation of public works management, and financial laws and regulations.In many countries, legislation already provides for community-based formal rep-resentative bodies to enter into formal agreements with local governments tomanage public funds. These include, for example, village and ward developmentcommittees in Tanzania, village and parish councils in Uganda, and village coun-cils in Mali (UNCDF 2006). In other countries, these laws and regulations mayrequire amendments to allow communities to manage public funds. In Benin, forexample, the laws regulating civil society organizations allowed communities toorganize themselves as “associations.” However, under the 2001 Public WorksContract Management Delegation Law, conceived as a framework for contractmanagement agencies (CMAs), the management of public funds for infrastructureprojects could not be delegated to community associations. As a result, the Gov-ernment of Benin revised this law in 2004 to allow local community associationsto act as local contract management agents for the construction of small-scale localinfrastructures by delegation from communes, thus enabling the implementationof a CDD program (World Bank 2004c).2
An approach that has been adopted by numerous countries, and that hasworked well, is for the community to organize two committees—a CommunityDevelopment Committee (CDC), which acts as the CBO, and a Project Manage-ment Committee (PMC). The CDC is the legal body responsible for the schoolproject, enters into the FA with the funding agency on behalf of the community,and is accountable for the use of the funds. The CDC also organizes a Commu-nity Tender Board, which is composed of community members with gender parity and inclusion of the disabled, and whose sessions are open to publicattendance. The PMC is a small committee composed of about four people,responsible for planning, procurement, and day-to-day project management, andis accountable to the CDC and community at large. Awarded contracts are mon-itored by the PMC, which posts the progress of payments in a public area acces-sible to all community members.
APPROPRIATE PROCEDURES
An FA and simplified procurement procedures are key elements in the process offacilitating community empowerment.

118 • School Construction Strategies for Universal Primary Education in Africa
The financing agreement supports community empowerment by “contractual-izing” the roles and responsibilities of local governments as funders, and commu-nities as implementers. Through the FA, the community commits itself to buildthe facilities according to standard drawings and within an agreed maximum cost.The community manages the funds and the procurement of goods and services. Itpays the contractor on the basis of certification of works by an engineer that is alsocontracted by the community to supervise the site-works. In turn, the fundingagency commits itself to disburse the funds to the community in installments, onthe basis of progress. A summary of the content of an FA between a communityand local government is displayed in box 6.3.
Simplified procurement procedures are also fundamental to a CDD approach.The main goals of procurement procedures are to ensure economy and efficiencyin procurement, safeguard transparency in the procurement process, ensure eligi-ble bidders a fair opportunity to compete, and encourage the development ofdomestic contracting. Some countries lack an adequate National ProcurementCode, and when they have one, it lacks appropriate provisions for procurementby local government or community organizations (De Silva 2000).
Recognizing this gap, some donor agencies have developed specific procure-ment guidelines for community contracting. For example, the World Bank providesgeneral and specific guidelines. Its general guidelines allow for the adaptation ofthe procurement procedures, specifications, and contract packaging when it isdesirable to call for the participation of local communities or non-governmentalorganizations in the delivery of services. The guidelines also allow for situationswhen it is desirable to increase the utilization of local know-how or materials, oremploy labor-intensive or other appropriate technologies (World Bank 2004l).3
Consistent with this policy, the World Bank has issued several publications withspecific guidance to support implementation of community contracting and fund
BOX 6.3 ESSENTIAL ELEMENTS OF A FINANCIAL AGREEMENT
• Standard drawings and technical specifications• A procurement plan, including estimated contract value and simplified
procurement methods• Models of simplified bid documents and contracts with contractors and
site supervisors • A schedule for payment of the grant, in installments according to physi-
cal progress of the works• Models of reports to be provided by the community to support its
requests for payments

Setting up Community Management • 119
management in projects it finances.4 The key features of community procurementare described in box 6.4. These procedures should be made explicit in a programhandbook for management of the program and forthe participating communities (De Silva 2002).
CAPACITY BUILDING
Capacity building across all stake holders is essential fora CDD or any community-based approach to work.Capacity building through information and specifictraining needs to be built in.
Ensuring broad provision of all the necessary infor-mation, such as operation manuals, standard designs,model FAs and contracts, and lists of competent localcontractors and site supervisors is fundamental. Suc-cessful experiences show that several documents can
BOX 6.4 COMMUNITY-BASED PROCUREMENT: KEY FEATURES
Tools and Documents
• Operation manual and community handbook• Simplified invitation to bid form• Simplified bidding document with standard design and specifications as
provided by the MoE• Simplified contract
Procurement Methods
• Local competitive bidding with local advertisement for works• Three price quotations for works or goods, or both• Shortlist of consultants for site supervision (generally provided by local
government or other funding agency)
Procedures
• Invitation to bid form posted in local public places (trees, buildings)• Community Tender Board with gender parity and inclusion of handi-
capped people• Public community information on offered prices and contracts awarded,
including the contract amount and payments when made
Figure 6.3 Senegal Social Fund Hand-book Illustration for Training Communitiesin Establishing a Community DevelopmentCommittee
Source: AFDS 2002; drawing by Aly Nguer.
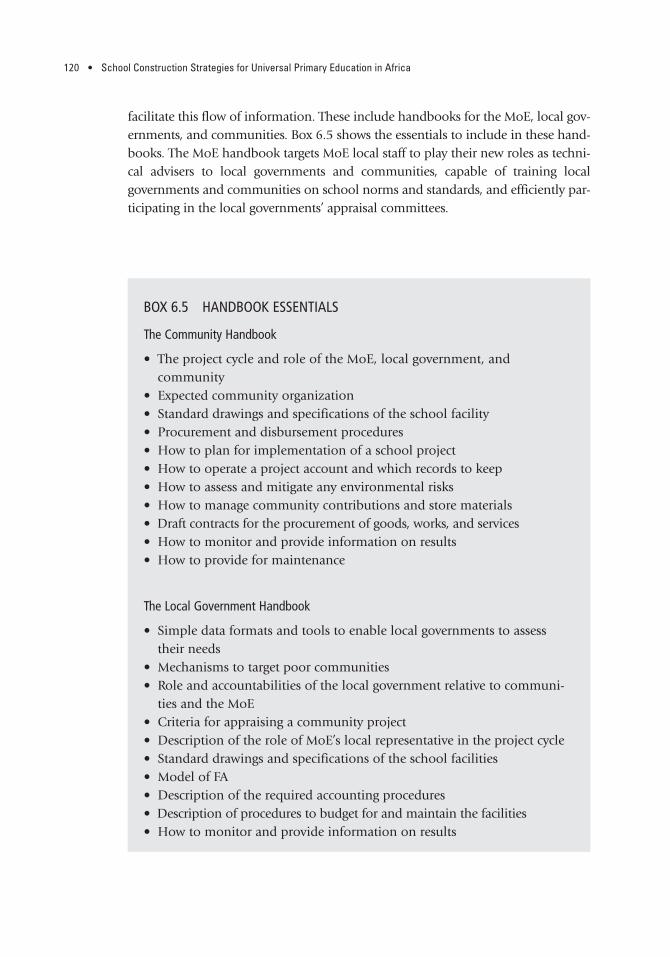
120 • School Construction Strategies for Universal Primary Education in Africa
facilitate this flow of information. These include handbooks for the MoE, local gov-ernments, and communities. Box 6.5 shows the essentials to include in these hand-books. The MoE handbook targets MoE local staff to play their new roles as techni-cal advisers to local governments and communities, capable of training localgovernments and communities on school norms and standards, and efficiently par-ticipating in the local governments’ appraisal committees.
BOX 6.5 HANDBOOK ESSENTIALS
The Community Handbook
• The project cycle and role of the MoE, local government, and community
• Expected community organization • Standard drawings and specifications of the school facility• Procurement and disbursement procedures• How to plan for implementation of a school project• How to operate a project account and which records to keep • How to assess and mitigate any environmental risks• How to manage community contributions and store materials• Draft contracts for the procurement of goods, works, and services • How to monitor and provide information on results • How to provide for maintenance
The Local Government Handbook
• Simple data formats and tools to enable local governments to assesstheir needs
• Mechanisms to target poor communities • Role and accountabilities of the local government relative to communi-
ties and the MoE• Criteria for appraising a community project • Description of the role of MoE’s local representative in the project cycle• Standard drawings and specifications of the school facilities• Model of FA • Description of the required accounting procedures• Description of procedures to budget for and maintain the facilities • How to monitor and provide information on results
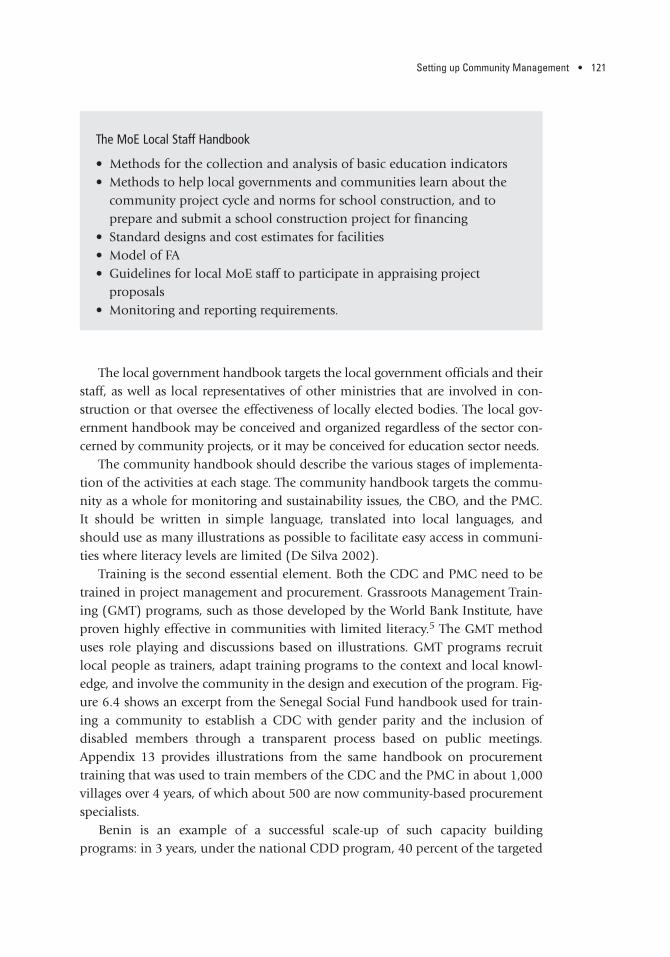
Setting up Community Management • 121
The local government handbook targets the local government officials and theirstaff, as well as local representatives of other ministries that are involved in con-struction or that oversee the effectiveness of locally elected bodies. The local gov-ernment handbook may be conceived and organized regardless of the sector con-cerned by community projects, or it may be conceived for education sector needs.
The community handbook should describe the various stages of implementa-tion of the activities at each stage. The community handbook targets the commu-nity as a whole for monitoring and sustainability issues, the CBO, and the PMC.It should be written in simple language, translated into local languages, andshould use as many illustrations as possible to facilitate easy access in communi-ties where literacy levels are limited (De Silva 2002).
Training is the second essential element. Both the CDC and PMC need to betrained in project management and procurement. Grassroots Management Train-ing (GMT) programs, such as those developed by the World Bank Institute, haveproven highly effective in communities with limited literacy.5 The GMT methoduses role playing and discussions based on illustrations. GMT programs recruitlocal people as trainers, adapt training programs to the context and local knowl-edge, and involve the community in the design and execution of the program. Fig-ure 6.4 shows an excerpt from the Senegal Social Fund handbook used for train-ing a community to establish a CDC with gender parity and the inclusion ofdisabled members through a transparent process based on public meetings.Appendix 13 provides illustrations from the same handbook on procurementtraining that was used to train members of the CDC and the PMC in about 1,000villages over 4 years, of which about 500 are now community-based procurementspecialists.
Benin is an example of a successful scale-up of such capacity building programs: in 3 years, under the national CDD program, 40 percent of the targeted
The MoE Local Staff Handbook
• Methods for the collection and analysis of basic education indicators • Methods to help local governments and communities learn about the
community project cycle and norms for school construction, and to prepare and submit a school construction project for financing
• Standard designs and cost estimates for facilities• Model of FA • Guidelines for local MoE staff to participate in appraising project
proposals • Monitoring and reporting requirements.

122 • School Construction Strategies for Universal Primary Education in Africa
villages in the country received GMT training and successfully implemented localprojects of their choice, 80 percent being schools (World Bank 2007a).6 On thebasis of this experience, the MoE decided in 2008 to move away from direct con-struction management and to use EFA-FTI funds to implement part of the schoolconstruction program using the CDD approach illustrated in figure 6.1 (Benin2008).7 Also, in the context of FTI, the Malagasy MoE decided in 2007 to developa demand-driven decentralized strategy for school construction by which localgovernments and communities will be implementers of school construction(MENRS 2007a). The community-based program illustrated in figure 6.4 will bealso used in 2008 to implement an emergency program to rebuild about 700 class-rooms destroyed by cyclones in February 2008.
The CDD approach also provides a model for defining responsibilities for mainte-nance.
• MoEs are responsible for setting up the rules of the game for maintenance,and ensuring that an adequate volume of resources flows to the maintenancefunding agencies.
Figure 6.4 Deconcentrated Planning, Community Empowerment, and Financing throughFiduciary Agency
cen
tral
ized
semipublic andNGO sectors
private sector
dec
entr
aliz
ed
LocalMoEoffice
public private government communities
planning
planning
provides financial resources and cap building
signs Financing Agreement
Localgovernment
Village
Schoolinstitution
Localcommunity
Schoolcommunity
Mediumcontractor
Smallcontractor
contractsworks
executesthe works
contributesto the works
expressneeds
Schoolbuilding
CentralMoE
Largenational
contractor
Memo-randumof Agree-ment
localcommunitiesexpressneeds
Fiduciaryagency
Source: Author’s figure.
Setting up Community Management • 123
• Where local governments are responsible for school maintenance and forthe management of financial resources for school maintenance transferredto them by the central government, they should contract with local commu-nities or school boards for the execution of maintenance activities, includingmanagement of maintenance funds.
• Communities (or school boards) should be responsible for day-to-daymaintenance and repair or rehabilitation works, using local governments’delegated financial resources, for which they are accountable to the localgovernments; in such a scheme, the head of school has a particular respon-sibility to develop the maintenance planning.
• The private sector is responsible for executing maintenance work under con-tracts with the communities’ school boards. The chapter on maintenanceof the 2004 AfDB Toolkit of Quality Education Project advises a similarapproach (African Development Bank Group 2004).
NOTES
1. Subsidiarity is an organizing principle that states that matters ought to be handledby the smallest, lowest, or least centralized competent authority.
2. Laws no. 2001–07 dated May 9, 2001, and no. 2005–07 dated April 8, 2005.3. See section 3.17.4. See Gopal 1995, Mbungu 1999, Cavero 2000, De Silva 2002, and World Bank 2002.5. The Grassroots Management Training (GMT) was developed in 1993 by the Eco-
nomic Development Institute (EDI), now World Bank Institute, and used since by BurkinaFaso, India, Mali, Malawi, Mauritania, Nigeria, Tanzania, and Senegal.
6. The targeted 40 percent number (1,500 villages). 7. The other part of the program is outsourced to CMAs.

125
School Maintenance
CHAPTER 7
The durability of school buildings not only results from design and quality con-struction, but also relies heavily on maintenance. Throughout Africa, mainte-nance of public facilities, including schools, is wanting. This lack of mainte-
nance not only erodes confidence in the education system, it also results in the needfor large and costly rehabilitation programs soon after the building is constructed.In African countries, classroom maintenance is compounded by the many class-rooms built by communities with local nonpermanent materials that require a highlevel of upkeep to keep them operational. In Chad, Senegal, and Guinea, for exam-ple, the World Bank estimates that between 13–20 percent of classrooms built withnondurable materials need urgent rehabilitation (World Bank 2001c, 2003b).
There are several reasons for this lack of maintenance on the part of the gov-ernment, donor, and community. On the government side, first, most countrieshave not established clear maintenance policies, strategies, or implementationarrangements. Second, governments rarely allocate sufficient financing for main-tenance, even when they have a maintenance policy preferring to allocateresources for new construction. In Senegal, maintenance was treated as a technicalproblem only. The MoE developed an excellent maintenance guide in the 1980sthat is still useful today. However, the cost of maintenance was never estimated,and the financing was never budgeted (DECS 1985). In other cases, to the extentthat resources are allocated for school maintenance, they are usually includedunder the broader budget line of “operations and maintenance” (O&M). To start,O&M budgets represent an insignificant share of recurrent education expenditure.Once utilities, chalk, paper, travel costs, and other recurrent expenditure are paid,nothing is left for maintenance. Third, when the countries’ decentralization lawsdevolve responsibility for maintenance to local governments, the correspondingfunds are rarely transferred from the central to local governments. Finally, animportant reason explaining the failure of school maintenance can be found inthe lack of clarity regarding who is the owner of the land on which the school isbuilt, particularly in a decentralized context. As a result, few African countries
have ever piloted maintenance programs, but instead offload maintenance ontocommunities.1
For their part, maintenance by communities rarely materializes. Communi-ties rarely assume this responsibility in the absence of financing because thecommitment of communities to maintain buildings that are governmentowned is often absent as communities consider that the buildings should bemaintained by the owner. This reluctance is likely to be more pronouncedwhen the quality of construction is low, thus requiring even more maintenance.Poor communities also have difficulty mobilizing the resources required, eitherdue to lack of organization or competing pressures on family and communitybudgets. If they had contributed to the construction of the school, they mayfeel that they have already made their contribution. Further, communities maynot understand the basic rules of maintenance and how to put this into prac-tice. According to a World Bank Impact Evaluation of Social Funds conductedin 2000, “there is a gap between the community declaring itself the owner ofthe project and understanding in theory the basic rules of maintenance, andputting all this knowledge into practice (OED 2002).” As a result, in projectswith maintenance components with communities, results are generally farfrom expectations (World Bank 1979, World Bank 1982).
Finally, there are the donors. Donors pour additional resources into rehabili-tation but never fix the maintenance problem. Few donor- supported projectsinclude a maintenance component. When they do, the component is limited tocapacity-building activities and limited pilots, but no project has ever succeededin scaling up maintenance activities and streamlining them into regular postpro-ject activities. Maintenance can hardly be financed through projects that are short-term, while maintenance is an ongoing recurrent expenditure that is best financedthrough the government budget to ensure sustainability. Most projects simplyassign school maintenance to the government, without an assessment of its feasi-bility. Donors also rarely evaluate their investments 10 to 15 years later, and con-tinue to finance rehabilitation of buildings that would not have been necessaryhad they been properly maintained.
The few tests that have been conducted have never lasted long and were notevaluated. Thus, experience from Africa provides few lessons. Asian and LatinAmerican countries have some experience. Only developed countries have propermaintenance policies. Box 7.1 presents the maintenance experience in Pakistan.
Overall, there is a deep knowledge gap regarding all aspects of school mainte-nance, and the present study, reflecting such a gap, is not able to provide the samelevel of information on maintenance strategies as on construction strategies.
Maintenance, however, does not pose an insurmountable cost. In the past, main-tenance was estimated to require a yearly budget of about 1 percent of the invest-ment cost (UNESCO 1986). More recent analysis in developed and developing
126 • School Construction Strategies for Universal Primary Education in Africa

School Maintenance • 127
BOX 7.1 BUDGETING FOR SCHOOL MAINTENANCE IN PAKISTAN
The 1972 nationalization of the primary schools ended the previouslong-term community commitment to school mainte nance, and it wasnot replaced with any clear maintenance policy. During the subsequent15 years without maintenance, the durable classrooms (“pucca”) deterio-rated so much that one-third were dilapidated and unusable, and anotherthird needed substantial repair. The World Bank subsequently financedthe following solutions.
A Third Primary Education Project (1987–96) for the Punjab provinceincluded development of a maintenance policy that resulted in a plan(1996) to release funds directly to communities with significant impacton community and teacher involvement in repair and maintenance.
A World Bank–financed Primary Education Development Program(1991–95) in the Sindh Province provided an increment to the 50 percentof the maintenance budget for the rehabilitation and maintenance ofabout 2,000 classrooms. This raised maintenance to 2 percent of the primary education recurrent budget. Community awareness increased as aresult of the establishment of PTAs empowered to manage recurrent funds,which included maintenance.
In Baluchistan province, the operation and maintenance budget(including classroom materials) was raised, in 1993, to 4 percent of thetotal recurrent costs managed by communities. Approximately 10,000 Parent-Teacher School Management Committees were formed. More than2,000 were trained, and more than 4,670 opened a bank account for nonsalary operating funds.
In the North-West province, the 1995 project planned a maintenanceannual budget of 1.5 percent of capital costs.
Sources: World Bank 1987c, 1990, 1993c, 1995a, 1995f, 1997, 2000b.
countries shows that maintenance needs to be assessed according to the buildingand the country context. In Africa, recent studies estimate yearly maintenancecosts for classrooms between 1.5 and 3 percent of the investment cost (Group 52006a, b, c, d, and e). In developed countries, schools hardly ever budget less than2.5 percent of the investment cost. Table 7.1 outlines a concrete approach to esti-mate the cost of classroom maintenance in Burkina Faso, and provides a good

128 • School Construction Strategies for Universal Primary Education in Africa
indication of the type, cost, and schedule of each maintenance activity, which canserve as a useful guide for other countries. In this case, the cost of classroom main-tenance is estimated at 1.8 percent of the initial capital investment per year. Usingthe same methodology, the annual cost in Ghana was estimated at 3 percent(Group 5 2006b). The CDD approach is a good model for distributing roles andresponsibilities in the management of maintenance resources.
Getting maintenance back on the radar screen will require a clear strategy of educat-ing donors, central and local governments, and communities about the significant coststhat neglect imposes in terms of renovation and replacement. Adequate volume ofresources need to be planned and mobilized by governments and transferred tolocal government budgets. The Bank and the EFA Fast Track Initiative Secretariatcan play a major role in this by making detailed infrastructure plans—with ade-quate investment and recurrent budgets—a required component of education sec-tor plans, with provision for regular stocktaking, preferably conducted by an inde-pendent agency.
As a first step, there is a need to build knowledge of actors and partners regard-ing maintenance.
NOTE
1. This is a long-standing tradition, beginning with Kenya’s “Harambee” movement inthe 1960s, which was emulated throughout Africa. The promise was that if communitiesbuilt and maintained the schools, government would follow up with teachers and books.
Table 7.1 The Cost of Maintenance
Annual maintenanceElement and Scope and % of total cost as % ofactivity interval cost construction cost
Floor screed; repairs 20% of area, 5 years 4.00 0.16
Plaster, internal/external; 10% of area, 5 years 4.00 0.08repairs
Painting walls 50% of area, 2 years 2.00 0.50
Painting doors, 100%, 5 years 1.50 0.30windows, trusses
Painting blackboard 100%, every year 0.25 0.25
Locks, hinges, bolts; replace 100%, 5 years 1.50 0.30
Roofing screws, fix 25%, 5 years 1.00 0.05and replace
Doors; replace 50%, 10 years 3.00 0.15
Total annual maintenance cost as percentage of construction costs 1.79
Source: Group 5 2006a, table 12.2, p. 28.
129
Corruption in School Construction
CHAPTER 8
Throughout the world, the construction sector consistently ranks as the mostcorrupt of any segment of a nation’s economy (Transparency International2005b). The scale of corruption in the construction sector is magnified by the
size of the sector, estimated globally at some US$3.2 trillion a year. Recent examplesof corruption in developed countries include the United Kingdom and France. In theUnited Kingdom, in 2005, the Office of Fair Trading announced its intention tointroduce measures to rid the construction industry of anticompetitive behavior(Dundas & Wilson 2005). In France, major construction enterprises were convictedin 2006 for bribing to obtain public contracts for school construction and trans-port.1 In New York City, past corruption in school construction is measured in thehundreds of millions of dollars (Klitgaard and Parris 2000). In Guinea, where corruption to obtain public contracts is high, construction contractors can pay anaverage of 20 percent of the contract value to obtain the contract. The total amountof bribes paid by private contractors to civil servants was estimated to amount to9.3 percent of gross national income in 2003 (ANLC 2005).
One reason that community-based programs are significantly more costeffective than other approaches to school construction management may be thatfewer resources are wasted through corrupt practices. Although we do not havethe data to test this hypothesis, based on prevailing theory, research, and expe-rience, we posit that the greater cost effectiveness is at least partly attributable tocertain implementation aspects of community-based programs that are not pres-ent in the other management methods. These include community participation, decentralized and competitive procurement processes, the flow and transparencyof information, and the ability to appoint and fire the managers for which community-based programs have developed effective mechanisms.
Becker and Stitgler 1974 (cited by Olken 2005), for example, consider com-munity participation key to reducing corruption since community members havebetter incentives to monitor the progress and quality of the works than do bureau-crats because communities benefit from the service. Transparency International

concludes that centralized procurement offers greater opportunity for corruption.In its 2005 Global Corruption Report, Transparency International reported thatlarge, centralized capital-intensive projects offer decision makers more scope forkickbacks, bureaucratic control, and political prestige than decentralized community-based projects. Such projects also offer greater scope for private gainthan does the rehabilitation of existing infrastructure. Further, Becker and Stigler(1974) argue that monitoring and punishment alone have not succeeded in reduc-ing corruption because those who regulate and punish are corruptible themselves.
In school construction, corruption is also facilitated by other practices that limitcompetition and accountability. These include direct contracting, packaging worksinto large bid packages, setting qualification requirements too high, and weak pub-lic accountability. Box 8.1 contrasts these facilitating factors with community-basedapproaches that limit corruption more effectively.
Direct contracting, or sole-source procurement, is a method that provides thegreatest scope for kickbacks because there is no competition. This approach wascommon in Africa during the 1980s and early 1990s. In Senegal, for example, a1993 review of government procurement practices showed that direct contract-ing represented 51 percent of the contracts awarded and 59 percent of theircumulative value (World Bank 1993d). A second common procurement practiceduring this time, which still continues today, is the packaging of numerousschools into one or a few large bid packages. This approach limits competitionbecause the enterprise security deposit and capital and turnover requirementsneed to be high to ensure that the enterprise has the capacity to deliver the fullpackage of works. Only large enterprises that meet these requirements can com-pete effectively, which offers greater scope for collusion and bribery. As we sawwith school construction, during the 1970s and 1980s in many African coun-tries, public procurement for works was controlled by cartels of a few large, oftenforeign, contractors because the eligibility criteria were such that only they couldqualify. Research done in Mauritania in the late 1980s showed that for low-costhousing, these few contractors broke down large contracts into medium-size lots(20–30 units) and (illegally) subcontracted these lots at two-thirds the initialprice to medium-size contractors, who in turn subcontracted smaller lots of3–5 units to smaller contractors in the informal sector. These in turn subcon-tracted some of the buildings to individual “tâcherons,” who in the end built thehousing units at one-fourth the initial contract price (Theunynck 1984). Exam-ples of this can be found worldwide.
In addition to the cost advantage that results from community-based procure-ment, community-based programs have also achieved greater transparency andaccountability throughout the construction process, from the delivery of fundsto the completion of the works. Community-based programs have developedeffective mechanisms to ensure a free flow of information among community
130 • School Construction Strategies for Universal Primary Education in Africa
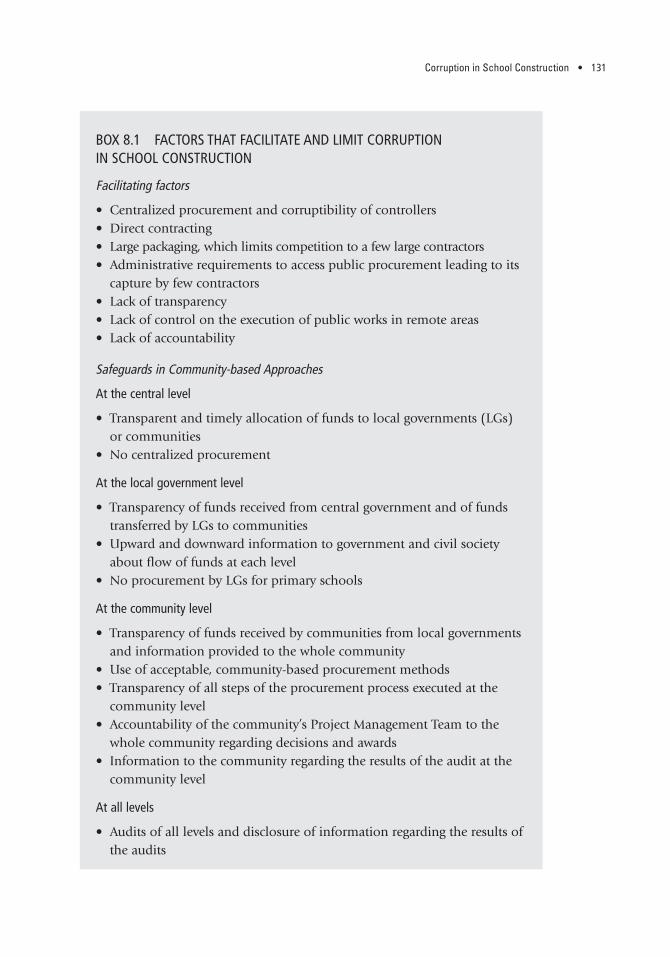
Corruption in School Construction • 131
BOX 8.1 FACTORS THAT FACILITATE AND LIMIT CORRUPTIONIN SCHOOL CONSTRUCTION
Facilitating factors
• Centralized procurement and corruptibility of controllers• Direct contracting• Large packaging, which limits competition to a few large contractors• Administrative requirements to access public procurement leading to its
capture by few contractors• Lack of transparency • Lack of control on the execution of public works in remote areas• Lack of accountability
Safeguards in Community-based Approaches
At the central level
• Transparent and timely allocation of funds to local governments (LGs)or communities
• No centralized procurement
At the local government level
• Transparency of funds received from central government and of fundstransferred by LGs to communities
• Upward and downward information to government and civil societyabout flow of funds at each level
• No procurement by LGs for primary schools
At the community level
• Transparency of funds received by communities from local governmentsand information provided to the whole community
• Use of acceptable, community-based procurement methods • Transparency of all steps of the procurement process executed at the
community level• Accountability of the community’s Project Management Team to the
whole community regarding decisions and awards• Information to the community regarding the results of the audit at the
community level
At all levels
• Audits of all levels and disclosure of information regarding the results ofthe audits

132 • School Construction Strategies for Universal Primary Education in Africa
BOX 8.2 APPROACH TO LIMIT CORRUPTION AT THE COMMUNITY LEVEL:THE SENEGAL SOCIAL FUND
General information
• Regional offices publish the list of approved community projects, includ-ing type of project and financial allocations
• Regional offices create, update, and provide to communities a list ofcompetent expertise for site supervision
Socialization and inclusion
• Villagers learn their rights, how to exert them, and improve their man-agement capacity though grassroots management training
• Women and handicapped villagers are systematically included in allmeetings and committees
Community control and simplicity
• Communities manage the funds and the procurement process using sim-plified procedures
• A group of five persons, mainly female, is put in charge of controllingthe respect of procedures
Transparency
• All financial information is made public and remains accessible in apublic display
• Invitations to bid are locally displayed in public (rural radios, posted ontrees, school doors, and so on)
• Bid evaluations are opened in public and bid evaluation and award arealso made in public
• Information to community of awarded contracts and payments to contractors
members regarding the funds received, the procurement process itself, how thefunds were spent, and the resulting quality of the works.
Box 8.2 shows the mechanisms applied in the Senegal Social Fund imple-mented during 2000–05 in 1,000 villages, which was effective in limiting corrup-tion. Five cases of misuse of funds were reported and resulted in reimbursementand blacklisting of the culprits by the communities. More than 600 procurement

Corruption in School Construction • 133
specialists were trained and about 250,000 residents were informed of the project’sfinancial and procurement procedures. The procurement training module alsoincluded role-plays on corruption to make it appropriate to talk about, and facilitate discussion on, how to mitigate this risk.2 In Indonesia, the KecamatanDevelopment Project also implemented some of these approaches in more than20,000 villages where levels of corruption were high, with significant results in lim-iting corruption (World Bank 2004a). Section 7 lays out these processes in moredetail.
External audits are essential to contain corruption. A 2005 experiment, con-ducted in Indonesia in more than 600 villages that carried out small road projects,showed that the threat of being audited reduced unaccounted-for expenditure byabout 8 percentage points, an amount largely superior to the cost of the audit.Increased monitoring by villagers also reduced corruption on wages paid (Olken2005).
NOTES
1. Between 1990–1997, 34 construction contractors in France, including the threelargest (Bouygues, Vinci, and Eiffages) participated in price-fixing on works for schools and
Limited discretion
• All works are procured through open local competitive bidding• All goods are procured through comparison of at least three quotations• Technicians for site supervision are hired though competition of short-
listed competent specialists accredited by the Social Fund
Accountability mechanisms
• Regular village meetings to account for funds• A village subcommittee is assigned to monitor proper use of funds• Sanctions by community on misusers of funds• External audits did not qualify any community project
Monitoring and follow-up
• Regular project monitoring by community• Training of communities on use and maintenance of facilities built
134 • School Construction Strategies for Universal Primary Education in Africa
transport in the region of Île-de-France. Contracts worth about 1 billion euros (US$1.2 bil-lion) were parsed out among the three. They were convicted in March 2006 and ordered topay 40.5 million euros (US$60 million) in fines (www.Batiactu.com, March 22, 2006). Thesystem also involved political corruption. A levy of 2 percent on all contracts was paidto finance the major political parties in the region, including the RPR (Rassemblementpour la République, the PR (Parti Républicain), the PS (Parti Socialiste), and the PC (Parti Communiste) ([email protected], March 17, 2005).
2. Using Grassroots Management Training methods.

135
The Donor Factor
CHAPTER 9
Most countries in Sub-Saharan Africa rely heavily on external aid to fundschool construction. For example, foreign aid constitutes 55, 90, and 100 per -cent of financing for school construction in Senegal, Mauritania, and
Chad, respectively. As a result, donors have exerted a significant influence on school infrastructure programs, from school designs to implementation arrangements, andare a main contributing factor to the many inefficiencies found in school construc-tion programs throughout Sub-Saharan Africa.
With few exceptions, the bulk of aid for school construction is deliveredthrough a multitude of stand-alone projects, characterized by project-specificschool designs, procedures, unit costs, and reporting requirements. Separate Proj-ect Implementation Units (PIUs) are often an integral part of this approach.School construction programs, in particular, have historically offered some of thestrongest arguments in support of PIU management, owing to the need for tech-nically competent project management staff and flexibility to recruit them at amarket wage.
The use of PIUs and the project approach more generally, however, have someproverbial weaknesses. They undermine government leadership, create high com-pliance costs for recipient governments, disperse limited government capacity, facil-itate policy fragmentation, and duplicate efforts. Further, a 2005 World Bank reporton capacity building in Africa concludes that, although PIUs have promoted rapidand efficient project implementation, they have undermined long-term institutionaldevelopment (World Bank, OED 2005a). In school construction, a particularlyinsidious outcome of the widespread use of a project approach has been a system-atic failure on the part of countries and donors to learn from experience, resultingin the perennial resurrection of failed strategies.
There has never been a more favorable time for change. Recent global commitments promise to radically transform the way most aid is delivered. TheMillennium Development Goals (MDGs) adopted in 2000 set clear targets for
eradicating poverty and other human deprivations, including lack of basic edu-cation. The Monterrey Consensus of 2002 stressed the mutual accountability ofdeveloped and developing nations in reaching these goals by increasing financ-ing and improving the effectiveness of aid. The Paris Declaration on Alignmentand Harmonization, signed by more than 90 countries in 2005, lays out specificcommitments of developed and developing countries to improve the effectivenessof aid through progress on country ownership, donor alignment with country priorities, and donor harmonization of procedures and reporting requirements,eliminating tied aid and strengthening mutual accountability in the achievementof these goals. Finally, the Education For All-Fast Track Initiative (EFA-FTI) hastranslated these global agreements into a global compact among countries anddevelopment partners to reach the MDG of universal completion of primary edu-cation for all children by 2015.
Prior to these agreements, sectorwide approaches had already been takingshape in many countries. Sectorwide approaches (SWAPs) provide a frameworkto facilitate collaboration and harmonization with country-led priorities andcountry systems. SWAPs are typically characterized by strong government own-ership, agreed policy and expenditure frameworks, pooled resources (often inthe form of sector budget support), a focus on monitoring and results, and harmonization of partner agency and government procedures for procurementand disbursements. (Refer to box 9.1 for the characteristics of sectorwideapproaches.)
These global initiatives, particularly the EFA-FTI, provide an unprecedentedopportunity to transform how aid is delivered in education, including for schoolconstruction. As a result of these agreements, many donors are moving moredeliberately to harmonize procedures and processes at the country level, startingat a minimum with using joint analytical work, common review and reportingrequirements, and aid aligned with a country’s national poverty reduction strategy.At the same time these donors work toward the use of country systems to disburseaid flows.
The 2004 EFA-FTI Status Report notes that SWAPs and budget support are anincreasing trend in the education sector across countries. Of 75 internationaldevelopment association-eligible countries for which data were available, half(38) are reported to either have sectorwide programs or are developing one.Further, in most countries, donors are aligned around the government’s sectorprogram (EFA-FTI Secretariat 2004). A 2004 study by the Organisation for Economic Co-operation and Development Development Assistance CommitteeWorking Party on Aid Effectiveness across 14 countries supports the conclusionthat the education sector has made significant progress in aligning donor support with one national program.
136 • School Construction Strategies for Universal Primary Education in Africa
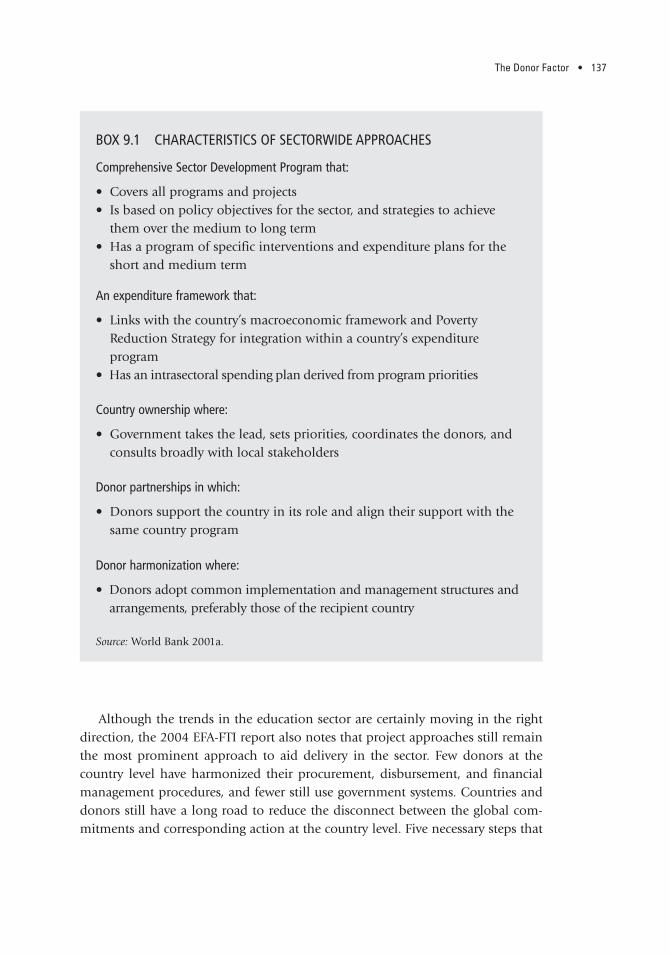
The Donor Factor • 137
Although the trends in the education sector are certainly moving in the rightdirection, the 2004 EFA-FTI report also notes that project approaches still remainthe most prominent approach to aid delivery in the sector. Few donors at thecountry level have harmonized their procurement, disbursement, and financialmanagement procedures, and fewer still use government systems. Countries anddonors still have a long road to reduce the disconnect between the global com-mitments and corresponding action at the country level. Five necessary steps that
BOX 9.1 CHARACTERISTICS OF SECTORWIDE APPROACHES
Comprehensive Sector Development Program that:
• Covers all programs and projects• Is based on policy objectives for the sector, and strategies to achieve
them over the medium to long term• Has a program of specific interventions and expenditure plans for the
short and medium term
An expenditure framework that:
• Links with the country’s macroeconomic framework and Poverty Reduction Strategy for integration within a country’s expenditure program
• Has an intrasectoral spending plan derived from program priorities
Country ownership where:
• Government takes the lead, sets priorities, coordinates the donors, andconsults broadly with local stakeholders
Donor partnerships in which:
• Donors support the country in its role and align their support with thesame country program
Donor harmonization where:
• Donors adopt common implementation and management structures andarrangements, preferably those of the recipient country
Source: World Bank 2001a.
138 • School Construction Strategies for Universal Primary Education in Africa
countries and development partners must take to improve the effectiveness of aidfor school construction are:
• Embrace a program-based approach to school construction, with country gov-ernments taking the lead in defining their construction strategies and donorsaligning their support with this strategy.
• Phase out PIUs.• Learn from the more than 30 years of experience in school construction within
the country and make good use of communities and the private sector.• Pool donor resources to support the strategy.• Harmonize with the country’s decentralization framework when that is
appropriate.

139
Framework for Action
CHAPTER 10
This extensive analysis of the history of school infrastructure in Sub-SaharanAfrica has shown that the availability and quality of infrastructure are a criti-cal component of reaching the Millennium Development Goals and the
scope of the needs are considerable. To accommodate all primary school-age children in safe environments, we esti-
mated that the 33 International Development Association-eligible countries inSub-Saharan Africa will need to construct an estimated 2 million classrooms by2015 (table 10.1). They will also need to equip new schools with adequate latrinesand water, while retrofitting about half the existing ones to the required level, andwith a minimum of auxiliary facilities, such as offices and storages. They will needto adapt all classrooms and one sanitation box in each school for access and useby handicapped children.
Figure 10.1 illustrates the projection of the required increase in classroom stockfor the 33 countries. The needs are front-loaded, assuming that all will be met by2015. Thereafter, construction requirements will be driven by the need to accom-modate increases in the school-age population and to replace the buildings whenthey have reached the end of their useful life. Appendix 16 provides details on thisprojection.
Table 10.2 shows estimates of the financing required to close the school facilitygap over the next 10 years in the 33 African countries. Two scenarios are estimatedon two different assumptions. In the high-cost scenario, it is assumed that countriesmake no change in the way school construction activities are currently carried out. Ituses an average of US$9,150 per classroom, or the average across African countrieswhen school construction is managed centrally by the ministry of education (MoE)or a contract management agencies (CMAs). The low-cost scenario is based on theassumption that all countries harmonize school construction strategies and shift tothe community-contracting approach. The low estimate applies the average cost acrosscountries of community-managed school construction: US$6,800 per classroom.
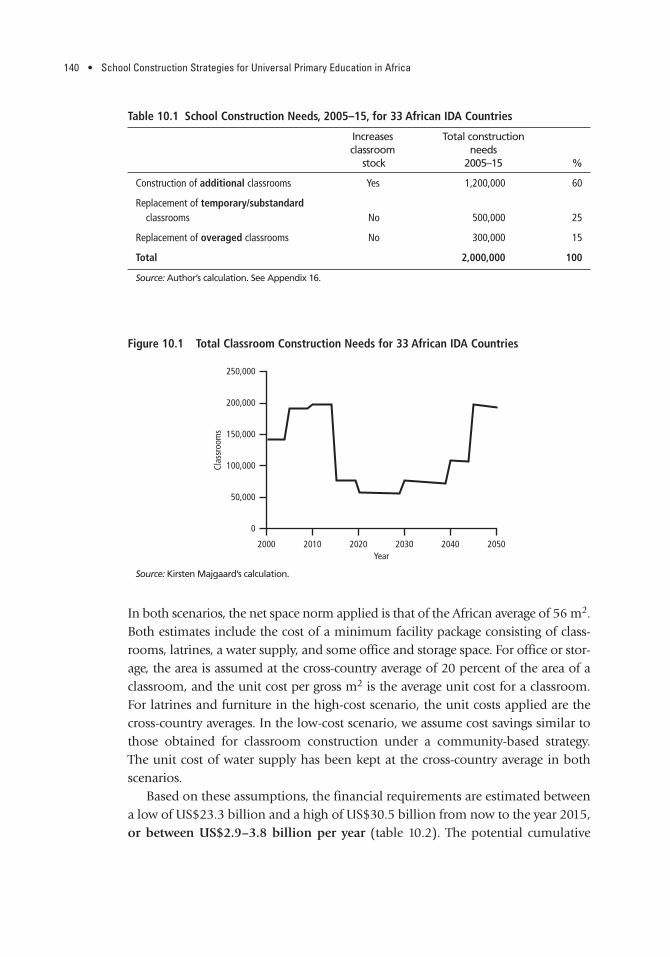
In both scenarios, the net space norm applied is that of the African average of 56 m2.Both estimates include the cost of a minimum facility package consisting of class-rooms, latrines, a water supply, and some office and storage space. For office or stor-age, the area is assumed at the cross-country average of 20 percent of the area of aclassroom, and the unit cost per gross m2 is the average unit cost for a classroom.For latrines and furniture in the high-cost scenario, the unit costs applied are thecross-country averages. In the low-cost scenario, we assume cost savings similar tothose obtained for classroom construction under a community-based strategy.The unit cost of water supply has been kept at the cross-country average in both scenarios.
Based on these assumptions, the financial requirements are estimated betweena low of US$23.3 billion and a high of US$30.5 billion from now to the year 2015,or between US$2.9–3.8 billion per year (table 10.2). The potential cumulative
140 • School Construction Strategies for Universal Primary Education in Africa
0
50,000
100,000
150,000
200,000
250,000
2000 2010 2020Year
2030 2040 2050
Clas
sroo
ms
Figure 10.1 Total Classroom Construction Needs for 33 African IDA Countries
Table 10.1 School Construction Needs, 2005–15, for 33 African IDA Countries
Increases Total constructionclassroom needs
stock 2005–15 %
Construction of additional classrooms Yes 1,200,000 60
Replacement of temporary/substandardclassrooms No 500,000 25
Replacement of overaged classrooms No 300,000 15
Total 2,000,000 100
Source: Author’s calculation. See Appendix 16.
Source: Kirsten Majgaard’s calculation.
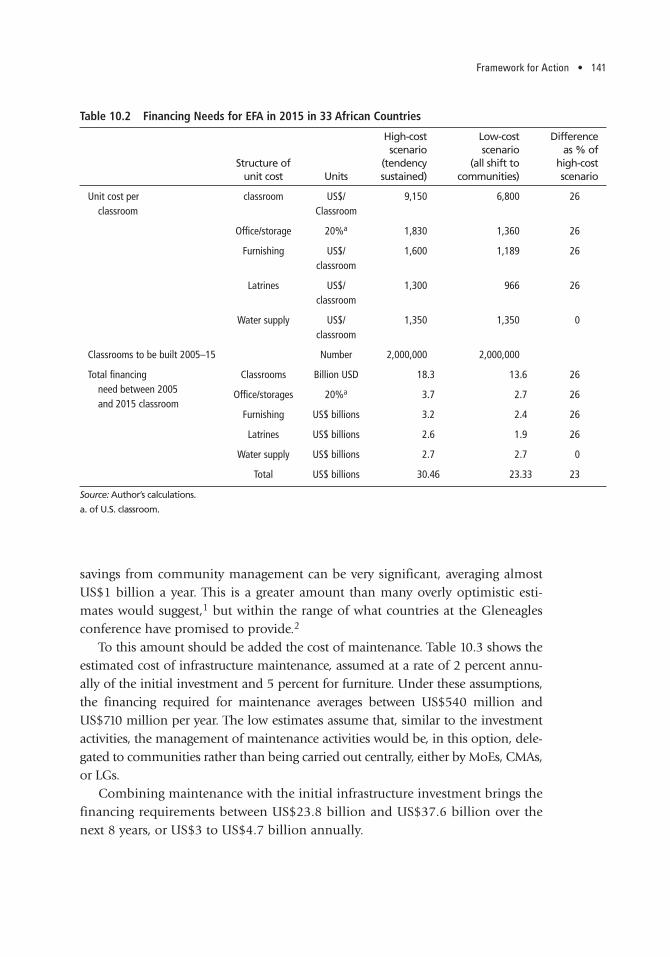
Framework for Action • 141
savings from community management can be very significant, averaging almostUS$1 billion a year. This is a greater amount than many overly optimistic esti-mates would suggest,1 but within the range of what countries at the Gleneaglesconference have promised to provide.2
To this amount should be added the cost of maintenance. Table 10.3 shows theestimated cost of infrastructure maintenance, assumed at a rate of 2 percent annu-ally of the initial investment and 5 percent for furniture. Under these assumptions,the financing required for maintenance averages between US$540 million andUS$710 million per year. The low estimates assume that, similar to the investmentactivities, the management of maintenance activities would be, in this option, dele-gated to communities rather than being carried out centrally, either by MoEs, CMAs,or LGs.
Combining maintenance with the initial infrastructure investment brings thefinancing requirements between US$23.8 billion and US$37.6 bil lion over thenext 8 years, or US$3 to US$4.7 billion annually.
Table 10.2 Financing Needs for EFA in 2015 in 33 African Countries
High-cost Low-cost Differencescenario scenario as % of
Structure of (tendency (all shift to high-cost unit cost Units sustained) communities) scenario
Unit cost per classroom US$/ 9,150 6,800 26classroom Classroom
Office/storage 20%a 1,830 1,360 26
Furnishing US$/ 1,600 1,189 26classroom
Latrines US$/ 1,300 966 26classroom
Water supply US$/ 1,350 1,350 0classroom
Classrooms to be built 2005–15 Number 2,000,000 2,000,000
Total financing Classrooms Billion USD 18.3 13.6 26need between 2005 Office/storages 20%a 3.7 2.7 26and 2015 classroom
Furnishing US$ billions 3.2 2.4 26
Latrines US$ billions 2.6 1.9 26
Water supply US$ billions 2.7 2.7 0
Total US$ billions 30.46 23.33 23
Source: Author’s calculations.
a. of U.S. classroom.

142 • School Construction Strategies for Universal Primary Education in Africa
WHAT COUNTRIES SHOULD DO
Countries should take charge, learn from experience, and lead the process toensure that school facility needs will be satisfied. For this purpose, they shouldcomplete a stock-taking exercise and harmonize planning norms, processes,school models, architectural and construction standards and implementationstrategy; develop tools and handbooks; build capacity of the various actors;develop a communication strategy; and ensure sound monitoring and evaluationof the implementation of the process.
COMPLETE A STOCK-TAKING EXERCISE
Ministries of Education should conduct a stock-taking exercise that analyzes(a) current and projected infrastructure needs to reach the MDG of complete qual-ity primary education for all by 2015; (b) current planning norms and processesand flow of funds for school construction; (c) the national context regardingdecentralization, the construction industry, water and sanitation policies, publicprocurement rules, and the environment; and (d) the past and current programsin terms of who did or does what, how, and at what cost in the provision of schoolfacilities. Box 10.1 mentions the essential elements needed for the exercise.Table 10.4 shows an example of such an exercise with data from Ghana to organ-ize the information on who does what, how, and with what result. Appendix 17provides other examples. The stock-taking exercise is intended to provide a basisfor harmonizing norms, management, and implementation arrangements, andachieving better unit costs. It provides a sound basis for unit costs to be used foreducation expenditure projections. It may usefully complement the Education
Table 10.3 Estimated Annual Cost of Maintenance of the Programs to Be Built in the 33 African Countries During 2005–15
Total investment cost Annual maintenance cost
High-cost Low-cost High-cost Low-costscenario scenario scenario scenario
(tendency (all shift to % investment (tendency (all shift to sustained) communities) cost sustained) communities)
Classroom 18.3 13.6 2 0.37 0.27
Office/storage 3.7 2.7 2 0.07 0.05
Furnishing 3.2 2.4 5 0.16 0.12
Latrines 2.6 1.9 2 0.05 0.04
Water supply 2.7 2.7 2 0.05 0.05
Total 30.5 23.3 0.71 0.54
Source: Author’s calculations.

Framework for Action • 143
BOX 10.1 ESSENTIAL ELEMENTS OF STOCKTAKING EXERCISE
Assessing Current Status and Needs
• School-age population (current and forecast) and geographical distribution, urban/rural, proportion of handicapped children
• Enrollments: GER—national, by region, by gender, disabled children• Retention/dropout rates, by regions; urban/rural, by cycle• Use of multigrade teaching • Pupils per classroom ratio (PCR): national, by region, urban/rural • Schools with incomplete education: national, by region, urban/rural• Number of classrooms and other facilities (latrines, water, office, storage,
furniture)• Geographical distribution, identification of inequities between regions,
urban/rural, gender disparities • Status of buildings (fair, needing repair, dilapidated beyond repair,
nonpermanent)• Classroom and other school facilities needs assessment to reach EFA by
2015
Assessing Planning and Financing
• Planning norms and standards for school creation and expansion, maximum distance from home to school
• Size and distribution of villages, maximum size of school• Targeting strategy, priorities• Planning process: who does what, when, and how?; top-down versus
bottom-up approaches• Projected financing from all sources• Actual expenditures for school investment and maintenance
Knowing Context
• Status of administrative and fiscal decentralization • Construction industry: modern sector, informal sector • Transport issues for materials and impact on cost• Water supply policy and strategy by Ministry of Water• Sanitation policy and rules by Ministry of Health and Sanitation• Public procurement code status, openness for community procurement• Environmental issues related to school construction
144 • School Construction Strategies for Universal Primary Education in Africa
Country Status Report carried out by many countries, and may be combined withit if applicable, as did Burkina Faso in 2008. Madagascar carried out its stock-tak-ing exercise in 2007 for the preparation of its submission to EFA-FTI.
HARMONIZE AND ADOPT PLANNING NORMS, PROCESSES, SCHOOL MODELS,ARCHITECTURAL AND CONSTRUCTION STANDARDS, AND DEVELOP A SCHOOLCONSTRUCTION STRATEGY
The process should be fully participatory, managed by the MoE with involvementof all stakeholders, including other key ministries involved in school construction,water, sanitation, or small- and medium-size enterprise development; local gov-ernments; staff of education construction projects or multisector projects financingschool construction, such as social funds or decentralization projects; donors; andcivil society. Chapters 2, 3, and 4 provide indications regarding the planning ele-ments to be harmonized. Chapter 5 provides information and guidance regardingthe more cost-efficient implementation and procurement strategies. Appendix 13provides illustrations of toolkits for harmonization. Chapter 6 provides informa-tion on norms to be established by MoEs.
DEVELOP TRAINING TOOLS AND HANDBOOKS AND BUILD CAPACITY
Chapter 6 provides information regarding tools and handbooks for MoEs at thecentral and local levels, local governments, and communities that are useful forcommunity management of the school construction. To the extent possible, MoEsmay build on existing experienced programs in their own country and adapt their
Knowing Who Does What, How, and With What Result, for Each Program or Project
• Norms and standard designs for each type of facility• Overall management of each program• Implementation mechanisms, including flow of funds, procurement
arrangements, contracting out, delegations, payment of contractors, andsupervision arrangements
• Maintenance arrangements • Unit costs for each type of facility • Cross-comparison of efficiency and cost efficiency• Potential for harmonization across projects

145
Table 10.4 A Stock-taking Exercise on Who Does What and How in Primary School Construction: Example with Ghana
Centralized/deconcentrated approaches Decentralized approaches
Ministry Agency NGOs Local CommunitiesCentral Local School Central Local Central Local govern- Private empower- partici-
Project WHO DOES WHAT? Donor office office staff office office office office ments sector ment pation
BESSIP - Basic Education Strategic Investment Program
Financing agency IDA 1. Proposes planning DistrictsNumber of classrooms: 750 2. Decides planning GESYears 1997–02 3. Standard design PIUPIU yes 4. Signs Financing AgmtCoverage nation 5. Sets DAO standard docs NCBYear of cost data 2002 6. Invites to bid PIU$/classroom 10,433 7. Awards contracts PIUGross m2 per classroom 69.00 8. Signs contracts PIUUS$ per m2 97.00 9. Monitors works Dist. Eng.Community participation No 10. Pays works PIUsource Group 5 11. Executes works SME
12. Hands over building GES
ESSP-SU - School Upgrading Program
Financing agency DFID 1. Proposes planning DistrictsNumber of classrooms: 560 2. Decides planning DistrictsYears 2002–now 3. Standard design MoEPIU yes 4. Signs Financing AgmtCoverage 2 regions 5. Sets DAO standard docs NCBYear of cost data 2004 6. Invites to bid Districts$/classroom 10,727 7. Awards contracts DistrictsGross m2 per classroom 51.00 8. Signs contracts DistrictsUS$ per m2 85.00 9. Monitors works Par. Ass.Community participation No 10. Pays works Districtssource Group 5 11. Executes works Small Ent
12. Hands over bldg Districts
Primary School construction Program
Financing agency Plan Int. 1. Proposes planning Plan IntNumber of classrooms: 90 2. Decides planning Plan IntYears 2002–now 3. Standard design MoEPIU NGO 4. Signs Financing Agmt Plan Int Comm.Coverage 3 regions 5. Sets DAO standard docsYear of cost data 2004 6. Invites to bid$/classroom 7,500 7. Awards contractsGross m2 per classroom 50.60 8. Signs contracts Plan IntUS$ per m2 60.70 9. Monitors works Comm.Community participation Yes 10. Pays works Plan Intsource Group 5 11. Executes works artisan labor
12. Hands over bldg MoE
Source: Table from the author with data from Group 5b
146 • School Construction Strategies for Universal Primary Education in Africa
training tools and handbooks. They may also learn for other countries’ experiencethrough international workshops or country visits. Capacity-building programsmay take advantage of experienced non-governmental organizations (NGOs) andlocal experts.
COMMUNICATION STRATEGY
A national information education communication strategy will be needed toensure national access to program information by all stakeholders and the civilsociety. The IEC (Information education communication) system should find theinformation required to form a sound monitoring and information system. Itshould ensure transparency through public availability of all information regardingthe school construction program, including decision-making processes and results,flow of funds, procurement activities, and results. The strategy should target differ-ent audiences with different tools: central authorities with general reports andscorecards, local authorities with specific reports and scorecards. At the communitylevel, information on resources, procurement decisions, and payments of contractsshould be displayed in public places and subject to information-sharing sessions incommunity meetings. Chapter 8 provides information on the efficiency of trans-parency mechanisms to curb corruption.
BUILD OR DEVELOP SOUND MONITORING AND EVALUATION OF THE SCHOOLCONSTRUCTION PROGRAM
Monitoring capacity should be built within the MoE and particular attention paidto developing evaluation capacity in the universities.
Monitoring mechanisms should be based on a clear set of data and perform-ance indicators, with a clear chain of data collection. Tracked indicators may betranslated into scorecards to be disseminated to concerned audiences and disclosedto the public through the communication system. Examples of monitoring score-cards for local governments were developed in 2007 by the Nigeria Community-Driven Development (CDD) project and in 2008 by the Benin CDD project.
The Evaluation system should include annual financial audits and technicalaudits that provide ex-postevaluation of cost efficiency of each project or program,and the value for money obtained during the past period; and beneficiary assess-ments that provide the management with feedback from all actors (Salmen 1995,1998; Owen and Van Domelen 1998). When different programs with differentstrategies are implemented simultaneously in the country, the M&E system shouldcover all programs, measure their performances with the same tools and indica-tors, and inform all stakeholders of the comparative efficiency and cost efficiencyof the different programs.

Framework for Action • 147
WHAT DONORS SHOULD DO
Donors should implement the Paris Declaration, taking their support to schoolconstruction as a specific subject of harmonization. In this area, they shoulddevelop formal joint agreements to secure harmonized partner support and assisteach donor in internally negotiating the changes needed for its own support.
In each country, donors should support the country leadership and agree on adetailed agenda toward school construction harmonization with time-boundbenchmarks. The agenda may include (a) donor support to develop a nationalcountry-led school construction strategy; (b) adoption of revised school mappingapproaches that ensure access to EFA for all children; (c) consensus on norms andstandard designs; (d) agreement to finance the national minimum package offacilities including furniture, water, and sanitation; (e) agreement to move towarda harmonized implementation arrangement and procedures based on best prac-tices allowing large and rapid scale-up, and the most cost-effective implementationmodalities; (f) agreement to help MoEs realign their modus operandi, along withdecentralization of school construction to local governments when needed, andstreamline CDD approaches for school construction to increase cost efficiency and
BOX 10.2 TECHNICAL AUDIT AND BENEFICIARY ASSESSMENT:KEY FEATURES
Technical Audit• Covers all projects and programs• Sample statistically valid by project/program and region • Assess appropriateness of design and conformity of works to design• Capacity of management, contractor, and site supervisor• Actual unit cost per m2 of contract prices and value for money in each
project/program • Assess achievement of school project objective• Sustainability of operations and maintenance of facilities
Beneficiary Assessment• Consultation with beneficiaries and stakeholders• Representative sample• In-depth interviews around key themes and topics• Focus group discussions• Direct observation and participant observation

148 • School Construction Strategies for Universal Primary Education in Africa
transparency; (g) consensus to finance investment subject to the incorporation ofa sound maintenance strategy into the program; (h) phasing out PIUS and relyingon reinforced MoEs structures; and (i) acceptance of a country-led Monitoring andEvalution system that covers all programs regardless of origin of funds. Donorsshould reach agreement between themselves and the country on what is essentialto improve efficiency of aid in school construction.
At the global level, under the umbrella of the EFA-FTI Secretariat, donors mayagree on a global agenda covering some or all of the items above, with time-boundbenchmarks to measure global progress toward harmonization in the area ofschool construction. The EFA-FTI Secretariat may put more focus in this area byrequesting a sound school construction strategy when FTI resources are expected tofinance school buildings.
AREAS FOR FURTHER RESEARCH
This review revealed important knowledge gaps that need further research:
• Maintenance of facilities. The lack of information on maintenance practices isabysmal. No maintenance programs have ever been evaluated. There is an urgentneed to build minimum knowledge and identify best practices, if any, to supporta dialogue on maintenance strategies.
• Impact of water and sanitation on access, retention, and learning perform-ance of girls. In this matter, the literature is full of anecdotal information andadvocacy, but statistical analysis remains to be done.
• Minimum School Facility Package. Little is known of the impact of canteens,staff housing, libraries on students’ access and retention, and their learningoutcomes. Specific analysis is also to be carried out.
• Roles of local governments in education. Decentralization and devolution ofsome educational competencies to local governments is a global evolution. Little is known about the impact of decentralization on the performances of theeducation sector.
• School planning, village development planning, and local developmentplanning. Knowledge needs to be more systematically developed about theimpact of bottom-up versus top-down planning of school construction pro-grams, particularly in the context of decentralization.
• National procurement rules and community-based procurement. Commu-nity participation in procurement is allowed in World Bank ProcurementGuidelines; however, national procurement codes never include provisions forsuch types of procurement. Many countries are currently revising their procure-ment code, often with the Bank’s assistance, with little or no consideration ofcommunity participation in procurement.

Framework for Action • 149
NOTES
1. Earlier estimates suggested an average of US$1.1 billion per year during the 2005–15period for 47 Sub-Saharan Africa countries, including an average of US$0.8 billion per yearto cover rehabilitation needs and 0.3 billion for expansion countries (Burns, Mingat andRakotomala 2003).
2. In the 2005 Global Policy Forum of Gleneagles (United Kingdom), the G8 countriesand other Official Development Assistance donors promised to provide an extra US$50 bil-lion to Africa by 2010.


151
Impact on Student Enrollment and Retention. The research evidence is unambiguous—the closer the school is to home, the more likely children are toattend, and enroll at the appropriate age. Based on household survey data, theWorld Bank Country Status Reports have examined the relation between distanceto school and enrollment in a large number of Sub-Saharan African countries: theenrollment rate is consistently lower, the farther the children live from the school,but the size of the impact varies from one country to another.1 In Mali, the enroll-ment rate is almost 30 percentage points higher for children who live less than30 minutes from school than for children who live more than 45 minutes fromthe nearest school, whereas in Burundi, the difference in enrollment rate for thesame two groups is 10 percentage points. Schaffner (2003) found that each addi-tional kilometer from home to school reduces school enrollment by 2 to 3 per-centage points in Ethiopia. And in Eritrea, primary school participation rates grewby 191 percent when the average distance to home was more than halved (VanDomelen and El-Rashidi 2001). In Lesotho, it was found that reducing the timeneeded to reach school from one hour to 15 minutes led parents to send their children to school at a younger age, thereby reducing the probability that the children would drop out (World Bank 2005a).
Distance to school is important, not only because it taxes the stamina of chil-dren, but also because a longer trip to school is less safe. In a study covering Chad,Guinea, and Niger, Lehman (2004) found that enrollment rates drop precipitouslywhen children are expected to attend school in a village other than their own, evenif that village is nearby. A World Bank study (2005m) on Pakistan finds that safetyconcerns are a major factor explaining why many parents do not send their girlsto school, particularly in rural areas where villages do not have school facilitiesand the girls would be forced to travel outside of their communities. Kane (2004)reported that distance has a negative effect on school enrollment for girls in Côted’Ivoire and Ghana, and that girls are often taken out of school at puberty in Zambia. Distance also poses an additional challenge for children with disabilities.Thus, the evidence is overwhelming that having an extensive network of primaryschools with schools located as close as possible to where children live is essentialfor achieving universal primary enrollment.
School Infrastructure Matters: The Research Evidence
APPENDIX 1
The quality of the school infrastructure and facilities available at the schoolhave also been found to impact school enrollment. Many studies have found animpact of water and latrines on enrollment and retention. Sey (2001) found thatthe availability of water and sanitation was important for the retention of girls inSenegal. Chaudhury, Christiaensen, and Asadullah (2006) found that the avail-ability of water and sanitation in the nearest school increased the probability ofmale enrollment by 15 percent for water and 7 percent for latrines in Ethiopia(girls’ enrollment was very low with or without latrines). In Pakistan, the con-struction of separate latrines for girls has had a major effect on girls’ enrollment inprimary schools (World Bank 2004o). In India, a UNICEF assessment estimatedthat the provision of potable water and sanitary facilities would increase girls’enrollments from 47 to 66 percent in the targeted schools (Sey et al. 2003). Thecondition of the school buildings has been found to affect completion in severalstudies, including Mason (1994) and Glewwe and Jacoby (1996). They found thatpoor quality of school buildings in Indonesia and Vietnam lowered the probabil-ity of completion of primary school.
Impact on Teacher Motivation and Absenteeism. Teachers show greater motivationand dedication when the infrastructure is more welcoming. A study of teacherabsenteeism in Bangladesh, Ecuador, India, Indonesia, Peru, and Uganda foundthat teachers in schools with the best infrastructure have absenteeism rates 10 per-centage points lower than teachers in schools with the worst infrastructure(Chaudhury, Hammer et al. 2005). In particular, lack of toilets was correlated withhigh rates of teacher absenteeism (which ranged between 11 and 27 percent).Infrastructure was even found to have a stronger impact on teacher absenteeismthan the teacher’s salary level or administrative tolerance of absence.
Impact on Learning Outcomes. Finally, the research provides evidence that the con-dition of the school infrastructure has an impact on learning outcomes. In a reviewof 96 production function studies on developing countries, Hanushek (1995)found 34 studies that investigated the impact of physical facilities (such as qualitybuildings and libraries) on student learning. A large majority of the studies founda positive effect of high-quality school infrastructure on learning achievement.
Similarly, Michaelowa and Wechtler (2005) found that the condition of schoolbuildings has an impact on learning, based on the SACMEQ student learningachievement survey covering 14 Sub-Saharan African countries. The authors founda strong positive relationship between the condition of the school building andlearning outcomes. A change from a school in extremely bad condition to one ingood condition resulted in an increase of about 10 percent of a standard deviationin learning achievement. This effect is about as strong as, and in some casesstronger than, the effect of some instructional equipment (12 percent for high-tech
152 • School Construction Strategies for Universal Primary Education in Africa

School Infrastructure Matters: The Research Evidence • 153
equipment and 7 percent for teacher manuals) and equivalent to the gain in liter-acy scores (10 percent) from having a school library. However, the authors under-score the possibility that these results may suffer from an endogeneity problem:Because the condition of school buildings and availability of high-tech equipmentare highly visible signals of a rich school environment, parents who are wealthy,have greater interest in their children’s education, or have children who arebrighter than average are more likely to select better-equipped schools in betterphysical condition. SACMEQ data (unlike PASEC) do not allow for controlling forinitial knowledge, as they do not include pupils’ test scores from the beginning ofthe year.
Other studies have also found an impact on learning from having adequateequipment in schools. In the Tan, Lane and Coustere (1997) study on first gradersin the Philippines, lack of adequate furniture was found to be associated with a dropof –0.32 standard deviations in math and –0.29 standard deviations in reading. Inthe study by Glewwe and Jacoby (1994), repairing leaking roofs in Ghanaian middleschools produced an estimated increase of 2.0 standard deviations in reading scoresand 2.2 in math scores; the availability of blackboards raised reading scores by 1.9standard deviations and mathematics scores by 1.8. Adding a library led to smallerincreases. Likewise, Michaelowa and Wechtler (2005) found that the availability ofblackboards and chalk had a positive impact on student learning in mathematics.
Many more studies have demonstrated the positive impact on enrollment,completion, and learning from having adequate school infrastructure. However,many studies concur that other types of school inputs have a greater impact, particularly when compared to their costs (several studies found that the mostcost-effective inputs are textbooks and teacher manuals). Infrastructure is hugelyexpensive, but a certain basic level of infrastructure and equipment is necessaryfor schools to function and learning to take place. Yet, in a context of relatively lowper student spending, beyond the basic infrastructure level, resources may be better spent on other learning inputs. While the existing body of research hasdemonstrated that school infrastructure matters, the existing research appears tobe less useful in providing guidance as to how and where to spend the fundsdirected to infrastructure improvement. Given that most projects cannot cover anentire country at one time, we need to know more about what types of infrastruc-ture investments are most cost-effective in improving enrollment, retention andlearning. Carrying out more production function type studies may not be the rightway forward, for the two reasons discussed below.
Problems with data. One reason may be on the data side: it requires a lot of vari-ables to adequately describe the quality of school infrastructure. The quality ofschool infrastructure encompasses both the availability of certain facilities, suchas libraries, sanitation facilities, furniture, etc., but also the quality of the buildings
154 • School Construction Strategies for Universal Primary Education in Africa
in terms of materials used and condition of repairor disrepair. But quality alsodepends on aspects such as cleanliness, spaciousness, and appearance. When dataon infrastructure exist, they mostly focus on the availability of certain facilities,and sometimes on the condition of school buildings, but ignore the other aspects.Spending on infrastructure may be used as a proxy, but these data are even harderto come by. Some empirical studies deal with the complexity of describing schoolinfrastructure by combining available information into an infrastructure qualityindex. But very little is known about the extent to which these indices correctlymeasure the infrastructure quality.
Endogeneity bias. The second problem with this type of study is that productionfunction studies are prone to have endogeneity problems. For example, if schoolswith good infrastructure are systematically located in richer areas than schoolswith poor infrastructure, we may be capturing the effect of rich/poor household,rather than of good/poor infrastructure. For example, if school maintenance isfunded by parents, schools in better-off areas are likely to be in a better conditionthat schools in poorer areas. Thus, there are likely systematic differences betweenschools that we do not completely understand. Because we do not understandthem, it may be impossible to control for these differences in regressions (omittedvariable bias). Another related problem is that of a possible selection bias: whengiven the choice, parents may choose to enroll their children in a school that hasa better quality infrastructure, other things equal. This can lead to two statisticalproblems: 1) the better equipped schools have a higher enrollment, leading to adeterioration of their pupil: teacher ratio, and other measures of per-pupil spend-ing, and can actually lead to a decline in learning outcomes, or 2) the studentcomposition may change, for example if mostly resourceful families move theirchildren to better equipped schools, learning outcomes may improve, not becausethe school is better, but because the student body has changed composition.Therefore, additional production function studies are not likely to provide muchmore information on the effect of infrastructure.
Project impact evaluations present another source of evidence on the impactof the quality of school infrastructure on learning. Despite the many school con-struction and rehabilitation programs funded by the World Bank over the years,very few impact evaluations have been carried out. What is more, unless theschools benefiting from the projects were selected randomly (with a controlgroup), the impact evaluations are likely flawed (omitted variable bias again) andtheir results unreliable. Two useful evaluations have been carried out in recentyears. A review of the World Bank’s assistance to education programs in Ghanaconcluded that the improvements in the availability and quality of school infra-structure had resulted in higher primary school enrolment and an increase in English and math scores. Whereas in 1988, only half of all classrooms were usable

School Infrastructure Matters: The Research Evidence • 155
when it rained, by 2003, two-thirds were able to function normally therebyincreasing the amount of instructional and learning time (World Bank 2004d).Further, a 1999 World Bank study of the social fund in Peru showed that invest-ment made in school facilities had a significantly positive impact on school atten-dance rates for both younger and older children (but no effect on the likelihoodof children being at the right grade level for age, or on the time it takes to travelto school).
More randomized trials are needed in school infrastructure investments. Kremer(1995), in a commentary to Hanushek (1995), pointed out that project evalua-tions using randomized trials have indicated high payoffs to education expendi-tures. However, there are only a few such project evaluations, and none yet ofWorld Bank–funded infrastructure projects. Unlike retrospective studies, random-ized trials are not subject to bias from omission of variables correlated with edu-cational outcomes. The design of a randomized trial requires that the schools benefiting from improvements be randomly selected, in order to have an “identical”control group for later statistical analysis of project effects. (If it is not politicallyfeasible to deny investments in one group, the two groups could receive differentimprovements or the same improvements at different dates). According to Kremer(1995), schools in developing countries are particularly well suited for random-ized trials because relatively small investments can make a big difference in schoolbudgets.
NOTE
1. See: World Bank 2001d, 2003c, 2004e, 2004f, 2005a, 2005e, 2005f, 2005h, 2005i,2005s, 2006c, 2006i, 2006d, and 2007h.
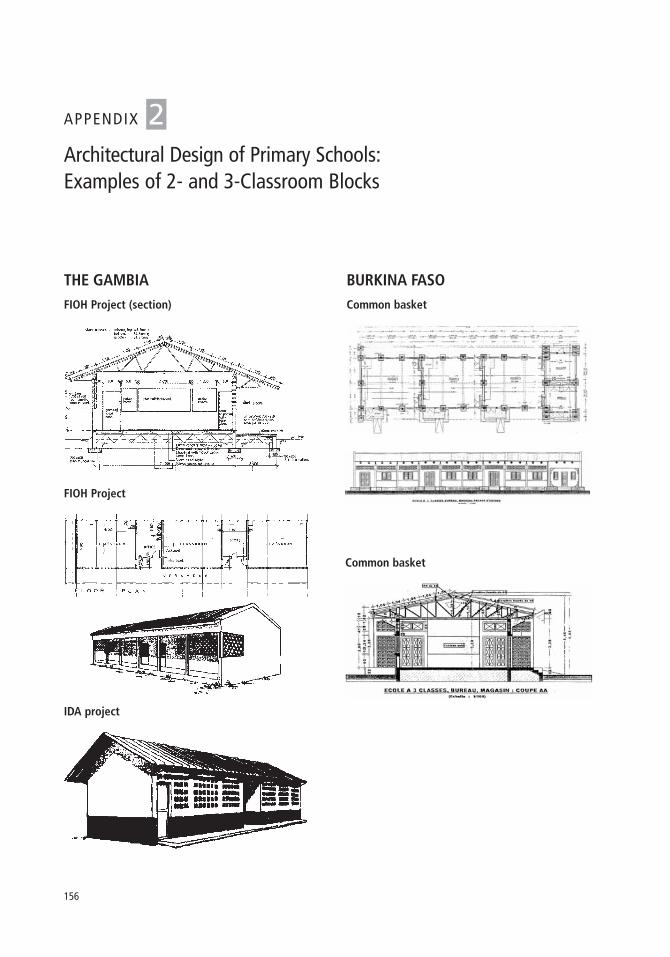
Architectural Design of Primary Schools:Examples of 2- and 3-Classroom Blocks
APPENDIX 2
THE GAMBIAFIOH Project (section)
IDA project
Common basket
BURKINA FASOCommon basket
FIOH Project
156
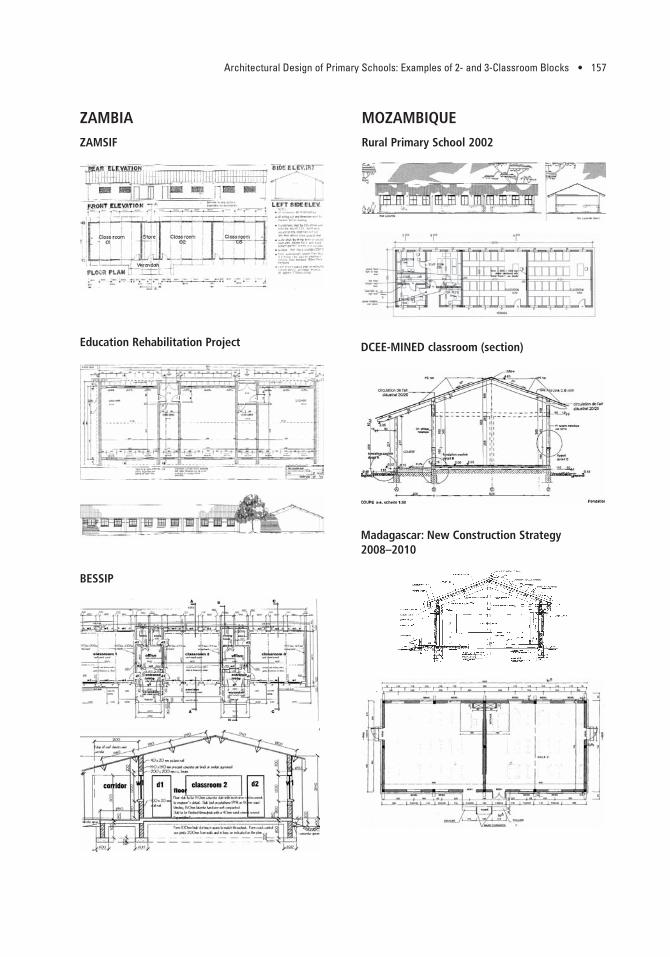
Architectural Design of Primary Schools: Examples of 2- and 3-Classroom Blocks • 157
BESSIP
ZAMBIAZAMSIF
Education Rehabilitation Project
Madagascar: New Construction Strategy2008–2010
MOZAMBIQUERural Primary School 2002
DCEE-MINED classroom (section)

158 • School Construction Strategies for Universal Primary Education in Africa
Chad Education Project
Ghana Micro-Project (EU)Guinea: Classroom-Block Model
Uganda School Facility GrantBENINMEMP
AGETUR
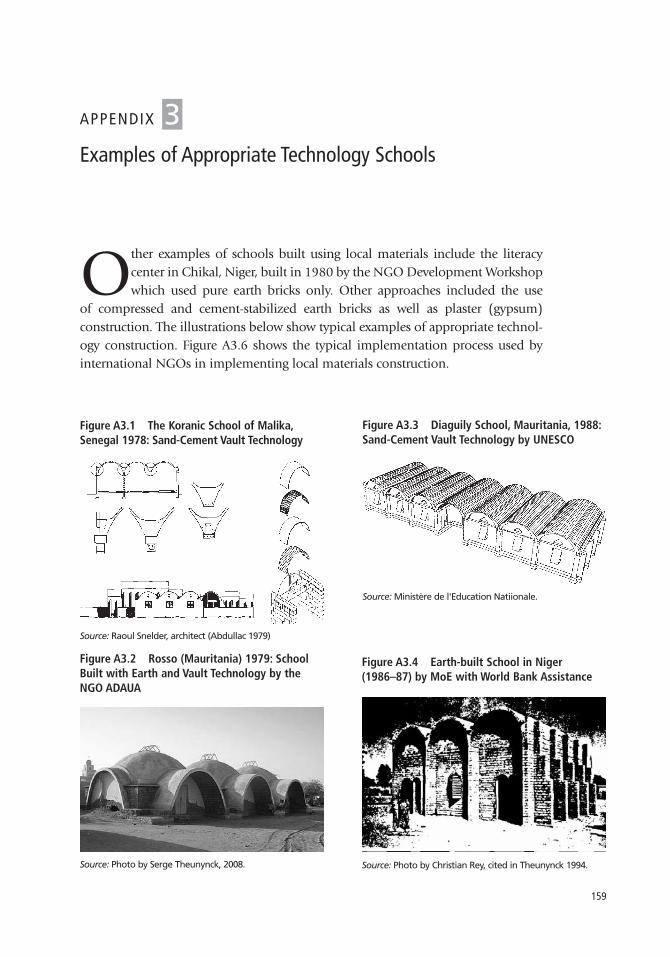
159
Other examples of schools built using local materials include the literacy center in Chikal, Niger, built in 1980 by the NGO Development Workshopwhich used pure earth bricks only. Other approaches included the use
of compressed and cement-stabilized earth bricks as well as plaster (gypsum) construction. The illustrations below show typical examples of appropriate technol-ogy construction. Figure A3.6 shows the typical implementation process used byinternational NGOs in implementing local materials construction.
Figure A3.1 The Koranic School of Malika, Senegal 1978: Sand-Cement Vault Technology
Figure A3.2 Rosso (Mauritania) 1979: SchoolBuilt with Earth and Vault Technology by theNGO ADAUA
Source: Raoul Snelder, architect (Abdullac 1979)
Source: Photo by Serge Theunynck, 2008.
Figure A3.3 Diaguily School, Mauritania, 1988:Sand-Cement Vault Technology by UNESCO
Source: Ministère de l'Education Natiionale.
Figure A3.4 Earth-built School in Niger(1986–87) by MoE with World Bank Assistance
Source: Photo by Christian Rey, cited in Theunynck 1994.
Examples of Appropriate Technology Schools
APPENDIX 3

160 • School Construction Strategies for Universal Primary Education in Africa
public private
Memorandum
of Agreement trains skilles and unskilled workerson new technology
providestoolsmaterialssupervision
laborSchoolinstitution
semi public andNGO sectors
Individualworker
Localcommunity
dece
ntra
lized
Schoolcommunity
Mediumcontractor
Smallcontractor
Localgovernment
Village/neighbor-
hood
cent
raliz
ed
Largenational
contractor
Inter-national
NGO
Centralgovernment
government private sector communities
Schoolbuilding
Figure A3.6 Typical Implementation Scheme for International NGOsUsing Local Materials Construction
Source: Author’s figure.
Figure A3.5 Primary Schools with Stabilized Earth Bricks, Senegal, 1984
Source: Patrick Dujarric, Birahim BNiang, IDA SecondEducation Project
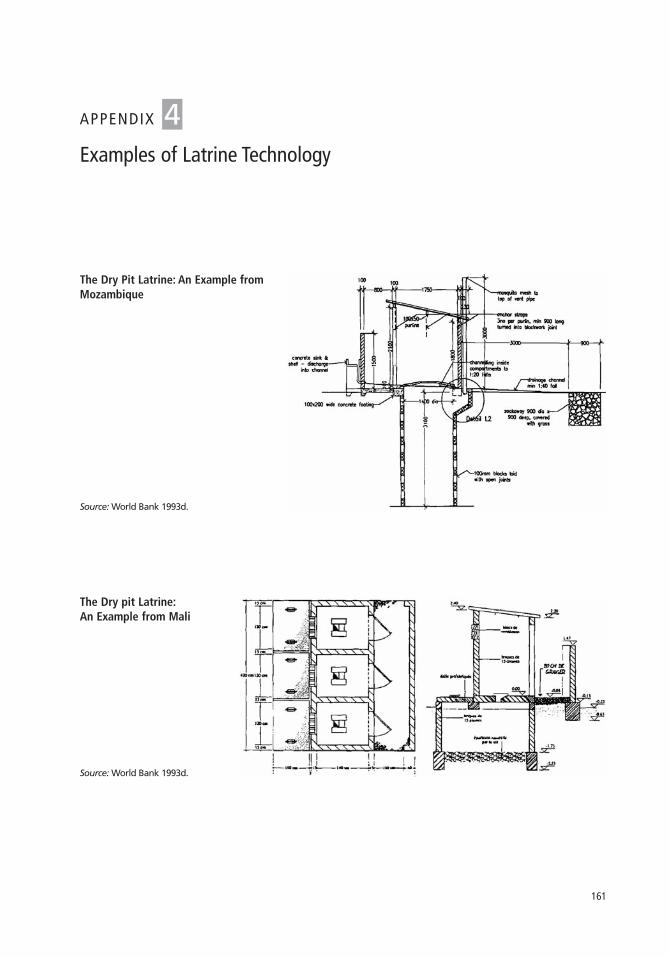
161
The Dry Pit Latrine: An Example fromMozambique
Source: World Bank 1993d.
The Dry pit Latrine:An Example from Mali
Source: World Bank 1993d.
Examples of Latrine Technology
APPENDIX 4
162
The term prefabrication means that large portions of buildings are factory- produced off-site and assembled on-site. Compared with traditional con-struction, prefabrication requires significantly different capital requirements,
logistical arrangement, and specialized skills. Capital costs include either the cost ofimporting the prefabricated building segments or the cost of the investment to erectan industrial plant to fabricate the building segments. Logistics involve transportinglarge prefabricated building segments to the construction sites, compared to thelogistics of traditional construction, such as moving cement, lumber, and roofingsheets.These logistics become more complex when the school construction sites aredispersed, building segments are large, and road networks and transport systemsare poor. The site assembly crews typically needs to be more knowledgeable andcompetent than traditional construction crews, because the building foundationneeds to be more exactly precise and because specific know-how is required toassemble the prefabricated segments.
Off-site prefabrication and mass-marketing of prefabricated constructionstarted in the U.S. during the nineteenth century as a modern way to mass- produce inexpensive housing for the middle classes. Prefabrication also becamepopular during the gold rush in the mid-nineteenth century, when large numbersof buildings were needed for mushrooming towns. Mass-merchandisers, led bySears and Roebuck, sold housing packages by the tens of thousands through catalogs. The popularity of prefabricated housing, however, faded along with theeconomic downturn and Great Depression in 1930.
When prefabrication faded in the US, ironically, it became increasingly popularin Europe (Richman 1994), where the prefabricated movement began in 1928 withthe founding of the Congres Internationaux d’Architecture Moderne (CIAM) inFrance by the architect le Corbusier and other modernist architects. CIAM, a majorsource of avant-garde ideas in architecture, promoted the industrialization of construction sector, embraced new technologies, and touted the efficiency of theautomotive industry as a model for the construction industry. Soon thereafter, theGroupement d’Etudes pour une Architecture Industrialisée (GEAI) was established inthe 1930s. Engineers affiliated with the GEAI, such as Marcel Lods and Jean Prouvé,
A Brief History of Industrialization inthe Construction Industry Worldwide
APPENDIX 5

A Brief History of Industrialization in the Construction Industry Worldwide • 163
developed light steel structures to support prefabricated segments for low-cost hous-ing and adapted the production methods of the automobile and airplane industries.During the post-war reconstruction period of 1945–75 in France, large low-costhousing complexes were constructed using this method in Sottevile-les-Rouen(1948–1955), Maly le Roy (1957–59), and La Grand-Mare in Rouen (1969–1978).
The European movement toward prefabrication also included the GermanBauhaus, founded in 1919 by Walter Gropius and closed in 1933 by Mies Van derRohe. The Bauhaus group’s objective was to blend art, craft, and modern technologyin housing production by drawing on the mass production technology of the auto-mobile industry. The Swedish school of architects promoted room area normaliza-tion to facilitate the fabrication of standardized components and provide flexibilityin plans. Finally, in Great Britain during the 1950s and 1960s, architects promoteda technology called the Large Panel System which was an earlier Danish invention,to provide large numbers of housing units (DTI 2001).
Despite these many attempts to industrialize housing construction, industrial-ization never generated the anticipated cost-savings. The complexity in the design,production, delivery and assembly of prefabricated buildings exceeded the savingsexpected from the reduction of time, labor and materials (Koskela and Vrijboef2001). A recent study conducted in Israel concludes that industrialization is morelikely to be efficient for the construction of large multistory buildings or a a largenumber of units on the same site, as opposed to few and small buildings on mul-tiple sites (Kun 2004). Further, the flexibility of traditional small- and medium-size on-site construction enterprises allowed them to remain highly competitivewith industrialized builders. Studies conducted in many countries confirm theseresults. In the United States, the labor economist Finkel (1997) notes, that despiteits important contribution to the U.S. economy of about US$400 billion per year,the construction industry has failed to generate productivity gains and attain theefficiencies of large-scale production. Output per hours increased only by 16 per-cent in over three decades. He states, “[T]he rapid firm entry into the building mar-ket, the low capital requirements, and minimal licensing restrictions have createda competitive market system composed of small units of capital. The Mom-and-Pop shops, the one-person firm, and the itinerant contractor have been the com-monplace participants since the earliest beginning of market-based construction”(Finkel 1997). And it is still the case. The United States has about 2 million construction firms, the majority of which are small enterprises. Similarly, inFrance, nearly 90 percent of the 342,000 construction enterprises registered in2004 were small, often family owned, enterprises with fewer than nine employees(INSEE 2004). In 1997, Japan had a total of 565,000 construction firms, of which99 percent were small and medium-sized firms (Sugii 1998).

164
• In Chad, the CMA ATETIP was created in 1993 to manage a school con-struction program financed by the World Bank. Although the agency builtclassrooms of acceptable quality, the unit cost was 22 percent higher thanthe planned costs. The agency’s services were subsequently cancelled in 1998(World Bank 1993a, 2003b).
• In Burkina Faso, the CMA Faso Baara managed school construction pro-grams financed by the government through HIPC resources and by the AFD.Faso Baara filled an important gap and contributed enormously to expand-ing access. The agency built 37 percent of a total of 3,650 classrooms con-structed nationwide between 2001–05 (Group 5 2006a). However, the unitcosts achieved by Faso Baara, at between US$127–143 per m2, were margin-ally higher than costs of the NGO Plan International (US$125/m2) and21 percent higher than costs achieved by provincial governments (US$103/m2).
• In Cape Verde, the MoE delegated the management of an IDA-financedschool construction program from the PIU to the CMA AGECABO. AGECABO successfully built the schools at only 60 percent of the cost ofclassrooms constructed by the PIU, which averaged CVEsc 4.12 million. Thissuccess swayed the MoE to adopt AGECABO’s procurement procedures ofthree quotes in lieu of national competitive bidding. As a result, the MoEachieved similar savings and the approach was later adopted by local governments as well (World Bank 2005d).
• In Madagascar, the unit cost of AGETIPA managed classroom construction(US$322/m2 was 60 percent higher than the cost of projects managed by thecentral Ministry of Education utilizing national competitive bidding proce-dures which averaged US$196/m2 under an AfDB-financed project, andalmost double the cost of construction carried out by the Social FundAgency.
• In Mauritania, AMEXTIPE built classrooms through urban developmentprojects in secondary towns at much higher cost than those built by theMoE through its community-based construction program. A technical auditshowed that AMEXTIPE built a school in the town of Selibaby at a per classroom cost of US$13,200, three times higher than classrooms built by
Unit Costs of Some Contract ManagementAgencies in School Construction
APPENDIX 6
Unit Costs of Some Contract Management Agencies in School Construction • 165
communities (US$4,600) (Synergy 2000, World Bank 2001f). In 2005,AMEXTIPE built primary schools in the towns of Rosso and Nouadhibou atUS$219/m2 and US$231/m2, respectively. In contrast, communities in Rossoand Nouadhibou built schools at US$155/m2 and US$128/m2, respectively.
• In Senegal, between 1994 and 1998, AGETIP built about 2,000 classroomson behalf of the MoE and brought unit costs down by almost half—fromUS$8,100–13,200 per classroom to US$6,700 (World Bank 2000d). By2001, the unit cost fell further to US$6,400. Between 2000 and 2004,AGETIP built 27 percent of a total of 7,950 new classrooms constructedthroughout the country by different agencies (Dupety 2005a).
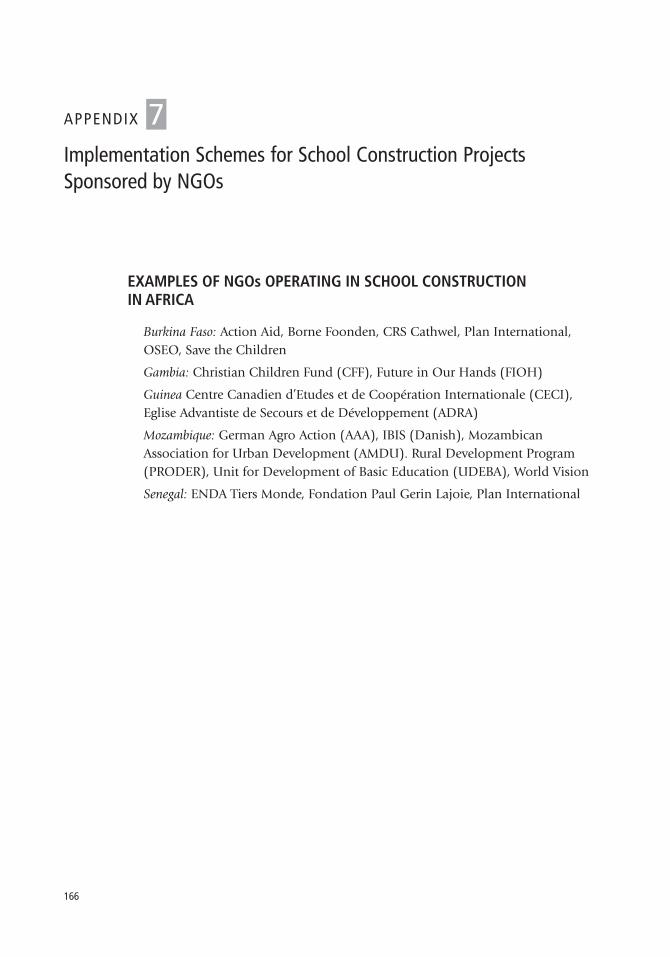
166
EXAMPLES OF NGOs OPERATING IN SCHOOL CONSTRUCTIONIN AFRICA
Burkina Faso: Action Aid, Borne Foonden, CRS Cathwel, Plan International,OSEO, Save the Children
Gambia: Christian Children Fund (CFF), Future in Our Hands (FIOH)
Guinea Centre Canadien d’Etudes et de Coopération Internationale (CECI),Eglise Advantiste de Secours et de Développement (ADRA)
Mozambique: German Agro Action (AAA), IBIS (Danish), Mozambican Association for Urban Development (AMDU). Rural Development Program(PRODER), Unit for Development of Basic Education (UDEBA), World Vision
Senegal: ENDA Tiers Monde, Fondation Paul Gerin Lajoie, Plan International
Implementation Schemes for School Construction Projects Sponsored by NGOs
APPENDIX 7
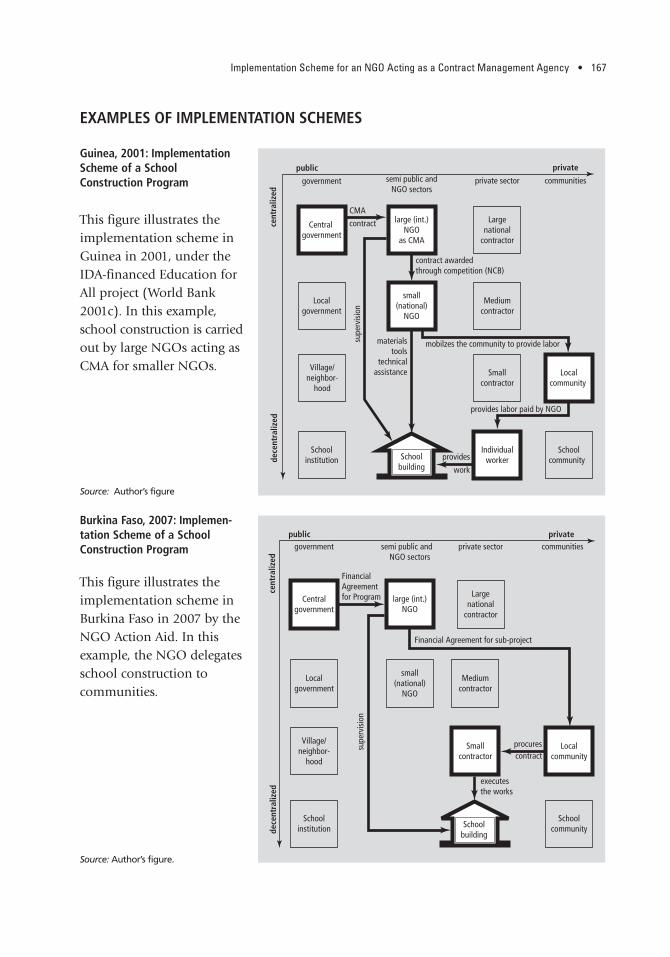
Implementation Scheme for an NGO Acting as a Contract Management Agency • 167
Guinea, 2001: ImplementationScheme of a School Construction Program
Source: Author’s figure
EXAMPLES OF IMPLEMENTATION SCHEMES
public
CMA
contract
contract awardedthrough competition (NCB)
materialstools
technicalassistance
provides labor paid by NGO
provides
work
private
communities
Localcommunity
dece
ntra
lized
Schoolinstitution
Individualworker
Schoolcommunity
supe
rvis
ion
Localgovernment
Mediumcontractor
Village/neighbor-
hood
Smallcontractor
small(national)
NGO
Central government
large (int.)NGO
as CMA
Largenational
contractor c
entr
aliz
ed
government private sector
Schoolbuilding
mobilzes the community to provide labor
semi public andNGO sectors
This figure illustrates theimplementation scheme inGuinea in 2001, under theIDA-financed Education forAll project (World Bank2001c). In this example,school construction is carriedout by large NGOs acting asCMA for smaller NGOs.
This figure illustrates theimplementation scheme inBurkina Faso in 2007 by theNGO Action Aid. In thisexample, the NGO delegatesschool construction to communities.
Burkina Faso, 2007: Implemen-tation Scheme of a School Construction Program
Source: Author’s figure.
public
FinancialAgreementfor Program
Financial Agreement for sub-project
procurescontract
executes the works
Localcommunity
dece
ntra
lized
Schoolinstitution
Schoolcommunity
Localgovernment
small(national)
NGO
Mediumcontractor
supe
rvis
ion
Village/neighbor-
hood
Smallcontractor
private
c
entr
aliz
ed
government private sector
Centralgovernment
large (int.)NGO
Largenational
contractor
Schoolbuilding
communitiessemi public and NGO sectors
168
Benin. Following the enactment of decentralization laws in 1999, 77 CommunalCouncils were established in February 2003 with a mandate for communal plan-ning, roads, the environment, drinking water, hygiene and sanitation, literacy,building, equipment and maintenance of primary schools, health centers, mar-kets, and abattoirs. However, devolution has not been accompanied by a transferof competencies, nor of human and financial resources. Nevertheless, 22 projectsfinanced by 12 donors supported decentralization in 2004. An IDA-financedNational Community-Driven Support Project, launched in 2005, was intended toaddress these issues by supporting the MoE in realigning and transferingresources to Communal Councils, which delegate the implementation of small-scale infrastructure to communities (World Bank 2004b).
Burkina Faso. Decentralization laws were first enacted in 1998, creating 45provinces and 33 elected communes, each headed by a mayor. In 2004, a presi-dential decree abolished the provinces and created rural communes with electedVillage Development Councils, as well as a permanent fund to assist them. Thenew Councils and resource transfers were to become effective in 2005, with Coun-cils assuming responsibility for primary and secondary school facilities in 2008.To date, an implementation plan to transfer the responsibilities and resources tothe Councils has not been adopted. Thus, the MoE continues to utilize variousapproaches for school construction, including management by provincial govern-ments. Provincial governments constructed 876 classrooms in 2003 with financ-ing from a PRSC fund supported by eight donors; management by Faso Baara,which constructed 1,050 classrooms in 2003 with HIPC funds; and MoE centrallymanaged construction of 120 classrooms in 2004 financed by domestic resources(Burkina Faso 2004; Group 5 2006a; World Bank 2005g, 2006a).
Burundi. Communes have existed since the colonial period, but with mandateslimited to administrative local management. After a decade of civil crisis, the new2005 Constitution and Local Government Law boosted the decentralizationprocess. Communal elections were held in September 2005 in 123 communes,including 13 in the capital, Bujumbura. Communal competencies are still limited
Decentralization of School Construction in Africa:Country Examples
APPENDIX 8

Decentralization of School Construction in Africa: Country Examples • 169
and central control important. IDA- and UNDP-financed projects have supportedpilots providing more responsibilities to communal committees. To date, thetransfer of competencies has been limited to administration. School constructionand maintenance have not been effectively transferred (Demante Sidibe 2006).
Cameroon. Decentralization laws were enacted in 2004, creating communes andregions for local development. In 1996, Cameroon counted 338 communes withelected councils, each headed by a mayor. Communes are responsible only for themanagement, equipment, and maintenance of preschools and primary schools.School construction remains a central MoE responsibility. (Cameroon 2004;Kamto 2002).
Chad. Chad is not decentralized. However, the school system is co-managed bythe MoE and the Federation of Parents Associations.
Ethiopia. In 1991, the central government devolved responsibilities to 11 regionalgovernments. School construction is centrally funded and regionally administeredwith some school contributions (Gershberg and Winkler 2003).
Ghana. The Local Government Act of 1992 divided the country into 103 districtswith elected District Assemblies. The District Assembly is legally responsible forprimary and secondary school facilities. However, resources and commitmenthave not followed. Although six out of thirteen donor-financed school construc-tion projects between 2000 and 2004 were managed by the districts, a 2006 reviewnoted that both the Ministry of Education and the development partners havebeen reluctant to entrust districts with the responsibility for education due to weakcapacity.
Guinea. A 1991 law created 38 Urban Communes with elected councils headed bya mayor, and 303 Development Rural Communes with elected councils headed bya Council President.
Mali. The Local Government Code was issued in 1995, creating 701 communeswith elected councils headed by a mayor. Elections were held during 1998–99. In2002, a government decree transferred the management of preschool and primaryschool construction to local governments (SNV and CEDELO 2004).
Malawi. A Local Government Act was passed in 1989 with the aim of graduallydevolving school construction to elected District Assemblies. Elections took placein 2000. Nevertheless, a variety of school construction programs are carried outwith no involvement of the District Assemblies. In 2003, Malawi launched adecentralized governance program in the southern part of the country by which
170 • School Construction Strategies for Universal Primary Education in Africa
District Assemblies decide on priorities, in consultation with communities, andmobilize resources to carry them out. Germany, Norway, the United States and theUNDP have contributed US$12 million in financing for the pilot project. (UNDP2003; Van Donge 2000).
Mauritania. The 1986 decentralization law created 48 urban and 163 rural LocalGovernments and devolved responsibility to them for basic education, includingconstruction, equipment, and maintenance of primary schools. Funds for primaryschool infrastructure are largely managed by the MoE, which has delegated theimplementation of school construction and maintenance to Parents’ Associations.In addition, school construction is managed by urban local governments throughurban development projects, which in turn delegated the management to AMEXTIPE.
Mozambique. In 1997, municipal legislation created a legal framework for electedgovernments in 33 municipalities. The 128 rural districts, which contain 70 per-cent of the population, are subject to state administration (World Bank 2003f).
Niger. As of 2006 Niger was not decentralized.
Nigeria. A 2002 review noted that although local governments are legally re -sponsible for school construction, both federal and state governments claim theyhave this function, and local governments rarely receive capital investment funds(Gershberg and Winkler 2003).
Senegal. A 1996 Local Government Act created 110 urban local governments(Communes) and 330 rural local governments (Communautés Rurales), giving themresponsibility for primary school construction and maintenance. By 2006, finan-cial transfers were limited, most responsibilities remained within the MoE, andlocal governments still had weak planning and implementation capacity. Therecent IDA-financed Participatory Local Development Project is expected toaddress these issues (World Bank 2006i).
Tanzania. A decentralization law was enacted in 1984, and local governmentswere elected in 1990. Local governments include 20 regional units, 113 Local Government Authorities, and about 11,000 wards and villages. Primary schoolconstruction is centrally funded, regionally administered, and overseen andimplemented by Local Government Authorities and schools. (Gershberg and Winkler 2003).
Uganda. The 1995 Constitution and the 1997 Local Government Act decentralizedthe provision of school facilities to 45 districts with elected councils and
Decentralization of School Construction in Africa: Country Examples • 171
800 counties. In 1999, Uganda developed a School Facility Grant Program thatcontinues today, in which District Councils administer and oversee school con-struction projects implemented by school communities. Funds are transferred todistricts and municipalities to be used in accordance with the Poverty ActionFund’s general guidelines issued by the Ministry of Finance, Planning, and Economic Development. School communities are represented by a School Management Committee, which prepares a community’s application for fundingand contracts and supervises the construction (Gershberg and Winkler 2003;Group 5 2006d).
Zambia. A Local Government Act was adopted in 1992, followed by local elec-tions. Local authorities carry out a limited range of tasks such as managing mar-kets and advising on road maintenance. The Ministry of Works and Supplies isresponsible for all public infrastructures, including school construction. The Min-istry of Local Government oversees the relationship between the line ministriesand the local authorities. A 2005 study notes an absence of coordination betweenthe central ministries and local governments. At the district level, coordinationvaries depending on vision, commitment, and capacity. The Social Fund, ZAMSIF,has been working with the local governments to foster decentralization (Group 52006e; Van Donge 2000).
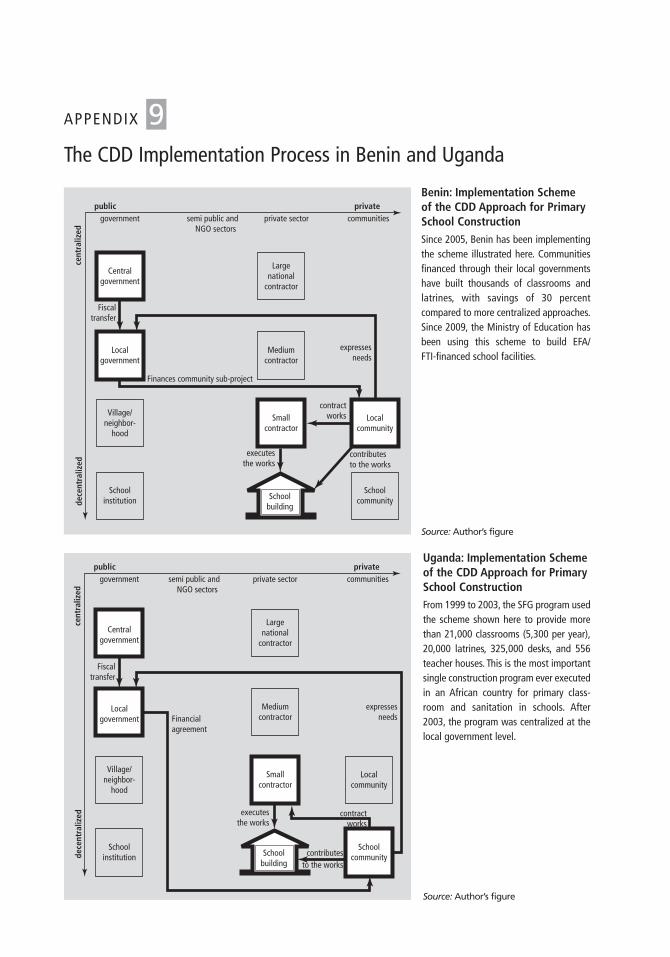
Uganda: Implementation Schemeof the CDD Approach for PrimarySchool ConstructionFrom 1999 to 2003, the SFG program usedthe scheme shown here to provide morethan 21,000 classrooms (5,300 per year),20,000 latrines, 325,000 desks, and 556teacher houses. This is the most importantsingle construction program ever executedin an African country for primary class-room and sanitation in schools. After2003, the program was centralized at thelocal government level.
Source: Author’s figure
public
Financialagreement
executesthe works
contractworks
expressesneeds
Fiscaltransfer
contributesto the works
Localcommunity
dece
ntra
lized
Schoolinstitution
Schoolcommunity
Localgovernment
Mediumcontractor
Village/neighbor-
hood
Smallcontractor
private
c
entr
aliz
ed
government private sector
Centralgovernment
Largenational
contractor
Schoolbuilding
communitiessemi public and NGO sectors
Benin: Implementation Schemeof the CDD Approach for PrimarySchool ConstructionSince 2005, Benin has been implementingthe scheme illustrated here. Communitiesfinanced through their local governmentshave built thousands of classrooms andlatrines, with savings of 30 percent compared to more centralized approaches.Since 2009, the Ministry of Education hasbeen using this scheme to build EFA/FTI-financed school facilities.
Source: Author’s figure
public
Finances community sub-project
executesthe works
contractworks
expressesneeds
Fiscaltransfer
contributesto the works
Localcommunity
dece
ntra
lized
Schoolinstitution
Schoolcommunity
Localgovernment
Mediumcontractor
Village/neighbor-
hood
Smallcontractor
private
c
entr
aliz
ed
government private sector
Centralgovernment
Largenational
contractor
Schoolbuilding
communitiessemi public and NGO sectors
The CDD Implementation Process in Benin and Uganda
APPENDIX 9

173
School Construction by Local GovernmentImplementation Arrangements
APPENDIX 10
Direct implementation of school construction by local government is illustratedin figure A10.1. It has been implemented in Ghana, Guinea, Mauritania, and Sene-gal. Delegation from local government to CMAs is illustrated in figure A10.2. It hasbeen implemented in Senegal and Mauritania, in parallel with direct managementby local governments in urban areas under IDA-financed urban development, aswell as rural infrastructure projects. Delegation from local governments to com-munities is illustrated in figure A10.3. Uganda and Benin provide examples of thisapproach.
public
procures the work throughNCB or LCB/3-quotations
executesworks
mobilizes community
expressesneeds
Fiscaltransfer
contributesto the works
Localcommunity
dece
ntra
lized
Schoolinstitution
Schoolcommunity
Localgovernment
Mediumcontractor
Village/neighbor-
hood
Smallcontractor
private
c
entr
aliz
ed
government private sector
Centralgovernment
Largenational
contractor
Schoolbuilding
communitiessemi public and NGO sectors
Figure A10.1 Devolution toLocal Governments that DirectlyImplement School Construction
Source: Author’s figure

174 • School Construction Strategies for Universal Primary Education in Africa
public
delegatesprogram
or LCB/3-quotations
procuresworksthroughNCB
executesworks
mobilizes community
expressesneeds
Fiscaltransfer
contributesto the works
Localcommunity
dece
ntra
lized
Schoolinstitution
Schoolcommunity
Localgovernment
Mediumcontractor
Village/neighbor-
hood
Smallcontractor
private
c
entr
aliz
ed
government private sector
Centralgovernment
Socialfund
Largenational
contractor
Schoolbuilding
communitiessemi public and NGO sectors
public
Financial agreement
executesthe works
contractworks
expressesneeds
Fiscaltransfer
contributesto the works
Localcommunity
dece
ntra
lized
Schoolinstitution
Schoolcommunity
Localgovernment
Mediumcontractor
Village/neighbor-
hood
Smallcontractor
private
c
entr
aliz
ed
government private sector
Centralgovernment
Largenational
contractor
Schoolbuilding
communitiessemi public and NGO sectors
Figure A10.3 Devolution to Local Governments and Subsequent Delegation to Local Communities
Source: Author’s figure
Figure A10.2 Delegation to Local Government and Subsequent Delegation to CMAs
Source: Author’s figure
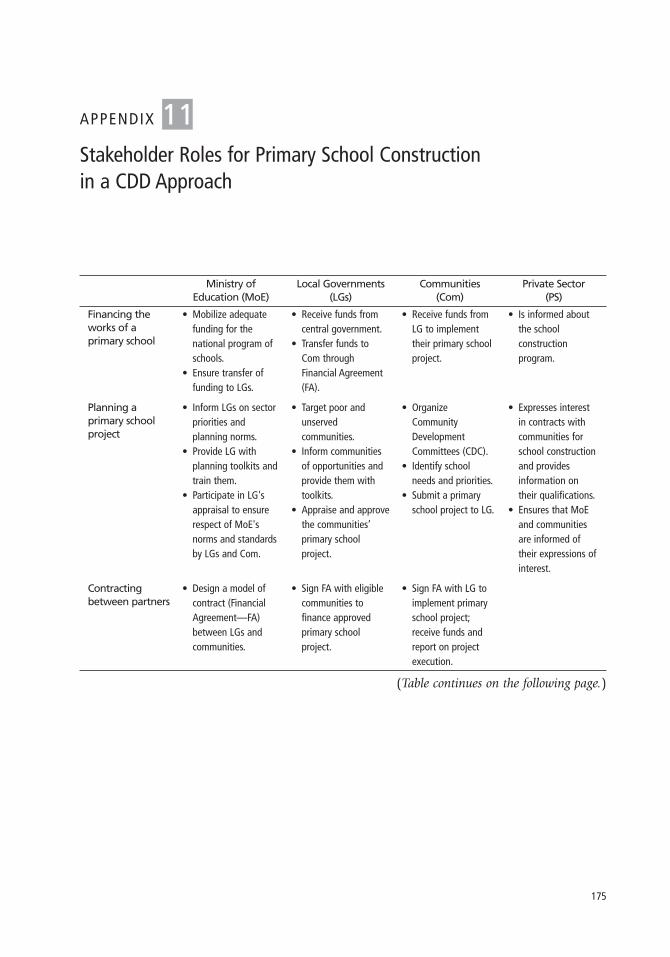
175
Ministry of Local Governments Communities Private SectorEducation (MoE) (LGs) (Com) (PS)
Financing theworks of a primary school
Planning a primary schoolproject
Contractingbetween partners
• Mobilize adequatefunding for thenational program ofschools.
• Ensure transfer offunding to LGs.
• Inform LGs on sectorpriorities and planning norms.
• Provide LG withplanning toolkits andtrain them.
• Participate in LG'sappraisal to ensurerespect of MoE'snorms and standardsby LGs and Com.
• Design a model ofcontract (FinancialAgreement—FA)between LGs andcommunities.
• Receive funds fromcentral government.
• Transfer funds toCom through Financial Agreement(FA).
• Target poor andunserved communities.
• Inform communitiesof opportunities andprovide them withtoolkits.
• Appraise and approvethe communities’ primary school project.
• Sign FA with eligiblecommunities tofinance approved primary school project.
• Receive funds fromLG to implementtheir primary schoolproject.
• Organize Community Development Committees (CDC).
• Identify schoolneeds and priorities.
• Submit a primaryschool project to LG.
• Sign FA with LG toimplement primaryschool project;receive funds andreport on projectexecution.
• Is informed aboutthe school construction program.
• Expresses interestin contracts withcommunities forschool constructionand provides information ontheir qualifications.
• Ensures that MoEand communitiesare informed oftheir expressions ofinterest.
(Table continues on the following page.)
Stakeholder Roles for Primary School Constructionin a CDD Approach
APPENDIX 11

176 • School Construction Strategies for Universal Primary Education in Africa
Ministry of Local Governments Communities Private SectorEducation (MoE) (LGs) (Com) (PS)
Organizing theprimary schoolproject implementation
Procuring works,goods and services, andmanaging contracts
Monitoring execution of contracts
Maintaining facilities
• Ensure LG receivestoolkits and trainingfor community project cycle management.
• Ensure Com receivestoolkit and trainingon project management.
• Ensures adequatefunding is providedto LGs for maintenance.
• Receive trainingon community project-cycle management (financing communities, monitoring communities’ performance).
• Supervise executionof FA by communities
• Hand over newlybuilt school facility ifit conforms to FA,and register into LGproperty file.
• Sign FA with communities to cofinance maintenance ofschools.
• Set up a ProjectManagement Committee (PMC).
• Receive trainingon procurement,financial management,and participatorymonitoring.
• Procure contracts forworks, furniture, andsite supervisionthrough local competition
• PMC monitors contracts andreports to CDC andcommunity.
• Sign FA with LG toexecute propermaintenance ofschools (self maintenance +outcontracting).
• Execute works, furniture procurement, andsite supervisionthrough contractswith communities.
• Engineers/executessite supervisionthrough contractswith community.
• Executes maintenance contracts with communities (painting, civilwork, andfurniture repairs).
(Table continued)
Source: Author’s elaboration.

177
Table A12.1 Norms and Standards
What Do We Need to Put in a Toolkit for Donor Harmonization Regarding Norms and Standards? An Exampleof a Simplified Table
Project Project Project Project Project Project Project Project 1 2 3 4 5 6 7 8 Harmonization
Maximum distancehome to school
Maximum schoolsize
Small “ruralfriendly” model
Urban multistoryschool model
Minimum SchoolFacility Package
Standard normfor primaryclassroom area
Ratio for areaof office andstorage
Standard designsfor a menu ofclassroom blocs
Standard designfor latrines andwater
Standard designfor flexiblefurniture
Planning norms
Schoolmodelandstandarddesigns
Toolkits to Harmonize Norms and Standardsand Implementation Strategies
APPENDIX 12

178 • School Construction Strategies for Universal Primary Education in Africa
Table A12.2 Toolkit for Donor Harmonization in Implementation Strategies
Project Project Project Project Project Project Project Project Ideal1 2 3 4 5 6 7 8 model
Ministry X
NGO
MCA
Local Gov.
Community X
Private sector
Ministry
NGO
MCA
Local Gov.
Community
Private sector
Ministry
NGO
MCA
Local Gov. X
Community X
Private sector
Ministry
NGO
MCA
Local Gov.
Community X
Private sector
Ministry
NGO
MCA
Local Gov.
Community X
Private sector
Ministry
NGO
MCA
Local Gov.
Community
Private sector X
Ministry
NGO
MCA
Local Gov. X
Community X
Private sector
Managing theoverall schoolconstructionproject
Planning a primary schoolproject
Contractingbetween partners
Organizing primary schoolproject implementation
Procuring works,goods and services, managing contracts
Monitoring execution of contracts
Maintaining facilities
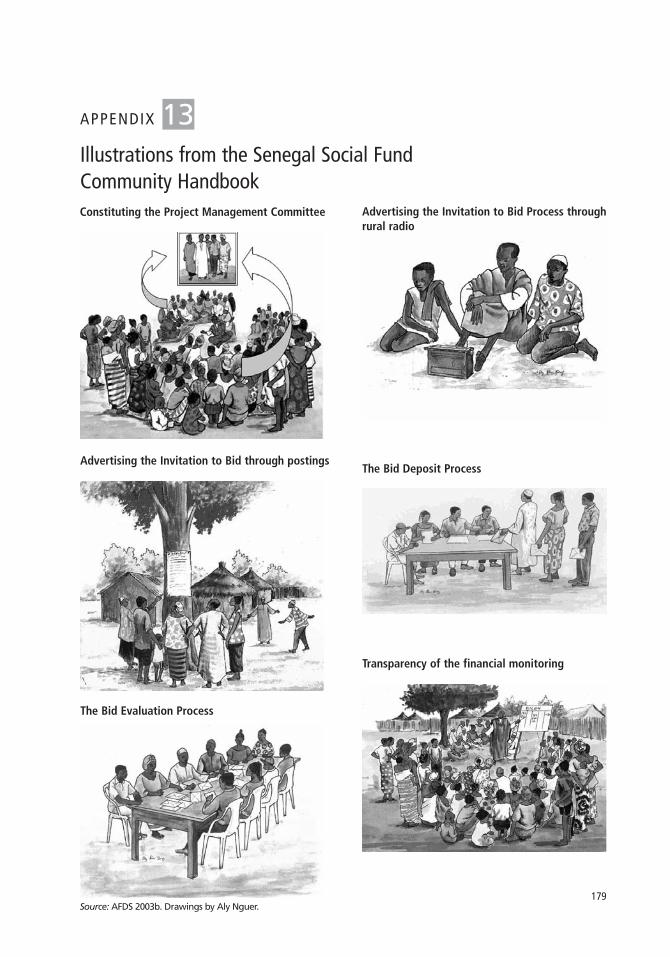
179
Transparency of the financial monitoring
Constituting the Project Management Committee
Source: AFDS 2003b. Drawings by Aly Nguer.
Advertising the Invitation to Bid Process throughrural radio
Advertising the Invitation to Bid through postingsThe Bid Deposit Process
The Bid Evaluation Process
Illustrations from the Senegal Social FundCommunity Handbook
APPENDIX 13
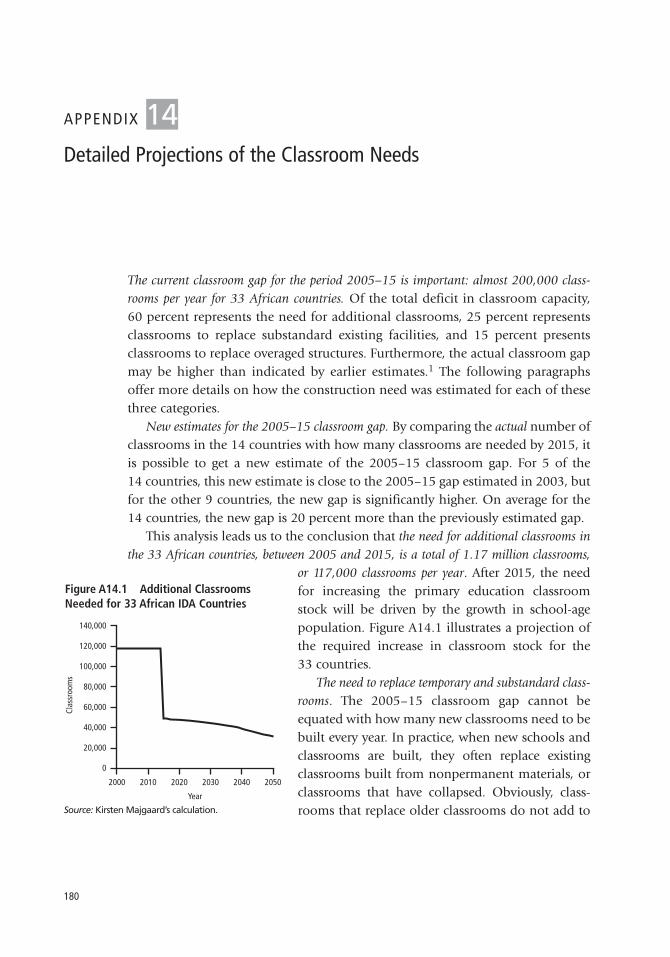
180
The current classroom gap for the period 2005–15 is important: almost 200,000 class-rooms per year for 33 African countries. Of the total deficit in classroom capacity,60 percent represents the need for additional classrooms, 25 percent representsclassrooms to replace substandard existing facilities, and 15 percent presents classrooms to replace overaged structures. Furthermore, the actual classroom gapmay be higher than indicated by earlier estimates.1 The following paragraphsoffer more details on how the construction need was estimated for each of thesethree categories.
New estimates for the 2005–15 classroom gap. By comparing the actual number ofclassrooms in the 14 countries with how many classrooms are needed by 2015, itis possible to get a new estimate of the 2005–15 classroom gap. For 5 of the14 countries, this new estimate is close to the 2005–15 gap estimated in 2003, butfor the other 9 countries, the new gap is significantly higher. On average for the14 countries, the new gap is 20 percent more than the previously estimated gap.
This analysis leads us to the conclusion that the need for additional classrooms inthe 33 African countries, between 2005 and 2015, is a total of 1.17 million classrooms,
or 117,000 classrooms per year. After 2015, the needfor increasing the primary education classroomstock will be driven by the growth in school-agepopulation. Figure A14.1 illustrates a projection ofthe required increase in classroom stock for the33 countries.
The need to replace temporary and substandard class-rooms. The 2005–15 classroom gap cannot beequated with how many new classrooms need to bebuilt every year. In practice, when new schools andclassrooms are built, they often replace existingclassrooms built from nonpermanent materials, orclassrooms that have collapsed. Obviously, class-rooms that replace older classrooms do not add to
Figure A14.1 Additional ClassroomsNeeded for 33 African IDA Countries
20,000
0
40,000
60,000
80,000
100,000
120,000
140,000
2000 2010 2020
Year
2030 2040 2050
Clas
sroo
ms
Source: Kirsten Majgaard’s calculation.
Detailed Projections of the Classroom Needs
APPENDIX 14
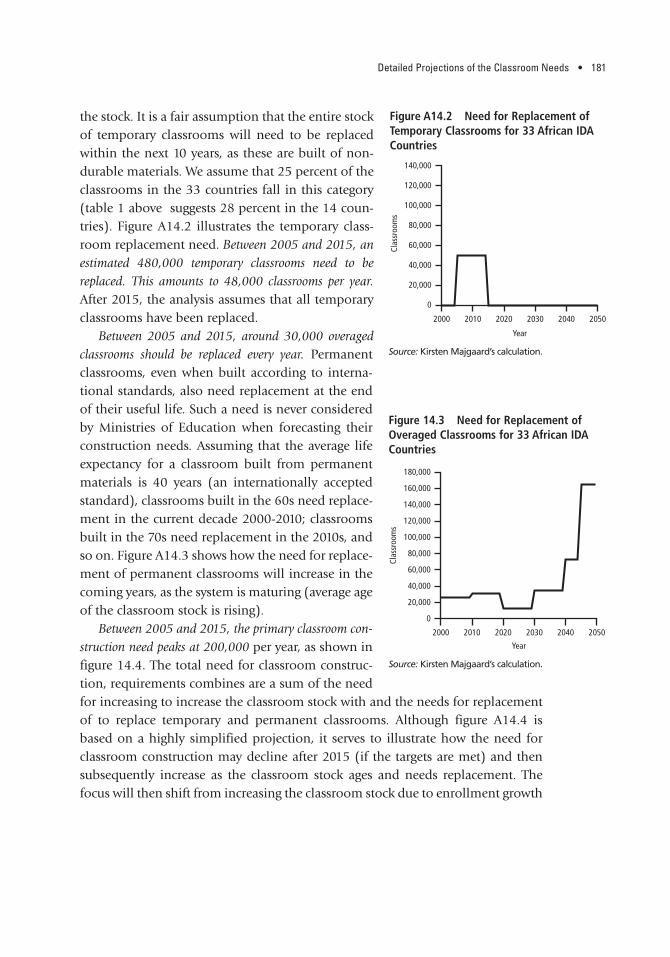
Detailed Projections of the Classroom Needs • 181
the stock. It is a fair assumption that the entire stockof temporary classrooms will need to be replacedwithin the next 10 years, as these are built of non-durable materials. We assume that 25 percent of theclassrooms in the 33 countries fall in this category(table 1 above suggests 28 percent in the 14 coun-tries). Figure A14.2 illustrates the temporary class-room replacement need. Between 2005 and 2015, anestimated 480,000 temporary classrooms need to bereplaced. This amounts to 48,000 classrooms per year.After 2015, the analysis assumes that all temporaryclassrooms have been replaced.
Between 2005 and 2015, around 30,000 overagedclassrooms should be replaced every year. Permanentclassrooms, even when built according to interna-tional standards, also need replacement at the endof their useful life. Such a need is never consideredby Ministries of Education when forecasting theirconstruction needs. Assuming that the average lifeexpectancy for a classroom built from permanentmaterials is 40 years (an internationally acceptedstandard), classrooms built in the 60s need replace-ment in the current decade 2000-2010; classroomsbuilt in the 70s need replacement in the 2010s, andso on. Figure A14.3 shows how the need for replace-ment of permanent classrooms will increase in thecoming years, as the system is maturing (average ageof the classroom stock is rising).
Between 2005 and 2015, the primary classroom con-struction need peaks at 200,000 per year, as shown infigure 14.4. The total need for classroom construc-tion, requirements combines are a sum of the needfor increasing to increase the classroom stock with and the needs for replacementof to replace temporary and permanent classrooms. Although figure A14.4 isbased on a highly simplified projection, it serves to illustrate how the need forclassroom construction may decline after 2015 (if the targets are met) and thensubsequently increase as the classroom stock ages and needs replacement. Thefocus will then shift from increasing the classroom stock due to enrollment growth
Figure A14.2 Need for Replacement ofTemporary Classrooms for 33 African IDACountries
Year
20,000
0
40,000
60,000
80,000
100,000
120,000
140,000
2000 2010 2020 2030 2040 2050
Clas
sroo
ms
Figure 14.3 Need for Replacement ofOveraged Classrooms for 33 African IDA Countries
20,000
0
40,000
60,000
80,000
100,000
120,000
140,000
2000 2010 2020
Year
2030 2040 2050
Clas
sroo
ms
160,000
180,000
Source: Kirsten Majgaard’s calculation.
Source: Kirsten Majgaard’s calculation.

182 • School Construction Strategies for Universal Primary Education in Africa
to the replacement of an ageing classroom stock. Allnew school construction should, as a rule, bereplaced 40 years later. Therefore, the estimated2005–15 peak will recur in 2045–55, as shown infigure A14.4. Between the two peaks, primary class-room construction demand will be 50,000–100,000per year.
NOTE
1. The 2003 gap assessment assumed that there were41 pupils per classroom in 2000.
Figure A14.4 Total Classroom ConstructionNeeds for 33 African IDA Countries
0
50,000
100,000
150,000
200,000
250,000
2000 2010 2020
Year
2030 2040 2050
Clas
sroo
ms
Source: Kirsten Majgaard’s calculation.

183
Schemes to implement school construction programs
C e
n t
r a
l i
z e
d
s
c h
e m
e s
CommunitiesFinancers
(government,donors)
Central Government(MoE, MPW)
NGOs
D e
c e
n t
r a
l i
z e
d
s
c h
e m
e s
1
2
3
4
5
62
7
8
9
10
11
12
School built by NGO with local contactor and community participation
School built by government through large contactor
School built by agency through medium contactor
School built by community through small local contactor
School built by NGO with local contactor and community participation
School built by government without community partic.
School built by communities (through small contractors)
School built by LG with medium contactor
School built by CMA or SF with medium contactor
School built by community through small local contactor
School built by NGO with local contactor and community participation
School built by community through small local contactor
Selection of contractor by NGOs through NGO’s procedure
Delegation to communities for primary schools
Delegation by LG’s to NGOs
Delegation by LG to Social Fund Agency
Social Fund transfers (some) funds to communities
Delegation by LG to CMA or SF
Selection of contractor by CMA or SF through NCB
Selection by LGs of contractor through LG’s procedure
Delegation to communities
Direct execution of the works (tests in local materials)
Delegation of the program to NGOs
Social Fund only: transfer of funds to communities
CMA or SF selection of contractor by CMA or SF through NCB
Delegation of the program to agency (CMA or SF)
Centralized procurement of large programs through ICB/ NCB
Financing by government ordonors
Direct execution by donors (bilaterals)
Agencies (CMA or SF)
Local Governments
Selection of contractor by NGOs through NGO’s procedure
Selection of contractor by NGOs through NGO’s procedure
Summary of the Various Implementation Schemes
APPENDIX 15

184
The Situation of School Construction Programsin Selected African Countries: Who Does What and How
APPENDIX 16
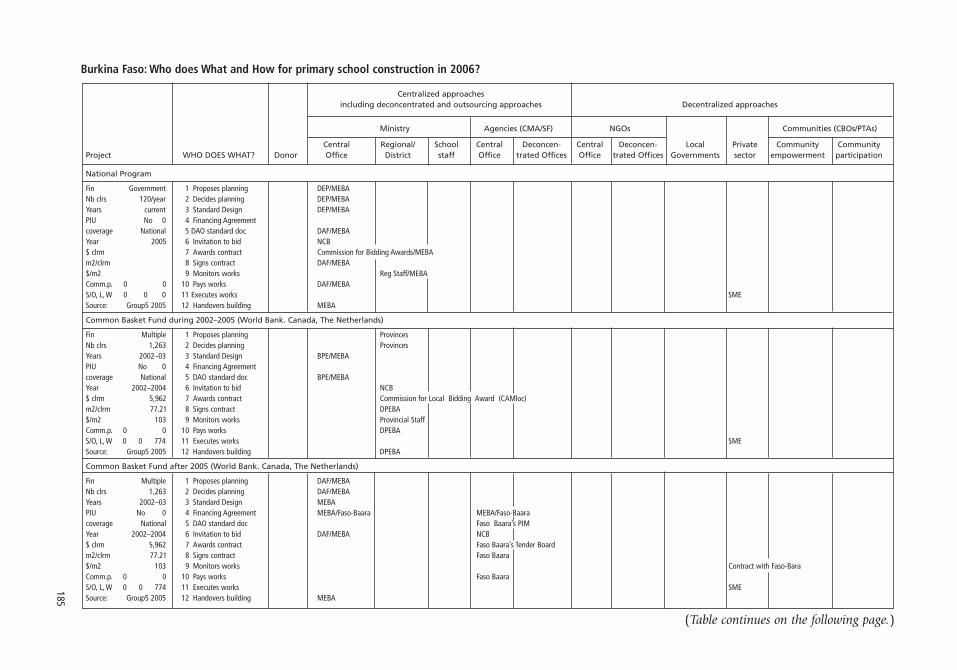
185
Burkina Faso: Who does What and How for primary school construction in 2006?
Centralized approachesincluding deconcentrated and outsourcing approaches Decentralized approaches
Ministry Agencies (CMA/SF) NGOs Communities (CBOs/PTAs)
Central Regional/ School Central Deconcen- Central Deconcen- Local Private Community CommunityProject WHO DOES WHAT? Donor Office District staff Office trated Offices Office trated Offices Governments sector empowerment participation
National Program
Fin Government 1 Proposes planning DEP/MEBANb clrs 120/year 2 Decides planning DEP/MEBAYears current 3 Standard Design DEP/MEBAPIU No 0 4 Financing Agreementcoverage National 5 DAO standard doc DAF/MEBAYear 2005 6 Invitation to bid NCB$ clrm 7 Awards contract Commission for Bidding Awards/MEBAm2/clrm 8 Signs contract DAF/MEBA$/m2 9 Monitors works Reg Staff/MEBAComm.p. 0 0 10 Pays works DAF/MEBA S/O, L, W 0 0 0 11 Executes works SMESource: Group5 2005 12 Handovers building MEBA
Common Basket Fund during 2002–2005 (World Bank. Canada, The Netherlands)
Fin Multiple 1 Proposes planning ProvincesNb clrs 1,263 2 Decides planning ProvincesYears 2002–03 3 Standard Design BPE/MEBAPIU No 0 4 Financing Agreementcoverage National 5 DAO standard doc BPE/MEBAYear 2002–2004 6 Invitation to bid NCB$ clrm 5,962 7 Awards contract Commission for Local Bidding Award (CAMloc)m2/clrm 77.21 8 Signs contract DPEBA$/m2 103 9 Monitors works Provincial StaffComm.p. 0 0 10 Pays works DPEBAS/O, L, W 0 0 774 11 Executes works SMESource: Group5 2005 12 Handovers building DPEBA
Common Basket Fund after 2005 (World Bank. Canada, The Netherlands)
Fin Multiple 1 Proposes planning DAF/MEBANb clrs 1,263 2 Decides planning DAF/MEBAYears 2002–03 3 Standard Design MEBA PIU No 0 4 Financing Agreement MEBA/Faso-Baara MEBA/Faso-Baaracoverage National 5 DAO standard doc Faso Baara’s PIMYear 2002–2004 6 Invitation to bid DAF/MEBA NCB$ clrm 5,962 7 Awards contract Faso Baara’s Tender Boardm2/clrm 77.21 8 Signs contract Faso Baara$/m2 103 9 Monitors works Contract with Faso-BaraComm.p. 0 0 10 Pays works Faso BaaraS/O, L, W 0 0 774 11 Executes works SMESource: Group5 2005 12 Handovers building MEBA
(Table continues on the following page.)
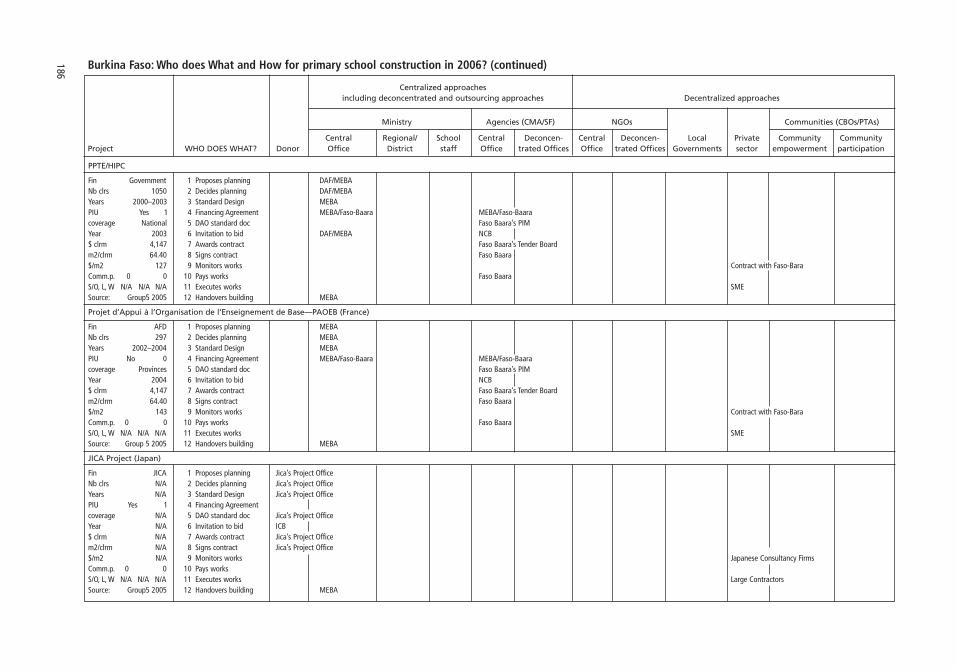
186
PPTE/HIPC
Fin Government 1 Proposes planning DAF/MEBANb clrs 1050 2 Decides planning DAF/MEBAYears 2000–2003 3 Standard Design MEBA PIU Yes 1 4 Financing Agreement MEBA/Faso-Baara MEBA/Faso-Baaracoverage National 5 DAO standard doc Faso Baara’s PIMYear 2003 6 Invitation to bid DAF/MEBA NCB$ clrm 4,147 7 Awards contract Faso Baara’s Tender Boardm2/clrm 64.40 8 Signs contract Faso Baara$/m2 127 9 Monitors works Contract with Faso-BaraComm.p. 0 0 10 Pays works Faso BaaraS/O, L, W N/A N/A N/A 11 Executes works SMESource: Group5 2005 12 Handovers building MEBA
Projet d’Appui à l’Organisation de l’Enseignement de Base—PAOEB (France)
Fin AFD 1 Proposes planning MEBANb clrs 297 2 Decides planning MEBAYears 2002–2004 3 Standard Design MEBAPIU No 0 4 Financing Agreement MEBA/Faso-Baara MEBA/Faso-Baaracoverage Provinces 5 DAO standard doc Faso Baara’s PIMYear 2004 6 Invitation to bid NCB$ clrm 4,147 7 Awards contract Faso Baara’s Tender Boardm2/clrm 64.40 8 Signs contract Faso Baara$/m2 143 9 Monitors works Contract with Faso-BaraComm.p. 0 0 10 Pays works Faso BaaraS/O, L, W N/A N/A N/A 11 Executes works SMESource: Group 5 2005 12 Handovers building MEBA
JICA Project (Japan)
Fin JICA 1 Proposes planning Jica’s Project OfficeNb clrs N/A 2 Decides planning Jica’s Project OfficeYears N/A 3 Standard Design Jica’s Project OfficePIU Yes 1 4 Financing Agreementcoverage N/A 5 DAO standard doc Jica’s Project OfficeYear N/A 6 Invitation to bid ICB$ clrm N/A 7 Awards contract Jica’s Project Officem2/clrm N/A 8 Signs contract Jica’s Project Office$/m2 N/A 9 Monitors works Japanese Consultancy FirmsComm.p. 0 0 10 Pays worksS/O, L, W N/A N/A N/A 11 Executes works Large ContractorsSource: Group5 2005 12 Handovers building MEBA
Burkina Faso: Who does What and How for primary school construction in 2006? (continued)
Centralized approachesincluding deconcentrated and outsourcing approaches Decentralized approaches
Ministry Agencies (CMA/SF) NGOs Communities (CBOs/PTAs)
Central Regional/ School Central Deconcen- Central Deconcen- Local Private Community CommunityProject WHO DOES WHAT? Donor Office District staff Office trated Offices Office trated Offices Governments sector empowerment participation
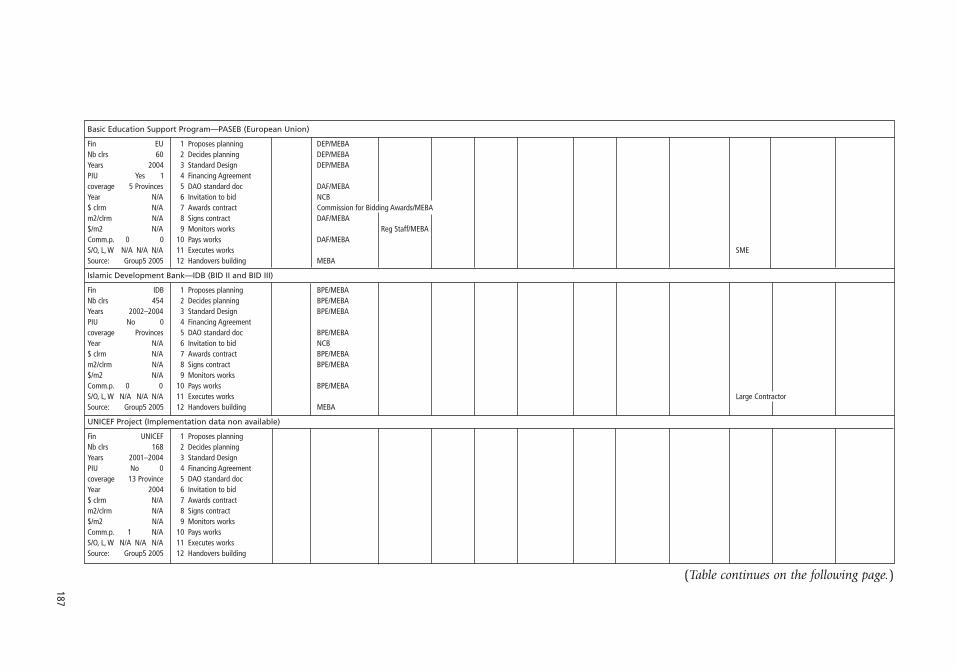
187
Basic Education Support Program—PASEB (European Union)
Fin EU 1 Proposes planning DEP/MEBANb clrs 60 2 Decides planning DEP/MEBAYears 2004 3 Standard Design DEP/MEBAPIU Yes 1 4 Financing Agreementcoverage 5 Provinces 5 DAO standard doc DAF/MEBAYear N/A 6 Invitation to bid NCB$ clrm N/A 7 Awards contract Commission for Bidding Awards/MEBAm2/clrm N/A 8 Signs contract DAF/MEBA$/m2 N/A 9 Monitors works Reg Staff/MEBAComm.p. 0 0 10 Pays works DAF/MEBA S/O, L, W N/A N/A N/A 11 Executes works SMESource: Group5 2005 12 Handovers building MEBA
Islamic Development Bank—IDB (BID II and BID III)
Fin IDB 1 Proposes planning BPE/MEBANb clrs 454 2 Decides planning BPE/MEBAYears 2002–2004 3 Standard Design BPE/MEBAPIU No 0 4 Financing Agreementcoverage Provinces 5 DAO standard doc BPE/MEBAYear N/A 6 Invitation to bid NCB$ clrm N/A 7 Awards contract BPE/MEBAm2/clrm N/A 8 Signs contract BPE/MEBA$/m2 N/A 9 Monitors worksComm.p. 0 0 10 Pays works BPE/MEBAS/O, L, W N/A N/A N/A 11 Executes works Large ContractorSource: Group5 2005 12 Handovers building MEBA
UNICEF Project (Implementation data non available)
Fin UNICEF 1 Proposes planningNb clrs 168 2 Decides planningYears 2001–2004 3 Standard DesignPIU No 0 4 Financing Agreementcoverage 13 Province 5 DAO standard docYear 2004 6 Invitation to bid$ clrm N/A 7 Awards contractm2/clrm N/A 8 Signs contract$/m2 N/A 9 Monitors worksComm.p. 1 N/A 10 Pays worksS/O, L, W N/A N/A N/A 11 Executes worksSource: Group5 2005 12 Handovers building
(Table continues on the following page.)

188
Plan International, Burkina Faso Project
Fin Plan 1 Proposes planning NGONb clrs 55 2 Decides planning MEBAYears 2003–2004 3 Standard Design NGOPIU Yes 1 4 Financing Agreement NGO/MEBA NGO/MEBAcoverage N/A 5 DAO standard doc NGOYear 2004 6 Invitation to bid NGO$ clrm 4,147 7 Awards contract NGOm2/clrm 64.40 8 Signs contract NGO$/m2 125 9 Monitors works NGOComm.p. 1 N/A 10 Pays works NGOS/O, L, W N/A N/A N/A 11 Executes works Micro-contractor CommunitySource: Group5 2005 12 Handovers building MEBA
OSEO
Fin NGO 1 Proposes planning NGONb clrs 2 Decides planning MEBAYears 3 Standard Design NGOPIU Yes 1 4 Financing Agreement NGO/MEBA NGO/MEBAcoverage Provinces 5 DAO standard doc NGOYear 6 Invitation to bid NGO$ clrm 17,089 7 Awards contract NGOm2/clrm 78 8 Signs contract NGO$/m2 219 9 Monitors works NGOComm.p. 1 N/A 10 Pays works NGOS/O, L, W 0 0 0 11 Executes works Micro-contractor CommunitySource: OSEO 12 Handovers building MEBA
Other NGOs: CRS Cathwell, OSEO, Save the Children, Born Fenden
Fin NGO 1 Proposes planning NGONb clrs 163 2 Decides planning MEBAYears 2004 3 Standard Design NGOPIU Yes 1 4 Financing Agreement NGO/MEBA NGO/MEBAcoverage Provinces 5 DAO standard doc NGOYear N/A 6 Invitation to bid NGO$ clrm N/A 7 Awards contract NGOm2/clrm N/A 8 Signs contract NGO$/m2 N/A 9 Monitors works NGOComm.p. 1 N/A 10 Pays works NGOS/O, L, W N/A N/A N/A 11 Executes works Micro-contractor CommunitySource: Group5 2005 12 Handovers building MEBA
Centralized approachesincluding deconcentrated and outsourcing approaches Decentralized approaches
Ministry Agencies (CMA/SF) NGOs Communities (CBOs/PTAs)
Central Regional/ School Central Deconcen- Central Deconcen- Local Private Community CommunityProject WHO DOES WHAT? Donor Office District staff Office trated Offices Office trated Offices Governments sector empowerment participation
Burkina Faso: Who does What and How for primary school construction in 2006? (continued)
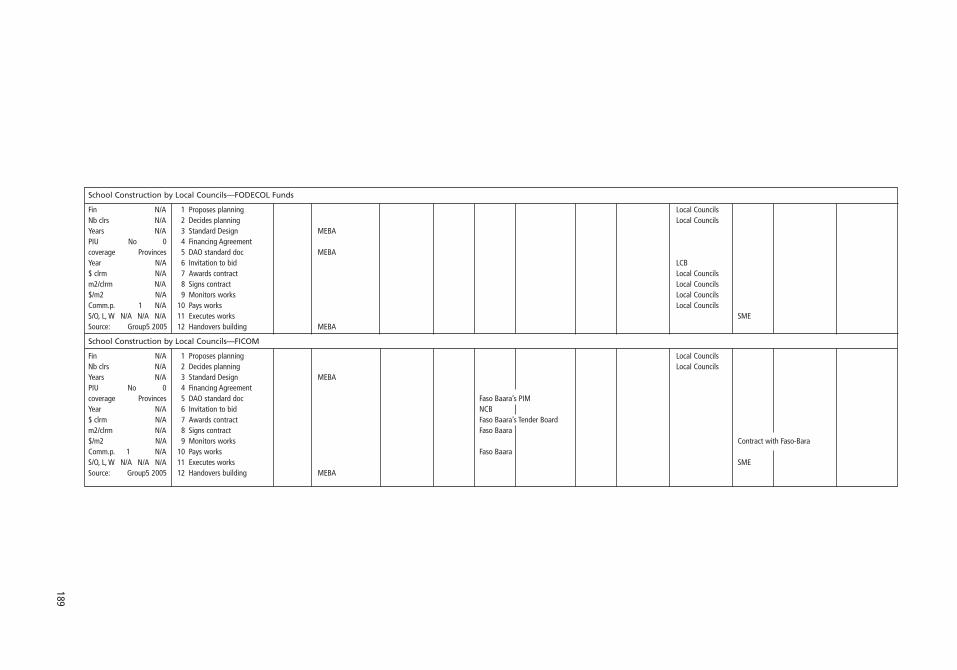
189
School Construction by Local Councils—FODECOL Funds
Fin N/A 1 Proposes planning Local CouncilsNb clrs N/A 2 Decides planning Local CouncilsYears N/A 3 Standard Design MEBAPIU No 0 4 Financing Agreementcoverage Provinces 5 DAO standard doc MEBAYear N/A 6 Invitation to bid LCB$ clrm N/A 7 Awards contract Local Councilsm2/clrm N/A 8 Signs contract Local Councils$/m2 N/A 9 Monitors works Local CouncilsComm.p. 1 N/A 10 Pays works Local CouncilsS/O, L, W N/A N/A N/A 11 Executes works SMESource: Group5 2005 12 Handovers building MEBA
School Construction by Local Councils—FICOM
Fin N/A 1 Proposes planning Local CouncilsNb clrs N/A 2 Decides planning Local CouncilsYears N/A 3 Standard Design MEBAPIU No 0 4 Financing Agreementcoverage Provinces 5 DAO standard doc Faso Baara’s PIMYear N/A 6 Invitation to bid NCB$ clrm N/A 7 Awards contract Faso Baara’s Tender Boardm2/clrm N/A 8 Signs contract Faso Baara$/m2 N/A 9 Monitors works Contract with Faso-BaraComm.p. 1 N/A 10 Pays works Faso BaaraS/O, L, W N/A N/A N/A 11 Executes works SMESource: Group5 2005 12 Handovers building MEBA

190
Mauritania: Who does What and How for primary school construction in 2006?
Centralized approaches includingdeconcentrated and outsourcing approaches Decentralized approaches
Ministry Agencies (CMA/SF) NGOs Communities (CBOs/PTAs)
WHO DOES Central Regional/ School Central Deconcentrated Central Deconcentrated Local Private Community CommunityProject WHAT? Donor Office District staff Office Offices Office Offices Governments sector empowerment participation Comments
National Ten-Year Education and Training Program (PNDSE)
Fin IDA/AFD 1 Proposes planning Parents Association DPEF isNb clrs 5,000 2 Decides planning DPEF successfullyYears 1989–2006 3 Standard Design DPEF managingPIU 1 DPEF 4 Financing Agreement btwn DPEF and Parents Ass. btwn DPEF and Parents Ass. the Moe’scoverage National 5 DAO standard doc DPEF’s Operation Manual programYear 2001 6 Invitation to bid 3Q or DC since 1989$ clrm 7,678 7 Awards contract Parents AssociationGross m2 53.25 8 Signs contract Parents AssociationGross $/m2 144 9 Monitors works DPEF’s engineersComm.p. 1 30% 10 Pays works Parents AssociationS/O, L, W 1 1 0 11 Executes works Micro-contractorSource: PNDSE/ST 12 Handovers building MoE
Urban Development Project
Fin IDA 1 Proposes planning Local Government The Project isNb clrs N/A 2 Decides planning Local Government using theYears 1995–2006 3 Standard Design MoE (similar to DPEF) same modelPIU 0 No 4 Financing Agreement btwn MoE and AMEXTIPE btwn MoE and AMEXTIPE as DPEFcoverage Urban 5 DAO standard doc AMEXTIPE’s Operation ManualYear 2002 6 Invitation to bid National Competitive Bidding$ clrm 12,325 7 Awards contract AMEXTIPE’s Tender BoardGross m2 53.25 8 Signs contract AMEXTIPE Gross $/m2 231 9 Monitors works Contract with AMEXTIPEComm.p. 0 No 10 Pays works AMEXTIPE S/O, L, W 1 1 0 11 Executes works SMESource: PNDSE/ST 12 Handovers building MoE

191
Niger: Who does What and How for primary school construction in 2006?
Centralized approaches includingdeconcentrated and outsourcing approaches Decentralized approaches
Ministry Agencies (CMA/SF) NGOs Communities (CBOs/PTAs)Deconcen- Deconcen-
Central Regional/ School Central trated Central trated Local Private Community CommunityProject WHO DOES WHAT? Donor Office District staff Office Offices Office Offices Governments sector empowerment participation
PPTE
Fin Government 1 Proposes planningNb clrs 2 Decides planningYears 3 Standard DesignPIU 4 Financing Agreementcoverage 5 DAO standard docYear 6 Invitation to bid$ clrm 7 Awards contractm2/clrm 56.00 8 Signs contract$/m2 – 9 Monitors worksComm.p. 10 Pays worksAB, L, W 1 1 0 11 Executes worksSource: Soul. Zerbo 12 Handovers building
PADEB (classic)
Fin IDA 1 Proposes planning Planning DirectorateNb clrs 2 Decides planning Planning DirectorateYears 3 Standard Design Infrastructure DirectoratePIU 4 Financing Agreementcoverage 5 DAO standard doc national NCB doc (adapted)Year 6 Invitation to bid MoE Regional Directorate (NCB)$ clrm 8,257 7 Awards contract Regional Tenderboardm2/clrm 56.00 8 Signs contract MoE Regional Directorate$/m2 147.44 9 Monitors works Contractual agent of Reg MoE DirComm.p. 10 Pays works MoE Regional DirectorateAB, L, W 1 1 0 11 Executes works SMESource: Soul. Zerbo 12 Handovers building MoE Regional Directorate
PADEB (shelter)
Fin IDA 1 Proposes planning Planning DirectorateNb clrs 2 Decides planning Planning DirectorateYears 3 Standard Design Infrastructure DirectoratePIU 4 Financing Agreementcoverage 5 DAO standard doc national NCB doc (adapted)Year 6 Invitation to bid MoE Regional Directorate (NCB)$ clrm 3,457 7 Awards contract Regional Tenderboardm2/clrm 56.00 8 Signs contract MoE Regional Directorate$/m2 61.73 9 Monitors works Contractual agent of Reg MoE DirComm.p. 10 Pays works MoE Regional DirectorateAB, L, W 0 1 0 11 Executes works SMESource: Soul. Zerbo 12 Handovers building MoE Regional Directorate
(Table continues on the following page.)

192
AFD-funded project (name ?)
Fin AFD 1 Proposes planningNb clrs 2 Decides planningYears 3 Standard DesignPIU 4 Financing Agreementcoverage 5 DAO standard docYear 6 Invitation to bid$ clrm 7 Awards contractm2/clrm 56.00 8 Signs contract$/m2 - 9 Monitors worksComm.p. 10 Pays worksAB, L, W 1 1 0 11 Executes worksSource: Soul. Zerbo 12 Handovers building
KfW-funded Project (name ?)
Fin KfW 1 Proposes planningNb clrs 2 Decides planningYears 3 Standard DesignPIU 4 Financing Agreementcoverage 5 DAO standard docYear 6 Invitation to bid$ clrm 7 Awards contractm2/clrm 56.00 8 Signs contract$/m2 - 9 Monitors worksComm.p. 10 Pays worksAB, L, W 0 1 0 11 Executes worksSource: Soul. Zerbo 12 Handovers building
PAEFAN (name ?)
Fin ??? 1 Proposes planningNb clrs 2 Decides planningYears 3 Standard DesignPIU 4 Financing Agreementcoverage 5 DAO standard docYear 6 Invitation to bid$ clrm 7 Awards contractm2/clrm 56.00 8 Signs contract$/m2 - 9 Monitors worksComm.p. 10 Pays worksAB, L, W 1 1 0 11 Executes worksSource: Soul. Zerbo 12 Handovers building
Niger: Who does What and How for primary school construction in 2006? (continued)
Centralized approaches includingdeconcentrated and outsourcing approaches Decentralized approaches
Ministry Agencies (CMA/SF) NGOs Communities (CBOs/PTAs)Deconcen- Deconcen-
Central Regional/ School Central trated Central trated Local Private Community CommunityProject WHO DOES WHAT? Donor Office District staff Office Offices Office Offices Governments sector empowerment participation

193
Senegal: Who does What and How for primary school construction in 2006?
Centralized approaches including deconcentrated and outsourcing approaches Decentralized approaches
Ministry Agencies (CMA/SF) NGOs Communities (CBOs/PTAs)
Decon- Decon-cen- cen- Local
WHO DOES Central Regional/ School Central trated Central trated Govern- Private Community CommunityProject WHAT? Donor Office District Staff Office Offices Office Offices Ments Sector Empowerment Participation Comments
1. AFDS (Agence du Fonds de Développement Social
Fin IDA 1 Proposes planning CommunityNb clrs 115 2 Decides planning CommunityYears 2002–06 3 Standard Design Same as AGETIPPIU 0 4 Financing Agreement between AFDS and Comm. between AFDS and Comm.coverage 5 regions 5 DAO standard doc in the PIMYear 2006 6 Invitation to bid LCB$ clrm 7,498 7 Awards contract Community's Tender Boardm2/clrm 65.20 8 Signs contract by Comm.$/m2 115.00 9 Monitors works contract with comm.Comm.p. 1 5% 10 Pays works by Comm.O/S, L, W 1 1 1 11 Executes works micro-contractor.Source: Dupety/Sow 12 Handovers building according to Law
Education Project III (AfDB III)
Fin AfDB 1 Proposes planning DCESNb clrs 0 (rehab) 2 Decides planning DECSYears 2001–04 3 Standard Design DECSPIU 0 4 Financing Agreementcoverage 5 DAO standard doc NCB/DCESYear 6 Invitation to bid DCES$ clrm 7 Awards contract National Tender Boardm2/clrm 8 Signs contract DCES$/m2 #VALUE! 9 Monitors works DCESComm.p. 10 Pays works DCES AB, L, W 11 Executes works SMESource: Dupety 2005 12 Handovers building MoE
Investment Consolidated Budget (BCI)
Fin Government 1 Proposes planning DCESNb clrs 4,804 2 Decides planning DECSYears 2002–06 3 Standard Design DECSPIU 0 4 Financing Agreementcoverage National 5 DAO standard doc NCB/DCESYear 2005 6 Invitation to bid DCES$ clrm 8,473 7 Awards contract National Tender Boardm2/clrm 67.34 8 Signs contract DCES$/m2 125.83 9 Monitors works DCESComm.p. 0 0 10 Pays works DCES O/S, L, W 0 0 0 11 Executes works SMESource: Dupety 2005 12 Handovers building MoE
Communities have proven they have thecapacity to carryout school construction
At the end ofthe program, 45 classroomsare subject to contract managementissues
(Table continues on the following page.)
During the consultant’sreview, 97 clas-roooms wereuncompletedbecause of contract issues

194
JICA IV
Fin JICA 1 Proposes planning JICANb clrs 323 2 Decides planning JICAYears 2002–04 3 Standard Design JICAPIU 0 4 Financing Agreementcoverage Urban 5 DAO standard doc JICAYear 6 Invitation to bid JICA$ clrm N/A 7 Awards contract JICAm2/clrm 8 Signs contract JICA$/m2 N/A 9 Monitors works DCESComm.p. 0 0 10 Pays works DCES O/S, L, W 0 0 0 11 Executes works Large ContractorSource: Dupety 2005 12 Handovers building MoEOPEP IIIFin OPEP 1 Proposes planning DCESNb clrs 125 2 Decides planning DECSYears 2003–04 3 Standard Design DECSPIU 0 4 Financing Agreementcoverage 5 DAO standard doc NCB/DCESYear 2004 6 Invitation to bid DCES$ clrm 9,206 7 Awards contract National Tender Boardm2/clrm 67.34 8 Signs contract DCES$/m2 136.71 9 Monitors works DCESComm.p. 0 0 10 Pays works DCES O/S, L, W 0 0 0 11 Executes works SMESource: Dupety 2005 12 Handovers building MoE
Commune Support Project (PAC)
Fin IDA 1 Proposes planning DCESNb clrs 15 2 Decides planning DCESYears 2000–02 3 Standard Design AGETIPPIU 0 4 Financing Agreement Btwn AGETIP and LG Btwn AGETIP and LGcoverage Sec. Towns 5 DAO standard doc AGETIP's Operation ManualYear 2002 6 Invitation to bid AGETIP's Tender Board$ clrm 9,079 7 Awards contract AGETIP's Tender Boardm2/clrm 63.38 8 Signs contract AGETIP's Tender Board$/m2 143.24 9 Monitors works contract with AGETIPComm.p. 0 0 10 Pays works AGETIPAB, L, W 0 0 0 11 Executes works SMESource: Dupety 2005 12 Handovers building MoE with LG with MoE
All the program ismanaged by JICA.The consultantcould not collectinformation oncost
Senegal: Who does What and How for primary school construction in 2006? (continued)
Centralized approaches including deconcentrated and outsourcing approaches Decentralized approaches
Ministry Agencies (CMA/SF) NGOs Communities (CBOs/PTAs)
Decon- Decon-cen- cen- Local
WHO DOES Central Regional/ School Central trated Central trated Govern- Private Community CommunityProject WHAT? Donor Office District Staff Office Offices Office Offices ments sector empowerment participation Comments
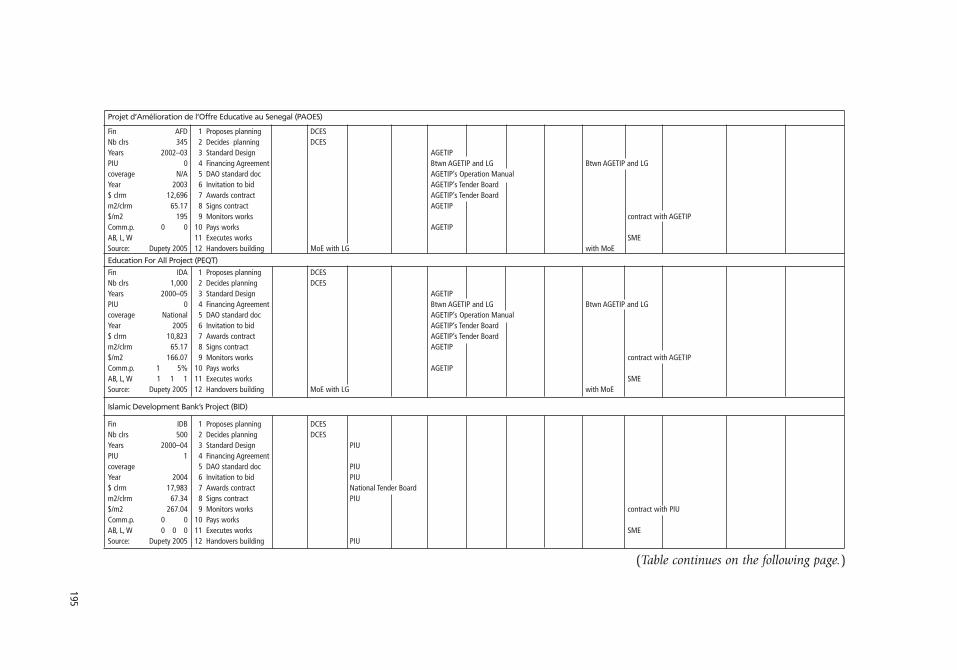
195
Projet d’Amélioration de l’Offre Educative au Senegal (PAOES)
Fin AFD 1 Proposes planning DCESNb clrs 345 2 Decides planning DCESYears 2002–03 3 Standard Design AGETIPPIU 0 4 Financing Agreement Btwn AGETIP and LG Btwn AGETIP and LGcoverage N/A 5 DAO standard doc AGETIP’s Operation ManualYear 2003 6 Invitation to bid AGETIP’s Tender Board$ clrm 12,696 7 Awards contract AGETIP’s Tender Boardm2/clrm 65.17 8 Signs contract AGETIP$/m2 195 9 Monitors works contract with AGETIPComm.p. 0 0 10 Pays works AGETIPAB, L, W 11 Executes works SMESource: Dupety 2005 12 Handovers building MoE with LG with MoE
Education For All Project (PEQT)
Fin IDA 1 Proposes planning DCESNb clrs 1,000 2 Decides planning DCESYears 2000–05 3 Standard Design AGETIPPIU 0 4 Financing Agreement Btwn AGETIP and LG Btwn AGETIP and LGcoverage National 5 DAO standard doc AGETIP’s Operation ManualYear 2005 6 Invitation to bid AGETIP’s Tender Board$ clrm 10,823 7 Awards contract AGETIP’s Tender Boardm2/clrm 65.17 8 Signs contract AGETIP$/m2 166.07 9 Monitors works contract with AGETIPComm.p. 1 5% 10 Pays works AGETIPAB, L, W 1 1 1 11 Executes works SMESource: Dupety 2005 12 Handovers building MoE with LG with MoE
Islamic Development Bank’s Project (BID)
Fin IDB 1 Proposes planning DCESNb clrs 500 2 Decides planning DCESYears 2000–04 3 Standard Design PIUPIU 1 4 Financing Agreementcoverage 5 DAO standard doc PIUYear 2004 6 Invitation to bid PIU$ clrm 17,983 7 Awards contract National Tender Boardm2/clrm 67.34 8 Signs contract PIU$/m2 267.04 9 Monitors works contract with PIUComm.p. 0 0 10 Pays worksAB, L, W 0 0 0 11 Executes works SMESource: Dupety 2005 12 Handovers building PIU
(Table continues on the following page.)
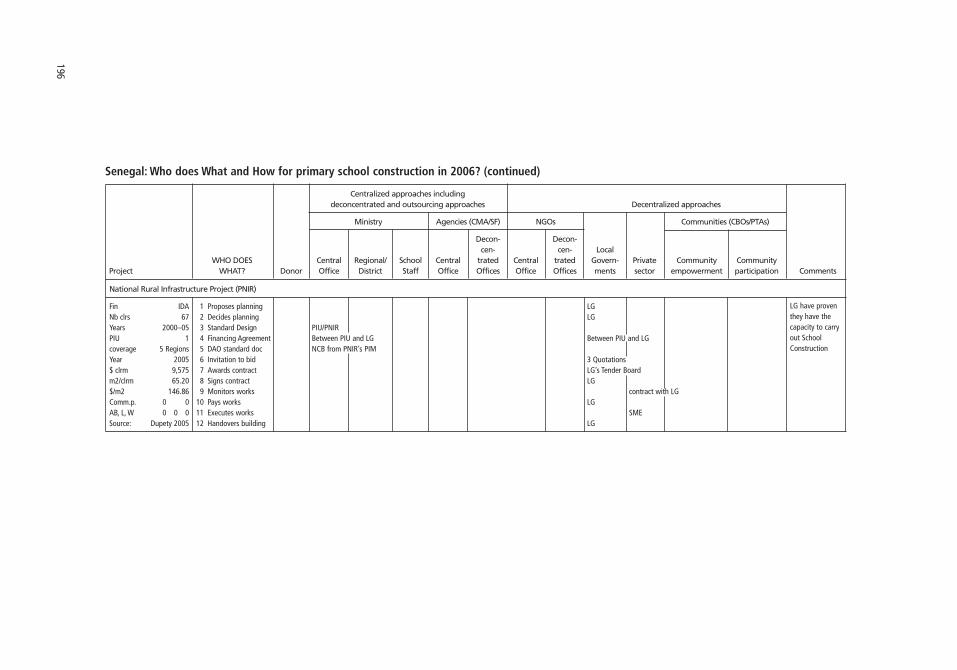
196
National Rural Infrastructure Project (PNIR)
Fin IDA 1 Proposes planning LGNb clrs 67 2 Decides planning LGYears 2000–05 3 Standard Design PIU/PNIRPIU 1 4 Financing Agreement Between PIU and LG Between PIU and LGcoverage 5 Regions 5 DAO standard doc NCB from PNIR’s PIMYear 2005 6 Invitation to bid 3 Quotations$ clrm 9,575 7 Awards contract LG’s Tender Boardm2/clrm 65.20 8 Signs contract LG$/m2 146.86 9 Monitors works contract with LGComm.p. 0 0 10 Pays works LGAB, L, W 0 0 0 11 Executes works SMESource: Dupety 2005 12 Handovers building LG
Senegal: Who does What and How for primary school construction in 2006? (continued)
Centralized approaches including deconcentrated and outsourcing approaches Decentralized approaches
Ministry Agencies (CMA/SF) NGOs Communities (CBOs/PTAs)
Decon- Decon-cen- cen- Local
WHO DOES Central Regional/ School Central trated Central trated Govern- Private Community CommunityProject WHAT? Donor Office District Staff Office Offices Office Offices ments sector empowerment participation Comments
LG have proventhey have thecapacity to carryout School Construction

197
Zambia: Who does What and How for primary school construction in 2006?
Centralized approaches includingdeconcentrated and outsourcing approaches Decentralized approaches
Ministry Agencies (CMA/SF) NGOs Communities (CBOs/PTAs)
WHO DOES Central Regional/ School Central Deconcentrated Central Deconcentrated Local Private Community CommunityProject WHAT? Donor Office District staff Office Offices Office Offices Governments sector empowerment participation Comments
Basic Education Sub-Sector Investment Plan—BESSIP (DANIDA, DFID, Finland, Ireland Aid, Netherland, Norway and GRZ)
Fin Multiple 1 Proposes planning Province The PresentNb clrs/year 27 2 Decides planning Province programYears 2000–2003 3 Standard Design SIS/DP/MoE ESSP III PIU 0 No 4 Financing Agreement (1999–2003)coverage National 5 DAO standard doc MoE followed Year 2003 6 Invitation to bid LS/DC ESSP II but$ clrm 6,500 7 Awards contract Community since 2000Gross m2 59.80 8 Signs contract Community is fullyGross $/m2 108.70 9 Monitors works SIS/DP/MoE District Building Officer Comm. Mangmt. Committee integratedComm.p. 1 10 Pays works Community into theS/O, L, W 0 1 0 11 Executes works Jobbers MoE program.Source: Group5 2005e 12 Handovers building Province
Basic Education Support Program—BESP (Ireland Aid)
Fin Ireland 1 Proposes planning Province SameNb clrs/year 30 2 Decides planning Province mechanismYears 2000–2002 3 Standard Design SIS/DP/MoE as BESSIP.PIU 0 No 4 Financing Agreement Funds arecoverage North Prov 5 DAO standard doc MoE deposited intoYear 2002 6 Invitation to bid LS/DC the “pool,$ clrm 6,500 7 Awards contract Community but earmarkedGross m2 59.80 8 Signs contract Community for NorthernGross $/m2 108.70 9 Monitors works SIS/DP/MoE District Building Officer Comm. Mangmt. Committee ProvincesComm.p. 1 10 Pays works CommunityS/O, L, W 11 Executes works JobbersSource: Group5 2005 12 Handovers building Province
Basic School Construction Program—BSCP (World Bank)
Fin IDA 1 Proposes planning ProvinceNb clrs/year 70 2 Decides planning ProvinceYears 2002–2003 3 Standard Design SIS/DP/MoEPIU 0 No 4 Financing Agreementcoverage Rural 5 DAO standard doc MoEYear 2003 6 Invitation to bid National Competitive Bidding$ clrm 7,800 7 Awards contract MoEGross m2 59.80 8 Signs contract MoEGross $/m2 130 9 Monitors works SIS/DP/MoE District Building OfficerComm.p. 0 10 Pays works MoE S/O, L, W N/A N/A N/A 11 Executes works SMESource: Group5 2005 12 Handovers building MoE
(Table continues on the following page.)

198 Zambia: Who does What and How for primary school construction in 2006? (continued)
Centralized approaches includingdeconcentrated and outsourcing approaches Decentralized approaches
Ministry Agencies (CMA/SF) NGOs Communities (CBOs/PTAs)
WHO DOES Central Regional/ School Central Deconcentrated Central Deconcentrated Local Private Community CommunityProject WHAT? Donor Office District staff Office Offices Office Offices Governments sector empowerment participation Comments
Education III (AfDB)
Fin AfDB 1 Proposes planning SIS/DP/MoENb clrs/year 94 2 Decides planning SIS/DP/MoEYears 2002–2003 3 Standard Design MoEPIU 0 No 4 Financing Agreementcoverage National 5 DAO standard doc MoEYear 2003 6 Invitation to bid International Competitive Bidding$ clrm 7,300 7 Awards contract MoEGross m2 59.80 8 Signs contract MoEGross $/m2 122 9 Monitors works SIS/DP/MoE District Building OfficerComm.p. 0 No 10 Pays works MoE S/O, L, W 1 1 1 11 Executes works Large ContractorsSource: Group5 2005 12 Handovers building MoE
Primary School Upgrading Project—OPSUP (OPEC)
Fin OPEC 1 Proposes planning ZEPIUNb clrs/year 44 2 Decides planning ZEPIUYears N/A 3 Standard Design ZEPIUPIU 1 ZEPIU 4 Financing Agreementcoverage P 5 DAO standard doc ZEPIU for materialsYear 6 Invitation to bid ICB for materials Direct contracting for labor$ clrm 5,700 7 Awards contract ZEPIU for materials Communities for laborGross m2 63.25 8 Signs contract ZEPIU for materials Communities for laborGross $/m2 90 9 Monitors works ZEPIU for all works and materials Communities for laborComm.p. 10 Pays works ZEPIU Communities for laborS/O, L, W 11 Executes works Large Suppliers and micro contractorsSource: Group5 2005 12 Handovers building MoE
Urban School Construction Project (JICA)
Fin JICA 1 Proposes planning Jica’s Project Office Essentially inNb clrs/year 92 2 Decides planning Jica’s Project Office Lusaka andYears 2000–2001 3 Standard Design Jica’s Project Office potentially thePIU 1 Jica PO 4 Financing Agreement Copperbeltcoverage Urban 5 DAO standard doc Jica’s Project OfficeYear 6 Invitation to bid ICB$ clrm 24,750 7 Awards contract Jica’s Project OfficeGross m2 63.25 8 Signs contract Jica’s Project OfficeGross $/m2 391 9 Monitors works Japanese Consultancy FirmsComm.p. 10 Pays worksS/O, L, W 11 Executes works Large ContractorsSource: Group5 2005 12 Handovers building MoE
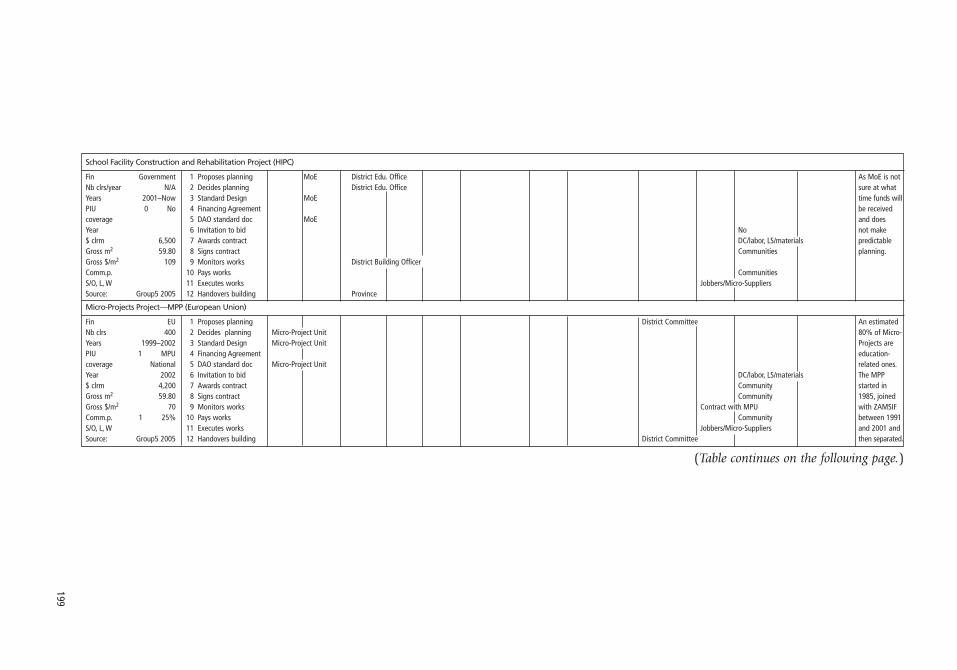
199
School Facility Construction and Rehabilitation Project (HIPC)
Fin Government 1 Proposes planning MoE District Edu. Office As MoE is notNb clrs/year N/A 2 Decides planning District Edu. Office sure at whatYears 2001–Now 3 Standard Design MoE time funds willPIU 0 No 4 Financing Agreement be receivedcoverage 5 DAO standard doc MoE and does Year 6 Invitation to bid No not make $ clrm 6,500 7 Awards contract DC/labor, LS/materials predictableGross m2 59.80 8 Signs contract Communities planning.Gross $/m2 109 9 Monitors works District Building OfficerComm.p. 10 Pays works CommunitiesS/O, L, W 11 Executes works Jobbers/Micro-SuppliersSource: Group5 2005 12 Handovers building Province
Micro-Projects Project—MPP (European Union)
Fin EU 1 Proposes planning District Committee An estimatedNb clrs 400 2 Decides planning Micro-Project Unit 80% of Micro-Years 1999–2002 3 Standard Design Micro-Project Unit Projects arePIU 1 MPU 4 Financing Agreement education-coverage National 5 DAO standard doc Micro-Project Unit related ones.Year 2002 6 Invitation to bid DC/labor, LS/materials The MPP $ clrm 4,200 7 Awards contract Community started in Gross m2 59.80 8 Signs contract Community 1985, joinedGross $/m2 70 9 Monitors works Contract with MPU with ZAMSIFComm.p. 1 25% 10 Pays works Community between 1991S/O, L, W 11 Executes works Jobbers/Micro-Suppliers and 2001 andSource: Group5 2005 12 Handovers building District Committee then separated.
(Table continues on the following page.)
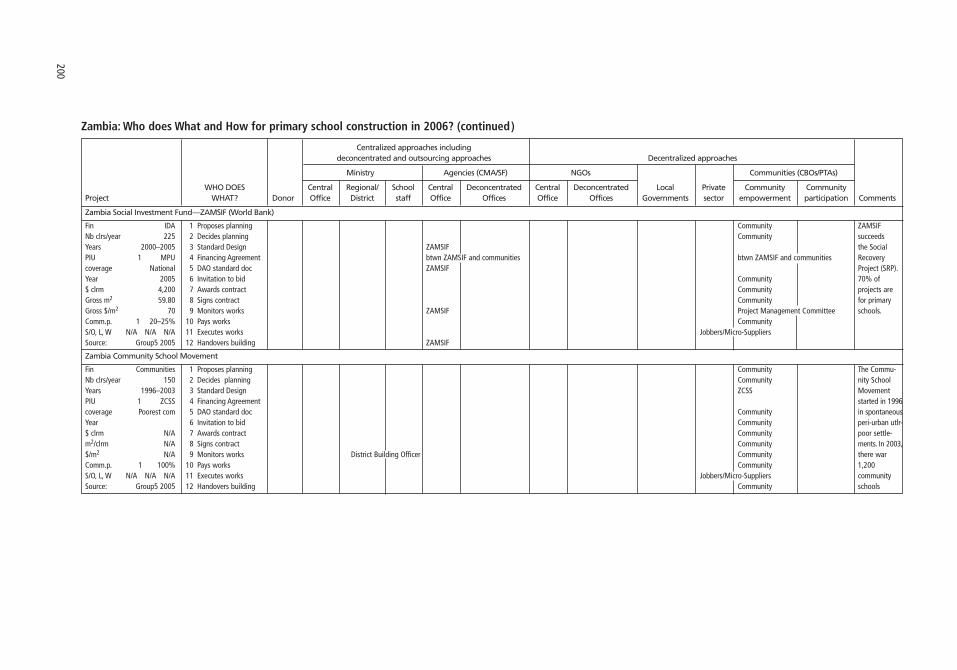
200
Zambia Social Investment Fund—ZAMSIF (World Bank)
Fin IDA 1 Proposes planning Community ZAMSIFNb clrs/year 225 2 Decides planning Community succeeds Years 2000–2005 3 Standard Design ZAMSIF the Social PIU 1 MPU 4 Financing Agreement btwn ZAMSIF and communities btwn ZAMSIF and communities Recoverycoverage National 5 DAO standard doc ZAMSIF Project (SRP).Year 2005 6 Invitation to bid Community 70% of $ clrm 4,200 7 Awards contract Community projects areGross m2 59.80 8 Signs contract Community for primaryGross $/m2 70 9 Monitors works ZAMSIF Project Management Committee schools.Comm.p. 1 20–25% 10 Pays works CommunityS/O, L, W N/A N/A N/A 11 Executes works Jobbers/Micro-SuppliersSource: Group5 2005 12 Handovers building ZAMSIF
Zambia Community School Movement
Fin Communities 1 Proposes planning Community The Commu-Nb clrs/year 150 2 Decides planning Community nity SchoolYears 1996–2003 3 Standard Design ZCSS MovementPIU 1 ZCSS 4 Financing Agreement started in 1996coverage Poorest com 5 DAO standard doc Community in spontaneousYear 6 Invitation to bid Community peri-urban utlr-$ clrm N/A 7 Awards contract Community poor settle-m2/clrm N/A 8 Signs contract Community ments. In 2003,$/m2 N/A 9 Monitors works District Building Officer Community there warComm.p. 1 100% 10 Pays works Community 1,200S/O, L, W N/A N/A N/A 11 Executes works Jobbers/Micro-Suppliers communitySource: Group5 2005 12 Handovers building Community schools
Zambia: Who does What and How for primary school construction in 2006? (continued)
Centralized approaches includingdeconcentrated and outsourcing approaches Decentralized approaches
Ministry Agencies (CMA/SF) NGOs Communities (CBOs/PTAs)
WHO DOES Central Regional/ School Central Deconcentrated Central Deconcentrated Local Private Community CommunityProject WHAT? Donor Office District staff Office Offices Office Offices Governments sector empowerment participation Comments
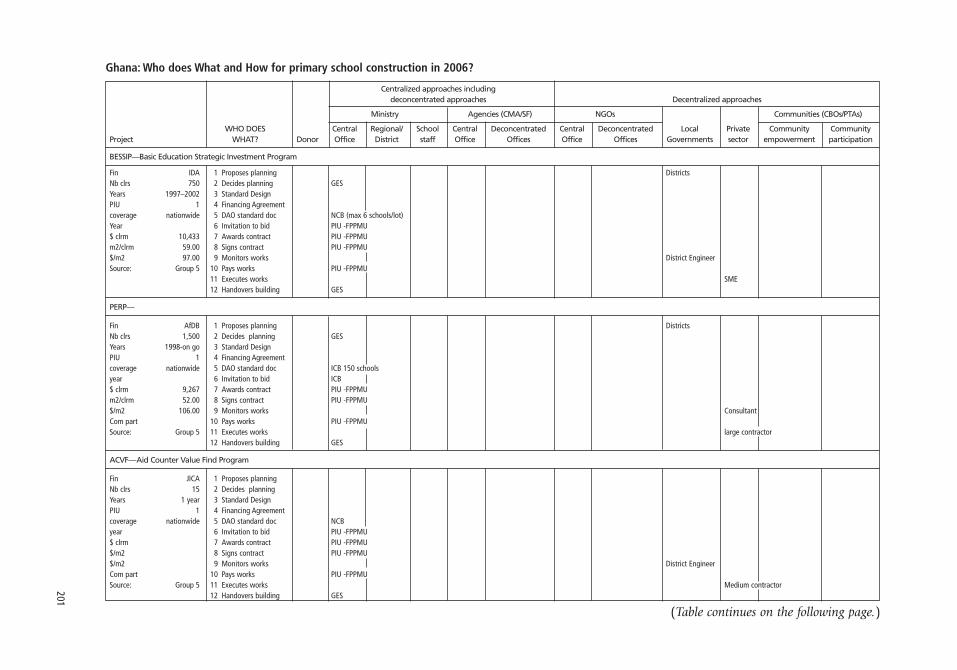
201
Ghana: Who does What and How for primary school construction in 2006?
Centralized approaches includingdeconcentrated approaches Decentralized approaches
Ministry Agencies (CMA/SF) NGOs Communities (CBOs/PTAs)
WHO DOES Central Regional/ School Central Deconcentrated Central Deconcentrated Local Private Community CommunityProject WHAT? Donor Office District staff Office Offices Office Offices Governments sector empowerment participation
BESSIP—Basic Education Strategic Investment Program
Fin IDA 1 Proposes planning DistrictsNb clrs 750 2 Decides planning GESYears 1997–2002 3 Standard DesignPIU 1 4 Financing Agreementcoverage nationwide 5 DAO standard doc NCB (max 6 schools/lot)Year 6 Invitation to bid PIU -FPPMU$ clrm 10,433 7 Awards contract PIU -FPPMUm2/clrm 59.00 8 Signs contract PIU -FPPMU$/m2 97.00 9 Monitors works District EngineerSource: Group 5 10 Pays works PIU -FPPMU
11 Executes works SME12 Handovers building GES
PERP—
Fin AfDB 1 Proposes planning DistrictsNb clrs 1,500 2 Decides planning GESYears 1998-on go 3 Standard DesignPIU 1 4 Financing Agreementcoverage nationwide 5 DAO standard doc ICB 150 schoolsyear 6 Invitation to bid ICB$ clrm 9,267 7 Awards contract PIU -FPPMUm2/clrm 52.00 8 Signs contract PIU -FPPMU$/m2 106.00 9 Monitors works ConsultantCom part 10 Pays works PIU -FPPMUSource: Group 5 11 Executes works large contractor
12 Handovers building GES
ACVF—Aid Counter Value Find Program
Fin JICA 1 Proposes planningNb clrs 15 2 Decides planningYears 1 year 3 Standard DesignPIU 1 4 Financing Agreementcoverage nationwide 5 DAO standard doc NCByear 6 Invitation to bid PIU -FPPMU$ clrm 7 Awards contract PIU -FPPMU$/m2 8 Signs contract PIU -FPPMU$/m2 9 Monitors works District EngineerCom part 10 Pays works PIU -FPPMUSource: Group 5 11 Executes works Medium contractor
12 Handovers building GES
(Table continues on the following page.)

202
Centralized approaches includingdeconcentrated approaches Decentralized approaches
Ministry Agencies (CMA/SF) NGOs Communities (CBOs/PTAs)
WHO DOES Central Regional/ School Central Deconcentrated Central Deconcentrated Local Private Community CommunityProject WHAT? Donor Office District staff Office Offices Office Offices Governments sector empowerment participation
Ghana: Who does What and How for primary school construction in 2006? (continued)
Non-Project Assistance Fund
Fin USAID 1 Proposes planningNb clrs 51 2 Decides planningYears 1 year 3 Standard DesignPIU 4 Financing Agreementcoverage 5 DAO standard doc Direct contractingyear 6 Invitation to bid PIU -FPPMU$ clrm 7 Awards contract PIU -FPPMU$/m2 8 Signs contract PIU -FPPMU$/m2 9 Monitors work District EngineerCom part 10 Pays works PIU -FPPMUSource: Group 5 11 Executes works Medium contractor
12 Handovers building GES
Rehabilitation of Schools Project
Fin UNICEF 1 Proposes planning DistrictsNb clrs 534 2 Decides planning DistrictsYears 3 Standard Design ???PIU 4 Financing Agreement ???coverage 5 DAO standard doc procures materials procures sand and blocksyear 6 Invitation to bid$ clrm 7 Awards contract$/m2 8 Signs contract$/m2 9 Monitors work DistrictsCom part 10 Pays worksSource: Group 5 11 Executes works skill and unskilled labor
12 Handovers building Districts
ESSP-SU—School Upgrading Program
Fin DFID 1 Proposes planning DistrictsNb clrs 560 2 Decides planning DistrictsYears 2002–now 3 Standard Design ???? ???PIU 1 4 Financing Agreementcoverage 2 regions 5 DAO standard doc ???? NCB max 2 schools/lotyear 6 Invitation to bid Districts—NCB$ clrm 10,727 7 Awards contract Districtsm2/clrm 51 8 Signs contract Districts$/m2 85 9 Monitors work Parents Teach. Ass.Com part 10 Pays works DistrictsSource: Group 5 11 Executes works
12 Handovers building

203
HIPC
Fin Government 1 Proposes planning DistrictsNb clrs 1,400 2 Decides planning DistrictsYears 2002–now 3 Standard Design ???PIU 4 Financing Agreementcoverage nationwide 5 DAO standard doc LCByear 6 Invitation to bid Districts—LCB$ clrm 7 Awards contract Districtsm2/clrm 53 8 Signs contract Districts$/m2 9 Monitors work District EngineerCom part 10 Pays works DistrictsSource: Group 5 11 Executes works Small contractor
12 Handovers building District
Ghana Education Trust Fund (GET Fund)
Fin Government 1 Proposes planning DistrictsNb clrs 2 Decides planning DistrictsYears 3 Standard Design ???PIU 4 Financing Agreementcoverage 5 DAO standard doc NCByear 6 Invitation to bid Districts - NCB$ clrm 7 Awards contract Districts$/m2 8 Signs contract Districts$/m2 9 Monitors work District EngineerCom part 10 Pays works DistrictsSource: Group 5 11 Executes works Medium contractor
12 Handovers building District
Micro Project Program
Fin EU 1 Proposes planning apply for projectNb clrs 1,440 2 Decides planning DAYears 2000–2003 3 Standard Design EUPIU 1 4 Financing Agreementcoverage 6 regions 5 DAO standard docyear 6 Invitation to bid$ clrm 7,067 7 Awards contractm2/clrm 62 8 Signs contract with local artisans $/m2 64 9 Monitors work DistrictCom part 25% 10 Pays works local artisansSource: Group 5 11 Executes works artisan provides labor
12 Handovers building District
(Table continues on the following page.)

204
Centralized approaches includingdeconcentrated approaches Decentralized approaches
Ministry Agencies (CMA/SF) NGOs Communities (CBOs/PTAs)
WHO DOES Central Regional/ School Central Deconcentrated Central Deconcentrated Local Private Community CommunityProject WHAT? Donor Office District staff Office Offices Office Offices Governments sector empowerment participation
QUIPS—Quality Improvement in Primary Schools
Fin USAID 1 Proposes planning DistrictsNb clrs 632 2 Decides planning PIU with District DistrictsYears 1998–2004 3 Standard DesignPIU US NGO 4 Financing Agreementcoverage 5 DAO standard doc procures labor procures materialsyear 6 Invitation to bid$ clrm 7 Awards contract direct contract$/m2 8 Signs contract District$/m2 9 Monitors work PIU Com part 25% 10 Pays works DistrictSource: Group 5 11 Executes works labor
12 Handovers building District
Primary School Construction Program
Fin Plan Internat 1 Proposes planning Plan IntNb clrs 90 2 Decides planning Plan IntYears 3 Standard Design Plan IntPIU 1 4 Financing Agreement Plan Int with Community with Plan Intcoverage 3 regions 5 DAO standard docyear 6 Invitation to bid$ clrm < 7,500 7 Awards contractm2/clrm 50–60 8 Signs contract with local artisans $/m2 60–70 9 Monitors work site supervisionCom part 10 Pays works local artisansSource: Group 5 11 Executes works artisan provides labor
12 Handovers building Central
Ghana: Who does What and How for primary school construction in 2006? (continued)

205
Grant Assistance to Grassroots Projects
Fin Japan Embassy 1 Proposes planning EmbassyNb clrs 64 2 Decides planning EmbassyYears 2000–2002 3 Standard DesignPIU 4 Financing Agreementcoverage 5 DAO standard docyear 6 Invitation to bid$ clrm 7 Awards contract$/m2 8 Signs contract with local artisans $/m2 9 Monitors work District EngineerCom part 10 Pays works local artisansSource: Group 5 11 Executes works artisan provides labor
12 Handovers building
Education Investment Plan
Fin World Vision 1 Proposes planning with DA with WVNb clrs 765 2 Decides planningYears 3 Standard DesignPIU 4 Financing Agreementcoverage 5 DAO standard docyear 6 Invitation to bid$ clrm 7 Awards contract$/m2 8 Signs contract with local artisans $/m2 9 Monitors work Zonal Program OfficerCom part 10 Pays works local artisansSource: Group 5 11 Executes works artisan provides labor
12 Handovers building

206
Difficulty tocoordinatecommunityparticipation.MoE abandonedapproachand shiftedto FID
High Unitcosts resultingfrom re-centralizationand “emergency”contractingprocedures
Good delivery timeand the lowest unitcost. Needslarge supportof FID atlocal level
GeneralComments
on the Project per -formance
Madagascar: Who does What and How for primary school construction in 2006?
Centralized approaches including deconcentrated approaches Decentralized approaches
Ministry Agencies (CMA/SF) NGOs Communities (CBOs/PTAs)
WHO DOES Central Regional/ School Central Deconcentrated Central Deconcentrated Local Private Community CommunityProject WHAT? Office District staff Office Offices Office Offices Governments sector empowerment participation
CRESED II regular program
Fin IDA 1 Proposes planning CISCONb clrs 556 2 Decides planning MoEYears 2000–04 3 Standard Design PIUPIU 1 4 Financing Agreement CISCO School with CISCOYear 2002 5 DAO standard doc PIU-IDA$ clrm 7,711 6 Invitation to bid CISCO$/m3 144 7 Awards contract CISCOYear 2004 8 Signs contract CISCO$ clrm 9,500 9 Monitors works PIU-IDA$/m3 176 10 Pays works PIU-IDASource: Group 5 11 Executes works SME/small contracts 10%
12 Handovers building MoE
CRESED II Post Cyclonic sub-program
Fin IDA 1 Proposes planning MoENb clrs 472 2 Decides planning MoEYears 2004–05 3 Standard Design PIUPIU 1 4 Financing Agreement$/clrm 9,500 5 DAO standard doc PIU-IDAm2/clrm 54.2 6 Invitation to bid PIU-IDA or Tender Board?$/m2 264 7 Awards contract PIU-IDASource: Group 5 8 Signs contract PIU-IDA
9 Monitors work PIU-IDA10 Pays works PIU-IDA11 Executes works SME/small contracts 10%12 Handovers building MoE
FID IV
Fin IDA 1 Proposes planning MoE with ZAPNb clrs 1200 2 Decides planning FID Years 2002–03 3 Standard Design FIDPIU 0 4 Financing Agreement MoE with FID FID with MoE$/clrm 7,983 5 DAO standard doc FIDm2/clrm 46.9 6 Invitation to bid with FID support$/m2 170 7 Awards contract with FID supportSource: Group 5 8 Signs contract with FID support
9 Monitors work with FID support10 Pays works with FID support11 Executes works SME/small contracts 10%12 Handovers building MoE
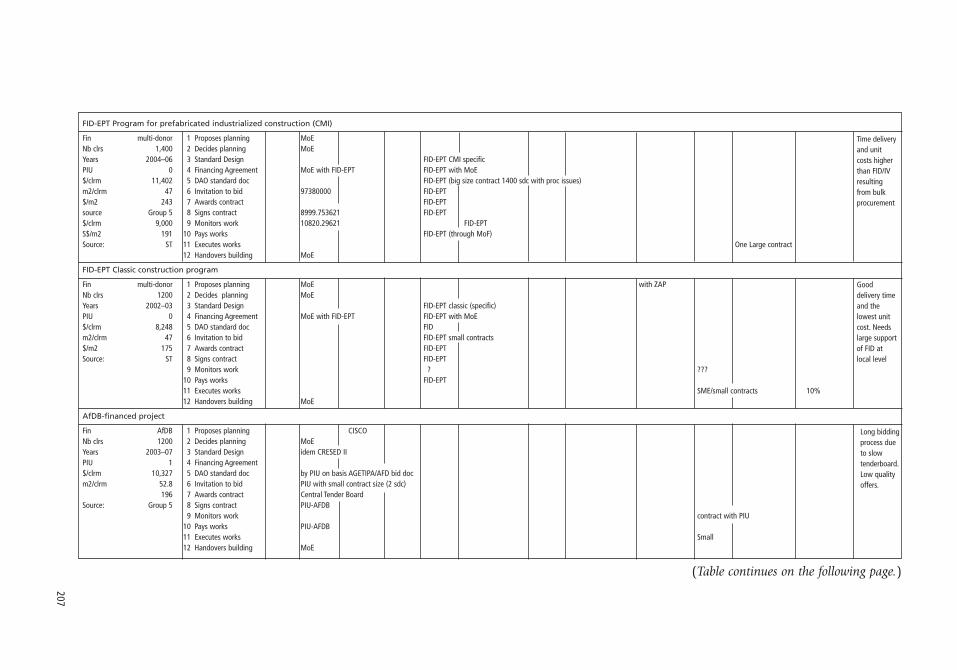
207
Time deliveryand unitcosts higherthan FID/IVresultingfrom bulkprocurement
Good delivery timeand the lowest unitcost. Needslarge supportof FID atlocal level
Long biddingprocess dueto slow tenderboard.Low qualityoffers.
FID-EPT Program for prefabricated industrialized construction (CMI)
Fin multi-donor 1 Proposes planning MoENb clrs 1,400 2 Decides planning MoEYears 2004–06 3 Standard Design FID-EPT CMI specificPIU 0 4 Financing Agreement MoE with FID-EPT FID-EPT with MoE$/clrm 11,402 5 DAO standard doc FID-EPT (big size contract 1400 sdc with proc issues)m2/clrm 47 6 Invitation to bid 97380000 FID-EPT$/m2 243 7 Awards contract FID-EPTsource Group 5 8 Signs contract 8999.753621 FID-EPT$/clrm 9,000 9 Monitors work 10820.29621 FID-EPTS$/m2 191 10 Pays works FID-EPT (through MoF)Source: ST 11 Executes works One Large contract
12 Handovers building MoE
FID-EPT Classic construction program
Fin multi-donor 1 Proposes planning MoE with ZAPNb clrs 1200 2 Decides planning MoEYears 2002–03 3 Standard Design FID-EPT classic (specific)PIU 0 4 Financing Agreement MoE with FID-EPT FID-EPT with MoE$/clrm 8,248 5 DAO standard doc FIDm2/clrm 47 6 Invitation to bid FID-EPT small contracts$/m2 175 7 Awards contract FID-EPTSource: ST 8 Signs contract FID-EPT
9 Monitors work ? ???10 Pays works FID-EPT11 Executes works SME/small contracts 10%12 Handovers building MoE
AfDB-financed project
Fin AfDB 1 Proposes planning CISCONb clrs 1200 2 Decides planning MoEYears 2003–07 3 Standard Design idem CRESED IIPIU 1 4 Financing Agreement$/clrm 10,327 5 DAO standard doc by PIU on basis AGETIPA/AFD bid docm2/clrm 52.8 6 Invitation to bid PIU with small contract size (2 sdc)
196 7 Awards contract Central Tender BoardSource: Group 5 8 Signs contract PIU-AFDB
9 Monitors work contract with PIU10 Pays works PIU-AFDB11 Executes works Small12 Handovers building MoE
(Table continues on the following page.)
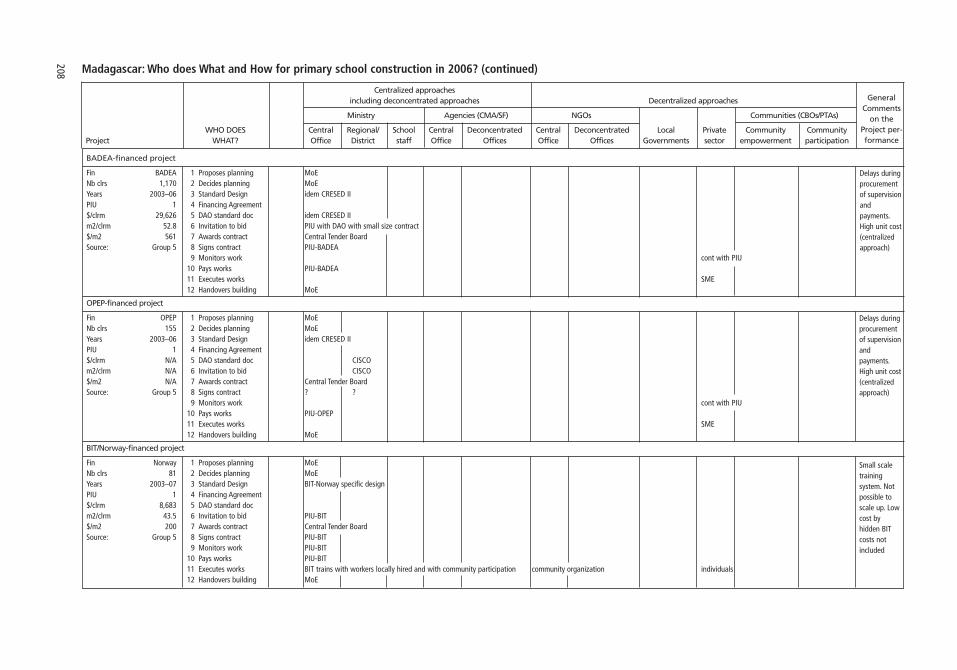
208
BADEA-financed project
Fin BADEA 1 Proposes planning MoENb clrs 1,170 2 Decides planning MoEYears 2003–06 3 Standard Design idem CRESED IIPIU 1 4 Financing Agreement$/clrm 29,626 5 DAO standard doc idem CRESED IIm2/clrm 52.8 6 Invitation to bid PIU with DAO with small size contract $/m2 561 7 Awards contract Central Tender BoardSource: Group 5 8 Signs contract PIU-BADEA
9 Monitors work cont with PIU10 Pays works PIU-BADEA11 Executes works SME12 Handovers building MoE
OPEP-financed project
Fin OPEP 1 Proposes planning MoENb clrs 155 2 Decides planning MoEYears 2003–06 3 Standard Design idem CRESED IIPIU 1 4 Financing Agreement$/clrm N/A 5 DAO standard doc CISCOm2/clrm N/A 6 Invitation to bid CISCO$/m2 N/A 7 Awards contract Central Tender BoardSource: Group 5 8 Signs contract ? ?
9 Monitors work cont with PIU10 Pays works PIU-OPEP11 Executes works SME12 Handovers building MoE
BIT/Norway-financed project
Fin Norway 1 Proposes planning MoENb clrs 81 2 Decides planning MoEYears 2003–07 3 Standard Design BIT-Norway specific designPIU 1 4 Financing Agreement$/clrm 8,683 5 DAO standard docm2/clrm 43.5 6 Invitation to bid PIU-BIT$/m2 200 7 Awards contract Central Tender BoardSource: Group 5 8 Signs contract PIU-BIT
9 Monitors work PIU-BIT10 Pays works PIU-BIT11 Executes works BIT trains with workers locally hired and with community participation community organization individuals12 Handovers building MoE
Delays duringprocurementof supervisionand payments.High unit cost(centralizedapproach)
Small scaletraining system. Notpossible toscale up. Lowcost by hidden BITcosts notincluded
Delays during procurementof supervisionand payments.High unit cost (centralizedapproach)
Madagascar: Who does What and How for primary school construction in 2006? (continued)
Centralized approaches including deconcentrated approaches Decentralized approaches
Ministry Agencies (CMA/SF) NGOs Communities (CBOs/PTAs)
WHO DOES Central Regional/ School Central Deconcentrated Central Deconcentrated Local Private Community CommunityProject WHAT? Office District staff Office Offices Office Offices Governments sector empowerment participation
GeneralComments
on the Project per -formance

209
Very high unitcosts resultingmainly fromcentralizedimplementa-tion approach
Very high unitcosts resultingfrom bulk procurementto interna-tional firmand subcon-tracts tonational ones
AFD-financed Project
Fin AFD 1 Proposes planning MoENb clrs 195 2 Decides planning MoEYears 2003–07 3 Standard Design AFD specific designPIU 0 4 Financing Agreement AFD with AGETIPA AGETIPA with AFD$/clrm 19,113 5 DAO standard doc WB standard docm2/clrm 59.4 6 Invitation to bid AGETIPA with small size contract$/m2 322 7 Awards contract AGETIPASource: Group 5 8 Signs contract AGETIPA
9 Monitors work contract with AGETIP10 Pays works AFD11 Executes works SME12 Handovers building MoE
JICA-financed Project
Fin JICA 1 Proposes planning MoENb clrs 343 2 Decides planning MoEYears 2005–06 3 Standard Design JICA specific designPIU 0 4 Financing Agreement$/clrm 32,190 5 DAO standard doc JICA standard doc (all bulked in one contract to Japanese contractor) m2/clrm 57.4 6 Invitation to bid by JICA in Japan$/m2 561 7 Awards contract Gov of Japan Tender BoardSource: Group 5 8 Signs contract JICA with Japanese contractor who, in turn sub-contracts to Malagasi contractors
9 Monitors work Japanese engineering firm10 Pays works JICA standard doc (all bulked in one contract to Japanese contractor) 11 Executes works JICA large contract + subcontracts to SME12 Handovers building MoE
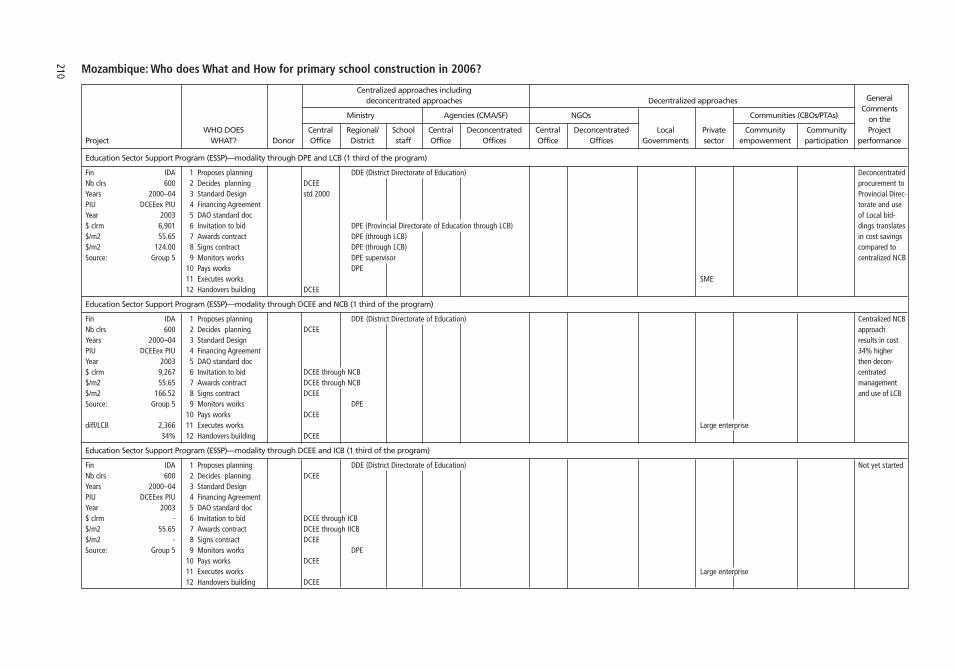
210 Mozambique: Who does What and How for primary school construction in 2006?
Centralized approaches includingGeneral deconcentrated approaches Decentralized approaches
Comments Ministry Agencies (CMA/SF) NGOs Communities (CBOs/PTAs) on the
WHO DOES Central Regional/ School Central Deconcentrated Central Deconcentrated Local Private Community Community ProjectProject WHAT? Donor Office District staff Office Offices Office Offices Governments sector empowerment participation performance
Education Sector Support Program (ESSP)—modality through DPE and LCB (1 third of the program)
Fin IDA 1 Proposes planning DDE (District Directorate of Education) DeconcentratedNb clrs 600 2 Decides planning DCEE procurement to Years 2000–04 3 Standard Design std 2000 Provincial Direc-PIU DCEEex PIU 4 Financing Agreement torate and use Year 2003 5 DAO standard doc of Local bid-$ clrm 6,901 6 Invitation to bid DPE (Provincial Directorate of Education through LCB) dings translates $/m2 55.65 7 Awards contract DPE (through LCB) in cost savings $/m2 124.00 8 Signs contract DPE (through LCB) compared to Source: Group 5 9 Monitors works DPE supervisor centralized NCB
10 Pays works DPE11 Executes works SME12 Handovers building DCEE
Education Sector Support Program (ESSP)—modality through DCEE and NCB (1 third of the program)
Fin IDA 1 Proposes planning DDE (District Directorate of Education) Centralized NCB Nb clrs 600 2 Decides planning DCEE approach Years 2000–04 3 Standard Design results in cost PIU DCEEex PIU 4 Financing Agreement 34% higher Year 2003 5 DAO standard doc then decon-$ clrm 9,267 6 Invitation to bid DCEE through NCB centrated $/m2 55.65 7 Awards contract DCEE through NCB management $/m2 166.52 8 Signs contract DCEE and use of LCBSource: Group 5 9 Monitors works DPE
10 Pays works DCEEdiff/LCB 2,366 11 Executes works Large enterprise
34% 12 Handovers building DCEE
Education Sector Support Program (ESSP)—modality through DCEE and ICB (1 third of the program)
Fin IDA 1 Proposes planning DDE (District Directorate of Education) Not yet startedNb clrs 600 2 Decides planning DCEEYears 2000–04 3 Standard DesignPIU DCEEex PIU 4 Financing AgreementYear 2003 5 DAO standard doc$ clrm - 6 Invitation to bid DCEE through ICB$/m2 55.65 7 Awards contract DCEE through IICB$/m2 - 8 Signs contract DCEESource: Group 5 9 Monitors works DPE
10 Pays works DCEE11 Executes works Large enterprise12 Handovers building DCEE

211
Rural Primary School Project IDB
Fin IDB 1 Proposes planning DDE (District)Nb clrs 220 2 Decides planning DPE (Province)Years 3 Standard DesignPIU No 4 Financing Agreement$/clrm 7,928 5 DAO standard doc NCBm2/clrm 55.83 6 Invitation to bid DCEE$/m2 142 7 Awards contract DCEESource: Group 5 8 Signs contract DCEE
9 Monitors work DPE 10 Pays works DCEE11 Executes works SME12 Handovers building DCEE
Emergency Program (Royal Netherland Embassy)
Fin RNE 1 Proposes planning DPENb clrs 360 2 Decides planning DCEEYears 3 Standard DesignPIU 0 4 Financing Agreement$/clrm 26,464 5 DAO standard doc ICBm2/clrm 58.16 6 Invitation to bid$/m2 455 7 Awards contractSource: Group 5 8 Signs contract
9 Monitors work Firms10 Pays works DCEE11 Executes works International Supplier12 Handovers building DCEE
Education Sector Support Program—PASE
Fin Finnida 1 Proposes planning Provincial DirectorateNb clrs 237 2 Decides planning DPEYears 1998–2005 3 Standard Design PASECoverage Maputo Prov 4 Financing AgreementPIU 1 5 DAO standard doc DPE/LCB$/clrm 7,394 6 Invitation to bid DPE/LCBm2/clrm 62.14 7 Awards contract DPE $/m2 119 8 Signs contract ?Source: Group 5 9 Monitors work DPE
10 Pays works PIU11 Executes works micro contactor12 Handovers building DCEE
(Table continues on the following page.)

212 Mozambique: Who does What and How for primary school construction in 2006? (continued)
Centralized approaches includingGeneral deconcentrated approaches Decentralized approaches
Comments Ministry Agencies (CMA/SF) NGOs Communities (CBOs/PTAs) on the
WHO DOES Central Regional/ School Central Deconcentrated Central Deconcentrated Local Private Community Community ProjectProject WHAT? Donor Office District staff Office Offices Office Offices Governments sector empowerment participation performance
Danish Support to the Education Sector Strategic Plan—through local contractors
Fin DANIDA 1 Proposes planning Provincial DirectorateNb clrs 300 2 Decides planning DPEYears 2002–07 3 Standard Design std 1998PIU 1 4 Financing AgreementCoverage 3 prov. 5 DAO standard doc DPE/LCB$/clrm 22332 6 Invitation to bid DPE/LCBm2/clrm 56 7 Awards contract DPE$/m2 400 8 Signs contract DPESource: Group 5 9 Monitors work DPE
10 Pays works PIU11 Executes works SME12 Handovers building DPE
Danish Support to the Education Sector Strategic Plan—modality with community participation
Fin DANIDA 1 Proposes planning Provincial DirectorateNb clrs 300 2 Decides planning DPEYears 2002–07 3 Standard DesignPIU 4 Financing Agreement with community with DPECoverage 3 prov. 5 DAO standard doc$/clrm 4466 6 Invitation to bidm2/clrm 56 7 Awards contract$/m2 80 8 Signs contractSource: Group 5 9 Monitors work
10 Pays works PIU11 Executes works community12 Handovers building DPE
Primary School Construction Project in Maputo Town
Fin JICA 1 Proposes planning PIU/JICANb clrs 100 2 Decides planning PIU/JICAYears 2003 3 Standard Design JICAPIU 1 4 Financing Agreement$/clrm 30,660 5 DAO standard doc Japanm2/clrm 58.4 6 Invitation to bid JICA$/m2 525 7 Awards contract JICASource: Group 5 8 Signs contract JICA
9 Monitors work Japanese consultant10 Pays works PIU/JICA11 Executes works large contractor12 Handovers building DCEE
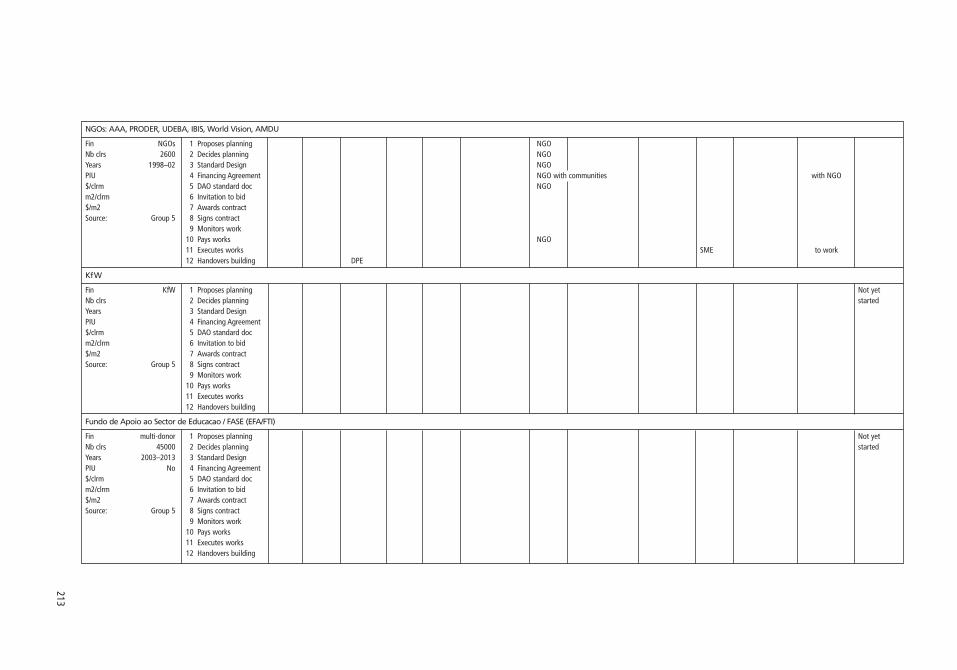
213
NGOs: AAA, PRODER, UDEBA, IBIS, World Vision, AMDU
Fin NGOs 1 Proposes planning NGONb clrs 2600 2 Decides planning NGOYears 1998–02 3 Standard Design NGOPIU 4 Financing Agreement NGO with communities with NGO$/clrm 5 DAO standard doc NGOm2/clrm 6 Invitation to bid$/m2 7 Awards contractSource: Group 5 8 Signs contract
9 Monitors work10 Pays works NGO11 Executes works SME to work12 Handovers building DPE
KfW
Fin KfW 1 Proposes planning Not yet Nb clrs 2 Decides planning startedYears 3 Standard DesignPIU 4 Financing Agreement$/clrm 5 DAO standard docm2/clrm 6 Invitation to bid$/m2 7 Awards contractSource: Group 5 8 Signs contract
9 Monitors work10 Pays works11 Executes works12 Handovers building
Fundo de Apoio ao Sector de Educacao / FASE (EFA/FTI)
Fin multi-donor 1 Proposes planning Not yet Nb clrs 45000 2 Decides planning startedYears 2003–2013 3 Standard DesignPIU No 4 Financing Agreement$/clrm 5 DAO standard docm2/clrm 6 Invitation to bid$/m2 7 Awards contractSource: Group 5 8 Signs contract
9 Monitors work10 Pays works11 Executes works12 Handovers building

214
Uganda: Who does What and How for primary school construction in 2006?
Centralized approaches includingdeconcentrated approaches Decentralized approaches
Ministry Agencies (CMA/SF) NGOs Communities (CBOs/PTAs)
WHO DOES Central Regional/ School Central Deconcentrated Central Deconcentrated Local Private Community CommunityProject WHAT? Donor Office District staff Office Offices Office Offices Governments sector empowerment participation
SFG School Facility Grant
Fin multi donor 1 Proposes planning School Managmt CommitteeNb clrs 20,000 2 Decides planning MOES District proposes to MOEsYears 1998–2003 3 Standard DesignPIU 4 Financing Agreementcoverage nationwide 5 DAO standard doc MOESrural 6 Invitation to bid SMC – 3 quotations$ clrm 3,885 7 Awards contract District tender boardm2/clrm 51.8 8 Signs contract SMC$/m2 75 9 Monitors works District engineerurban 10 Pays works SMC$/m2 135 11 Executes works Micro-enterpriseSource: Group 5 12 Handovers building SMC
Micro Project Program
Fin EU 1 Proposes planning School Managmt CommitteeNb clrs 400 2 Decides planning PIU – MP SMC assisted by PIUYears 2000–03 3 Standard DesignPIU 1 4 Financing Agreementcoverage nationwide 5 DAO standard doc PIU – MPyear 6 Invitation to bid SMC$ clrm 7 Awards contract SMCm2/clrm 8 Signs contract SMC$/m2 97 9 Monitors works PIU + SMC SMC + PIUCom part 15% 10 Pays works SMCSource: Group 5 11 Executes works Micro-enterprise
12 Handovers building SMC

List of Projects Reviewed
APPENDIX 17
215

216
Project overall date ofmanagement agency
Procure- Procure-Project cost Financing ment ment type of Unit cost per m2
Country Project name Acronym period info Agency Head Directorate Delegation Technology Agency method contractor current 2006 Source
Africa
Angola
1 NA 2000–04 2003 donor MoE MPW classic MPW NCB medium 275 296 World Bank 2000a, 2004a2 Second Social Fund Project SSFP 2000–04 2003 IDA SF FAS-II classic CMA ICB/NCB large/small 297 319 World Bank 2000a, 2004a
Benin type name
3 Social Fund Project SFP 2000–01 2001 IDA FS AGeFIB community classic community 3-quot jobbers 73 81 AGeFIB 2001, p. 484 Investment Program PIP 2001 Gov Admin. Direct. classic Admin.c. NCB Medium 113 126 World Bank 2004c5 N/A AGDS 2000–01 2001 donor CMA AGDS classic CMA NCB Medium 113 126 World Bank 2004c6 National Community-Driven Project PNDCC 2005–10 2006 IDA PIU SE-PNDCC community classic community LCB Medium 116 116 Theunynck7 National Community-Driven Project PNDCC 2005–10 2007 IDA PIU SE-PNDCC community classic community 3-quot jobbers 117 117 PNDCC 20078 National Community-Driven Project PNDCC 2005–10 2007 IDA PIU SE-PNDCC community classic community LCB micro 120 118 PNDCC 20079 regular Program MoE MoE 2007 2007 Gov MoE classic Admin. Cent. NCB medium 172 169 PNDCC 2007
Burkina Faso
10 Government program 1985–94 1990 donor Admin. classic Admin.c ICB large 250 349 World Bank 1991a, 1995a11 Education III Project 1985–94 1990 IDA MoE PCU classic PIU ICB/CW large/com 125 175 World Bank 1991a, 1995a12 10-Year Plan for Basic Edu and Lit. PDDEB 2002–10 2004 basket/1 MoE prov. Off. classic Admin.d NCB medium 103 108 Group 5 2006a, tab 7.4a13 Projet Appui à Org Ens de Base PAOEB 2002–10 2004 FDA Faso Baara classic CMA NCB medium 143 150 Group 5 2006a, tab 7.4a14 Government program (HPIC) HPIC 2004 Gov Faso Baara classic CMA NCB medium 127 133 Group 5 2006a, tab 7.4a15 N/A 2004 JICA16 Plan International Program PI 2004 Plan Int Plan Int classic NGO direct jobbers 124 130 Group 5 2006a, tab 7.4a17 OSEO Program OSEO 2007 OSEO OSEO classic NGO direct micro 114 112 OSEO 200718 Program Burkina AeA 2007 Action Aid AA community classic community LCB micro 91 89 cost info from AA 2007
Burundi
19 Second Social Action Project SSAP 1999–06 2005 IDA SF Twitezimbere classic SF NCB small 113 115 World Bank 2007b20 Second Social Action Project SSAP 1999–07 2006 IDA SF Twitezimbere classic SF NCB small 176 176 Dupety 200621 Public Works and Employ. Creation Proj PWECP 1999–06 2005 IDA ABUTIP classic CMA NCB medium 166 169 World Bank 2007b22 Public Works and Employ. Creation Proj PWECP 1999–07 2006 IDA ABUTIP classic CMA NCB medium 182 182 Dupety 200623 Belgian Burundi Fund BBF 2005 Belgium/ Belg/Bur Fund classic SF NCB medium 171 174 World Bank 2007b
Gov24 N/A AFD 2005 FDA classic Admin/cent NCB medium 104 106 Dupety 200625 N/A UNCHR 2005 UNCHR classic NGO direct small 134 137 Dupety 200626 N/A UNICEF 2005 UNICEF classic community direct small 59 60 Dupety 2006
Cape Verde
27 Edu. and Training Cons. and Mod. Proj PROMEF 2000–02 2002 IDA MoE PIU classic Admin/cent NCB medium 325 355 Siri and Goovaert 200228 Social Sector Development Project SSDP 2001–06 2004 IDA AGECABO classic CMA NCB medium 243 247 Theunynck 2005a,
World Bank 1999b29 Education Project II Ecole 2004 Gov MoE DPEE classic Admin/cent 3-Q small 260 265 Theunynck 2005a30 SDDP Ecole Belavista SSDP 2001–06 2001 IDA AGECABO CMA classic CMA NCB medium 278 308 Theunynck 2005a
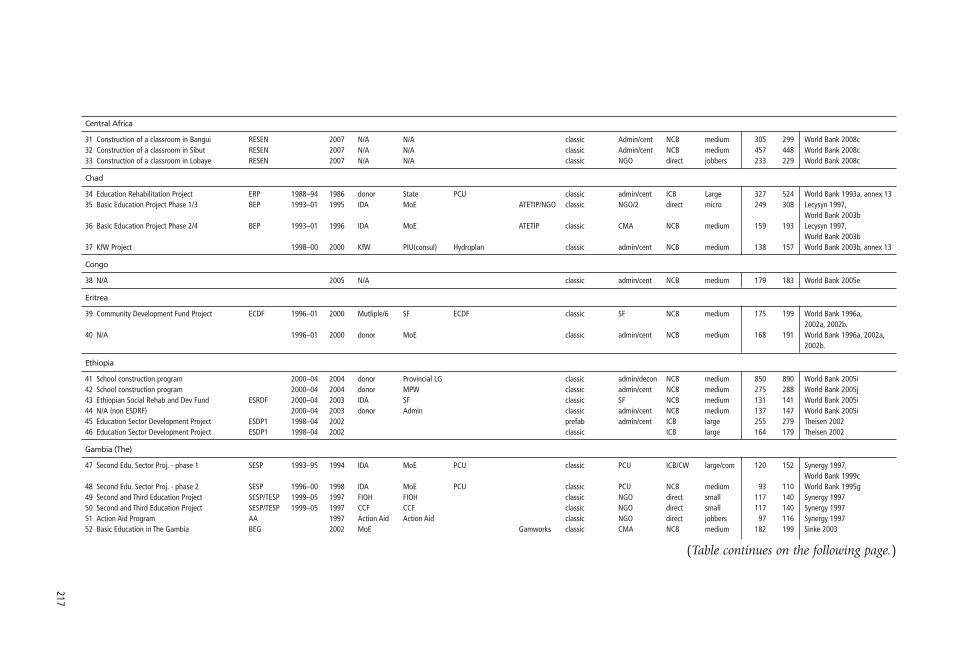
Central Africa
31 Construction of a classroom in Bangui RESEN 2007 N/A N/A classic Admin/cent NCB medium 305 299 World Bank 2008c32 Construction of a classroom in Sibut RESEN 2007 N/A N/A classic Admin/cent NCB medium 457 448 World Bank 2008c33 Construction of a classroom in Lobaye RESEN 2007 N/A N/A classic NGO direct jobbers 233 229 World Bank 2008c
Chad
34 Education Rehabilitation Project ERP 1988–94 1986 donor State PCU classic admin/cent ICB Large 327 524 World Bank 1993a, annex 1335 Basic Education Project Phase 1/3 BEP 1993–01 1995 IDA MoE ATETIP/NGO classic NGO/2 direct micro 249 308 Lecysyn 1997,
World Bank 2003b36 Basic Education Project Phase 2/4 BEP 1993–01 1996 IDA MoE ATETIP classic CMA NCB medium 159 193 Lecysyn 1997,
World Bank 2003b37 KfW Project 1998–00 2000 KfW PIU(consul) Hydroplan classic admin/cent NCB medium 138 157 World Bank 2003b, annex 13
Congo
38 N/A 2005 N/A classic admin/cent NCB medium 179 183 World Bank 2005e
Eritrea
39 Community Development Fund Project ECDF 1996–01 2000 Mutliple/6 SF ECDF classic SF NCB medium 175 199 World Bank 1996a,2002a, 2002b.
40 N/A 1996–01 2000 donor MoE classic admin/cent NCB medium 168 191 World Bank 1996a, 2002a,2002b.
Ethiopia
41 School construction program 2000–04 2004 donor Provincial LG classic admin/decon NCB medium 850 890 World Bank 2005i42 School construction program 2000–04 2004 donor MPW classic admin/cent NCB medium 275 288 World Bank 2005j43 Ethiopian Social Rehab and Dev Fund ESRDF 2000–04 2003 IDA SF classic SF NCB medium 131 141 World Bank 2005i44 N/A (non ESDRF) 2000–04 2003 donor Admin classic admin/cent NCB medium 137 147 World Bank 2005i45 Education Sector Development Project ESDP1 1998–04 2002 prefab admin/cent ICB large 255 279 Theisen 200246 Education Sector Development Project ESDP1 1998–04 2002 classic ICB large 164 179 Theisen 2002
Gambia (The)
47 Second Edu. Sector Proj. - phase 1 SESP 1993–95 1994 IDA MoE PCU classic PCU ICB/CW large/com 120 152 Synergy 1997,World Bank 1999c
48 Second Edu. Sector Proj. - phase 2 SESP 1996–00 1998 IDA MoE PCU classic PCU NCB medium 93 110 World Bank 1995g49 Second and Third Education Project SESP/TESP 1999–05 1997 FIOH FIOH classic NGO direct small 117 140 Synergy 199750 Second and Third Education Project SESP/TESP 1999–05 1997 CCF CCF classic NGO direct small 117 140 Synergy 199751 Action Aid Program AA 1997 Action Aid Action Aid classic NGO direct jobbers 97 116 Synergy 199752 Basic Education in The Gambia BEG 2002 MoE Gamworks classic CMA NCB medium 182 199 Sinke 2003
217
(Table continues on the following page.)
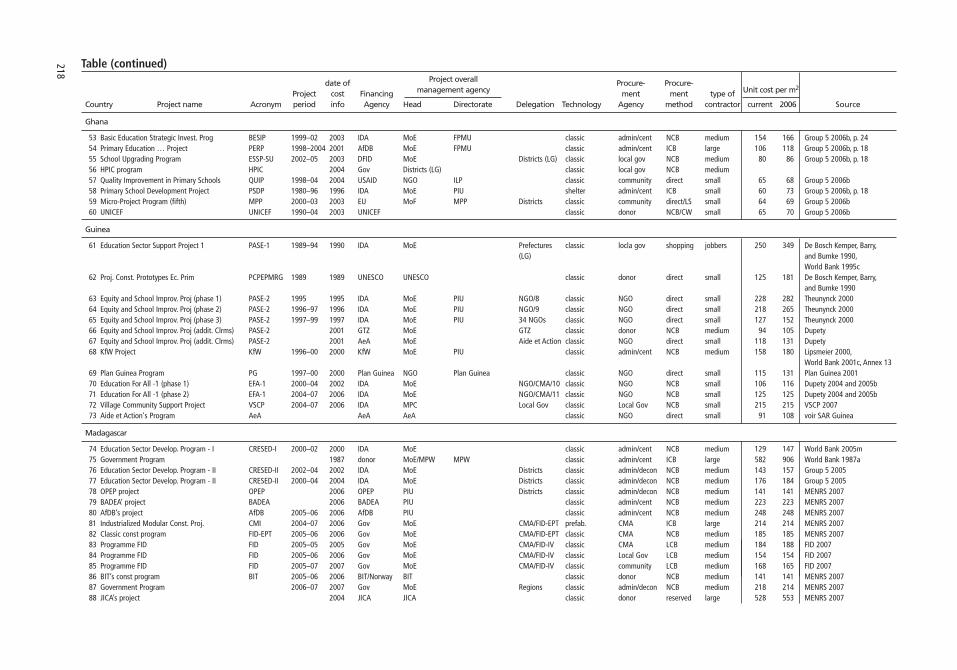
218
Table (continued)Project overall date of
management agencyProcure- Procure-
Project cost Financing ment ment type of Unit cost per m2
Country Project name Acronym period info Agency Head Directorate Delegation Technology Agency method contractor current 2006 Source
Ghana
53 Basic Education Strategic Invest. Prog BESIP 1999–02 2003 IDA MoE FPMU classic admin/cent NCB medium 154 166 Group 5 2006b, p. 2454 Primary Education … Project PERP 1998–2004 2001 AfDB MoE FPMU classic admin/cent ICB large 106 118 Group 5 2006b, p. 1855 School Upgrading Program ESSP-SU 2002–05 2003 DFID MoE Districts (LG) classic local gov NCB medium 80 86 Group 5 2006b, p. 1856 HPIC program HPIC 2004 Gov Districts (LG) classic local gov NCB medium57 Quality Improvement in Primary Schools QUIP 1998–04 2004 USAID NGO ILP classic community direct small 65 68 Group 5 2006b58 Primary School Development Project PSDP 1980–96 1996 IDA MoE PIU shelter admin/cent ICB small 60 73 Group 5 2006b, p. 1859 Micro-Project Program (fifth) MPP 2000–03 2003 EU MoF MPP Districts classic community direct/LS small 64 69 Group 5 2006b60 UNICEF UNICEF 1990–04 2003 UNICEF classic donor NCB/CW small 65 70 Group 5 2006b
Guinea
61 Education Sector Support Project 1 PASE-1 1989–94 1990 IDA MoE Prefectures classic locla gov shopping jobbers 250 349 De Bosch Kemper, Barry, (LG) and Bumke 1990,
World Bank 1995c62 Proj. Const. Prototypes Ec. Prim PCPEPMRG 1989 1989 UNESCO UNESCO classic donor direct small 125 181 De Bosch Kemper, Barry,
and Bumke 199063 Equity and School Improv. Proj (phase 1) PASE-2 1995 1995 IDA MoE PIU NGO/8 classic NGO direct small 228 282 Theunynck 200064 Equity and School Improv. Proj (phase 2) PASE-2 1996–97 1996 IDA MoE PIU NGO/9 classic NGO direct small 218 265 Theunynck 200065 Equity and School Improv. Proj (phase 3) PASE-2 1997–99 1997 IDA MoE PIU 34 NGOs classic NGO direct small 127 152 Theunynck 200066 Equity and School Improv. Proj (addit. Clrms) PASE-2 2001 GTZ MoE GTZ classic donor NCB medium 94 105 Dupety 67 Equity and School Improv. Proj (addit. Clrms) PASE-2 2001 AeA MoE Aide et Action classic NGO direct small 118 131 Dupety68 KfW Project KfW 1996–00 2000 KfW MoE PIU classic admin/cent NCB medium 158 180 Lipsmeier 2000,
World Bank 2001c, Annex 1369 Plan Guinea Program PG 1997–00 2000 Plan Guinea NGO Plan Guinea classic NGO direct small 115 131 Plan Guinea 200170 Education For All -1 (phase 1) EFA-1 2000–04 2002 IDA MoE NGO/CMA/10 classic NGO NCB small 106 116 Dupety 2004 and 2005b71 Education For All -1 (phase 2) EFA-1 2004–07 2006 IDA MoE NGO/CMA/11 classic NGO NCB small 125 125 Dupety 2004 and 2005b72 Village Community Support Project VSCP 2004–07 2006 IDA MPC Local Gov classic Local Gov NCB small 215 215 VSCP 200773 Aide et Action's Program AeA AeA AeA classic NGO direct small 91 108 voir SAR Guinea
Madagascar
74 Education Sector Develop. Program - I CRESED-I 2000–02 2000 IDA MoE classic admin/cent NCB medium 129 147 World Bank 2005m75 Government Program 1987 donor MoE/MPW MPW classic admin/cent ICB large 582 906 World Bank 1987a76 Education Sector Develop. Program - II CRESED-II 2002–04 2002 IDA MoE Districts classic admin/decon NCB medium 143 157 Group 5 200577 Education Sector Develop. Program - II CRESED-II 2000–04 2004 IDA MoE Districts classic admin/decon NCB medium 176 184 Group 5 200578 OPEP project OPEP 2006 OPEP PIU Districts classic admin/decon NCB medium 141 141 MENRS 200779 BADEA’ project BADEA 2006 BADEA PIU classic admin/cent NCB medium 223 223 MENRS 200780 AfDB’s project AfDB 2005–06 2006 AfDB PIU classic admin/cent NCB medium 248 248 MENRS 200781 Industrialized Modular Const. Proj. CMI 2004–07 2006 Gov MoE CMA/FID-EPT prefab. CMA ICB large 214 214 MENRS 200782 Classic const program FID-EPT 2005–06 2006 Gov MoE CMA/FID-EPT classic CMA NCB medium 185 185 MENRS 200783 Programme FID FID 2005–05 2005 Gov MoE CMA/FID-IV classic CMA LCB medium 184 188 FID 200784 Programme FID FID 2005–06 2006 Gov MoE CMA/FID-IV classic Local Gov LCB medium 154 154 FID 200785 Programme FID FID 2005–07 2007 Gov MoE CMA/FID-IV classic community LCB medium 168 165 FID 200786 BIT’s const program BIT 2005–06 2006 BIT/Norway BIT classic donor NCB medium 141 141 MENRS 200787 Government Program 2006–07 2007 Gov MoE Regions classic admin/decon NCB medium 218 214 MENRS 200788 JICA’s project 2004 JICA JICA classic donor reserved large 528 553 MENRS 2007

89 AGETIPA’s program AGETIPA 2004 FDA/France CMA AGETIPA classic CMA NCB medium 288 301 MENRS 200790 Aide et Action - Antananarivo AeA 2001 AeA NGO AeA classic NGO LCB small 52 58 Aide et Action 200791 Aide et Action Tulear AeA 2004 AeA NGO AeA classic NGO LCB small 82 86 Aide et Action 30 mai 200792 FID (DRT) Projet EPP Iavoambony FID-IV 2003 IDA FID classic community LCB medium 96 103 FID 2003a93 FID (DRT) Projet EPP Morarano Anrongona FID-IV 2003 IDA FID classic community LCB medium 94 102 FID 2003b94 FID (DRT) Projet CEG Nandihizana FID-IV 2005 IDA FID classic local gov LCB medium 185 189 FID 2005c95 FID (DRT) ProjetLycée Soanindrariny FID-IV 2004 IDA FID classic CMA LCB medium 146 153 FID 2004d96 FID (DRT) Projet CEG Ambogamarina FID-IV 2005 IDA FID classic local gov LCB medium 65 66 FID 2005a97 FID (DRT) Projet EPP Antanimenabe FID-IV 2005 IDA FID classic local gov LCB medium 98 100 FID 2005b98 FID (DRT) Projet EPP Andranomasina FID-IV 2004 IDA FID classic community LCB Medium 72 75 FID 2004c99 FID (DRD) Projet Ecole FJKM Andapa FID-IV 2003 IDA FID classic CMA RCB medium 177 190 Olivier 2004
100 FID (DRN) Projet Ecole NDDLP Ambohianatrika FID-IV 2003 IDA FID classic CMA RCB medium 141 152 Olivier 2004101 FID (DRU) Projet EPP Ranavo (access diff) FID-IV 2003 IDA FID classic community RCB medium 104 112 Olivier 2004
Malawi 177.16
102 Second Social Development Fund MAZAF 1998–06 2003 IDA MAZAF classic community 3Q small 62 66 EMC Jatula Associates 2003 103 N/A DANIDA 2003 DANIDA PIU classic admin. NCB medium 146 157 EMC Jatula Associates 2003 104 Plan International Program PI 2003–06 2006 PI NGO classic NGO direct small 101 101 Plan International Data 105 Micro Project Program MPP 2004–06 2006 EU MPP PIU classic community direct/LS jobbers 134 134 Majgaard data106 Micro Project Program MPP 2004–06 2006 EU MPP PIU classic community direct/LS jobbers 121 121 Majgaard data107 Malwi UNICEF program UNICEF 2004–06 2006 UNICEF donor classic community direct/LS jobbers 90 101 Majgaard data108 MAZAF Program MAZAF 2001 MAZAF MAZAF classic community 3Q small 63 70 Majgaard data 109 Building Department BD 2001 donor MoE classic admin/cent NCB medium 100 111 Majgaard data 108 Malawi DFID Program (urban) DFID 2004–06 2004 DFID donor classic admin/cent NCB medium 107 112 Majgaard data 109 Malawi DFID Program (rural) DFID 2004–06 2004 DFID donor classic admin/cent NCB medium 101 106 Majgaard data 110 Malawi DFID Program (urban) DFID 2006 DFID donor classic admin/cent NCB medium 125 125 Majgaard data111 Malawi DFID Program (rural) DFID 2005 DFID donor classic admin/cent NCB medium 118 118 Majgaard data
Mali
112 Primary schools 1982–87 France NGO AFVP local mat NGO direct jobbers 41 Derisbour et al 1987113 Low-cost housing proj. Banconi 1982 France NGO ACA local mat NGO direct jobbers 98 178 ACA 1982, p. 58114 Training Center Gabriel Cisse Segou 1987 Church NGO Altech local mat NGO direct jobbers 115 179 Houben and Guillard 1989,
pp. 69–87115 Government Program 1985 donor donor classic donor ICB large 356 583 World Bank 1989c116 Community Schools 1994–00 1998 NGOs NGOs classic NGO direct/LS small 128 193 Cissé et al. 2000117 Education Sector Consolidation Proj ESCP 1990–95 1990 IDA MoE AGETIP-Mali classic CMA NCB medium 133 186 World Bank 1989c, 1996b118 Education Sector Consolidation Proj ESCP 1990–95 1990 IDA MoE NGOs classic NGO direct micro 108 151 World Bank 1989c, 1996b119 Grassroots Initiative Project GRIP IDA Admin. PIU classic community LCB small 105 120 voir e-mail Sverrir
219
(Table continues on the following page.)

220
Table (continued)Project overall date of
management agencyProcure- Procure-
Project cost Financing ment ment type of Unit cost per m2
Country Project name Acronym period info Agency Head Directorate Delegation Technology Agency method contractor current 2006 Source
Mauritania
120 Low-cost housing project Rosso 1977–81 1980 multiple NGO ADAUA local mat NGO direct jobbers 70 148 Theunynck 1994, p. 809121 Primary school in Diaguily 1987–88 1988 UNESCO donor BREDA local mat donor direct jobbers 98 148 UNESCO 1988, pp. 6–7122 FED program 1973–77 1977 UE MPW classic admin/cent ICB large 500 1334 UNESCO 1984, p. 27123 Government Program RIM 78 1978 1978 Irak, Koweit MPW classic admin/cent ICB large 387 965 UNESCO 1984, p. 28124 Government Program 1984 donor MPW classic admin/cent ICB large 370 624 World Bank 1988125 Urban Project 1 (school in Selibaby) 2000 IDA MoF ADM AMEXTIPE classic CMA NCB medium 243 277 Synergie 2000y126 Urban Project 2 (Nouadhibou) 2005 IDA MoF ADM AMEXTIPE classic CMA NCB medium 227 231 Theunynck 2007127 Urban Project 2 (Rosso) 2003 KFW MoF ADM AMEXTIPE classic CMA NCB medium 219 235 Theunynck 2007128 Urban Project 2 (Nema) 2001 IDA MoF ADM AMEXTIPE classic CMA NCB medium 165 184 Theunynck 2007129 Education III Project Edu-III 1989–95 1991 IDA-FDA MoE PIU community classic community direct small 104 140 Theunynck 1999130 Education III Project Edu-III 1989–96 1995 IDA-FDA MoE PIU community classic community direct small 113 139 Theunynck 1999131 Education III Project Edu-V 1989–97 1999 IDA-FDA MoE PIU community classic community direct small 117 136 Theunynck 1999132 Education V Project Edu-V 1995–00 2000 IDA-FDA MoE PIU community classic community LCB small 85 97 World Bank 2001f133 Edu. Sector Nat. Support Program (Rosso) PNDSE 2000–10 2001 IDA-FDA MoE PIU community classic community LCB small 53 58 data collected by S. Theunynck134 Edu. Sector Nat. Support Program (Ndbou) PNDSE 2000–10 2001 IDA-FDA MoE PIU community classic community LCB small 77 85 data collected by S. Theunynck135 Edu. Sector Nat. Support Program (Rosso) PNDSE 2000–10 2002 IDA-FDA MoE PIU community classic community LCB small 135 148 data collected by S. Theunynck136 Edu. Sector Nat. Support Program (Ndbou) PNDSE 2000–11 2003 IDA-FDA MoE PIU community classic community LCB small 119 128 data collected by S. Theunynck137 Urban school in Ryiad, Dar Naim Urb. Proj 2002 IDA Local Gov AMEXTIPE classic CMA NCB medium 192 210 data collected by S. Theunynck
Mozambique
138 Second Education Projet SEP 1991–98 1998 IDA MoE NGO classic NGO FA jobbers 116 137 World Bank 1999fpara 23–24
139 Education Sector Strategic Program ESSP 2000–04 2004 IDA MoE DCEE classic admim/cent NCB medium 165 173 Group 5 2006c140 Education Sector Strategic Program ESSP 2000–04 2004 IDA MoE Provinces classic admin/decon LCB small 124 130 Group 5 2006c141 Rural Primary School Project RPSP 2000–04 2004 IDB MoE Provinces classic admin/decon NCB medium 142 149 Group 5 2006c142 Education Support Program PASE 1995–05 2003 FINNIDA MoE Provinces classic admin/decon LCB small 108 116 Group 5 2006c143 Danish Support to the ESP ESSP 2002–06 2004 DANIDA MoE Provinces classic MoE/decon LCB medium 400 419 Group 5 2006c144 Danish Support to the ESP ESSP 2002–06 2004 DANIDA MoE Provinces classic community direct jobbers 80 84 Group 5 2006c145 Primary School Construction Proj 2004 JICA donor JICA classic donor reserved large 525 550 Group 5 2006c146 Emergency Program IDA MoE PIU prefab admin/cent ICB large 455 506 Group 5 2006c147 AMDU Program 2004 NGO NGO AMDU classic NGO direct small 105 110 Group 5 2006c148 Lutheran World Federation project LWF 2005 NGO NGO classic NGO direct small 173 176 Group 5 2006c149 PRONES PRONES 2005 UNICEF classic Group 5 2006c
Niger
150 Literacy Center in Chical 1980 UNDP NGO ACA local mat NGO direct jobbers 322 638 DMN 1980, p. 7151 Education III Project 1986 IDA MoE PIU local mat admin/cent direct jobbers 160 256 Theunynck 1994, p. 807152 Government Program 1984 donor MoE/MPW classic admin/cent ICB large 378 638 World Bank 1996d153 Government Program 1984 Gov MoE classic admin/cent ICB large 214 361 World Bank 1986154 First Education Project (test 60 clrms) FEP 1981–90 1986 IDA MPW classic admin/cent ICB large 143 228 World Bank 1992b

155 First Education Project (MPW for MoE)) FEP 1981–91 1987 IDA MPW classic admin/cent ICB large 208 323 World Bank 1992b156 Primary Edu. Develop, Projet (Edu-II) PEDP 1987–95 1987 IDA MoE PIU shelter admin/cent ICB/com large 66 102 Word Bank 157 Primary Edu. Develop, Projet (Edu-II) PEDP 1987–95 1988 IDA MoE PIU shelter admin/cent ICB/com large 66 99 World Bank 1996d158 Basic Education Project PADEB 2003–08 2005 IDA MoE PIU shelter admin/cent ICB/com large 62 63 Zerbo 2008159 Basic Education Project PADEB 2003–08 2005 IDA MoE PIU classic admin/cent NCB medium 147 150 Zerbo 2008160 AFD Program FDA 2005 FDA MoE PIU Nigetipe classic CMA NCB medium 172 175 Zerbo 2008161 KfW Program KfW 2005 KfW MoE classic donor NCB medium 157 160 Zerbo 2008
Rwanda
162 Human Resource Development Project HRDP 2000–07 2004 IDA MoE PIU Local classic local gov NCB medium 220 231 Kayumba 2006aGovernment
163 Education III Project EDU-III 2000–06 2006 AfDB MoE PIU classic admin/cent NCB medium 263 263 Kayumba 2006a164 Construction et Rehab. Ecoles Primaires CREP 2003–09 2006 Belgium MoE PIU classic admin/cent NCB medium 125 125 CREP 2006 165 HRDP Marché Ville Kabuga-Ent Ecotibat HRDP 2000–07 2003 IDA MoE PIU Local classic local gov NCB medium 145 156 Kabuga 2001
Government166 HRDP Marché Rubavu-Ent Kazoza HRDP 2000–08 2006 IDA MoE PIU Local classic local gov NCB medium 209 209 MESTRS 2006
Government
Senegal
167 Training Center in Nianning 1977 UNESCO donor BREDA local mat donor direct medium 56 149 Dellicour and Al, 1978168 School of Derkle in Dakar 1983 EU donor EU local mat donor direct medium 131 230 Theunynck 1974, p. 719169 Coranic School of Malika 1979 NGO NGO Daara local mat NGO direct medium 132 Abdullac 1979, p. 37170 Third Education Project TEP 1983 IDA Gov PIU local mat admin. direct medium 117 World Bank 2000d, annex 12171 Third Education Project TEP 1982 IDA Gov PIU local mat admin. direct medium 203 369 World Bank 2000d, annex 13172 Gov Programs donors Gov classic admin/cent ICB large 593 828 Verspoor, Looked, p. 179173 Aide et Action Program AeA 1982 NGO NGO classic NGO direct small 162 294 Aide et Action 1994, p. 20174 Government Program 1984 donor MoE MPW classic admin/cent ICB large 293 494 World Bank 1993e175 Primary Edu. Develop Proj. Phase1 PEDP-1 1987–89 1988 IDA MoE PIU classic admin. ICB/com large/com 210 316 World Bank 1995g176 Primary Edu. Develop Proj. Phase2 PEDP-1 1989–95 1992 IDA MoE AGETIP classic CMA NCB medium 177 233 World Bank 1995g177 Education IV 1988–90 1990 EU MoE DCES classic admin/cent NCB large 237 331 Word Bank 2000d178 Gov Program PDRH-2 1993 Gov MoE DCES classic admin cent NCB medium 143 185 Word Bank 2000d179 Government Program (BCI) 1998 Gov MoE DCES classic admin. NCB medium 129 152 Word Bank 2000d180 Human Resource Dev. Project II PDRH-2 1995–98 1998 IDA MoE AGETIP classic CMA NCB medium 109 129 Dupety 2005b181 Edu. Sector Emergency Program PUSE 1999 CIDA NGO FPGL classic NGO direct jobbers 123 143 F2 Consultants 1999182 Gov Program (1020 classrooms) 1998–99 1998 Gov /BCI MoE DCES classic admin/cent NCB medium 126 149 World Bank 2000d183 Gov Program (1000 classrooms) 1999 Gov /BCI MoE DCES classic admin/cent NCB medium 80 93 World Bank 2000d184 School Construction Project III OPEP-III 2000–04 2004 OPEP MoE DCES classic admin. NCB medium 135 141 Dupety 2005a185 School Construction Project 2000–04 2004 IDB MoE PIU classic admin/PIU ICB large 264 277 Dupety 2005a186 School Construction Project IV JICA-IV 2000–04 2004 JICA JICA classic donor reserved large 731 766 World Bank 2005j187 Education For All Project -1 EFA-1 2000–04 2004 IDA MoE AGETIP classic CMA NCB medium 145 152 Diouf 2006188 Education For All Project -2 EFA-2 2000–05 2005 IDA MoE AGETIP classic CMA NCB medium 138 141 Dupety 2005a189 Education Improvement Proj for Senegal PAOES 2002–03 2003 FDA MoE AGETIP classic CMA NCB medium 162 174190 BID Program BID 2001–04 2004 IDB MoE DCES classic admin/cent NCB medium 221 231 Dupety 2005a191 OPEP Program OPEP-III 2003–04 2004 OPEP MoE DCES classic admin/cent NCB medium 136 142 Dupety 2005a192 Third Education Project Edu-III 2001–04 2004 AfDB MoE PUI classic admin/cent NCB large 137 144 Dupety 2005a193 National Rural Infrastructure Proj. NRIP 2000–03 2003 IDA Min Rural D Local Gov classic local gov LCB medium 122 132 Dupety 2005a194 National Rural Infrastructure Proj. NRIP 2000–04 2004 IDA Min Rural D Local Gov classic local gov LCB medium 134 140 Diouf 2006195 Edu. Supply Improvement Proj. PAOES 2000–04 2004 FDA/France AGETIP classic CMA NCB medium 193 202 Dupety 2005a221 (Table continues on the following page.)

222
Table (continued)
Project overall date ofmanagement agency
Procure- Procure-Project cost Financing ment ment type of Unit cost per m2
Country Project name Acronym period info Agency Head Directorate Delegation Technology Agency method contractor current 2006 Source
196 Communal Support Project PAC 2000–04 2004 IDA MoLD ADM AGETIP classic CMA NCB medium 142 149 Dupety 2005a197 Social Development Fund Project PFDS 2001–05 2004 IDA FS AFDS community classic community LCB small 105 110 Diouf 2006198 Government Program (HIPC) HPIC 2000–05 2004 Gov MoE DCES classic amdmin/cent NCB medium 135 141 Diouf 2006199 Government Program (BCI) BCI 2000–04 2004 Gov MoE DCES classic admin/cent NCB medium 125 131 Dupety 2005a200 Japan Education Program 2002 JICA Donor classic JICA reserved large 357 391 GA2D 2002201 AFDS FatickNiassene PFDS 2003 IDA FS community classic community LCB small 95 102 contract202 EFA1- AGETIP Fatick Gossas EFA-! 2003 IDA MoE AGETIP classic CMA NCB medium 119 128 contract
Uganda
203 Education Strategic Investment Plan ESSIP 2000–06 2003 MoE/SFD/LG MoE SFD/local gov classic community LCB small 75 81 Group 5 2006d204 Edu. Strategic Invest. Plan (urban schools) ESSIP 2000–07 2004 MoE/SFD/LG MoE SFD/local gov classic admin/cent NCB small 135 141 Group 5 2006d205 Micro-Project Program MPP 2000–03 2002 UE MoF MPP Local Gov classic local gov direct/LS small 97 92 Group 5 2006d206 Micro-Project Program MPP 2000–04 2005 UE MoF MPP Local Gov classic local gov direct/LS small 109 EU 2005, p. 45207 Northern Uganda Social Action Fund NUSAF 2000–07 2007 IDA Prime Min Community classic community LCB208 Local Government Development Program LGDP-! 2000–04 2002 IDA MoLG PIU Local Gov classic local gov NCB medium 49.5 World Bank 2004n
level 3209 Local Government Development Program LGDP-1 2000–04 2003 IDA MoLG PIU Local Gov classic local gov NCB medium 63 PKF Consulting 2003, p. 124
level 4210 Local Government Development Program LGDP-2 2004–07 2007 IDA MoLG PIU Local Gov classic local gov NCB medium 92 Theunynck 2007a
level 4211 School Facility Grant - ESSP SFG-ESSP 2000–03 2003 multidonor MoE CMU Sch. Mngm. classic community LCB small 59 PKF Consulting 2003
Com.
Zambia
212 Primary School Upgrading Program OPSUP-1 1993 OPEP PIU ZEPIU classic PIU ICB/CW large/com 167 215 Group 5 2000a213 OPEC Primary School Upgrading Project OPSUP-2 2000–03 2003 OPEC MoE/PIU ZEPIU classic PIU ICB/CW large/com 131 141 Group 5 2006e, pp. 19–20214 Social Recovery Project SRP 1993 WB/EU PIU MPU classic community direct jobbers 125 161 Group 5 2000a215 Education Sector Support Project III ESSP-III 1992–03 2000 Finland MoE classic community direct/LS jobbers 125 142 Group 5 2006e, pp. 19–20216 Community Implementation Program BESSIP 1999–03 2003 Pool/7 MoE DPI classic community direct/LS jobbers 125 134 Group 5 2006e, pp. 19–20217 Basic School Construction Program BSCP 2002–05 2003 IDA MoE SIS classic admin/cent NCB medium 150 161 Group 5 2006e, pp. 19–20218 Education III Edu-III 1999–01 2000 AfDB MoE SIS classic admin/cent ICB large 337 384 Rawling et al 2001, Group 5
2000a219 Education III Edu-III 2002–05 2003 AfDB MoE SIS classic admin/cent ICB large 140 151 Group 5 2006e, pp. 19–20220 Urban School Construction USCP 2000–05 2000 JICA MoE PIU classic donor reserved large 450 513 Group 5 2006e, pp. 19–20221 Zambia Social Investment Fund ZAMSIF 1999–05 2000 WB SF classic community direct/SL jobbers 125 142 Rawling et al 2001,
Group 5 2000a222 Zambia Social Investment Fund ZAMSIF 1999–05 2004 WB SF classic community direct/LS jobbers 80 84 Group 5 2006e, pp. 19–20223 Government Program (HPIC) HPIC 2004 Gov MoE SIS classic admin/cent NCB medium 125 131 Group 5 2006e, pp. 19–20224 Micro-Projects Program MPP 1985–06 2004 EU MPU Microproj Unit classic community direct/LS jobbers 80 84 Group 5 2006e, pp. 19–20

223
Asia
Philippines
225 Second Education Projet SEEP 1990–97 1992 Gov MoE prefab admin/cent NCB large 173 229 World Bank 1996e
Bangladesh
226 Second Primary Education Project (rural) SPEP 1985–90 1985 IDA MoE local gov classic admin/decon LCB small 59 97 World Bank 1985a227 Second Primary Education Project (urban) SPEP 1985–90 1985 IDA MoE classic admin/cent LCB medium 89 145 World Bank 1985a228 General Education Project (Rural) GEP 1990–96 1996 IDA MoE local gov classic admin/decon 98 119 World Bank 1997a229 General Education Project (urban) GEP 1990–96 1996 IDA MoE classic admin/cent 128 155 World Bank 1997a230 Fourth Education Edu-IV 1980–90 1980 IDA MoE classic admin/cent ICB/LCB large/small 47 99 World Bank 1980, p. 28231 Fourth Education Edu-IV 1980–90 1990 IDA MoE classic admin/cent ICB/LCB large/small 58 80 World Bank 1990a
India
232 Raj. District Pri. Edu. Project (1st) RDPE-1 1999–04 2004 IDA MoE classic community 3-Q small 61 64 World Bank 2005u233 Utah Pradesh Primary Edu. Project (1st) UPPEP 1993–00 IDA MoE classic community 3-Q small 82 97 World Bank 1993g
Laos
234 Basic Education Project BEGP 1992–99 1999 ADB MoE PIU classic admin/cent NCB medium 88 102 Madecor 2007235 Second Education Quality Improvement Proj. EQIP-II 1999–07 2002 ADB MoE PIU classic admin/cent NCB medium 115 126 Madecor 2007236 JICA Donor classic donor reserved large 250 291 Madecor 2007237 Education Development Project EDP-I 1993–00 1999 IDA MoE classic admin/cent NCB medium 120 140 Madecor 2007238 Second Education Development Project EDP-II 2004–10 2007 IDA MoE classic community LCB small 67 66 Madecor 2007239 Second Education Development Project EDP-II 2004–11 2007 IDA MoE classic community LCB small 62 World Bank 2007e240 Poverty Reduction Fund PRF 2003–07 2007 IDA SF classic community LCB small 65 World Bank 2007e241 Girls Education Project GEP ADB MoE classic admin/cent NCB medium 96 World Bank 2007e242 Second Educ. Quality Improvement Proj. EQIP-II 1999–07 ADB MoE classic admin/cent NCB medium 115 World Bank 2007e
Pakistan
243 Second Elementary Education Proj. SEEP 1985–93 1987 IDA Gov/PCU prefab. PCU ICB large 194 303 World Bank 1995f(7000$/clrm)
244 Fourth Education Project Edu-IV 1979–87 1985 IDA Gov/PCU classic PCU LCB small 138 226 World Bank 1987b, Annex 16245 Sindh Primary Education SPEDP 1990–99 1990 IDA MoE classic admin/cent LCB 164.7 204 285 World Bank 1990c246 Sindh Primary Education SPEDP 1990–99 1990 classic admin/cent LCB 203.8 139 195 World Bank 1990c
Latin America
Brazil
247 Innovation in Basic Education IBE 1991 IBRD MoE classic admin/cent NCB large 442 596 World Bank 2000e
Mexico
248 Primary Education (4states) PE 1991 IBRD MoE classic admin/cent NCB large 473 638 World Bank 1994b249 Second primary Education SPE 1994 IBRD MoE classic admin/cent NCB large 465 587 World Bank 1994b250 Primary Education PE 1998 IBRD MoE classic admin/cent NCB large 336 397 World Bank 1999h

225
References
Abdullac, Samir. 1979. L’utilisation des techniques et matériaux locaux: Quatre études de cas—lagrande mosquée de Niono; l’école coranique de Malika; l’école rurale de Nigde; l’école maternellede Clesse. Dakar, Senegal: Regional Bureau for Education in Africa, United Nations Educational, Scientific, and Cultural Organization.
Abeillé, Bernard, and Jean Marie Lantran. 1993a. “Social Infrastructure Construction in theSahel.” Discussion Paper No. 200, World Bank, Washington, DC.
Ablo, Emmanuel, and Ritva Reinikka. 1998. “Do Budgets Really Matter? Evidence fromPublic Spending on Education and Health in Uganda.” Policy Research Working Paper1926, World Bank, Washington, DC.
Adam, Sarah. 2005. “Evaluating Social Fund Impact: A Toolkit for Task Team and Social FundManagers.” Social Protection Discussion Paper 0611, World Bank, Washington, DC.
ACA. 1982. Projet Bamako: Bilan. Paris: Programme Interministériel de Coopération, Rexcoop. August.
ADE [Aide à la Decision Économique]. 2006. “Evaluation of European Commission Support to Micro-Projects Programmes under the European Development Fund in ACPCountries: Final Report.” ADE, Louvain-la-Neuve, Belgium, August.
AFDS [Agence du Fonds de Développement Social]. 2003a. L’organisation et la dynamiquecommunautaire: Guide illustré. Dakar, Senegal: AFDS.
______. 2003b. La passation des marchés par les communautés de base: Guide illustré. Dakar,Senegal: AFDS.
______. 2006. “État d’avancement des micro-projets et sous-projets dans la Région deZiguinchor.” Zinguinchor Regional Branch, AFDS, November.
African Development Bank Group. 2004 “Improving the Quality of Projects—Quality ofInfrastructure, Maintenance and Sustainability—Quality of Education.” Toolkit forQuality in Education Projects, Tunis-Belvedère, Tunisia, December.
Ahmad, Junaid Kamal, Shantayanan Devarajan, Stuti Khemani, and Shekhar Shah. 2005.“Decentralization and Service Delivery.” Policy Research Working Paper 3603, WorldBank, Washington, DC.
AGeFIB [Agence de Financement des Initiatives de Bases]. 2001. “Evaluation d’impacts desapproches et actions de l’AGeFIB.” Projet de Fonds Social de Lutte contre la Pauvreté auBénin, réalisation LIFAD, Cotonou, Benin. June.
AGETIP [Agence d’Exécution des Travaux d’Intêret Public]. 2004a. “Rapport annuel 2003.”AGETIP, Dakar, Senegal. January.
Aide et Action. 1984. “Sénégal: Rapport d’activité.” Aide et Action, Dakar, Senegal.

226 • References
______. 2005. “Programme Burkina: Démarche de maîtrise d’ouvrage déléguée.” Includesa contract between the Parents’ Association of Doundougou and the contractorEMJF/BTP. Aide et Action, Paris, November 4.
______. 2007. “Proforma d’un bâtiment en 2001.” Document remis à Serge Theunyncklors de sa mission à Madagascar. April 2007.
ANLC (Agence Nationale de Lutte contre a Corruption et de Moralisation des ActivitésÉconomiques et Financières). 2005. “Enquête nationale sur la corruption et la gouvernance en Guinée (ENACOG 2003): Résumé du rapport final.” ANLC, Conakry,Guinea, June.
Ansley, James. 2000. “Creating Accessible Schools.” National Clearinghouse for Educa-tional Facilities, Washington, DC, June.
Association for the Development of Education in Africa. 2003. “Study of the Provision ofPhysical Infrastructure and Its Impact on Quality Improvement in Primary Educationin Lesotho.” Country case study prepared for the Association for the Development ofEducation in Africa’s Sixth Biennial Meeting, Grand Baie, Mauritius, December 3–6.
Bagayoko, Mamadou. 2005. “Expériences éducatives novatrices pour l’éducation desenfants et jeunes ruraux au Burkina Faso.” Paper prepared for the Ministerial Seminaron Education for Rural People in Africa: Policy Lessons, Options, and Priorities, Foodand Agricultural Organization, held by the Association for the Development of Educa-tion in Africa, and the United Nations Educational, Scientific, and Cultural Organiza-tion, Addis Ababa, Ethiopia, September 7–9.
Baquer, Ali, and Anjali Sharma. 2005. Disability: Challenges vs. Responses. New Delhi, India:Concerned Action Now. http://www.healthlibrary.com/reading/ncure/disability.
Barthélémy, Gérard. 1986. Artisanat et développement. Paris: Gret.BATHYS Consult. 2007. “Rapport d’audit technique et financier des sous-projets financés
par le PNDCC.” Projet National d’Appui au Développement Conduit par les Commu-nautés, Ministère de la Microfinance, de l’Emploi des Jeunes et des Femmes et desPetites et Moyennes Entreprises, Cotonou, Benin.
Batiactu. 2007. “Artisanat du Bâtiment: Bilan 2006 positif et année 2007 prometteuse.”Bactiactu, Paris, January 11. http://www.batiactu.com/edito/artisanat-du-batiment—bilan-2006-positif-et-anne-5036.php.
BEC Engineering. 2005. “Northern Uganda Social Action Fund (NUSAF): Technical Auditof Community Assets—Final Report.” BEC Engineering, South Perth, Australia, December.
Becker, Gary S., and Georges J. Stigler. 1974. “Law Enforcement, Malfeasance, and Compensation of Enforcers.” Journal of Legal Studies 3 (1): 1–18.
Benin. 2008. “Programme de l’Accord de Don: Fast-Track/FCB.” Working draft, Coutonou,Benin, February.
Beynon, John. 1998. “Installations et bâtiments éducatifs: Ce que les planificateursdoivent savoir.” Principes de la planification de l’éducation 57, International Institutefor Educational Planning, Paris.
Bigio, Anthony G., ed. 1998. Social Funds and Reaching the Poor: Experiences and FutureDirections. Washington, DC: World Bank.
Binswanger, Hans, and Tuu Van Nguyen. 2005. “Scaling Up Community-Driven Develop-ment: A Step-By-Step-Guide.” World Bank, Washington, DC, April 5.
______. 2006. “Scaling Up Community-Driven Development for Dummies.” World Bank,Washington, DC, April 14.
Blundo, Giorgio. 2001. “Dessus-de-table: La corruption quotidienne dans la passation desmarchés publics locaux au Sénégal.” Politique Africaine 83 (October): 79–97.
Bruns, Barbara, Alain Mingat, and Ramahatra Rakotomalala. 2003. Achieving Universal Primary Education by 2015: A Chance for Every Child. Washington, DC: World Bank.

References • 227
Burkina Faso. 2004. Loi No. 055-2004/AN Portant Code Général des Collectivités Territoriales,au Burkina Faso. In Journal Officiel, special issue 02, April 20, 2005.
Burns, Barbara, Alain Mingat, and Ramahatra Rakotomalala. 2003e. Achieving UniversalPrimary Education by 2015: A Chance for Every Child. Washington, DC: World Bank.
Bussat, Pierre, Heimo Mantynen, Jørgen Sønderberg, and Mohamed El- Ghannam. 1973a.“Flexible Short-Span Structures for Low-Cost Educational Buildings.” Regional Officefor Education in the Arab States, United Nations Educational, Scientific, and CulturalOrganization, Beirut, Lebanon.
Cameroon. 2004. Loi No. 2004/018 du 22 juillet 2004 fixant les règles applicables aux communes. Yaoundé, July.
CAPEB [Confédération de l’Artisanat et des Petites Entreprises du Bâtiment]. 2007. Livreblanc. Montpellier, France: CAPEB.
Carassus, Jean. 1987. Economie de la filière construction. Paris: Presses de l’École Nationaledes Ponts et Chaussées.
Cassimatis, Peter J. 1969. Economics of the Construction Industry. Studies in Business Economics 111. Washington, DC: National Industrial Conference Board.
Cavero Uriona, Jorge A. 2000. “Guide for Task Teams on Procurement Procedures Used inSocial Fund.” World Bank, Washington, DC.
Cerna, Michael M. 1998. “Nongovernmental Organizations and Local Development.” Discussion Paper 40, World Bank, Washington, DC.
Chad. 2002. Revue des dépenses publiques dans le secteur de l’education. Final report, Commission Technique pour la Revue et le Suivi des Dépenses Publiques dans leSecteur de l’Education, Direction Générale, Ministère de l’Education, N’Djamena,Chad, January.
Chaudhury, Nazmul, Luc Christiaensen, and Mohammad Niaz Asadullah. 2006. “Schools,Household, Risk, and Gender: Determinants of Child Schooling in Ethiopia.” Paperpresented at the Centre for the Study of African Economics Annual Conference,St. Catherine’s College, Oxford, U.K., March 19–21.
Chaudhury, Nazmul, Jeffrey Hammer, Michael Kremer, Karthik Muralidharan, andF. Halsey Rogers. 2006. “Missing in Action: Teacher and Health Worker Absence inDeveloping Countries.” Journal of Economic Perspectives 20 (1): 91–116.
Chaudhury, Nazmul, and F. Halsey Rogers. 2004. “Measuring and Understanding TeacherAbsence.” PowerPoint presentation, Education Sector Board, World Bank, WashingtonDC, May.
Christian Blind Mission and International Center for Eye Health. 2006. Rapid Assessmentof Musculoskeletal Impairment in Rwanda: Preliminary Report for the Ministry of Health.London: Christian Blind Mission and International Center for Eye Health, LondonSchool of Hygiene and Tropical Medicine.
Cissé, Morifing, Abel Diarra, Jacques Marchand, and Sékou Traoré. 2000a. Les écoles communautaires au Mali. Paris: Institute for International Economic Planning.
Cliffe, Sarah, Scott Guggenheim, and Markus Kostner. 2003. “Community- Driven Recon-struction as an Instrument in War-to-Peace Transitions.” Center for Policy ResearchWorking Paper 7, Social Development Department, Environmentally and Socially Sustainable Development Network, World Bank, Washington, DC, August 2003.
Collier, Paul, and Anke Heffier. 2005. “The Economic Costs of Corruption in Infrastruc-ture.” In Global Corruption Report 2005, ed. Transparency International, 12–19. London:Pluto Press.
Congo, Republic of. 2003. Loi No. 10-2003 du 6 février 2003 portant transfert de competencesaux Collectivités Locales. Brazzaville, Republic of Congo, February 6.
CRATerre. 1989. Bulletin d’Information du CRATerre 2 (April–June). École d’Architecture deGrenoble, France.
228 • References
DCES [Direction des Constructions et de l’Equipement Scolaires]. 1985. Entretenons notreécole: Guide d’entretien à l’usage des instituteurs et des élèves des établissements publics d’enseignement élémentaire et des parents d’élèves. Dakar, Senegal: DCES, Direction del’Administration Générale et de l’Equipement, Ministère de l’Education Nationale.
______. 1997. Pour une école appropriée: Guide de programmation et de conception des écolesélémentaires. Dakar, Senegal: DCES, Direction de l’Administration Générale et de l’Equipement, Ministère de l’Education Nationale.
De Bosch Kemper, Jan , T. O. Barry, and S. Bumke. 1990. “Projet de construction de prototypes d’écoles primaires en milieu rural en Guinée.” Regional Bureau for Educa-tion in Africa, United Nations Educational, Scientific, and Cultural Organization,Dakar, Senegal, March 5.
Dellicour, Oswald, Kamal El Jack, Chris Posma, and Paul de Walick. 1978. “Vers unemeilleure utilisation des ressources locales en construction: Le centre de formationagricole de Nianing.” Regional Bureau for Education in Africa, United Nations Educa-tional, Scientific, and Cultural Organization, Dakar, Senegal.
Demante, Marie Jo, and Abdoulaye Sidibe. 2006. Evaluation du thème “Appui à la decentral-ization et gouvernance locale.” Étape 2: Études de terrain, le Burundi. Cepia, InternationalInstitute for Environment and Development, African Institute for Community-DrivenDevelopment, Institut de Recherches et d’Applications des Méthodes de Développe-ment, Service Public Féderal et Coopération au Développement, La Coopération Belgeau Développement, Paris, France.
Derisbourg, François, and AETA. 1987. Au Mali: Un programme de construction en banco stabilisé. Monographie de Projet Association Française des Volontaires du Progès, Ministère de la Coopération, Bamako, Mali, March.
De Silva, Samantha. 2000. “Community-Based Contracting: A Review of StakeholderExperience.” World Bank, Washington, DC.
______. 2002. Communities Taking the Lead: A Handbook on Direct Financing of CommunitySubprojects. Washington, DC: World Bank.
DIAL [Développement Institutions & Analyses de Long Terme]. 2007. “Youth and LabourMarkets in Africa: A Critical Review of Literature.” Working Paper 49, DIAL, Paris, October.
Diou, Christian, Michel Henry, and Babaly Deme. 2007. La délégation de maîtrise d’ouvrageen Afrique en 2007: Bila, enjeux et perspectives. Public-Private Infrastructure Advisory Project, Dakar, Senegal, April.
Diouf, Mame Sémou. 2006. Rapport d’évaluation des coûts unitaires des constructions scolairesréalisées par le Projet Fonds de Développement Social. Agence du Fonds de DéveloppementSocial, Dakar, Senegal, May.
DMN [Direction de la Météorologie Nationale]. 1980. “Station agrométéorologique deChikal.” Projet PNUD/OMM/NER/77/002, DMN, Niamey, Niger.
DPEF [Direction des Projets Education et Formation]. 1994a. Atlas Info RIM, Tome 1: Sites.Ministère de l’Education Nationale, Ministère du Plan, Nouakchott, Mauritania.
______. 1994b. Atlas scolaire: Données par collectivité. Appui aux collectivités pour la construction de salles de classe de l’Enseignement Fondamental, Projets Education IIIet V, Direction des Projets Education et Formation, Direction de la Planification et dela Coopération, Ministère de l’Education Nationale, Ministère du Plan, Nouakchott,Mauritania, December 21.
DTI [U.K. Department of Trade and Industry]. 2001. Current Practice and Potential Use ofPrefabrication. Project Report 203032, Construction Industry Directorate, DTI, London.
Duflo, Esther. 2001. “Schooling and Labor Market Consequences of School Constructionin Indonesia: Evidence from Unusual Policy Experiment.” American Review 91 (4):795–813.
References • 229
Dundas & Wilson. 2005. “EU and Competition.” Dundas & Wilson bulletin.http://www.dundas-wilson.com.
Dupety, Daniel. 2003. Evaluation des travaux de genie-civil: Mission Daniel Dupety du 18 juillet au 3 aôut 2003. Projet Équité et Amélioration des Écoles (IDA Cr 2719-GUI),Composante Construction et Réhabilitation des Écoles Primaires, Conakry, Guinea,September 9.
______. 2004. “Revue du volet génie civil: Rapport de mission (05 au 15 février 2004).”Projet Equité et Amélioration des Ecoles (IDA Cr 2719-GUI), Programme Educationpour Tous (IDA Cr 3552-GUI), Conakry, Guinea.
______. 2005a. “Construction scolaire: Évaluation des travaux de génie-civil de la premièrephase.” Mission report, Senegal, March 16–April 10.
______. 2005b. “Revue du volet génie civil: Rapport de mission (10 au 19 avril 2005).” Programme Education pour Tous (IDA Cr 3552-GUI), Conakry, Guinea.
______. 2005c. “Revue du volet génie civil: Rapport de mission (1 au 13 septembre 2005).”Programme Education Pour Tous (Cr 3552-GUI), Conakry, Guinea.
______. 2006. “Aide-mémoire: Contribution de Daniel Dupety, mission de pré-évaluation,6–18 février 2006.” Programme d’appui à la reconstruction du système educatif duBurundi, Bujumbura, Burundi.
Edward, Michael, and Alan Fowler, eds. 2004. The Earthscan Reader on NGO Management.London: Earthcan Publications.
EMC Jatula Associates. 2003. “Malawi Social Fund Consultancy Services for Review ofCost-Effectiveness and Technical Design Standards.” Final Report, EMC Jatula Associ-ates Consulting Engineers, Lilongwe, Malawi, June.
Ernst & Young. 2001. “Projet Équité et Amélioration des Écoles (PEAE): Rapport sur la mission de contrôle des procédures d’appel d’offres.” Conakry, Guinea, September.
EU [European Union]. 2005. “8th EDF Microprojects Programme, Project No. 8, ACP UG013: Completion Report—2000–2005.” Kampala, Uganda.
F2 Consultants. 1999. “Étude comparative de salles de classe.” F2 Consultants, Ministèrede l’Education Nationale, Direction des Constructions et de l’Equipement Scolaires,Agence d’Exécution des Travaux d’Intêret Public, Dakar, Senegal.
Faso Baara. 2006. “Rapport annuel exercice 2005.” Faso Baara, Ouagadougou, Burkina Faso.FCGA [Fédération des Centres de Gestion Agréés]. 2007. Activités et tendances. 11th ed.
Paris: FCGA, June.FID [Fonds d’Intervention pour le Développement]. 2003a. “Travaux de construction de
deux bâtiments respectivement à deux salles de classe et à deux salles de classe avecbureau pour EPP Iavo Ambony.” Contrat entreprise Hasina, Antananarivo, Madagascar,April 5.
______. 2003b. “Travaux de construction de l’EPP Morarano Antongona.” Contrat entre-prise EETMa.” Antananarivo, Madagascar, August 28.
______. 2004a. “Construction de 3000 salles de classe: ‘2700 EPP et 700 CEG avec la four-niture de mobilier scolaire.’” Rapport de synthèse: Programme–Prospection–ÉtudesDCE–Consultation des Entreprises–Passation des Marchés, établi le 12 mars 2004 parSBLT Consultant, Antananarivo, Madagascar.
______. 2004b. “Programme Education pour Tous (EPT), Financement Ministère de l’Education Nationale et de la Recherche Scientifique: Dossier d’appel d’offres.” Hexaport International, FID. Ministère de l’Education Nationale et de la Recherche Scientifique, Antananarivo, Madagascar, July 13.
______. 2004c. “Travaux de construction de l’E.P.P. Andranomasina.” Contrat entrepriseE.M.M, Antananarivo, Madagascar, April 26.
______. 2004d. “Travaux de construction du lycée Soanindrariny.” Contrat1497/ENT/DRT/04, Entreprise Dina, Antananarivo, Madagascar, November 21.

230 • References
______. 2005a. “Exécution des travaux de construction CEG Ambongamarina.” Contrat04/CR-AMG-03, Entreprise Arena, Antananarivo, Madagascar, June 9.
______. 2005b. “Travaux de construction de l’EPP Antanimenabe.” Contrat entrepriseToandro, Antananarivo, Madagascar, April 25.
______. 2005c. “Travaux de construction du CEG à 4 salles de classes avec bibliothèque etbureau à Nandihizana.” Contrat C01, Entreprise Andry-H, Antananarivo, Madagascar,Septermber 5.
______. 2007. “Coût moyen des infrastructures scolaires.” Estimation provided by FID toSerge Theunynck during a mission, Antananarivo, Madagascar, April 2007.
FID-EPT [Fonds d’Intervention pour le Développement–Education Pour Tous]. 2005a.Convention de Maîtrise d’Ouvrage Déléguée entre le Ministère de L’Education Nationale etde Recherche Scientifique (MENRS) et le Fonds d’Intervention pour le Développement—Education Pour Tous (FID-EPT). Convention No. 01/2005, MENRS/FID-EPT, Antana-narivo, Madagascar, January 18.
______. 2005b. “Memorandum: Marché FID/EPT–Hexaport International, construction1.400 salles de classe, composante ‘founitures,’ composante ‘travaux,’ services connexes.”Antananarivo, Madagascar, November.
Filmer, Deon. 2004. “If You Build It, Will They Come? School Availability and SchoolEnrollment in 21 Poor Countries.” Policy Research Working Paper 3340, World Bank,Washington, DC.
Finkel, Gerard. 1997. The Economics of the Construction Industry. Armonk, NY: M.E. Sharpe. Foster, Andrew D., and Mark R. Rosenzweig. 1996. “Technical Change and Human Capital
Returns and Investments: Evidence from the Green Revolution.” American EconomicReview 86 (4): 932–53.
Frigenti, Laura, and Alberto Harth. 1998. Local Solutions to Regional Problems: The Growth ofSocial Funds and Public Works and Employment Projects in Sub-Saharan Africa. Washington,DC: World Bank.
Gershberg, Alec Ian, and Donald R. Winkler. 2003. “Education Decentralization in Africa: AReview of Recent Policy and Practice.” World Bank, Washington, DC.
Glewwe, Paul, and Hanan G. Jacoby. 1994. “Student Achievement and Schooling Choicein Low-Income Countries: Evidence from Ghana.” Journal of Human Resources 29 (3):834–64.
______. 1996. “School Enrollment and Completion: An Investigation of Recent Trends.”In Household Welfare and Vietnam’s Transition, ed. David Dollar, Paul Glewwe, and Jennie Litvack, 201–34. Washington, DC: World Bank.
Glick, Peter, and David E. Sahn. 2006. “The Demand for Primary Schooling in Mada -gascar: Process, Quality, and the Choice between Public and Private Providers.” Journalof Development Economics 79 (1): 118–45.
Gopal, Gita. 1995. Bank-Financed Projects with Community Participation: A Manual forDesigning Procurement and Disbursement Mechanisms. Washington, DC: World Bank.
Gould, William T. S. 1978. “Guidelines for School Location Planning.” Staff WorkingPaper 308, World Bank, Washington, DC.
Group 5 Consulting Engineers. 2000. “Zambia Primary School Infrastructure Study: FinalReport.” Group 5 Consulting Engineers, Rotterdam, Netherlands.
______. 2005. “Review of Primary School Construction Standards, Cost, and ConstructionManagement Capacity in Madagascar.” Group 5 Consulting Engineers, Rotterdam,Netherlands.
______. 2006a. “Country Report: Burkina Faso.” In School Construction Study: A Compara-tive Analysis of Primary School Construction in Burkina Faso, Ghana, Mozambique, Uganda,Zambia. Rotterdam, Netherlands: Group 5 Consulting Engineers.

References • 231
______. 2006b. “Country Report: Ghana.” In School Construction Study: A ComparativeAnalysis of Primary School Construction in Burkina Faso, Ghana, Mozambique, Uganda,Zambia. Rotterdam, Netherlands: Group 5 Consulting Engineers.
______. 2006c. “Country Report: Mozambique.” In School Construction Study: A Compara-tive Analysis of Primary School Construction in Burkina Faso, Ghana, Mozambique, Uganda,Zambia. Rotterdam, Netherlands: Group 5 Consulting Engineers.
______. 2006d. “Country Report: Uganda.” In School Construction Study: A ComparativeAnalysis of Primary School Construction in Burkina Faso, Ghana, Mozambique, Uganda,Zambia. Rotterdam, Netherlands: Group 5 Consulting Engineers.
______. 2006e. “Country Report: Zambia.” In School Construction Study: A ComparativeAnalysis of Primary School Construction in Burkina Faso, Ghana, Mozambique, Uganda,Zambia. Rotterdam, Netherlands: Group 5 Consulting Engineers.
Gurney, Beth. 2004. Sand and Soil: Earth’s Building Blocks. New York: Crabtree Publishing.Haan, Hans Christian. 2001. Training for Work in the Informal Sector: Fresh Evidence from
Eastern and Southern Africa. Turin, Italy: International Training Center, InternationalLabour Organization.
Habitat Forum Berlin. 1987. Learning from One Another. Proceedings of Habitat ForumBerlin 1987, International Conference on Housing and Local Development, Urbaniza-tion Processes, and Development Options, Berlin, June 1–11.
Hammarskjöld, Dag. 1975. “Que faire? Un autre développement” [French translation].Report prepared for the Seventh Extraordinary Session of the United Nations, NewYork.
Hanushek, Eric A. 1995. “Interpreting Recent Research on Schooling in Developing Countries.” World Bank Research Observer 10 (2): 227–46.
Harris, E. C., and KPMG. 1995. “Construction Industry Development Study.” Stage 1Report, December 21.
Houben, Hugo, and Hubert Guillard. 1989. Modernité de l’architecture de terre en Afrique:Réalisations des années 80. Grenoble, France: CRATerre.
IEG [Independent Evaluation Group]. 2006a. Engaging with Fragile States: An IEG Review ofWorld Bank Support to Low-Income Countries under Stress. Washington, DC: World Bank.
______. 2006b. Malawi: Country Assistance Evaluation. Report 36862. Washington, DC:World Bank.
ILO [International Labour Office]. 1982. Pour une politique d’emploi au Sénégal: Esquissed’une stratégie concertée et intégrée. Addis Ababa, Ethiopia: ILO.
______. 2002a. Decent Work and the Informal economy: Sixth Item on the Agenda. ReportVI, International Labour Conference, 90th Session. Geneva: ILO.
INSEE (Institut National de la Statistique et des Études Économiques). 2004. Statisticsfrom website (http:////www.insee.fr).
Jack, William. 2001. “Social Investment Funds: An Organizational Approach to ImprovedDevelopment Assistance.” World Bank Research Observer 16 (1): 109–24.
Jadin, Olivier. 2004. “La situation des personnes handicapées au Bénin: Diagnostic prélim-inaire et propositions d’action.” World Bank, Washington, DC. http://siteresources.worldbank.org/DISABILITY/Resources/Regions/Africa/BeninJadin.pdf.
Johanson, Richard K., and Arvil V. Adams. 2004. Développement des qualifications profes-sionnelles en Afrique subsaharienne. Washington, DC: World Bank.
Kabuga. 2001. “Projet de construction du centre scolaire de Rusheshe.” Mairie de Kabuga,Rwanda, December.
Kamto, Maurice. 2002. “Decentralisation communale et développement local au Cameroun:Étude critique juridique et propositions.” Final Report, 2nd ed., Programme Nationalde Développement Participatif, July.
232 • References
Kane, Eileen. 2004. “Girls’ Education in Africa: What Do We Know about StrategiesThat Work?” Africa Region Human Development Working Paper 73, World Bank,Washington, DC.
Kaufmann, Daniel, Aart Kraay, and Pablo Zoido-Lobatón. 2000. “Governance Matters:From Measurement to Action.” Finance and Development 37 (2): 10–13.
Kayumba. 2006. Project Education III interoffice memorandum dated March 10.Kessides, Christine. 1997. “World Bank Experience with the Provision of Infrastructure Serv-
ices for the Urban Poor: Preliminary Identification and Review of Best Practices.” Trans-portation, Water, and Urban Development Department, World Bank, Washington, DC.
Kingdon, Geeta. 1996. “The Quality and Efficiency of Public and Private Schools: A CaseStudy of Urban India.” Oxford Bulletin of Economics and Statistics 58 (1): 55–80.
Kisamba-Mugerwa, Christine, Yakobo Moyini, Erissa Ochieng, and Henk Meijerink. 2001.“Uganda, SFG Evaluation.” Final Report, Ministry of Education and Sports, Kampala,Uganda, March.
Klitgaard, Robert. 1998. Controlling Corruption. Santa Monica, CA: University of CaliforniaPress.
Klitgaard, Robert, Ronald Maclean-Abaroa, and H. Lindsey Parris. 2000. Corrupt Cities: APractical Guide to Cure and Prevention. Oakland, CA: ICS Press.
Knapp, Eberhard, Kaj Noschis, and Çelen Pasalar, eds. 2007. School Building Design and Learn-ing Performance with a Focus on Schools in Developing Countries. Lausanne, Switzerland:Comportements.
Koskela, Lauri, and Ruben Vrijhoef. 2001. “The Prevalent Theory of Construction Is a Hin-drance for Innovation.” TNO Building and Construction Research, Delft, Netherlands.
Kremer, Michael. 1995. “Research on Schooling: What We Know and What We Don’t—AComment on Hanushek.” World Bank Research Observer 10 (2): 247–54.
Kumar, Nalini. 2003a. “Community-Driven Development: Lessons from the Sahel—AnAnalytical Review.” Working Paper, Operations Evaluation Department, World Bank,Washington, DC.
Kun, George. 2004. “Low Labor-Input Technology Utilization in the Construction Industry.”Central Bureau of Statistics, Jerusalem, Israel.
Laking, Rob. 2006. “Agencies: Their Benefit and Risks.” OECD Journal on Budgeting 4 (4):9–30.
Langley, Philip, with Nazaire Sadom, Jean Gbedo, Zourkaïnény Adamou, Boniface Fade,and Saraf Dine Ogbon. 2002. “Le développement dirigé par les communautés: Un bilansommaire des actions menées au Bénin.” Centre for Environment and Development inAfrica, Cotonou, Benin.
Lavy, Victor Chaim. 1996. “School Supply Constraints and Children’s Educational Outcomes in Rural Ghana.” Journal of Development Economics 51 (2): 291–314.
Lecysyn, René. 1997. “Tchad évaluation technique de la première phase du volet ‘constructions scolaires’ du Projet de l’Enseignement Fondamental: Rapport deuxièmepartie.” Direction des Projets Education, Ministère de l’Education Nationale, N’Djamena,Chad.
Lehman, Douglas. 2004. “Selected Implementation Strategies: Options for AcceleratingProgress to EFA in Ethiopia.” Paper prepared for the Ethiopia Education Forum, September 2004.
Lehman, Douglas, Piet Buys, Gaiwé François Atchina, Léo Laroche, and Bob Prouty. 2004.The Rural Access Initiative: Shortening the Distance to Education for All in the African Sahel.Washington, DC: World Bank.
Lesotho. 2005. “Kingdom of Lesotho Education Sector Strategic Plan, 2005–2015.” Ministry of Education and Training, Maseru, Lesotho.

References • 233
Levacic, Rosalind, and Peter Downes. 2004. Formula Funding of Schools, Decentralization, andCorruption: A Comparative Analysis. Paris: Institute for International Economic Planning.
Lewis, Maureen A., and Marlaine E. Lockheed. 2006. Inexcusable Absence: Why 60 MillionGirls Still Aren’t in School and What to Do about It. Washington DC: Center for GlobalDevelopment.
Lipsmeier & Partner Architects. 2000. “Drawings and Costs.” Documents collected by SergeTheunynck, Lipsmeier & Partner Architects.
Litvack, Jennie, Junaid Ahmad, and Richard Bird. 1998. “Rethinking Decentralization inDeveloping Countries.” World Bank, Washington, DC.
Lloyd, Cynthia B., Sahar El Tawila, Wesley H. Clark, and Barbara S. Mensch. 2003. “The Impactof Educational Quality on School Exit in Egypt.” Comparative Education Review 47 (4):444–67.
Lo, Fu-Chen, and Yue-Man Yeung, eds. 1998. Globalization of the World of Large Cities.Tokyo: United Nations University Press.
Lockheed, Marlaine E., and Adriaan M. Verspoor. 1991. Improving Primary Education inDeveloping Countries. Washington, DC: Oxford University Press.
Ly, Serigne. 1992. “Problématique des constructions scolaires au Sénégal.” IngénieurGénie Civil, Chef de la Division des Constructions et de l’Equipement Scolaires, Dakar,Senegal.
Lynch, James. 1994. “Provision for Children with Special Educational Needs in the AsiaRegion.” Asia Technical Paper 261, World Bank, Washington, DC.
Maclean, Andrew. 2005. Review of DFID Technical Assistance to the Unit for Construction andEquipment of Schools (UCES). London: DFID.
Madagascar. 2006. “Rapport de suivi du Plan Education pour Tous.” First draft, Antana-narivo, Republic of Madagascar, March 15.
Madecor Career System. 2007. “Second Education Development Project (Grant NoH0840-LA) Component 1: Evaluation of Impact of Community-Based Interventions—Mid-Term Evaluation.” Madecor Career System, Vientiane, Lao PDR.
Manikowski, Stanislaw, and Ibrahima Hathié. 2005. “Projet National d’InfrastructuresRurales Première Phase (PNIR1): Rapport d’achèvement.” École National d’ÉconomieAppliquée, Dakar, Senegal.
Mason, Andrew D. 1994. “Schooling Decisions, Basic Education, and the Poor in RuralJava.” PhD thesis, Food Research Institute, Stanford University, Stanford, CA.
Mason, Andrew D., and Scott D. Rozelle. 1998. Schooling Decisions, Basic Education, and thePoor in Rural Java. Washington, DC: World Bank.
Mauritania. 2006. “Cadre Global de Dépenses à Moyen Terme 2007–2009.” Draft Zero,Ministère des Affaires Economiques et du Développement, Ministère des Finances,Nouakchott, Mauritania.
May, John, Soumana Harouna, and Jean-Pierre Guengant. 2004o. “Nourrir, éduquer etsoigner tous les Nigériens: La démographie en perspective.” Africa Region Human Devel-opment Working Paper 63, World Bank, Washington, DC.
Maynard, Kimberly. 2005f. “Community-Driven Conflict Recovery: From Reconstructionto Development.” World Bank, Washington, DC.
Mbungu, Mbuba. 1999. “Procurement and Financial Procedures Manual for Use by Community-Based Organizations.” World Bank, Accra Ghana.
Meadows, Donella H., Dennis L. Meadows, Jørgen Randers, and William W. Behrens.1972. The Limits to Growth. Washington DC: Potomac Associates.
MEMP [Ministère de l’Enseignement Maternel et Primaire]. 2007. “Enseignement primaire2005–2006: Public et privé.” Ministère de l’Enseignement Maternel et Primaire, Cotonou, Benin.

234 • References
MENRS [Ministère de l’Education Nationale et de la Recherce Scientifique]. 2007. “Pro-gramme Éducation pour Tous: Stratégie de construction d’écoles.” MENRS, Antananrivo,Madagascar.
MESTRS [Ministère de l’Éducation, de la Science, de la Technologie et de la Recherche Scientifique]. 2006. Documents remis par le MESTRS à la mission. World Bank,Rwanda, October.
Michaelowa, Katharina, and Annika Wechtler. 2005. “The Cost-Effectiveness of Inputs inPrimary Education: Insights from the Literature and Recent Student Surveys for Sub-Saharan Africa.” Background paper for the Association for the Development of Educa-tion in Africa biennial meeting, January 2006. Operations Evaluation Department,World Bank, Washington, DC.
Mingat, Alain. 2003. “Eléments analytiques et factuels pour une politique de la qualitédans le primaire en Afrique subsaharienne dans le contexte de l’Education pour Tous.”World Bank, Washington, DC, October.
Mingat, Alain, Ramahatra Rakotomalala, and Jee-Peng Tan. 2002a. “Financing Educa-tion for All by 2015: Simulations for 33 African Countries.” Africa Region HumanDevelopment Working Paper, World Bank, Washington, DC.
Mingat, Alain, and Bruno Suchaut. 1998. “Une analyse économique comparative des sys-tèmes éducatifs africains.” Rapport réalisé pour le compte du Ministère Français de laCoopération et du Développement. Institut de Recherche sur l’Économie de l’Éducation,Université de Bourgogne, Dijon, France, November.
NaCSA [National Commission for Social Action]. 2003. Community-Driven Programme:Direct Community Financing. Freetown, Sierra Leone: NaCSA.
Narayan, Deepa. 2003. Autonomisation et reduction de la pauvreté. Montreal, QC: EditionsSaint-Martin.
Ndegwa, Stephen N. 2002. “La décentralisation en Afrique: Vue d’ensemble.” World Bank,Washington, DC, November.
NISER [Nigerian Institute of Social and Economic Research]. 2004. “Background Study forthe Mid-Term Review of the Community-Based Poverty Reduction Project.” Study conducted for the National Planning Commission and the World Bank, NISER,Niamey, Niger.
Neufert, Ernst. 2006. Les éléments des projets de construction. 9th ed. Paris: Dunod. NMFA [Netherlands Ministry of Foreign Affairs]. 2003. Local Solutions to Global Challenges:
Towards Effective Partnership in Basic Education, Joint Evaluation of External Support to BasicEducation in Developing Countries. The Hague, Netherlands: NMFA. http://www.dfid.gov.uk/pubs/files/basic-education-final-report.pdf.
Norton, John. 1997. Building with Earth: A Handbook. 2nd ed. London: ITDG Publishing. NUSAF [Northern Uganda Social Action Fund]. 2007. “Northern Uganda Social Action
Fund: CDI Sub-projects Funded as at 31st July 2007.” NUSAF, Kampala, Uganda.OECD [Organisation for Economic Co-operation and Development]. 2007. “Statistical
Annex.” In Development Co-operation Report 2006. Table 2. Paris: OECD. OED [Operations Evaluation Department]. 2002. “Social Funds: A Review of World Bank
Experience.” Report 23668. OED, World Bank, Washington, DC. ______. 2004. Books, Buildings, and Learning Outcomes: An Impact Evaluation of World Bank
Support to Basic Education in Ghana. Washington, DC: World Bank. ______. 2005a. Capacity Building in Africa: An OED Evaluation of World Bank Support.
Washington, DC: World Bank. ______. 2005b. “Niger: First Education Project (Cr 1151-NIR), Primary Education Devel-
opment Project (Credit 1740-NIR), Basic Education Sector Project (Hybrid) (Credit2618-NIR)—Project Performance Assessment Report.” Report 31657, World Bank,Washington, DC.

References • 235
______. 2005c. The Effectiveness of World Bank Support of Community-Based and-Driven Devel-opment: An OED Evaluation. Washington, DC: World Bank. http://www.worldbank.org/oed/cbdcdd.
Okidi, John A., and Madina Guloba. 2006. “Decentralization and Development: Emerg-ing Issues from Uganda’s Experience.” Occasional Paper 31, Economic Policy ResearchCentre, Kampala, Uganda.
Olivier, Franco. 2004. “Audit technique du Programme de Développement Communautaire(FID IV) à Madagascar: Rapport final.” Fonds d’Intervention pour le Développement,Antananarivo, Madagascar.
Olken, Benjamin A. 2005. “Monitoring Corruption: Evidence from a Field Experimentin Indonesia.” Harvard University and National Bureau of Economic Research, Cambridge, MA.
Olowu, Dele. 2003. “Local Democracy, Taxation, and Multi-level Governance in Africa.”Paper prepared for the Norwegian Association for Development Research Annual Conference on Politics and Poverty, Workshop on Taxation, Accountability, andPoverty, Oslo, Norway, October 23–24.
OSEO [Oeuvre Suisse d’Entraide Ouvrière]. 2007. “Devis estimatif pour la réalisation d’uncomplexe scolaire.” Représentation au Burkina Faso. Document remis à Serge Theunynck.February 2007.
Ould Cheik, Abdel Weddoud. 1994. Mission pour l’identification des mécanismes de finance-ment des constructions scolaires des collectivités. Rapport de mission, Ministère du Plan,Projet de Restructuration du Secteur de l’Éducation, Bureau de Coordination du Projet,Nouakchott, Mauritania, March.
Oumarou, Boubacar. 1993. “Stratégie de construction des classes primaires.” Présentationde la délégation du Niger au séminaire sur les pratiques de construction des infrastruc-tures sociales dans les pays du Sahel à Dakar. October 19–22.
Owen, Daniel, and Julie Van Domelen. 1998. “Getting an Earful: A Review of BeneficiaryAssessment of Social Funds.” Social Protection Discussion Paper 9816, World Bank,Washington, DC.
Parajuli, Dilip. 2001. “What Is Driving Educational Ineffectiveness in Kenya? The Role of Eco-nomic Inefficiency, Institutional Corruption, and Poverty.” Transparency International–Kenya, Nairobi, Kenya.
Paxson, Christina, and Norbert Schady. 1999. “Do School Facilities Matter? The Case ofthe Peruvian Social Fund (FONCODES).” Policy Research Working Paper 2229, WorldBank, Washington, DC.
Pichvai, Ahita. 2004. “Assessment of School Infrastructure Needed to Support the Expansionof Basic Education.” CfBT Education Trust, Rwandan Education Sector Support Program,Ministry of Education, Science, Technology, and Scientific Research, Kigali, Rwanda.
PKF Consulting. 2003. “SFG Programme: Value for Money Audit.” Draft Report, PKF Consulting, Kampala, Uganda.
Plan Guinée. 2001. Constructions dans les Zones de Yomou et Bowe: Détail des coûts. PlanGuinée, Conakry, Guinea, January 13.
PNDCC [Projet National d’appui au Developpement Conduit par les Communautés].2007. “Comparaison de prix par mètre carré par type de financement.” Executive Secretariat, PNDCC, Cotonou, Benin, June 27.
Ratcliffe, Mike, and Murray Macrae. 1999. “Sector Wide Approaches to Education: A Strategic Analysis.” Education Research, Serial 32, U.K. Department for InternationalDevelopment, London.
Rawlings, Laura, Lynne Sherburne Benz, and Julie Van Domelen. 2001. “Letting Commu-nities Take the Lead: A Cross-Country Evaluation of Social Fund Performance.” WorldBank, Washington, DC.

236 • References
Richman, Judah Lee. 1994. “Accelerated Methods of Residential Construction: Prefabrica-tion Re-evaluated.” M.S. thesis, Massachusetts Institute of Technology, Cambridge, MA.
Salmen, Lawrence F. 1995. “Beneficiary Assessment: An Approach Described.” SocialAssessment Paper 23, World Bank, Washington, DC.
Salmen, Lawrence F., assisted by Misgana Amelga. 1998. “Implementing BeneficiaryAssessment in Education: A Guide for Practitioners (with Examples from Brazil).”Social Development Paper 25, World Bank, Washington, DC.
Schaffner, Julie. 2003. “The Determinants of Schooling Investments among PrimarySchool-Aged Children in Ethiopia.” Human Development Department, Africa Region,World Bank, Washington, DC.
SCHL [Société Canadienne d’Hypothèque et de Logement]. 2003. Guide des codes de construction résidentiels des États-Unis à l’intention des exportateurs canadiens. Kanata, ON:SCHL.
Schumacher, Ernst Friedrich. 1973. Small Is Beautiful: Economics as If People Mattered. London: Harper Perennial.
______. 1980. Good Work. Paris: Editions du Seuil.Sey, Haddy. 2001. “Quality Education for All in Senegal: Including the Excluded.” Back-
ground paper for the Quality Education for All Project, World Bank, Washington, DC.Sey, Haddy, Sudesh Mukhpadhyay, Evelyne Laurin, and Sourav Banerjee. 2003. Enhancing
Educational Opportunities for Vulnerable People: Exploring UNICEF SWASTHH for Support—A Rapid Assessment. Washington, DC: Creative Associates International.
Sinke, Leo. 2003. “The Gambia: Third Education Project—Contribution to the Aide Memoire.” World Bank, Washington DC.
Siri, Gabriel, and Piet Goovaerts. 2002. “Analysis of the Costs and Benefits of Public WorksPrograms in Cape Verde.” National Poverty Alleviation Program, Social Sector Develop-ment Project, Praia, Cape Verde.
SNIES [Service National des Infrastructures et Equipements Scolaires]. 1990. Programmeexperimental d’écoles avec les collectivités rurales. SNIES, Ministère de l’Enseignement Pré-Universitaire et de l’Education Civique, Conakry, Guinea.
______. 1999. “Atelier sur la rehabilitation des infrastructures scolaires, du 3 au 7 mai1999.” Documents préparatoires aux travaux de l’atelier. SNIES, Ministère de l’Enseignement Pre-Universitaire et de l’Education Civique, Conakry, Guinea.
SNV and CEDELO [Netherlands Development Organization and Centre de DeveloppementLocal]. 2004. “La décentralisation au Mali: du discours à la practique.” Décentralisationet gouvernance locale bulletin 358, Institut Royal des Tropiques, Amsterdam, May 4.
SP-SRP [Secrétariat Permanent de la Stratégie de la Pauvreté]. 2005. “Deuxième rapport demise en œuvre de la stratégie de réduction de la pauvreté.” SP-SRP, Ministère de l’Economie et des Finances, Conakry, Guinea.
Steinfeld, Edward. 2005. “Education for All: The Cost of Accessibility.” Education Notes,World Bank, Washington, DC.
Strand, Arne, Hege Toje, Alef Morten Jerve, and Ingrid Samset. 2003. “Community-DrivenDevelopment in Contexts of Conflicts.” Concept paper, Chr. Michelsen Institute,Bergen, Norway.
Sugii, Takashi. 1998. “The Construction Sector Suffers from Declining Labor Productivity.”Industrial Research Department, NLI Research Institute, Tokyo.
Synergy International. 1995. “Rapport de mission d’audit technique du volet ‘constructionde salles de classe’ couvrant la période novembre 1995.” Synergy International, Brussels,Belgium.
______. 1997. “Preparation of a Nation-Wide Classroom Construction Program under theThird Education Project.” Synergy International, Brussels, Belgium, and Ministry ofEducation, Banjul, The Gambia.
References • 237
______. 2000. “Rapport de mission d’audit technique du volet ‘construction de salles declasse,’ couvrant la période novembre 1995–June 2000.” Synergy International, Brussels,Belgium.
Tan, Jee-Peng, Julia Lane, and Paul Coustere. 1997. “Putting Inputs to Work in ElementarySchools: What Can Be Done in the Philippines?” Economic Development and CulturalChange 45 (4): 857–79.
Theisen, Gary. 2002. “Education Sector Development Project: Ethiopia.” Supervision Mission, October 22–November 10, Addis Ababa, Ethiopia.
Theunynck, Serge. 1987. Economie de la construction à Nouakchott. Paris: L’Harmattan.______. 1993. “Création d’une capacité nationale de réalisation des infrastructures sociales
de base.” Rapport general, Direction des Projets Éducation–Formation, Nouakchott,Mauritania.
______. 1994. Economie de l’habitat et de la construction au Sahel. Vols. 1 and 2. Paris: L’Harmattan.
______. 1995. “Preparation of the Third Elementary Education Project.” Annex to the aidememoire for civil works, World Bank, Washington, DC, February–March.
______. 1999. “Coût des constructions scolaires: Recueil de données par pays et par projet.” Projet d’Appui aux Collectivités pour la Construction de Salles de Classe, Direction des Projets Éducation–Formation, Nouakchott, Mauritania, October 25.
______. 2000. “Projet PASE-II: Supervision Report.” Technical Note, World Bank, Washington, DC.
______. 2002. “School Construction in Developing Countries: What Do We Know?” WorldBank, Washington, DC.
______. 2005. “Note technique sur les performances de l’AGECABO.” Projet deDéveloppement du Secteur Social, World Bank, Washington, DC.
______. 2006. “Note sur l’approche construction modulaire industrialisée (CMI).” Projetd’Appui à la Réduction de la Pauvreté, Construction de Salles de Classe, World Bank,Washington, DC.
______. 2007. “Universal Secondary Education (USE): Universal Primary Education andTraining (UPPET).” Aide memoire, mission regarding school construction in Uganda,World Bank, Washington, DC.
Transparency International. 2002. “Corruption Fighters’ Tool Kit: Civil Society Experiencesand Emerging Strategies.” Transparency International, Berlin.
______. 2005a. Un avenir dérobé: La corruption dans l’éducation—Dix experiences vécues à travers le monde. Berlin: Transparency International
______. 2005b. Global Corruption Report 2005: Special Focus—Corruption in Construction andPost-conflict Reconstruction. Berlin: Transparency International.
UNCDF [United Nations Capital Development Fund]. 2006. Delivering the Goods: Building Local Government Capacity to Achieve the Millennium Development Goals—APractitioner’s Guide for UNDCF Experience in Least Developed Countries. New York:UNCDF.
UNCHS [United Nations Center for Human Settlements]. 2001. Cities in a GlobalizingWorld. Global Report on Human Settlements 2001. London: Earthscan.
UNESCO [United Nations Educational, Scientific, and Cultural Organization]. 1984.“UNESCO-FADES Feasibility Study on the Development of Low-Cost Educational Buildings and Facilities in Djibouti, Mauritania, Somalia, Sudan, PDR Yemen, andYemen AR.” UNESCO, Noukachott, Mauritania, and Dakar, Senegal.
______. 1986. Normes et standards des constructions scolaires. Paris: Division des Politiqueset de la Planification de l’Education, UNESCO.
______. 1990. “Projet de construction de prototypes d’écoles primaires en milieu rural enGuinée.” Final report, UNESCO Regional Bureau, Dakar, Senegal et la Direction de la
238 • References
Coopération Technique et des Projets, Ministère de l’Education Nationale, Conakry,Guinea.
______. 2005. EPT: Repères pour l’action—Éducation pour tous en Afrique. Senegal, Dakar:Bureau Régional à Dakar, UNESCO.
United Nations. 2002. Report of the International Conference on Financing for Development:Monterrey, Mexico, March 18–22. New York: United Nations.
______. 2005. “2005 World Summit Outcome.” Resolution 60/1, adopted by the GeneralAssembly, 60th Session, United Nations, New York, October 24.
Vajpeyi, Kabir. 2005. “Building as Learning Aid: Developing School Space as a LearningResource.” Education Group, Human Resource Network, South Asia Human Develop-ment Sector, World Bank, Washington, DC.
Van Domelen, Julie, and Randa El-Rashidi. 2001. “A Review of Social Funds in Africa:Implementation Experience and Issues for the Future.” Human Development Network,World Bank, Washington, DC.
Van Donge, Jankees. 2000. “Nurtured from Above and Growing from the Roots: SocialFunds and Decentralization in Zambia and Malawi.” Institute of Social Studies, TheHague, Netherlands.
Van Imschoot, Marc. 2004a. “Rapport du premier audit technique de la sous-composanted’intervention sur les dégâts cycloniques.” Fonds d’Intervention pour le Développe-ment, Antananarivo, Madagascar, October 1–19.
______. 2004b. “Rapport du 2ème audit technique de la sous-composante d’interventionsur les dégâts cycloniques.” Fonds d’Intervention pour le Développement, Antana-narivo, Madagascar, October 1–19.
Varghese, N. V. 1995. “School Facilities and Learner Achievement: Towards a Methodologyof Analysing School Facilities in India.” Perspectives in Education 11 (2): 97–108.
VSCP [Village Community Support Project]. 2007. Data received via personal communi-cation, March 2007.
Wade, Magatte. 2004. “Overview of Senegal’s AGETIP Model for Jobs Creation,” Paper presented at the Meeting on Youth and Employment in West Africa, Goree Institute,Goree Island, Senegal, February 12–13.
Walker, Ian, Rafael del Cid, Fidel Ordoñez, and Florencia Rodríguez. 1999. “Ex-Post Evaluation of the Honduran Social Investment Fund (FHIS2).” ESA Consultores, Tegucigalpa, Honduras.
Wilson, Michael. 2006a. “Family and Community Contributions to School Constructionand Maintenance: A Review of the Fast Track Initiative Countries.” World Bank, Washington, DC.
______. 2006b. “The Fast Track Initiative and School Facilities: Achieving the Second Millennium Development Goals.” PowerPoint briefing presented at the 12th Architec-ture and Behaviour Colloquium, Lausanne, Switzerland, March 29–April 1.
______. 2006c. “Moving Towards Free Basic Education: Policy Issues and ImplementationChallenges.” United Children’s Fund and World Bank, Washington, DC, January 2006.
Wolfskill, Lyle A., Waine A. Dunlop, and Bob M. Galloway. 2005. Handbook for BuildingHomes of Earth. Honolulu, HI: University Press of the Pacific.
World Bank. 1979. “Pakistan: Primary Education Project, Credit 892-PAK—Staff AppraisalReport.” Report 2307-PAK, World Bank, Washington, DC.
______. 1980. “Bangladesh: Fourth Education Project (1980–90)—Staff Appraisal Report.”Report 2964-BD, World Bank, Washington, DC, May 27.
______. 1981. “Niger: Education Project—Staff Appraisal Report.” Report 3047-NIR, WorldBank, Washington, DC, May 4.
______. 1985a. “Bangladesh: Second Primary Education Projects.” Report 5363-BD, WorldBank, Washington, DC.

References • 239
______. 1985b. “Pakistan: Second Primary Education Project (Cr. 1602-PAK)—StaffAppraisal Report,” Report 5363-PAK, World Bank, Washington, DC, May 1.
______. 1986. “Niger: Primary Education Development Project, Credit 1740-NIR—StaffAppraisal Report.” Report 6115-NIR, World Bank, Washington, DC, October 28.
______. 1987a. “Madagascar: Second Education Project (Credit 663-MAG)— Project Completion Report.” Report 6774-MAG, World Bank, Washington, DC, May 22.
______. 1987b. “Pakistan: Fourth Education Project/Primary Education Project (Cr. 892-PAK)—Project Completion Report.” Report 6827-PAK, World Bank, Washington, DC,June 19.
______. 1987c. “Pakistan: Third Primary Education Project, Credit 1821-PAK—StaffAppraisal Report.” Report 6492-PAK, World Bank, Washington, DC.
______. 1988. “Mauritania: Education Sector Restructuring Project—Staff AppraisalReport.” Report 7213-MAU, World Bank, Washington, DC, June 28.
______. 1989a. “Brazil: Northeast Basic Education (Loan 1867-BR) Project CompletionReport.” Report 8266-BR, World Bank, Washington, DC, December 29.
______. 1989b. “Involving Nongovernmental Organization in Bank-Supported Activities.”Operational Directive 14.70, World Bank, Washington, DC.
______. 1989c. “Mali: Education Sector Consolidation Project—Report and Recommen-dation of the President of the International Development Association.” World Bank,Washington, DC, Report P-25010-MLI, May 17.
______. 1990a. “Bangladesh: Fourth (Primary) Education Project (Credit 1054-BD)—Project Implementation Report.” Report 8355-BD, World Bank, Washington, DC,February 6.
______. 1990b. “The Gambia: Education Sector Project—Staff Appraisal Report.” Report8359-GM, World Bank, Washington, DC, April 30.
______. 1990c. “Pakistan: Sindh Primary Education Development Program—StaffAppraisal Report.” Report 8178-PAK, World Bank, Washington, DC, February 6.
______. 1990d. “Philippines: Second Education Project—Staff Appraisal Report.” Report8395-PH, World Bank, Washington, DC, May 30.
______. 1991a. “Burkina Faso: Fourth Education Project, Cr. 244-BUR—Staff AppraisalReport.” Report 9119-BUR, World Bank, Washington, DC, April 24.
______. 1991b. “Senegal: Second Human Resource Development Project—Implementa-tion Completion Report.” Report 21474-SE, World Bank, Washington, DC.
______. 1992a. Étude sectorielle régionale: Pratiques de construction des infrastructures socialesdans les pays du Sahel. Vol. 1, Report 10294-AFR. Washington, DC: World Bank. April 6.
______. 1992b. “Niger. First Education Project (Credit 1151-NIR): Project CompletionReport.” Report 10786, World Bank, Washington, DC, June 26.
______. 1993a. “Chad: Basic Education Project (Education V), Credit 2501-CD—Staff AppraisalReport.” Report 11680-CD, World Bank, Washington, DC, April 16.
______. 1993b. Guide des pratiques de construction des infrastructures sociales dans les pays duSahel: Draft du nouveau guide suite au séminaire de Dakar, Région Afrique, Département duSahel. Divisions Population et Resources Humaines et Infrastructures and SynergyInternational, Brussels, Belgium.
______. 1993c. “Pakistan: Baluchistan Primary Education Program—Staff AppraisalReport.” Report 11403-PAK, World Bank, Washington, DC.
______. 1993d. “Rapport d’évaluation des procédures de passation de marchés au Sénégal.”World Bank, Dakar, Senegal.
______. 1993e. “Senegal: Second Human Resource Development Project (Education V)—Staff Appraisal Report.” Report 11254-SE, World Bank, Washington, DC, February 11.
______. 1993f. “Vietnam: Primary Education Project (1993–2001), Cr. 2548-VN—StaffAppraisal Report.” Report 12203, World Bank, Washington, DC.
240 • References
______. 1993g. “India. Uttar-Pradesh Basic Education Project. Staff Appraisal Report.”Report No. 11746-IN, World Bank, Washington, DC.
______. 1994a. “Niger: Basic Education Sector Project (Hybrid)—Report and Recommendation of the President.” Report P-6328-NIR, World Bank, Washington, DC,May 5.
______. 1994b. “Mexico. Basic Education Development Project. Project Appraisal Docu-ment.” Report No. 17535, World Bank, Washington, DC.
______. 1995a. “Burkina Faso: Primary Education Development Project— Education III(Cr. 1598-BUR).” Report 14464-BUR, World Bank, Washington, DC, May 4.
______. 1995b. “Guinea: Education Sector Adjustment Credit (Credit 2155-GUI)— Implementation Completion Report.” Report 14617-GUI, World Bank, Washington,DC, June 16.
______. 1995c. “Guinea. Equity and School Improvement Project: Staff Appraisal Report.”Report 13472-GUI, World Bank, Washington, DC, April 7.
______. 1995d. “Malawi: Primary Education Project—Staff Appraisal Report.” Report15127-MAI, World Bank, Washington, DC, December 21.
______. 1995e. “Mauritania: General Education Project (Cr-MAU), PAD.” Report 13569,World Bank, Washington, DC.
______. 1995f. “Pakistan: Second Primary Education Project (Cr. 1602-PAK), Project Completion Report.” Report 14218-PAK, World Bank, Washington, DC, April 3.
______. 1995g. “Senegal: Primary Education Development Project (Credit 1735-SE)— Project Implementation Report.” Report 14443-SE, World Bank, Washington, DC, May 4.
______. 1995h. Working with NGOs: A Practical Guide to Operational Collaboration betweenthe World Bank and Non-governmental Organizations. Washington, DC: Operation PolicyDepartment, World Bank.
______. 1996a. “Eritrea: Community Development Fund Project—Staff Appraisal Report.”Report 14937-ER, World Bank, Washington, DC, January 30.
______. 1996b. “Mali: Education Sector Consolidation Project (Cr. 2054-MLI)— Implementation Completion Report.” Report 15720-MLI, World Bank, Washington,DC, June 10.
______. 1996c. “Mauritania: Education Restructuring Project (Cr 1943-MAU)— Implementation Completion Report.” Report 15739-MAU, World Bank, Washington,DC.
______. 1996d. “Niger: Primary Education Development Project (1986–95), Cr. 1740-NIR—Implementation Completion Report.” Report 15748-NIR, World Bank, Washington, DC, June 14.
______. 1996e. “Philippines: Second Elementary Education Project (Cr. 3244-PH)—Implementation Completion Report.” Report 16177-PH, World Bank, Washington,DC, December 30.
______. 1996f. “Philippines: Third Elementary Education Project—Staff Appraisal Report.”Report 15888-PH, World Bank, Washington, DC, October 25.
______. 1997. “Bangladesh: General Education Project (Credit 2118-BD)—Implementa-tion Completion Report.” Report 16729-BD, World Bank, Washington, DC, June 19.
______. 1998a. “The Gambia: Third Education Sector Program—Project Appraisal Docu-ment.” Report 17903-GM, World Bank, Washington, DC, August 7.
______. 1998b. “Madagascar: Education Sector Development Project—Project AppraisalDocument.” Report 16666-MAG, World Bank, Washington, DC, February 13.
______. 1998c. “The Use of Social Investment Funds as an Instrument for CombatingPoverty.” Strategy Paper POV-104, World Bank, Washington, DC.
______. 1999a. “Burkina Faso: Education IV Project (Credit 2244-BUR)— ImplementationCompletion Report.” Report 19485-BUR, World Bank, Washington, DC, June 28.

References • 241
______. 1999b. “Cape Verde: Education and Training Consolidation and ModernizationProject (PROMEF)—Project Appraisal Document.” Report 18581-CV, World Bank,Washington, DC, April 30.
______. 1999c. “The Gambia: Education Sector Project (Credit 2142-GM)—ImplementationCompletion Report.” Report 19269-GM, World Bank, Washington, DC, June 29.
______. 1999d. “Guinea: Village Communities Support Program (Phase 1)— ProjectAppraisal Document.” Report 17934-GUI, World Bank, Washington, DC, January 27.
______. 1999e. “Mozambique: Education Sector Strategic Program (ESSP)— ProjectAppraisal Document.” Report 18681-MOZ, World Bank, Washington, DC, January 22.
______. 1999f. “Mozambique: Second Education Project (Credit 2200-MOZ)— Implementation Completion Report.” Report 19524-MOZ, World Bank, Washington,DC, June 18.
______. 1999g. “Senegal: National Rural Infrastructure Program—Project Appraisal Document.” Report No. 19663-SE, World Bank, Washington, DC, December 20.
______. 1999h. “Mexico. Second Primary Education Project. Project Appraisal Document.” Report No. 12529. World Bank, Washington, DC.
______. 2000a. “Angola: Second Social Action Fund Project (FAS-II)—Project AppraisalDocument.” Report 20474-ANG, World Bank, Washington, DC, May 26.
______. 2000b. “Mali: Education Sector Expenditure Program.” World Bank, Washington,DC.
______. 2000c. “Second Conference of Social Funds.” World Bank, Washington, DC,June 5–7.
______. 2000d. “Senegal: Quality Education for All Program in Support of the First Phaseof the Ten-Year Education and Training Program (PDEF)—Project Appraisal Document.”Report 19610-SE, World Bank, Washington, DC, March.
______. 2000e. “Brazil. Second Northeast Education Project. Project Completion Report.”Report No. 8266-BR, World Bank, Washington, DC.
______. 2001a. Education and Health in Sub-Saharan Africa: A Review of Sector-WideApproaches. Washington, DC: World Bank.
______. 2001b. “India: Uttar Pradesh Basic Education Project, Cr. 25090-IN— Implementation Completion Report.” Report No. 21754-IN, World Bank, Washington,DC.
______. 2001c. “Guinea: Education for All Project in Support of the First Phase of the Education for All Program—Project Appraisal Document.” Report 20405-GUI, WorldBank, Washington, DC.
______. 2001d. “Le système éducatif Mauretanien: Eléments d’analyse pour instruire despolitiques nouvelles.” Africa Region Human Development Working Paper 15, WorldBank, Washington, DC, November.
______. 2001e. “Malawi: Primary Education Project—Implementation CompletionReport.” Report No. 22167-MAI, World Bank, Washington, DC, June 28.
______. 2001f. “Mauritania: Education Sector Development National Program in Supportof the First Phase of the Ten-Year Education Program—Project Appraisal Document.”Report 22529-MAU, World Bank, Washington, DC, September 26.
______. 2001g. “Nigeria: Community-Based Poverty Reduction Project—Project AppraisalDocument.” Report 21396-UNI, World Bank, Washington, DC, September.
______. 2001h. “Senegal: Second Human Resources Development Project (Education V,PDRH2)—Implementation Completion Report.” Report No. 21472, World Bank,Washington, DC, March.
______. 2002a. “Eritrea: Community Development Fund Project (Cr. 28230)— Implementation Completion Report.” Report 22694, World Bank, Washington, DC,May 6.
242 • References
______. 2002b. “Eritrea: Community Development Fund Project (Cr. 28230)—Project Performance Assessment Report.” Report 24418, World Bank, Washington, DC,June 24.
______. 2002c. “Fiduciary Management for Community-Driven Development Projects: AReference Guide.” World Bank, Washington, DC.
______. 2002d. “Mauritania: Urban Infrastructure and Pilot Decentralization Project—Implementation Completion Report.” Report 24302-MAU, World Bank, Washington,DC, June 24.
______. 2002e. “Niger: Basic Education Sector Project (Hybrid)—Implementation Comple-tion Report (DA-26180). Report 24311-NIR, World Bank, Washington, DC, June.
______. 2002f. “Senegal: Primary Education Development Project (Credit 1735-SE), Second Resources Development Project (Credit 2473-SE)—A Review of Investments inEducation and Performance Assessment Reports.” Report 23715-SE, World Bank, Washington, DC, February 21.
______. 2002g. “World Bank–Civil Society Collaboration: Progress Report for Fiscal Years2000 and 2001.” World Bank, Washington, DC.
______. 2003a. “Anticorruption Guide: Developing an Anti-Corruption Program forReducing Fiduciary Risks in New Projects—Lessons from Indonesia.” Jakarta, Indonesia,World Bank, March 15.
______. 2003b. “Chad: Education Sector Reform Project—Project Appraisal Document.”Report 23797-CD, World Bank, Washington, DC, February 14.
______. 2003c. Education in Rwanda: Rebalancing Resources to Accelerate Post- conflict Development and Poverty Reduction. Washington, DC: World Bank.
______. 2003d. “Guinea: 20 Years of IDA Assistance: Second Education Project— Education Sector Adjustment Credit, Higher Education Management Support Project,Pre-service, Pre-service Teacher Education Project.” Report 26245-GUI, World Bank,Washington, DC, June 26.
______. 2003e. “Guinea: Equity and School Improvement Project—Implementation Completion Report.” Report 25808-GUI, World Bank, Washington,DC, June 18.
______. 2003f. “Mozambique: Decentralized Planning and Financing Project—ProjectAppraisal Document.” Report 26365-MOZ, World Bank, Washington, DC, October 15.
______. 2003g. “Niger: Basic Education Project—Project Appraisal Document.” Report25688-NIR, World Bank, Washington, DC, June 20.
______. 2003h. “Recommendations visant à renforcer le Programme Anti- Corruption:Mali.” Africa Region, World Bank, Washington, DC, March.
______. 2004a. “Angola: Second Social Action Fund Project (FAS-II)— ImplementationCompletion Report.” Report 29162, World Bank, Washington, DC, August 17.
______. 2004b. Benin: National Community-Driven Development Support Project(PNDCC)—Project Appraisal Report.” Report 29165-BJ, World Bank, Washington, DC,September 9.
______. 2004c. “Benin: Social Fund Project—Implementation Completion Report.” Report29078, World Bank, Washington, DC, June 7.
______. 2004d. Books, Buildings, and Learning Outcomes: An Impact Evaluation of World BankSupport to Basic Education in Ghana. Washington, DC: Operations Evaluations Department, World Bank.
______. 2004e. “Cost, Financing, and School Effectiveness in Malawi: Country StatusReport.” Africa Region Human Development Working Paper 78, World Bank, Washington, DC.
______. 2004f. Education in Ethiopia: Strengthening the Foundation for Sustainable Progress.Washington, DC: World Bank.

References • 243
______. 2004g. “Fighting Corruption at the Local Level: The Case of Kecamatan Development Project.” PowerPoint presentation prepared for the Local DevelopmentConference, World Bank, Washington, DC, June 17.
______. 2004h. “La dynamique des scolarisations au Niger: Evaluation pour undéveloppement durable.” Africa Region Human Development Working Paper, WorldBank, Washington, DC, July.
______. 2004i. “Local Development Discussion Paper.” Paper prepared for the Interna-tional Conference on Local Development, Human Development, Social Development,and Public Sector Management Networks, World Bank, Washington, DC, June 16–18.
______. 2004j. “Madagascar: First Poverty Reduction Support Project.” Report 29376-MAG, World Bank, Washington, DC, June 23.
______. 2004k. “Mainstreaming Anti-Corruption Activities in World Bank Assistance, AReview of Progress Since 1997.” Report No. 29620, Operations Evaluation Department,World Bank, Washington, DC, July 14.
______. 2004l. Procurement Guidelines under IBRD Loans and IDA Credits. May 2004,Revised October 1, 2006. Washington, DC: World Bank.
______. 2004m. Strategic Framework for Assistance to Africa: IDA and the Emerging PartnershipModel. Washington, DC: World Bank.
______. 2004n. “Uganda: Local Government Development Program— ImplementationCompletion Report.” Report 30284, World Bank, Washington, DC, November 23.
______. 2004o. World Bank Development Report 2004: Making Services Work for Poor People.Washington, DC: World Bank.
______. 2005a. “Building on Free Primary Education: Primary and Secondary Education inLesotho—A Country Status Report.” Africa Region Human Development WorkingPaper 101, World Bank, Washington, DC.
______. 2005b. “Burkina Faso: Administration Capacity Building Project— ProjectAppraisal Document.” Report 29909-BF, Africa Region, World Bank, Washington, DC,February 17.
______. 2005c. “Burkina Faso: Fifth Poverty Reduction Support Operation— Program Document.” Report 31342-BF, World Bank, Washington, DC, April 7.
______. 2005d. “Cape Verde: Social Sector Development Project—Implementation Completion Report.” World Bank, Washington, DC, August 22.
______. 2005e. Education in the Democratic Republic of Congo: Priorities and Options for Regeneration. Washington, DC: World Bank.
______. 2005f. Education in Ethiopia. Strengthening the Foundation for Sustainable Progress.Washington, DC: World Bank.
______. 2005g. The Effectiveness of World Bank Support for Community-Based and Demand-Driven Development. Advance conference ed. Washington, DC: Operations EvaluationDepartment, World Bank.
______. 2005h. “Eléments de diagnostic du système éducatif tchadien pour une politiquenouvelle.” World Bank, Washington, DC, July.
______. 2005i. “Ethiopia: Ethiopian Social Rehabilitation and Development Fund—Implementation Completion Report.” Report 32321, World Bank, Washington, DC,June 24.
______. 2005j. Fiscal Year 2005 Retrospective: Summary of Key Achievements. Washington,DC: World Bank.
______. 2005k. “The Gambia: Third Education Sector Project—Implementation Comple-tion Report (TF-22573, IDA-31280 TF-54182).” Report 33169-GM, World Bank, Washington, DC, December 19.
______. 2005l. “Le système éducatif guinéen: Diagnostic et perspectives pour la politiqueéducative dans le contexte des contraintes macro-économiques fortes et de la réduction

244 • References
de la pauvreté.” Africa Region Human Development Working Paper 90, World Bank,Washington, DC, November.
______. 2005m. “Madagascar: Education Sector Development Project— ImplementationCompletion Report.” Report 33345-MAG, World Bank, Washington, DC, October 24.
______. 2005n. “Mozambique: Second Poverty Reduction Support Operation— ProgramDocument.” Report 32890-MZ, World Bank, Washington, DC, August 4.
______. 2005o. “Note technique sur les performances de l’AGECABO.” Mission de super-vision, Projet de Développement du Secteur Social, World Bank, Washington, DC,March 23–30.
______. 2005p. “Organizational Effectiveness Task Force: Final Report.” SecM2005-0064,World Bank, Washington, DC, February 25.
______. 2005q. “Pakistan Country Gender Assessment: Bridging the Gender Gap— Opportunities and Challenges.” Report 32244-PAK, World Bank, Washington, DC.
______. 2005r. “Primary and Secondary Education in Lesotho: A Country Status Report.”Africa Region Human Development Working Paper 101, World Bank, Washington, DC.
______. 2005s. “Rapport d’état du système éducatif ivoirien: Eléments d’analyse pourinstruire une politique educative nouvelle dans le contexte de l’EPT et du PRSP.” AfricaRegion Human Development Working Paper 80, World Bank, Washington, DC, September.
______. 2005t. “Senegal: Urban Development and Decentralization Program—Implementation Completion Report.” Report 32408-SE, World Bank, Washington, DC,June 28.
______. 2005u. “India. Rajasthan District Primary Education Project, Staff AppraisalReport.” Report No. 21955-IN, World Bank, Washington, DC.
______. 2006a. “Burkina Faso: Fifth Poverty Reduction Support Financing.” Report 31342-BF, Africa Region, World Bank, Washington, DC.
______. 2006b. “Développements récents et sources de financement du budget de l’état:Revue des dépenses publiques.” Report 36497-SN, World Bank, Washington, DC.
______. 2006c. Eléments de diagnostic du système éducatif burundais. Washington, DC: WorldBank. June 2006.
______. 2006d. Eléments de diagnostic du système éducatif malien: Le besoin d’une politiqueéducative nouvelle pour l’atteinte des objectifs du millénaire et la réduction de la pauvreté.Washington, DC: World Bank. January 2006.
______. 2006e. “The Gambia: Third Education Project, Phase 2—Project Appraisal Docu-ment.” Report 35-797-GM, World Bank, Washington, DC, May 8.
______. 2006f. “Mali: Second Education Sector Investment Program—Project AppraisalDocument.” Report 36189-MLI, World Bank, Washington, DC, June 23.
______. 2006g. “Managing Risks in Rural Senegal: A Multi-Sectoral Review of Efforts toReduce Vulnerability.” Report 33435-SN, Human Development 2, Africa Region, WorldBank, Washington, DC.
______. 2006h. “Rapport sur l’état du système éducatif national.” Version de travail, Ministère des Enseignements Fondamental et Secondaire, Ministère des AffairesEconomiques et du Développement. World Bank, Washington, DC, January 2006.
______. 2006i. “Senegal: Participatory Local Development Program (PDLP) in Support ofNational Local Development Program—Project Appraisal Document.” Report 35459-SN. World Bank, Washington, DC, April 3.
______. 2006j. World Bank Development Report 2007: Development and the Next Generation.Washington, DC: World Bank.
______. 2007a. “Benin: Aide mémoire de la 6ème mission de supervision.” National Community-Driven Development Program, World Bank, Washington, DC, Septem-ber 16–18.

References • 245
______. 2007b. “Burundi: Second Social Action Project—Implementation Completionand Results Report (BELG-24242, IDA-32870, IDA-H0330).” Report ICR000045, WorldBank, Washington, DC.
______. 2007c. Community Driven Approaches in Lao PDR: A Review of the Poverty ReductionFund and Selected Community-Driven Livelihood Projects. Washington, DC: World Bank.
______. 2007d. “Elements de diagnostic du système éducatif centrafricain (RESEN): Contraintes et marges de manoeuvre dans la perspective de la réduction de la pauvreté.” Version provisoire, World Bank, Washington, DC, February.
______. 2007e. “Senegal: Social Development Fund Project—Implementation Completionand Results.” Report ICR000106, World Bank, Washington, DC, January 31.
______. 2008a. “Rapport d’étape du système éducatif national (RESEN).” World Bank,Washington, DC: World Bank.
______. 2008b. “Diagnostic de la pauvreté.” Département de la Réduction de la Pauvretéet de la Gestion de l’Economie, avec la collaboration de l’Agence Nationale de la Statistique et de la Démographique, World Bank, Washington, DC, June 9.
______. 2008c. “Le système éducatif centrafricain.” Contraintes et marges de manœuvrepour la reconstitution du système éducatif dans la perspective de réduction de la pauvreté. Document de travail de la Banque Mondiale No. 144. Série de DéveloppementHumain en Afrique. World Bank, Washington, DC.
Wyss, Urs. 2005a. “La construction en “matériaux locaux”: État d’un secteur à potentielmultiple.” Swiss Agency for Development and Cooperation, Ougadougou, BurkinaFaso.
______. 2005b. “Projet dissémination des techniques de construction et de toitureséconomiques et non consommatrices de bois au Burkina Faso.” Ministère des AffairesÉtrangères, Ouagadougou, Burkina Faso.
Yars, Samuel. 1999. “MIHU-CNUEH-HABITAT-PNUD Projet LOCOMAT BKT 07/013/99:Rapport de mission d’évaluation.” Ministry of Infrastructure, Housing and Urbanism,Ouagadougo, Burkina Faso.
Zerbo, Souleymane. 2008. E-mail message to author dated May 11.


247
Index
absenteeism of teachers, 5, 152ABUTIP. See Agence Burundaise des
Travaux d’Intérêt Public (ABUTIP)accessibility, for children with physical
disabilities, 15–16, 26–27accountability
and community-driven development,112–16, 123n1
in reaching MDGs, 136in school construction, 130, 131b8.1,
132b8.2achievement
impact of lack of water and sanitationfacilities on, 5
impact of multiple shifts on, 9–10impact of substandard structures on, 3–4link to classroom size, 20link to school roofs, 4
ACTION-ECOLE, 75AfDB. See African Development Bank
(AfDB)AFDS. See Agence de Fonds de Développe-
ment Social (AFDS)African Development Bank (AfDB), 58,
68, 107n2AFRICATIPE, 67, 107n9AGECABO. See Cabo Verdean Agency for
Public Works AGeFIB. See Agence de Financement des
Initiatives de Base (AGeFIB)Agence Burundaise des Travaux d’Intérêt
Public (ABUTIP), 84, 85t5.6Agence de Financement des Initiatives de
Base (AGeFIB), 81, 86t5.7, 87Agence de Fonds de Developpement, 68Agence de Fonds de Développement Social
(AFDS), 81, 84, 86t57
Agence d’Exécution des Travaux d’IntérêtPublic, Madagascar (AGETIPA),164–65
Agences d’Exécution des Travaux d’IntérêtPublic (AGETIPs), 31–32b3.1, 61
contract management delegated to,67–73, 107–8nn9–16, 109n32
See also contract managementagencies (CMAs)
Agences Mauitanienne d’Execution desTravaux d’Intérêt Public pour I’Emploi(AMEXTIPE), 18, 68, 93b5.2, 109n32,164–65
agenciesand capacity of government, 72,
108n16overview of delegation of contract
management to, 66–67See also contract management agencies
(CMAs); non-governmental organizations (NGOs); social funds
AGETIPA. See Agence d’Exécution desTravaux d’Intérêt Public, Madagascar(AGETIPA)
AGETIPs. See Agences d’Exécution desTravaux d’Intérêt Public (AGETIPs)
air flow in classrooms, 20, 21, 27n3,39–40, 50n13
allocation of resourcesinefficiency of, 10–11and school location planning, 15–16
AMEXTIPE. See Agences Mauitanienned’Execution des Travaux d’Intérêt Public pour I’Emploi (AMEXTIPE)
“Another Development”, 36, 49n5antiques dealers, and prefabricated
buildings, 45, 50n18
248 • Index
appropriate technology classrooms,35–40, 49–50nn4–13
conclusions concerning, 48–49, 50n19examples of, 159–60
architects and architecturearchitectural design of schools, 156–58architectural norms, 113, 114b6.1and prefabrication, 40, 50n15
Architecture for the Poor, 37–38, 49n6attendance, link to distance to school,
6–8, 13nn9–10audits, 133, 146–47auxiliary purpose-built facilities, 21–24
Bala initiative, 22b2.1Basic Education Sub-Sector Investment
Program (BESIP), Ghana, 35b3.2Basic Education Sub-Sector Plan (BESSIP),
Zambia, 108n27Benin, 168, 172BESIP. See Basic Education Sub-Sector
Investment Program (BESIP), GhanaBESSIP. See Basic Education Sub-Sector
Plan (BESSIP), Zambiabidding process, 81
bid packages and CMAs, 72corruption in, 130and prefabricated classrooms,
46–47b3.3See also international competitive
bidding (ICB); local competitive bidding (LCB); national competitivebidding (NCB)
budgetsand education sector, 136and maintenance of schools, 125, 126,
127b7.1, 128n1Pakistan, 126, 127b7.1for school construction, 65
Building as a Learning Air, 22b2.1buildings. See classrooms and buildingsbulk procurement, 56, 58–63Burundi, 168–69
Cabo Verdean Agency for Public Works,69–70, 71t5.4, 72, 164
Cameroon, 169capacity building, 119–23, 123nn5–7,
144, 146Cape Verde, 164catchment areas, 15–19, 27n1
CBD. See community-based development (CBD)
CBOs. See community-based organizations (CBOs)
CDCs. See Community DevelopmentCommittees (CDCs)
CDD. See community-driven development (CDD)
central governments, 83, 108n24centralized management, 81–83, 85t5.6,
108n23inefficiencies of, 24–25and procurement through ICB, 55–63,
107nn1–5and procurement through NCB, 63–66,
107n8Chad, 164, 169Christian Children’s Fund, 75classic classroom model, 29–32,
33t3.1, 49n1architectural design examples, 30,
156–58conclusions concerning, 48–49, 50n19costs compared to prefabricated
classrooms, 42, 45t3.3See also classrooms and buildings
classroom construction. See school construction
classrooms and buildingsarchitectural design of, 156–58class size, 8–10conclusions concerning appropriate
technology in, 48–49, 50n19distance norms, 16–19, 27n1growth trend in, 1–2, 12–13n1and industrialized prefabrication,
40–42, 46–47b3.3, 50nn15–18inefficient use of, 10–11life span of, 12, 13n12link to population, 17–19, 27n1local materials and appropriate
technology classrooms, 35–40,48–49, 49–50nn4–13
maintenance of, 122–23, 125–28,128n1, 141–42
multiple shifts in, 8–10need for, 12–13n1, 102, 139–41, 180–82number and condition of, 2–3one-classroom schools, 17–19, 27n2prefabrication of, 40–45, 46–47b3.3,
50nn15–18, 50n18, 162–63

Index • 249
sanitation for, 4–5, 13n4, 51–53, 152school shelter model, 32, 34–35,
49nn2–3size of classroom, 16–19, 20–21, 27n1,
27nn3–4speed of construction, 12, 13n11two-classroom schools, 17–19water supply for, 4–5, 13n4, 17,
53–54, 152See also classic classroom model; costs;
procurement; school constructionCMAs. See contract management
agencies (CMAs)Cointereaux, François, 36, 49nn6–11communication, development of strategy
for, 146communities, 75
community cost recovery, 61community-managed school
construction, 3, 84, 86t5.7, 87,100–103, 108n34
corruption in school construction,129–33, 133–34nn1–2
delegation by MoEs of contract management to, 92–94, 95t5.9,108nn26–28
and demand-driving financing, 81–83,108n23
empowerment of, 116–23, 123n2,123nn5–7
handbooks for, 120b6.5, 121and maintenance of school
buildings, 126performance of construction
management methods, 99–100role in CDD school construction
projects, 115–16, 175–76Senegal Social Fund Community
Handbook, 179community-based development
(CBD), 111community-based organizations (CBOs),
73, 116–17Community Development Committees
(CDCs), 115b6.2, 117community-driven development (CDD),
111–16, 123n1, 175–76Community Handbook, 120b6.5, 121Community Tender Board, 117competition, and procurement, 56–58compressed earth bricks, 36, 49n6
construction industry, 11and centralized management with
procurement through ICB, 55–63,107nn1–5
and CMAs, 67–73, 107nn9–16conclusions concerning appropriate
technology in, 48–49, 50n19construction norms, 113, 114b6.1and demand-driven financing with
community participation, 82–83direct contracting, 130improvements in, 68informal sector in, 30–32, 49n1modern construction model, 45,
47–48and prefabrication, 40–45, 46–47b3.3,
50nn15–18and use of local materials, 35–40,
49–50nn6–13worldwide historical perspective,
162–63See also contract management; school
constructionconstruction technology, 16
classic classroom, 29–32, 33t3.1, 49n1industrialized prefabrication, 40–42,
46–47b3.3, 50nn15–18local materials and appropriate
technology classrooms, 35–40,49–50nn4–13
and modern construction model, 45,47–48
school shelter model, 32, 34–35, 49nn2–3contract management, delegation of
to CMAs, 67–73, 107nn9–16community contracting of, 100–106,
108n34conclusions concerning community
delegation, 106–7and decentralization, 88–106,
108–9nn30–33, 168–71to local governments, 94, 96–100,
108–9nn30–33to local MoE branch offices, 88–92by MoEs directly to communities,
92–94, 95t5.9, 108nn26–28to NGOs, 73–79, 108nn18–20overview of delegation to agencies,
66–67to social fund agencies, 80–88,
108nn21–24

250 • Index
contract management agencies (CMAs),56–57, 68–73, 108nn12–16
compared to social fund agencies,80–82
delegation of construction managementfrom local governments to, 96–99,108n32
and financing of school construction,139–42, 149nn1–2
limitations of, 70, 72–73Madagascar, 47b3.3management of public funds, 117and NGOs, 74–79unit costs of CMA’s in school
construction, 164–65See also specific agencies
contractors, 68, 74–75, 107n10corrugated-iron roofed rooms, 49n10corruption in school construction,
129–33, 133–34nn1–2costs, 72
of classic classroom technology, 32,33t3.1
of classroom construction by local governments, 96–99
of classrooms procured by local MoEbranch offices, 89–92
to close school facility gap in Africa,140–42, 149nn1–2
of community-managed school construction, 100–103, 109n34
and delegation of contract managementto communities, 93–94
of earth-built facilities, 37of furniture, 6, 13nn6–7in Ghana, 35b3.2in Guinea, 78–79b5.1and ICB procurement, 55–63, 64–66,
70–72, 89–92, 107nn1–7,108nn14–15
latrines, 52–53of local material technology compared
to informal sector, 37–39of maintenance, 125–28, 128n1, 141–42in Mauritania, 93b5.2and NCB procurement, 64–66, 70–72,
108nn14–15of NGO-managed classroom construction,
73–78, 78–79b5.1prefabricated classrooms, 42–48
rural vs. urban communities, 61, 107n5of school shelter model, 34, 35b3.2social funds and centrally managed
implementation, 83–84, 86t5.7and stock-taking exercise, 142–44,
145t10.4, 149n1of teacher housing, 24using CMAs, 70–72, 108nn14–15, 164–65water wells, 53–54
craftsmen, 30, 49n1CRATerre, 37, 49nn7–10
data, and school infrastructure, 153–54decentralization of contract management,
88–106, 108–9nn30–33, 168–71delivery delays, 66, 90, 107n8demand-driven financing, 81–83, 85t5.6,
87, 108n23development assistance, 73distance norms, 16–19, 27n1distance to school, 6–8, 13nn9–10,
16–19, 151donor assistance, 6, 13n1
and coordination of school construction, 105–6
and ICB, 56influence on school construction, 135–38for local materials technology, 36, 39and maintenance of school
buildings, 126and procurement guidelines for
community contracting, 118role of donors in school construction,
147–48and school construction
strategies, 48–49shift from ICB to NCB procurement, 65and water and sanitation technologies, 54
double difference analysis, 116dropout rates, link to distance to school, 7dry-pit latrines, 51–53durability, of earth-built construction,
37, 49n9
earth bricks, 36, 49n6, 159Economic Development Institute (EDI),
123n5economies of scale
and distance norms, 16–17and prefabricated buildings, 41–42, 50n17

Index • 251
EDI. See Economic Development Institute (EDI)
Education for All (EFA), 1, 20, 25,31–32b3.1, 94
Education for All-Fast Track Initiative(EFA-FTI), 1, 122, 136–38
Education Sector Consolidation Project(ESCP), 70, 71t5.3, 108n20
EEC, and procurement, 58, 107n2EFA. See Education for All (EFA)EFA-FTI. See Education for All-Fast Track
Initiative (EFA-FTI)efficiency
of centralized planning, 24–25high cost of, 94of resource allocations, 10–11and school location planning, 15–16of social funds, 83
emergencies, 20, 27n5empowerment of communities, 116–23,
123n2, 123nn5–7endogeneity bias in research, 154–55enrollment
expenditures as function of, 17in Guinea, 78–79b5.1impact of school infrastructure on, 151–52link to distance to school, 7and NGO support, 75, 108n19and prefabricated classrooms, 47b3.3in school shelters in Ghana, 35b3.2
environmental issues, and earth-built construction, 39–40, 50n13
ESCP. See Education Sector ConsolidationProject (ESCP)
Ethiopia, 169European Union (EU), 84, 94, 108n28European Union Fund, 45, 47–48evaluation. See monitoring and
evaluation (M&E)Executing Agencies for Construction in the
Public Interest, 31–32b3.1, 61, 67–73,107–8nn9–16, 109n32
expenditures, 17, 104–5See also costs
FAS. See Social Funds in Angola (FAS)Faso Baara, 59, 107n3, 164, 168Fast Track Initiative (FTI), 122
See also Education for All-Fast Tract Initiative (EFA-FTI)
FCFA. See Franc Communauté FinancièreAfricaine (FCFA)
FID. See Fonds d’Intervention pour leDéveloppement (FID)
financing, 26, 62, 139–41, 149nn1–2See also donor assistance
financing agreements (FAs), 117, 118b6.3,120–21b6.5
fired bricks, 39, 50n13Fonds d’Intervention pour le Développe-
ment (FID), 47b3.3 Madagascar, 81
Franc Communauté Financière Africaine(FCFA), 107n7
France, corruption in school construction,129, 133–34n1
FTI. See Fast Track Initiative (FTI)furniture, 5–6, 13nn6–7Future in Our Hands, 75
GAMWORKS, 69–70GEAI. See Groupement d’Etudes pour une
Architecture Industrialisée (GEAI)Ghana, 35b3.2, 169girls, distance to school as barrier to
attendance, 7Gleneagles, 141, 149n2GMT. See Grassroots Management Training
(GMT) programsGNI. See gross national income (GNI)Grassroots Management Training (GMT)
programs, 121–22, 123nn5–7, 133,134n2
Gropius, Walter, 40gross national income (GNI), 101, 103Groupement d’Etudes pour une Architec-
ture Industrialisée (GEAI), 50n15Guinea, 78–79b5.1, 169
habitation-to-school distance, 8, 13n10handbooks, 119f6.3, 120–21
development of, 144, 146Senegal Social Fund Community
Handbook, 179Harambee movement, 126, 128n1harmonization
and school construction strategies, 144toolkits to harmonize norms and
standards, 177–78health of students, 3–4, 5
252 • Index
heavily indebt poor country (HIPC), 168home construction industry, 41
ICB. See international competitive bidding (ICB)
IDA. See International Development Association (IDA)
IEC. See information education communication (IEC)
IIEP. See International Institute for Education Planning (IIEP)
ILO. See International Labor Organization (ILO)
implementation schemesCDD process in Benin and Uganda, 172for construction projects sponsored by
NGOs, 166–67and cost of classrooms, 32, 33t3.1,
43t3.3increase in capacity of, 79b5.1by local governments, 173–74PIUs, 135and social funds, 83–84, 86t5.7, 87summary of, 183toolkits to harmonize norms and
standards, 177–78imported materials, 58–59, 62–63industrialization, in construction industry
worldwide, 162–63industrialized prefabrication, 40–42,
46–47b3.3, 50nn15–18informal sector
in construction industry, 30–32, 49n1and use of local materials for
construction, 37–39, 49n10information, and community construction
projects, 116information education communication
(IEC), 146infrastructure
conclusions concerning, 12,13nn11–12
and distance to school, 6–8, 13nn9–10evidence of impact of, 151–55and inefficient resource allocations,
10–11and overcrowding and multiple shifts,
8–10sanitation, 4–5, 13n4school furniture, 5–6, 13nn6–7small scale, 83
temporary structures, 2–4, 13n3water supply, 4–5, 13n4
Intermediate Technology DevelopmentGroup, 35–36, 49n4
international competitive bidding (ICB),33, 34, 47b3.3
and classic classroom technology inSenegal, 33t3.1
combined with microenterprises, 62–63,107nn6–7
with community participation, 58–62,107nn3–5
compared to NCB process, 64–66and costs of prefabricated classrooms,
43t3.3overview, 17nn1–2, 55–58
International Development Association(IDA), 26
and decentralization of contract management to local offices, 88
financed projects, 62, 107n6Ghana projects, 35b3.2and ICB procurement, 58, 107n2projects by AGETIP, 69, 108n13and school construction needs, 12t1.6,
139–40International Institute for Education
Planning (IIEP), 16, 20International Labor Organization (ILO), 67
Japan International Cooperation Agency(JICA), 65–66, 103
KfW. See Kreditanstalt für Wiederaufbau(KfW)
kickbacks, 130Kreditanstalt für Wiederaufbau (KfW), 68,
108nn12–13
labor, 58, 62laboratories, 22large panel system (LPS), 50n15latrines, 4–5, 152
design to accommodate physically disabled children, 27
dry-pit latrines, 51–53and economies of scale, 17examples of latrine technology, 161
LCB. See local competitive bidding (LCB)
learning outcomes, 152–53
Index • 253
legal frameworkfor decentralization in education, 94,
96t5.10, 168–71for establishment of CBOs, 117
LGs. See local governments (LGs)libraries, 22, 27n4LICUS. See low income country under
stress (LICUS)life span of classrooms, 34, 48local competitive bidding (LCB), 33t3.1,
43t3.3, 62Local Government Handbook, 120b6.5, 121local governments (LGs)
and corruption in school construction,131b8.1
and decentralization of school construction, 168–71
delegation of contract management to,94, 96–100, 108–9nn30–33
expenditures as share of GDP and government expenditures, 104–5
handbooks for, 120b6.5, 121implementation schemes of, 173–74and maintenance of school buildings,
125–26role in CDD school construction
projects, 115, 175–76and social funds, 87
local materialsand appropriate technology classrooms,
35–40, 49–50nn4–13and ICB procurement, 58
low-cost housing, 39, 50n12low income country under stress (LICUS),
84–85LPS. See large panel system (LPS)
Madagascar, and prefabricated classrooms,47b3.3
maintenance, 125–28, 128n1costs to close gap in, 141–42responsibility for, 122–23
Malawi, 81, 86t5.7, 169–70Malawi Social Action Fund (MASAF),
81, 86t5.7Mali, 169management, training in procurement,
121–22MASAF. See Malawi Social Action
Fund (MASAF)mathematics performance, 27n4
Mauritania, 93b5.2, 94, 164–65, 170M&E. See monitoring and evaluation (M&E)microenterprises, 62–63, 80, 107nn6–7Micro-project Program (MPP), 108n23Millennium Development Goals (MDGs),
12, 25, 135–36, 139ministries of education (MoEs), 105
decentralization of contract managementto local offices of, 88–92
and delegation of construction programs to AGETIPs, 68–73
delegation of contract managementdirectly to communities, 92–94,95t5.9, 108nn26–28
delegation of school construction toNGOs, 79b5.1
and financing school construction,139–42, 149nn1–2
knowledge of water and sanitation technologies, 54
local staff handbook, 121b6.5management of ICB with
microenterprises, 62, 107n7and NCB procedure costs, 61, 107n4norms established by, 113, 114b6.1and procurement through ICB, 55–63role in CDD school construction
projects, 113–15, 116, 175–76and social funds, 87–88stock-taking exercise, 142–44, 145t10.4,
149n1and use of informal sector for school
construction, 31–32b3.1ministries of public works, 55–63, 107n6modern construction model, 45, 47–48, 57MoEs. See ministries of education (MoEs)monitoring and evaluation (M&E), 116,
146–47Monterrey Consensus, 136Mozambique, 170MPP. See Micro-project Program (MPP)multigrade classes and learning, 17–19, 20multiple shifts in schools, 8–10multisector projects, 80, 108n21
national competitive bidding (NCB), 58, 59
and centralized management with procurement by, 63–66, 107n8
and classroom construction, 70–72,108nn14–15

254 • Index
national competitive bidding (continued)and costs of classrooms in Senegal,
33t3.1and prefabricated classrooms, 43t3.3,
47b3.3National Procurement Code, 118National Rural Infrastructure Project
(NRIP), 108n31NCB. See national competitive
bidding (NCB)networks, 67, 107n9NGOs. See non-governmental
organizations (NGOs)Niger, 62–63, 170Nigeria, 170non-governmental organizations
(NGOs), 70delegation of contract management to,
73–79, 108nn18–20examples of, 166–67in Guinea school construction program,
78–79and implementation schemes for school
construction projects, 166–67Intermediate Technology Development
Group, 35–36, 49n4norms
established by MoEs, 113, 114b6.1for school location planning, 15–16toolkits to harmonize norms and
implementation schemes, 177–78Northern Uganda Social Action Fund
(NUSAF), 81, 86t5.7NRIP. See National Rural Infrastructure
Project (NRIP)NUSAF. See Northern Uganda Social
Action Fund (NUSAF)
OECD. See Organisation for Economic Co-operation and Development(OECD) countries
office space, 21–24Official Development Assistance, 73oil-free technologies, 35–36O&M. See operations and maintenance
(O&M) budgetone-classroom schools, 17–19, 27n2OPEC. See Organization of Petroleum
Exporting Countries (OPEC)operations and maintenance (O&M)
budget, 125–26, 127b7.1, 128n1
Organisation for Economic Co-operationand Development (OECD) countries,27n4, 68, 136
Organization of Petroleum ExportingCountries (OPEC), 58, 88–90, 107n2
overcrowding in schools, 8–10
Pakistan, 46b3.3, 126, 127b7.1Paris Declaration on Alignment and
Harmonization, 136PCUs. See Project Coordination
Units (PCUs)PEDP. See Primary Education Development
Project (PEDP)The Philippines, prefabricated classrooms,
46–47b3.3physical environment, as learning aid,
22b2.1physically disabled children
accessibility to schools for, 15–16,26–27
and classic classroom model, 50n19and distance to schools, 8handicap-friendly latrines, 52impact of school infrastructure
on, 151PISA. See Program for International
Student Assessment (PISA)PIUs. See Project Implementation
Units (PIUs)plant materials, 2–3PMCs. See Project Management
Committees (PMCs)PNDSE. See Programme National de
Développement du Secteur Education(PNDSE)
population, and school construction,16–19, 27n1, 102–3
potable water supply, 3–5poverty alleviation, link to social
funds, 83Poverty Reduction Support Credits, 80prefabrication, 40–42, 46–47b3.3,
50nn15–18, 162–63prices
and ICB procedures, 56price-fixing, 133–34n1
Primary Education Development Project(PEDP), 49n11, 127b7.1
primary gross enrollment ratio, 10
Index • 255
private sectorand construction of public
infrastructure, 67and role of CDD approach in school
construction, 175–76and school construction, 11
procurementcentralized management of through
ICB, 55–63, 107nn1–5centralized management with
procurement by NCB, 63–66, 107n8and classic classroom construction, 32,
33t3.1, 43t3.3and corruption in school construction,
130–33and costs of classroom technology in
Senegal, 32, 33t3.1and LCB, 33t3.1, 43t3.3, 62and management arrangements, 101procedures for, 117–19training in, 121–22, 123nn5–7See also international competitive
bidding (ICB); national competitivebidding (NCB)
Program for International Student Assessment (PISA), 27n4
Programme National de Développementdu Secteur Education (PNDSE), 50n19
Project Coordination Units (PCUs), 62Project Implementation Units (PIUs),
34, 135Project Management Committees
(PMCs), 117Prouvé, Jean, 50n18public funds, management of, 117public sector, performance of, 68public works, 68, 107n11purpose-built facilities, 21–24
quality of facilities, 16See also school quality norms
rainwater tanks, 53research
impact of school infrastructure, 151–53knowledge gaps in, 148randomized trials, 155
retentionimpact of school infrastructure on,
151–52link to distance to school, 7
roofing, 2–3, 4, 13n3rural areas
access to schools, 11and CMAs, 72and community participation in poli-
cies, 61, 107n5and delegation of contract management
to local governments, 96, 108n31and social fund agencies, 80and transportation of prefabricated
buildings, 44, 46–47b3.3
sanitation, 4–5, 13n4impact on enrollment, 152technology for, 51–53
satellite school model, 7, 13n9school buildings. See classrooms and
buildingsschool location planning
conclusions concerning, 25–26and distance norms, 16–19, 27n1inefficiencies of centralized planning of,
24–25overview, 15–16
school mapping, 15school quality norms, 16
and auxiliary purpose-built facilities,21–24
and classroom size, 20–21, 27nn3–4overview, 19–20
school shelter model, 32, 34–35, 49nn2–3Schumacher, Ernst, 35–36, 49n4Sears and Roebuck, 40sector strategies, 26sectorwide approaches (SWAPs), 136–38security requirements, 21, 27n3Senegal, 165, 170
Social Fund Community Handbook,121, 122f6.4, 179
unit costs of classic classroom technol-ogy, 32, 33t3.1
Senegal Social Fund, 121, 132–33b8.2, 179septic tank systems, 51shell, 34, 49n2Single Teacher Schools (STC), 27n2skilled construction workers, and prefabri-
cated classrooms, 45small-and medium-size enterprises
(SMEs), 80–81, 163small construction enterprises, 40–41,
50n16
256 • Index
SMEs. See small-and medium-size enter-prises (SMEs)
social funds, 80–88, 108nn21–24Angola, 81and corruption in school construction,
132–33b8.2Senegal, 121, 132–33b8.2, 179Zambia, 66, 81–82, 86t5.7, 171
Social Funds in Angola (FAS), 81social perspectives of school shelter, 34social protection sector, 80sole-source procurement, 130special needs children, 26–27
See also physically disabled childrenstakeholders
capacity building for community-basedwork approach, 119–23, 123nn5–7
in CDD projects, 112–16, 123n1,175–76
STC. See Single Teacher Schools (STC)stock-taking exercise, 142–44, 145t10.4,
149n1storage space, 21–24students to classroom ratios, 8–10, 13n12students to teacher ratios, 9–10, 20subcontracting, 56–57subsidiarity principle, 114, 123n1SWAPS. See sectorwide approaches
(SWAPs)
Tanzania, 170targeting mechanisms, 80teachers
absenteeism, 5, 152impact of infrastructure on motivation
of, 152student to teacher ratio, 9–10, 20teachers to classrooms ratio, 8–10unit cost of housing for, 24
technical assistance, 58technical audits, 146–47technical specialists, 99, 109n33technologies
construction. See construction technologyoil-free, 36use in United States home construction,
41for water and sanitation, 51–54
temporary structures, 2–4, 13n3
theft, of school furniture, 5–6training
development of, 144, 146to mitigate corruption, 133, 134n2in project management and
procurement, 121–22, 123nn5–7transparency, 129–30, 131b8.1,
132b8.2, 146Transparency International, 129–30transportation
and delivery of inputs, 58–59and prefabricated classrooms, 44,
46–47b3.3“Tropical House”, 50n18two-classroom schools, 17–19
Uganda, 93, 108n26, 112, 170–71, 172UNICEF. See United Nations Children’s
Fund (UNICEF)unit costs. See costsUnited Nations, “Another Development”,
36, 49n5United Nations Children’s Fund
(UNICEF), 5, 7United Nations Educational, Security, and
Cultural Organization (UNESCO),26, 36
United States, technologies used in homeconstruction, 41
unit space allocations, 20urban areas
access to schools, 11and community participation in
policies, 61, 107n5delegation of construction management
to CMAs, 96, 109n32
vandalism, to school furniture, 5–6Van der Rohe, Mies, 40VCSP. See Village Community Support
Project (VCSP)Ventilated Improved Pit (VIP) latrine, 51Village Community Support Project
(VCSP), 79b5.1Village Development Councils, 168village populations, and school size,
18–19VIP. See Ventilated Improved Pit (VIP)
latrine
Index • 257
wastewater treatment systems, 51water supply, 4–5, 13n4
and economies of scale, 17impact on enrollment, 152technology for, 53–54
water wells, 53World Bank, 68, 73
and CMAs, 67and distance norms, 16and earth-brick construction, 36, 49n7
and NGOs, 73–74as promoter of social funds, 80, 108n22ratings of school-delivery projects
financed by, 90student-teacher ratio, 20
World Bank Institute, 121, 123n5
Zambia, 171Zambia Social Investment Fund (ZAMSIF),
66, 81–82, 86t5.7, 171

E C O - A U D I T
Environmental Benefits Statement
The World Bank is committed to preserving endan-gered forests and natural resources. School Con-
struction Strategies for Universal Primary Education
in Africa: Should Communities Be Empowered to
Build Their Schools? is printed on 60# RollandOpaque, a recycled paper made with 30 percentpost-consumer waste. The Office of the Publisherfollows the recommended standards for paper usageset by the Green Press Initiative, a nonprofit pro-gram supporting publishers in using fiber that is notsourced from endangered forests. For more informa-tion, visit www.greenpressinitiative.org.
Saved:
• 7 trees• 3 million BTUs
of total energy• 51 pounds of
net greenhousegases
• 3,243 gallonsof waste water
• 110 pounds ofsolid waste

African countries have made significant progress in expanding access to primary educa-tion, and particularly since the year 2000, due in large part to commitments of aidmade by developed countries through such agreements as Education for All (EFA),
the Millennium Development Goals (MDGs), and the Education For All–Fast Track Initiative(EFA-FTI). Yet these achievements have placed great stress on school infrastructure, which hasnot grown fast enough to accommodate all school-age children. School facilities are ofteninadequate and unsuitable for learning. The development and creation of school infrastructureis too often hampered by poorly allocated resources, inefficient planning norms and practices,unsuitable construction technology, and non-cost-efficient management and implementationprocesses.
School Construction Strategies for Universal Primary Education in Africa examines the scope of theinfrastructure challenge in Sub-Saharan Africa and the constraints to scaling up at an affordablecost. It assesses the experiences of African countries with school planning, school facility designs,construction techniques, and procurement and implementation arrangements over the pastthirty years. It reviews the roles of the various actors in the implementation process: centraland decentralized administrations, local governments, agencies, social funds, NGOs, and localcommunities. Drawing upon extensive analysis of data from over 250 projects sponsored bythe World Bank and other donor agencies, the book draws lessons on promising approaches toenable African countries to scale up the facilities required to achieve the EFA goals and MDGsof complete quality primary education for all children at the lowest marginal cost.
ISBN 978-0-8213-7720-8
SKU 17720