school development based on assessments for quality ... · pdf fileschool development based on...
TRANSCRIPT

School Development based on Assessments for Quality Education in the Republic of Korea
JIMIN CHO, Vice President, Korea Institute for Curriculum and Evaluation
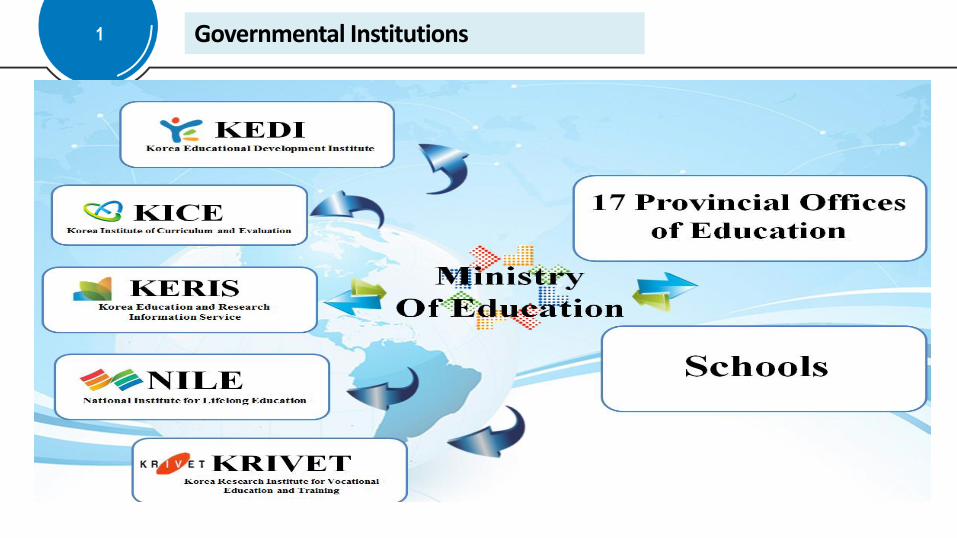
1 Governmental Institutions

Curriculum
Educational Evaluation
Teaching & Learning
Primary & Secondary Education
Implementation & Management
Research &Development
TextbookAuthorisation
Achievement
Test, CSAT, etc.
Operating Central Teaching & Learning
Centre
National Education Policy
Feedback
Input
Adju
stin
g S
ocia
l Change &
Refle
ctin
g U
ser R
equire
ments
KICE Integrative Management System 2

3 Significance of Assessment-national level
Gathering, analyzing, and using informatio
n about student learning
Collecting Objective Data
• NAEA, CSAT
• Improving teaching and learning
• Diagnosing students’ academic performance
• Providing materials for educational uses and policies
Educational Accountability
• Educational policy making
• Raising accountabilities of school, school district, and government

DIAGNOSING : Academic achievement
PROVIDING : Data and information
IMPROVING : Teaching and learning
EXPLORING : New research design and methods
ENHANCING : School’s accountability
NAEA
Purpose of the National Assessment of Educational Achievement(NAEA)4

Enforcement Decree of the Act (November 17, 2008)
Act on the Disclosure of Information of Education-related Institutions (May 25, 2007)
“Zero Below-Basic Plan (2008~2012)”“Upward Equalization” as government agenda
- The nation should perform NAEA for the all students compulsorily every year.(except Elementary school)
- Individual schools should announce the results in public.
Census test for all the studentsSample-based test 2008
NAEA Revisions5

- School Features
- School Facilities
- School-Level Curriculum Management
- School Climate
SCHOOLS
- Personal Background
- Teaching Activities Related to Each Subject
- Job’s SatisfactionTEACHERS
- Personal and Family Background
- Extracurricular Activities
- Learning Method and Attitude
- School Life
- Learning Related to Each Subject
STUDENTS
NAEA Survey based on Contextual Variables 6

Cut-scores to divide achievement levels Performance Level Descriptions
Advanced level
Proficient level
Basic level
Below-Basic level
Standard Setting Advanced cut-off score
Proficient cut-off score
Basic cut-off score
Standard Setting for Achievement Levels: MC+CR7

Achievement Levels of NAEA
ADVANCED
Level
PROFICIENT
Level
BASIC
Level
Superior academic performance of required knowledge and
skills
(Above 80% reached to the desired performance that must be
achieved in each content and grade )
Solid academic performance of required knowledge and skills
(50 – 80% reached to the desired performance that must be
achieved in each content and grade )
Partial mastery of required knowledge and skills
(20 – 50% reached to the desired performance that must be
achieved in each content and grade )
BELOW- BASIC
Base Line of basic academic achievement
8

Trends of NAEA9

Outcomes of “School For Improvement” Policy : After School Program
2.8 2.1
1.1 1.2
1.7 1.5
0.8 0.7
0.0
0.5
1.0
1.5
2.0
2.5
3.0
2009 2010 2011 2012
(%)
YEAR
11.0
7.1
3.9 3.9
6.4
4.2
2.2 2.2
0.0
2.0
4.0
6.0
8.0
10.0
12.0
2009 2010 2011 2012
(%)
YEAR
18.4
10.5
8.1
6.8 5.6 3.5
3.1 2.9
0.0
4.0
8.0
12.0
16.0
20.0
2009 2010 2011 2012
(%)
YEARProvided by MOE(2013)
10

Regional gap
Trying to reduce the regional gap
Below basic Basic above
%of below basic in 17 provinces
11

Advanced Proficiency Basic Below basic
Metropolitan cities rural
Regional Trends/ School Progress Index
School Progress Index of 17 Provinces in 2014
12

• Once a year
• Number of students who took the NAEA
• Percentage of students at each level (Below Basic, Basic, Proficient and Advanced)
• School Progress Index
School Information Disclosure
Act on the Disclosure of Information of Education-related Institutions
Enforcement Decree of the Act
www.schoolinfo.go.kr
Release the results of the assessment to the public to build a
“comprehensive student service mechanism”
- Uploading achievement levels and SPI on “School Reporter” for the public
School Reporter: www.schoolinfo.go.kr
13

Dissemination of NAEA results14

Feedback to Schools: leaflet, Reports, Seminar…15

Use of the NAEA Results for school development16

1) Increasing quality schools
2) Attaining policy goals for the improvement of basic education
3) Contribution to standardization rates of student
Serve as indicators of school achievement and a method of objectively evaluating the quality of schools
The school support policy has been executed since 2009 and has shown significant positive results in raising school capacity and supporting low achieving students.
Reducing the achievement gaps between the urban and rural areas
The Implications of Student Assessment in Korea’s Education17

Student Assessments at the International Level
The OECD Programme for International Student Assessment
Trends in International Mathematics and Science Study
International Computer and Information Literacy Study
PISA
TIMSS
ICILS
18

Percentage of students at different19

Upward equalization
21
20 PISA: Reading by Proficiency level

PISA Results
525
534
556
539536
547
542
547 546
554552
538
522
538 538
500
510
520
530
540
550
560
2000 2003 2006 2009 2012 2000 2003 2006 2009 2012 2000 2003 2006 2009 2012
Reading Math Science
Mean score
Rank 6 2 1 2~4 3~5 2 3 1~4 3~6 3~5 1 4 7~13 4~7 5~8
21

Trends in Science Literacy by Gender
Trends in Science Literacy by Gender
561 point541 point
546 point 527 point
537 point 539 point
PISA 2003
PISA 2006
PISA 2009
539 point 539 point
PISA 2012
22
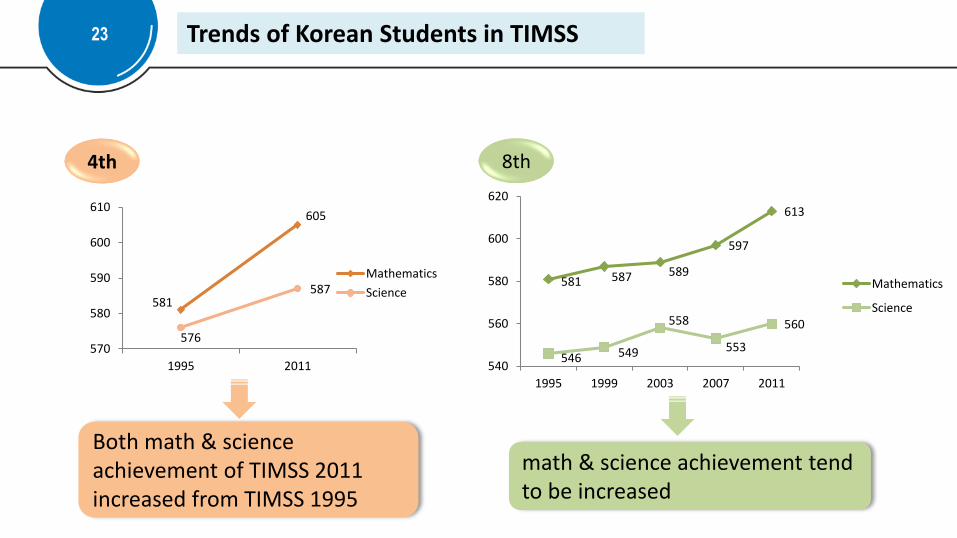
Trends of Korean Students in TIMSS
581 587 589
597
613
546 549
558
553
560
540
560
580
600
620
1995 1999 2003 2007 2011
Mathematics
Science
Both math & science achievement of TIMSS 2011 increased from TIMSS 1995
4th
581
605
576
587
570
580
590
600
610
1995 2011
Mathematics
Science
8th
math & science achievement tend to be increased
23

Implications from PISA/TIMSS
1) top/low performing students
2) Gender Difference in Science & Math
3) Index of Affective characteristics in PISA/TIMSS
Confidence Interest
Value
3%
34%
63%
14%
45% 41%
0%10%20%30%40%50%60%70%
confident somewhatconfident
notconfident
Korea Inter. Avg
8%
36%
56%
26%
42%31%
0%10%20%30%40%50%60%
Korea Inter. Avg
14%
52%
34%
46%39%
15%
0%10%20%30%40%50%60%
value somewhatvalue
do notvalue
Korea Inter. Avg
24
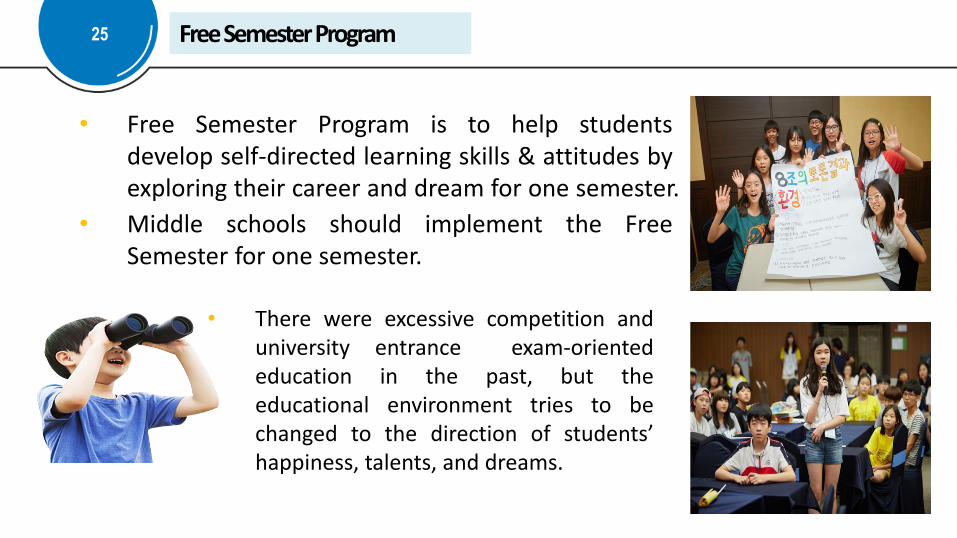
• Free Semester Program is to help studentsdevelop self-directed learning skills & attitudes byexploring their career and dream for one semester.
• Middle schools should implement the FreeSemester for one semester.
Free Semester Program
• There were excessive competition anduniversity entrance exam-orientededucation in the past, but theeducational environment tries to bechanged to the direction of students’happiness, talents, and dreams.
25

Exploration of the reasons of affective achievement of various domains
as well as finding the teaching and learning support plan for affective
achievement
How to aligning curriculum, teaching and assessment at international,
national, regional and school level
How to focusing on the types of skills requested at global level
- upcoming 2015 revised national curriculum in Korea
Challenges in Korea’s education26

Thank you for your attention!
2016
Further Information
www.kice.re.kr