school district of osceola county overview of budget & millages august 6, 2009
TRANSCRIPT

School District of Osceola County
Overview of Budget & Millages
August 6, 2009

2
Osceola
County
School
Board
Members

3
2008 – 2009
OSCEOLA COUNTY SCHOOL GRADES DISTRIBUTION
4

5
Budget ReductionsJanuary 2009 to Present
Million
Total 38.5
Salaries 17.0
Schools % 5.5%
Departments % 8.7%
Insurance Premium Increases 3.5
Shift Costs to Capital Project Funds 4.7
Energy Savings Program
No Raises

Millions
Stimulus Funding 18
Stabilization Grants 12
Total 30
Applied to Salaries 22
6
American Recovery & Reinvestment Act

7
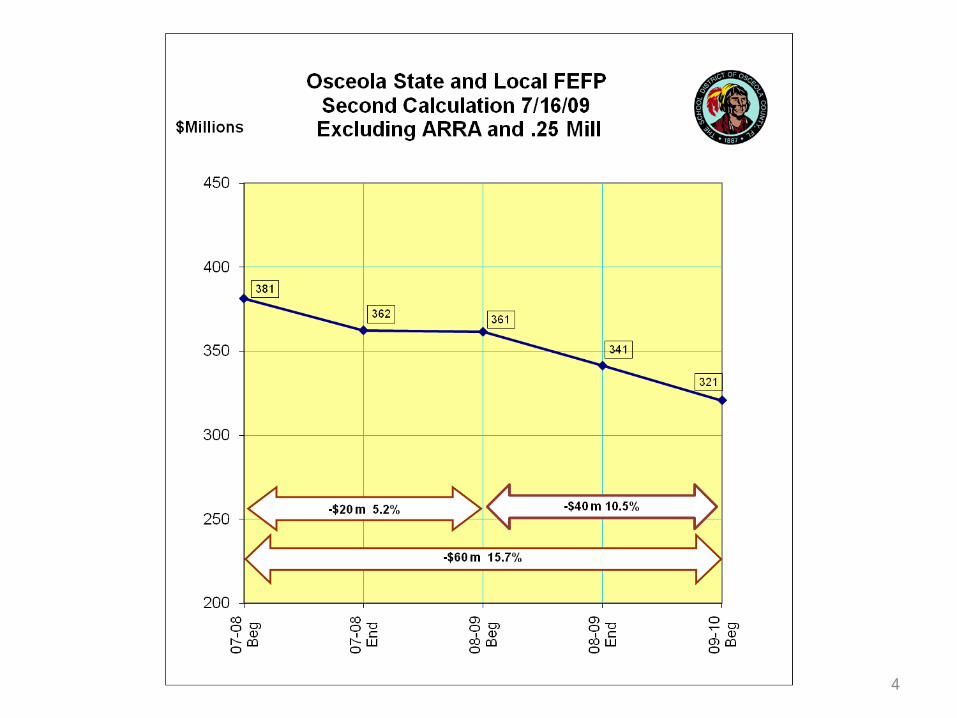
General Fund BudgetProjection Without .25 Mills
Millages
Recurring Revenues 351.9
Recurring Appropriations 357.3
Shortfall (5.4)

8
Value of .25 Mills
Local Tax
School Tax Roll 22,933,780,727
Value of .25 Mills 5,446,773
State Compression Adjustment
Unweighted Students 50,656.72
Osceola value of .25 mills per student 107.52
Statewide average per student .25 mills 149.35
Compression per student 41.83
Compression Adjustment 2,118,971
Total .25 mills plus compression 7,565,744

9
MillageGeneral Operating
Required Local Effort 5.165Basic Discretionary Operating 0.748Discretionary Critical Needs 0.250
Basic Discretionary Capital Outlay 1.500
Debt Service 0.000
Total Millage 7.663
Proposed Millage Rates FY 2009-2010
10
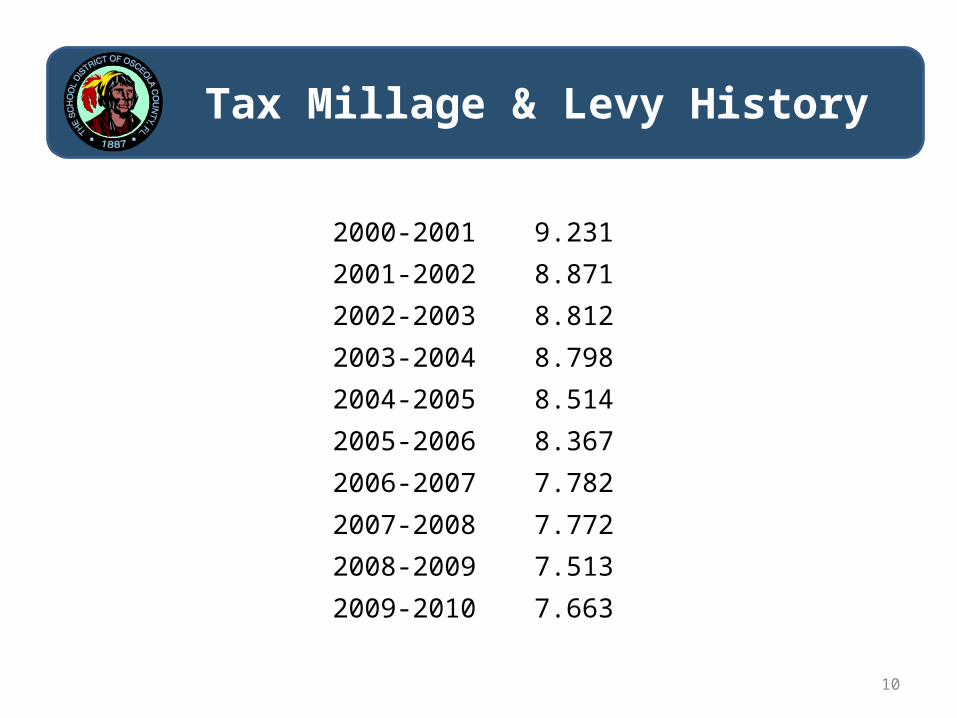
Tax Millage & Levy History
2000-2001 9.231
2001-2002 8.871
2002-2003 8.812
2003-2004 8.798
2004-2005 8.514
2005-2006 8.367
2006-2007 7.782
2007-2008 7.772
2008-2009 7.513
2009-2010 7.663
11
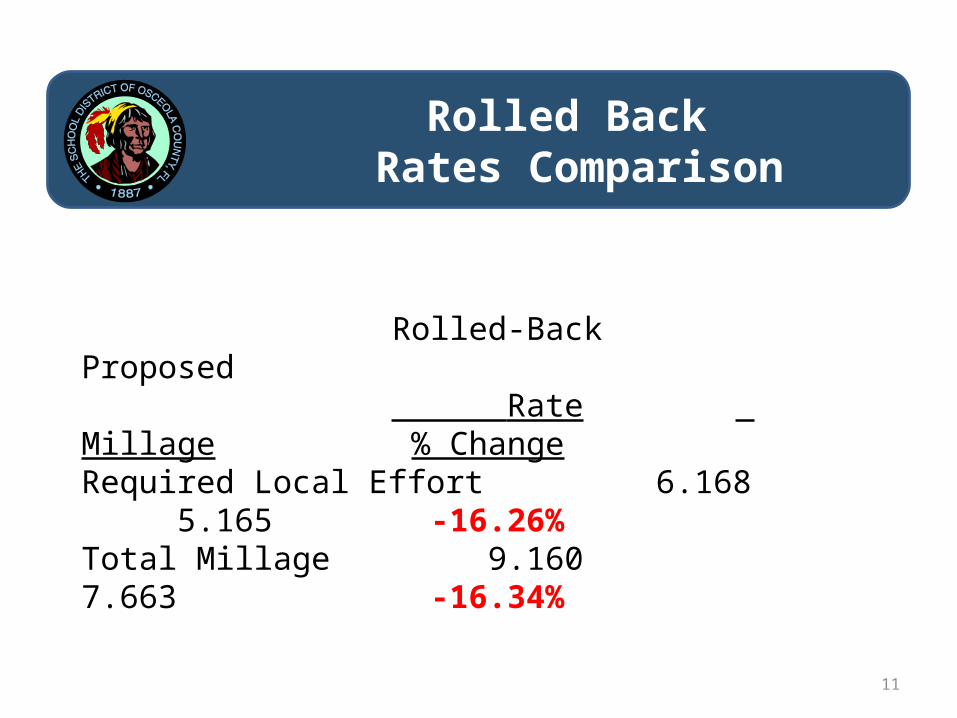
Rolled-Back Proposed Rate Millage % Change
Required Local Effort 6.168 5.165 -16.26%Total Millage 9.160 7.663 -16.34%
Rolled Back Rates Comparison

1212
Tax Levy Comparison
2008-2009 2009-2010
Tax Roll 27,185,791,325 22,933,780,727
Total Millage 7.513 7.663
Total Levy 204,246,850 175,741,562
Change in Tax Levy (838,850) (28,505,288)