school district of the borough of englewood cliffs … · sue anne mather school business...
TRANSCRIPT
SCHOOL DISTRICT OF THE
BOROUGH OF ENGLEWOOD CLIFFS
COUNTY OF BERGEN, NEW JERSEY
COMPREHENSIVE ANNUAL FINANCIAL REPORT
FOR THE FISCAL YEAR ENDED
JUNE 30, 2019
School Districtof
Englewood Cliffs
ENGLEWOOD CLIFFS PUBLIC SCHOOLSEnglewood Cliffs, New Jersey
Comprehensive Annual Financial ReportYear Ended June 30, 2019

Comprehensive Annual Financial Report
of the
ENGLEWOOD CLIFFS PUBLIC SCHOOLSEnglewood Cliffs, New Jersey
Year Ended June 30, 2019
Prepared by
Sue Anne MatherBoard Secretary/Business Administrator
OUTLINE OF CAFR
INTRODUCTORY SECTION
Letter of Transmittal. . . . . . . . . . . . . . . . . . . . . . . . . . . . . . . . . . . . . . . . . . . . . . . . . . . . . . . . . . . . . 1Organizational Chart. . . . . . . . . . . . . . . . . . . . . . . . . . . . . . . . . . . . . . . . . . . . . . . . . . . . . . . . . . . . . 5Roster of Officials.. . . . . . . . . . . . . . . . . . . . . . . . . . . . . . . . . . . . . . . . . . . . . . . . . . . . . . . . . . . . . . 6Consultants and Advisors. . . . . . . . . . . . . . . . . . . . . . . . . . . . . . . . . . . . . . . . . . . . . . . . . . . . . . . . . 7
FINANCIAL SECTION
Independent Auditor's Report. . . . . . . . . . . . . . . . . . . . . . . . . . . . . . . . . . . . . . . . . . . . . . . . . . . . . . 8
Required Supplementary Information - Part IManagement’s Discussion and Analysis.. . . . . . . . . . . . . . . . . . . . . . . . . . . . . . . . . . . . . . . . . . . . . 12
BASIC FINANCIAL STATEMENTS
A. District-wide Financial Statements:
A-1 Statement of Net Position. . . . . . . . . . . . . . . . . . . . . . . . . . . . . . . . . . . . . . . . . . . . . . . . 21A-2 Statement of Activities. . . . . . . . . . . . . . . . . . . . . . . . . . . . . . . . . . . . . . . . . . . . . . . . . . 22
B. Fund Financial Statements:
Governmental Funds:B-1 Balance Sheet. . . . . . . . . . . . . . . . . . . . . . . . . . . . . . . . . . . . . . . . . . . . . . . . . . . . . . . . . 23B-2 Statement of Revenues, Expenditures and Changes in Fund Balances. . . . . . . . . . . . . 24B-3 Reconciliation of the Statement of Revenues, Expenditures, and
Changes in Fund Balances of Governmental Funds to theStatement of Activities. . . . . . . . . . . . . . . . . . . . . . . . . . . . . . . . . . . . . . . . . . . . . . . . 25
Proprietary Funds:B-4 Statement of Net Position. . . . . . . . . . . . . . . . . . . . . . . . . . . . . . . . . . . . . . . . . . . . . . . . 26B-5 Statement of Revenues, Expenses and Changes in Fund Net Position.. . . . . . . . . . . . . 27B-6 Statement of Cash Flows. . . . . . . . . . . . . . . . . . . . . . . . . . . . . . . . . . . . . . . . . . . . . . . . 28
Fiduciary Funds:B-7 Statement of Fiduciary Net Position. . . . . . . . . . . . . . . . . . . . . . . . . . . . . . . . . . . . . . . . 29B-8 Not Applicable
Notes to the Financial Statements. . . . . . . . . . . . . . . . . . . . . . . . . . . . . . . . . . . . . . . . . . . . . . . . 30

OUTLINE OF CAFR
Required Supplementary Information - Part II
C. Budgetary Comparison Schedules:
C-1 Budgetary Comparison Schedule - General Fund.. . . . . . . . . . . . . . . . . . . . . . . . . . . . . 67C-1a Not ApplicableC-2 Budgetary Comparison Schedule - Special Revenue Fund.. . . . . . . . . . . . . . . . . . . . . . 72
Notes to the Required Supplementary InformationC-3 Budgetary Comparison Schedule. . . . . . . . . . . . . . . . . . . . . . . . . . . . . . . . . . . . . . . . . . 73
Required Supplementary Information - Part III
L. Schedules Related to Accounting and Reporting for Pensions (GASB 68)
L-1 Schedule of the District's Proportionate Share of the Net PensionLiability – PERS.. . . . . . . . . . . . . . . . . . . . . . . . . . . . . . . . . . . . . . . . . . . . . . . . . . . . 74
L-2 Schedule of District Contributions – PERS. . . . . . . . . . . . . . . . . . . . . . . . . . . . . . . . . . 75L-3 Schedule of the District's Proportionate Share of the Net Pension
Liability – TPAF.. . . . . . . . . . . . . . . . . . . . . . . . . . . . . . . . . . . . . . . . . . . . . . . . . . . . 76L-4 Notes to Requires Schedules of Supplementary Information - Part III.. . . . . . . . . . . . . 77
M. Schedules Related to Accounting and Reporting for OPEB (GASB 75)
M-1 Schedule of Changes in the District's Proportionate Share of the StateOPEB Liability. . . . . . . . . . . . . . . . . . . . . . . . . . . . . . . . . . . . . . . . . . . . . . . . . . . . . . 78
Other Supplementary Information
D. School Level Schedules: Not Applicable
E. Special Revenue Fund:
E-1 Combining Schedule of Program Revenues and Expenditures -Budgetary Basis. . . . . . . . . . . . . . . . . . . . . . . . . . . . . . . . . . . . . . . . . . . . . . . . . . . . . 79
E-1a Combining Schedule of Program Revenues and Expenditures -Budgetary Basis. . . . . . . . . . . . . . . . . . . . . . . . . . . . . . . . . . . . . . . . . . . . . . . . . . . . . 80
E-2 Not ApplicableE-3 Not ApplicableE-4 Not ApplicableE-5 Not Applicable
F. Capital Projects Fund:
Not Applicable
OUTLINE OF CAFR
G. Proprietary Funds:
Enterprise Fund:G-1 Combining Statement of Net Position. . . . . . . . . . . . . . . . . . . . . . . . . . . . . . . . . . . . . . 81G-2 Combining Statement of Revenues, Expenses and Changes in
Fund Net Position. . . . . . . . . . . . . . . . . . . . . . . . . . . . . . . . . . . . . . . . . . . . . . . . . . . . 82G-3 Combining Statement of Cash Flows. . . . . . . . . . . . . . . . . . . . . . . . . . . . . . . . . . . . . . . 83
Internal Service Fund:Not Applicable
H. Fiduciary Funds:
H-1 Combining Statement of Fiduciary Net Position. . . . . . . . . . . . . . . . . . . . . . . . . . . . . . 84H-2 Not Applicable H-3 Student Activity Agency Fund - Schedule of Receipts and Disbursements. . . . . . . . . . 85H-4 Payroll Agency Fund - Schedule of Receipts and Disbursements. . . . . . . . . . . . . . . . . 86
I. Long-Term Debt:
I-1 Statement of Serial Bonds.. . . . . . . . . . . . . . . . . . . . . . . . . . . . . . . . . . . . . . . . . . . . . . . 87I-2 Budgetary Comparison Schedule - Debt Service Fund.. . . . . . . . . . . . . . . . . . . . . . . . . 88
J. Statistical Section (Unaudited)
Financial Trends
Introduction to the Statistical Section
J-1 Net Position by Component. . . . . . . . . . . . . . . . . . . . . . . . . . . . . . . . . . . . . . . . . . . . . . 89J-2 Changes in Net Position. . . . . . . . . . . . . . . . . . . . . . . . . . . . . . . . . . . . . . . . . . . . . . . . . 90J-3 Fund Balances - Governmental Funds. . . . . . . . . . . . . . . . . . . . . . . . . . . . . . . . . . . . . . 93J-4 Changes in Fund Balances - Governmental Funds. . . . . . . . . . . . . . . . . . . . . . . . . . . . . 94J-5 General Fund - Other Local Revenue by Source. . . . . . . . . . . . . . . . . . . . . . . . . . . . . . 96
Revenue Capacity
J-6 Assessed Value and Estimated Actual Value of Taxable Property.. . . . . . . . . . . . . . . . 97J-7 Direct and Overlapping Property Tax Rates. . . . . . . . . . . . . . . . . . . . . . . . . . . . . . . . . . 98J-8 Principal Property Taxpayers. . . . . . . . . . . . . . . . . . . . . . . . . . . . . . . . . . . . . . . . . . . . . 99J-9 Property Tax Levies and Collections. . . . . . . . . . . . . . . . . . . . . . . . . . . . . . . . . . . . . . . 100
Debt Capacity
J-10 Ratios of Outstanding Debt by Type.. . . . . . . . . . . . . . . . . . . . . . . . . . . . . . . . . . . . . . . 101J-11 Ratios of General Bonded Debt Outstanding. . . . . . . . . . . . . . . . . . . . . . . . . . . . . . . . . 102J-12 Direct and Overlapping Governmental Activities Debt. . . . . . . . . . . . . . . . . . . . . . . . . 103J-13 Legal Debt Margin Information. . . . . . . . . . . . . . . . . . . . . . . . . . . . . . . . . . . . . . . . . . . 104
Demographic and Economic Information
J-14 Demographic and Economic Statistics. . . . . . . . . . . . . . . . . . . . . . . . . . . . . . . . . . . . . . 104J-15 Principal Employers. . . . . . . . . . . . . . . . . . . . . . . . . . . . . . . . . . . . . . . . . . . . . . . . . . . . 106
Operating Information
J-16 Full-time Equivalent District Employees by Function/Program.. . . . . . . . . . . . . . . . . . 107J-17 Operating Statistics. . . . . . . . . . . . . . . . . . . . . . . . . . . . . . . . . . . . . . . . . . . . . . . . . . . . . 108J-18 School Building Information. . . . . . . . . . . . . . . . . . . . . . . . . . . . . . . . . . . . . . . . . . . . . 109J-19 Schedule of Required Maintenance Expenditures for School Facilities.. . . . . . . . . . . . 110J-20 Insurance Schedule. . . . . . . . . . . . . . . . . . . . . . . . . . . . . . . . . . . . . . . . . . . . . . . . . . . . . 111
K. SINGLE AUDIT SECTION
K-1 Independent Auditor’s Report on Internal Control Over Financial Reporting andon Compliance and Other Matters Based on an Audit of Financial StatementsPerformed in Accordance with Government Auditing Standards. . . . . . . . . . . . . . . 113
K-2 Independent Auditor’s Report on Compliance with Requirements Applicable toEach Major State Program and Internal Control Over Compliance inAccordance with the Uniform Guidance and N.J. OMB Circular Letter 15-08.. . . . 115
K-3 Schedule of Expenditures of Federal Awards - Schedule A. . . . . . . . . . . . . . . . . . . . . . 118K-4 Schedule of Expenditures of State Financial Assistance - Schedule B.. . . . . . . . . . . . . 119K-5 Notes to the Schedules of Expenditures of Federal Awards and
State Financial Assistance. . . . . . . . . . . . . . . . . . . . . . . . . . . . . . . . . . . . . . . . . . . . . 120K-6 Schedule of Findings and Questioned Costs.. . . . . . . . . . . . . . . . . . . . . . . . . . . . . . . . . 123K-7 Schedule of Financial, Federal and State Findings. . . . . . . . . . . . . . . . . . . . . . . . . . . . . 124K-8 Summary Schedule of Prior Audit Findings. . . . . . . . . . . . . . . . . . . . . . . . . . . . . . . . . . 125

INTRODUCTORY SECTION

ENGLEWOOD CLIFFS PUBLIC SCHOOLS
143 Charlotte Place
Englewood Cliffs, NJ 07632-2681
Telephone (201) 567-7292 FAX: (201) 567-2738
Jennifer Brower
Superintendent of Schools
November 8, 2019
Honorable President and
Members of the Board of Education
Englewood Cliffs School District
County of Bergen, New Jersey
Dear Board Members:
Sue Anne Mather
School Business Administrator/
Board Secretary
The comprehensive annual financial report of the Englewood Cliffs School District
(District) for the fiscal year ending June 30, 2019 is hereby submitted. Responsibility
for both the accuracy of the data and the completeness and fairness of the
presentations, including all disclosures, rests with the management of the Board of
Education. To the best of our knowledge and belief, the data presented in this report
is accurate in all material respects and is reported in a manner designed to present
fairly the financial position and results of operations of the various funds and account
groups of the District. All disclosures necessary to enable the reader to gain an
understanding of the District's financial activities have been included.
The comprehensive annual financial report is presented in four sections: introductory,
financial, statistical and single audit. The introductory section includes this transmittal
letter, the district�s organizational chart and a list of principal officials. The financial
section includes the basic financial statements, management's discussion and analysis
and the independent auditor's report. The statistical section includes selected financial
and demographic information, generally presented on a multi-year basis. The District
is required to undergo an annual single audit in conformity with the provisions of the
Title 2 U.S. Code of Federal Regulations Part 200, Uniform Administrative
Requirements, Cost Principles, and Audit Requirements for Federal Awards (Uniform
Guidance) and the schedule of expenditures of state financial assistance as required
by NJ 0MB 15-08
-1-

Information related to this single audit, including the auditor's report on the internal
control structure and compliance with applicable laws and regulations and findings
recommendations are included in the single audit section of the report.
1) Reporting Entity and Its Services: The Englewood Cliffs School District is an
independent reporting entity with the criteria adopted by GASB as established by GASB
Statement No. 14. All funds and account groups of the District are included in this
report. The Englewood Cliffs Board of Education and all its schools constitute the
District's reporting entity. The District provides a full range of services appropriate to
grade level Pre-K through 8. These programs include regular and inclusive special
education services for handicapped children. The district completed the 2018-2019
fiscal year with an average daily enrollment of 489 students, which represents 5
students below the previous year's enrollment. The following details the changes in
the student enrollment of the District over the last five years.
Average Daily Enrollment
Fiscal Year
2018-2019
2017-2018
2016-2017
2015-2016
2014-2015
Student Enrollment
489
494
525
546
540
Percent Change
-1.0
-5.9
-3.8
1.1
3.2
2) Economic Conditions and Outlook: The tax revenue producing areas of
Englewood Cliffs have limited growth. Given the current economic climate, it can be
expected that this will continue to have an impact on the district's revenues for the
foreseeable future.
3) Major Initiatives: We continue to increase the use of technology in our everyday
curriculum and have begun Reading, Writing and Math Workshop in Grades K-8. We
have professional development in math and language arts and Responsive Classroom.
With all of the initiatives, it is now time for us to begin tracking the progress of these
programs and refine our current programs to insure the success of each child in our
district. With all new programs in place, the Englewood Cliffs School district is
positioned to be a leader in educational reform movement.
-2-
4) Internal Accounting Controls: Management of the District is responsible for
establishing and maintaining an internal control structure designed to ensure that the
assets of the District are protected from loss, theft and misuse and to ensure that
adequate accounting data are compiled to allow for the presentation of financial
statements in conformity with generally accepted accounting principles (GAAP). The
internal control structure is designed to provide reasonable, but not absolute,
assurance that these objectives are met. The concept of reasonable assurance
recognizes that (1) the cost of a control should not exceed the benefits likely to be
derived and (2) the valuation of costs and benefits require estimate and judgments by
management.
As a recipient of federal and state financial assistance, the District also is responsible
for ensuring that an adequate internal control structure is in place to ensure
compliance with applicable laws and regulations related to those programs. This
internal control structure is also subject to periodic evaluation by the District
management.
As part of the District's single audit described earlier, tests are made to determine the
adequacy of the internal control structure, including that portion related to federal and
state financial assistance programs, as well as to determine that the District has
complied with applicable laws and regulations.
5) Budgetary Controls: In addition to internal accounting controls, the District
maintains budgetary controls. The objective of these budgetary controls is to ensure
compliance with legal provisions embodied in the annual appropriated budget. Annual
appropriated budgets are adopted for the general fund and the special revenue fund.
The final budget amount as amended for the fiscal year is reflected in the financial
section.
An encumbrance accounting system is used to record outstanding purchasing
commitments on a line item basis. Open encumbrances at year-end are either
canceled or are included as re-appropriations of fund balance in the subsequent year.
Those amounts to be appropriated are reported as reservations of fund balance at
June 30, 2019.
6) Cash Management: The investment policy of the District is guided in large part by
state statute as detailed in "Notes to the Financial Statements", Note 2. The district
has adopted a cash management plan which requires it to deposit public funds
depositories protected from loss under the provisions of the Governmental Unit Deposit
Protection Act ("GUDPA") GUDPA was enacted in 1970 to protect Governmental Units
from loss of funds on deposit with failing banking institutions in New Jersey. The law
-3-

requires governmental units to deposit public funds only in public depositories located
in New Jersey, where the funds are secured in accordance with the Act.
7) Risk Management: The Board carries various forms of insurance, including but
not limited to general liability, hazards and theft insurance on property and contents,
fidelity bonds, and student accident. The Board participates in a self-insurance pool
(43 school districts) for workers' compensation as a member of the Northeast Bergen
County School Board Insurance Group.
8) Other Information - Independent Audit: State statutes require an annual audit by
independent certified public accountants er registered municipal accountants. The
accounting firm of Ferraioli, Wielkotz, Cerullo & Cuva, P.A. was selected by the Board.
In addition to meeting requirements set forth in state statues, the audit also was
designed to meet the requirements of the Title 2 U.S. Code of Federal Regulations, Part
2, Uniform Administrative Requirements, Cost Principles, and Audit Requirements for
Federal Awards (Uniform Guidance), and the schedule of expenditures of state financial
assistance as required by NJ 0MB 15-08. The auditor's report on the general-purpose
financial statements and combined and individual fund statement and schedules is
included in the financial section of this report. The auditor's report relates specifically
to the single audits are included in the single audit section of this report.
9) Acknowledgements: We would like to express our appreciation to the members
of the Englewood Cliffs School Board for their concern in providing fiscal accountability
to the citizens and taxpayers of the school district and thereby contributing their full
support to the development and maintenance of our financial operations. The
preparation of this report could not have been accomplished without the efficient and
dedicated services of our financial and accounting staff.
Respectfully submitted,
J
Superintendent of Schools
Sue Anne Mather
School Business Administrator/
Board Secretary
-4-

Sch
ool B
usi
ness
A
dm
inis
trato
r Board
Secr
etar
y
Ass
ista
nt Busi
ness
A
dm
inis
trato
r, D
1stn
ct
Secr
etary
, Tr
easu
rer
of Sch
ool
Mon
ies
Cus
todia
ns
EN
GLEW
OO
D C
LIF
FS S
CH
OO
L D
IST
RIC
T
OR
GA
NIZ
ATIO
NA
L C
HA
RT
Superv
isor
of
Guid
ance
D
istr
ict Pri
ncip
al
Net
work
Sp
eci
alist
Sup
ervi
sor of
Speci
al
Educa
tion/
Soci
al
Wor
ker
Sch
ool P
sych
olo
g1s
t, LD
TC,
Spe
cial
Educa
tion
Teach
ers
, Par
apro
fess
10nals
, Chi
ld S
tudy
Team
Sec
reta
ry
Super
viso
r of
Cur
ricu
lum
and
Inst
ruct
ion
Exec
utive S
ecr
etary
to
the S
uper
inte
nden
t/H
R
Aug
ust
13, 20
18
-5-

BOROUGH OF ENGLEWOOD CLIFFS SCHOOL DISTRICT
ROSTER OF OFFICIALS
JUNE 30, 2019
Members of the Board of Education Term Expires
Shanna Jafri, President 2021
Philip K. Choi, Vice-President 2020
Eugene Chang 2020
George Drimones 2021
Edmond Duda 2021
Katherine Kang 2020
Ankur Pandya 2019
Susan Pak 2019
Frank Patti, Jr. 2019
Other Officials
Jennifer Brower, Superintendent of Schools
Siobhan Tauchert, Principal
Sue Anne Mather, Board Secretary/Business Administrator
Charles A. Hangley, Treasurer of School Monies
Stephen R. Fogarty, Esp., Solicitor
-6-
BOROUGH OF ENGLEWOOD CLIFFS SCHOOL DISTRICT
CONSULTANTS AND ADVISORS
AUDIT FIRM
Ferraioli, Wielkotz, Cerullo & Cuva, P.A.Certified Public Accountants
401 Wanaque AvenuePompton Lakes, NJ 07442
ATTORNEY
Fogarty & HaraAttorneys at Law
21-00 Route 208 SouthFair Lawn, NJ 07410
OFFICIAL DEPOSITORY
Connect One Bank180 Sylvan Avenue
Englewood Cliffs, NJ 07632
-7-

FINANCIAL SECTION

Ferraioli, Wielkotz, Cerullo & Cuva, P.A.Charles J. Ferraioli, Jr., MBA, CPA, RMA Certified Public Accountants Newton Office Steven D. Wielkotz, CPA, RMA 401 Wanaque Avenue 100B Main Street James J. Cerullo, CPA, RMA Pompton Lakes, New Jersey 07442 Newton, NJ 07860Paul J. Cuva, CPA, RMA 973-835-7900 973-579-3212Thomas M. Ferry, CPA, RMA Fax 973-835-6631 Fax 973-579-7128
INDEPENDENT AUDITOR'S REPORT
Honorable President andMembers of the Board of EducationBorough of Englewood Cliffs School DistrictCounty of Bergen, New Jersey
Report on the Financial Statements
We have audited the accompanying financial statements of the governmental activities, the business-type activities, each major fund and the aggregate remaining fund information of the Board of Educationof the Borough of Englewood Cliffs School District, in the County of Bergen, State of New Jersey, as ofand for the year ended June 30, 2019, and the related notes to the financial statements, whichcollectively comprise the District’s basic financial statements as listed in the table of contents.
Management’s Responsibility for the Financial Statements
Management is responsible for the preparation and fair presentation of these financial statements inaccordance with accounting principles generally accepted in the United States of America; this includesthe design, implementation, and maintenance of internal control relevant to the preparation and fairpresentation of financial statements that are free from material misstatements, whether due to fraud orerror.
Auditor’s Responsibility
Our responsibility is to express opinions on these financial statements based on our audit. Weconducted our audit in accordance with auditing standards generally accepted in the United States ofAmerica, the audit requirements prescribed by the Office of School Finance, Department of Education,State of New Jersey, and the standards applicable to financial audits contained in Government AuditingStandards, issued by the Comptroller General of the United States. Those standards require that weplan and perform the audit to obtain reasonable assurance about whether the financial statements arefree of material misstatement.
-8-

Honorable President andMembers of the Board of EducationPage 2.
An audit involves performing procedures to obtain audit evidence about the amounts and disclosures inthe financial statements. The procedures selected depend on the auditor’s judgment, including theassessment of the risks of material misstatement of the financial statements, whether due to fraud orerror. In making those risk assessments, the auditor considers internal control relevant to the entity’spreparation and fair presentation of the financial statements in order to design audit procedures that areappropriate in the circumstances, but not for the purpose of expressing an opinion on the effectivenessof the entity’s internal control. Accordingly, we express no such opinion. An audit also includesevaluating the appropriateness of accounting policies used and the reasonableness of significantaccounting estimates made by management, as well as evaluating the overall presentation of thefinancial statements.
We believe that the audit evidence we have obtained is sufficient and appropriate to provide a basis forour audit opinions.
Opinion
In our opinion, the financial statements referred to above present fairly, in all material respects, therespective financial position of the governmental activities, business-type activities, each major fund,and the aggregate remaining fund information of the Borough of Englewood Cliffs Board of Education,in the County of Bergen, State of New Jersey, as of June 30, 2019, and the respective changes infinancial position and, where applicable, cash flows thereof for the year then ended in accordance withaccounting principles generally accepted in the United States of America.
Other Matters
Required Supplementary Information
Accounting principles generally accepted in the United States of America require that theManagement’s Discussion and Analysis, Budgetary Comparison Information, and schedules related toaccounting and reporting for pensions and other post employment benefits identified in the table ofcontents be presented to supplement the basic financial statements. Such information, although not apart of the basic financial statements, is required by the Governmental Accounting Standards Board whoconsiders it to be an essential part of the financial reporting for placing the basic financial statements inan appropriate operational, economic, or historical context. We have applied certain limited proceduresto the required supplementary information in accordance with auditing standards generally accepted inthe United States of America, which consisted of inquiries of management about the methods ofpreparing the information and comparing the information for consistency with management’s responsesto our inquiries, the basic financial statements, and other knowledge we obtained during our audit of thebasic financial statements. We do not express an opinion or provide any assurance on the informationbecause the limited procedures do not provide us with sufficient evidence to express an opinion orprovide any assurance.
-9-

Honorable President andMembers of the Board of EducationPage 3.
Other Information
Our audit was conducted for the purpose of forming opinions on the financial statements thatcollectively comprise the Borough of Englewood Cliffs Board of Education’s basic financial statements. The introductory section, combining and individual nonmajor fund financial statements and schedule ofexpenditures of federal awards, and the schedule of expenditures of state financial assistance as requiredby NJ OMB 15-08 and the State of New Jersey, Department of Education, Division of Finance, andstatistical section are presented for purposes of additional analysis and are not a required part of thebasic financial statements.
The combining and individual nonmajor fund financial statements and the schedule of expenditures offederal awards, and the schedule of expenditures of state financial assistance as required by NJ OMB15-08 and the State of New Jersey, Department of Education, Division of Finance are the responsibilityof management and were derived from and relates directly to the underlying accounting and otherrecords used to prepare the basic financial statements. Such information has been subjected to theauditing procedures applied in the audit of the basic financial statements and certain additionalprocedures, including comparing and reconciling such information directly to the underlying accountingand other records used to prepare the basic financial statements or to the basic financial statementsthemselves, and other additional procedures in accordance with auditing standards generally accepted inthe United States of America. In our opinion, the combining and individual nonmajor fund financialstatements, and the schedule of expenditures of state financial assistance as required by NJ OMB 15-08are fairly stated, in all material respects, in relation to the basic financial statements as a whole.
The introductory section and statistical data section has not been subject to the auditing proceduresapplied in the audit of the basic financial statements, and accordingly, we do not express an opinion orprovide any assurance on it.
Other Reporting Required by Government Auditing Standards
In accordance with Government Auditing Standards, we have also issued our report dated November 8,2019 on our consideration of the Borough of Englewood Cliffs Board of Education’s internal controlover financial reporting and on our tests of its compliance with certain provisions of laws, regulations,
-10-

Honorable President andMembers of the Board of EducationPage 4.
contracts, and grant agreements and other matters. The purpose of that report is to describe the scope ofour testing of internal control over financial reporting and compliance and the results of that testing, andnot to provide an opinion on internal control over financial reporting or on compliance. That report is an
integral part of an audit performed in accordance with Government Auditing Standards in consideringthe Borough of Englewood Cliffs Board of Education’s internal control over financial reporting andcompliance.
Steven D. Wielkotz, C.P.A.Licensed Public School AccountantNo. 816
FERRAIOLI, WIELKOTZ, CERULLO & CUVA, P.A.Certified Public AccountantsPompton Lakes, New Jersey
November 8, 2019
Steven D. Wielkotz
Ferraioli, Wielkotz, Cerullo & Cuva,P.A.
-11-

REQUIRED SUPPLEMENTARY
INFORMATION - PART I
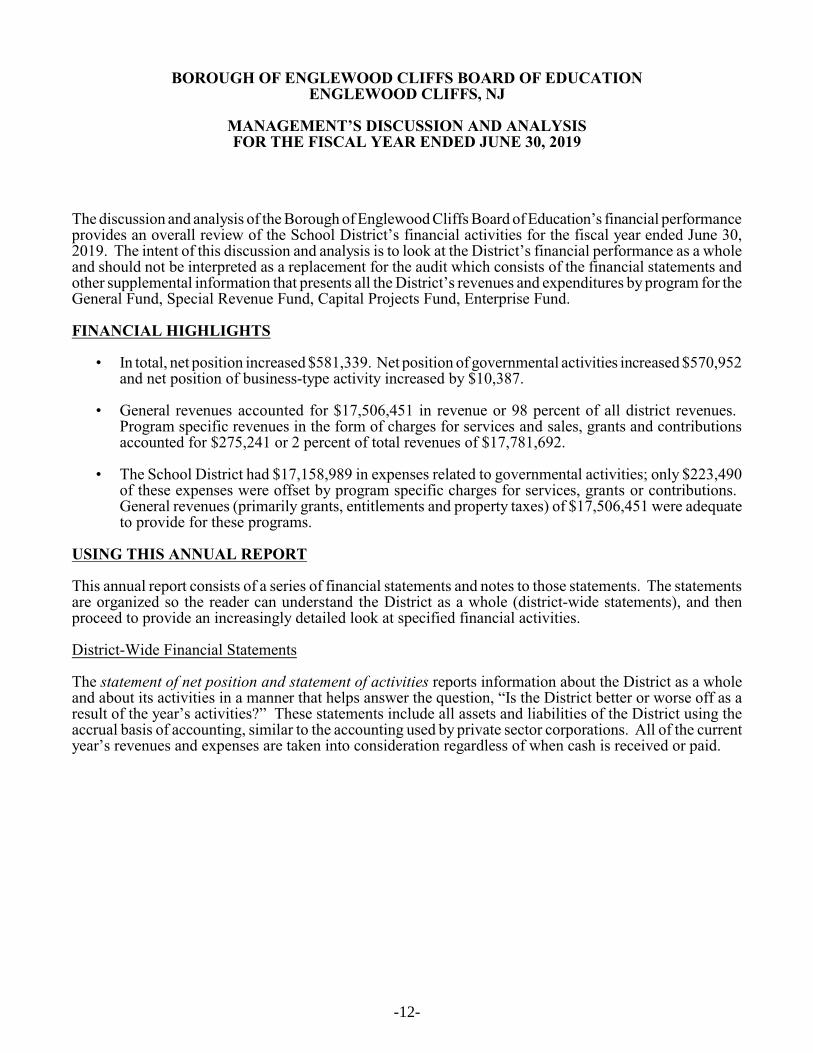
BOROUGH OF ENGLEWOOD CLIFFS BOARD OF EDUCATIONENGLEWOOD CLIFFS, NJ
MANAGEMENT’S DISCUSSION AND ANALYSISFOR THE FISCAL YEAR ENDED JUNE 30, 2019
The discussion and analysis of the Borough of Englewood Cliffs Board of Education’s financial performanceprovides an overall review of the School District’s financial activities for the fiscal year ended June 30,2019. The intent of this discussion and analysis is to look at the District’s financial performance as a wholeand should not be interpreted as a replacement for the audit which consists of the financial statements andother supplemental information that presents all the District’s revenues and expenditures by program for theGeneral Fund, Special Revenue Fund, Capital Projects Fund, Enterprise Fund.
FINANCIAL HIGHLIGHTS
• In total, net position increased $581,339. Net position of governmental activities increased $570,952and net position of business-type activity increased by $10,387.
• General revenues accounted for $17,506,451 in revenue or 98 percent of all district revenues. Program specific revenues in the form of charges for services and sales, grants and contributionsaccounted for $275,241 or 2 percent of total revenues of $17,781,692.
• The School District had $17,158,989 in expenses related to governmental activities; only $223,490of these expenses were offset by program specific charges for services, grants or contributions. General revenues (primarily grants, entitlements and property taxes) of $17,506,451 were adequateto provide for these programs.
USING THIS ANNUAL REPORT
This annual report consists of a series of financial statements and notes to those statements. The statementsare organized so the reader can understand the District as a whole (district-wide statements), and thenproceed to provide an increasingly detailed look at specified financial activities.
District-Wide Financial Statements
The statement of net position and statement of activities reports information about the District as a wholeand about its activities in a manner that helps answer the question, “Is the District better or worse off as aresult of the year’s activities?” These statements include all assets and liabilities of the District using theaccrual basis of accounting, similar to the accounting used by private sector corporations. All of the currentyear’s revenues and expenses are taken into consideration regardless of when cash is received or paid.
-12-

BOROUGH OF ENGLEWOOD CLIFFS BOARD OF EDUCATIONENGLEWOOD CLIFFS, NJ
MANAGEMENT’S DISCUSSION AND ANALYSISFOR THE FISCAL YEAR ENDED JUNE 30, 2019
(CONTINUED)
USING THIS ANNUAL REPORT, (continued)
Both of the district-wide financial statements distinguish functions of the Borough of Englewood CliffsBoard of Education that are principally supported by taxes and intergovernmental revenues (governmentalactivities) from other functions that are intended to recover all or a significant portion of their costs throughuser fees and charges (business-type activities).
In the Statement of Net Position and the Statement of Activities, the District is divided into two distinct kindsof activities:
C Governmental Activities – All of the school district’s programs and services are reported hereincluding instruction, support services, operation and maintenance of plant facilities, pupiltransportation and extracurricular activities.
C Business-type Activity – This service is provided on a charge for goods and services basis to recoverall the expenses of the goods or services provided. The Special Milk Fund, Invengineering Programand Enrichment Program are reported as business activities.
The two statements report the District’s net position and changes in them. The change in net position canbe utilized by a reader to assist in determining whether the District’s financial health is improving ordeteriorating. However, the reader should also consider non-financial factors such as property tax base,current New Jersey laws restricting revenue growth, student enrollment growth, facility conditions, requirededucational programs and other factors in determining the District’s overall financial health.
Fund Financial Statements
A fund is a grouping of related accounts that is used to maintain control over resources that have beensegregated for specific activities or objectives. The Borough of Englewood Cliffs Board of Education, likeother state and local governments, uses fund accounting to ensure and demonstrate compliance with finance-related legal requirements. All of the district’s funds can be divided into three categories: GovernmentalFunds, Proprietary Funds and Fiduciary Funds.
Governmental Funds
Governmental funds are used to account for essentially the same functions reported as governmentalactivities in the district-wide financial statements. However, unlike the district-wide financial statements,governmental fund financial statements focus on near-term inflows and outflows of spendable resources,as well as on balances of spendable resources available at the end of the fiscal year. These funds arereported using an accounting method called modified accrual accounting, which measures cash and all otherfinancial assets that can be readily converted to cash.
Because the focus of governmental funds is narrower than that of the district-wide financial statements, itis useful to compare the information presented for governmental funds with similar information presentedfor governmental activities in the district-wide financial statements. By doing so, readers may betterunderstand the long-term impact of the District’s near-term financing decisions. Both the governmental fundbalance sheet and the governmental fund statement of revenues, expenditures, and changes in fund balancesprovide a reconciliation to facilitate this comparison between governmental funds and governmentalactivities (reported in the Statement of Net Position and the Statement of Activities).
-13-

BOROUGH OF ENGLEWOOD CLIFFS BOARD OF EDUCATIONENGLEWOOD CLIFFS, NJ
MANAGEMENT’S DISCUSSION AND ANALYSISFOR THE FISCAL YEAR ENDED JUNE 30, 2019
(CONTINUED)
USING THIS ANNUAL REPORT, (continued)
The Borough of Englewood Cliffs Board of Education maintains four individual governmental funds. Information is presented separately in the governmental fund balance sheet and in the governmentalstatement of revenues, expenditures and changes in fund balances for the general, special revenue, capitalprojects funds, and debt service funds, which are both considered to be major funds.
The Borough of Englewood Cliffs Board of Education adopts annual appropriated budgets for itsgovernmental funds. A budgetary comparison statement has been provided for the general, special revenue,and debt service funds to demonstrate compliance with their budgets.
Proprietary Funds
Proprietary funds use the accrual basis of accounting, the same as on the district-wide statements, thereforethe statements will essentially match the business-type activities portion of the district-wide statements. TheBorough of Englewood Cliffs Board of Education uses proprietary funds to account for its special milk andenrichment programs.
Fiduciary Funds
Fiduciary funds are used to account for resources held for the benefit of parties outside the District. Theseactivities are excluded from the District’s other financial statements because the assets cannot be utilizedby the District to finance its operations.
Notes to the Financial Statements
The notes provide additional information that is essential to a full understanding of the data provided in thedistrict-wide and fund financial statements.
Other Information
In addition to the basic financial statements and accompanying notes, this report also presents certainrequired supplementary information concerning budgetary information for the District’s major funds.
Our auditor has provided assurance in his independent auditor’s report, located immediately preceding thisManagement’s Discussion and Analysis, that the Basic Financial Statements are fairly stated. Varyingdegrees of assurance are being provided by the auditor regarding the Required Supplemental Informationand the Supplemental Information identified above. A user of this report should read the independentauditor’s report carefully to ascertain the level of assurance being provided for each of the other parts in theFinancial Section.
-14-

BOROUGH OF ENGLEWOOD CLIFFS BOARD OF EDUCATIONENGLEWOOD CLIFFS, NJ
MANAGEMENT’S DISCUSSION AND ANALYSISFOR THE FISCAL YEAR ENDED JUNE 30, 2019
(CONTINUED)
DISTRICT-WIDE FINANCIAL ANALYSIS
The Statement of Net Position provides the perspective of the District as a whole. Net position may, over time,serve as a useful indicator of a government’s financial position.
The District’s financial position is the product of several financial transactions including the net results of activities,the acquisition and payment of debt, the acquisition and disposal of capital assets and the depreciation of capitalassets.
The School District’s net position was $2,724,007 at June 30, 2019. Restricted net position is reported separatelyto show legal constraints that limit the School District’s ability to use the net position for day-to-day operations. Our analysis below focuses on the net position (Table 1) and change in net position (Table 2) of the School District.
Table 1
Net PositionJune 30,
Governmental Activities Business-Type Activities Total
2019 2018 2019 2018 2019 2018
Assets
Current and Other Assets 3,354,311 3,451,904 36,694 32,885 3,391,005 3,484,789
Capital Assets 4,477,521 4,047,226 4,477,521 4,047,226
Total Assets 7,831,832 7,499,130 36,694 32,885 7,868,526 7,532,015
Deferred Outflows:
Deferred Outflows of Resources
Related to PERS 1,132,321 1,589,048 1,132,321 1,589,048
Total Deferred Outflows 1,132,321 1,589,048 1,132,321 1,589,048
Liabilities
Other Liabilities 351,772 376,098 215 6,793 351,987 382,891
Noncurrent Liabilities 4,723,606 5,701,115 4,723,606 5,701,115
Total Liabilities 5,075,378 6,077,213 215 6,793 5,075,593 6,084,006
Deferred Inflows:
Deferred Inflows of Resources
Related to PERS 1,201,247 894,389 1,201,247 894,389
Total Deferred Outflows 1,201,247 894,389 1,201,247 894,389
Net Position
Invested in Capital Assets 3,457,521 2,697,226 3,457,521 2,697,226
Restricted 2,901,400 3,058,563 2,901,400 3,058,563
Unrestricted (3,671,393) (3,639,213) 36,479 26,092 (3,634,914) (3,613,121)
Total Net Position 2,687,528 2,116,576 36,479 26,092 2,724,007 2,142,668
-15-

BOROUGH OF ENGLEWOOD CLIFFS BOARD OF EDUCATIONENGLEWOOD CLIFFS, NJ
MANAGEMENT’S DISCUSSION AND ANALYSISFOR THE FISCAL YEAR ENDED JUNE 30, 2019
(CONTINUED)
DISTRICT-WIDE FINANCIAL ANALYSIS, (continued)
Table 2
Changes in Net PositionYear Ended June 30,
Governmental Activities Business-Type Activities Total
2019 2018 2019 2018 2019 2018
Revenues
Program Revenues:
Charges for Services and Sales 49,372 47,403 49,372 47,403
Operating Grants and Contributions 223,490 315,064 2,379 2,469 225,869 317,533
General Revenues:
Taxes:
Property taxes, levied for general
purposes 13,222,907 12,963,634 13,222,907 12,963,634
Property taxes, levied for debt services 72,961 267,829 72,961 267,829
Federal and State Aid not Restricted 3,836,787 3,120,148 3,836,787 3,120,148
Federal and State Aid - Capital Outlay 16,900 16,900
Tuition Received 281,823 230,500 281,823 230,500
Miscellaneous Income 68,961 227,369 68,961 227,369
Investment Earnings 6,112 6,112
Total Revenues and Transfers 17,729,941 17,124,544 51,751 49,872 17,781,692 17,174,416
-16-

BOROUGH OF ENGLEWOOD CLIFFS BOARD OF EDUCATIONENGLEWOOD CLIFFS, NJ
MANAGEMENT’S DISCUSSION AND ANALYSISFOR THE FISCAL YEAR ENDED JUNE 30, 2019
(CONTINUED)
DISTRICT-WIDE FINANCIAL ANALYSIS, (continued)
Governmental Activities Business-Type Activities Total
2019 2018 2019 2018 2019 2018
Functions/Program Expenses
Instruction:
Regular 4,919,699 4,750,188 4,919,699 4,750,188
Special Education 1,057,777 1,118,449 1,057,777 1,118,449
Other Special Instruction 266,191 170,063 266,191 170,063
Other Instruction 107,589 14,891 107,589 14,891
Support Services:
Tuition 2,034,033 2,021,273 2,034,033 2,021,273
Student & Instruction Related Services 2,429,659 2,211,348 2,429,659 2,211,348
General Administrative Services 518,604 471,737 518,604 471,737
School Administrative Services 265,498 230,683 265,498 230,683
Central Administration 316,508 264,369 316,508 264,369
Administrative Information Technology 88,332 172,582 88,332 172,582
Plant Operations and Maintenance 1,140,487 1,051,907 1,140,487 1,051,907
Pupil Transportation 977,629 928,621 977,629 928,621
Unallocated Benefits 2,630,128 2,998,814 2,630,128 2,998,814
Capital Outlay - nondepreciable 21,025 202,379 21,025 202,379
Food Service 3,916 3,815 3,916 3,815
Enrichment Program: 37,448 40,542 37,448 40,542
Debt Service:
Interest and Other Charges 18,042 4,771 18,042 4,771
Bond Issuance Costs 0 0
Unallocated Depreciation 367,788 320,396 367,788 320,396
Total Expenses 17,158,989 16,932,471 41,364 44,357 17,200,353 16,976,828
Increase or (Decrease) in
Net Position 570,952 192,073 10,387 5,515 581,339 197,588
-17-

BOROUGH OF ENGLEWOOD CLIFFS BOARD OF EDUCATIONENGLEWOOD CLIFFS, NJ
MANAGEMENT’S DISCUSSION AND ANALYSISFOR THE FISCAL YEAR ENDED JUNE 30, 2019
(CONTINUED)
DISTRICT-WIDE FINANCIAL ANALYSIS, (continued)
Governmental and Business- Activities
As reported in the Statement of Activities the cost of all of our governmental and business-type activitiesthis year was $17,200,353. However, the amount that our taxpayers ultimately financed for these activitiesthrough School District taxes was only $13,295,868 because some of the cost was paid by those whobenefitted from the programs $49,372 by other governments and organizations who subsidized certainprograms with grants and contributions $225,869, unrestricted federal and state aid $3,836,787, restrictedfederal and state aid $16,900, tuition $281,823, and by miscellaneous sources of $75,073.
Revenues for the District’s business-type activities (special milk and enrichment programs) were comprisedof charges for services and federal and state subsidy reimbursements. Significant financial results includethe following:
T Special milk, enrichment and Invengineering program revenues exceeded expenses by $10,387.
T Charges for services provided totaled $49,372. This represents amounts paid by consumers for dailymilk purchases, tuition payments and program fees.
T Federal and state reimbursement for milks served was $2,379.
MAJOR GOVERNMENTAL FUNDS BUDGETING AND OPERATING HIGHLIGHTS
The School District’s budgets are prepared according to New Jersey law, and are based on accounting forcertain transactions on a basis of cash receipts, disbursements and encumbrances. The most significantbudgeted funds are the general fund and the special revenue fund.
During the fiscal year ended June 30, 2019, the School District amended the budgets of these majorgovernmental funds several times. Revisions in the budget were made to recognize revenues that were notanticipated and to prevent over-expenditures in specific line item accounts. Several of these revisions bearnotation:
C TPAF, which is the state’s contribution to the pension fund, is neither a revenue item nor anexpenditures item to the district but is required to be reflected in the financial statements.
C The special revenue fund was increased by $83,972 for increases in federal and state grant awards.
General Fund
The general fund actual revenue was 15,909,272. That amount is $1,663,513 above the final amendedbudget of $14,245,759. The variance between the actual revenues and final budget was the result of non-budgeted on-behalf payments of $1,613,450 for TPAF social security reimbursements and on-behalf pensionpayments, $(28,694) for extraordinary state aid not received, $30,711 in additional other unrestricted stateaid, and $48,046 in excess miscellaneous anticipated revenues.
-18-
BOROUGH OF ENGLEWOOD CLIFFS BOARD OF EDUCATIONENGLEWOOD CLIFFS, NJ
MANAGEMENT’S DISCUSSION AND ANALYSISFOR THE FISCAL YEAR ENDED JUNE 30, 2019
(CONTINUED)
MAJOR GOVERNMENTAL FUNDS BUDGETING AND OPERATING HIGHLIGHTS, (continued)
General Fund, (continued)
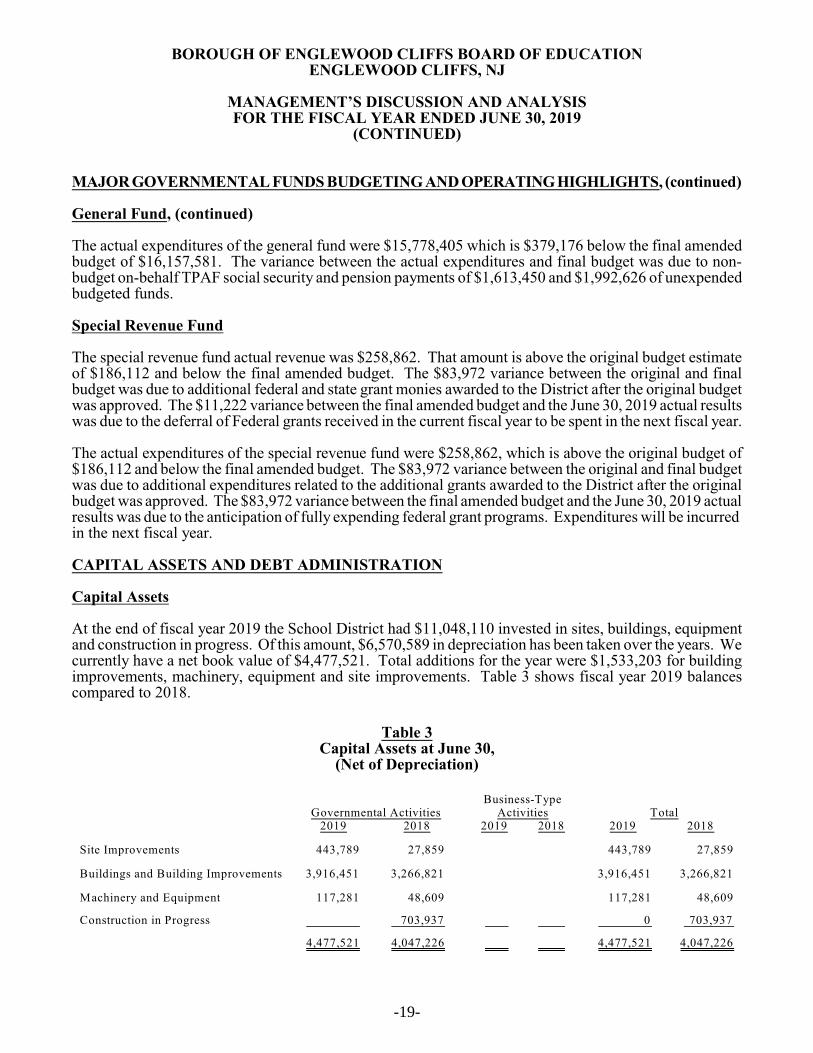
The actual expenditures of the general fund were $15,778,405 which is $379,176 below the final amendedbudget of $16,157,581. The variance between the actual expenditures and final budget was due to non-budget on-behalf TPAF social security and pension payments of $1,613,450 and $1,992,626 of unexpendedbudgeted funds.
Special Revenue Fund
The special revenue fund actual revenue was $258,862. That amount is above the original budget estimateof $186,112 and below the final amended budget. The $83,972 variance between the original and finalbudget was due to additional federal and state grant monies awarded to the District after the original budgetwas approved. The $11,222 variance between the final amended budget and the June 30, 2019 actual resultswas due to the deferral of Federal grants received in the current fiscal year to be spent in the next fiscal year.
The actual expenditures of the special revenue fund were $258,862, which is above the original budget of$186,112 and below the final amended budget. The $83,972 variance between the original and final budgetwas due to additional expenditures related to the additional grants awarded to the District after the originalbudget was approved. The $83,972 variance between the final amended budget and the June 30, 2019 actualresults was due to the anticipation of fully expending federal grant programs. Expenditures will be incurred in the next fiscal year.
CAPITAL ASSETS AND DEBT ADMINISTRATION
Capital Assets
At the end of fiscal year 2019 the School District had $11,048,110 invested in sites, buildings, equipmentand construction in progress. Of this amount, $6,570,589 in depreciation has been taken over the years. Wecurrently have a net book value of $4,477,521. Total additions for the year were $1,533,203 for buildingimprovements, machinery, equipment and site improvements. Table 3 shows fiscal year 2019 balancescompared to 2018.
Table 3Capital Assets at June 30,
(Net of Depreciation)
Governmental ActivitiesBusiness-Type
Activities Total2019 2018 2019 2018 2019 2018
Site Improvements 443,789 27,859 443,789 27,859
Buildings and Building Improvements 3,916,451 3,266,821 3,916,451 3,266,821
Machinery and Equipment 117,281 48,609 117,281 48,609
Construction in Progress 703,937 0 703,937
4,477,521 4,047,226 4,477,521 4,047,226
-19-

BOROUGH OF ENGLEWOOD CLIFFS BOARD OF EDUCATIONENGLEWOOD CLIFFS, NJ
MANAGEMENT’S DISCUSSION AND ANALYSISFOR THE FISCAL YEAR ENDED JUNE 30, 2019
(CONTINUED)
Debt Administration
At June 30, 2019, the district had $4,723,606 of outstanding debt. Of this amount, $351,483 is forcompensated absences, $1,020,000 in school bonds payable, and $3,352,123 is for the net pension liability.
Table 4Outstanding Serial Bonds at June 30,
2019 2018
2017 School Refunding Bonds 1,020,000 1,350,000
ECONOMIC FACTORS AND NEXT YEAR’S BUDGETS
Due to the current state of the economy in New Jersey and across the country, our economic outlook is notas bright as we would hope. This economic reality will have an impact on our ability to advance ourprogram and educational goals. These factors will be considered in preparing the Borough of EnglewoodCliffs Board of Education’s budget for the 2019-2020 fiscal year.
REQUESTS FOR INFORMATION
This financial report is designed to provide a general overview of the Borough of Englewood Cliffs Boardof Education’s finances for all those with an interest in the government’s finances. Questions concerningany of the information provided in this report or requests for additional information should be addressed to:
Sue Anne MatherSchool Business Administrator/Board SecretaryBorough of Englewood Cliffs Board of Education143 Charlotte PlaceEnglewood Cliffs, New Jersey 07632
-20-

BASIC FINANCIAL STATEMENTS

DISTRICT-WIDE FINANCIAL STATEMENTS
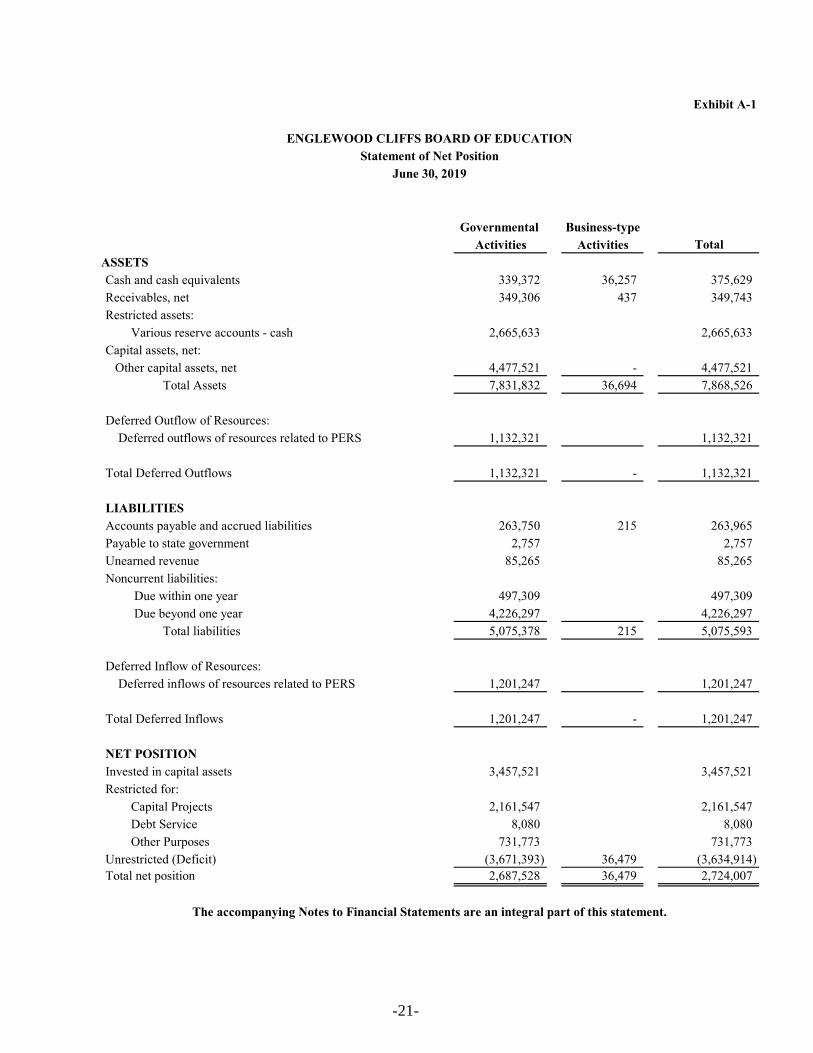
Exhibit A-1
Governmental Business-typeActivities Activities Total
ASSETSCash and cash equivalents 339,372 36,257 375,629 Receivables, net 349,306 437 349,743 Restricted assets: Various reserve accounts - cash 2,665,633 2,665,633 Capital assets, net: Other capital assets, net 4,477,521 - 4,477,521 Total Assets 7,831,832 36,694 7,868,526
Deferred Outflow of Resources: Deferred outflows of resources related to PERS 1,132,321 1,132,321
Total Deferred Outflows 1,132,321 - 1,132,321
LIABILITIESAccounts payable and accrued liabilities 263,750 215 263,965 Payable to state government 2,757 2,757 Unearned revenue 85,265 85,265 Noncurrent liabilities: Due within one year 497,309 497,309 Due beyond one year 4,226,297 4,226,297 Total liabilities 5,075,378 215 5,075,593
Deferred Inflow of Resources: Deferred inflows of resources related to PERS 1,201,247 1,201,247
Total Deferred Inflows 1,201,247 - 1,201,247
NET POSITIONInvested in capital assets 3,457,521 3,457,521 Restricted for: Capital Projects 2,161,547 2,161,547 Debt Service 8,080 8,080 Other Purposes 731,773 731,773 Unrestricted (Deficit) (3,671,393) 36,479 (3,634,914) Total net position 2,687,528 36,479 2,724,007
The accompanying Notes to Financial Statements are an integral part of this statement.
ENGLEWOOD CLIFFS BOARD OF EDUCATIONStatement of Net Position
June 30, 2019
-21-

Exhi
bit A
-2
Net
(Exp
ense
) Rev
enue
and
Prog
ram
Rev
enue
s C
hang
es in
Net
Pos
ition
Indi
rect
O
pera
ting
Cap
ital
Expe
nses
Cha
rges
for
Gra
nts a
ndG
rant
s and
G
over
nmen
tal
Bus
ines
s-ty
peFu
nctio
ns/P
rogr
ams
Expe
nses
Allo
catio
nSe
rvic
esC
ontr
ibut
ions
Con
trib
utio
nsA
ctiv
ities
Act
iviti
esTo
tal
G
over
nmen
tal a
ctiv
ities
:
In
stru
ctio
n:
Regu
lar
3,60
5,80
0
1,
313,
899
151,
044
(4
,768
,655
)
(4
,768
,655
)
Spec
ial e
duca
tion
748,
234
30
9,54
3
(1,0
57,7
77)
(1,0
57,7
77)
O
ther
spec
ial i
nstru
ctio
n18
1,85
6
84,3
35
(2
66,1
91)
(2
66,1
91)
Oth
er in
stru
ctio
n83
,740
23,8
49
(1
07,5
89)
(1
07,5
89)
Su
ppor
t ser
vice
s:
Tuiti
on2,
034,
033
(2,0
34,0
33)
(2,0
34,0
33)
St
uden
t & in
stru
ctio
n re
late
d se
rvic
es1,
825,
205
604,
454
72
,446
(2,3
57,2
13)
(2,3
57,2
13)
Sc
hool
adm
inist
rativ
e se
rvic
es19
0,97
4
74,5
24
(2
65,4
98)
(2
65,4
98)
Gen
eral
adm
inist
rativ
e se
rvic
es42
4,89
8
93,7
06
(5
18,6
04)
(5
18,6
04)
Cent
ral s
ervi
ces
233,
045
83
,463
(316
,508
)
(316
,508
)
A
dmin
istra
tive
info
. tec
h. se
rvic
es86
,241
2,09
1
(88,
332)
(88,
332)
Pl
ant o
pera
tions
and
mai
nten
ance
914,
817
22
5,67
0
(1,1
40,4
87)
(1,1
40,4
87)
Pu
pil t
rans
porta
tion
950,
484
27
,145
(977
,629
)
(977
,629
)
U
nallo
cate
d be
nefit
s2,
630,
128
(2,6
30,1
28)
(2,6
30,1
28)
Ca
pita
l Out
lay
- non
-dep
reci
able
21,0
25
(2
1,02
5)
(2
1,02
5)
D
ebt S
ervi
ces:
In
tere
st a
nd o
ther
Cha
rges
18,0
42
(1
8,04
2)
(1
8,04
2)
U
nallo
cate
d de
prec
iatio
n36
7,78
8
(367
,788
)
(367
,788
)
T
otal
gov
ernm
enta
l act
iviti
es13
,948
,522
3,21
0,46
7
-
223,
490
-
(1
6,93
5,49
9)
-
(16,
935,
499)
Bu
sines
s-ty
pe a
ctiv
ities
:
Sp
ecia
l Milk
Fun
d3,
916
2,
393
2,
379
85
6
85
6
In
veng
inee
ring
Prog
ram
3,15
0
3,15
0
-
-
Enric
hmen
t Pro
gram
34,2
98
43
,829
9,
531
9,
531
Tot
al b
usin
ess-
type
act
iviti
es41
,364
49,3
72
2,37
9
-
-
10,3
87
10
,387
Tota
l prim
ary
gove
rnm
ent
13,9
89,8
86
49
,372
22
5,86
9
-
(16,
935,
499)
10
,387
(16,
925,
112)
Gen
eral
reve
nues
:Ta
xes:
Pr
oper
ty ta
xes,
levi
ed fo
r gen
eral
pur
pose
s13
,222
,907
13,2
22,9
07
Prop
erty
taxe
s, le
vied
for d
ebt s
ervi
ces
72,9
61
72
,961
Fede
ral a
nd S
tate
aid
not
rest
ricte
d 3,
836,
787
3,83
6,78
7
Fe
dera
l and
Sta
te a
id -
Capi
tal O
utla
y16
,900
16,9
00
In
vest
men
t Ear
ning
s6,
112
6,
112
Tu
ition
281,
823
28
1,82
3
Misc
ella
neou
s inc
ome
68,9
61
68
,961
T
otal
gen
eral
reve
nues
, spe
cial
item
s, ex
traor
dina
ry it
ems a
nd tr
ansf
ers
17,5
06,4
51
-
17
,506
,451
Ch
ange
in N
et P
ositi
on57
0,95
2
10,3
87
58
1,33
9
Net
Pos
ition
—be
ginn
ing
2,11
6,57
6
26
,092
2,14
2,66
8
N
et P
ositi
on—
endi
ng2,
687,
528
36,4
79
2,
724,
007
ENG
LEW
OO
D C
LIFF
S B
OA
RD
OF
EDU
CA
TIO
NSt
atem
ent o
f Act
iviti
esFi
scal
Yea
r En
ded
June
30,
201
9
The
acco
mpa
nyin
g N
otes
to F
inan
cial
Sta
tem
ents
are
an
inte
gral
par
t of t
his s
tate
men
t.
-22-

FUND FINANCIAL STATEMENTS
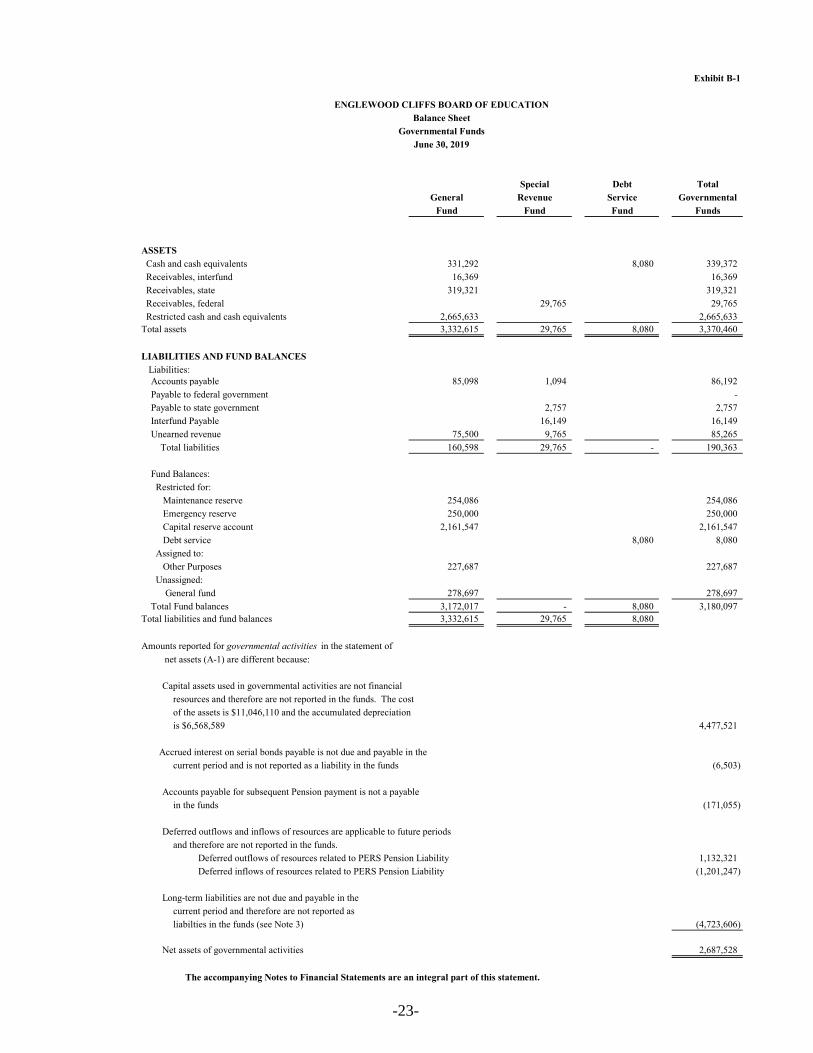
Exhibit B-1
Special Debt TotalGeneral Revenue Service Governmental
Fund Fund Fund Funds
ASSETS Cash and cash equivalents 331,292 8,080 339,372 Receivables, interfund 16,369 16,369 Receivables, state 319,321 319,321 Receivables, federal 29,765 29,765 Restricted cash and cash equivalents 2,665,633 2,665,633 Total assets 3,332,615 29,765 8,080 3,370,460
LIABILITIES AND FUND BALANCES Liabilities: Accounts payable 85,098 1,094 86,192 Payable to federal government - Payable to state government 2,757 2,757 Interfund Payable 16,149 16,149 Unearned revenue 75,500 9,765 85,265 Total liabilities 160,598 29,765 - 190,363
Fund Balances: Restricted for: Maintenance reserve 254,086 254,086 Emergency reserve 250,000 250,000 Capital reserve account 2,161,547 2,161,547 Debt service 8,080 8,080 Assigned to: Other Purposes 227,687 227,687 Unassigned: General fund 278,697 278,697 Total Fund balances 3,172,017 - 8,080 3,180,097 Total liabilities and fund balances 3,332,615 29,765 8,080
Amounts reported for governmental activities in the statement of net assets (A-1) are different because:
Capital assets used in governmental activities are not financialresources and therefore are not reported in the funds. The cost of the assets is $11,046,110 and the accumulated depreciation is $6,568,589 4,477,521
Accrued interest on serial bonds payable is not due and payable in thecurrent period and is not reported as a liability in the funds (6,503)
Accounts payable for subsequent Pension payment is not a payablein the funds (171,055)
Deferred outflows and inflows of resources are applicable to future periodsand therefore are not reported in the funds.
Deferred outflows of resources related to PERS Pension Liability 1,132,321 Deferred inflows of resources related to PERS Pension Liability (1,201,247)
Long-term liabilities are not due and payable in thecurrent period and therefore are not reported asliabilties in the funds (see Note 3) (4,723,606)
Net assets of governmental activities 2,687,528
ENGLEWOOD CLIFFS BOARD OF EDUCATIONBalance Sheet
Governmental FundsJune 30, 2019
The accompanying Notes to Financial Statements are an integral part of this statement.
-23-
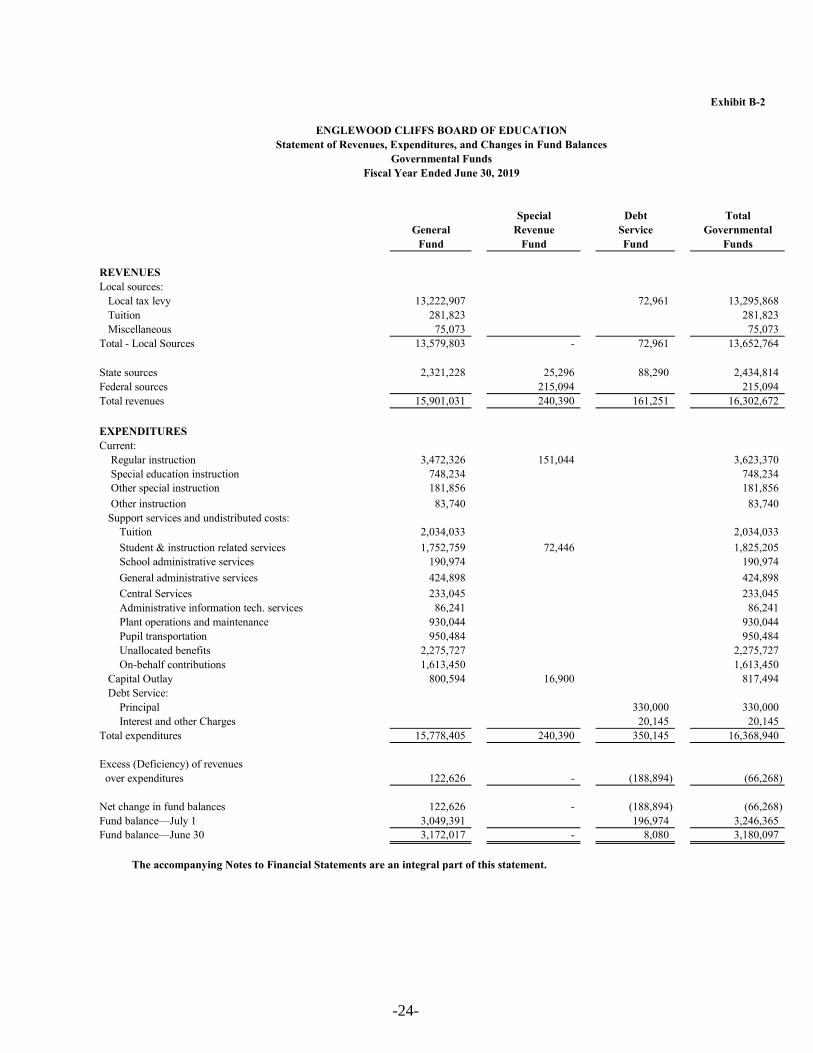
Exhibit B-2
Special Debt TotalGeneral Revenue Service Governmental
Fund Fund Fund Funds
REVENUESLocal sources: Local tax levy 13,222,907 72,961 13,295,868 Tuition 281,823 281,823 Miscellaneous 75,073 75,073 Total - Local Sources 13,579,803 - 72,961 13,652,764
State sources 2,321,228 25,296 88,290 2,434,814 Federal sources 215,094 215,094 Total revenues 15,901,031 240,390 161,251 16,302,672
EXPENDITURESCurrent: Regular instruction 3,472,326 151,044 3,623,370 Special education instruction 748,234 748,234 Other special instruction 181,856 181,856 Other instruction 83,740 83,740 Support services and undistributed costs: Tuition 2,034,033 2,034,033 Student & instruction related services 1,752,759 72,446 1,825,205 School administrative services 190,974 190,974 General administrative services 424,898 424,898 Central Services 233,045 233,045 Administrative information tech. services 86,241 86,241 Plant operations and maintenance 930,044 930,044 Pupil transportation 950,484 950,484 Unallocated benefits 2,275,727 2,275,727 On-behalf contributions 1,613,450 1,613,450 Capital Outlay 800,594 16,900 817,494 Debt Service: Principal 330,000 330,000 Interest and other Charges 20,145 20,145 Total expenditures 15,778,405 240,390 350,145 16,368,940
Excess (Deficiency) of revenues over expenditures 122,626 - (188,894) (66,268)
Net change in fund balances 122,626 - (188,894) (66,268) Fund balance—July 1 3,049,391 196,974 3,246,365 Fund balance—June 30 3,172,017 - 8,080 3,180,097
ENGLEWOOD CLIFFS BOARD OF EDUCATIONStatement of Revenues, Expenditures, and Changes in Fund Balances
Governmental FundsFiscal Year Ended June 30, 2019
The accompanying Notes to Financial Statements are an integral part of this statement.
-24-

Exhibit B-3
Total net change in fund balances - governmental funds (from B-2) (66,268)
Amounts reported for governmental activities in the statementof activities (A-2) are different because:
Capital outlays are reported in governmental funds as expenditures. However, in the statement of activities, the cost of those assets is allocated over their estimated useful lives as depreciation expense. This is the amount by which capital outlays exceeded depreciation in the period.
Depreciation expense (398,971)Depreciable Capital outlays - Fund 11 32,797Depreciable Capital outlays - Fund 12 779,569Depreciable Capital outlays - Fund 20 16,900
430,295
Repayment of long-term debt is reported as an expenditure in the governmental funds, but the repayment reduces long-term liabilities in the statement of net assets and is not reported in the statement of activities. In the current year, these amounts consist of: Principal payment on serial bonds 330,000
In the statement of activities, interest on long-term debt is accrued, regardless of when due. In the governmental funds, interest is reported when due. The accrued interest is a subtraction in the reconciliation.(-) General Bond Obligations - Prior Year 8,606 General Bond Obligations (6,503)
2,103In the statement of activities, certain operating expenses, e.g., compensated absences (vacations) are measured by the amounts earned during the year. In the governmental funds, however, expenditures for these items are reported in the amount of financial resources used (paid). When the earned amount exceeds the paid amount, the difference is reduction in the reconciliation (-); when the paid amount exceeds the earned amount the difference is an addition to the reconciliation (+).
Decrease in compensated absences payable 9,885
District pension contributions are reported as expenditures in the governmental funds when made. However, per GASB No. 68 they are reported as deferred outflows of resources in the Statement of Net Position because the reported net pension liability is measured a year before the District's report date. Pension expense, which is the change in the net pension liability adjusted for changed in deferred outflows and inflows of resources related to pensions, is reported in the Statement of Activities.
District Pension Contributions 169,343Less: Pension Expense (304,406)
(Increase)/Decrease in Pension Expense (135,063)
Per GASB No. 68, Non-employer contributing entities are required to record any increases in revenue and expense for On-behalf TPAF pension payments paid by the State of New Jersey on the Statement of Activities that are in excess of those amounts reported in the fund financial statements.
Increase in On-behalf State Aid TPAF Pension 807,686Increase in On-behalf TPAF Pension Expense (807,686)
Per GASB No. 75 Non-employer contributing entities are required to record an increases in revenue and expense for On-behalf TPAF post employment medical payments paid by the State of New Jersey on the Statement of Activities that are in excess of those amounts reported in the fund financial statements
Increase in On-behalf State Aid TPAF Post Employment Medical Revenue 619,583Increase in On-behalf State Aid TPAF Post Employment Medical Expense (619,583)
570,952
The accompanying Notes to Financial Statements are an integral part of this statement.
ENGLEWOOD CLIFFS BOARD OF EDUCATIONReconciliation of the Statement of Revenues, Expenditures,
and Changes in Fund Balances of Governmental Fundsto the Statement of Activities
Fiscal Year Ended June 30, 2019
-25-

Exhibit B-4
Special Milk EnrichmentProgram Program Totals
ASSETS
Current assets:Cash and cash equivalents 1,930 34,327 36,257 Accounts receivable:
Federal 437 437 Total current assets 2,367 34,327 36,694
Noncurrent assets:Capital assets: Equipment 2,000 2,000 Less accumulated depreciation (2,000) (2,000) Total capital assets (net of accumulated depreciation) - - - Total assets 2,367 34,327 36,694
LIABILITIES
Current liabilities:Accounts Payable 215 - 215 Total current liabilities 215 - 215
NET POSITION
Unrestricted 2,152 34,327 36,479 Total net position 2,152 34,327 36,479
The accompanying Notes to Financial Statements are an integral part of this statement.
ENGLEWOOD CLIFFS BOARD OF EDUCATIONStatement of Net Position
Proprietary FundsJune 30, 2019
-26-

Exh
ibit
B-5
Spec
ial M
ilkE
nric
hmen
tIn
veng
inee
ring
Prog
ram
Prog
ram
Prog
ram
Tot
als
Ope
ratin
g re
venu
es:
Cha
rges
for s
ervi
ces:
D
aily
sale
s - re
imbu
rsab
le p
rogr
ams
2,39
3
2,
393
Tu
ition
Cha
rges
43
,829
3,15
046
,979
Tot
al o
pera
ting
reve
nues
2,39
3
43
,829
3,15
0
49
,372
Ope
ratin
g ex
pens
es:
Cos
t of s
ales
- re
imbu
rsab
le p
rogr
ams
3,91
6
3,
916
Sala
ries a
nd w
ages
33,4
372,
420
35,8
57
Su
pplie
s and
mat
eria
ls86
173
01,
591
Tot
al O
pera
ting
Expe
nses
3,91
6
34
,298
3,15
0
41
,364
Ope
ratin
g in
com
e (lo
ss)
(1,5
23)
9,53
1
-
8,
008
Non
oper
atin
g re
venu
es (e
xpen
ses)
:Fe
dera
l sou
rces
:
Spec
ial m
ilk p
rogr
am2,
379
-
2,37
9
T
otal
non
oper
atin
g re
venu
es (e
xpen
ses)
2,37
9
-
-
2,
379
In
com
e (lo
ss) b
efor
e co
ntrib
utio
ns &
tran
sfer
s85
6
9,53
1
10
,387
C
hang
e in
net
pos
ition
856
9,
531
10,3
87
To
tal n
et p
ositi
on-b
egin
ning
1,29
6
24
,796
26,0
92
To
tal n
et p
ositi
on—
endi
ng2,
152
34,3
27
-
36
,479
The
acc
ompa
nyin
g N
otes
to F
inan
cial
Sta
tem
ents
are
an
inte
gral
par
t of t
his s
tate
men
t.
EN
GL
EW
OO
D C
LIF
FS B
OA
RD
OF
ED
UC
AT
ION
Stat
emen
t of R
even
ues,
Exp
ense
s, an
d C
hang
es in
Fun
d N
et P
ositi
onPr
opri
etar
y Fu
nds
Fisc
al Y
ear
End
ed J
une
30, 2
019
-27-

Exh
ibit
B-6
Spec
ial M
ilkE
nric
hmen
tIn
veng
inee
ring
Prog
ram
Prog
ram
Prog
ram
Tot
als
CA
SH F
LO
WS
FRO
M O
PER
AT
ING
AC
TIV
ITIE
SR
ecei
pts f
rom
cus
tom
ers
2,39
3
43
,829
3,15
0
46,2
22
Paym
ents
for m
ilk p
urch
ases
(4,4
29)
(4
,429
)
Paym
ents
for s
alar
ies a
nd w
ager
s(3
3,43
7)
(2,4
20)
(33,
437)
Paym
ents
for u
tiliti
es(6
,065
)
Pa
ymen
ts fo
r sup
plie
s(8
61)
(7
30)
(8
61)
N
et c
ash
prov
ided
by
(use
d fo
r) op
erat
ing
activ
ities
(2,0
36)
3,46
6
-
7,
495
CA
SH F
LO
WS
FRO
M N
ON
CA
PIT
AL
FIN
AN
CIN
G A
CT
IVIT
IES
Fede
ral s
ourc
es2,
459
-
-
2,45
9
N
et c
ash
prov
ided
by
(use
d fo
r) no
n-ca
pita
l fin
anci
ng a
ctiv
ities
2,45
9
-
-
2,
459
N
et in
crea
se (d
ecre
ase)
in c
ash
and
cash
equ
ival
ents
423
3,
466
-
3,88
9
Bala
nces
—be
ginn
ing
of y
ear
1,50
7
30
,861
-
32,3
68
Bala
nces
—en
d of
yea
r1,
930
34,3
27
-
36
,257
Rec
onci
liatio
n of
ope
ratin
g in
com
e (lo
ss) t
o ne
t cas
h pr
ovid
ed
(use
d) b
y op
erat
ing
activ
ities
:
Ope
ratin
g in
com
e (lo
ss)
(1,5
23)
9,
531
-
8,00
8
A
djus
tmen
ts to
reco
ncile
ope
ratin
g in
com
e (lo
ss) t
o ne
t cas
h pr
ovid
ed b
y-
(us
ed fo
r) op
erat
ing
activ
ities
-
I
ncre
ase
(dec
reas
e) in
acc
ount
s pay
able
(513
)
(6
,065
)
(6
,578
)
Tota
l adj
ustm
ents
(513
)
(6
,065
)
-
(6
,578
)
Net
cas
h pr
ovid
ed b
y (u
sed
for)
oper
atin
g ac
tiviti
es(2
,036
)
3,46
6
-
1,
430
The
acc
ompa
nyin
g N
otes
to F
inan
cial
Sta
tem
ents
are
an
inte
gral
par
t of t
his s
tate
men
t.
EN
GL
EW
OO
D C
LIF
FS B
OA
RD
OF
ED
UC
AT
ION
Stat
emen
t of C
ash
Flow
sPr
opri
etar
y Fu
nds
Fisc
al Y
ear
End
ed J
une
30, 2
019
-28-
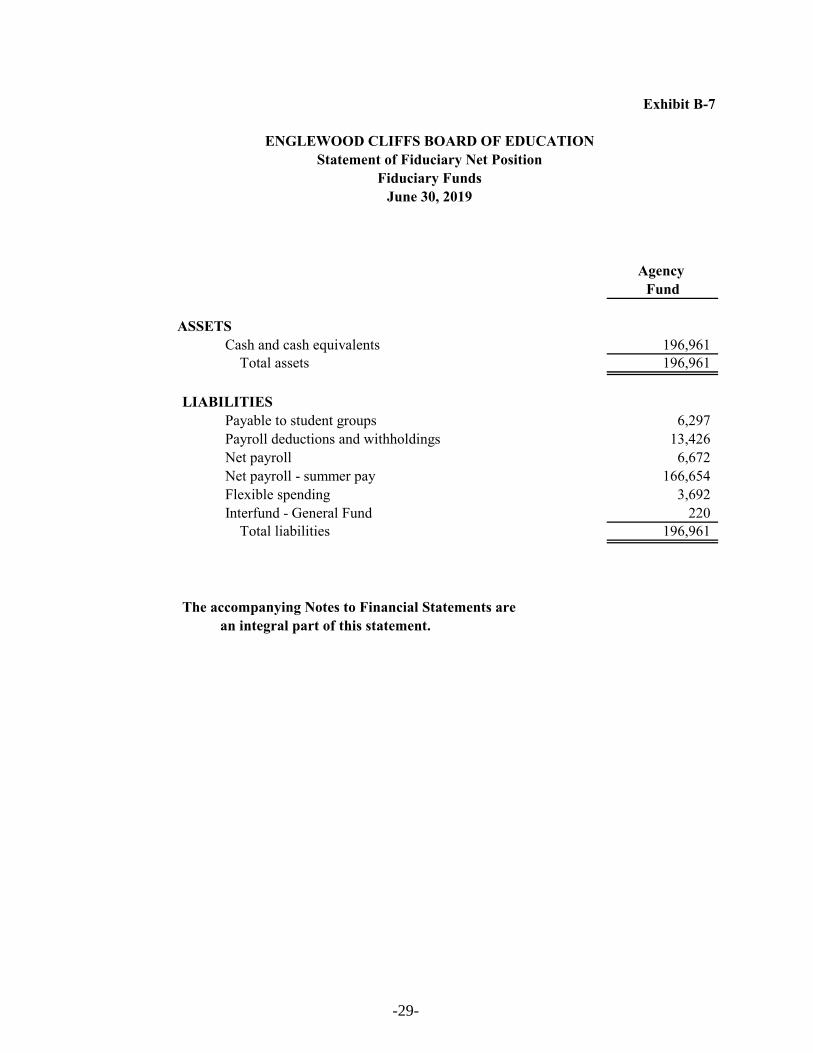
Exhibit B-7
Agency Fund
ASSETSCash and cash equivalents 196,961 Total assets 196,961
LIABILITIES Payable to student groups 6,297 Payroll deductions and withholdings 13,426 Net payroll 6,672 Net payroll - summer pay 166,654 Flexible spending 3,692 Interfund - General Fund 220 Total liabilities 196,961
an integral part of this statement.
ENGLEWOOD CLIFFS BOARD OF EDUCATIONStatement of Fiduciary Net Position
Fiduciary FundsJune 30, 2019
The accompanying Notes to Financial Statements are
-29-

NOTES TO THE FINANCIAL STATEMENTS

Borough of Englewood Cliffs School DistrictNotes to the Basic Financial Statementsfor the fiscal year ended June 30, 2019
NOTE 1. SUMMARY OF SIGNIFICANT ACCOUNTING POLICIES
The financial statements of the Board of Education of the Borough of Englewood Cliffs School District havebeen prepared in conformity with accounting principles generally accepted in the United States of America(GAAP) as applied to governmental units. The Governmental Accounting Standards Board (GASB) is theaccepted standard-setting body for establishing governmental accounting and financial reporting principles. The more significant of the board’s accounting policies are described below.
A. Description of the School District and Reporting Entity:
The Board of Education (“Board”) of the Borough of Englewood Cliffs School District (“District”) is aninstrumentality of the State of New Jersey, established to function as an educational institution. TheBorough of Englewood Cliffs School District is a Type II district located in the County of Bergen, State ofNew Jersey. As a Type II district, the School District functions independently through a Board of Education. The board is comprised of nine members elected to three-year terms. The purpose of the District is toeducate students in grades K-8. A superintendent is appointed by the Board and is responsible for theadministrative control of the District. Under existing statutes, the Board’s duties and powers include, butare not limited to, the development and adoption of a school program; the establishment, organization andoperation of schools; and the acquisition, maintenance and disposition of school property.
The Board also has broad financial responsibilities, including the approval of the annual budget and theestablishment of a system of accounting and budgetary controls.
Governmental Accounting Standards Board publication, Codification of Governmental Accounting andFinancial Reporting Standards, Section 2100, “Defining the Financial Reporting Entity” establishesstandards to determine whether a governmental component unit should be included in the financial reportingentity. The basic criterion for inclusion or exclusion from the financial reporting entity is the exercise ofoversight responsibility over agencies, boards and commissions by the primary government. The exerciseof oversight responsibility includes financial interdependency and a resulting financial benefit or burdenrelationship, selection of governing authority, designation of management, ability to significantly influenceoperations, and accountability for fiscal matters. In addition, certain legally separate, tax-exempt entitiesthat meet specific criteria (i.e. benefit of economic resources, access/entitlement to economic resources, andsignificance) should be included in the financial reporting entity. The combined financial statements includeall funds of the District over which the Board exercises operating control. The operations of the Districtinclude elementary schools and a middle school, located in the Borough of Englewood Cliffs. There wereno additional entities required to be included in the reporting entity under the criteria as described above,in the current fiscal year. Furthermore, the District is not includable in any other reporting entity on the basisof such criteria.
-30-

Borough of Englewood Cliffs School DistrictNotes to the Basic Financial Statementsfor the fiscal year ended June 30, 2019
NOTE 1. SUMMARY OF SIGNIFICANT ACCOUNTING POLICIES, (continued)
B. Basis of Presentation:
The Board’s basic financial statements consist of District-wide statements, including a statement of netposition and a statement of activities, and fund financial statements which provide a more detailed level offinancial information.
District-wide Financial Statements:
The statement of net position and the statement of activities display information about the Board as a whole. These statements include the financial activities of the overall District, except for the fiduciary funds. Thestatements distinguish between those activities of the Board that are governmental and those that areconsidered business-type activities.
The statement of net position presents the financial condition of the governmental and business-typeactivities of the Board at year-end. The statement of activities presents a comparison between directexpenses and program revenues for each program or function of the governmental activities and for thebusiness-type activities of the Board. Direct expenses are those that are specifically associated with aservice, program or department and therefore clearly identifiable to a particular function. Program revenuesinclude charges paid by the recipient of the goods or services offered by the program, grants andcontributions that are restricted to meeting the operational or capital requirements of a particular program. Revenues which are not classified as program revenues are presented as general revenues of the Board, withcertain limited exceptions. The comparison of direct expenses with program revenues identifies the extentto which each business segment or governmental function is self-financing or draws from the generalrevenues of the Board.
Fund Financial Statements:
During the fiscal year, the School District segregates transactions related to certain School District functionsor activities in separate funds in order to aid financial management and to demonstrate legal compliance. The fund financial statements provide information about the District’s funds, including its fiduciary funds. Separate statements for each fund category - government, proprietary, and fiduciary - are presented. TheNew Jersey Department of Education (NJDOE) has elected to require New Jersey districts to treat eachgovernmental fund as a major fund in accordance with the option noted in GASB No. 34, paragraph 76. TheNJDOE believes that the presentation of all funds as major is important for public interest and to promoteconsistency among district financial reporting models. The various funds of the Board are grouped into thecategories governmental, proprietary and fiduciary.
-31-
Borough of Englewood Cliffs School DistrictNotes to the Basic Financial Statementsfor the fiscal year ended June 30, 2019
NOTE 1. SUMMARY OF SIGNIFICANT ACCOUNTING POLICIES, (continued)
Fund Financial Statements: (continued)
GOVERNMENTAL FUNDS
Governmental funds are those through which most governmental functions of the Board are financed. Governmental fund reporting focuses on the sources, uses and balances of current financial resources. Expendable assets are assigned to the various governmental funds according to the purposes for whichthey may or must be used. Current liabilities are assigned to the fund from which they will be paid. The difference between governmental fund assets and liabilities is reported as fund balance. Thefollowing are the Board’s governmental funds:
General Fund - The General Fund is the general operating fund of the Board. It is used to account forall financial resources except those required to be accounted for in another fund. Included are certainexpenditures for vehicles and movable instructional or noninstructional equipment which are classifiedin the Capital Outlay subfund.
As required by the New Jersey State Department of Education, the Board includes budgeted CapitalOutlay in this fund. Accounting principles generally accepted in the United States of America as theypertain to governmental entities state that General Fund resources may be used to directly financecapital outlays for long-lived improvements as long as the resources in such cases are derivedexclusively from unrestricted revenues.
Resources for budgeted capital outlay purposes are normally derived from State of New Jersey Aid,District taxes and appropriated fund balance. Expenditures are those that result in the acquisition ofor additions to fixed assets for land, existing buildings, improvements of grounds, construction ofbuildings, additions to or remodeling of buildings and the purchase of built-in equipment. Theseresources can be transferred from and to Current Expense by board resolution.
Special Revenue Fund - The Special Revenue Fund is used to account for the proceeds of specificrevenue from State and Federal Government, (other than major capital projects, Debt Service or theEnterprise Funds) and local appropriations that are legally restricted to expenditures for specifiedpurposes.
Capital Projects Fund - The Capital Projects Fund is used to account for all financial resources to beused for the acquisition or construction of major capital facilities (other than those financed byProprietary Funds). The financial resources are derived from sale of bonds, lease purchases and otherrevenues.
-32-

Borough of Englewood Cliffs School DistrictNotes to the Basic Financial Statementsfor the fiscal year ended June 30, 2019
NOTE 1. SUMMARY OF SIGNIFICANT ACCOUNTING POLICIES, (continued)
Fund Financial Statements: (continued)
GOVERNMENTAL FUNDS, (continued)
Debt Service Fund - The debt service fund is used to account for the accumulation of resources forand the payment of principal and interest on bonds issued to finance major property acquisition,construction and improvement programs.
PROPRIETARY FUNDS
The focus of Proprietary Fund measurement is upon determination of net income, changes in netposition, financial position and cash flows. The accounting principles generally accepted in the UnitedStates of America applicable are those similar to businesses in the private sector. Proprietary funds areclassified as enterprise or internal service; the Board has no internal service funds. The following isa description of the Proprietary Funds of the Board:
Enterprise Funds - The Enterprise Funds are utilized to account for operations that are financed andoperated in a manner similar to private business enterprises -- where the intent of the Board is that thecosts (i.e. expenses including depreciation and indirect costs) of providing goods or services to thestudents on a continuing basis be financed or recovered primarily through user charges; or, where theBoard has decided that periodic determination of revenues earned, expenses incurred, and/or netincome is appropriate for capital maintenance, public policy, management control, accountability orother purposes.
The Board's Enterprise Fund is comprised of the Special Milk, Enrichment and InvengineeringPrograms.
FIDUCIARY FUNDS
Fiduciary Fund - Fiduciary Fund reporting focuses on net position and changes in net position. TheFiduciary Funds are used to account for assets held by the Board on behalf of individuals, privateorganizations, other governments and/or other funds. Fiduciary Funds include UnemploymentCompensation Insurance, Student Activities Fund, Payroll and Payroll Agency Funds.
C. Measurement Focus:
District-wide Financial Statements
The District-wide statements (i.e., the statement of net position and the statement of activities) are preparedusing the economic resources measurements focus and the accrual basis of accounting. All assets andliabilities associated with the operation of the Board are included on the statement of net position, exceptfor fiduciary funds.
-33-

Borough of Englewood Cliffs School DistrictNotes to the Basic Financial Statementsfor the fiscal year ended June 30, 2019
NOTE 1. SUMMARY OF SIGNIFICANT ACCOUNTING POLICIES, (continued)
C. Measurement Focus: (continued)
Fund Financial Statements
All governmental funds are accounted for using a flow of current financial resources measurement focus. With this measurement focus, only current assets and current liabilities generally are included on the balancesheet. The statement of revenues, expenditures and changes in fund balances reports on the sources (i.e.,revenues and other financing sources) and uses (i.e., expenditures and other financing uses) of currentfinancial resources. This approach differs from the manner in which the governmental activities of theDistrict-wide financial statements are prepared. Governmental fund financial statements therefore includea reconciliation with brief explanations to better identify the relationship between the government-widestatements and the statements for governmental funds.
Like the District-wide statements, all proprietary fund types are accounted for on a flow of economicresources measurement focus. All assets and all liabilities associated with the operation of these funds areincluded on the statement of net position. The statement of changes in fund net position presents increases(i.e., revenues) and decreases (i.e., expenses) in net total position. The statement of cash flows providesinformation about how the Board finances and meets the cash flow needs of its proprietary activities.
D. Basis of Accounting:
Basis of accounting determines when transactions are recorded in the financial records and reported on thefinancial statements. The District-wide financial statements and the financial statements of the proprietaryand fiduciary funds are prepared using the accrual basis of accounting. Governmental funds use themodified accrual basis of accounting. Differences in the accrual and the modified accrual basis ofaccounting arise in the recognition of revenue, the recording of deferred revenue, and in the presentation ofexpenses versus expenditures.
Revenues - Exchange and Non-exchange Transactions
Revenue resulting from exchange transactions, in which each party gives and receives essentially equalvalue, is recorded on the accrual basis when the exchange takes place. On a modified accrual basis, revenueis recorded in the fiscal year in which the resources are measurable and become available. Available meansthat the resources will be collected within the current fiscal year or are expected to be collected soon enoughthereafter to be used to pay liabilities of the current fiscal year.
-34-

Borough of Englewood Cliffs School DistrictNotes to the Basic Financial Statementsfor the fiscal year ended June 30, 2019
NOTE 1. SUMMARY OF SIGNIFICANT ACCOUNTING POLICIES, (continued)
D. Basis of Accounting: (continued)
Revenues - Exchange and Non-exchange Transactions, (continued)
Nonexchange transactions, in which the Board receives value without directly giving equal value in return,include property taxes, grants, entitlements and donations. On an accrual basis, revenue from property taxesis recognized in the fiscal year for which the taxes are levied. Revenue from grants, entitlements anddonations is recognized in the fiscal year in which all eligibility requirements have been satisfied. Eligibilityrequirements include timing requirements, which specify the year when the resources are required to be usedor the year when use is first permitted, matching requirements, in which the Board must provide localresources to be used for a specified purpose, and expenditure requirements, in which the resources areprovided to the Board on a reimbursement basis. On a modified accrual basis, revenue from nonexchangetransactions must also be available before it can be recognized. Under GAAP, in accordance with GASBNo. 33, Accounting and Financial Reporting for Nonexchange Transactions, the last state aid payment is notconsidered revenue to the school district if the state has not recorded the corresponding expenditure, eventhough state law dictates recording the revenue.
Under the modified accrual basis, the following revenue sources are considered to be both measurable andavailable at year-end: ad valorem property taxes, tuition, unrestricted grants and interest.
Expenses/Expenditures
On the accrual basis of accounting, expenses are recognized at the time they are incurred. The fair value ofdonated commodities used during the year is reported in the operating statement as an expense with a likeamount reported as donated commodities revenue.
The measurement of focus of governmental fund accounting is on decreases in net financial resources(expenditures) rather than expenses. Expenditures are generally recognized in the accounting period inwhich the related fund liability is incurred, if measurable. Allocations of cost, such as depreciation andamortization, are not recognized in the governmental funds.
E. Budgets/Budgetary Control:
Annual appropriated budgets are adopted in the spring of the preceding year for the general, and specialrevenue funds. The budgets are submitted to the county superintendents office for approval. Budgets areprepared using the modified accrual basis of accounting, except for the special revenue fund as describedlater. The legal level of budgetary control is established at line item accounts within each fund. Line itemaccounts are defined as the lowest (most specific) level of detail as established pursuant to the minimumchart of accounts referenced in N.J.A.C. 6A:23-2(g)1. Transfers of appropriations may be made by SchoolBoard resolution at any time during the fiscal year. The Board of Education made additional appropriationsof $87,216 to regular programs and undistributed instruction general supplies from prior year extraordinaryaid and $29,934 in additional State aid for instructional supplies.
-35-

Borough of Englewood Cliffs School DistrictNotes to the Basic Financial Statementsfor the fiscal year ended June 30, 2019
NOTE 1. SUMMARY OF SIGNIFICANT ACCOUNTING POLICIES, (continued)
E. Budgets/Budgetary Control: (continued)
Formal budgetary integration into the accounting system is employed as a management control device duringthe year. For governmental funds there are no substantial differences between the budgetary basis ofaccounting and accounting principles generally accepted in the United States of America with the exceptionof the legally mandated revenue recognition of the last state aid payment for budgetary purposes only andspecial revenue fund as noted below. Encumbrance accounting is also employed as an extension of formalbudgetary integration in the governmental fund types. Unencumbered appropriations lapse at fiscal year end.
The accounting records of the special revenue fund are maintained on the grant accounting budgetary basis. The grant accounting budgetary basis differs from GAAP in that the grant accounting budgetary basisrecognizes encumbrances as expenditures and also recognizes the related revenues, whereas the GAAP basisdoes not. Sufficient supplemental records are maintained to allow for the presentation of GAAP basisfinancial reports.
F. Encumbrances:
Under encumbrance accounting purchase orders, contracts and other commitments for the expenditure ofresources are recorded to reserve a portion of the applicable appropriation. Open encumbrances ingovernmental funds, other than the special revenue fund, are reported as reservations of fund balances atfiscal year end as they do not constitute expenditures or liabilities but rather commitments related tounperformed contracts for goods and services.
Open encumbrances in the special revenue fund, for which the Board has received advances, are reflectedin the balance sheet as unearned revenues at fiscal year end.
The encumbered appropriation authority carries over into the next fiscal year. An entry will be made at thebeginning of the next fiscal year to increase the appropriation reflected in the certified budget by theoutstanding encumbrance amount as of the current fiscal year end.
G. Cash, Cash Equivalents and Investments:
Cash and cash equivalents include petty cash, change funds, cash in banks and all highly liquid investmentswith a maturity of three months or less at the time of purchase and are stated at cost plus accrued interest. U.S. Treasury and agency obligations and certificates of deposit with maturities of one year or less whenpurchased are stated at cost. All other investments are stated at fair value.
New Jersey school districts are limited as to the types of investments and types of financial institutions theymay invest in. New Jersey statute 18A:20-37 provides a list of permissible investments that may bepurchased by New Jersey school districts.
-36-

Borough of Englewood Cliffs School DistrictNotes to the Basic Financial Statementsfor the fiscal year ended June 30, 2019
NOTE 1. SUMMARY OF SIGNIFICANT ACCOUNTING POLICIES, (continued)
G. Cash, Cash Equivalents and Investments: (continued)
Additionally, the Board has adopted a cash management plan that requires it to deposit public funds in publicdepositories protected from loss under the provisions of the Governmental Unit Deposit Protection Act("GUDPA"). GUDPA was enacted in 1970 to protect Governmental Units from a loss of funds on depositwith a failed banking institution in New Jersey.
N.J.S.A. 17:9-41 et. seq. establishes the requirements for the security of deposits of governmental units. Thestatute requires that no governmental unit shall deposit public funds in a public depository unless such fundsare secured in accordance with the Act. Public depositories include Savings and Loan institutions, banks(both state and national banks) and savings banks the deposits of which are federally insured. All publicdepositories must pledge collateral, having a market value at least equal to five percent of the average dailybalance of collected public funds, to secure the deposits of Governmental Units. If a public depository fails,the collateral it has pledged, plus the collateral of all other public depositories, is available to pay the fullamount of their deposits to the Governmental Units.
H. Tuition Payable:
Tuition charges were established by the receiving district. The charges are subject to adjustment when thefinal costs have been determined.
I. Inventories:
On District-wide financial statements, inventories are presented at cost, which approximates market on afirst-in, first-out basis and are expensed when used.
On fund financial statements inventories are valued at cost, which approximates market, using thefirst-in-first-out (FIFO) method. Inventories of proprietary funds consist of food and goods held for resale,as well as supplies, and are expensed when used.
J. Prepaid Items:
Payments made to vendors for services that will benefit periods beyond June 30, 2019, are recorded asprepaid items using the consumption method. A current asset for the prepaid amount is recorded at the timeof purchase and an expenditure/expense is reported in the year in which services are consumed.
K. Short-Term Interfund Receivables/Payables:
On fund financial statements, receivables and payables resulting from short-term interfund loans areclassified as “interfund receivables/payables.” These amounts are eliminated in the governmental andbusiness-type activities columns of the statement of net position, except for the net residual amounts duebetween governmental and business-type activities, which are presented as internal balances.
-37-
Borough of Englewood Cliffs School DistrictNotes to the Basic Financial Statementsfor the fiscal year ended June 30, 2019
NOTE 1. SUMMARY OF SIGNIFICANT ACCOUNTING POLICIES, (continued)
L. Capital Assets:
General capital assets are those assets not specifically related to activities reported in the enterprise fund. These assets generally result from expenditures in the governmental funds. These assets are reported in thegovernmental activities column of the district -wide statement of net position but are not reported in the fundfinancial statements. Capital assets utilized by the enterprise fund are reported both in the business-typeactivity column of the District-wide statement of net position and in the fund.
All capital assets acquired or constructed during the year are recorded at actual cost. Donated fixed assetsare valued at their estimated fair market value on the date received. The capital assets acquired orconstructed prior to June 30, 1993 are valued at cost based on historical records or through estimationprocedures performed by an independent appraisal company. Donated capital assets are valued at theirestimated fair market value on the date received. The Board maintains a capitalization threshold of$2,000.00. The Board does not possess any infrastructure. Improvements are capitalized; the costs ofnormal maintenance and repairs that do not add to the value of the asset or materially extend an asset’s lifeare not.
All reported capital assets except land and construction in progress are depreciated. Improvements aredepreciated over the remaining useful lives of the related capital assets. Depreciation is computed using thestraight-line method over the following useful lives:
Description
GovernmentalActivities
Estimated Lives
Business-TypeActivity
Estimated LivesSites and Improvements 20 years N/A
Buildings and Improvements 7-50 years N/A
Furniture, Equipment and Vehicles 5-20 years 5-20 years
M. Compensated Absences:
Compensated absences are those absences for which employees will be paid, such as vacation, sick leave,and sabbatical leave. A liability for compensated absences that are attributable to services already rendered,and that are not contingent on a specific event that is outside the control of the Board and its employees, isaccrued as the employees earn the rights to the benefits. Compensated absences that relate to future services,or that are contingent on a specific event that is outside the control of the Board and its employees, areaccounted for in the period in which such services are rendered or in which such events take place.
For the District-wide Statements, the current portion is the amount estimated to be used in the followingyear. In accordance with GAAP, for the governmental funds, in the Fund Financial Statements, all of thecompensated absences are considered long-term and therefore, are not a fund liability and represents areconciling item between the fund level and District-wide presentations.
-38-
Borough of Englewood Cliffs School DistrictNotes to the Basic Financial Statementsfor the fiscal year ended June 30, 2019
NOTE 1. SUMMARY OF SIGNIFICANT ACCOUNTING POLICIES, (continued)
N. Deferred Revenue:
Deferred revenue arises when assets are recognized before revenue recognition criteria have been satisfied.
Deferred revenue in the special revenue fund represents cash that has been received but not yet earned. SeeNote 1(F) regarding the special revenue fund.
O. Accrued Liabilities and Long-term Obligations:
All payables, accrued liabilities and long-term obligations are reported in the District-wide financialstatements.
In general, governmental fund payables and accrued liabilities that, once incurred, are paid in a timelymanner and in full from current financial resources, are reported as obligations of the funds. However,claims and judgements, compensated absences, special termination benefits and contractually requiredpension contributions that will be paid from governmental funds are reported as a liability in the fundfinancial statements only to the extent that they are due for payment in the current year. Bonds, long-termobligations, and capital leases that will be paid from governmental funds are recognized as a liability in thefund financial statements when due.
P. Accounting and Financial Reporting for Pensions:
In fiscal year 2015, the District implemented GASB 68. This Statement amends GASB Statement No. 27.It improves accounting and financial reporting by state and local governments for pensions. It also improvesinformation provided by state and local government employers about financial support for pensions that isprovided by other entities. This Statement results from a comprehensive review of the effectiveness ofexisting standards of accounting and financial reporting for pensions with regard to providing decision usefulinformation, supporting assessments of accountability and interperiod equity, and creating additionaltransparency. This Statement replaces the requirement of Statement No. 27, Accounting for Pension by Stateand Local Governmental Employers, as well as the requirements of Statement No. 50, Pension Disclosures,as they relate to pensions that are provided through pension plans administered as trusts or equivalentarrangements that meet certain criteria. The requirements of Statements 27 and 50 remain applicable forpensions that are not covered by the scope of this Statement.
The District has also implemented GASB Statement 71, Pension Transition for Contributions madeSubsequent to the Measurement Date-an amendment to GASB No. 68. The objective of this Statement isto address an issue regarding application of the transition provisions of Statement No. 68, Accounting andFinancial Reporting for Pensions. The issue relates to amounts associated with contributions, if any, madeby a state or local government employer or nonemployer contributing entity to a defined benefit pension planafter the measurement date of the government's beginning net pension liability.
-39-

Borough of Englewood Cliffs School DistrictNotes to the Basic Financial Statementsfor the fiscal year ended June 30, 2019
NOTE 1. SUMMARY OF SIGNIFICANT ACCOUNTING POLICIES, (continued)
P. Accounting and Financial Reporting for Pensions: (continued)
Statement 68 requires a state or local government employer (or nonemployer contributing entity in a specialfunding situation) to recognize a net pension liability measured as of a date (the measurement date) no earlierthan the end of its prior fiscal year. If a state or local government employer or nonemployer contributingentity makes a contribution to a defined benefit pension plan between the measurement date of the reportednet pension liability and the end of the government's reporting period, Statement 68 requires that thegovernment recognize its contribution as a deferred outflow of resources.
In addition, Statement 68 requires recognition of deferred outflows of resources and deferred inflows ofresources for changes in the net pension liability of a state or local government employer or nonemployercontributing entity that arise from other types of events. At transition to Statement 68, if it is not practicalfor an employer or nonemployer contributing entity to determine the amounts of all deferred outflows ofresources and deferred inflows of resources related to pensions, paragraph 137 of Statement 68 required thatbeginning balances for deferred outflows of resources and deferred inflows of resources not be reported.Consequently, if it is not practical to determine the amounts of all deferred outflows of resources anddeferred inflows of resources related to pensions, contributions made after the measurement date of thebeginning net pension liability could not have been reported as deferred outflows of resources at transition.This could have resulted in a significant understatement of an employer or nonemployer contributing entity'sbeginning net position and expense in the initial period of implementation.
This Statement amends paragraph 137 of Statement 68 to require that, at transition, a government recognizea beginning deferred outflow of resources for its pension contributions, if any, made subsequent to themeasurement date of the beginning net pension liability. Statement 68, as amended, continues to require thatbeginning balances for other deferred outflows of resources and deferred inflows of resources related topensions be reported at transition only if it is practical to determine all such amounts.
Q. Deferred Outflows/Inflows of Resources
In addition to assets, the statement of financial position will sometimes report a separate section for deferredoutflows of resources. This separate financial statement element, deferred outflows of resources, representsa consumption of net position that applies to a future period(s) and so will not be recognized as an outflowof resources (expense/expenditure) until then. Currently, the District has only one item that qualifies forreporting in this category, deferred amounts related to pension.
In addition to liabilities, the statement of financial position will sometimes report a separate section fordeferred inflows of resources. This separate financial statement element, deferred inflows of resources,represents an acquisition of net position that applies to a future period(s) and so will not be recognized asan inflow of resources (revenue) until that time. The District has one item that qualifies in this category,deferred amounts related to pension.
-40-

Borough of Englewood Cliffs School DistrictNotes to the Basic Financial Statementsfor the fiscal year ended June 30, 2019
NOTE 1. SUMMARY OF SIGNIFICANT ACCOUNTING POLICIES, (continued)
R. Fund Balances:
Fund balance is divided into five classifications based primarily on the extent to which the Board is boundto observe constraints imposed upon the resources in the governmental funds. The classifications are asfollows:
• Nonspendable fund balance includes amounts that are not in a spendable form (inventory,for example) or are required to be maintained intact (the principal of an endowment fund,for example).
• Restricted fund balance includes amounts that can be spent only for the specific purposesstipulated by external resource providers (for example, grant providers), constitutionally,or through enabling legislation (that is, legislation that creates a new revenue source andrestricts its use). Effectively, restrictions may be changed or lifted only with the consent ofresource providers.
• Committed fund balance includes amounts that can be used only for the specific purposesdetermined by a formal action of the Board’s highest level of decision-making authority. Commitments may be changed or lifted only by the government taking the same formalaction that imposed the constraint originally.
• Assigned fund balance comprises amounts intended to be used by the Board for specificpurposes. Intent can be expressed by the governing body or by an official or body to whichthe governing body delegates the authority. In governmental funds other than the generalfund, assigned fund balance represents the amount that is not restricted or committed. Thisindicates that resources in other governmental funds are, at a minimum, intended to be usedfor the purpose of that fund.
• Unassigned fund balance is the residual classification for the general fund and includes allamounts not contained in the other classifications. Unassigned amounts are technicallyavailable for any purpose. If another governmental fund has a fund balance deficit, then itwill be reported as a negative amount in the unassigned classification in that fund. Positiveunassigned amounts will be reported only in the general fund.
S. Net Position:
Net position represent the difference between assets and liabilities. Net position invested in capital assets,net of related debt consists of capital assets, net of accumulated depreciation, reduced by the outstandingbalances of any borrowings used for the acquisition, construction or improvement of those assets. Netposition are reported as restricted when there are limitations imposed on their use either through the enablinglegislation adopted by the Board or through external restrictions imposed by creditors, grantors or laws orregulations of other governments.
-41-

Borough of Englewood Cliffs School DistrictNotes to the Basic Financial Statementsfor the fiscal year ended June 30, 2019
NOTE 1. SUMMARY OF SIGNIFICANT ACCOUNTING POLICIES, (continued)
S. Net Position: (continued)
The Board applies restricted resources first when an expense is incurred for purposes for which bothrestricted and unrestricted net position are available.
T. Operating Revenues and Expenses:
Operating revenues are those revenues that are generated directly from the primary activity of the proprietaryfunds. For the Board, these revenues are sales for food service. Operating expenses are necessary costsincurred to provide the good or service that is the primary activity of the fund.
U. Extraordinary and Special Items:
Extraordinary items are transactions or events that are both unusual in nature and infrequent in occurrence. Special items are transactions or events that are within the control of the Board and that are either unusualin nature or infrequent in occurrence. Neither type of transaction occurred during the fiscal year.
V. Allocation of Indirect Expenses:
The District reports all direct expenses by function in the Statement of Activities. Direct expenses are thosethat are clearly identifiable with a function. Indirect expenses are allocated to functions but are reportedseparately in the Statement of Activities. Employee benefits, including the employer’s share of socialsecurity, workers compensation, and medical and dental benefits, were allocated based on salaries of thatprogram. TPAF on-behalf contributions and changes in compensated absences have not been allocated andhave been reported as unallocated benefits on the Statement of Activities. Depreciation expense, wherepracticable, is specifically identified by function and is included in the indirect expense column of theStatement of Activities. Depreciation expense that could not be attributed to a specific function isconsidered an indirect expense and is reported separately on the Statement of Activities as unallocateddepreciation. Interest on long-term debt is considered an indirect expense and is reported separately on theStatement of Activities.
W. Use of Estimates:
The preparation of financial statements in accordance with accounting principles generally accepted in theUnited States of America requires management to make estimates and assumptions that effect certainreports, amounts and disclosures. Accordingly, actual results could differ from those estimates.
-42-

Borough of Englewood Cliffs School DistrictNotes to the Basic Financial Statementsfor the fiscal year ended June 30, 2019
NOTE 1. SUMMARY OF SIGNIFICANT ACCOUNTING POLICIES, (continued)
X. New Accounting Standards:
During fiscal year 2019, the District adopted the following GASB Statements:
GASB Statement No. 88, Certain Disclosures Related to Debt, Including Direct Borrowings and DirectPlacement. The objective of this Statement is to improve consistency in the information that is disclosedin notes to government financial statements related to debt, including direct borrowings and directplacements, and to provide financial statement users with additional essential information about debt.
Other accounting standards that the District is currently reviewing for applicability and potential impact onthe financial statements include:
GASB Statement No. 84, Fiduciary Activities. This Statement establishes criteria for identifying fiduciaryactivities of all state and local governments. The focus on the criteria generally is on (1) whether agovernment is controlling the assets of the fiduciary activity and (2) the beneficiaries with whom a fiduciaryrelationship exists. Separate criteria are included to identify component units and postemployment benefitarrangements that are fiduciary activities.
GASB Statement No. 87, Leases, which improves accounting and financial reporting for leases bygovernments. This Statement requires recognition of certain lease assets and liabilities for leases thatpreviously were classified as operating leases and recognized as inflows of resources or outflows ofresources based on the payment provisions of the contract. It establishes a single model for lease accountingbased on the fundamental principle that leases are financings of the right to use an underlying asset. Therequirements of this Statement are effective for reporting periods beginning after December 15, 2019. .
GASB Statement No. 89, Accounting for Interest Cost Incurred Before the end of a Construction. Theobjectives of this Statement is to (1) to enhance the relevance and comparability of information about capitalassets and the cost of borrowing for a reporting period and (2) to simplify accounting for interest costincurred before the end of a construction period. This Statement requires that interest cost incurred beforethe end of a construction period be recognized as an expense in the period in which the cost is incurred forfinancial statements prepared using the economic resources measurement focus. The requirements of thisStatement are effective for reporting periods beginning after December 15, 2019.
GASB Statement No. 90, Majority Equity Interests – An Amendment of GASB Statements No. 14 and No.61. This Statement improves the consistency and comparability of reporting a government’s majority equityinterest in a legally separate organization and improves the relevance of financial statement information forcertain component units. The requirements of this Statement are effective for reporting periods beginningafter December 31, 2018.
-43-

Borough of Englewood Cliffs School DistrictNotes to the Basic Financial Statementsfor the fiscal year ended June 30, 2019
X. New Accounting Standards: (continued)
GASB Statement No. 91, Conduit Debt Obligations. This Statement provides a single method of reportingconduit debt obligations by issuers and eliminates diversity in practice associated with (1) commitmentsextended by issuers, (2) arrangements associated with conduit debt obligations, and (3) related notedisclosures. This Statement achieves those objectives by clarifying the existing definition of a conduit debtobligation; establishing that a conduit debt obligation is not a liability of the issuer; establishing that aconduit debt obligation is not a liability of the issuer; establishing standards for accounting and financialreporting of additional commitments and voluntary commitments extended by issuers and arrangementsassociated with conduit debt obligations; and improving required note disclosures. This Statement iseffective for reporting periods beginning after December 15, 2020.
NOTE 2. CASH AND CASH EQUIVALENTS AND INVESTMENTS
Cash
Custodial Credit Risk - Deposits
Custodial credit risk is the risk that in the event of a bank failure, the government’s deposits may not bereturned to it. The District’s policy is based on New Jersey Statutes requiring cash be deposited only in NewJersey based banking institutions that participate in New Jersey Governmental Depository Protection Act(GUDPA) or in qualified investments established in New Jersey Statutes 18A:20-37 that are treated as cashequivalents. As of June 30, 2019, $-0- of the District’s bank balance of $4,062,433 was exposed to custodialcredit
Investments
Investment Rate Risk
The District does not have a formal investment policy that limits investment maturities as a means ofmanaging its exposure to fair value losses arising from increasing interest rates. However, New JerseyStatutes 18A:20-37 limits the length of time for most investments to 397 days.
Credit Risk
New Jersey Statutes 18A:20-37 limits school district investments to those specified in the Statutes. The typeof allowable investments are Bonds of the United States of America, bonds or other obligations of the schooldistricts or bonds or other obligations of the local unit or units within which the school district is located;obligations of federal agencies not exceeding 397 days; government money market mutual funds; the Stateof New Jersey Cash Management Plan; local government investment pools; or repurchase of fullycollateralized securities.
-44-

Borough of Englewood Cliffs School DistrictNotes to the Basic Financial Statementsfor the fiscal year ended June 30, 2019
NOTE 2. CASH AND CASH EQUIVALENTS AND INVESTMENTS, (continued)
Concentration of Credit Risk
The District places no limit on the amount the District may invest in any one issuer.
NOTE 3. RECEIVABLES
Receivables at June 30, 2019, consisted of accounts and intergovernmental. All receivables are consideredcollectible in full. A summary of the principal items of receivables follows:
GovernmentalFund Financial
Statements
Business-Type
Activities
District WideFinancial
Statements
State Aid $319,321 $437 $319,758Federal Aid 29,765 29,765
Interfund Receivables 16,369 220
Gross Receivables 365,455 437 349,743
Less: Allowance for Uncollectibles
Total Receivables, Net $365,455 $437 $349,743
NOTE 4. INTERFUND BALANCES AND ACTIVITY
Balances due to/from other funds at June 30, 2019 consist of the following:
$ 220 Due to the General Fund from the Payroll AgencyFund to transfer amounts in excess of that neededto satisfy outstanding payroll deduction liabilities.
16,149 Due to the General Fund from the Special RevenueFund for cash deficit.
$16,369
During the fiscal year ended June 30, 2019, the District transferred $-0- of unexpended bond proceeds relatedto Capital Projects to the Debt Service Fund and transferred $-0- from the Unemployment CompensationInsurance Trust Fund to the General Fund as the account is no longer needed.
-45-

Borough of Englewood Cliffs School DistrictNotes to the Basic Financial Statementsfor the fiscal year ended June 30, 2019
NOTE 5. CAPITAL ASSETS
Capital asset activity for the fiscal year ended June 30, 2019 was as follows:
Beginning
Balance Additions Deductions
Ending
Balance
Governmental Activities
Capital Assets that are not being Depreciated:
Land $ $ $ $
Construction in Progress $703,937 (703,937)
Total Capital Assets not being Depreciated 703,937 (703,937)
Capital Assets Being Depreciated
Site Improvements 368,957 440,052 809,009
Buildings and Building Improvements 8,589,963 993,296 9,583,259
Machinery and Equipment 553,987 99,855 653,842
Totals at Historical Cost 9,512,907 1,533,203 11,046,110
Less Accumulated Depreciation:
Site Improvements (341,098) (24,122) (365,220)
Buildings and Improvements (5,323,142) (343,666) (5,666,808)
Equipment (505,378) (31,183) (536,561)
Total Accumulated Depreciation (6,169,618) (398,971) (6,568,589)
Total Capital Assets, Being Depreciated, Net
of Accumulated Depreciation 3,343,289 1,134,232 4,477,521
Governmental Activities Capital Assets, Net $4,047,226 $1,134,232 (703,937) $4,477,521
Balance
6/30/18 Additions Deductions
Balance
6/30/19
Business-Type Activity
Equipment $2,000 $ $ $2,000
Less Accumulated Depreciation for:
Equipment (2,000) (2,000)
Business-Type Activity Capital Assets, Net $ $ $ $
-46-

Borough of Englewood Cliffs School DistrictNotes to the Basic Financial Statementsfor the fiscal year ended June 30, 2019
NOTE 5. CAPITAL ASSETS, (continued)
Depreciation expense was charged to governmental functions as follows:
Instruction $17,822
Support Services:
Instruction 11,245
School Administration 1,125
Operations 991
Buildings 18,480
Building Improvements 325,186
Land Improvements 24,122
Total Depreciation Expense $398,971
NOTE 6. LONG-TERM OBLIGATION ACTIVITY
Changes in long-term obligations for the year ended June 30, 2019 were as follows:
BalanceJune 30, 2018 Issued Retired
BalanceJune 30, 2019
AmountDue WithinOne Year
Long-TermPortion
Governmental Activities:Bonds Payable: General Obligation Debt $1,350,000 $ $330,000 $1,020,000 $335,000 $685,000
Total Bonds Payable 1,350,000 330,000 1,020,000 335,000 685,000
Other Liabilities:
Compensated Absences Payable 361,368 19,021 28,906 351,483 351,483
Net Pension Liability PERS 3,989,747 637,624 3,352,123 162,309 3,189,814
Total Other Liabilities $5,701,115 $19,021 $996,530 $4,723,606 $497,309 $4,226,297
-47-
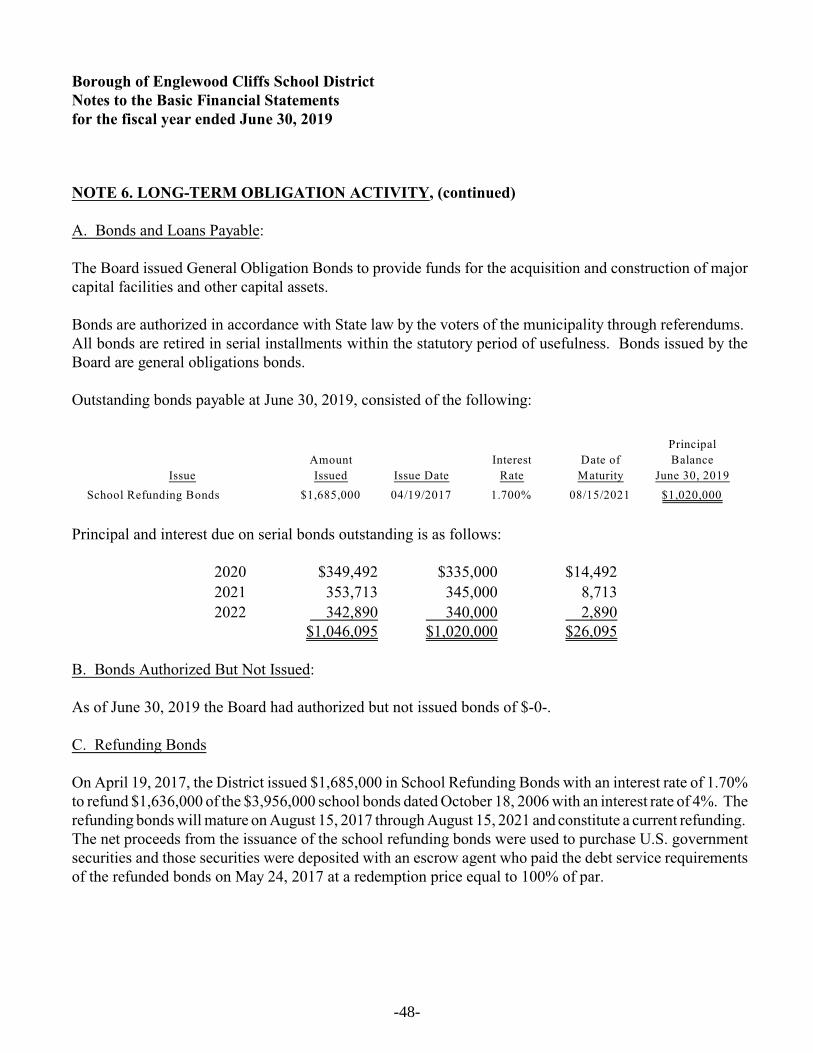
Borough of Englewood Cliffs School DistrictNotes to the Basic Financial Statementsfor the fiscal year ended June 30, 2019
NOTE 6. LONG-TERM OBLIGATION ACTIVITY, (continued)
A. Bonds and Loans Payable:
The Board issued General Obligation Bonds to provide funds for the acquisition and construction of majorcapital facilities and other capital assets.
Bonds are authorized in accordance with State law by the voters of the municipality through referendums. All bonds are retired in serial installments within the statutory period of usefulness. Bonds issued by theBoard are general obligations bonds.
Outstanding bonds payable at June 30, 2019, consisted of the following:
Issue
Amount
Issued Issue Date
Interest
Rate
Date of
Maturity
Principal
Balance
June 30, 2019
School Refunding Bonds $1,685,000 04/19/2017 1.700% 08/15/2021 $1,020,000
Principal and interest due on serial bonds outstanding is as follows:
2020 $349,492 $335,000 $14,492
2021 353,713 345,000 8,713
2022 342,890 340,000 2,890$1,046,095 $1,020,000 $26,095
B. Bonds Authorized But Not Issued:
As of June 30, 2019 the Board had authorized but not issued bonds of $-0-.
C. Refunding Bonds
On April 19, 2017, the District issued $1,685,000 in School Refunding Bonds with an interest rate of 1.70%to refund $1,636,000 of the $3,956,000 school bonds dated October 18, 2006 with an interest rate of 4%. Therefunding bonds will mature on August 15, 2017 through August 15, 2021 and constitute a current refunding. The net proceeds from the issuance of the school refunding bonds were used to purchase U.S. governmentsecurities and those securities were deposited with an escrow agent who paid the debt service requirementsof the refunded bonds on May 24, 2017 at a redemption price equal to 100% of par.
-48-
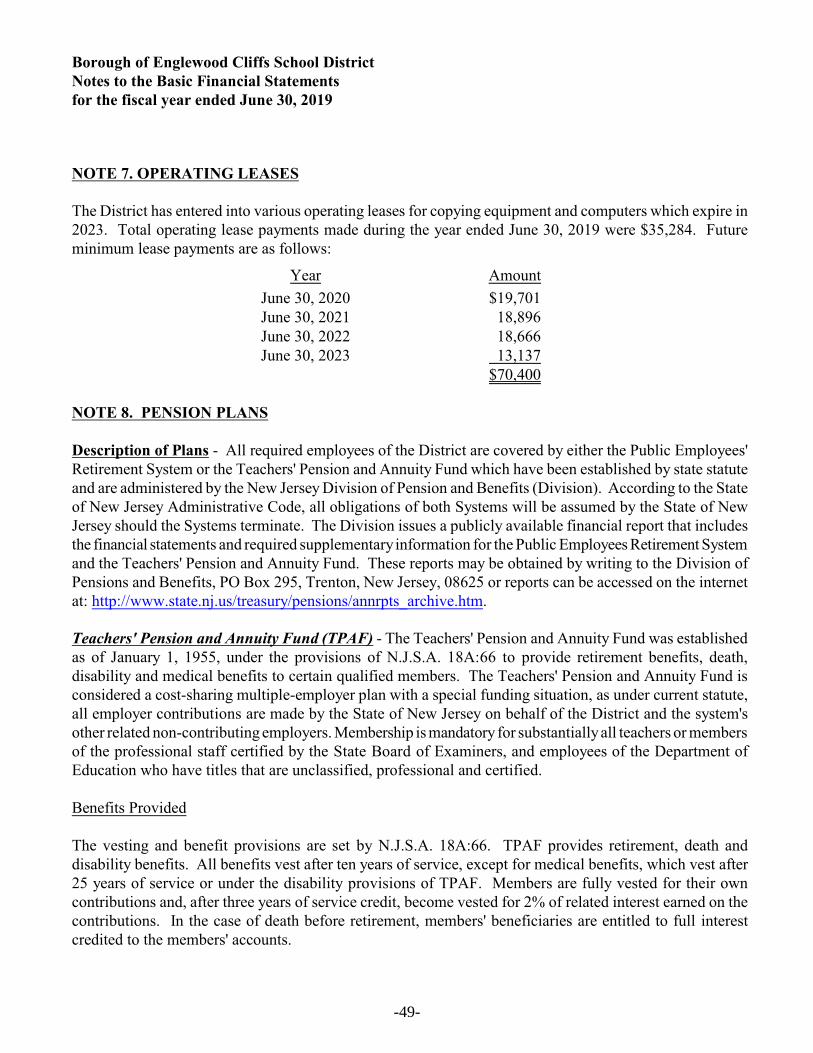
Borough of Englewood Cliffs School DistrictNotes to the Basic Financial Statementsfor the fiscal year ended June 30, 2019
NOTE 7. OPERATING LEASES
The District has entered into various operating leases for copying equipment and computers which expire in2023. Total operating lease payments made during the year ended June 30, 2019 were $35,284. Futureminimum lease payments are as follows:
Year Amount
June 30, 2020 $19,701June 30, 2021 18,896June 30, 2022 18,666June 30, 2023 13,137
$70,400
NOTE 8. PENSION PLANS
Description of Plans - All required employees of the District are covered by either the Public Employees'Retirement System or the Teachers' Pension and Annuity Fund which have been established by state statuteand are administered by the New Jersey Division of Pension and Benefits (Division). According to the Stateof New Jersey Administrative Code, all obligations of both Systems will be assumed by the State of NewJersey should the Systems terminate. The Division issues a publicly available financial report that includesthe financial statements and required supplementary information for the Public Employees Retirement Systemand the Teachers' Pension and Annuity Fund. These reports may be obtained by writing to the Division ofPensions and Benefits, PO Box 295, Trenton, New Jersey, 08625 or reports can be accessed on the internetat: http://www.state.nj.us/treasury/pensions/annrpts_archive.htm.
Teachers' Pension and Annuity Fund (TPAF) - The Teachers' Pension and Annuity Fund was establishedas of January 1, 1955, under the provisions of N.J.S.A. 18A:66 to provide retirement benefits, death,disability and medical benefits to certain qualified members. The Teachers' Pension and Annuity Fund isconsidered a cost-sharing multiple-employer plan with a special funding situation, as under current statute,all employer contributions are made by the State of New Jersey on behalf of the District and the system'sother related non-contributing employers. Membership is mandatory for substantially all teachers or membersof the professional staff certified by the State Board of Examiners, and employees of the Department ofEducation who have titles that are unclassified, professional and certified.
Benefits Provided
The vesting and benefit provisions are set by N.J.S.A. 18A:66. TPAF provides retirement, death anddisability benefits. All benefits vest after ten years of service, except for medical benefits, which vest after25 years of service or under the disability provisions of TPAF. Members are fully vested for their owncontributions and, after three years of service credit, become vested for 2% of related interest earned on thecontributions. In the case of death before retirement, members' beneficiaries are entitled to full interestcredited to the members' accounts.
-49-

Borough of Englewood Cliffs School DistrictNotes to the Basic Financial Statementsfor the fiscal year ended June 30, 2019
NOTE 8. PENSION PLANS, (continued)
The following represents the membership tiers for TPAF:
Tier Definition 1 Members who were enrolled prior to July 1, 2007 2 Members who were eligible to enroll on or after July 1, 2007 and prior to November 2, 2008 3 Members who were eligible to enroll on or after November 2, 2008 and prior to May 22, 2010 4 Members who were eligible to enroll on or after May 22, 2010 and prior to June 28, 2011 5 Members who were eligible to enroll on or after June 28, 2011
Service retirement benefits of 1/55 of final average salary for each year of service credit is available to Tiersth
1 and 2 members upon reaching age 60 and to Tier 3 members upon reaching age 62. Service retirementbenefits of 1/60 of final average salary for each year of service credit is available to Tier 4 members uponth
reaching age 62 and to Tier 5 members upon reaching age 65. Early retirement benefits are available to Tiers1 and 2 members before reaching age 60, to Tiers 3 and 4 before age 62 with 25 or more years of servicecredit and Tier 5 with 30 or more years of service credit before age 65. Benefits are reduced by a fraction ofa percent for each month that a member retires prior to the age at which a member can receive full earlyretirement benefits in accordance with their respective tier. Tier 1 members can receive an unreduced benefitfrom age 55 to age 60 if they have at least 25 years of service. Deferred retirement is available to memberswho have at least 10 years of service credit and have not reached the service retirement age for the respectivetier.
Public Employees' Retirement System (PERS) - The Public Employees' Retirement System (PERS) wasestablished as of January 1, 1955 under the provisions of N.J.S.A. 43:15A to provide retirement, death,disability and medical benefits to certain qualified members. The Public Employees' Retirement System isa cost-sharing multiple-employer plan. Membership is mandatory for substantially all full-time employeesof the State of New Jersey or any county, municipality, school district, or public agency, provided theemployee is not required to be a member of another state-administered retirement system or other state orlocal jurisdiction.
Benefits Provided
The vesting and benefit provisions are set by N.J.S.A. 43:15A. PERS provides retirement, death anddisability benefits. All benefits vest after ten years of service, except for medical benefits, which vest after25 years of service or under the disability provisions of PERS.
The following represents the membership tiers for PERS:
Tier Definition 1 Members who were enrolled prior to July 1, 2007 2 Members who were eligible to enroll on or after July 1, 2007 and prior to November 2, 2008 3 Members who were eligible to enroll on or after November 2, 2008 and prior to May 22, 2010 4 Members who were eligible to enroll on or after May 22, 2010 and prior to June 28, 2011 5 Members who were eligible to enroll on or after June 28, 2011
-50-
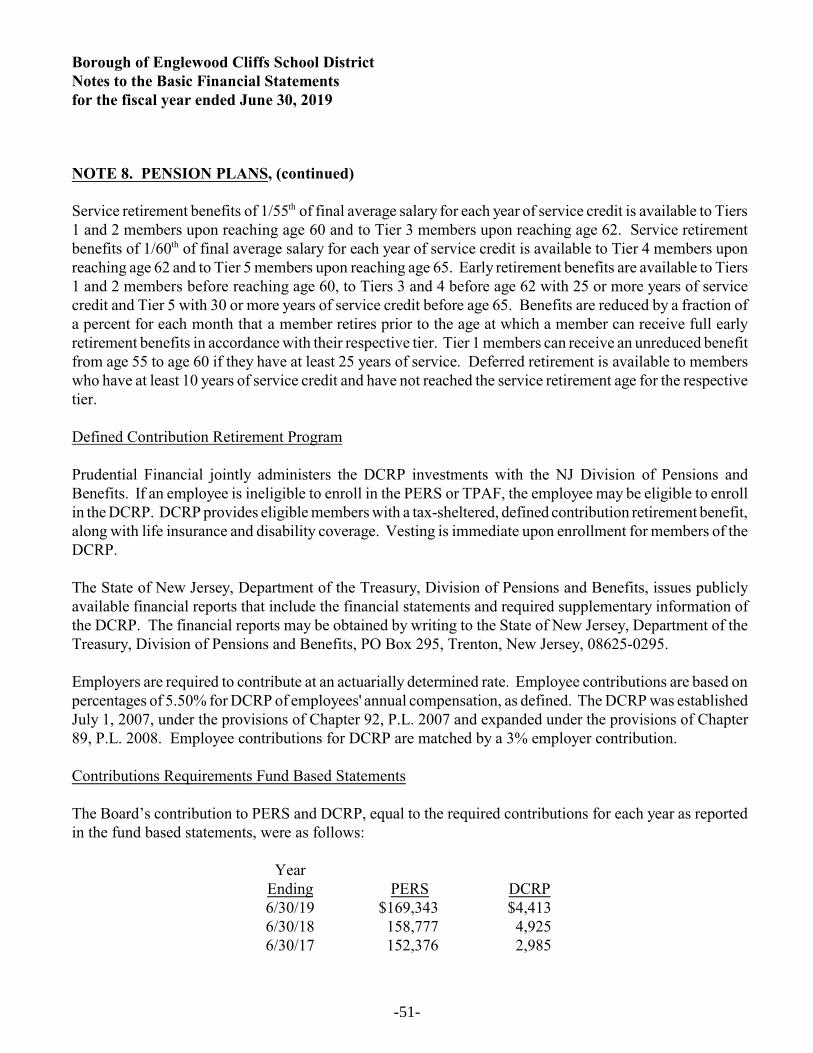
Borough of Englewood Cliffs School DistrictNotes to the Basic Financial Statementsfor the fiscal year ended June 30, 2019
NOTE 8. PENSION PLANS, (continued)
Service retirement benefits of 1/55 of final average salary for each year of service credit is available to Tiersth
1 and 2 members upon reaching age 60 and to Tier 3 members upon reaching age 62. Service retirementbenefits of 1/60 of final average salary for each year of service credit is available to Tier 4 members uponth
reaching age 62 and to Tier 5 members upon reaching age 65. Early retirement benefits are available to Tiers1 and 2 members before reaching age 60, to Tiers 3 and 4 before age 62 with 25 or more years of servicecredit and Tier 5 with 30 or more years of service credit before age 65. Benefits are reduced by a fraction ofa percent for each month that a member retires prior to the age at which a member can receive full earlyretirement benefits in accordance with their respective tier. Tier 1 members can receive an unreduced benefitfrom age 55 to age 60 if they have at least 25 years of service. Deferred retirement is available to memberswho have at least 10 years of service credit and have not reached the service retirement age for the respectivetier.
Defined Contribution Retirement Program
Prudential Financial jointly administers the DCRP investments with the NJ Division of Pensions andBenefits. If an employee is ineligible to enroll in the PERS or TPAF, the employee may be eligible to enrollin the DCRP. DCRP provides eligible members with a tax-sheltered, defined contribution retirement benefit,along with life insurance and disability coverage. Vesting is immediate upon enrollment for members of theDCRP.
The State of New Jersey, Department of the Treasury, Division of Pensions and Benefits, issues publiclyavailable financial reports that include the financial statements and required supplementary information ofthe DCRP. The financial reports may be obtained by writing to the State of New Jersey, Department of theTreasury, Division of Pensions and Benefits, PO Box 295, Trenton, New Jersey, 08625-0295.
Employers are required to contribute at an actuarially determined rate. Employee contributions are based onpercentages of 5.50% for DCRP of employees' annual compensation, as defined. The DCRP was establishedJuly 1, 2007, under the provisions of Chapter 92, P.L. 2007 and expanded under the provisions of Chapter89, P.L. 2008. Employee contributions for DCRP are matched by a 3% employer contribution.
Contributions Requirements Fund Based Statements
The Board’s contribution to PERS and DCRP, equal to the required contributions for each year as reportedin the fund based statements, were as follows:
YearEnding PERS DCRP6/30/19 $169,343 $4,4136/30/18 158,777 4,9256/30/17 152,376 2,985
-51-

Borough of Englewood Cliffs School DistrictNotes to the Basic Financial Statementsfor the fiscal year ended June 30, 2019
NOTE 8. PENSION PLANS, (continued)
The State of New Jersey contribution to TPAF (paid on-behalf of the District) for normal and post retirementbenefits have been included in the fund-based statements as revenues and expenditures in accordance withGASB 24, paragraphs 7 through 13, as follows:
YearEnding
PensionContributions
Post-RetirementMedical
ContributionsNCGI
Premium
Long-TermDisabilityInsurance
6/30/19 $854,222 $395,584 $17,881 $1,075
6/30/18 667,009 441,261 16,187 990
6/30/17 487,098 420,568 17,649 1,351
In addition, the post-retirement medical benefits are included in the district-wide financial statements.
Also, in accordance with N.J.S.A. 18A:66-66 the State of New Jersey reimbursed the Board $344,688 duringthe year ended June 30, 2019 for the employer’s share of social security contributions for TPAF membersas calculated on their base salaries. This amount has been included in the fund-based statements as revenuesand expenditures in accordance with GASB 24, paragraphs 7 through 13.
ACCOUNTING AND FINANCIAL REPORTING FOR PENSION IN THE DISTRICT-WIDESTATEMENTS PER - GASB NO. 68
Public Employees Retirement System (PERS)
At June 30, 2019, the District had a liability of $3,352,124 for its proportionate share of the PERS net pensionliability. The net pension liability was measured as of June 30, 2018, and the total pension liability used tocalculate the net pension liability was determined by an actuarial valuation as of that date. The District'sproportion of the net pension liability was based on a projection of the District's long-term share ofcontributions to the pension plan relative to the projected contributions of all participating governmentalentities, actuarially determined. At June 30, 2018, the District's proportion was .0170249300 percent, whichwas a decrease of (.000114337) percent from its proportion measured as of June 30, 2017.
For the year ended June 30, 2019, the District recognized pension expense of $304,406. At June 30, 2019,deferred outflows of resources and deferred inflows of resources related to PERS from the following sources:
-52-

Borough of Englewood Cliffs School DistrictNotes to the Basic Financial Statementsfor the fiscal year ended June 30, 2019
NOTE 8. PENSION PLANS, (continued)
DeferredOutflows ofResources
DeferredInflows ofResources
Difference in actual and expected experience $63,925 $17,285Changes of assumptions 552,374 1,071,831Net difference between projected and actual earnings on pension plan investments 31,443Changes in proportion and differences between District contributions and proportionate share of contributions 344,967 80,688District contributions subsequent to the measurement date 171,055
Total $1,132,321 $1,201,247
The $171,055 reported as deferred outflows of resources related to pensions resulting from school districtcontributions subsequent to the measurement date (i.e. for the school year ending June 30, 2019, the planmeasurement date is June 30, 2018) will be recognized as a reduction of the net pension liability in the yearended June 30, 2019. Other amounts reported as deferred outflows of resources and deferred inflows ofresources related to pensions (excluding changes in proportion) will be recognized in pension expense asfollows:
Year ended June 30:2019 $23,2652020 (32,211)2021 (230,982)2022 (200,218)2023 (64,114)
Changes in Proportion
The previous amounts do not include employer specific deferred outflows of resources and deferred inflowsof resources related to changes in proportion. These amounts should be recognized (amortized) by eachemployer over the average of the expected remaining service lives of all plan members, which is 5.63, 5.48,5.57, 5.72 and 6.44 years for 2018, 2017, 2016, 2015 and 2014 amounts, respectively.
-53-

Borough of Englewood Cliffs School DistrictNotes to the Basic Financial Statementsfor the fiscal year ended June 30, 2019
NOTE 8. PENSION PLANS, (continued)
Additional Information
Local Group Collective balances at June 30, 2018 and June 30, 2017 are as follows:
June 30, 2018 June 30, 2017
Collective deferred outflows of resources $4,684,852,302 $6,424,455,842
Collective deferred inflows of resources 7,646,736,226 5,700,625,981
Collective net pension liability 19,689,501,539 23,278,401,588
District's Proportion .0170249300% 0.0171392665%
Actuarial Assumptions
The total pension liability for the June 30, 2018 measurement date was determined by an actuarial valuationas of July 1, 2017, which rolled forward to June 30, 2018. This actuarial valuation used the followingassumptions, applied to all periods in the measurement.
Inflation 2.25 PercentSalary Increases: Through 2026 1.65-4.15 Percent (based on age) Thereafter 2.65-5.15 Percent (based on age)
Investment Rate of Return 7.00 Percent
The actuarial assumptions used in the June 30, 2017 valuation were based on the results of an actuarialexperience study for the period July 1, 2011 to June 30, 2014. It is likely that future experience will notexactly conform to these assumptions. To the extent that actual experience deviates from these assumptions,the emerging liabilities may be higher or lower than anticipated. The more the experience deviates, the largerthe impact on future financial statements.
Mortality Rates
Pre-retirement mortality rates were based on the RP-2000 Employee Pre-retirement Mortality Table for maleand female active participants. For State employees, mortality tables are set back 4 years for males andfemales. For local employees, mortality tables are set back 2 years for males and 7 years for females. Inaddition, the tables provide for future improvements in mortality from the base year of 2013 using agenerational approach based on the Conduent modified 2014 projection scale. Post-retirement mortality rates
-54-

Borough of Englewood Cliffs School DistrictNotes to the Basic Financial Statementsfor the fiscal year ended June 30, 2019
NOTE 8. PENSION PLANS, (continued)
were based on the RP-2000 Combined Healthy Male and Female Mortality Tables (setback 1 year for malesand females) for service retirements and beneficiaries of former members. In addition, the tables for serviceretirements and beneficiaries of former members provide for future improvements in mortality from 2012to 2013 using Projection Scale AA and using a generational approach based on the Conduent 2014 projectionscale thereafter. Disability retirement rates used to value disabled retirees were based on the RP-2000Disabled Mortality Table (set back 3 years for males and set forward 1 year for females).
Long-Term Rate of Return
In accordance with State statute, the long-term expected rate of return on plan investments (7.00% at June 30,2018) is determined by the State Treasurer, after consultation with the Directors of the Division ofInvestments and Division of Pensions and Benefits, the board of trustees and the actuaries. The long-termexpected rate of return was determined using a building block method in which best-estimate ranges ofexpected future real rates of return (expected returns, net of pension plan investment expense and inflation)are developed for each major asset class. These ranges are combined to produce the long-term expected rateof return by weighting the expected future real rates of return by the target asset allocation percentage andby adding expected inflation. Best estimates of arithmetic real rates of return for each major asset classincluded in PERS's target asset allocation as of June 30, 2018 are summarized in the following table:
Asset ClassTarget
Allocation
Long-TermExpected RealRate of Return
Risk Mitigation Strategies 5.00% 5.51%Cash equivalents 5.50% 1.00%U.S. Treasuries 3.00% 1.87%Investment grade credit 10.00% 3.78%High yield 2.50% 6.82%Global diversified credit 5.00% 7.10%Credit oriented hedge funds 1.00% 6.60%Debt related private equity 2.00% 10.63%Debt related real estate 1.00% 6.61%Private real asset 2.50% 11.83%Equity related real estate 6.25% 9.23%U.S. equity 30.00% 8.19%Non-U.S. developed markets equity 11.50% 9.00%Emerging markets equity 6.50% 11.64%Buyouts/venture capital 8.25% 13.08%
-55-
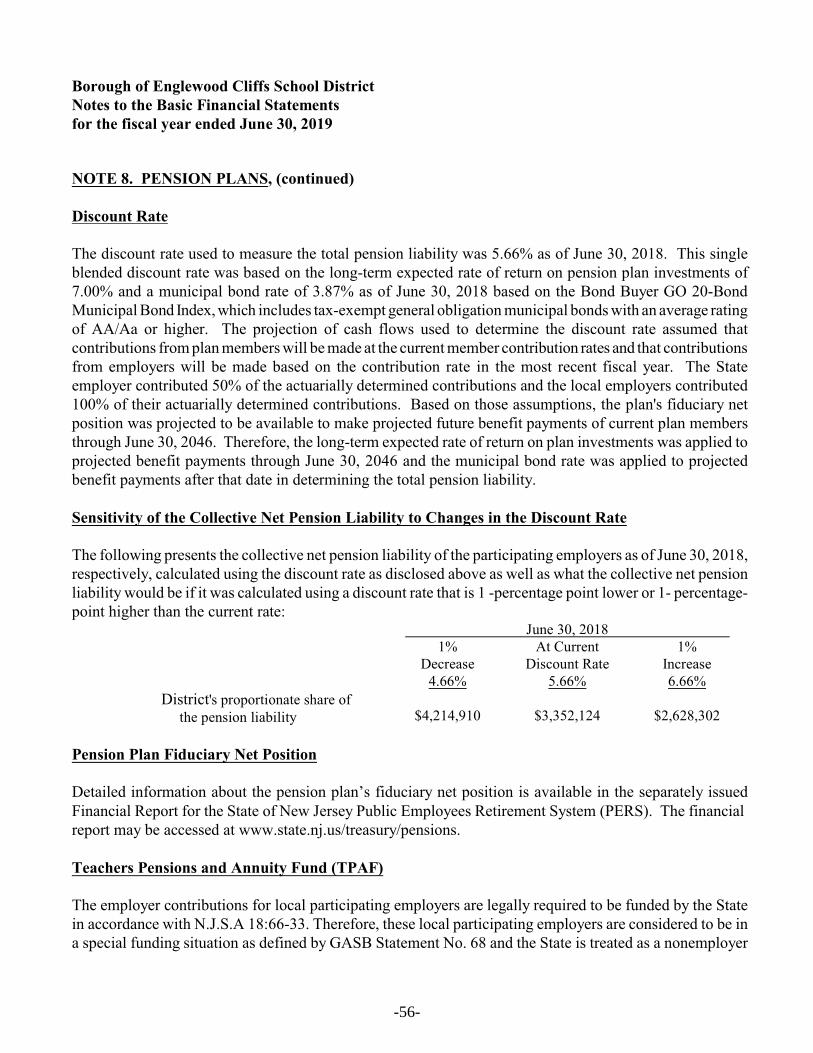
Borough of Englewood Cliffs School DistrictNotes to the Basic Financial Statementsfor the fiscal year ended June 30, 2019
NOTE 8. PENSION PLANS, (continued)
Discount Rate
The discount rate used to measure the total pension liability was 5.66% as of June 30, 2018. This singleblended discount rate was based on the long-term expected rate of return on pension plan investments of7.00% and a municipal bond rate of 3.87% as of June 30, 2018 based on the Bond Buyer GO 20-BondMunicipal Bond Index, which includes tax-exempt general obligation municipal bonds with an average ratingof AA/Aa or higher. The projection of cash flows used to determine the discount rate assumed thatcontributions from plan members will be made at the current member contribution rates and that contributionsfrom employers will be made based on the contribution rate in the most recent fiscal year. The Stateemployer contributed 50% of the actuarially determined contributions and the local employers contributed100% of their actuarially determined contributions. Based on those assumptions, the plan's fiduciary netposition was projected to be available to make projected future benefit payments of current plan membersthrough June 30, 2046. Therefore, the long-term expected rate of return on plan investments was applied toprojected benefit payments through June 30, 2046 and the municipal bond rate was applied to projectedbenefit payments after that date in determining the total pension liability.
Sensitivity of the Collective Net Pension Liability to Changes in the Discount Rate
The following presents the collective net pension liability of the participating employers as of June 30, 2018,respectively, calculated using the discount rate as disclosed above as well as what the collective net pensionliability would be if it was calculated using a discount rate that is 1 -percentage point lower or 1- percentage-point higher than the current rate:
June 30, 2018 1%
Decrease4.66%
At CurrentDiscount Rate
5.66%
1%Increase6.66%
District's proportionate share of the pension liability $4,214,910 $3,352,124 $2,628,302
Pension Plan Fiduciary Net Position
Detailed information about the pension plan’s fiduciary net position is available in the separately issuedFinancial Report for the State of New Jersey Public Employees Retirement System (PERS). The financial report may be accessed at www.state.nj.us/treasury/pensions.
Teachers Pensions and Annuity Fund (TPAF)
The employer contributions for local participating employers are legally required to be funded by the Statein accordance with N.J.S.A 18:66-33. Therefore, these local participating employers are considered to be ina special funding situation as defined by GASB Statement No. 68 and the State is treated as a nonemployer
-56-

Borough of Englewood Cliffs School DistrictNotes to the Basic Financial Statementsfor the fiscal year ended June 30, 2019
NOTE 8. PENSION PLANS, (continued)
contributing entity. Since the local participating employers do not contribute directly to the plan (except foremployer specific financed amounts), there is no net pension liability or deferred outflows or inflows to reportin the financial statements of the local participating employers. However, the notes to the financial statementsof the local participating employers must disclose the portion of the nonemployer contributing entities' totalproportionate share of the net pension liability that is associated with the local participating employer.
The portion of the TPAF Net Pension Liability that was associated with the District recognized at June 30,2019 was as follows:
Net Pension Liability:District's proportionate share $ -0- State's proportionate share
associated with the District 28,814,570$28,814,570
The net pension liability was measured as of June 30, 2018, and the total pension liability used to calculatethe net pension liability was determined by an actuarial valuation as of June 30, 2017 rolled forward toJune 30, 2018. The net pension liability associated with the District was based on a projection of the District'slong-term share of contributions to the pension plan relative to the projected contributions of all participatingschool districts and the State, actuarially determined. At June 30, 2018, the proportion of the TPAF netpension liability associated with the District was .0452932148%.
For the year ended June 30, 2019, the District recognized on-behalf pension expense and revenue of$1,679,789 for contributions provided by the State in the District-Wide Financial Statements.
Actuarial Assumptions
The total pension liability for the June 30, 2018 measurement date was determined by an actuarial valuationas of July 1, 2017, which was rolled forward to June 30, 2018. This actuarial valuation used the followingactuarial assumptions, applied to all periods in the measurement:
Inflation rate 2.25%Salary Increases 2011-2026 1.55%-4.55% Thereafter 2.00%-5.45%
Investment Rate of Return 7.00%
-57-
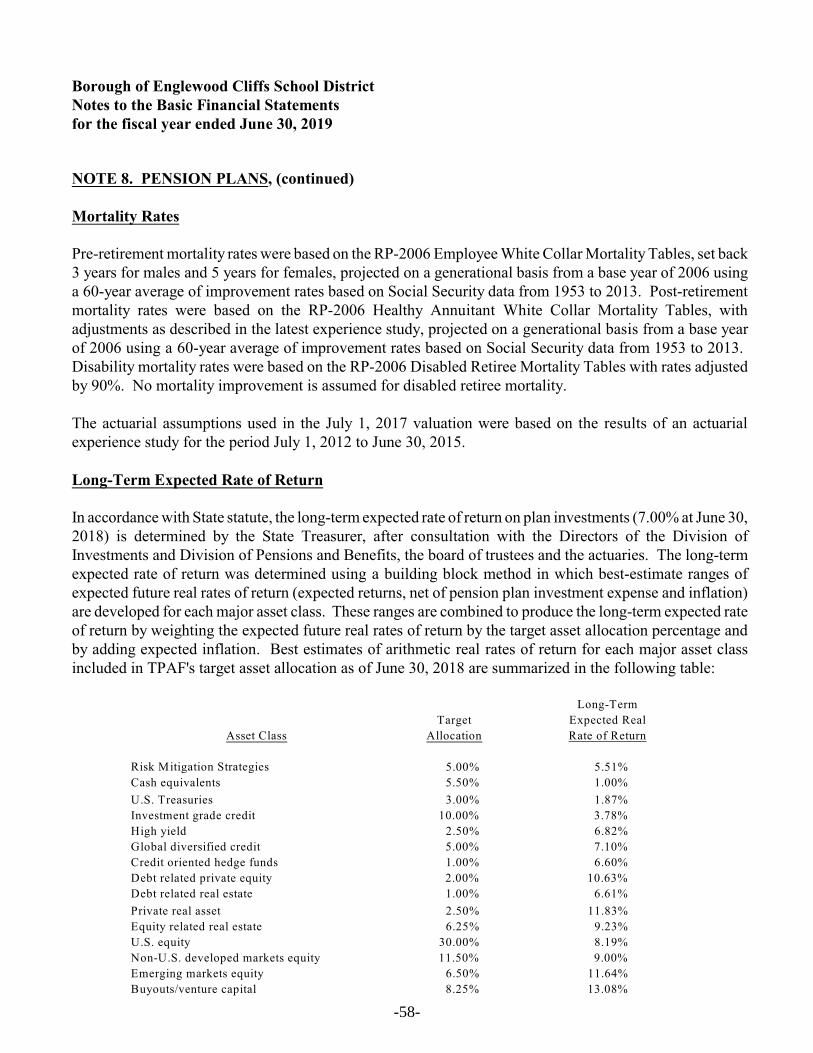
Borough of Englewood Cliffs School DistrictNotes to the Basic Financial Statementsfor the fiscal year ended June 30, 2019
NOTE 8. PENSION PLANS, (continued)
Mortality Rates
Pre-retirement mortality rates were based on the RP-2006 Employee White Collar Mortality Tables, set back3 years for males and 5 years for females, projected on a generational basis from a base year of 2006 usinga 60-year average of improvement rates based on Social Security data from 1953 to 2013. Post-retirementmortality rates were based on the RP-2006 Healthy Annuitant White Collar Mortality Tables, withadjustments as described in the latest experience study, projected on a generational basis from a base yearof 2006 using a 60-year average of improvement rates based on Social Security data from 1953 to 2013. Disability mortality rates were based on the RP-2006 Disabled Retiree Mortality Tables with rates adjustedby 90%. No mortality improvement is assumed for disabled retiree mortality.
The actuarial assumptions used in the July 1, 2017 valuation were based on the results of an actuarialexperience study for the period July 1, 2012 to June 30, 2015.
Long-Term Expected Rate of Return
In accordance with State statute, the long-term expected rate of return on plan investments (7.00% at June 30,2018) is determined by the State Treasurer, after consultation with the Directors of the Division ofInvestments and Division of Pensions and Benefits, the board of trustees and the actuaries. The long-termexpected rate of return was determined using a building block method in which best-estimate ranges ofexpected future real rates of return (expected returns, net of pension plan investment expense and inflation)are developed for each major asset class. These ranges are combined to produce the long-term expected rateof return by weighting the expected future real rates of return by the target asset allocation percentage andby adding expected inflation. Best estimates of arithmetic real rates of return for each major asset classincluded in TPAF's target asset allocation as of June 30, 2018 are summarized in the following table:
Asset Class
Target
Allocation
Long-Term
Expected Real
Rate of Return
Risk Mitigation Strategies 5.00% 5.51%
Cash equivalents 5.50% 1.00%
U.S. Treasuries 3.00% 1.87%
Investment grade credit 10.00% 3.78%
High yield 2.50% 6.82%
Global diversified credit 5.00% 7.10%
Credit oriented hedge funds 1.00% 6.60%
Debt related private equity 2.00% 10.63%
Debt related real estate 1.00% 6.61%
Private real asset 2.50% 11.83%
Equity related real estate 6.25% 9.23%
U.S. equity 30.00% 8.19%
Non-U.S. developed markets equity 11.50% 9.00%
Emerging markets equity 6.50% 11.64%
Buyouts/venture capital 8.25% 13.08%
-58-
Borough of Englewood Cliffs School DistrictNotes to the Basic Financial Statementsfor the fiscal year ended June 30, 2019
NOTE 8. PENSION PLANS, (continued)
Discount Rate
The discount rate used to measure the total pension liability was 4.86% and 4.25% as of June 30, 2018 and2017, respectively. This single blended discount rate was based on the long-term expected rate of return onpension plan investments of 7.00%, and a municipal bond rate of 3.87% and 3.58% as of June 30, 2018 and2017, respectively, based on the Bond Buyer Go 20-Bond Municipal Bond Index which includes tax-exemptgeneral obligation municipal bonds with an average rating of AA/Aa or higher. The projection of cash flowsused to determine the discount rate assumed that contributions from plan members will be made at the currentmember contribution rates and that contributions from employers will be made based on the contribution ratein the most recent fiscal year. The State contributed 50% of the actuary determined contributions. Based onthose assumptions, the plan's fiduciary net position was projected to be available to make projected futurebenefit payments of current plan members through 2040. Therefore, the long-term expected rate of return onplan investments was applied to projected benefit payments through 2040, and the municipal bond rate wasapplied to projected benefit payments after that date in determining the total pension liability.
Sensitivity of the Net Pension Liability to Changes in the Discount Rate
Because the District's proportionate share of the net pension liability is zero, consideration of potentialchanges in the discount rate is not applicable to the District.
NOTE 9. POST-RETIREMENT BENEFITS
General Information about the OPEB Plan
Plan Description and Benefits Provided
The State provides post-retirement medical (PRM) benefits for certain State and other retired employeesmeeting the service credit eligibility requirements. In Fiscal Year 2018, the State paid PRM benefits for148,401 State and local retirees.
The State funds post-retirement medical benefits on a “pay-as-you-go” basis, which means that the State doesnot pre-fund, or otherwise establish a reserve or other pool of assets against the PRM expenses that the Statemay incur in future years. For Fiscal Year 2018, the State contributed $1.909 billion to pay for pay-as-you-goPRM benefit costs incurred by covered retirees. The increase in the State's pay-as-you-go contributionbetween Fiscal Year 2017 and Fiscal Year 2018 is attributed to rising health costs, an increase in the numberof participants qualifying for State-paid PRM benefits at retirement and larger fund balance utilization inFiscal Year 2017 than in Fiscal Year 2018. The Fiscal Year 2019 Appropriations Act includes $1.921 billionas the State's contribution to fund pay-as-you-go PRM costs.
-59-

Borough of Englewood Cliffs School DistrictNotes to the Basic Financial Statementsfor the fiscal year ended June 30, 2019
NOTE 9. POST-RETIREMENT BENEFITS, (continued)
In accordance with the provisions of GASB Statement No. 75, Accounting and Financial Reporting forPostemployment Benefits Other Than Pensions, the State is required to quantify and disclose its obligationsto pay Other Postemployment Benefits (OPEB) to retired plan members. This new standard supersedes thepreviously issued guidance, GASB Statement No. 45, Accounting and Financial Reporting forPostemployment Benefits Other Than Pensions, effective for Fiscal Year 2018. The State is now requiredto accrue a liability in all instances where statutory language names the State as the legal obligor for benefitpayments. As such, the Fiscal Year 2017 total State OPEB liability to provide these benefits has been re-measured to $97.1 billion, an increase of $60.6 billion or 166 percent from the previous year's $36.5 billionliability booked in accordance with GASB Statement No. 45. For Fiscal Year 2018, the total OPEB liabilityfor the State is $90.5 billion, a decrease of $6.6 billion or 7 percent from the re-measured total OPEB liabilityin Fiscal Year 2017.
The School Employees Health Benefits Program (SEHBP) Act is found in New Jersey Statutes Annotated,Title 52, Article 17.25 et. seq. Rules governing the operation and administration of the program are foundin Title 17, Chapter 9 of the New Jersey Administrative Code.
No assets are accumulated in a trust that meets the criteria in paragraph 4 of GASB No. 75.
Total OPEB Liability
The State, a nonemployer contributing entity, is the only entity that has a legal obligation to make employercontributions to OPEB for qualified retired PERS and TPAF participants. The LEA's proportionate sharepercentage determined under paragraphs 193 and 203 through 205 of GASB No. 75 is zero percent. Accordingly, the LEA did not recognize any portion of the collective OPEB liability on the Statement of NetPosition. Accordingly, the following OPEB liability note information is reported at the State's level for theState Health Benefit Local Education Retired Employee's Plan and is not specific to the board ofeducation/board of trustees, and could be found at https://www.state.nj.us/treasury/pensions/GASBnoticesOPEB.
The portion of the OPEB Liability that was associated with the District recognized at June 30, 2019 was asfollows:
OPEB Liability:District's proportionate share $ -0- State's proportionate share
associated with the District 20,603,730
$20,603,730
-60-
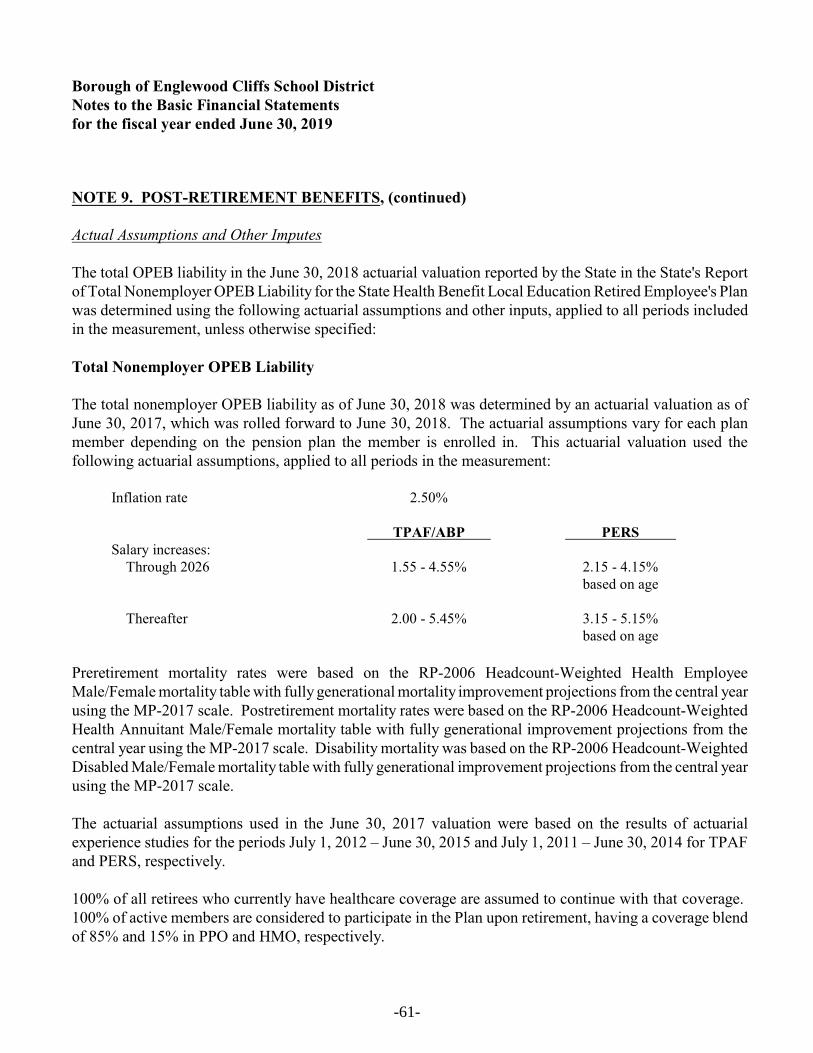
Borough of Englewood Cliffs School DistrictNotes to the Basic Financial Statementsfor the fiscal year ended June 30, 2019
NOTE 9. POST-RETIREMENT BENEFITS, (continued)
Actual Assumptions and Other Imputes
The total OPEB liability in the June 30, 2018 actuarial valuation reported by the State in the State's Reportof Total Nonemployer OPEB Liability for the State Health Benefit Local Education Retired Employee's Planwas determined using the following actuarial assumptions and other inputs, applied to all periods includedin the measurement, unless otherwise specified:
Total Nonemployer OPEB Liability
The total nonemployer OPEB liability as of June 30, 2018 was determined by an actuarial valuation as ofJune 30, 2017, which was rolled forward to June 30, 2018. The actuarial assumptions vary for each planmember depending on the pension plan the member is enrolled in. This actuarial valuation used thefollowing actuarial assumptions, applied to all periods in the measurement:
Inflation rate 2.50%
TPAF/ABP PERS Salary increases: Through 2026 1.55 - 4.55% 2.15 - 4.15%
based on age
Thereafter 2.00 - 5.45% 3.15 - 5.15%based on age
Preretirement mortality rates were based on the RP-2006 Headcount-Weighted Health EmployeeMale/Female mortality table with fully generational mortality improvement projections from the central yearusing the MP-2017 scale. Postretirement mortality rates were based on the RP-2006 Headcount-WeightedHealth Annuitant Male/Female mortality table with fully generational improvement projections from thecentral year using the MP-2017 scale. Disability mortality was based on the RP-2006 Headcount-WeightedDisabled Male/Female mortality table with fully generational improvement projections from the central yearusing the MP-2017 scale.
The actuarial assumptions used in the June 30, 2017 valuation were based on the results of actuarialexperience studies for the periods July 1, 2012 – June 30, 2015 and July 1, 2011 – June 30, 2014 for TPAFand PERS, respectively.
100% of all retirees who currently have healthcare coverage are assumed to continue with that coverage. 100% of active members are considered to participate in the Plan upon retirement, having a coverage blendof 85% and 15% in PPO and HMO, respectively.
-61-

Borough of Englewood Cliffs School DistrictNotes to the Basic Financial Statementsfor the fiscal year ended June 30, 2019
NOTE 9. POST-RETIREMENT BENEFITS, (continued)
(a) Health Care Trend Assumptions
For pre-Medicare preferred provider organization (PPO) and Health Maintenance Organization (HMO)medical benefits, the trend rate is initially 5.8% and decreases to a 5.0% long-term trend rate after eightyears. For self-insured post-65 PPO and HMO medical benefits, the trend rate is 4.5%. Forprescription drug benefits, the initial trend rate is 8.0% decreasing to a 5.0% long-term trend rate afterseven years. For the Medicare Part B reimbursement, the trend rate is 5.0%. The Medicare Advantagetrend rate is 4.5% and will continue in all future years.
(b) Discount Rate
The discount rate for June 30, 2018 was 3.87%. This represents the municipal bond return rate aschosen by the Division. The source is the Bond Buyer Go 20-Bond Municipal Bond Index, whichincludes tax-exempt general obligation municipal bonds with an average rating of AA/Aa or higher.
Sensitivity of Total Nonemployer OPEB Liability to Changes in the Discount Rate
Because the District's proportionate share of the OPEB liability is zero, consideration of potential changesin the discount rate is not applicable to the District.
Sensitivity of the Total Nonemployer OPEB Liability to Changes in the Healthcare Cost Trend Rates:
Because the District's proportionate share of the OPEB liability is zero, consideration of potential changesin the healthcare cost trend rates is not applicable to the District.
OPEB Expense and Deferred Outflows of Resources and Deferred Inflows of Resources Related to OPEB:
For the year ended June 30, 2019, the board of education/board of trustees recognized on-behalf OPEBexpense of $1,015,167 in the district-wide financial statements as determined by the State as the total OPEBliability for benefits provided through a defined benefit OPEB plan that is not administered through a trustthat meets the criteria in paragraph 4 of GASB No. 75 and in which there is a special funding situation.
In accordance with GASB No. 75, the Borough of Englewood Cliffs School District's proportionate share ofschool retirees OPEB is zero; therefore, there is no recognition of the allocation of proportionate share ofdeferred outflows of resources and deferred inflows of resources.
-62-

Borough of Englewood Cliffs School DistrictNotes to the Basic Financial Statementsfor the fiscal year ended June 30, 2019
NOTE 10. DEFERRED COMPENSATION
The Board offers its employees a choice of the following deferred compensation plans created in accordancewith Internal Revenue Code Section 403(b). The plans, which are administered by the entities listed below,permits participants to defer a portion of their salary until future years. Amounts deferred under the plansare not available to employees until termination, retirement, death or unforeseeable emergency. The planadministrators are as follows:
Equitable Equi-Vest Oppenheimer/InvescoValic Security Benefit
NOTE 11. RISK MANAGEMENT
The District is exposed to various risks of loss related to torts; theft of, damage to, and destruction of assets;errors and omissions; injuries to employees; and natural disasters.
Property and Liability Insurance - The District maintains commercial insurance coverage for property,liability, student accident and surety bonds. A complete schedule of insurance coverage can be found in theStatistical Section of this Comprehensive Annual Financial Report.
There has been no significant reduction in insurance coverage from the previous year nor have there been anysettlements in excess of insurance coverages.
New Jersey Unemployment Compensation Insurance - The District has elected to fund its New JerseyUnemployment Compensation Insurance under the “Contributory Method”. Under this plan, the Districtremits contributions directly to the New Jersey Unemployment Trust Fund. The following is a summary ofDistrict contributions, employee contributions, reimbursements to the State for benefits paid and the endingbalance of the District’s expendable trust fund for the current and previous two years:
Fiscal Year
Interest Earnings/District
ContributionsEmployee
ContributionsAmount
ReimbursedEndingBalance
2018-2019 $-0- $-0- $-0- $-0-
2017-2018 -0- -0- -0- -0-
2016-2017 -0- -0- -0- -0-
-63-
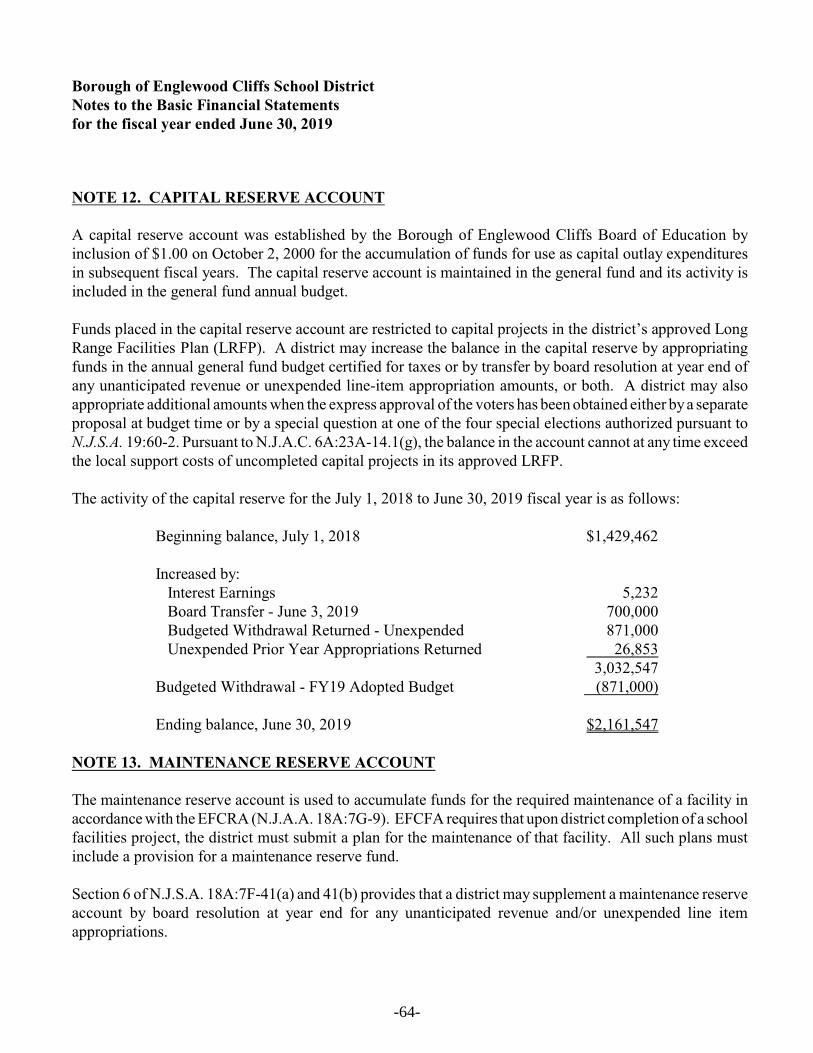
Borough of Englewood Cliffs School DistrictNotes to the Basic Financial Statementsfor the fiscal year ended June 30, 2019
NOTE 12. CAPITAL RESERVE ACCOUNT
A capital reserve account was established by the Borough of Englewood Cliffs Board of Education byinclusion of $1.00 on October 2, 2000 for the accumulation of funds for use as capital outlay expendituresin subsequent fiscal years. The capital reserve account is maintained in the general fund and its activity isincluded in the general fund annual budget.
Funds placed in the capital reserve account are restricted to capital projects in the district’s approved LongRange Facilities Plan (LRFP). A district may increase the balance in the capital reserve by appropriatingfunds in the annual general fund budget certified for taxes or by transfer by board resolution at year end ofany unanticipated revenue or unexpended line-item appropriation amounts, or both. A district may alsoappropriate additional amounts when the express approval of the voters has been obtained either by a separateproposal at budget time or by a special question at one of the four special elections authorized pursuant toN.J.S.A. 19:60-2. Pursuant to N.J.A.C. 6A:23A-14.1(g), the balance in the account cannot at any time exceedthe local support costs of uncompleted capital projects in its approved LRFP.
The activity of the capital reserve for the July 1, 2018 to June 30, 2019 fiscal year is as follows:
Beginning balance, July 1, 2018 $1,429,462
Increased by: Interest Earnings 5,232 Board Transfer - June 3, 2019 700,000 Budgeted Withdrawal Returned - Unexpended 871,000 Unexpended Prior Year Appropriations Returned 26,853
3,032,547Budgeted Withdrawal - FY19 Adopted Budget (871,000)
Ending balance, June 30, 2019 $2,161,547
NOTE 13. MAINTENANCE RESERVE ACCOUNT
The maintenance reserve account is used to accumulate funds for the required maintenance of a facility inaccordance with the EFCRA (N.J.A.A. 18A:7G-9). EFCFA requires that upon district completion of a schoolfacilities project, the district must submit a plan for the maintenance of that facility. All such plans mustinclude a provision for a maintenance reserve fund.
Section 6 of N.J.S.A. 18A:7F-41(a) and 41(b) provides that a district may supplement a maintenance reserveaccount by board resolution at year end for any unanticipated revenue and/or unexpended line itemappropriations.
-64-
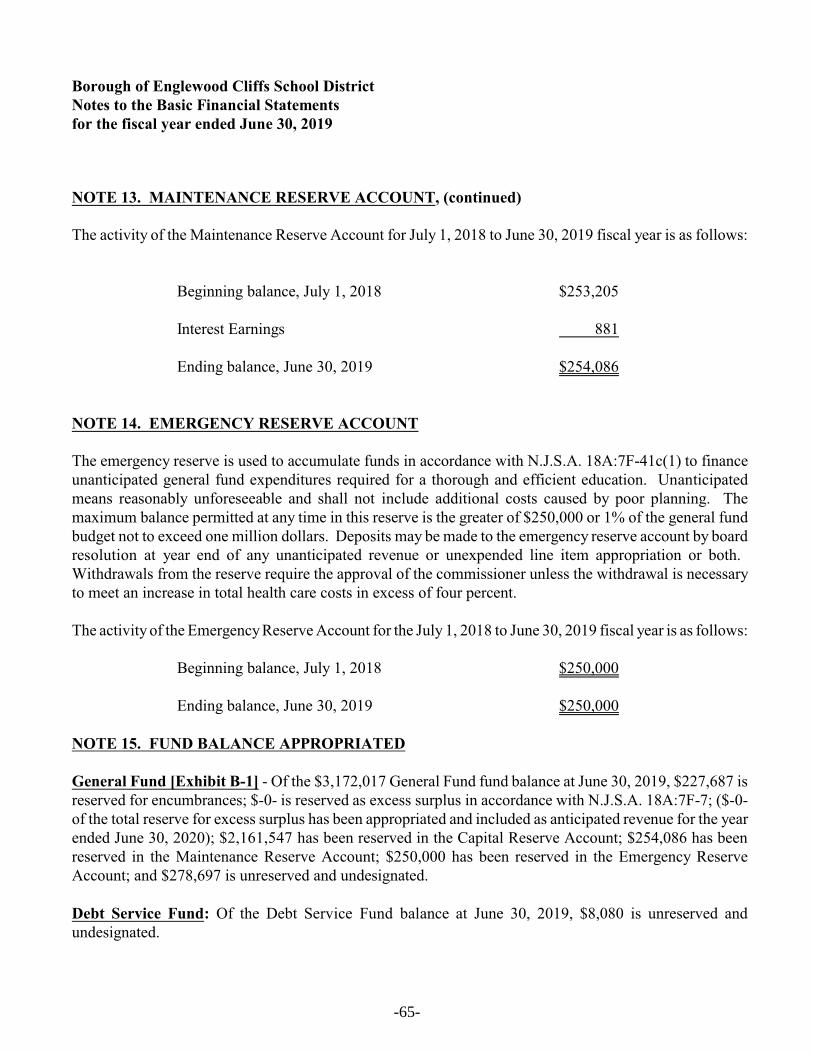
Borough of Englewood Cliffs School DistrictNotes to the Basic Financial Statementsfor the fiscal year ended June 30, 2019
NOTE 13. MAINTENANCE RESERVE ACCOUNT, (continued)
The activity of the Maintenance Reserve Account for July 1, 2018 to June 30, 2019 fiscal year is as follows:
Beginning balance, July 1, 2018 $253,205
Interest Earnings 881
Ending balance, June 30, 2019 $254,086
NOTE 14. EMERGENCY RESERVE ACCOUNT
The emergency reserve is used to accumulate funds in accordance with N.J.S.A. 18A:7F-41c(1) to financeunanticipated general fund expenditures required for a thorough and efficient education. Unanticipatedmeans reasonably unforeseeable and shall not include additional costs caused by poor planning. Themaximum balance permitted at any time in this reserve is the greater of $250,000 or 1% of the general fundbudget not to exceed one million dollars. Deposits may be made to the emergency reserve account by boardresolution at year end of any unanticipated revenue or unexpended line item appropriation or both. Withdrawals from the reserve require the approval of the commissioner unless the withdrawal is necessaryto meet an increase in total health care costs in excess of four percent.
The activity of the Emergency Reserve Account for the July 1, 2018 to June 30, 2019 fiscal year is as follows:
Beginning balance, July 1, 2018 $250,000
Ending balance, June 30, 2019 $250,000
NOTE 15. FUND BALANCE APPROPRIATED
General Fund [Exhibit B-1] - Of the $3,172,017 General Fund fund balance at June 30, 2019, $227,687 isreserved for encumbrances; $-0- is reserved as excess surplus in accordance with N.J.S.A. 18A:7F-7; ($-0-of the total reserve for excess surplus has been appropriated and included as anticipated revenue for the yearended June 30, 2020); $2,161,547 has been reserved in the Capital Reserve Account; $254,086 has beenreserved in the Maintenance Reserve Account; $250,000 has been reserved in the Emergency ReserveAccount; and $278,697 is unreserved and undesignated.
Debt Service Fund: Of the Debt Service Fund balance at June 30, 2019, $8,080 is unreserved andundesignated.
-65-

Borough of Englewood Cliffs School DistrictNotes to the Basic Financial Statementsfor the fiscal year ended June 30, 2019
NOTE 16. CALCULATION OF EXCESS SURPLUS
In accordance with N.J.S.A. 18A:7F-7 as amended, the designation for Reserved Fund Balance - ExcessSurplus is a required calculation pursuant to the New Jersey Comprehensive Educational Improvement andFinancing Act of 1996 (CEIFA). New Jersey school districts are required to reserve General Fund fundbalance at the fiscal year end of June 30 if they did not appropriate a required minimum amount as budgetedfund balance in their subsequent years’ budget. The excess fund balance for the year ended June 30, 2019is $-0- of which $-0- is the result of current year's operations and $-0- is prior year excess surplus.
NOTE 17. CONTINGENT LIABILITIES
Grant Programs - The school district participates in federally assisted grant programs. These programs aresubject to program compliance audits by the grantors or their representatives. The school district ispotentially liable for expenditures which may be disallowed pursuant to the terms of these grant programs. Management is not aware of any material items of noncompliance which would result in the disallowanceof program expenditures.
Litigation - The District is a party defendant in some lawsuits, none of a kind unusual for a school districtof its size and scope of operation. In the opinion of the Board's Attorney the potential claims against theDistrict not covered by insurance policies would not materially affect the financial condition of the District.
NOTE 18. SUBSEQUENT EVENTS
The Board has evaluated subsequent events through November 8, 2019, the date which the financialstatements were available to be issued and no other items were noted for disclosure.
-66-
REQUIRED SUPPLEMENTARY
INFORMATION - PART II

BUDGETARY COMPARISON SCHEDULES

Page 1 of 5
Exhibit C-1
BudgetOriginal Transfers/ Final VarianceBudget Adjustments Budget Actual Final to Actual
REVENUES:General Fund:
Revenues from Local Sources: Local Tax Levy 13,222,907 13,222,907 13,222,907 Tuition 273,600 273,600 281,823 8,223 Unrestricted Miscellaneous Revenues 30,000 30,000 68,961 38,961 Interest Earned on Maintenance Reserve 250 250 880 630 Interest Earned on Capital Reserve Funds 5,000 5,000 5,232 232Total - Local Sources 13,531,757 13,531,757 13,579,803 48,046Revenues from State Sources:
Categorical Special Education Aid 263,965 263,965 263,965Categorical Security Aid 8,968 8,968 8,968Categorical Transportation Aid 106,203 34,866 141,069 141,069Extraordinary Aid 300,000 300,000 271,306 (28,694)
Other Unrestricted State Aid - NonPublic Tarnsportation Aid 30,711 30,711On-behalf TPAF Post-Retirement Medical (non-budgeted) 395,584 395,584On-behalf TPAF Pension (non-budgeted) 854,222 854,222On-behalf TPAF NCGI Premium (non-budgeted) 17,881 17,881On-behalf TPAF - LTDI 1,075 1,075Reimbursed TPAF Social Security Contributions (non-budgeted) 344,688 344,688Total - State Sources 679,136 34,866 714,002 2,329,469 1,615,467
TOTAL REVENUES 14,210,893 34,866 14,245,759 15,909,272 1,663,513
EXPENDITURES:Current Expense:Regular Programs - Instruction
Preschool-Salaries of Teachers 132,741 2,290 135,031 135,031Kindergarten - Salaries of Teachers 360,644 (114,875) 245,769 245,769Grades 1-5 - Salaries of Teachers 1,738,758 16,190 1,754,948 1,754,948Grades 6-8 - Salaries of Teachers 1,002,444 (13,337) 989,107 989,107Grades 9-12 - Salaries of Teachers
Regular Programs - Home Instruction:Salaries of Teachers 180 180 180
Regular Programs - Undistributed InstructionOther Salaries for Instruction 1,000 1,204 2,204 2,204Purchased Professional-Educational Services 8,777 3,054 11,831 11,806 25Purchased Technical Services 38,542 22,495 61,037 47,283 13,754Other Purchased Services (400-500 series) 85,361 (27,830) 57,531 57,523 8General Supplies 198,674 209,900 408,574 205,855 202,719Textbooks 6,300 6,300 134 6,166Other Objects 23,663 (1,005) 22,658 22,486 172TOTAL REGULAR PROGRAMS - INSTRUCTION 3,590,604 104,566 3,695,170 3,472,326 222,844
SPECIAL EDUCATION - INSTRUCTIONResource Room/Resource Center:
Salaries of Teachers 767,200 (78,246) 688,954 666,032 22,922General Supplies 3,932 (2,875) 1,057 755 302
Total Resource Room/Resource Center 771,132 (81,121) 690,011 666,787 23,224Preschool Disabilities- Full-Time:
Salaries of Teachers 9,364 9,364 8,774 590Other Salaries for Instruction 71,700 71,700 71,524 176General Supplies 1,000 1,000 598 402
Total Preschool Disabilities - Full-Time 82,064 82,064 80,896 1,168Home Instruction
Salaries of Teachers 551 551 551Purchased Professional-Education Services
Total Home Instruction 551 551 551
TOTAL SPECIAL EDUCATION - INSTRUCTION 853,196 (80,570) 772,626 748,234 24,392
Basic Skills/Remedial - InstructionSalaries of Teachers 87,969 (876) 87,093 86,278 815General Supplies 797 797 797
Total Basic Skills/Remedial - Instruction 87,969 (79) 87,890 87,075 815
ENGLEWOOD CLIFFS BOARD OF EDUCATIONBudgetary Comparison Schedule
General FundFiscal Year Ended June 30, 2019
-67-

Page 2 of 5
Exhibit C-1
BudgetOriginal Transfers/ Final VarianceBudget Adjustments Budget Actual Final to Actual
ENGLEWOOD CLIFFS BOARD OF EDUCATIONBudgetary Comparison Schedule
General FundFiscal Year Ended June 30, 2019
Bilingual Education - InstructionSalaries of Teachers 90,248 3,196 93,444 93,444General Supplies 850 507 1,357 1,337 20
Total Bilingual Education - Instruction 91,098 3,703 94,801 94,781 20
School-Sponsored Cocurricular Activities - InstructionSalaries 1,500 1,500 1,500Supplies and Materials 3,000 3,000 3,000
Total School-Sponsored Cocurricular Activities - Instruction 4,500 4,500 3,000 1,500Other Supplemental/At Risk Prog-Inst
Salaries of Reading Specialist 80,740 80,740 80,740Total Other Supplemental/At Risk Prog-Inst 80,740 80,740 80,740
TOTAL INSTRUCTION 4,627,367 108,360 4,735,727 4,486,156 249,571
Tuition to Other LEAs Within the State - Regular 795,851 (119,600) 676,251 657,847 18,404Tuition to Other LEAs Within the State - Special 456,056 (106,665) 349,391 340,501 8,890Tuition to County Voc. School Dist. - Regular 390,852 27,711 418,563 418,563Tuition to County Voc. School Dist. - Special 54,000 27,000 81,000 81,000Tuition to CSSD & Regional Day Schools 291,000 (200,580) 90,420 90,420Tuition to Private Schools for the Handicapped - Within State 337,302 139,628 476,930 445,702 31,228
Total Undistributed Expenditures - Instruction: 2,325,061 (232,506) 2,092,555 2,034,033 58,522Undist. Expend. - Health Services
Salaries 150,030 (21,950) 128,080 125,537 2,543Purchased Professional and Technical Services 7,134 2,663 9,797 4,769 5,028Other Purchased Services (400-500 series) 1,000 (897) 103 40 63Supplies and Materials 10,466 (4,089) 6,377 5,713 664
Total Undistributed Expenditures - Health Services 168,630 (24,273) 144,357 136,059 8,298Undist. Expend. - Speech, OT, PT & Related Services
Salaries 96,288 1,675 97,963 97,013 950Purchased Prof. Services-Educational Services 193,135 2,646 195,781 165,202 30,579Supplies and Materials 4,000 (1,472) 2,528 2,308 220
Total Undist. Expend. - Speech, OT, PT & Related Serv. 293,423 2,849 296,272 264,523 31,749Undist. Expend. - Other Supp. Serv. Students-Extra. Serv.
Salaries 357,879 4,601 362,480 361,994 486Purchased Prof. Services-Educational Services 55,000 (7,450) 47,550 4,255 43,295Other Objects 3,600 3,600 3,600
Total Undist. Expend. -Other Supp. Serv. Students-Extra. Serv. 416,479 (2,849) 413,630 366,249 47,381Undist. Expend. - Guidance
Salaries of Other Professional Staff 92,610 3,080 95,690 94,539 1,151Salaries of Secretarial and Clerical Assistants 21,741 21,741 21,741Other Purchased Services (400-500 series) 800 (252) 548 40 508Supplies and Materials 2,650 (2,242) 408 199 209Other Objects 1,120 (300) 820 820
Total Undist. Expend. - Guidance 118,921 286 119,207 117,339 1,868Undist. Expend. - Child Study Teams
Salaries of Other Professional Staff 330,919 39,582 370,501 368,271 2,230Salaries of Secretarial and Clerical Assistants 50,031 50,031 50,031Purchased Prof. Services-Educational Services 3,000 2,360 5,360 3,384 1,976Other Purchased Prof. and Tech Services 49,450 (5,016) 44,434 43,374 1,060Other Purchased Services (400-500 series) 5,150 736 5,886 5577 309Misc. Pur Services (400-500 Series O/than Resid Costs)Supplies and Materials 10,800 (5,250) 5,550 5,139 411Other Objects 1,225 (105) 1,120 1,120
Total Undist. Expend. - Child Study Teams 450,575 32,307 482,882 476,896 5,986Undist. Expend. - Improvement of Instructional Services
Salaries of Supervisors of Instruction 94,668 3,156 97,824 97,824Salaries of Other Professional Staff 17,280 17,280 14,115 3,165Supplies and Materials 300 292 592 592Other Purch Services (400-500) 690 (100) 590 483 107Other Objects 980 1,989 2,969 2,969
Total Undist. Expend. - Improvement of Inst. Services 113,918 5,337 119,255 115,983 3,272Undist. Expend. - Educational Media Serv./Sch. Library
Salaries 75,940 (156) 75,784 75,730 54Salaries of Technology Coordinators 112,725 8,766 121,491 121,491Purchased Professional and Technical Services 6,909 (18) 6,891 6,891Other Purch Services (400-500) 200 (25) 175 175Supplies and Materials 3,700 873 4,573 4,455 118Other Objects 65 65 65
Total Undist. Expend. - Educational Media Serv./Sch. Library 199,539 9,440 208,979 208,807 172Undist. Expend. - Instructional Staff Training Serv.
Sal Ser. & Clerical Asst. 3,037 3,037 3,037Other Salaries
Undistributed Expenditures - Instruction:
-68-

Page 3 of 5
Exhibit C-1
BudgetOriginal Transfers/ Final VarianceBudget Adjustments Budget Actual Final to Actual
ENGLEWOOD CLIFFS BOARD OF EDUCATIONBudgetary Comparison Schedule
General FundFiscal Year Ended June 30, 2019
Purchased Professional - Educational Services 60,385 (10,716) 49,669 35,477 14,192Other Purchased Services (400-500 series)Supplies and Materials 10,895 17,507 28,402 28,389 13Other Objects
Total Undist. Expend. - Instructional Staff Training Serv. 71,280 9,828 81,108 66,903 14,205Undist. Expend. - Supp. Serv. - General Administration
Salaries 226,098 226,098 226,098Legal Services 55,000 20,307 75,307 75,307Audit Fees 20,500 20,500 41,000 20,500 20,500Architectural/Engineering Services 35,500 2,727 38,227 38,227Other Purchased Professional Services 1,750 (50) 1,700 1,500 200Purchased Technical ServicesCommunications/Telephone 21,689 (915) 20,774 17,113 3,661BOE Other Purchased ServicesMisc . Purch Services (400-500 Series) 33,052 (391) 32,661 32,649 12General Supplies 2,330 (803) 1,527 1,471 56BOE In House Training/Meeting Supplies 240 341 581 575 6Misc. Expenditures 2,525 (950) 1,575 1,575BOE Membership Dues and Fees 9,800 83 9,883 9,883
Total Undist. Expend. - Supp. Serv. - General Administration 408,484 40,849 449,333 424,898 24,435Undist. Expend. - Support Serv. - School Administration
Salaries of Principals/Assistant Principals 68,824 10,000 78,824 71,472 7,352Salaries of Secretarial and Clerical Assistants 106,184 8,228 114,412 105,628 8,784Purchased Prof & Technical Services 2,098 (174) 1,924 1,924Other Purchased Services (400-500 series) 3,437 1,123 4,560 4,028 532Supplies and Materials 6,890 (495) 6,395 6,354 41Other Objects 1,370 198 1,568 1,568
Total Undist. Expend. - Support Serv. - School Administration 188,803 18,880 207,683 190,974 16,709Undist. Expend. - Support Serv. - Central Services
Salaries 197,038 18,390 215,428 201,384 14,044Purchased Professional Services 20,000 (5,768) 14,232 9,577 4,655Purchased Technical Services 11,689 1,861 13,550 13,550Misc. Pur Services (400-500 Series) 1,477 120 1,597 1,597Supplies and Materials 5,230 148 5,378 5,059 319Other ObjectsMiscellaneous Expenditures 1,495 383 1,878 1,878
Total Undist. Expend. - Support Serv. - Central Services 236,929 15,134 252,063 233,045 19,018Undist. Expend. -Admin. Info. Tech
Salaries 34,986 (29,903) 5,083 5,046 37Purchased Professional Services 3,000 18,954 21,954 5,350 16,604Purchased Technical Services 55,365 11,586 66,951 63,046 3,905Other Purchased Services (400-500 series) 800 3,602 4,402 3,877 525Supplies and Materials 7,000 2,839 9,839 8,922 917
Total Undist. Expend. - Admin. Info. Tech 101,151 7,078 108,229 86,241 21,988Undist. Expend. - Required Maint. for School Facilities (261)
Lead TestingCleaning, Repair and Maintenance Services 83,090 14,571 97,661 94,420 3,241General Supplies 21,824 20,818 42,642 42,642Other Objects 946 (1) 945 945
Total 'Undist. Expend. - Required Maint. for School Facilities 105,860 35,388 141,248 138,007 3,241Undist. Expend. - Custodial Services (262)
Salaries 372,496 (13,472) 359,024 359,024Salaries of Non-Instructional Aides 70,520 (5,354) 65,166 64,953 213Cleaning, Repair and Maintenance Services 28,048 536 28,584 28,253 331Other Purchased Property Services 19,393 (4,691) 14,702 14,376 326Insurance 49,100 (1,940) 47,160 47,160Travel 11 11 11Miscellaneous Purchased Services 2,500 (2,500)General Supplies 43,733 (6,448) 37,285 37,059 226Energy (Natural Gas) 48,200 (3,532) 44,668 42,370 2,298Energy (Electricity) 103,400 9,318 112,718 77,603 35,115Other Objects
Total Undist. Expend. - Custodial Services (262) 737,390 (28,072) 709,318 670,809 38,509Undist. Expend. - Care & Upkeep of Grounds
Cleaning, Repair and Maintenance Services 78,330 (24,231) 54,099 49,421 4,678General Supplies 4,500 3,107 7,607 7,607
Total Undist. Expend. - Care & Upkeep of Grounds 82,830 (21,124) 61,706 57,028 4,678
-69-

Page 4 of 5
Exhibit C-1
BudgetOriginal Transfers/ Final VarianceBudget Adjustments Budget Actual Final to Actual
ENGLEWOOD CLIFFS BOARD OF EDUCATIONBudgetary Comparison Schedule
General FundFiscal Year Ended June 30, 2019
Undist. Expend. - SecuritySalaries 43,200 43,200 40,538 2,662Cleaning, Repair and Maintenance Services 13,923 7,190 21,113 17,777 3,336General Supplies 1,000 15,475 16,475 5,885 10,590
Total Undist. Expend. - Security 58,123 22,665 80,788 64,200 16,588Undist. Expend. - Student Transportation Services (270)
Salaries of Non-Instructional Aides 50,600 2,135 52,735 50,450 2,285Sal. For Pupil Trans (Bet Home & Sch)-Reg 15,046 15,046 15,046Contract Serv.-Aid in Lieu Pymts-NonPub Sch 84,000 (459) 83,541 83,000 541Contr Serv. (Bet. Home and Sch) VendorsContr Serv. (Oth than Bet. Home and Sch)-Vendors 15,580 15,580 11,155 4,425Contr Serv. (Bet. Home & Sch) Joint Agrmnts 479,576 49,268 528,844 461,345 67,499Contract Serv. (Sp Ed Stds)-Joint Agrmnts 403,214 (50,944) 352,270 329,488 22,782
Total Undist. Expend. - Student Transportation Services 1,048,016 1,048,016 950,484 97,532
UNALLOCATED BENEFITS Social Security Contributions 148,250 148,250 138,010 10,240Other Retirement Contributions-PERS 180,427 1,397 181,824 171,847 9,977Other Retirement Contributions-Regular 4,680 4,680 4,413 267Unemployment Compensation 27,500 1,562 29,062 25,219 3,843Workmen's Compensation 39,924 4,735 44,659 44,659Health Benefits 1,968,590 99,702 2,068,292 1,795,922 272,370Tuition Reimbursement 23,000 (33) 22,967 21,129 1,838Other Employee Benefits 38,610 10,918 49,528 49,528Unused Sick Payment to Term/Retired Staff 100,000 (25,000) 75,000 25,000 50,000
TOTAL UNALLOCATED BENEFITS 2,530,981 93,281 2,624,262 2,275,727 348,535On-behalf TPAF Post-Retirement Medical (non-budgeted) 395,584 395,584On-behalf TPAF Pension (non-budgeted) 854,222 854,222On-behalf TPAF NCGI Premium (non-budgeted) 17,881 17,881On-behalf TPAF - LTDI 1,075 1,075Reimbursed TPAF Social Security Contributions (non-budgeted) 344,688 344,688
TOTAL ON-BEHALF CONTRIBUTIONS 1,613,450 (1,613,450)
TOTAL PERSONAL SERVICES - EMPLOYEE BENEFITS 2,530,981 93,281 2,624,262 3,889,177 (1,264,915)
TOTAL UNDISTRIBUTED EXPENDITURES 9,656,393 (15,502) 9,640,891 10,491,655 (850,764)
TOTAL GENERAL CURRENT EXPENSE 14,283,760 92,858 14,376,618 14,977,811 (601,193)
Undist. Expenditures: Admin Info Tech 32,518 5,398 37,916 10,173 27,743Custodial Services 16,911 16,911 7,466 9,445Non-Instructional Services 32,518 32,518 32,518
Total Undist. Expend. 32,518 54,827 87,345 50,157 37,188Facilities Acquisition and Construction Services
Architectural/Engineering Services 191,000 191,000 191,000Other Purchased Prof. & Tech. Services 23,368 3,400 26,768 26,092 676Construction Services 1,469,294 931 1,470,225 718,720 751,505Assessment for Debt Service on SDA Funding 5,625 5,625 5,625
Total Facilities Acquisition and Construction Services 1,689,287 4,331 1,693,618 750,437 943,181
TOTAL CAPITAL OUTLAY 1,721,805 59,158 1,780,963 800,594 980,369
TOTAL EXPENDITURES 16,005,565 152,016 16,157,581 15,778,405 379,176
Excess (Deficiency) of RevenuesOver (Under) Expenditures (1,794,672) (117,150) (1,911,822) 130,867 2,042,689
Excess (Deficiency) of Revenues and Other Financing SourcesOver (Under) Expenditures and Other Financing Sources (Uses) (1,794,672) (117,150) (1,911,822) 130,867 2,042,689
Fund Balance, July 1 3,074,049 3,074,049 3,074,049
Fund Balance, June 30 1,279,377 (117,150) 1,162,227 3,204,916 2,042,689
-70-

Page 5 of 5
Exhibit C-1
BudgetOriginal Transfers/ Final VarianceBudget Adjustments Budget Actual Final to Actual
ENGLEWOOD CLIFFS BOARD OF EDUCATIONBudgetary Comparison Schedule
General FundFiscal Year Ended June 30, 2019
Recapitulation of Excess (Deficiency) of Revenues Over (Under) ExpendituresAdjustment for Prior Year Encumbrances (928,922) (928,922) (928,922)Increase:
Capital Reserve - Principal 700,000 (700,000)Capital Reserve - Interest 5,000 5,000 5,232 (232)Capital Reserve - Capital Projects Cancelled 897,854 (897,854)Maintenance Reserve - Interest 250 250 880 (630)
Withdrawal from Capital Reserve (871,000) (871,000) (871,000)Budgeted Fund Balance (117,150) (117,150) (1,473,099) 5,441,327
(1,794,672) (117,150) (1,911,822) 130,867 2,042,689
Recapitulation:Restriced Fund Balance:
Excess Surplus - Designated for Subsequent Years' ExpendituresCapital Reserve 2,161,547 Maintenance Reserve 254,086 Emergency Reserve 250,000
Assigned Fund Balance:Year-End Encumbrances 227,687
Unassigned Fund Balance: 311,596 3,204,916
Recapitulation to Governmental Fund Statement (GAAP):Less: Last State Aid Payment not Recognized GAAP Basis (32,899)
Total Fund Balance per Governmental Funds (GAAP) 3,172,017
-71-

Exh
ibit
C-2
Bud
get
Orig
inal
Tran
sfer
s/Fi
nal
Var
ianc
eB
udge
tA
djus
tmen
tsB
udge
tA
ctua
lFi
nal t
o A
ctua
lR
EV
EN
UE
S:St
ate
Sour
ces
25,2
54
12,5
64
37,8
18
35,0
61
(2,7
57)
Fe
dera
l Sou
rces
160,
858
71,4
08
232,
266
223,
801
(8,4
65)
Tot
al R
even
ues
186,
112
83,9
72
270,
084
258,
862
(11,
222)
EX
PEN
DIT
UR
ES:
Inst
ruct
ion:
Oth
er P
urch
ased
Ser
vice
s (40
0-50
0 Se
ries)
119,
737
56
119,
793
119,
793
-
G
ener
al S
uppl
ies
27,8
81
15,4
67
43,3
48
36,8
01
6,54
7
T
extb
ooks
4,60
2
57
8
5,18
0
5,
175
5
T
otal
inst
ruct
ion
152,
220
16,1
01
168,
321
161,
769
6,55
2
Supp
ort s
ervi
ces:
Pur
chas
ed P
rofe
ssio
nal a
nd T
echn
ical
Ser
vice
s26
,242
39
,746
65
,988
64
,339
1,
649
Oth
er P
urch
ased
Ser
vice
s (40
0-50
0 Se
ries)
1,17
5
1,
175
788
38
7
Sup
plie
s and
Mat
eria
ls7,
650
10,0
50
17,7
00
15,0
66
2,63
4
T
otal
supp
ort s
ervi
ces
33,8
92
50,9
71
84,8
63
80,1
93
4,67
0
Faci
litie
s acq
uisi
tion
and
cons
tuct
ion
serv
ices
: O
ther
Pur
chas
ed P
rofe
ssio
nal S
ervi
ces
-
-
Ins
truct
iona
l Equ
ipm
ent
16,9
00
16,9
00
16,9
00
-
O
ther
Pur
chas
ed S
ervi
ces
-
-
Sup
plie
s and
Mat
eria
ls-
-
-
-
T
otal
faci
litie
s acq
uisi
tion
and
cons
tuct
ion
serv
ices
-
16
,900
16
,900
16
,900
-
Tot
al E
xpen
ditu
res
186,
112
83,9
72
270,
084
258,
862
11,2
22
Exc
ess (
Def
icie
ncy)
of R
even
ues O
ver
(Und
er)
Exp
endi
ture
s and
Oth
er F
inan
cing
Sou
rces
(Use
s)-
-
-
-
-
EN
GL
EW
OO
D C
LIF
FS B
OA
RD
OF
ED
UC
AT
ION
Bud
geta
ry C
ompa
riso
n Sc
hedu
le
Spec
ial R
even
ue F
und
Fisc
al Y
ear
End
ed J
une
30, 2
019
-72-

Exhibit C-3
Note A - Explanation of Differences between Budgetary Inflows and Outflows and GAAP Revenues and Expenditures
SpecialGeneral Revenue
Fund FundSources/inflows of resourcesActual amounts (budgetary basis) "revenue"
from the budgetary comparison schedule [C-1],[C-2] 15,909,272 258,862
Difference - budget to GAAP:Grant accounting budgetary basis differs from GAAP in that encumbrances are recognized as expenditures, and the related revenue is recognized. (18,472)
State aid payment recognized for GAAP statements in the current year, previously recognized for budgetary purposes. 24,658
The last state aid payment is recognized as revenue for budgetarypurposes, and differs from GAAP which does not recognize thisrevenue until the subsequent year when the State recognizes therelated expense (GASB 33) (32,899)
Total revenues as reported on the statement of revenues, expenditures and changes in fund balances - governmental funds. [B-2] 15,901,031 240,390
Uses/outflows of resourcesActual amounts (budgetary basis) "total outflows" from the [C-1],[C-2] 15,778,405 258,862
budgetary comparison schedule
Differences - budget to GAAPEncumbrances for supplies and equipment ordered butreceived are reported in the year the order is placed forbudgetary purposes, but in the year the supplies are receivedfor financial reporting purposes. (18,472)
Total expenditures as reported on the statement of revenues, expenditures, and changes in fund balances - governmental funds [B-2] 15,778,405 240,390
ENGLEWOOD CLIFFS BOARD OF EDUCATIONRequired Supplementary Information
Budgetary Comparison Schedule Note to Required Supplementary Information - Part II
Fiscal Year Ended June 30, 2019
-73-

REQUIRED SUPPLEMENTARY
INFORMATION - PART III

Exhibit L-1
Schedules of Required Supplementary InformationSchedule of District's Share of Net Pension Liability - PERS
Last 10 Fiscal Years*
District'sDistrict's District's Proportionate Share Plan Fiduciary
Proportion Proportionate Share of the Net Pension Net Position asof the Net of the Net District's Covered Liability (Asset) as a Percentage of the
Fiscal Year Pension Liability Pension Liability Payroll - PERS a Percentage of Its' Total PensionEnding June 30, (Asset) (Asset) Employee's Covered Payroll Liability
2015 0.0152065979% 2,847,091$ 1,080,524$ 263.49% 52.08%2016 0.0142095476% 3,189,759 1,180,020 270.31% 47.93%2017 0.0171520092% 5,079,933 1,182,605 429.55% 59.86%2018 0.0171392665% 3,989,747 1,213,811 328.70% 51.90%2019 0.0170249300% 3,352,124 1,062,985 315.35% 46.40%
* GASB requires that ten years of information be presented. However, since fiscal year 2015 was the first year ofGASB 68 implementation ten years is not presented. Each year thereafter, an additional year will be included until tenyears of data is presented.
ENGLEWOOD CLIFFS BOARD OF EDUCATION
-74-

Exhibit L-2
Contributions in ContributionsRelations to the District's PERS as a Percentage
Contractually Contractually Contribution Covered- of PERS Covered-Fiscal Year Required Required Deficiency Employee Employee
Ending June 30, Contribution Contributions (Excess) Payroll Payroll
2015 125,361$ 125,361$ -$ 1,080,524$ 11.60%2016 122,164 122,164 - 1,180,020 10.35%2017 152,376 152,376 - 1,182,605 12.88%2018 158,777 158,777 - 1,213,811 13.08%2019 169,343 169,343 - 1,062,985 15.93%
* GASB requires that ten years of information be presented. However, since fiscal year 2015 was the first year ofGASB 68 implementation ten years is not presented. Each year thereafter, an additional year will be included until tenyears of data is presented.
ENGLEWOOD CLIFFS BOARD OF EDUCATIONSchedules of Required Supplementary Information
Schedule of District's Contributions - PERSLast 10 Fiscal Years*
-75-

Exhibit L-3
Schedules of Required Supplementary InformationSchedule of District's Share of Net Pension Liability - TPAF
Last 10 Fiscal Years*
State'sProportionate District's
District's District's Share of the Net Proportionate Share Plan FiduciaryProportion Proportionate Share Pension Liability of the Net Pension Net Position asof the Net of the Net Associated with District's Covered Liability (Asset) as a Percentage of
Fiscal Year Pension Liability Pension Liability the District Payroll - TPAF a Percentage of Its' the Total PensionEnding June 30, (Asset) (Asset) (Asset) Employee's Covered Payroll Liability
2015 0.0360689950% -$ 19,277,704$ 4,335,126$ 0.00% 33.64%2016 0.0380913907% - 24,075,386 4,393,888 0.00% 28.71%2017 0.0419659794% - 33,013,111 4,507,810 0.00% 22.33%2018 0.0448742572% - 30,255,842 4,680,802 0.00% 25.41%2019 0.0452932148% - 28,814,570 5,036,691 0.00% 26.49%
* GASB requires that ten years of information be presented. However, since fiscal year 2015 was the first year ofGASB 68 implementation ten years is not presented. Each year thereafter, an additional year will be included until tenyears of data is presented.
ENGLEWOOD CLIFFS BOARD OF EDUCATION
-76-
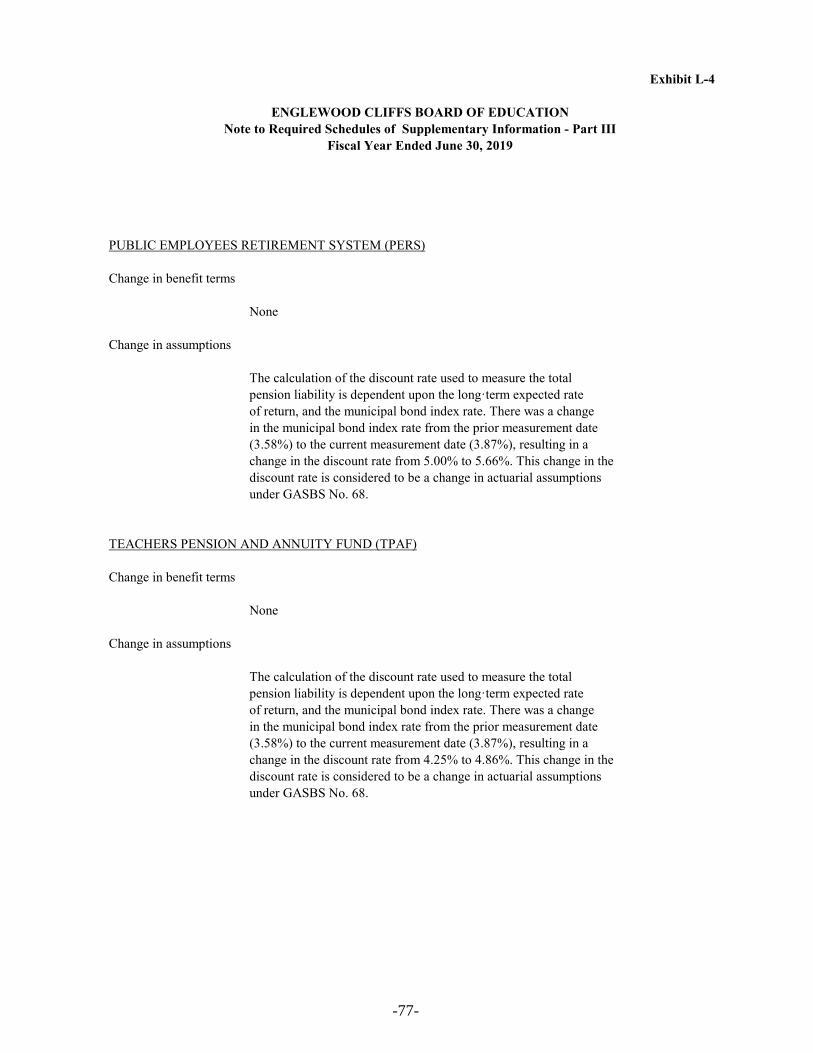
Exhibit L-4
Note to Required Schedules of Supplementary Information - Part III
PUBLIC EMPLOYEES RETIREMENT SYSTEM (PERS)
Change in benefit terms
None
Change in assumptions
The calculation of the discount rate used to measure the total pension liability is dependent upon the long·term expected rate of return, and the municipal bond index rate. There was a change in the municipal bond index rate from the prior measurement date (3.58%) to the current measurement date (3.87%), resulting in a change in the discount rate from 5.00% to 5.66%. This change in the discount rate is considered to be a change in actuarial assumptions under GASBS No. 68.
TEACHERS PENSION AND ANNUITY FUND (TPAF)
Change in benefit terms
None
Change in assumptions
The calculation of the discount rate used to measure the total pension liability is dependent upon the long·term expected rate of return, and the municipal bond index rate. There was a change in the municipal bond index rate from the prior measurement date (3.58%) to the current measurement date (3.87%), resulting in a change in the discount rate from 4.25% to 4.86%. This change in the discount rate is considered to be a change in actuarial assumptions under GASBS No. 68.
ENGLEWOOD CLIFFS BOARD OF EDUCATION
Fiscal Year Ended June 30, 2019
-77-

Exhibit M-1
Schedule of Required Supplementary InformationSchedule of Changes in the District's Proportionate Share of the State OPEB Liability
Last 10 Fiscal Years*
2019 2018Total OPEB Liability
Service Costs 879,761$ 1,063,587$ Interest on Total OPEB Liability 859,013 740,889Difference between Expected and Actual Experience (1,617,406)Changes in Assumptions (2,364,381) (3,095,742)Gross Benefit Payments (550,936) (541,499)Contribution from the Member 19,041 19,939Net Changes in total Share of OPEB Liability (2,774,908) (1,812,826) Total OPEB Liability - Beginning 23,378,638 25,191,464Total OPEB Liability - Ending 20,603,730$ 23,378,638$
District's Proportionate Share of OPEB Liability -$ -$ State's Proportionate Share of OPEB Liability 20,603,730 23,378,638Total OPEB Liability - Ending 20,603,730$ 23,378,638$
District's Covered Employee Payroll 6,250,502$ 5,863,407$
Districts' Proportionate Share of theTotal OPEB Liability as a Percentage of its
Covered Payroll 0% 0%
Notes to Schedule:
No assets are accumulated in a trust that meets the criteria inparagraph 4 of GASB 75.
Change in benefit terms None
Change in assumptions Assumptions used in calculating the OPEB liability are presentedin Note 8.
* GASB requires that ten years of information be presented. However, since fiscal year 2018 was the first year ofGASB 75 implementation ten years is not presented. Each year thereafter, an additional year will be included until tenyears of data is presented.
ENGLEWOOD CLIFFS BOARD OF EDUCATION
-78-

Supplementary Schedules

SPECIAL REVENUE FUND

Exh
ibit
E-1
(Pas
s Thr
ough
)T
itle
III,
Tot
alE
nglis
h B
roug
htT
itle
III
Lan
guag
eFo
rwar
dT
itle
IT
itle
II,
Imm
igra
ntT
itle
III
Enh
ance
men
tT
otal
s(E
x. E
-1b)
Part
APa
rt A
Car
ryov
erIm
mig
rant
& E
nric
hmen
tT
itle
IV20
19R
EV
EN
UE
S S
tate
Sou
rces
35,0
61
35
,061
Fed
eral
Sou
rces
119,
793
65
,183
12,2
93
1,
866
9,69
7
3,16
0
11
,809
223,
801
T
otal
Rev
enue
s15
4,85
4
65,1
83
12
,293
1,86
6
9,
697
3,
160
11,8
09
25
8,86
2
EX
PEN
DIT
UR
ES:
Inst
ruct
ion:
Oth
er P
urch
ased
Ser
vice
s (40
0-50
0 se
ries)
119,
793
11
9,79
3
Gen
eral
Sup
plie
s3,
374
18,5
77
1,
078
9,69
7
3,16
0
91
5
36,8
01
T
extb
ooks
5,17
5
5,
175
Tot
al in
stru
ctio
n12
8,34
2
18,5
77
-
1,
078
9,69
7
3,16
0
91
5
161,
769
Supp
ort S
ervi
ces:
Pur
chas
ed P
rofe
ssio
nal a
nd T
echn
ical
Ser
vice
s11
,446
40,6
0012
,293
64,3
39
O
ther
Pur
chas
ed S
ervi
ces (
400-
500
serie
s)-
78
8
788
Sup
plie
s and
Mat
eria
ls15
,066
15,0
66
Tot
al su
ppor
t ser
vice
s26
,512
40,6
00
12
,293
788
-
-
-
80
,193
Faci
litie
s acq
uisi
tion
and
cons
t. se
rv.:
Ins
truct
iona
l Equ
ipm
ent
-
6,00
610
,894
16,9
00
Tot
al fa
cilit
ies a
cqui
sitio
n an
d co
nst.
serv
.-
6,
006
-
-
10
,894
16,9
00
Tot
al E
xpen
ditu
res
154,
854
65
,183
12,2
93
1,
866
9,69
7
3,16
0
11
,809
258,
862
Exc
ess (
Def
icie
ncy)
of R
even
ues O
ver
(Und
er)
E
xpen
ditu
res a
nd O
ther
Fin
anci
ng S
ourc
es (U
ses)
-
-
-
-
-
-
-
-
EN
GL
EW
OO
D C
LIF
FS B
OA
RD
OF
ED
UC
AT
ION
Spec
ial R
even
ue F
und
Com
bini
ng S
ched
ule
of P
rogr
am R
even
ues a
nd E
xpen
ditu
res -
Bud
geta
ry B
asis
Fisc
al Y
ear
End
ed J
une
30, 2
019
-79-

Exh
ibit
E-1
a
N.J
. Non
publ
icN
.J. N
onpu
blic
N.J
. Non
publ
icN
.J. N
onpu
blic
IDE
AID
EA
Par
t BN
ursi
ngSe
curi
tyT
echn
olog
yT
extb
ook
Tot
als
Part
B, B
asic
Pres
choo
lSe
rvic
esA
idA
idA
id20
19R
EV
EN
UE
S S
tate
Sou
rces
11,4
46
15
,066
3,37
4
5,17
5
35,0
61
F
eder
al S
ourc
es11
5,27
2
4,52
1
119,
793
T
otal
Rev
enue
s11
5,27
2
4,52
1
11,4
46
15
,066
3,37
4
5,17
5
154,
854
EX
PEN
DIT
UR
ES:
Inst
ruct
ion:
Oth
er P
urch
ased
Ser
vice
s (40
0-50
0 se
ries)
115,
272
4,
521
11
9,79
3
Gen
eral
Sup
plie
s3,
374
3,
374
T
extb
ooks
5,17
5
5,17
5
Tot
al in
stru
ctio
n11
5,27
2
4,52
1
-
-
3,37
4
5,17
5
128,
342
Supp
ort S
ervi
ces:
Pur
chas
ed P
rofe
ssio
nal a
nd T
echn
ical
Ser
vice
s11
,446
11,4
46
O
ther
Pur
chas
ed S
ervi
ces (
400-
500
serie
s)-
S
uppl
ies a
nd M
ater
ials
15,0
66
15
,066
Tot
al su
ppor
t ser
vice
s-
-
11
,446
15,0
66
-
-
26
,512
Tot
al E
xpen
ditu
res
115,
272
4,
521
11
,446
15,0
66
3,
374
5,
175
15
4,85
4
Exc
ess (
Def
icie
ncy)
of R
even
ues O
ver
(Und
er)
E
xpen
ditu
res a
nd O
ther
Fin
anci
ng S
ourc
es (U
ses)
-
-
-
-
-
-
-
EN
GL
EW
OO
D C
LIF
FS B
OA
RD
OF
ED
UC
AT
ION
Spec
ial R
even
ue F
und
Com
bini
ng S
ched
ule
of P
rogr
am R
even
ues a
nd E
xpen
ditu
res -
Bud
geta
ry B
asis
Fisc
al Y
ear
End
ed J
une
30, 2
019
-80-

PROPRIETARY FUNDS
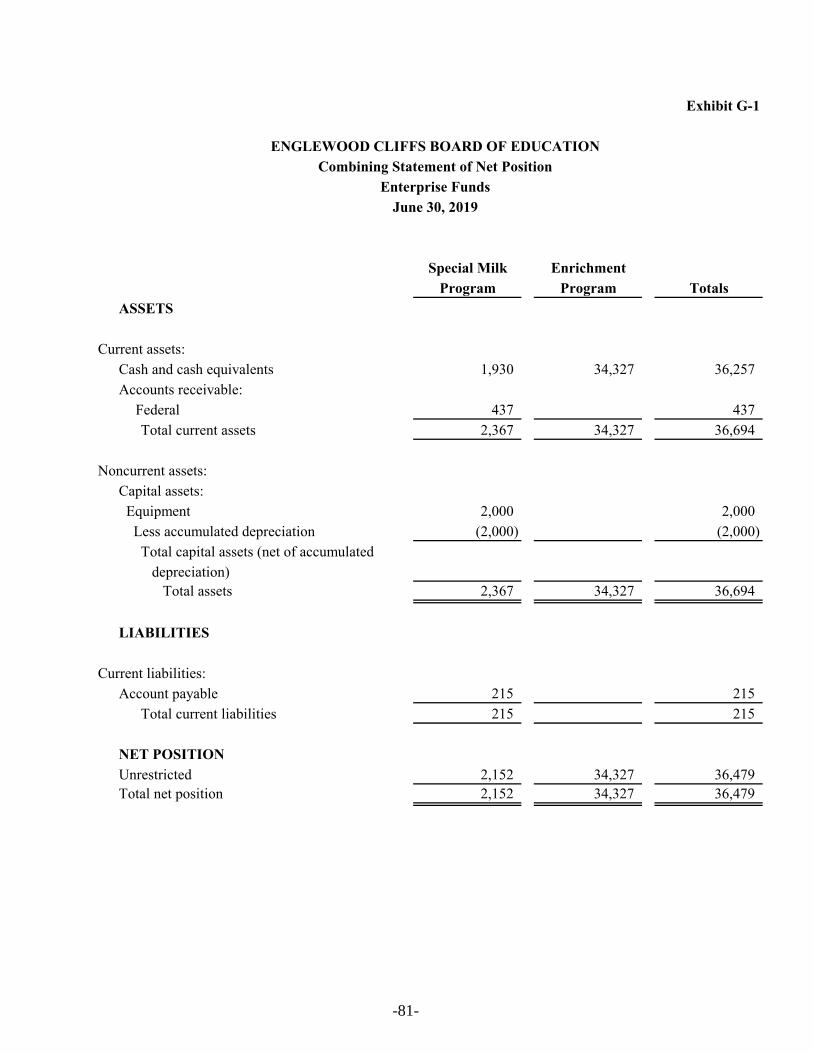
Exhibit G-1
Special Milk EnrichmentProgram Program Totals
ASSETS
Current assets:Cash and cash equivalents 1,930 34,327 36,257Accounts receivable:
Federal 437 437 Total current assets 2,367 34,327 36,694
Noncurrent assets:Capital assets: Equipment 2,000 2,000 Less accumulated depreciation (2,000) (2,000) Total capital assets (net of accumulated depreciation) Total assets 2,367 34,327 36,694
LIABILITIES
Current liabilities:Account payable 215 215 Total current liabilities 215 215
NET POSITIONUnrestricted 2,152 34,327 36,479Total net position 2,152 34,327 36,479
ENGLEWOOD CLIFFS BOARD OF EDUCATIONCombining Statement of Net Position
Enterprise FundsJune 30, 2019
-81-
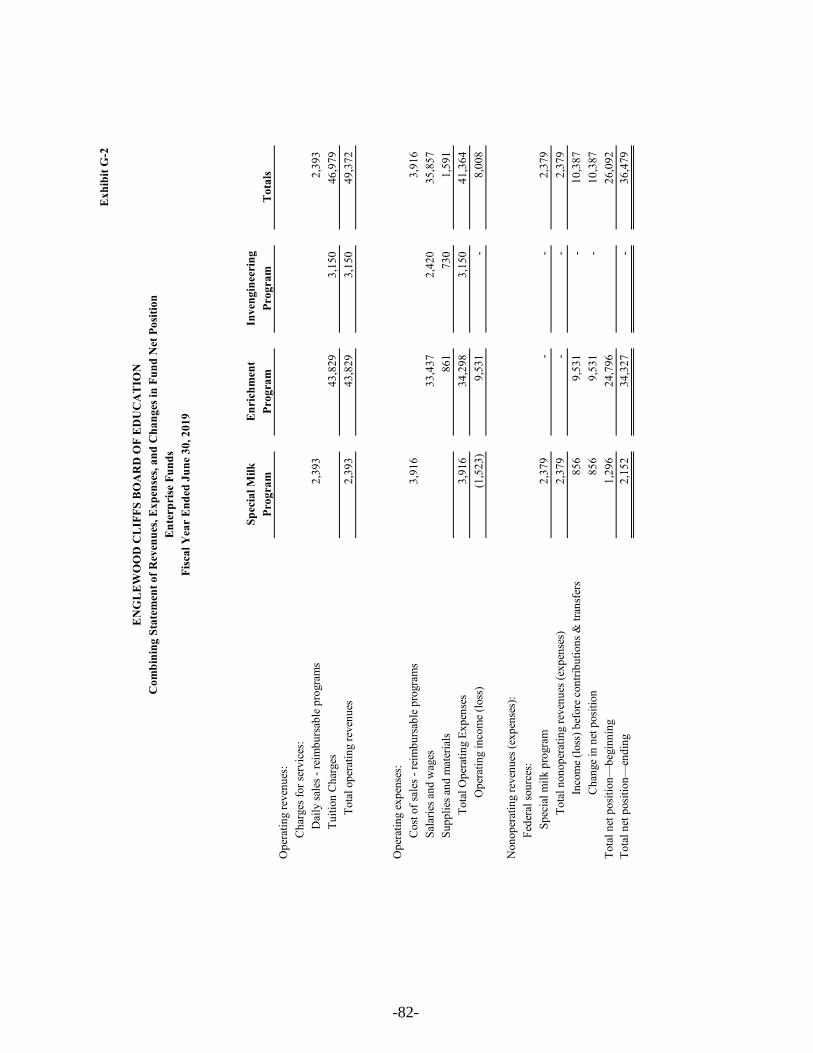
Exh
ibit
G-2
Spec
ial M
ilkE
nric
hmen
tIn
veng
inee
ring
Prog
ram
Prog
ram
Prog
ram
Tot
als
Ope
ratin
g re
venu
es:
Cha
rges
for s
ervi
ces:
D
aily
sale
s - re
imbu
rsab
le p
rogr
ams
2,39
3
2,
393
Tu
ition
Cha
rges
43,8
29
3,15
0
46
,979
T
otal
ope
ratin
g re
venu
es2,
393
43,8
29
3,15
0
49
,372
Ope
ratin
g ex
pens
es:
Cos
t of s
ales
- re
imbu
rsab
le p
rogr
ams
3,91
6
3,
916
Sala
ries a
nd w
ages
33,4
37
2,42
0
35
,857
Su
pplie
s and
mat
eria
ls86
1
730
1,
591
Tot
al O
pera
ting
Expe
nses
3,91
6
34
,298
3,
150
41,3
64
Ope
ratin
g in
com
e (lo
ss)
(1,5
23)
9,53
1
-
8,
008
Non
oper
atin
g re
venu
es (e
xpen
ses)
:Fe
dera
l sou
rces
:
Spec
ial m
ilk p
rogr
am2,
379
-
-
2,37
9
T
otal
non
oper
atin
g re
venu
es (e
xpen
ses)
2,37
9
-
-
2,
379
In
com
e (lo
ss) b
efor
e co
ntrib
utio
ns &
tran
sfer
s85
6
9,53
1
-
10
,387
Cha
nge
in n
et p
ositi
on85
6
9,53
1
-
10
,387
To
tal n
et p
ositi
on—
begi
nnin
g1,
296
24,7
96
26,0
92
Tota
l net
pos
ition
—en
ding
2,15
2
34
,327
-
36
,479
EN
GL
EW
OO
D C
LIF
FS B
OA
RD
OF
ED
UC
AT
ION
Com
bini
ng S
tate
men
t of R
even
ues,
Exp
ense
s, an
d C
hang
es in
Fun
d N
et P
ositi
onE
nter
prise
Fun
dsFi
scal
Yea
r E
nded
Jun
e 30
, 201
9
-82-

Exh
ibit
G-3
Com
bini
ng S
tate
men
t of C
ash
Flow
sE
nter
prise
Fun
ds
Spec
ial M
ilkE
nric
hmen
tIn
veng
inee
ring
Prog
ram
Prog
ram
Prog
ram
Tot
als
CA
SH F
LO
WS
FRO
M O
PER
AT
ING
AC
TIV
ITIE
SR
ecei
pts f
rom
cus
tom
ers
2,39
343
,829
3,15
049
,372
Pa
ymen
ts fo
r milk
pur
chas
es(4
,429
)
(4,4
29)
Pa
ymen
ts fo
r sal
arie
s and
wag
es(3
3,43
7)
(2
,420
)
(35,
857)
Paym
ents
for U
tiliti
es(6
,065
)
(6,0
65)
Pa
ymen
ts fo
r sup
plie
s(8
61)
(730
)
(1
,591
)
N
et c
ash
prov
ided
by
(use
d fo
r) op
erat
ing
activ
ities
(2,0
36)
3,46
6
-
1,
430
A
CT
IVIT
IES
Fede
ral s
ourc
es2,
459
2,
459
Net
cas
h pr
ovid
ed b
y (u
sed
for)
non-
capi
tal f
inan
cing
act
iviti
es2,
459
-
-
2,
459
N
et in
crea
se (d
ecre
ase)
in c
ash
and
cash
equ
ival
ents
423
3,46
6
-
3,
889
B
alan
ces—
begi
nnin
g of
yea
r1,
507
30
,861
-
32,3
68
Bal
ance
s—en
d of
yea
r1,
930
34
,327
-
36,2
57
Rec
onci
liatio
n of
ope
ratin
g in
com
e (lo
ss) t
o ne
t cas
h pr
ovid
ed
(use
d) b
y op
erat
ing
activ
ities
:
Ope
ratin
g in
com
e (lo
ss)
(1,5
23)
9,
531
-
8,00
8
pr
ovid
ed b
y
(
used
for)
oper
atin
g ac
tiviti
es
I
ncre
ase
(dec
reas
e) in
acc
ount
s pay
able
(513
)
(6
,065
)
(6,5
78)
To
tal a
djus
tmen
ts(5
13)
(6,0
65)
-
(6,5
78)
N
et c
ash
prov
ided
by
(use
d fo
r) op
erat
ing
activ
ities
(2,0
36)
3,
466
-
1,43
0
EN
GL
EW
OO
D C
LIF
FS B
OA
RD
OF
ED
UC
AT
ION
Fisc
al Y
ear
End
ed J
une
30, 2
019
-83-

FIDUCIARY FUND
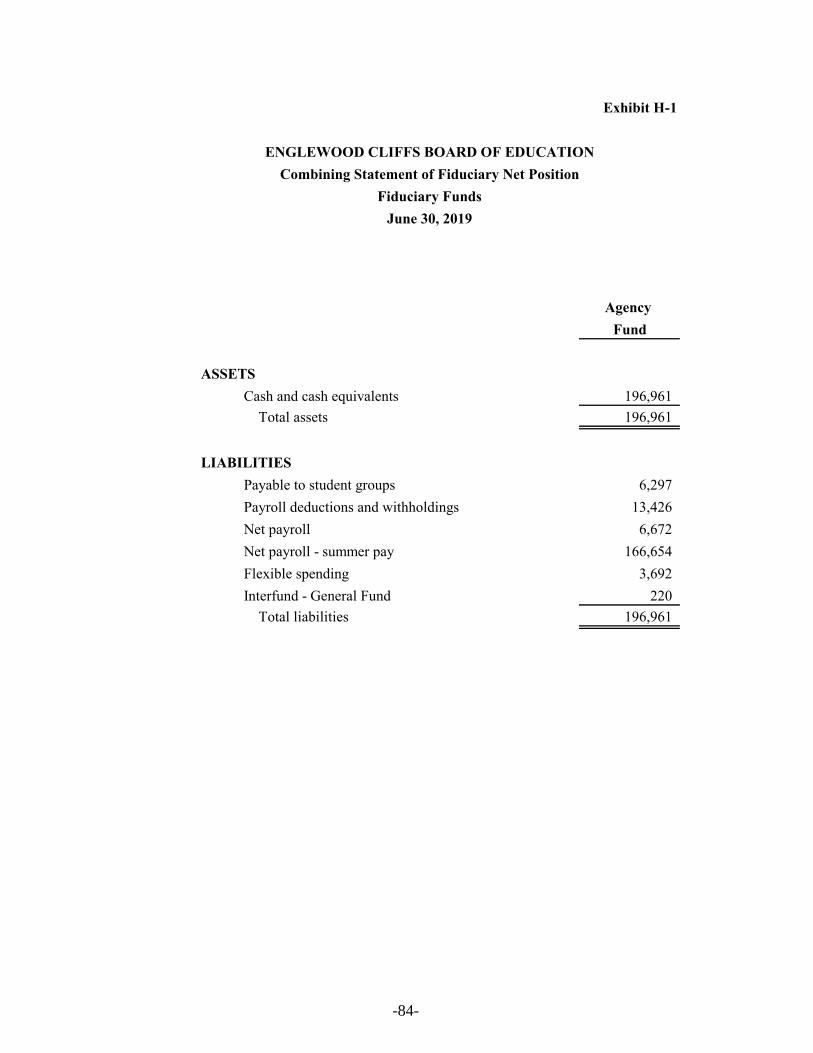
Exhibit H-1
Agency Fund
ASSETSCash and cash equivalents 196,961 Total assets 196,961
LIABILITIES Payable to student groups 6,297Payroll deductions and withholdings 13,426Net payroll 6,672Net payroll - summer pay 166,654Flexible spending 3,692Interfund - General Fund 220 Total liabilities 196,961
ENGLEWOOD CLIFFS BOARD OF EDUCATIONCombining Statement of Fiduciary Net Position
Fiduciary FundsJune 30, 2019
-84-

Exhibit H-3
Student Activity Agency FundSchedule of Receipts and Disbursements
Balance Cash Cash BalanceJuly 1, 2018 Receipts Disbursed June 30, 2019
Upper School 6,707 60,528 60,938 6,297
Total All Schools 6,707 60,528 60,938 6,297
ENGLEWOOD CLIFFS BOARD OF EDUCATION
Fiscal Year Ended June 30, 2019
-85-

Exhibit H-4
Payroll Agency FundSchedule of Receipts and Disbursements
Balance Cash Cash BalanceJuly 1, 2018 Receipts Disbursed June 30, 2019
Interfund Payable - General Fund 220 220 Net Payroll 6,672 4,040,424 4,040,424 6,672 Flexible Spending Account 4,101 8,506 8,915 3,692 Payroll Deductions and Withholdings 63,811 3,651,458 3,701,843 13,426 Summer Pay 196,378 166,956 196,680 166,654
271,182 7,867,344 7,947,862 190,664
ENGLEWOOD CLIFFS BOARD OF EDUCATION
Fiscal Year Ended June 30, 2019
-86-

LONG-TERM DEBT

Exh
ibit
I-1
Dat
e of
Am
ount
of
Ann
ual M
atur
ities
Inte
rest
Bal
ance
Bal
ance
ISSU
EIs
sue
Issu
eD
ate
Am
ount
Rat
eJu
ly 1
, 201
8D
ecre
ased
June
30,
201
9
Scho
ol R
efun
ding
Bon
ds4/
19/2
017
1,68
5,00
08/
15/2
019
335,
000
1.
700%
$1,
350,
000
33
0,00
0
1,
020,
000
8/
15/2
020
345,
000
1.
700%
8/15
/202
134
0,00
0
1.70
0%
$1,
350,
000
33
0,00
0
1,
020,
000
EN
GL
EW
OO
D C
LIF
FS B
OA
RD
OF
ED
UC
AT
ION
June
30,
201
9
Gen
eral
Lon
g T
erm
Deb
t Acc
ount
Gro
upSt
atem
ent o
f Ser
ial B
onds
-87-

Exh
ibit
I-2
Bud
geta
ry C
ompa
riso
n Sc
hedu
le
Deb
t Ser
vice
Fun
d
Var
ianc
eO
rigin
alB
udge
tFi
nal
Posit
ive
(Neg
ativ
e)B
udge
tTr
ansf
ers
Bud
get
Act
ual
Fina
l to
Act
ual
RE
VE
NU
ES:
Loca
l Sou
rces
:Lo
cal T
ax L
evy
72,9
61
72,9
61
72,9
61
-
St
ate
Sour
ces:
Deb
t Ser
vice
Aid
Typ
e II
88,2
90
88,2
90
88,2
90
-
Tota
l - S
tate
Sou
rces
88,2
90
-
88
,290
88
,290
-
Tot
al R
even
ues
161,
251
-
16
1,25
1
16
1,25
1
-
EX
PEN
DIT
UR
ES:
Reg
ular
Deb
t Ser
vice
:In
tere
st20
,145
20
,145
20
,145
-
Red
empt
ion
of P
rinci
pal
330,
000
330,
000
330,
000
-
Tota
l Reg
ular
Deb
t Ser
vice
350,
145
-
35
0,14
5
35
0,14
5
-
Tot
al e
xpen
ditu
res
350,
145
-
35
0,14
5
35
0,14
5
-
Exce
ss (D
efic
ienc
y) o
f Rev
enue
s Ove
r (U
nder
) Exp
endi
ture
s(1
88,8
94)
-
(1
88,8
94)
(188
,894
)
-
Fund
Bal
ance
, Jul
y 1
196,
974
-
19
6,97
4
19
6,97
4
-
Fund
Bal
ance
, Jun
e 30
8,08
0
-
8,
080
8,
080
-
Rec
apitu
latio
n of
Exc
ess (
Def
icie
ncy)
of R
even
ues O
ver
(Und
er) E
xpen
ditu
res
Bud
gete
d Fu
nd B
alan
ce(1
88,8
94)
-
(1
88,8
94)
8,08
0
196,
974
EN
GL
EW
OO
D C
LIF
FS B
OA
RD
OF
ED
UC
AT
ION
Fisc
al Y
ear
End
ed J
une
30, 2
019
-88-

STATISTICAL SECTION

STATISTICAL SECTION (UNAUDITED)
Introduction to the Statistical Section
Financial Trends
J-1 Net Assets/Position by Component
J-2 Changes in Net Assets/Position
J-3 Fund Balances - Governmental Funds
J-4 Changes in Fund Balances - Governmental Funds
J-5 General Fund Other Local Revenue by Source
Revenue Capacity
J-6 Assessed Value and Estimated Actual Value of Taxable Property
J-7 Direct and Overlapping Property Tax Rates
J-8 Principal Property Taxpayers
J-9 Property Tax Levies and Collections
Debt Capacity
J-10 Ratios of Outstanding Debt by Type
J-11 Ratios of General Bonded Debt Outstanding
J-12 Direct and Overlapping Governmental Activities Debt
J-13 Legal Debt Margin Information
Demographic and Economic Information
J-14 Demographic and Economic Statistics
J-15 Principal Employers
Operating Information
J-16 Full-time Equivalent District Employees by Function/Program
J-17 Operating Statistics
J-18 School Building Information*
J-19 Schedule of Allowable Maintenance Expenditures by School Facility
J-20 Insurance Schedule

STATISTICAL SECTION (UNAUDITED) - INTRODUCTION
J SERIES
Contents Page
Financial TrendsThese schedules contain trend information to help the readerunderstand how the district’s financial performance andwell-being have changes over time. J-1 to J-5
Revenue CapacityThese schedules contain information to help the reader assessthe district’s most significant local revenue sources, theproperty tax. J-6 to J-9
Debt CapacityThese schedules present information to help the reader assessthe affordability of the district’s current levels of outstandingdebt and the district’s ability to issue additional debt in thefuture. J-10 to J-13
Demographic and Economic InformationThese schedules offer demographic and economic indicatorsto help the reader understand the environment within whichthe district’s financial activities take place. J-14 to J-15
Operating InformationThese schedules contain service and infrastructure data tohelp the reader understand how the information in thedistrict’s financial report relates to the services the districtprovides and the activities it performs. J-16 to J-20
Sources: Unless otherwise noted, the information in these schedules isderived from the comprehensive annual financial reports(CAFR) for the relevant year. The district implemented GASBStatement 34 in the fiscal year ending June 30, 2004; schedulespresenting district-wide information include informationbeginning in that year.

Exh
ibit
J-1
2010
2011
2012
2013
2014
2015
2016
2017
2018
2019
Gov
ernm
enta
l act
iviti
esIn
vest
ed in
cap
ital a
sset
s, ne
t of r
elat
ed d
ebt
906,
819
830,
387
793,
040
1,61
5,88
31,
773,
540
1,83
7,95
71,
794,
548
1,76
6,99
12,
697,
226
3,45
7,52
1
Res
trict
ed1,
464,
173
2,13
4,49
12,
239,
190
2,42
7,84
52,
461,
642
2,41
8,54
62,
670,
011
3,50
6,02
43,
058,
563
2,90
1,40
0
Unr
estri
cted
(113
,289
)13
4,46
951
0,45
863
2,69
620
3,41
6(2
,540
,549
)(2
,609
,582
)(3
,348
,512
)(3
,639
,213
)(3
,671
,393
)
To
tal g
over
nmen
tal a
ctiv
ities
net
ass
ets/
posi
tion
2,25
7,70
3$
3,
099,
347
$
3,54
2,68
8$
4,
676,
424
$
4,
438,
598
$
1,
715,
954
$
1,
854,
977
$
1,
924,
503
$
2,
116,
576
$
2,
687,
528
$
Bus
ines
s-ty
pe a
ctiv
ities
Inve
sted
in c
apita
l ass
ets,
net o
f rel
ated
deb
t46
8$
33
5$
202
$
69
$
R
estri
cted
Unr
estri
cted
1,89
82,
168
658
801
734
818
1,64
820
,577
26,0
9236
,479
Tota
l bus
ines
s-ty
pe a
ctiv
ities
net
ass
ets/
posi
tion
2,36
6$
2,50
3$
86
0$
870
$
734
$
818
$
1,64
8$
20,5
77$
26
,092
$
36,4
79$
Dis
trict
-wid
eIn
vest
ed in
cap
ital a
sset
s90
7,28
7$
830,
722
$
79
3,24
2$
1,61
5,95
2$
1,77
3,54
0$
1,83
7,95
7$
1,79
4,54
8$
1,76
6,99
1$
2,69
7,22
6$
3,45
7,52
1$
Res
trict
ed1,
464,
173
2,13
4,49
1
2,
239,
190
2,42
7,84
5
2,46
1,64
2
2,41
8,54
6
2,67
0,01
1
3,50
6,02
4
3,05
8,56
3
2,90
1,40
0
Unr
estri
cted
(111
,391
)
136,
637
51
1,11
6
633,
497
204,
150
(2,5
39,7
31)
(2,6
07,9
34)
(3,3
27,9
35)
(3,6
13,1
21)
(3,6
34,9
14)
Tota
l dis
trict
net
ass
ets/
posi
tion
2,26
0,06
9$
3,
101,
850
$
3,54
3,54
8$
4,
677,
294
$
4,
439,
332
$
1,
716,
772
$
1,
856,
625
$
1,
945,
080
$
2,
142,
668
$
2,
724,
007
$
Sour
ce:
CA
FR S
ched
ule
A-1
* - G
ASB
Sta
tem
ent N
o. 6
3 be
cam
e ef
fect
ive
for t
he fi
scal
yea
r end
ed Ju
ne 3
0, 2
013
whi
ch c
hang
ed N
et A
sset
s to
Net
Pos
ition
.
(acc
rual
bas
is o
f acc
ount
ing)
EN
GL
EW
OO
D C
LIF
FS B
OA
RD
OF
ED
UC
AT
ION
Net
Ass
ets/
Posi
tion*
by
Com
pone
nt,
Las
t Ten
Fis
cal Y
ears
-89-

Exh
ibit
J-2
2010
2011
2012
2013
2014
2015
2016
2017
2018
2019
Exp
ense
sG
over
nmen
tal a
ctiv
ities
Inst
ruct
ion
Reg
ular
3,90
5,03
4$
2,
971,
597
$
3,22
4,34
1$
3,
301,
980
$
4,02
4,68
4$
4,
327,
314
$
4,
799,
343
$
4,54
3,47
6$
4,
750,
188
$
4,54
7,33
1
Sp
ecia
l edu
catio
n93
8,42
5
790,
833
89
5,93
0
1,05
3,43
6
1,
109,
731
1,43
8,50
2
1,46
3,51
6
1,
468,
399
1,11
8,44
9
96
8,84
4
Oth
er sp
ecia
l edu
catio
n35
1,34
7
313,
486
32
4,63
2
375,
651
31
1,88
1
285,
924
261,
988
18
2,65
2
170,
063
23
5,17
7
Oth
er in
stru
ctio
n8,
200
6,08
6
4,
770
10,5
99
4,
758
9,44
0
24
,292
14,8
91
10
7,58
9
Supp
ort S
ervi
ces:
Tuiti
on88
0,43
0
964,
637
82
4,43
0
729,
025
66
9,69
3
717,
668
977,
564
1,
973,
131
2,02
1,27
3
2,
034,
033
Stud
ent &
inst
ruct
ion
rela
ted
serv
ices
2,07
1,14
4
1,
789,
932
2,01
1,66
5
2,
310,
222
2,47
1,21
9
2,
430,
735
2,
349,
989
2,22
5,02
6
2,
211,
348
2,25
9,22
8
Sc
hool
Adm
inis
trativ
e Se
rvic
es23
8,93
7
207,
911
22
7,00
4
388,
293
15
7,08
4
158,
185
156,
652
20
7,81
1
230,
683
24
4,41
0
Gen
eral
adm
inis
tratio
n32
3,99
8
357,
097
34
1,79
3
223,
647
34
9,29
1
409,
541
412,
375
45
6,75
3
471,
737
49
1,68
2
Cen
tral S
ervi
ces
209,
248
22
8,38
4
245,
691
25
7,90
0
317,
435
35
4,58
9
27
1,98
6
347,
766
26
4,36
9
292,
529
A
dmin
istra
tive
info
rmat
ion
tech
nolo
gy21
,929
30,9
41
59
,610
101,
899
81
,329
181,
306
225,
784
15
7,71
7
172,
582
87
,731
Plan
t Ope
ratio
ns a
nd M
aint
enan
ce1,
184,
584
1,00
1,02
5
1,
006,
390
1,04
0,44
4
1,
134,
175
1,23
7,53
7
1,15
5,54
2
1,
038,
254
1,05
1,90
7
1,
075,
936
Pupi
l tra
nspo
rtatio
n74
4,45
7
655,
508
68
5,34
0
776,
161
69
1,20
6
755,
696
798,
155
90
6,85
8
928,
621
96
9,83
0
Oth
er su
ppor
t ser
vice
sA
lloca
ted
bene
fits
Una
lloca
ted
bene
fits
619,
163
72
6,60
4
881,
060
72
8,92
8
762,
093
95
9,11
6
31
1,33
8
1,20
5,34
0
2,
998,
814
2,01
0,54
5
O
n-be
half
Con
tribu
tions
Prio
r Yea
r Enc
umbr
ance
sC
apita
l Out
lay
- non
-dep
reci
able
48,3
36
11
0,26
0
4,20
3
32
2,36
9
95,2
91
195,
212
5,
993
202,
379
21
,025
Deb
t Ser
vice
s:In
tere
st a
nd o
ther
cha
rges
132,
850
12
4,83
5
109,
233
10
8,23
1
100,
548
93
,510
78
,190
66,8
64
4,
771
18,0
42
B
ond
Issu
ance
Cos
ts49
,000
Una
lloca
ted
depr
ecia
tion
302,
877
32
0,39
6
367,
788
To
tal g
over
nmen
tal a
ctiv
ities
exp
ense
s11
,629
,746
10
,217
,212
10
,952
,149
11
,410
,619
12
,507
,496
13
,454
,354
13
,457
,634
15
,162
,209
16
,932
,471
15
,731
,720
EN
GL
EW
OO
D C
LIF
FS B
OA
RD
OF
ED
UC
AT
ION
Cha
nges
in N
et A
sset
s/Po
sitio
n* L
ast T
en F
isca
l Yea
rs(a
ccru
al b
asis
of a
ccou
ntin
g)
-90-

Exh
ibit
J-2
2010
2011
2012
2013
2014
2015
2016
2017
2018
2019
EN
GL
EW
OO
D C
LIF
FS B
OA
RD
OF
ED
UC
AT
ION
Cha
nges
in N
et A
sset
s/Po
sitio
n* L
ast T
en F
isca
l Yea
rs(a
ccru
al b
asis
of a
ccou
ntin
g)
Bus
ines
s-ty
pe a
ctiv
ities
:Sp
ecia
l Milk
Fun
d4,
564
3,51
5
6,
608
4,36
4
5,
882
6,78
9
5,
090
6,14
1
3,
815
3,91
6
In
veng
inee
ring
Prog
ram
3,15
0
3,
150
Enric
hmen
t Pro
gram
26,8
42
37
,392
34,2
98
To
tal b
usin
ess-
type
act
iviti
es e
xpen
se4,
564
3,51
5
6,
608
4,36
4
5,
882
6,78
9
5,
090
32,9
83
44
,357
41,3
64
To
tal d
istri
ct e
xpen
ses
11,6
34,3
10$
10,2
20,7
27$
10,9
58,7
57$
11,4
14,9
83$
12,5
13,3
78$
13,4
61,1
43$
13,4
62,7
24$
15,1
95,1
92$
16,9
76,8
28$
15,7
73,0
84$
Prog
ram
Rev
enue
sG
over
nmen
tal a
ctiv
ities
:O
pera
ting
gran
ts a
nd c
ontri
butio
ns33
2,16
8
211,
317
20
6,59
1
231,
429
24
3,86
2
251,
809
294,
852
26
9,28
7
315,
064
22
3,49
0
Tota
l gov
ernm
enta
l act
iviti
es p
rogr
am re
venu
es33
2,16
8
211,
317
20
6,59
1
231,
429
24
3,86
2
251,
809
294,
852
26
9,28
7
315,
064
22
3,49
0
Bus
ines
s-ty
pe a
ctiv
ities
:C
harg
es fo
r ser
vice
sSp
ecia
l Milk
Fun
d2,
433
2,28
8
2,
619
2,04
7
2,
631
3,10
5
2,
658
2,09
4
2,
158
2,39
3
In
veng
inee
ring
Prog
ram
3,15
0
3,
150
Enric
hmen
t Pro
gram
46,9
35
42
,095
43,8
29
O
pera
ting
gran
ts a
nd c
ontri
butio
ns1,
743
1,36
4
2,
346
2,32
7
3,
115
3,76
8
3,
262
2,88
3
2,
469
2,37
9
To
tal b
usin
ess t
ype
activ
ities
pro
gram
reve
nues
4,17
6
3,
652
4,96
5
4,
374
5,74
6
6,
873
5,92
0
51
,912
49,8
72
51
,751
Tota
l dis
trict
pro
gram
reve
nues
336,
344
$
21
4,96
9$
211,
556
$
23
5,80
3$
249,
608
$
25
8,68
2$
30
0,77
2$
321,
199
$
36
4,93
6$
275,
241
$
Net
(Exp
ense
)/Rev
enue
Gov
ernm
enta
l act
iviti
es(1
1,29
7,57
8)$
(10,
005,
895)
$
(1
0,74
5,55
8)$
(11,
179,
190)
$
(1
2,26
3,63
4)$
(13,
202,
545)
$
(13,
162,
782)
$
(1
4,89
2,92
2)$
(16,
617,
407)
$
(1
5,50
8,23
0)$
Bus
ines
s-ty
pe a
ctiv
ities
(388
)
137
(1
,643
)
10
(136
)
84
830
18
,929
5,51
5
10
,387
Tota
l dis
trict
-wid
e ne
t exp
ense
(11,
297,
966)
$
(1
0,00
5,75
8)$
(10,
747,
201)
$
(1
1,17
9,18
0)$
(12,
263,
770)
$
(1
3,20
2,46
1)$
(1
3,16
1,95
2)$
(14,
873,
993)
$
(1
6,61
1,89
2)$
(15,
497,
843)
$
-91-

Exh
ibit
J-2
2010
2011
2012
2013
2014
2015
2016
2017
2018
2019
EN
GL
EW
OO
D C
LIF
FS B
OA
RD
OF
ED
UC
AT
ION
Cha
nges
in N
et A
sset
s/Po
sitio
n* L
ast T
en F
isca
l Yea
rs(a
ccru
al b
asis
of a
ccou
ntin
g)
Gen
eral
Rev
enue
s and
Oth
er C
hang
es in
Net
Ass
ets/
Posi
tion
Gov
ernm
enta
l act
iviti
es:
Prop
erty
taxe
s lev
ied
for g
ener
al p
urpo
ses,
net
9,29
9,80
0$
9,
720,
381
$
9,79
5,38
1$
9,
878,
618
$
10,0
76,1
90$
10,2
77,7
13$
10,9
63,9
18$
12,4
21,2
23$
12,9
63,6
34$
13,2
22,9
07
Taxe
s lev
ied
for d
ebt s
ervi
ce16
3,55
5
255,
474
25
6,77
7
257,
802
25
8,54
7
262,
668
262,
463
26
5,37
0
267,
829
72
,961
Fede
ral a
nd st
ate
aid
not r
estri
cted
1,13
5,99
8
88
4,44
9
1,04
2,52
9
1,
280,
176
1,30
7,20
0
2,
228,
154
1,
598,
074
1,87
7,11
9
3,
120,
148
2,40
9,51
8
Fe
dera
l and
stat
e ai
d - C
apita
l Out
lay
16,9
00
Tu
ition
Rec
eive
d18
5,61
0
179,
908
75
,757
248,
861
91
,083
268,
450
397,
699
30
0,42
7
230,
500
28
1,82
3
Inve
stm
ent e
arni
ngs
6,11
2
M
isce
llane
ous i
ncom
e 30
,629
20,2
44
18
,455
8,18
0
5,
488
12,4
38
79,6
51
98
,309
227,
369
68
,961
Tota
l gov
ernm
enta
l act
iviti
es10
,815
,592
10
,833
,438
11
,188
,899
11
,673
,637
12
,025
,808
13
,049
,423
13
,301
,805
14
,962
,448
16
,809
,480
16
,079
,182
Bus
ines
s-ty
pe a
ctiv
ities
:Li
abili
ties c
ance
led
Tota
l bus
ines
s-ty
pe a
ctiv
ities
-
-
-
-
-
-
-
-
-
-
To
tal d
istri
ct-w
ide
10,8
15,5
92$
10,8
33,4
38$
11,1
88,8
99$
11,6
73,6
37$
12,0
25,8
08$
13,0
49,4
23$
13,3
01,8
05$
14,9
62,4
48$
16,8
09,4
80$
16,0
79,1
82$
Cha
nge
in N
et A
sset
s/Po
sitio
nG
over
nmen
tal a
ctiv
ities
(481
,986
)$
82
7,54
3$
443,
341
$
49
4,44
7$
(237
,826
)$
(1
53,1
22)
$
139,
023
$
69
,526
$
192,
073
$
57
0,95
2$
Bus
ines
s-ty
pe a
ctiv
ities
(388
)
137
(1
,643
)
10
(136
)
84
830
18
,929
5,51
5
10
,387
Tota
l dis
trict
(482
,374
)$
82
7,68
0$
441,
698
$
49
4,45
7$
(237
,962
)$
(1
53,0
38)
$
139,
853
$
88
,455
$
197,
588
$
58
1,33
9$
Sour
ce:
CA
FR S
ched
ule
A-2
* - G
ASB
Sta
tem
ent N
o. 6
3 be
cam
e ef
fect
ive
for t
he fi
scal
yea
r end
ed Ju
ne 3
0, 2
013
whi
ch c
hang
ed N
et A
sset
s to
Net
Pos
ition
.
-92-

Exh
ibit
J-3
2010
2011
2012
2013
2014
2015
2016
2017
2018
2019
Gen
eral
Fun
dR
eser
ved
890,
851
$
Unr
eser
ved
180,
697
Res
trict
ed1,
426,
061
$
1,
931,
435
$
2,23
8,95
1$
2,27
2,74
8$
2,22
9,65
2$
2,48
1,12
1$
2,97
8,86
1$
1,93
2,66
7$
2,66
5,63
3
Ass
igne
d36
2,12
645
0,78
171
8,42
033
5,44
227
6,19
320
5,73
333
8,26
992
8,92
222
7,68
7
U
nass
igne
d41
8,17
140
7,35
028
7,96
529
3,13
227
3,77
435
7,13
123
5,87
718
7,80
227
8,69
7
To
tal g
ener
al fu
nd1,
071,
548
$
2,
206,
358
$
2,
789,
566
$
3,24
5,33
6$
2,90
1,32
2$
2,77
9,61
9$
3,04
3,98
5$
3,55
3,00
7$
3,04
9,39
1$
3,17
2,01
7$
All
Oth
er G
over
nmen
tal F
unds
Unr
eser
ved,
repo
rted
in:
Cap
ital p
roje
cts f
und
573,
321
Deb
t ser
vice
fund
1R
estri
cted
, rep
orte
d in
:C
apita
l pro
ject
s fun
d34
6,30
3
30
7,75
5
188,
894
188,
894
188,
894
188,
894
Deb
t ser
vice
fund
1
18
8,89
4
19
6,97
4
8,
080
To
tal a
ll ot
her g
over
nmen
tal f
unds
573,
322
$
346,
304
$
307,
755
$
18
8,89
4$
18
8,89
4$
18
8,89
4$
18
8,89
4$
18
8,89
4$
19
6,97
4$
8,
080
$
Sour
ce:
CA
FR B
-1
(mod
ified
acc
rual
bas
is o
f acc
ount
ing)
EN
GL
EW
OO
D C
LIF
FS B
OA
RD
OF
ED
UC
AT
ION
Fund
Bal
ance
s, G
over
nmen
tal F
unds
,L
ast T
en F
isca
l Yea
rs
-93-
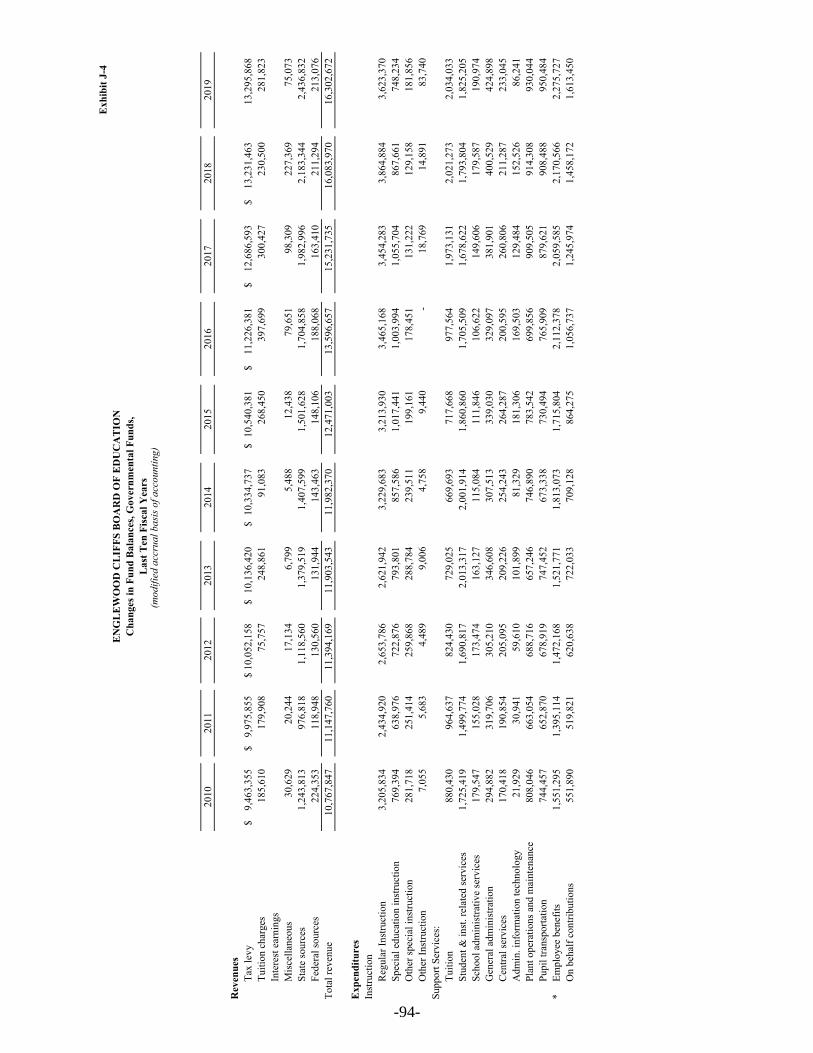
Exh
ibit
J-4
2010
2011
2012
2013
2014
2015
2016
2017
2018
2019
Rev
enue
sTa
x le
vy9,
463,
355
$
9,97
5,85
5$
10
,052
,158
$
10,1
36,4
20$
10
,334
,737
$
10,5
40,3
81$
11
,226
,381
$
12
,686
,593
$
13
,231
,463
$
13
,295
,868
Tu
ition
cha
rges
185,
610
179,
908
75
,757
248,
861
91,0
83
26
8,45
0
39
7,69
9
30
0,42
7
23
0,50
0
28
1,82
3
Inte
rest
ear
ning
sM
isce
llane
ous
30,6
29
20
,244
17,1
34
6,
799
5,
488
12
,438
79,6
51
98,3
09
227,
369
75,0
73
Stat
e so
urce
s1,
243,
813
976,
818
1,
118,
560
1,37
9,51
9
1,40
7,59
9
1,50
1,62
8
1,70
4,85
8
1,98
2,99
6
2,18
3,34
4
2,43
6,83
2
Fe
dera
l sou
rces
224,
353
118,
948
13
0,56
0
131,
944
143,
463
148,
106
188,
068
163,
410
211,
294
213,
076
To
tal r
even
ue10
,767
,847
11,1
47,7
60
11
,394
,169
11,9
03,5
43
11
,982
,370
12,4
71,0
03
13
,596
,657
15
,231
,735
16
,083
,970
16
,302
,672
Exp
endi
ture
sIn
stru
ctio
nR
egul
ar In
stru
ctio
n3,
205,
834
2,43
4,92
0
2,
653,
786
2,62
1,94
2
3,22
9,68
3
3,21
3,93
0
3,46
5,16
8
3,45
4,28
3
3,86
4,88
4
3,62
3,37
0
Sp
ecia
l edu
catio
n in
stru
ctio
n76
9,39
4
63
8,97
6
722,
876
79
3,80
1
85
7,58
6
1,
017,
441
1,
003,
994
1,
055,
704
86
7,66
1
74
8,23
4
Oth
er sp
ecia
l ins
truct
ion
281,
718
251,
414
25
9,86
8
288,
784
239,
511
199,
161
178,
451
131,
222
129,
158
181,
856
O
ther
Inst
ruct
ion
7,05
5
5,68
3
4,48
9
9,00
6
4,75
8
9,44
0
-
18
,769
14
,891
83
,740
Su
ppor
t Ser
vice
s:Tu
ition
880,
430
964,
637
82
4,43
0
729,
025
669,
693
717,
668
977,
564
1,97
3,13
1
2,02
1,27
3
2,03
4,03
3
St
uden
t & in
st. r
elat
ed se
rvic
es1,
725,
419
1,49
9,77
4
1,
690,
817
2,01
3,31
7
2,00
1,91
4
1,86
0,86
0
1,70
5,50
9
1,67
8,62
2
1,79
3,80
4
1,82
5,20
5
Sc
hool
adm
inis
trativ
e se
rvic
es17
9,54
7
15
5,02
8
173,
474
16
3,12
7
11
5,08
4
11
1,84
6
10
6,62
2
14
9,60
6
17
9,58
7
19
0,97
4
Gen
eral
adm
inis
tratio
n29
4,88
2
31
9,70
6
305,
210
34
6,60
8
30
7,51
3
33
9,03
0
32
9,09
7
38
1,90
1
40
0,52
9
42
4,89
8
Cen
tral s
ervi
ces
170,
418
190,
854
20
5,09
5
209,
226
254,
243
264,
287
200,
595
260,
806
211,
287
233,
045
A
dmin
. inf
orm
atio
n te
chno
logy
21,9
29
30
,941
59,6
10
10
1,89
9
81
,329
181,
306
169,
503
129,
484
152,
526
86,2
41
Plan
t ope
ratio
ns a
nd m
aint
enan
ce80
8,04
6
66
3,05
4
688,
716
65
7,24
6
74
6,89
0
78
3,54
2
69
9,85
6
90
9,50
5
91
4,30
8
93
0,04
4
Pupi
l tra
nspo
rtatio
n74
4,45
7
65
2,87
0
678,
919
74
7,45
2
67
3,33
8
73
0,49
4
76
5,90
9
87
9,62
1
90
8,48
8
95
0,48
4
*Em
ploy
ee b
enef
its1,
551,
295
1,39
5,11
4
1,
472,
168
1,52
1,77
1
1,81
3,07
3
1,71
5,80
4
2,11
2,37
8
2,05
9,58
5
2,17
0,56
6
2,27
5,72
7
O
n be
half
cont
ribut
ions
551,
890
519,
821
62
0,63
8
722,
033
709,
128
864,
275
1,05
6,73
7
1,24
5,97
4
1,45
8,17
2
1,61
3,45
0
EN
GL
EW
OO
D C
LIF
FS B
OA
RD
OF
ED
UC
AT
ION
Cha
nges
in F
und
Bal
ance
s, G
over
nmen
tal F
unds
,L
ast T
en F
isca
l Yea
rs(m
odifi
ed a
ccru
al b
asis
of a
ccou
ntin
g)
-94-

Exh
ibit
J-4
2010
2011
2012
2013
2014
2015
2016
2017
2018
2019
EN
GL
EW
OO
D C
LIF
FS B
OA
RD
OF
ED
UC
AT
ION
Cha
nges
in F
und
Bal
ance
s, G
over
nmen
tal F
unds
,L
ast T
en F
isca
l Yea
rs(m
odifi
ed a
ccru
al b
asis
of a
ccou
ntin
g)
Spec
ial S
choo
lsC
harte
r Sch
ools
Cap
ital o
utla
y12
9,51
8
71
,312
107,
578
21
8,09
2
56
2,89
7
22
9,95
1
20
8,66
7
38
,361
1,
136,
667
81
7,49
4
Deb
t ser
vice
:Pr
inci
pal
205,
000
215,
000
22
5,00
0
235,
000
245,
000
260,
000
270,
000
285,
000
335,
000
330,
000
In
tere
st a
nd o
ther
cha
rges
135,
733
127,
859
11
9,60
9
110,
984
101,
984
92,5
15
82
,240
71
,140
20
,705
20
,145
To
tal e
xpen
ditu
res
10,9
91,0
64
11
,662
,565
10,8
12,2
83
11
,489
,313
12,6
13,6
24
12
,591
,550
13,3
32,2
90
14,7
22,7
14
16,5
79,5
06
16,3
68,9
40
Exce
ss (D
efic
ienc
y) o
f rev
enue
s o
ver (
unde
r) e
xpen
ditu
res
(223
,217
)
(514
,805
)
581,
886
41
4,23
0
(6
31,2
54)
(1
20,5
47)
26
4,36
7
50
9,02
1
(4
95,5
36)
(66,
268)
Oth
er F
inan
cing
sour
ces (
uses
)Pr
ocee
ds fr
om b
orro
win
gC
apita
l lea
ses (
non-
budg
eted
)Pr
ocee
ds fr
om re
fund
ing
Paym
ents
to e
scro
w a
gent
Tr
ansf
ers i
n13
,403
2,18
0
1,32
1
42,8
61
44
8
47
2
47
4
189,
043
Tran
sfer
s out
(13,
403)
(2,1
80)
(1,3
21)
(42,
861)
(448
)
(4
72)
(474
)
(1
89,0
43)
Cap
ital R
eser
ve -
Cap
ital O
utla
y(2
27,0
18)
28
7,30
0
To
tal o
ther
fina
ncin
g so
urce
s (us
es)
-
(2
27,0
18)
-
-
287,
300
-
-
-
-
-
Net
cha
nge
in fu
nd b
alan
ces
(196
,748
)$
(514
,805
)$
581,
886
$
41
4,23
0$
(3
43,9
54)
$
(1
20,5
47)
$
26
4,36
7$
50
9,02
1$
(4
95,5
36)
$
(66,
268)
$
Deb
t ser
vice
as a
per
cent
age
ofno
ncap
ital e
xpen
ditu
res
3.11
%2.
95%
3.22
%3.
07%
2.88
%2.
85%
2.68
%2.
43%
2.30
%2.
25%
Sour
ce: D
istr
ict r
ecor
ds
Not
e: C
apita
l Pro
ject
s Fun
d is
not
incl
uded
as t
hese
exp
endi
ture
s var
y su
bsta
ntia
lly fr
om y
ear t
o ye
ar.
The
finan
cial
dat
a pr
esen
ted
wou
ld n
ot b
e m
eani
ngfu
l for
com
para
tive
purp
oses
if
thes
e w
ere
incl
uded
.So
urce
: C
AFR
, Sch
edul
e B
-2
-95-
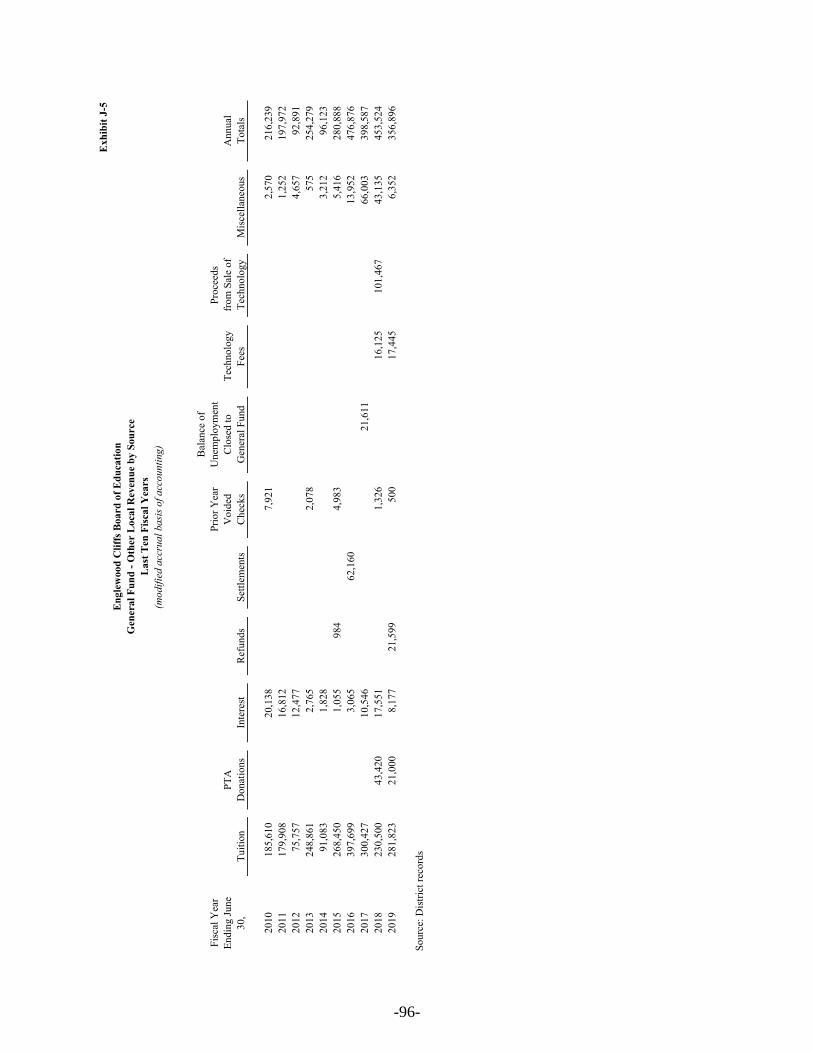
Exh
ibit
J-5
Fisc
al Y
ear
Endi
ng Ju
ne
30,
Tuiti
onPT
A
Don
atio
nsIn
tere
stR
efun
dsSe
ttlem
ents
Prio
r Yea
r V
oide
d C
heck
s
Bal
ance
of
Une
mpl
oym
ent
Clo
sed
to
Gen
eral
Fun
dTe
chno
logy
Fe
es
Proc
eeds
fr
om S
ale
of
Tech
nolo
gyM
isce
llane
ous
Ann
ual
Tota
ls
2010
185,
610
20,1
387,
921
2,57
021
6,23
9
20
1117
9,90
816
,812
1,25
219
7,97
2
20
1275
,757
12,4
774,
657
92,8
91
2013
248,
861
2,76
52,
078
575
254,
279
2014
91,0
831,
828
3,21
296
,123
20
1526
8,45
01,
055
984
4,98
35,
416
280,
888
2016
397,
699
3,06
562
,160
13,9
5247
6,87
6
20
1730
0,42
710
,546
21,6
1166
,003
398,
587
2018
230,
500
43,4
2017
,551
1,32
616
,125
101,
467
43,1
3545
3,52
4
20
1928
1,82
321
,000
8,17
721
,599
500
17,4
456,
352
356,
896
Sour
ce: D
istri
ct re
cord
s
Eng
lew
ood
Clif
fs B
oard
of E
duca
tion
Gen
eral
Fun
d - O
ther
Loc
al R
even
ue b
y So
urce
Las
t Ten
Fis
cal Y
ears
(mod
ified
acc
rual
bas
is o
f acc
ount
ing)
-96-
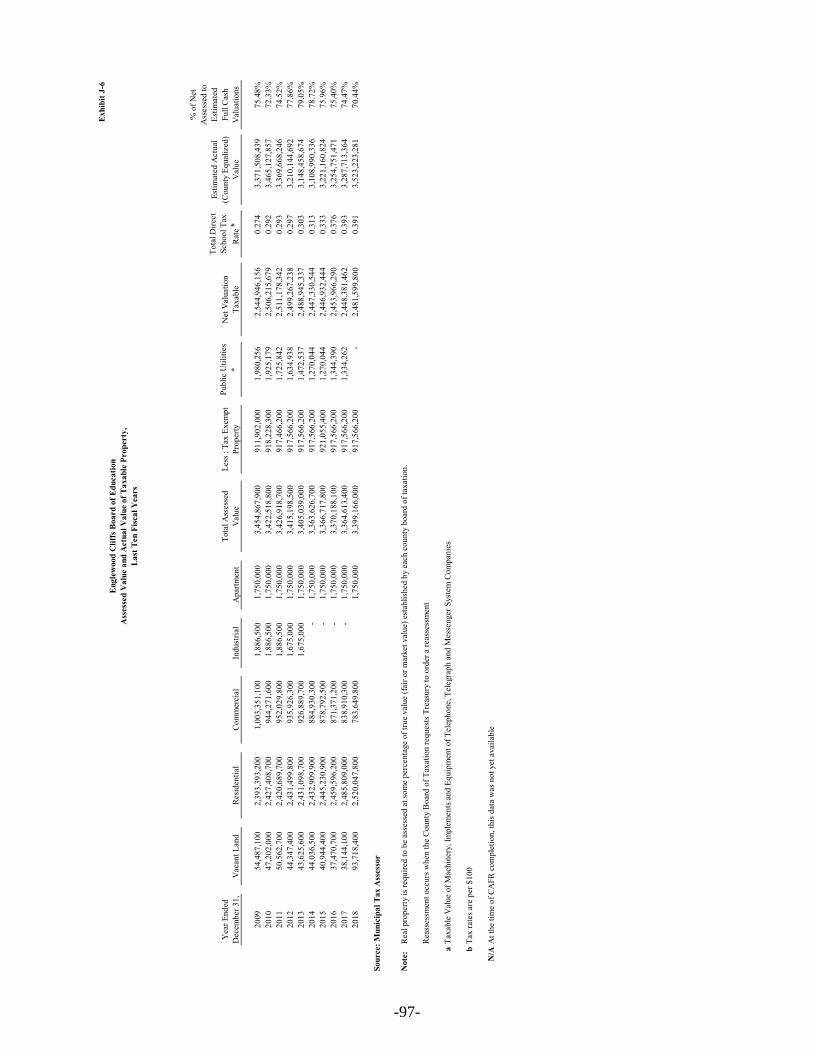
Exh
ibit
J-6
Yea
r End
ed
Dec
embe
r 31,
Vac
ant L
and
Res
iden
tial
Com
mer
cial
Indu
stria
lA
partm
ent
Tota
l Ass
esse
d V
alue
Less
: Ta
x Ex
empt
Pr
oper
tyPu
blic
Util
ities
a
Net
Val
uatio
n Ta
xabl
e
Tota
l Dire
ct
Scho
ol T
ax
Rat
e b
Estim
ated
Act
ual
(Cou
nty
Equa
lized
) V
alue
% o
f Net
A
sses
sed
to
Estim
ated
Fu
ll C
ash
Val
uatio
ns
2009
54,4
87,1
00
2,
393,
393,
200
1,00
3,35
1,10
0
1,
886,
500
1,75
0,00
0
3,45
4,86
7,90
0
911,
902,
000
1,
980,
256
2,54
4,94
6,15
6
0.27
4
3,
371,
508,
439
75
.48%
2010
47,2
02,0
00
2,
427,
408,
700
944,
271,
600
1,
886,
500
1,75
0,00
0
3,42
2,51
8,80
0
918,
228,
300
1,
925,
179
2,50
6,21
5,67
9
0.29
2
3,
465,
127,
857
72
.33%
2011
50,5
62,7
00
2,
420,
689,
700
952,
029,
800
1,
886,
500
1,75
0,00
0
3,42
6,91
8,70
0
917,
466,
200
1,
725,
842
2,51
1,17
8,34
2
0.29
3
3,
369,
668,
246
74
.52%
2012
44,3
47,4
00
2,
431,
499,
800
935,
926,
300
1,
675,
000
1,75
0,00
0
3,41
5,19
8,50
0
917,
566,
200
1,
634,
938
2,49
9,26
7,23
8
0.29
7
3,
210,
144,
692
77
.86%
2013
43,6
25,6
00
2,
431,
098,
700
926,
889,
700
1,
675,
000
1,75
0,00
0
3,40
5,03
9,00
0
917,
566,
200
1,
472,
537
2,48
8,94
5,33
7
0.30
3
3,
148,
458,
674
79
.05%
2014
44,0
36,5
00
2,
432,
909,
900
884,
930,
300
-
1,
750,
000
3,
363,
626,
700
91
7,56
6,20
0
1,27
0,04
4
2,
447,
330,
544
0.
313
3,10
8,99
0,33
6
78.7
2%20
1540
,944
,400
2,44
5,23
0,90
0
87
8,79
2,50
0
-
1,75
0,00
0
3,36
6,71
7,80
0
921,
055,
400
1,
270,
044
2,44
6,93
2,44
4
0.33
3
3,
221,
160,
824
75
.96%
2016
37,4
70,7
00
2,
459,
596,
200
871,
371,
200
-
1,
750,
000
3,
370,
188,
100
91
7,56
6,20
0
1,34
4,39
0
2,
453,
966,
290
0.
376
3,25
4,75
1,47
1
75.4
0%20
1738
,144
,100
2,48
5,80
9,00
0
83
8,91
0,30
0
-
1,75
0,00
0
3,36
4,61
3,40
0
917,
566,
200
1,
334,
262
2,44
8,38
1,46
2
0.39
3
3,
287,
713,
364
74
.47%
2018
93,7
18,4
00
2,
520,
047,
800
783,
649,
800
1,
750,
000
3,
399,
166,
000
91
7,56
6,20
0
-
2,
481,
599,
800
0.
391
3,52
3,22
3,28
1
70.4
4%
Sour
ce: M
unic
ipal
Tax
Ass
esso
r
Not
e:
Rea
sses
smen
t occ
urs w
hen
the
Cou
nty
Boa
rd o
f Tax
atio
n re
ques
ts T
reas
ury
to o
rder
a re
asse
ssm
ent
aTa
xabl
e V
alue
of M
achi
nery
, Im
plem
ents
and
Equ
ipm
ent o
f Tel
epho
ne, T
eleg
raph
and
Mes
seng
er S
yste
m C
ompa
nies
bTa
x ra
tes a
re p
er $
100
N/A
At t
he ti
me
of C
AFR
com
plet
ion,
this
dat
a w
as n
ot y
et a
vaila
ble
Eng
lew
ood
Clif
fs B
oard
of E
duca
tion
Ass
esse
d V
alue
and
Act
ual V
alue
of T
axab
le P
rope
rty,
Las
t Ten
Fis
cal Y
ears
Rea
l pro
perty
is re
quire
d to
be
asse
ssed
at s
ome
perc
enta
ge o
f tru
e va
lue
(fai
r or m
arke
t val
ue) e
stab
lishe
d by
eac
h co
unty
boa
rd o
f tax
atio
n.
-97-
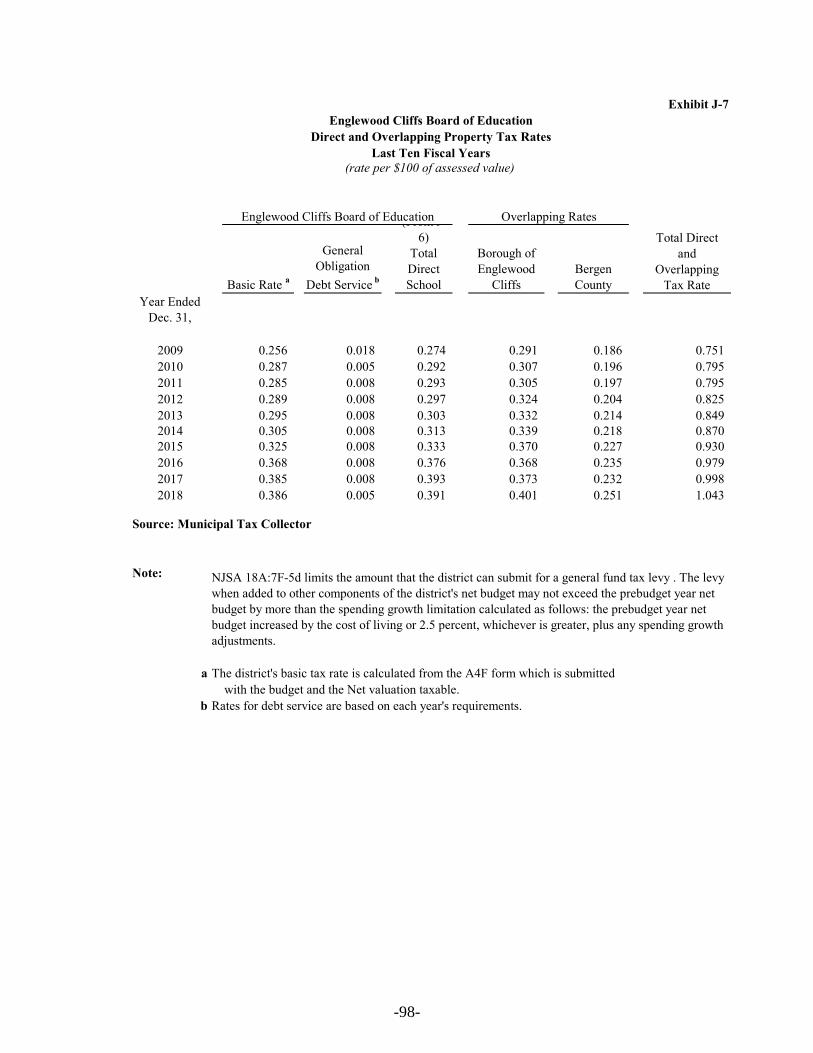
Exhibit J-7
Basic Rate a
General Obligation
Debt Service b
(From J6)
Total Direct School
Borough of Englewood
CliffsBergen County
Year Ended Dec. 31,
2009 0.256 0.018 0.274 0.291 0.186 0.751 2010 0.287 0.005 0.292 0.307 0.196 0.795 2011 0.285 0.008 0.293 0.305 0.197 0.795 2012 0.289 0.008 0.297 0.324 0.204 0.825 2013 0.295 0.008 0.303 0.332 0.214 0.849 2014 0.305 0.008 0.313 0.339 0.218 0.870 2015 0.325 0.008 0.333 0.370 0.227 0.930 2016 0.368 0.008 0.376 0.368 0.235 0.979 2017 0.385 0.008 0.393 0.373 0.232 0.998 2018 0.386 0.005 0.391 0.401 0.251 1.043
Source: Municipal Tax Collector
Note:
a The district's basic tax rate is calculated from the A4F form which is submittedwith the budget and the Net valuation taxable.
b Rates for debt service are based on each year's requirements.
NJSA 18A:7F-5d limits the amount that the district can submit for a general fund tax levy . The levy when added to other components of the district's net budget may not exceed the prebudget year net budget by more than the spending growth limitation calculated as follows: the prebudget year net budget increased by the cost of living or 2.5 percent, whichever is greater, plus any spending growth adjustments.
Englewood Cliffs Board of EducationDirect and Overlapping Property Tax Rates
Last Ten Fiscal Years(rate per $100 of assessed value)
Englewood Cliffs Board of Education Overlapping Rates
Total Direct and
Overlapping Tax Rate
-98-

Exh
ibit
J-8
Taxa
ble
% o
f Tot
alTa
xabl
e%
of T
otal
Ass
esse
dR
ank
Dis
trict
Net
A
sses
sed
Ran
kD
istri
ct N
et
Val
ue[O
ptio
nal]
Ass
esse
d V
alue
Val
ue[O
ptio
nal]
Ass
esse
d V
alue
Taxp
ayer
182
,500
,000
$
13.
32%
100,
981,
500
$
14.
03%
Taxp
ayer
262
,327
,400
22.
51%
90,0
00,0
00
23.
59%
Taxp
ayer
361
,831
,650
32.
49%
90,0
00,0
00
33.
59%
Taxp
ayer
455
,000
,000
42.
22%
87,5
25,7
00
43.
49%
Taxp
ayer
547
,223
,300
51.
90%
37,1
94,0
00
51.
48%
Taxp
ayer
635
,500
,000
61.
43%
35,5
00,0
00
61.
42%
Taxp
ayer
734
,000
,000
71.
37%
29,9
57,3
00
71.
20%
Taxp
ayer
832
,500
,000
81.
31%
21,1
81,9
00
80.
85%
Taxp
ayer
922
,500
,000
90.
91%
20,6
18,2
00
90.
82%
Tax
paye
r 10
17,7
80,6
00
10
0.72
%17
,780
,600
10
0.71
%
Tota
l45
1,16
2,95
0$
18
.18%
530,
739,
200
$
21.1
8%
T
otal
Net
Ass
esse
d V
alue
2,48
1,59
9,80
02,
506,
215,
679
Sour
ce:
Mun
icip
al T
ax A
sses
sor
Eng
lew
ood
Clif
fs B
oard
of E
duca
tion
Prin
cipa
l Pro
pert
y T
axpa
yers
,C
urre
nt Y
ear
and
Nin
e Y
ears
Ago
2019
2010
-99-

Exhibit J-9
Amount Percentage of Levy
2010 9,463,355 9,463,349 100.00% 6 2011 9,975,855 9,975,847 100.00% 8 2012 10,052,158 10,052,158 100.00% - 2013 10,136,420 10,136,420 100.00% - 2014 10,334,737 10,334,737 100.00% - 2015 10,540,381 10,540,381 100.00% - 2016 11,226,381 11,226,381 100.00% - 2017 12,686,593 12,686,593 100.00% - 2018 13,231,463 13,231,463 100.00% - 2019 13,295,868 13,295,868 100.00% -
Source: District records including the Certificate and Report of School Taxes (A4F form)
a - School taxes are collected by the Municipal Tax Collector. Under NewJersey State Statute, a municipality is required to remit to the school districtthe entire property tax balance in the amount voted upon or certified prior tothe end of the school year.
Englewood Cliffs Board of EducationProperty Tax Levies and Collections,
Last Ten Fiscal Years
Fiscal Year
Ended June 30,
Taxes Levied for the Fiscal Year
Collected within the Fiscal Year of the Levy a Collections in Subsequent
Years
-100-

Exh
ibit
J-10
Bus
ines
s-Ty
pe
Act
iviti
es
Fisc
al Y
ear
Ende
d Ju
ne
30,
Gen
eral
O
blig
atio
n B
onds
bC
ertif
icat
es o
f Pa
rtici
patio
nC
apita
l Lea
ses
Bon
d A
ntic
ipat
ion
Not
es (B
AN
s)C
apita
l Lea
ses
Tota
l Dis
trict
Perc
enta
ge o
f Pe
rson
al In
com
e a
Per C
apita
a
2010
3,37
1,00
0
-
-
-
-
3,
371,
000
0.
96%
51.0
8$
2011
3,15
6,00
0
-
-
-
-
3,
156,
000
0.
86%
45.8
3$
2012
2,93
1,00
0
-
-
-
-
2,
931,
000
0.
76%
40.8
3$
2013
2,69
6,00
0
-
-
-
-
2,
696,
000
0.
71%
37.9
2$
2014
2,45
1,00
0
-
-
-
-
2,
451,
000
0.
62%
33.2
8$
2015
2,19
1,00
0
-
-
-
-
2,
191,
000
0.
53%
28.5
2$
2016
1,92
1,00
0
-
-
-
-
1,
921,
000
0.
46%
24.6
6$
2017
1,68
5,00
0
-
-
-
-
1,
685,
000
0.
39%
20.7
5$
2018
1,35
0,00
0-
-
-
-
1,35
0,00
0
Not
Ava
ilabl
eN
ot A
vaila
ble
2019
1,02
0,00
0-
-
-
-
1,02
0,00
0
Not
Ava
ilabl
eN
ot A
vaila
ble
Sour
ce: D
istri
ct C
AFR
Sch
edul
es I-
1 an
d I-
2
Not
e: D
etai
ls re
gard
ing
the
dist
rict's
out
stan
ding
deb
t can
be
foun
d in
the
note
s to
the
finan
cial
stat
emen
ts.
aSe
e E
xhib
it N
J J-1
4 fo
r per
sona
l inc
ome
and
popu
latio
n da
ta.
Thes
e ra
tios a
re c
alcu
late
d us
ing
pers
onal
inco
me
and
popu
latio
n fo
r the
prio
r cal
enda
r yea
r.
bIn
clud
es E
arly
Ret
irem
ent I
ncen
tive
Plan
(ER
IP) r
efun
ding
Eng
lew
ood
Clif
fs B
oard
of E
duca
tion
Rat
ios o
f Out
stan
ding
Deb
t by
Typ
eL
ast T
en F
isca
l Yea
rs
Gov
ernm
enta
l Act
iviti
es
-101-

Exhibit J-11
Fiscal Year
Ended June 30,
General Obligation Bonds Deductions
Net General Bonded Debt Outstanding
Percentage of Actual Taxable
Value a of Property Per Capita b
2010 3,371,000 - 3,371,000 0.13% 65,992 2011 3,156,000 - 3,156,000 0.13% 68,865 2012 2,931,000 - 2,931,000 0.12% 71,789 2013 2,696,000 - 2,696,000 0.11% 71,100 2014 2,451,000 - 2,451,000 0.10% 73,637 2015 2,191,000 - 2,191,000 0.09% 76,821 2016 1,921,000 - 1,921,000 0.08% 77,901 2017 1,685,000 - 1,685,000 0.07% 81,203 2018 1,350,000 - 1,350,000 0.05% Not Available2019 1,020,000 1,020,000 Not Available Not Available
Notes: Details regarding the district's outstanding debt can be found in the notes to the financial statements.a See Exhibit NJ J-6 for property tax data. b Population data can be found in Exhibit NJ J-14.
Englewood Cliffs Board of EducationRatios of Net General Bonded Debt Outstanding
Last Ten Fiscal Years
General Bonded Debt Outstanding
-102-

Exh
ibit
J-12
Gov
ernm
enta
l Uni
t
Estim
ated
Pe
rcen
tage
A
pplic
able
aD
ebt O
utst
andi
ngEs
timat
ed S
hare
of
Ove
rlapp
ing
Deb
t
Dire
ct D
ebt o
f Sch
ool D
istri
ct a
s of J
une
30, 2
019
1,02
0,00
0$
Deb
t rep
aid
with
pro
perty
taxe
s
Bor
ough
of E
ngle
woo
d C
liffs
100.
00%
17,5
73,8
25$
C
ount
y of
Ber
gen
- Bor
ough
's Sh
are
2.14
0%18
,470
,340
Ber
gen
Cou
nty
Util
ities
Aut
horit
y - B
orou
gh's
Shar
e1.
435%
2,14
6,10
4
Subt
otal
, ove
rlapp
ing
debt
38,1
90,2
68
Tot
al d
irec
t and
ove
rlap
ping
deb
t39
,210
,268
$
Sour
ces:
Ass
esse
d va
lue
data
use
d to
est
imat
e ap
plic
able
per
cent
ages
pro
vide
d by
the
Ber
gen
Cou
nty
Boa
rd o
f Tax
atio
n.D
ebt o
utst
andi
ng d
ata
prov
ided
by
each
gov
ernm
enta
l uni
t.
Not
e:
Ove
rlapp
ing
gove
rnm
ents
are
thos
e th
at c
oinc
ide,
at l
east
in p
art,
with
the
geog
raph
ic b
ound
arie
s of t
he D
istri
ct.
This
sche
dule
est
imat
es th
e po
rtion
of t
he o
utst
andi
ng d
ebt o
f tho
se o
verla
ppin
g go
vern
men
ts th
at is
bor
ne b
y th
e re
side
nts a
nd
busi
ness
es o
f Eng
lew
ood
Clif
fs.
This
pro
cess
reco
gniz
es th
at, w
hen
cons
ider
ing
the
Dis
trict
's ab
ility
to is
sue
and
repa
y lo
ng-te
rm d
een
tire
debt
bur
den
born
e by
the
resi
dent
s and
bus
ines
ses s
houl
d be
take
n in
to a
ccou
nt.
How
ever
this
doe
s not
impl
y th
at
ever
y ta
xpay
er is
a re
side
nt, a
nd th
eref
ore
resp
onsi
ble
for r
epay
ing
the
debt
, of e
ach
over
lapp
ing
paym
ent.
For d
ebt r
epai
d w
ith p
rope
rty ta
xes,
the
perc
enta
ge o
f ove
rlapp
ing
debt
app
licab
le is
est
imat
ed u
sing
taxa
ble
asse
ssed
pro
perty
val
ueA
pplic
able
per
cent
ages
wer
e es
timat
ed b
y de
term
inin
g th
e po
rtion
of a
noth
er g
over
nmen
tal u
nit's
taxa
ble
valu
e th
at is
with
in th
e di
stric
t's b
ound
arie
s and
div
idin
g it
by e
ach
unit'
s tot
al ta
xabl
e va
lue.
Eng
lew
ood
Clif
fs B
oard
of E
duca
tion
Dir
ect a
nd O
verl
appi
ng G
over
nmen
tal A
ctiv
ities
Deb
tA
s of J
une
30, 2
019
-103-

Exh
ibit
J-13
Leg
al D
ebt M
argi
n C
alcu
latio
n fo
r Fi
scal
Yea
r 20
18
Equa
lized
val
uatio
n ba
sis
2018
3,52
3,22
3,28
1$
20
173,
287,
713,
364
$
2016
3,25
4,75
1,47
1$
[A]
10,0
65,6
88,1
16$
Ave
rage
equ
aliz
ed v
alua
tion
of ta
xabl
e pr
oper
ty[A
/3]
3,35
5,22
9,37
2$
Deb
t lim
it (3
% o
f ave
rage
equ
aliz
atio
n va
lue)
[B]
100,
656,
881
a
Tota
l Net
Deb
t App
licab
le to
Lim
it[C
]1,
020,
000
Leg
al d
ebt m
argi
n[B
-C]
99,6
36,8
81$
2010
2011
2012
2013
2014
2015
2016
2017
2018
2019
Deb
t lim
it99
,844
,836
$
10
1,53
1,25
3$
96,9
25,7
37$
97,3
56,7
28$
95,5
77,4
52$
95,6
21,0
40$
94,7
86,0
98$
95
,967
,744
$
99,4
03,5
49$
10
0,65
6,88
1$
Tota
l net
deb
t app
licab
le to
lim
it3,
371,
000
3,15
6,00
0
2,
931,
000
2,69
6,00
0
2,
451,
000
2,19
1,00
0
1,
921,
000
1,
685,
000
1,35
0,00
0
1,
020,
000
Lega
l deb
t mar
gin
96,4
73,8
36$
98,3
75,2
53$
93,9
94,7
37$
94,6
60,7
28$
93,1
26,4
52$
93,4
30,0
40$
92,8
65,0
98$
94
,282
,744
$
98,0
53,5
49$
99
,636
,881
$
Tota
l net
deb
t app
licab
le to
the
limit
as a
per
cent
age
of d
ebt l
imit
3.69
%3.
38%
3.11
%3.
02%
2.77
%2.
56%
2.29
%2.
03%
1.76
%1.
36%
Sour
ce:
Equa
lized
val
uatio
n ba
ses w
ere
obta
ined
from
the
Ann
ual R
epor
t of t
he S
tate
of N
ew Je
rsey
,D
epar
tmen
t of T
reas
ury,
Div
isio
n of
Tax
atio
n
aLi
mit
set b
y N
JSA
18A
:24-
19 fo
r a K
thro
ugh
12 d
istri
ct; o
ther
% li
mits
wou
ld b
e ap
plic
able
for o
ther
dis
trict
type
s.
Eng
lew
ood
Clif
fs B
oard
of E
duca
tion
Leg
al D
ebt M
argi
n In
form
atio
n,L
ast T
en F
isca
l Yea
rs
-104-

Exhibit J-14
Per Capita UnemploymentYear Population a Personal Income b Personal Income c Rate d
2010 5,321 351,143,432 65,992 7.60%2011 5,350 368,427,750 68,865 7.50%2012 5,354 384,358,306 71,789 7.60%2013 5,369 381,735,900 71,100 8.00%2014 5,368 395,283,416 73,637 4.40%2015 5,363 411,991,023 76,821 3.40%2016 5,348 416,614,548 77,901 3.60%2017 5,367 435,816,501 81,203 3.10%2018 5,385 Not Available Not Available 2.60%2019 Not Available Not Available Not Available Not Available
Source: a Population information provided by the NJ Dept of Labor and Workforce Developmentb Personal income has been estimated based upon the municipal population and per capita personal income presented.c Per Capita Personal Income - Bergen County - provided by NJ Dept of Labor and Workforce Development.d Unemployment data provided by the NJ Dept of Labor and Workforce Development
Englewood Cliffs Board of EducationDemographic and Economic Statistics
Last Ten Fiscal Years
-105-
Exh
ibit
J-15
Em
ploy
erE
mpl
oyee
sR
ank
[Opt
iona
l]
Perc
enta
ge
of T
otal
M
unic
ipal
E
mpl
oym
ent
Em
ploy
ees
Ran
k [O
ptio
nal]
Perc
enta
ge
of T
otal
M
unic
ipal
E
mpl
oym
ent
THE
NEW
JER
SEY
DEP
AR
TMEN
T O
F LA
BO
R A
ND
AR
EA E
MPL
OY
ERS
REF
USE
D T
O R
ELEA
SE IN
FOR
MA
TIO
N N
EED
EDTO
CO
MPL
ETE
THIS
SC
HED
ULE
DU
E TO
PR
IVA
CY
CO
NC
ERN
S.
En g
lew
ood
Clif
fs B
oard
of E
duca
tion
Prin
cipa
l Em
ploy
ers,
Cur
rent
Yea
r an
d T
en Y
ears
Ago
2019
2010
-106-

Exh
ibit
J-16
2010
2011
2012
2013
2014
2015
2016
2017
2018
2019
Func
tion/
Prog
ram
Inst
ruct
ion
Reg
ular
43.4
35
.9
35.0
36
.0
38.5
40
.9
40.5
38
.5
42
.7
49
.8
Sp
ecia
l edu
catio
n10
.0
7.7
13.0
14
.0
11.5
10
.9
12.0
11
.5
11
.0
13
.0
O
ther
spec
ial e
duca
tion
7.0
8.0
10.0
12
.0
2.0
2.0
3.0
3.5
1.9
-
V
ocat
iona
lO
ther
inst
ruct
ion
4.0
2.0
2.0
2.0
2.0
2.3
2.0
Non
publ
ic sc
hool
pro
gram
sA
dult/
cont
inui
ng e
duca
tion
prog
ram
s
Supp
ort S
ervi
ces:
Stud
ent &
inst
ruct
ion
rela
ted
serv
ices
3.4
3.0
4.0
4.0
25.7
25
.7
25.5
24
.5
23
.0
11
.2
G
ener
al a
dmin
istra
tion
2.0
2.0
3.0
4.0
1.6
1.7
1.9
2.1
2.1
2.1
Scho
ol a
dmin
istra
tive
serv
ices
5.0
5.0
4.0
4.0
2.5
2.0
2.0
2.7
3.0
2.5
Oth
er a
dmin
istra
tive
serv
ices
7.0
Cen
tral s
ervi
ces
4.0
2.1
3.0
4.0
2.3
2.3
2.3
2.3
2.3
1.8
Adm
inis
trativ
e In
form
atio
n Te
chno
logy
2.0
2.0
2.5
1.5
1.0
1.0
2.5
Plan
t ope
ratio
ns a
nd m
aint
enan
ce6.
4
5.
4
6.
0
8.
0
7.
5
8.
0
7.
6
7.
5
7.
6
6.
0
Pu
pil t
rans
porta
tion
0.3
0.3
0.3
0.3
0.3
Oth
er su
ppor
t ser
vice
s0.
6
0.
4
4.
0
3.
0
0.
3
2.
0
Sp
ecia
l Sch
ools
Food
Ser
vice
Chi
ld C
are
Tota
l88
74
84
.0
91.0
93
.8
98.6
98
.4
93.8
94.9
98.2
Sour
ce: D
istri
ct P
erso
nnel
Rec
ords
Eng
lew
ood
Clif
fs B
oard
of E
duca
tion
Full-
time
Equ
ival
ent D
istr
ict E
mpl
oyee
s by
Func
tion/
Prog
ram
,L
ast T
en F
isca
l Yea
rs
-107-

Exh
ibit
J-17
Fisc
al
Yea
rE
nrol
lmen
tO
pera
ting
Exp
endi
ture
s aC
ost P
er
Pupi
lPe
rcen
tage
C
hang
eT
each
ing
Staf
f bE
lem
enta
ryM
iddl
e Sc
hool
Seni
or
Hig
h Sc
hool
Ave
rage
Dai
ly
Enr
ollm
ent (
AD
E) c
Ave
rage
D
aily
A
tten
danc
e (A
DA
) c
% C
hang
e in
A
vera
ge D
aily
E
nrol
lmen
t
Stud
ent
Att
enda
nce
Perc
enta
ge
2010
426
1
1,19
2,31
4
26,
273
5.63
%
87.
80
1:9.
21:
9.2
447.
6941
2.85
4.
47%
92.2
2%20
1145
0
9,
722,
792
2
1,60
6 -1
7.76
%
43.
00
1:11
.61:
11.6
452.
5041
3.85
1.
07%
91.4
6%20
1249
2
10,
467,
674
2
1,27
6 -1
.53%
4
8.00
1:
11.2
1:11
.249
3.70
414.
85
9.10
%84
.03%
2013
498
1
0,92
5,23
7
21,
938
3.11
%
55.
00
1:11
.21:
11.2
498.
0047
3.10
0.
87%
95.0
0%20
1449
6
11,
703,
743
2
3,59
6 7.
56%
5
2.00
1:
10.0
1:10
.052
3.03
506.
08
5.03
%96
.76%
2015
567
1
2,00
9,08
4
21,
180
-10.
24%
5
6.00
1:
10.0
1:10
.054
0.00
523.
00
3.24
%96
.85%
2016
584
1
2,77
1,38
3
21,
869
3.25
%
54.
60
1:10
.71:
10.7
546.
2552
8.65
1.
16%
96.7
8%20
1754
7
14,
328,
213
2
6,19
4 19
.78%
5
3.50
1:
10.2
31:
10.2
352
4.76
506.
53
-3.9
3%96
.53%
2018
495
1
5,08
7,13
4
30,
479
16.3
6%
55.
60
1:8.
911:
8.91
494.
3648
6.29
-5
.79%
98.3
7%20
1948
9
13,
642,
953
2
7,90
0 -8
.46%
5
4.50
1:
8.98
1:8.
9848
9.48
478.
78
-0.9
9%97
.81%
Sour
ces:
D
istri
ct re
cord
s
Not
e: E
nrol
lmen
t bas
ed o
n an
nual
Oct
ober
dis
trict
cou
nt.
aO
pera
ting
expe
nditu
res e
qual
tota
l exp
endi
ture
s les
s deb
t ser
vice
and
cap
ital o
utla
y.b
Teac
hing
staf
f inc
lude
s onl
y fu
ll-tim
e eq
uiva
lent
s of c
ertif
icat
ed st
aff.
cA
vera
ge d
aily
enr
ollm
ent a
nd a
vera
ge d
aily
atte
ndan
ce a
re o
btai
ned
from
the
Scho
ol R
egis
ter S
umm
ary
(SR
S).
Eng
lew
ood
Clif
fs B
oard
of E
duca
tion
Ope
ratin
g St
atis
tics,
Las
t Ten
Fis
cal Y
ears
Pupi
l/Tea
cher
Rat
io
-108-
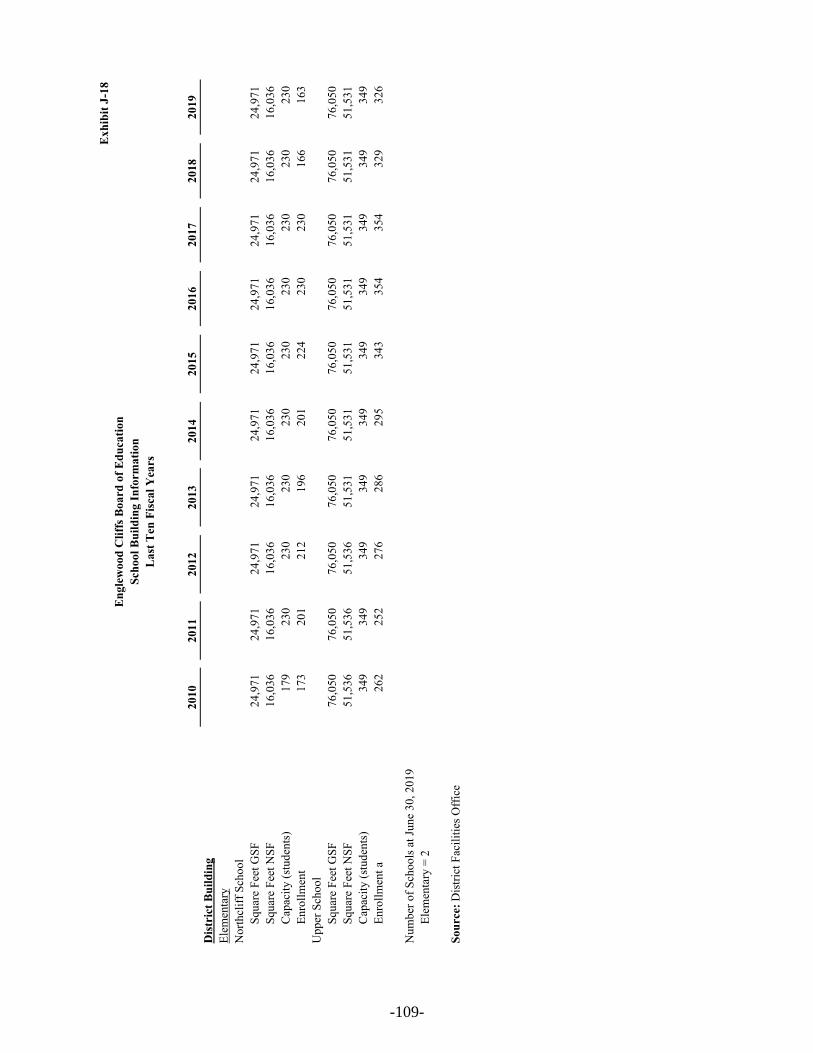
Exh
ibit
J-18
2010
2011
2012
2013
2014
2015
2016
2017
2018
2019
Dis
tric
t Bui
ldin
g
Nor
thcl
iff S
choo
lSq
uare
Fee
t GSF
24,9
71
24
,971
24,9
71
24
,971
24,9
71
24
,971
24,9
71
24
,971
24,9
71
24
,971
Squa
re F
eet N
SF16
,036
16,0
36
16
,036
16,0
36
16
,036
16,0
36
16
,036
16,0
36
16
,036
16,0
36
C
apac
ity (s
tude
nts)
179
230
230
230
230
230
230
23
0
230
23
0
Enro
llmen
t17
3
20
1
21
2
19
6
20
1
22
4
23
0
230
16
6
163
U
pper
Sch
ool
Squa
re F
eet G
SF76
,050
76,0
50
76
,050
76,0
50
76
,050
76,0
50
76
,050
76,0
50
76
,050
76,0
50
Sq
uare
Fee
t NSF
51,5
36
51
,536
51,5
36
51
,531
51,5
31
51
,531
51,5
31
51
,531
51,5
31
51
,531
Cap
acity
(stu
dent
s)34
9
34
9
34
9
34
9
34
9
34
9
34
9
349
34
9
349
En
rollm
ent a
262
252
276
286
295
343
354
35
4
329
32
6
Num
ber o
f Sch
ools
at J
une
30, 2
019
Elem
enta
ry =
2
Sour
ce: D
istri
ct F
acili
ties O
ffic
e
Eng
lew
ood
Clif
fs B
oard
of E
duca
tion
Scho
ol B
uild
ing
Info
rmat
ion
Las
t Ten
Fis
cal Y
ears
Elem
enta
ry
-109-

Exh
ibit
J-19
Scho
ol F
acili
ties
Proj
ect.
No.
's20
1920
1820
1720
1620
1520
1420
1320
1220
1120
10N
orth
cliff
Sch
ool
N/A
39,7
86
59,9
64
59,7
38
15,3
24
14,0
54
14,8
90
10,4
73
7,66
9
23,7
02
48,9
42$
Upp
er S
choo
lN
/A98
,221
10
4,98
1
79
,787
61
,793
48
,237
48
,357
38
,717
10
8,76
8
47
,051
76
,305
Gra
nd T
otal
138,
007
$
164,
945
$
139,
525
$
77,1
17$
62,2
91$
63,2
47$
49,1
90$
116,
437
$
70,7
53$
125,
247
$
Sour
ce:
Dis
trict
reco
rds
Eng
lew
ood
Clif
fs B
oard
of E
duca
tion
Sche
dule
of R
equi
red
Mai
nten
ance
Las
t Ten
Fis
cal Y
ears
UN
DIS
TRIB
UTE
D E
XPE
ND
ITU
RES
- R
EQU
IRED
MA
INTE
NA
NC
E FO
R S
CH
OO
L FA
CIL
ITIE
S11
-000
-261
-XX
X
-110-

Exhibit J-20
Company Type of Coverage Coverage Deductible
Great American Insurance Company Flood & Earthquake 5,000,000/occurrence 50,0005,000,000 aggregate
Flood: Within Special Flood "A" 2,000,000/occurrence 500,0002,000,000 aggregate
Extra Expense 5,000,000Building Ord Demolition Cost 5,000,000Building Ord Increased Cost of Construction 5,000,000
Pollution - Clean Up & Removal 100,000Broadened Water - Loss of Income Planned Events
and Tuition Fees 100,000Claim Data Expenses 25,000Fire Dept Service Charge 25,000Fire Extinguisher Recharge Expense 5,000Food Contamination Shutdown 10,000Newly Acquired or Constructed Property - Building 1,000,000Newly Acquired Personel Property 500,000Non-Owned Detached Trailers 5,000Outdoor Fences 100,000Outdoor Signs 100,000Pollutant Cleanup and Removal - Planned Events 10,000Property Off Premises 100,000Refridgerated Property 50,000Roof Protection 1,000Transportation 100,000Tuition and Fees 20,000Utility Services Direct Damage 50,000Utility Services Planned Events 25,000Valuable Papers & Records 5,000,000 1,000
Accts Receivable 100,000 Fine Arts 25,000 Musical Instruments 250,000 1,000
10,000/item Cameras, Audio/Video Equip 250,000 1,000
10,000/item Misc School Property 100,000 Contractors Equipment 250,000 1,000
Reward - Arson, Theft or Vandalism 25,000Underground Fiber Optic Cable 100,000Violent Event Extra Expense 50,000Expediting Expenses 250,000Hazardous Substances 250,000Spoilage 250,000
Theft of Money & Securities-Inside Premises 50,000 1,000 Theft of Money & Securities-Outside Premises 50,000 1,000 Computer Fraud 50,000 1,000
Installation Floater 500,000 1,000General Liability General Aggregate 2,000,000 10,000 Products & Completed Operations 2,000,000 10,000 Each Occurrence 1,000,000 10,000 Personal & Advertising Injury 1,000,000 10,000
Fire Damage Legal Liability 1,000,000 10,000Medical Expense Limit 5,000Pesticide or Herbicide Applicator 1,000,000 1,000
Employee Benefits Liability 1,000,000/per claim 1,0002,000,000 annual aggregate
Sexual Abuse & Molestation 1,000,000/occurrence1,000,000 annual aggregate
Englewood Cliffs Board of EducationInsurance Schedule
June 30, 2019
-111-
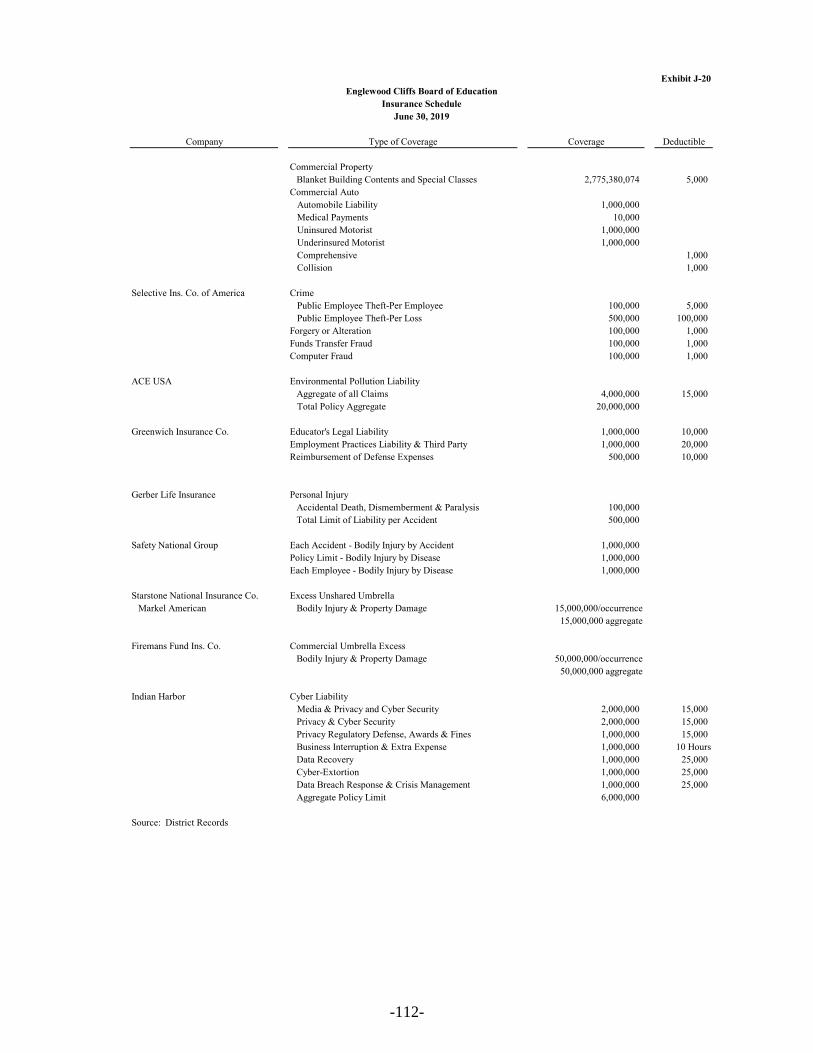
Exhibit J-20
Company Type of Coverage Coverage Deductible
Englewood Cliffs Board of EducationInsurance Schedule
June 30, 2019
Commercial PropertyBlanket Building Contents and Special Classes 2,775,380,074 5,000
Commercial Auto Automobile Liability 1,000,000 Medical Payments 10,000 Uninsured Motorist 1,000,000 Underinsured Motorist 1,000,000 Comprehensive 1,000 Collision 1,000
Selective Ins. Co. of America Crime Public Employee Theft-Per Employee 100,000 5,000 Public Employee Theft-Per Loss 500,000 100,000Forgery or Alteration 100,000 1,000Funds Transfer Fraud 100,000 1,000Computer Fraud 100,000 1,000
ACE USA Environmental Pollution LiabilityAggregate of all Claims 4,000,000 15,000
Total Policy Aggregate 20,000,000
Greenwich Insurance Co. Educator's Legal Liability 1,000,000 10,000Employment Practices Liability & Third Party 1,000,000 20,000Reimbursement of Defense Expenses 500,000 10,000
Gerber Life Insurance Personal InjuryAccidental Death, Dismemberment & Paralysis 100,000Total Limit of Liability per Accident 500,000
Safety National Group Each Accident - Bodily Injury by Accident 1,000,000Policy Limit - Bodily Injury by Disease 1,000,000Each Employee - Bodily Injury by Disease 1,000,000
Starstone National Insurance Co. Excess Unshared UmbrellaMarkel American Bodily Injury & Property Damage 15,000,000/occurrence
15,000,000 aggregate
Firemans Fund Ins. Co. Commercial Umbrella ExcessBodily Injury & Property Damage 50,000,000/occurrence
50,000,000 aggregate
Indian Harbor Cyber Liability Media & Privacy and Cyber Security 2,000,000 15,000
Privacy & Cyber Security 2,000,000 15,000Privacy Regulatory Defense, Awards & Fines 1,000,000 15,000Business Interruption & Extra Expense 1,000,000 10 HoursData Recovery 1,000,000 25,000Cyber-Extortion 1,000,000 25,000Data Breach Response & Crisis Management 1,000,000 25,000Aggregate Policy Limit 6,000,000
Source: District Records
-112-

SINGLE AUDIT SECTION
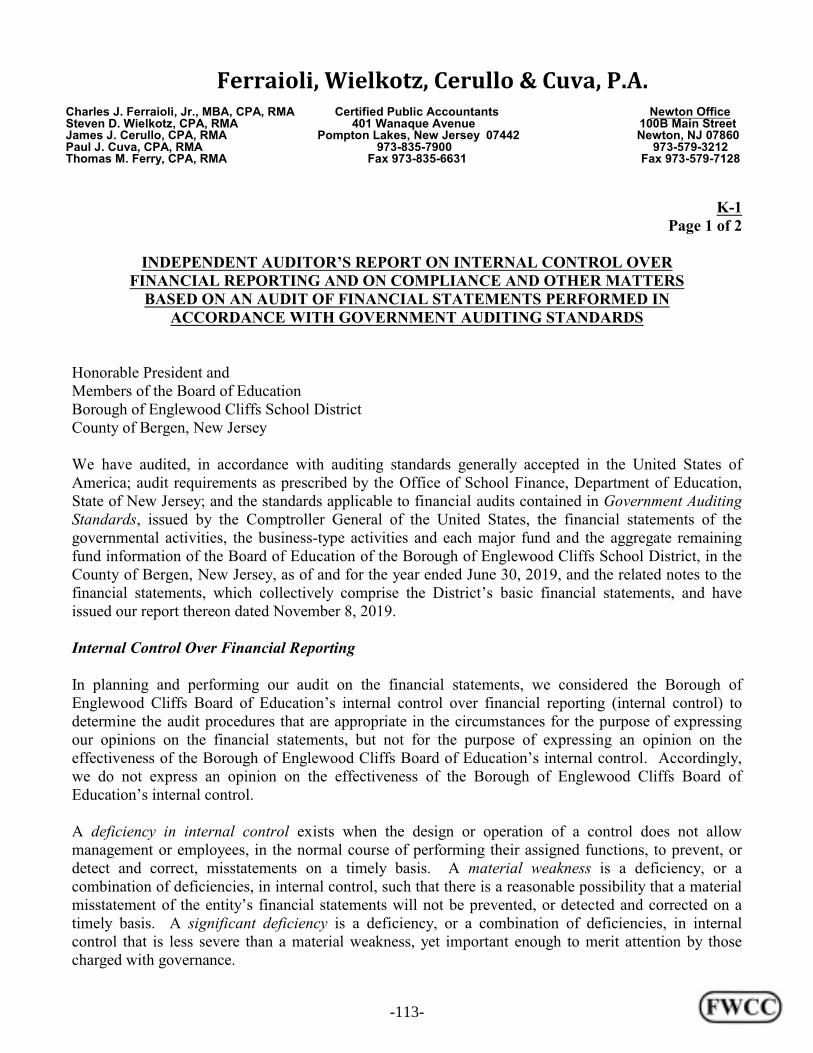
Ferraioli, Wielkotz, Cerullo & Cuva, P.A.Charles J. Ferraioli, Jr., MBA, CPA, RMA Certified Public Accountants Newton Office Steven D. Wielkotz, CPA, RMA 401 Wanaque Avenue 100B Main Street James J. Cerullo, CPA, RMA Pompton Lakes, New Jersey 07442 Newton, NJ 07860Paul J. Cuva, CPA, RMA 973-835-7900 973-579-3212Thomas M. Ferry, CPA, RMA Fax 973-835-6631 Fax 973-579-7128
K-1 Page 1 of 2
INDEPENDENT AUDITOR’S REPORT ON INTERNAL CONTROL OVERFINANCIAL REPORTING AND ON COMPLIANCE AND OTHER MATTERS
BASED ON AN AUDIT OF FINANCIAL STATEMENTS PERFORMED INACCORDANCE WITH GOVERNMENT AUDITING STANDARDS
Honorable President andMembers of the Board of EducationBorough of Englewood Cliffs School DistrictCounty of Bergen, New Jersey
We have audited, in accordance with auditing standards generally accepted in the United States ofAmerica; audit requirements as prescribed by the Office of School Finance, Department of Education,State of New Jersey; and the standards applicable to financial audits contained in Government AuditingStandards, issued by the Comptroller General of the United States, the financial statements of thegovernmental activities, the business-type activities and each major fund and the aggregate remainingfund information of the Board of Education of the Borough of Englewood Cliffs School District, in theCounty of Bergen, New Jersey, as of and for the year ended June 30, 2019, and the related notes to thefinancial statements, which collectively comprise the District’s basic financial statements, and haveissued our report thereon dated November 8, 2019.
Internal Control Over Financial Reporting
In planning and performing our audit on the financial statements, we considered the Borough ofEnglewood Cliffs Board of Education’s internal control over financial reporting (internal control) todetermine the audit procedures that are appropriate in the circumstances for the purpose of expressingour opinions on the financial statements, but not for the purpose of expressing an opinion on theeffectiveness of the Borough of Englewood Cliffs Board of Education’s internal control. Accordingly,we do not express an opinion on the effectiveness of the Borough of Englewood Cliffs Board ofEducation’s internal control.
A deficiency in internal control exists when the design or operation of a control does not allowmanagement or employees, in the normal course of performing their assigned functions, to prevent, ordetect and correct, misstatements on a timely basis. A material weakness is a deficiency, or acombination of deficiencies, in internal control, such that there is a reasonable possibility that a materialmisstatement of the entity’s financial statements will not be prevented, or detected and corrected on atimely basis. A significant deficiency is a deficiency, or a combination of deficiencies, in internalcontrol that is less severe than a material weakness, yet important enough to merit attention by thosecharged with governance.
-113-

Honorable President and K-1Members of the Board of Education Page 2 of 2
Our consideration of internal control was for the limited purpose described in the first paragraph of thissection and was not designed to identify all deficiencies in internal control that might be materialweaknesses or significant deficiencies. Given these limitations, during our audit we did not identify anydeficiencies in internal control that we consider to be material weaknesses. However, materialweaknesses may exist that have not been identified.
Compliance and Other Matters
As part of obtaining reasonable assurance about whether the Borough of Englewood Cliffs Board ofEducation’s financial statements are free of material misstatement, we performed tests of its compliancewith certain provisions of laws, regulations, contracts and grant agreements, noncompliance with whichcould have a direct and material effect on the determination of financial statement amounts. However,providing an opinion on compliance with those provisions was not an objective of our audit and,accordingly, we do not express such an opinion. The results of our tests disclosed no instances ofnoncompliance or other matters that are required to be reported under Government Auditing Standardsor the audit requirements as prescribed by the Office of School Finance, Department of Education, Stateof New Jersey.
We noted certain matters that were required to be reported to the Board of Education of the Borough ofEnglewood Cliffs School District in the separate Auditors’ Management Report on AdministrativeFindings - Financial, Compliance and Performance dated November 8, 2019.
Purpose of this Report
The purpose of this report is solely to describe the scope of our testing of internal control andcompliance and the results of that testing, and not to provide an opinion on the effectiveness of theentity’s internal control or on compliance. This report is an integral part of an audit performed inaccordance with Government Auditing Standards in considering the entity’s internal control andcompliance. Accordingly, this communication is not suitable for any other purpose.
Steven D. Wielkotz, C.P.A.Licensed Public School AccountantNo. 816
FERRAIOLI, WIELKOTZ, CERULLO & CUVA, P.A.Certified Public AccountantsPompton Lakes, New Jersey
November 8, 2019
Ferraioli, Wielkotz, Cerullo & Cuva,P.A.
Steven D. Wielkotz
-114-
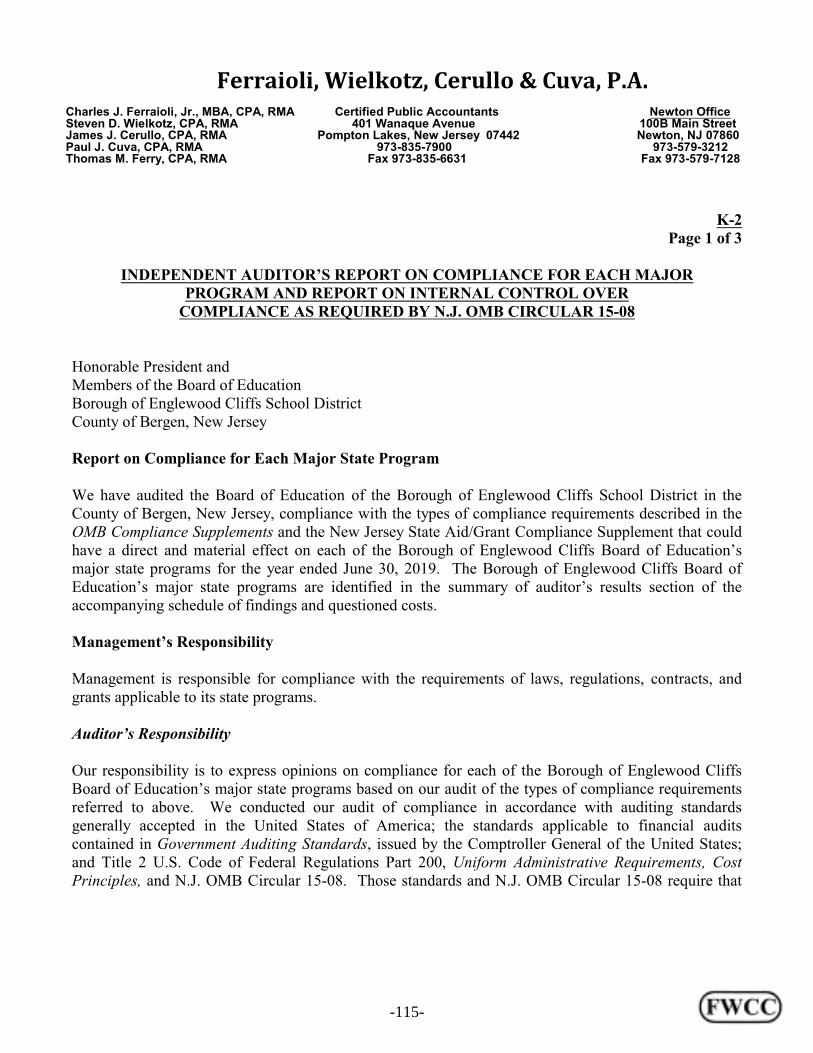
Ferraioli, Wielkotz, Cerullo & Cuva, P.A.Charles J. Ferraioli, Jr., MBA, CPA, RMA Certified Public Accountants Newton Office Steven D. Wielkotz, CPA, RMA 401 Wanaque Avenue 100B Main Street James J. Cerullo, CPA, RMA Pompton Lakes, New Jersey 07442 Newton, NJ 07860Paul J. Cuva, CPA, RMA 973-835-7900 973-579-3212Thomas M. Ferry, CPA, RMA Fax 973-835-6631 Fax 973-579-7128
K-2 Page 1 of 3
INDEPENDENT AUDITOR’S REPORT ON COMPLIANCE FOR EACH MAJORPROGRAM AND REPORT ON INTERNAL CONTROL OVER
COMPLIANCE AS REQUIRED BY N.J. OMB CIRCULAR 15-08
Honorable President andMembers of the Board of EducationBorough of Englewood Cliffs School DistrictCounty of Bergen, New Jersey
Report on Compliance for Each Major State Program
We have audited the Board of Education of the Borough of Englewood Cliffs School District in theCounty of Bergen, New Jersey, compliance with the types of compliance requirements described in theOMB Compliance Supplements and the New Jersey State Aid/Grant Compliance Supplement that couldhave a direct and material effect on each of the Borough of Englewood Cliffs Board of Education’smajor state programs for the year ended June 30, 2019. The Borough of Englewood Cliffs Board ofEducation’s major state programs are identified in the summary of auditor’s results section of theaccompanying schedule of findings and questioned costs.
Management’s Responsibility
Management is responsible for compliance with the requirements of laws, regulations, contracts, andgrants applicable to its state programs.
Auditor’s Responsibility
Our responsibility is to express opinions on compliance for each of the Borough of Englewood CliffsBoard of Education’s major state programs based on our audit of the types of compliance requirementsreferred to above. We conducted our audit of compliance in accordance with auditing standardsgenerally accepted in the United States of America; the standards applicable to financial auditscontained in Government Auditing Standards, issued by the Comptroller General of the United States;and Title 2 U.S. Code of Federal Regulations Part 200, Uniform Administrative Requirements, CostPrinciples, and N.J. OMB Circular 15-08. Those standards and N.J. OMB Circular 15-08 require that
-115-

Honorable President and K-2Members of the Board of Education Page 2 of 3
we plan and perform the audit to obtain reasonable assurance about whether noncompliance with thetypes of compliance requirements referred to above that could have a direct and material effect on amajor state program occurred. An audit includes examining, on a test basis, evidence about the Boroughof Englewood Cliffs Board of Education’s compliance with those requirements and performing suchother procedures as we considered necessary in the circumstances.
We believe that our provides a reasonable basis for our opinion on compliance for each major stateprogram. However, our audit does not provide a legal determination of the Borough of EnglewoodCliffs Board of Education’s compliance.
Opinion on Each Major State Program
In our opinion, the Borough of Englewood Cliffs Board of Education complied, in all material respects,with the types of compliance requirements referred to above that could have a direct and material effecton each of its major state programs for the year ended June 30, 2019.
Report on Internal Control Over Compliance
Management of the Borough of Englewood Cliffs Board of Education is responsible for establishing andmaintaining effective internal control over compliance with the types of compliance requirementsreferred to above. In planning and performing our audit of compliance, we considered the Borough ofEnglewood Cliffs Board of Education’s internal control over compliance with the type of requirementsthat could have a direct and material effect on each major state program to determine the auditingprocedures that are appropriate in the circumstances for the purpose of expressing an opinion oncompliance for each major state program and to test and report on internal control over compliance inaccordance with N.J. OMB Circular 15-08, but not for the purpose of expressing an opinion on theeffectiveness of internal control over compliance. Accordingly, we do not express an opinion on theeffectiveness of Borough of Englewood Cliffs Board of Education’s internal control over compliance.
A deficiency in internal control over compliance exists when the design or operation of a control overcompliance does not allow management or employees, in the normal course of performing theirassigned functions, to prevent, or detect and correct, noncompliance with a type of compliancerequirement of a state program on a timely basis. A material weakness in internal control overcompliance is a deficiency, or combination of deficiencies, in internal control over compliance, suchthat there is a reasonable possibility that material noncompliance with a type of compliance requirementof a state program will not be prevented, or detected and corrected, on a timely basis. A significantdeficiency in internal control over compliance is a deficiency, or a combination of deficiencies, ininternal control over compliance with a type of compliance requirement of a state program that is lesssevere than a material weakness in internal control over compliance, yet important enough to meritattention by those charged with governance.
-116-

Honorable President and K-2Members of the Board of Education Page 3 of 3
Our consideration of internal control over compliance was for the limited purpose described in the firstparagraph of this section and was not designed to identify all deficiencies in internal control overcompliance that might be material weaknesses or significant deficiencies. We did not identify anydeficiencies in internal control over compliance that we consider to be material weaknesses orsignificant deficiencies.
The purpose of this report on internal control over compliance is solely to describe the scope of ourtesting of internal control over compliance and the results of that testing based on the requirements ofN.J. OMB Circular 15-08. Accordingly, this report is not suitable for any other purpose.
Steven D. Wielkotz, C.P.A.Licensed Public School AccountantNo. 816
FERRAIOLI, WIELKOTZ, CERULLO & CUVA, P.A.Certified Public AccountantsPompton Lakes, New Jersey
November 8, 2019
Steven D. Wielkotz
Ferraioli, Wielkotz, Cerullo & Cuva,P.A.
-117-

Sche
dule
A K-3
(Acc
ount
sD
efer
red
Due
toFe
dera
lFe
dera
lG
rant
or
Bala
nce
atRe
ceiv
able
)Re
venu
eG
rant
or a
tFe
dera
l Gra
ntor
/Pas
s-th
roug
h CF
DA
FAIN
Stat
e Pr
ojec
tG
rant
Aw
ard
June
30,
Carr
yove
rCa
shBu
dget
ary
at Ju
ne 3
0,at
June
30,
June
30,
Gra
ntor
/Pro
gram
Titl
eN
umbe
rN
umbe
rN
umbe
rPe
riod
Am
ount
2018
Am
ount
Rece
ived
Expe
nditu
res
Adj
ustm
ents
2019
2019
2019
U.S
. Dep
artm
ent o
f Agr
icul
ture
Pass
ed-th
roug
h St
ate
Dep
artm
ent o
f Edu
catio
n:En
terp
rise
Fund
:Sp
ecia
l Milk
Pro
gram
10.5
5618
1NJ3
04N
1099
N/A
7/1/
18-6
/30/
192,
379
1,94
22,
379
(437
)Sp
ecia
l Milk
Pro
gram
10.5
5617
1NJ3
04N
1099
N/A
7/1/
17-6
/30/
182,
469
(517
)51
7To
tal U
.S. D
epar
tmen
t of A
gric
ultu
re(5
17)
2,45
92,
379
(437
)
Spec
ial R
even
ue F
und:
Title
I, P
art A
84.0
10S0
10A
1800
30ES
EA-1
380-
197/
1/18
-6/3
0/19
65,1
84(9
,400
)48
,589
65,1
83(2
5,99
4)Ti
tle I,
Par
t A84
.010
S010
A17
0030
ESEA
-138
0-18
7/1/
17-6
/30/
1865
,270
(9,4
00)
9,40
0Ti
tle II
, Par
t A84
.367
AS3
67A
1800
29ES
EA-1
380-
197/
1/18
-6/3
0/19
11,6
0612
,293
12,2
93Ti
tle II
I, En
glish
and
Lan
guag
e A
cqui
sitio
nan
d La
ngua
ge E
nhan
cem
ent
84.3
65A
S365
A18
0030
ESEA
-138
0-19
7/1/
18-6
/30/
193,
160
3,16
03,
160
Title
III,
Engl
ish a
nd L
angu
age
Acq
uisit
ion
and
Lang
uage
Enh
ance
men
t84
.365
AS3
65A
1700
30ES
EA-1
380-
187/
1/17
-6/3
0/18
10,0
001,
866
(1,8
66)
Title
III,
Imm
igra
nt84
.365
AS3
65A
1800
30ES
EA-1
380-
197/
1/18
-6/3
0/19
2,14
9(5
,416
)5,
416
9,69
7(9
,697
)Ti
tle II
I, Im
mig
rant
84.3
65A
S365
A17
0030
ESEA
-138
0-18
7/1/
17-6
/30/
188,
410
(5,4
16)
5,41
6Ti
tle IV
84.4
24S4
24A
1800
31ES
EA-1
380-
197/
1/18
-6/3
0/19
12,6
99(4
,798
)15
,692
11,8
09(9
15)
Title
IV84
.424
S424
A17
0031
ESEA
-138
0-18
7/1/
17-6
/30/
186,
363
(4,7
98)
4,79
8I.D
.E.A
. Par
t B, B
asic
84
.027
H02
7A18
0100
IDEA
-138
0-19
7/1/
18-6
/30/
1911
5,27
211
5,27
211
5,27
2I.D
.E.A
. Par
t B, P
resc
hool
84
.173
H17
3A18
0114
IDEA
-138
0-19
7/1/
18-6
/30/
194,
521
4,52
14,
521
Tota
l U.S
. Dep
artm
ent o
f Edu
catio
n(1
9,61
4)20
4,94
322
3,80
1(3
8,47
2)
Tota
l Fed
eral
Fin
anci
al A
ssist
ance
$(2
0,13
1)20
7,40
222
6,18
0(3
8,90
9)
(1) -
Gra
nt re
venu
e an
d ex
pend
iture
s are
refle
cted
on
this
sche
dule
for i
nfor
mat
ion
purp
oses
onl
y - g
rant
is a
dmin
ister
ed b
y a
cons
ortiu
m w
ith th
e Bo
gota
Boa
rd o
f Edu
catio
nSe
e ac
com
pany
ing
note
s to
sche
dule
s of e
xpen
ditu
res o
f fed
eral
and
stat
e aw
ards
.
Not
e: T
his s
ched
ule
was
not
subj
ect t
o an
aud
it in
acc
orda
nce
with
the
Uni
form
Gui
danc
e.
ENG
LEW
OO
D C
LIFF
S B
OA
RD
OF
EDU
CA
TIO
N
Sche
dule
of E
xpen
ditu
res o
f Fed
eral
Aw
ards
Yea
r en
ded
June
30,
201
9
-118-

Sche
dule
BK
-4
Bal
ance
at
June
30,
201
8D
efer
red
Re
paym
ent
Gra
nt o
r Sta
tePr
ogra
m
Reve
nue
Budg
etar
yof
Prio
r Cu
mul
ativ
ePr
ojec
tG
rant
or A
war
d(A
ccou
nts
Cash
Expe
nditu
res
Yea
rs'
(Acc
ount
sD
ue to
Budg
etar
yTo
tal
Stat
e G
rant
or/P
rogr
am T
itle
Num
bers
Perio
dA
mou
ntRe
ceiv
able
)Re
ceiv
edPa
ss th
roug
h Fu
nds
Bala
nces
Rece
ivab
le)
Gra
ntor
Rece
ivab
leEx
pend
iture
s
Stat
e D
epar
tmen
t of E
duca
tion:
Gen
eral
Fun
d:Sp
ecia
l Edu
catio
n A
id49
5-03
4-51
20-0
897/
1/18
-6/3
0/19
$26
3,96
524
2,98
926
3,96
5*
(20,
976)
263,
965
Tran
spor
tatio
n A
id49
5-03
4-51
20-0
147/
1/18
-6/3
0/19
141,
069
129,
859
141,
069
*(1
1,21
0)14
1,06
9Se
curit
y A
id49
5-03
4-51
20-0
847/
1/18
-6/3
0/19
8,96
88,
255
8,96
8*
(713
)8,
968
Reim
burs
ed N
on-P
ublic
Tra
nspo
rtatio
n A
id49
5-03
4-51
20-0
147/
1/18
-6/3
0/19
30,7
1130
,711
(30,
711)
*30
,711
Reim
burs
ed N
on-P
ublic
Tra
nspo
rtatio
n A
id49
5-03
4-51
20-0
147/
1/17
-6/3
0/18
29,9
34(2
9,93
4)29
,934
*29
,934
Extra
ordi
nary
Aid
495-
034-
5120
-044
7/1/
18-6
/30/
1927
1,30
627
1,30
6(2
71,3
06)
*27
1,30
6Ex
traor
dina
ry A
id49
5-03
4-51
20-0
447/
1/17
-6/3
0/18
255,
982
(255
,982
)25
5,98
2*
255,
982
Lead
Tes
ting
for S
choo
ls A
id49
5-03
4-51
20-1
047/
1/17
-6/3
0/18
*TP
AF
Soci
al S
ecur
ity49
5-03
4-50
94-0
037/
1/18
-6/3
0/19
344,
688
327,
384
344,
688
(17,
304)
*34
4,68
8TP
AF
Soci
al S
ecur
ity49
5-03
4-50
94-0
037/
1/17
-6/3
0/18
332,
725
(16,
087)
16,0
87*
332,
725
On-
beha
lf TP
AF
Post
retir
emen
t Med
ical
Con
t.49
5-03
4-50
94-0
017/
1/18
-6/3
0/19
395,
584
395,
584
395,
584
*39
5,58
4O
n-be
half
TPA
F Pe
nsio
n49
5-03
4-50
94-0
027/
1/18
-6/3
0/19
854,
222
854,
222
854,
222
*85
4,22
2O
n-be
half
TPA
F N
CGI P
rem
ium
495-
034-
5094
-004
7/1/
18-6
/30/
1917
,881
17,8
8117
,881
*17
,881
On-
beha
lf TP
AF
- LTD
I49
5-03
4-50
94-0
047/
1/18
-6/3
0/19
1,07
51,
075
1,07
5*
1,07
5To
tal G
ener
al F
und
(302
,003
)2,
279,
252
2,32
9,46
9(3
19,3
21)
*(3
2,89
9)2,
948,
110
*Sp
ecia
l Rev
enue
Fun
d:*
N.J.
Non
publ
ic A
id:
*Se
curit
y A
id10
0-03
4-51
20-5
097/
1/18
-6/3
0/19
17,7
0017
,700
15,0
662,
634
*15
,066
Secu
rity
Aid
100-
034-
5120
-509
7/1/
17-6
/30/
187,
650
7,65
07,
650
*Te
xtbo
ok A
id10
0-03
4-51
20-0
647/
1/18
-6/3
0/19
5,18
05,
180
5,17
55
*5,
175
Text
book
Aid
100-
034-
5120
-064
7/1/
17-6
/30/
184,
602
4,60
24,
602
*N
ursin
g Se
rvic
es10
0-03
4-51
20-0
707/
1/18
-6/3
0/19
11,4
4611
,446
11,4
46*
11,4
46Te
chno
logy
Aid
100-
034-
5120
-373
7/1/
18-6
/30/
193,
492
3,49
23,
374
118
*3,
374
Tech
nolo
gy A
id10
0-03
4-51
20-3
737/
1/17
-6/3
0/18
3,10
884
384
3*
2,26
5To
tal S
peci
al R
even
ue F
und
13,0
9537
,818
35,0
6113
,095
2,75
7*
37,3
26*
Deb
t Ser
vice
Fun
d:*
Deb
t Ser
vice
Aid
Typ
e II
495-
034-
5120
-017
7/1/
18-6
/30/
1988
,290
88,2
9088
,290
*88
,290
88,2
9088
,290
*88
,290
*To
tal S
tate
Fin
anci
al A
ssist
ance
(288
,908
)2,
405,
360
2,45
2,82
013
,095
(319
,321
)2,
757
*(3
2,89
9)3,
073,
726
Less
: On-
Beh
alf T
PAF
Pens
ion
Syst
em C
ontr
ibut
ions
On-
Beha
lf TP
AF
Pens
ion
- Con
tribu
tion
495-
034-
5094
-002
7/1/
18-6
/30/
1985
4,22
285
4,22
2O
n-Be
half
TPA
F Pe
nsio
n - P
ost R
etire
men
t49
5-03
4-50
94-0
017/
1/18
-6/3
0/19
395,
584
395,
584
On-
Beha
lf TP
AF
NCG
I Pre
miu
m49
5-03
4-50
94-0
047/
1/18
-6/3
0/19
17,8
8117
,881
On-
Beha
lf TP
AF
LTD
I49
5-03
4-50
94-0
047/
1/18
-6/3
0/19
1,07
51,
075
1,26
8,76
2
Tota
l for
Sta
te F
inan
cial
Ass
istan
ce-M
ajor
Pro
gram
Det
erm
inat
ion
1,18
4,05
8
See
acco
mpa
nyin
g no
tes t
o sc
hedu
les o
f exp
endi
ture
s for
fede
ral a
nd st
ate
awar
ds.
Bal
ance
at J
une
30, 2
019
MEM
O
ENG
LEW
OO
D C
LIFF
S B
OA
RD
OF
EDU
CA
TIO
N
Sche
dule
of E
xpen
ditu
res o
f Sta
te F
inan
cial
Ass
istan
ce
Yea
r en
ded
June
30,
201
9
-119-
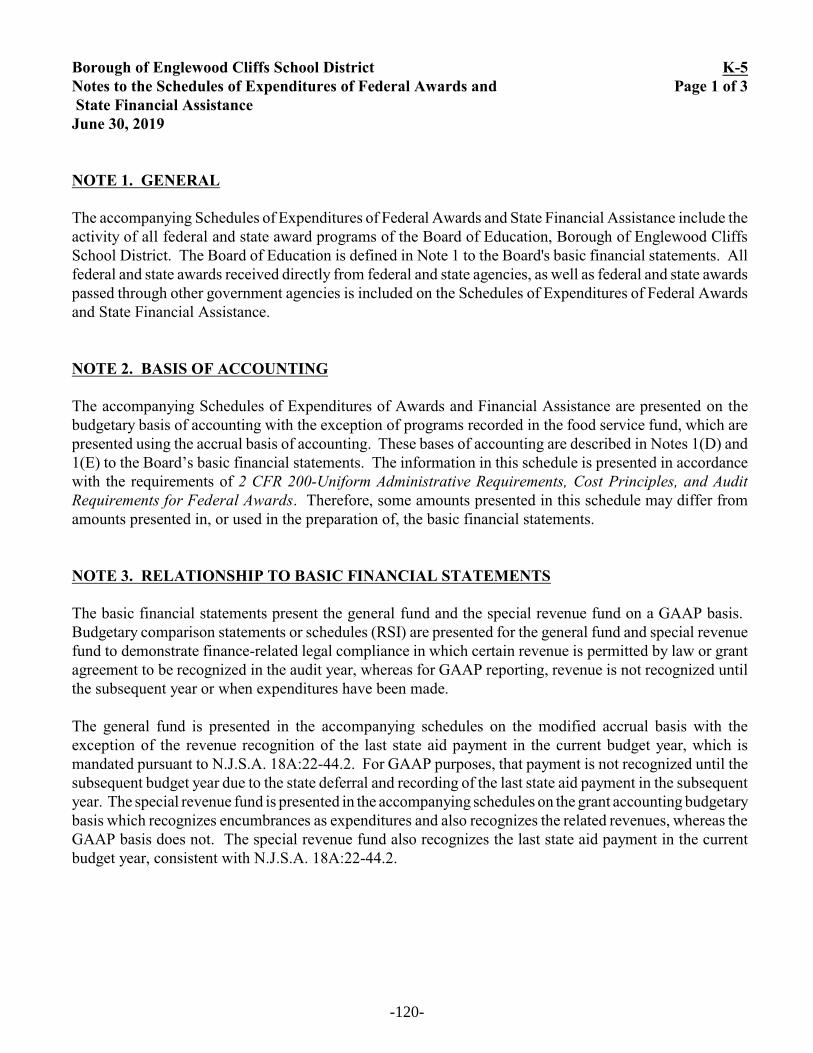
Borough of Englewood Cliffs School District K-5Notes to the Schedules of Expenditures of Federal Awards and Page 1 of 3 State Financial Assistance June 30, 2019
NOTE 1. GENERAL
The accompanying Schedules of Expenditures of Federal Awards and State Financial Assistance include theactivity of all federal and state award programs of the Board of Education, Borough of Englewood CliffsSchool District. The Board of Education is defined in Note 1 to the Board's basic financial statements. Allfederal and state awards received directly from federal and state agencies, as well as federal and state awardspassed through other government agencies is included on the Schedules of Expenditures of Federal Awardsand State Financial Assistance.
NOTE 2. BASIS OF ACCOUNTING
The accompanying Schedules of Expenditures of Awards and Financial Assistance are presented on thebudgetary basis of accounting with the exception of programs recorded in the food service fund, which arepresented using the accrual basis of accounting. These bases of accounting are described in Notes 1(D) and1(E) to the Board’s basic financial statements. The information in this schedule is presented in accordancewith the requirements of 2 CFR 200-Uniform Administrative Requirements, Cost Principles, and AuditRequirements for Federal Awards. Therefore, some amounts presented in this schedule may differ fromamounts presented in, or used in the preparation of, the basic financial statements.
NOTE 3. RELATIONSHIP TO BASIC FINANCIAL STATEMENTS
The basic financial statements present the general fund and the special revenue fund on a GAAP basis. Budgetary comparison statements or schedules (RSI) are presented for the general fund and special revenuefund to demonstrate finance-related legal compliance in which certain revenue is permitted by law or grantagreement to be recognized in the audit year, whereas for GAAP reporting, revenue is not recognized untilthe subsequent year or when expenditures have been made.
The general fund is presented in the accompanying schedules on the modified accrual basis with theexception of the revenue recognition of the last state aid payment in the current budget year, which ismandated pursuant to N.J.S.A. 18A:22-44.2. For GAAP purposes, that payment is not recognized until thesubsequent budget year due to the state deferral and recording of the last state aid payment in the subsequentyear. The special revenue fund is presented in the accompanying schedules on the grant accounting budgetarybasis which recognizes encumbrances as expenditures and also recognizes the related revenues, whereas theGAAP basis does not. The special revenue fund also recognizes the last state aid payment in the currentbudget year, consistent with N.J.S.A. 18A:22-44.2.
-120-

Borough of Englewood Cliffs School District K-5Notes to the Schedules of Expenditures of Federal Awards and Page 2 of 3 State Financial AssistanceJune 30, 2019
NOTE 3. RELATIONSHIP TO BASIC FINANCIAL STATEMENTS, (continued)
The net adjustment to reconcile from the budgetary basis to the GAAP basis is $(8,241) for the General Fundand $(18,472) for the Special Revenue Fund. See Notes to Required Supplemental Information for areconciliation of the budgetary basis to the modified accrual basis of accounting for the general and specialrevenue funds. Awards and financial assistance revenues are reported in the Board’s financial statements ona GAAP basis as follows:
Federal State Total
General Fund $ $2,321,228 $2,321,228Special Revenue Fund 215,094 25,296 240,390Debt Service Fund 88,290 88,290Food Service Fund 2,379 2,379Total Awards and Financial $217,473 $2,434,814 $2,652,287
NOTE 4. RELATIONSHIP TO FEDERAL AND STATE FINANCIAL REPORTS
Amounts reported in the accompanying schedules agree with the amounts reported in the related federal andstate financial reports.
NOTE 5. OTHER
Revenues and expenditures reported under the Food Distribution Program represent current year valuereceived and current year distributions, respectively. The amount reported as TPAF Pension Contributionsrepresents the amount paid by the state on behalf of the District for the year ended June 30, 2019. TPAFSocial Security Contributions represents the amount reimbursed by the state for the employer’s share of socialsecurity contributions for TPAF members for the year ended June 30, 2019.
NOTE 6. ON-BEHALF PROGRAMS NOT SUBJECT TO STATE SINGLE AUDIT
On-behalf State Programs for TPAF Pension and Post-Retirement Medical Benefits Contributions are notsubject to a State single audit and, therefore, the amount of $1,268,762 of on-behalf payments is excludedfrom major program determination.
-121-

Borough of Englewood Cliffs School District K-5Notes to the Schedules of Expenditures of Federal Awards and Page 3 of 3 State Financial AssistanceJune 30, 2019
NOTE 8. SCHOOLWIDE PROGRAM FUNDS
Schoolwide programs are not separate federal programs as defined in Uniform Administrative Requirements,Cost Principles, and Audit Requirements for Federal Awards (Uniform Grant Guidance); amounts used inschoolwide programs are included in the total expenditures of the program contributing the funds in theSchedule of Expenditures of Federal Awards. The following funds by program are included in schoolwideprograms in the school district:
Program Total
Title I, Part A: Grants to Local Educational Agencies $65,183Title II, Part A: Improving Teacher Quality State Grants 12,293Title III: English Language Acquisition State Grants (Pass Through) 3,160Title III: Immigrant 11,563Title IV: Student Support and Academic Enrichment 11,809
Total $104,008
-122-

K-6 BOROUGH OF ENGLEWOOD CLIFFS SCHOOL DISTRICT
SCHEDULE OF FINDINGS AND QUESTIONED COSTSFOR THE FISCAL YEAR ENDED JUNE 30, 2019
Section I - Summary of Auditor’s Results
Financial Statements
Type of auditor’s report issued: unmodified
Internal control over financial reporting:
1. Material weakness(es) identified? yes X no
2. Significant deficiencies identified that arenot considered to be material weaknesses? yes X none reported
Noncompliance material to basic financial statements noted? yes X no
Federal Awards
Not Applicable
State Awards
Dollar threshold used to distinguish between type A and type B programs: $ 750,000
Auditee qualified as low-risk auditee? X yes no
Type of auditor’s report issued on compliance for major programs: unmodified
Internal Control over major programs:
1. Material weakness(es) identified? yes X no
2. Significant deficiencies identified that are not considered to be material weaknesses? yes X none reported
Any audit findings disclosed that are required to be reported in accordance with NJ OMB Circular Letter 15-08as applicable?? yes X no
Identification of major programs:
State Grant/Project Number(s) Name of State Program
495-034-5094-003 (B) Reimbursed TPAF Social Security contributions
495-034-5120-044 (B) Extraordinary Aid
Note: (B) – Tested as Major Type B Program.
-123-

K-7
BOROUGH OF ENGLEWOOD CLIFFS SCHOOL DISTRICTSCHEDULE OF FINANCIAL, FEDERAL AND STATE FINDINGS
FOR THE FISCAL YEAR ENDED JUNE 30, 2019(continued)
Section II - Financial Statement Findings
None
Section III - State Financial Assistance Findings and Questioned Costs
None
-124-

K-8
BOROUGH OF ENGLEWOOD CLIFFS SCHOOL DISTRICTSUMMARY SCHEDULE OF PRIOR AUDIT FINDINGS
FOR THE FISCAL YEAR ENDED JUNE 30, 2019
Status of Prior Year Findings
There were no prior year findings.
-125-