school district of whitefish bay - … district assessment...(cogat) september district assessment...
TRANSCRIPT
FOCUS PLAN REPORT #1-REPORT OF ACADEMIC ACHIEVEMENT
Page 1 Teaching and Learning Office August, 2014
H:\1 pmilz\1 DISTRICT\1 Board\1 Board Meetings\1 2014-15\1August\2014-15 District Assessment Report.doc
School District of Whitefish Bay 1200 East Fairmount Avenue
Whitefish Bay, Wisconsin 53217
TO: Board of Education
FROM: Maria Kucharski, Director of Teaching and Learning
CC: Laura Myrah, District Administrator
RE: Focus Plan Update #1: Academic Achievement
DATE: August 6, 2014 Background: This annual report gives a broad view of student performance on various district, state and national assessments. It is important to note that each of these assessments is only one measure of how our students are performing. Since this is the last year for administration of the WKCE in mathematics and reading, reduced amount of administration of the CogAT assessment, as well as a change from the Measure of Academic Progress (MAP) to STAR, this will be the final year of this report and its particular format. Throughout the school year, the Board will be engaged in assessment learning activities in order to provide administration guidance about the format and type of assessment data it would like to have reported in the future. The report is organized into the following sections:
Part One: Overview of Assessments, including the test, the origin of the test, the dates of administration and a brief description of the assessment.
Part Two: Results of the Wisconsin Knowledge and Concepts Examination (WKCE) for students
in grades 4, 8 and 10 (math, reading, science, social studies, language arts) and grades 3, 5, 6, 7 (math and reading), NAEP-Based
Comparison chart, School Report Cards.
Part Three: Results of the Measure of Academic Progress (MAP) for students in grades 2-8 (9th grade piloted the assessment and will not be continuing it) in the areas of math, language arts and reading.
Part Four: Results of the ACT, SAT, and AP exams along with summary data on National Merit Scholars
FOCUS PLAN REPORT #1-REPORT OF ACADEMIC ACHIEVEMENT
Page 2 Teaching and Learning Office August, 2014
H:\1 pmilz\1 DISTRICT\1 Board\1 Board Meetings\1 2014-15\1August\2014-15 District Assessment Report.doc
SCHOOL DISTRICT OF WHITEFISH BAY 1200 EAST FAIRMOUNT AVENUE
WHITEFISH BAY, WISCONSIN 53217
2014-2015
Focus Plan Update #1- Report of Academic Achievement
Wisconsin Knowledge and Concepts Examinations (WKCE)
Measure of Academic Progress (MAP) Scholastic Aptitude Test (SAT) American College Test (ACT)
Advanced Placement Exams (AP) National Merit Scholarship Qualifying Test
FOCUS PLAN REPORT #1-REPORT OF ACADEMIC ACHIEVEMENT
Page 3 Teaching and Learning Office August, 2014
H:\1 pmilz\1 DISTRICT\1 Board\1 Board Meetings\1 2014-15\1August\2014-15 District Assessment Report.doc
Part ONE
Overview of District Assessments
FOCUS PLAN REPORT #1-REPORT OF ACADEMIC ACHIEVEMENT
Page 4 Teaching and Learning Office
August 2014
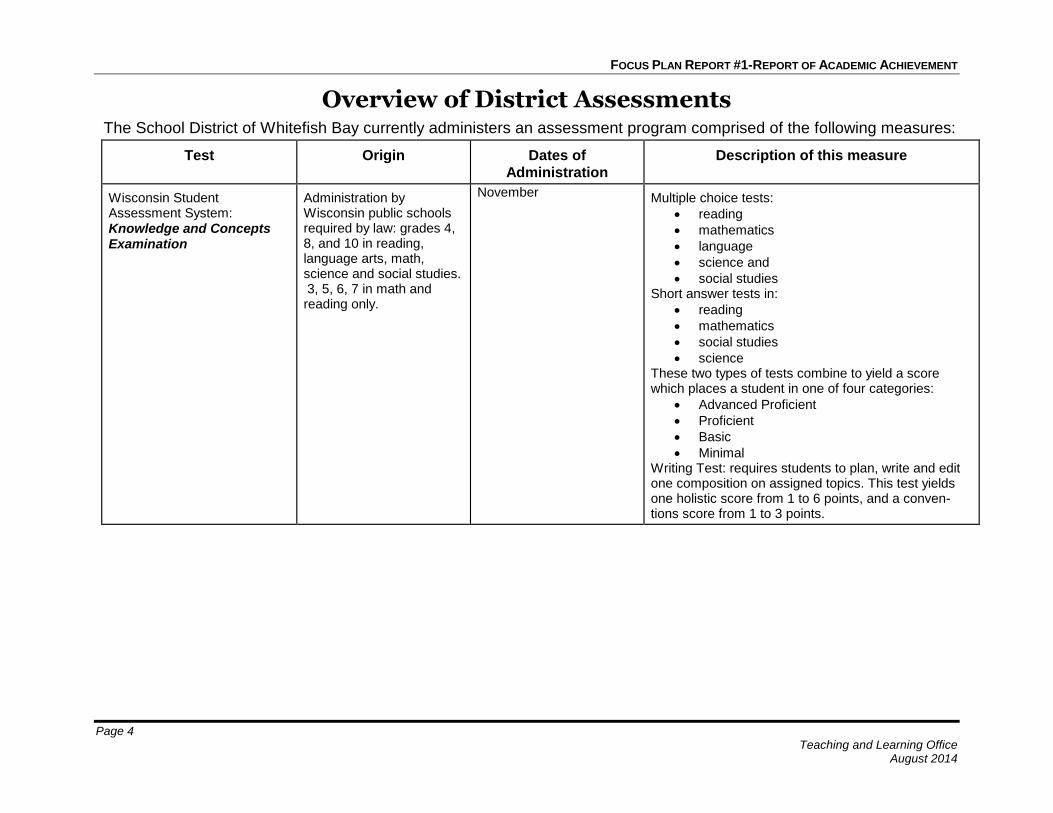
Overview of District Assessments The School District of Whitefish Bay currently administers an assessment program comprised of the following measures:
Test Origin Dates of
Administration
Description of this measure
Wisconsin Student Assessment System: Knowledge and Concepts Examination
Administration by Wisconsin public schools required by law: grades 4, 8, and 10 in reading, language arts, math, science and social studies. 3, 5, 6, 7 in math and reading only.
November
Multiple choice tests:
reading
mathematics
language
science and
social studies Short answer tests in:
reading
mathematics
social studies
science These two types of tests combine to yield a score which places a student in one of four categories:
Advanced Proficient
Proficient
Basic
Minimal Writing Test: requires students to plan, write and edit one composition on assigned topics. This test yields one holistic score from 1 to 6 points, and a conven-tions score from 1 to 3 points.
FOCUS PLAN REPORT #1-REPORT OF ACADEMIC ACHIEVEMENT
Page 5 Teaching and Learning Office
August 2014
Test Origin Dates of
Administration
Description of this measure
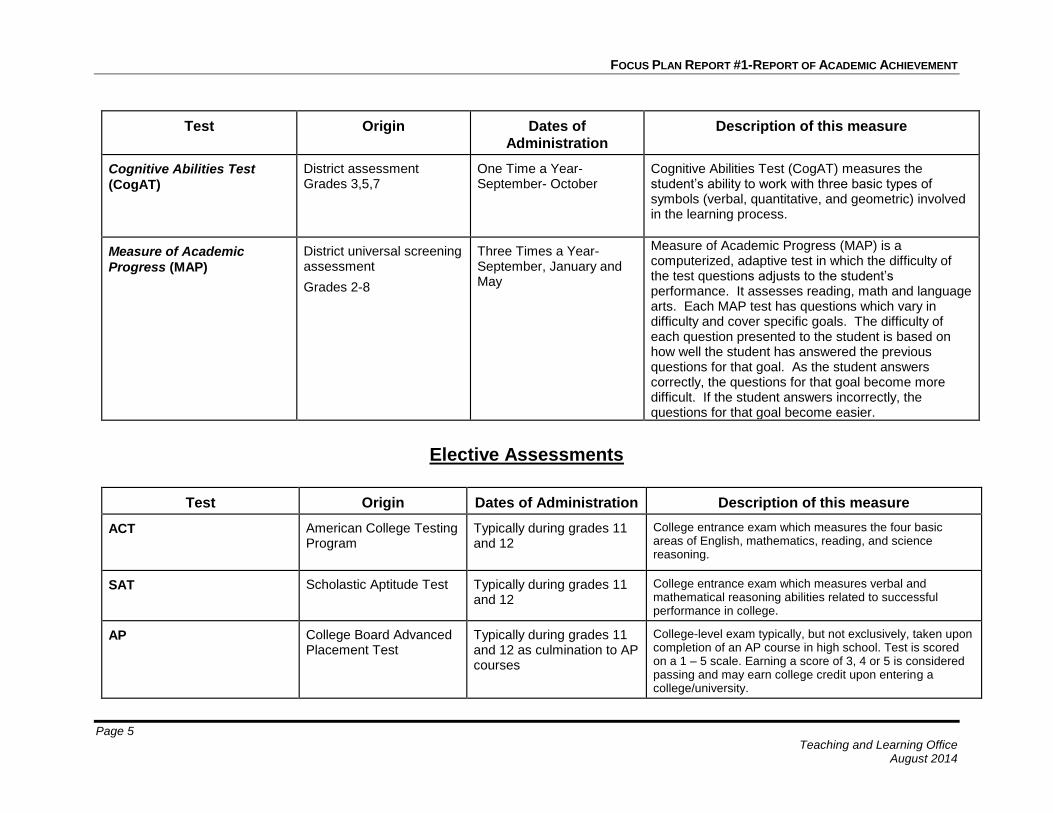
Cognitive Abilities Test
(CogAT)
District assessment Grades 3,5,7
One Time a Year- September- October
Cognitive Abilities Test (CogAT) measures the student’s ability to work with three basic types of symbols (verbal, quantitative, and geometric) involved in the learning process.
Measure of Academic
Progress (MAP)
District universal screening assessment
Grades 2-8
Three Times a Year- September, January and May
Measure of Academic Progress (MAP) is a computerized, adaptive test in which the difficulty of the test questions adjusts to the student’s performance. It assesses reading, math and language arts. Each MAP test has questions which vary in difficulty and cover specific goals. The difficulty of each question presented to the student is based on how well the student has answered the previous questions for that goal. As the student answers correctly, the questions for that goal become more difficult. If the student answers incorrectly, the questions for that goal become easier.
Elective Assessments
Test Origin Dates of Administration Description of this measure
ACT
American College Testing Program
Typically during grades 11 and 12
College entrance exam which measures the four basic areas of English, mathematics, reading, and science reasoning.
SAT Scholastic Aptitude Test Typically during grades 11 and 12
College entrance exam which measures verbal and mathematical reasoning abilities related to successful performance in college.
AP College Board Advanced Placement Test
Typically during grades 11 and 12 as culmination to AP courses
College-level exam typically, but not exclusively, taken upon completion of an AP course in high school. Test is scored on a 1 – 5 scale. Earning a score of 3, 4 or 5 is considered passing and may earn college credit upon entering a college/university.
FOCUS PLAN REPORT #1-REPORT OF ACADEMIC ACHIEVEMENT
Page 6 Teaching and Learning Office
August 2014
Understanding the Scores National Percentile Rank Some spreadsheets show the scores of our students in percentile rankings. This score shows the relative strength or rank when compared to a group of students who are in the same grade and who were tested at the same time of year during the national standardization. This large group of students attended schools that are representative of schools throughout the nation in terms of region, enrollment size, and socioeconomic status. The district also looks carefully at the local percentile rank information. This score permits an interpretation of individual achievement in terms of local conditions such as particular curricular issues, community background, etc. Both of these scores are useful for analysis of areas of strength and weakness for an individual student, a group of students, or a grade level.
The RIT Scale (MAP Only) RIT scales are built from data about the performance of individual examinees on individual items. The theory governing scale construction is called Item Response Theory (IRT). NWEA uses a specific IRT model conceived by Danish mathematician, Georg Rasch, (1901-1980). The RIT Scale is a curriculum scale that uses individual item difficulty values to estimate student achievement. An advantage of the RIT scale is that it can relate the numbers on the scale directly to the difficulty of items on the tests. In addition, the RIT scale is an equal interval scale. Equal interval means that the difference between scores is the same regardless of whether a student is at the top, bottom, or middle of the RIT scale, and it has the same meaning regardless of grade level. Grade Equivalent Some spreadsheets show the scores of our students in grade equivalent scores. The grade equivalent score in a number that describes a student’s location on an achievement continuum. Grade equivalent scores are useful and convenient for measuring individual or group growth over time, and for estimating developmental status in terms of grade level.
Proficiency Levels Starting in the Fall of 2012, Wisconsin raised the scores needed for students to reach proficient or advanced performance on the WKCE. These levels of performance was aligned to the National Assessment of Educational Progress (NAEP) and was part of Wisconsin’s commitment to higher standards for college and career readiness within our No Child Left Behind (NCLB) waiver. There are four proficiency levels: Advanced, Proficient, Basic and Minimal. Because of the changes in the benchmark scaled scores, you will notice a decline in the number of students considered to be proficient or advanced in Whitefish Bay. The best analogy I heard to explain this change relates to temperature. Consider the difference between describing the freezing point between Fahrenheit scale versus the Celsius scale. Using Fahrenheit, we say it freezes at 32 degrees out. Using Celsius, we say it freezes at zero. To say zero does NOT make it any warmer or colder outside. Something similar cam be said about the difference between our old State of Wisconsin Cut Scores and the new NAEP-based cut scores. This does not reflect a change in the ability of students or the quality of teaching. It is these scores that are being used in both school and district report cards.
FOCUS PLAN REPORT #1-REPORT OF ACADEMIC ACHIEVEMENT
Page 7 Teaching and Learning Office
August 2014
Part TWO
Wisconsin Student Assessment System Knowledge and Concepts Examination
Grades 3,4,5,6,7,8 and 10
FOCUS PLAN REPORT #1-REPORT OF ACADEMIC ACHIEVEMENT
Page 8 Teaching and Learning Office – August 2014
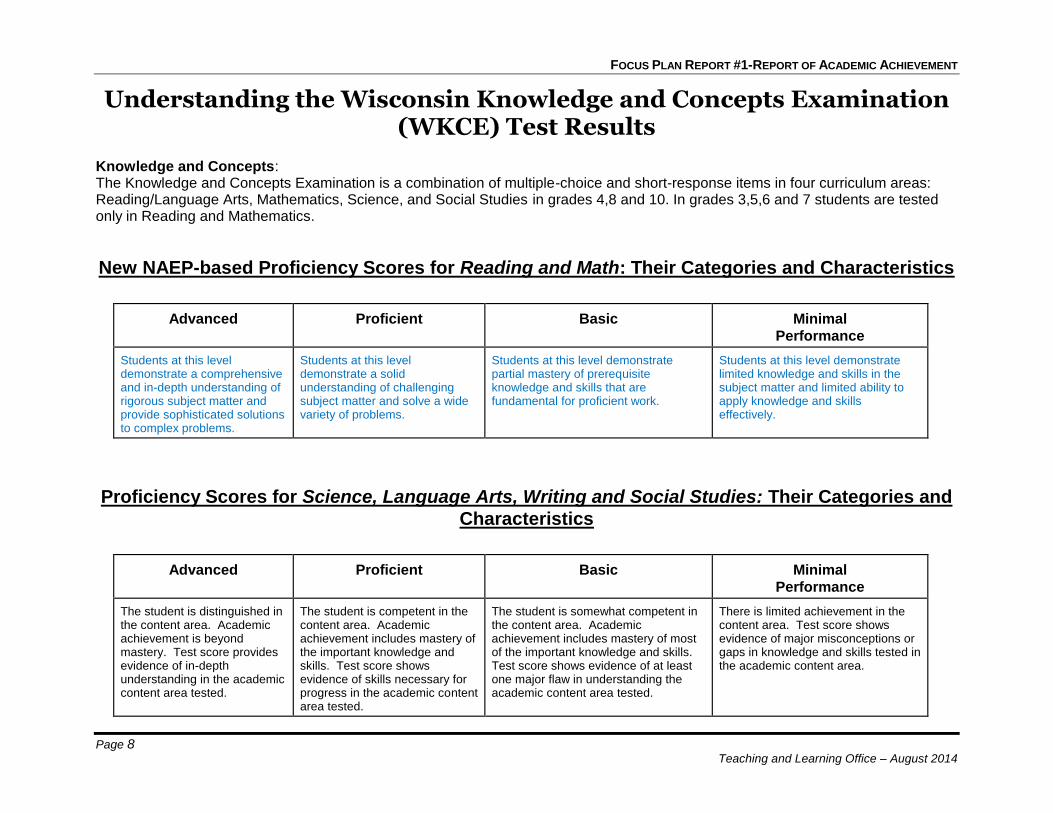
Understanding the Wisconsin Knowledge and Concepts Examination (WKCE) Test Results
Knowledge and Concepts: The Knowledge and Concepts Examination is a combination of multiple-choice and short-response items in four curriculum areas: Reading/Language Arts, Mathematics, Science, and Social Studies in grades 4,8 and 10. In grades 3,5,6 and 7 students are tested only in Reading and Mathematics.
New NAEP-based Proficiency Scores for Reading and Math: Their Categories and Characteristics
Advanced Proficient Basic Minimal
Performance
Students at this level demonstrate a comprehensive and in-depth understanding of rigorous subject matter and provide sophisticated solutions to complex problems.
Students at this level demonstrate a solid understanding of challenging subject matter and solve a wide variety of problems.
Students at this level demonstrate partial mastery of prerequisite knowledge and skills that are fundamental for proficient work.
Students at this level demonstrate limited knowledge and skills in the subject matter and limited ability to apply knowledge and skills effectively.
Proficiency Scores for Science, Language Arts, Writing and Social Studies: Their Categories and
Characteristics
Advanced Proficient Basic Minimal
Performance
The student is distinguished in the content area. Academic achievement is beyond mastery. Test score provides evidence of in-depth understanding in the academic content area tested.
The student is competent in the content area. Academic achievement includes mastery of the important knowledge and skills. Test score shows evidence of skills necessary for progress in the academic content area tested.
The student is somewhat competent in the content area. Academic achievement includes mastery of most of the important knowledge and skills. Test score shows evidence of at least one major flaw in understanding the academic content area tested.
There is limited achievement in the content area. Test score shows evidence of major misconceptions or gaps in knowledge and skills tested in the academic content area.
FOCUS PLAN REPORT #1-REPORT OF ACADEMIC ACHIEVEMENT
Page 9 Teaching and Learning Office – August 2014
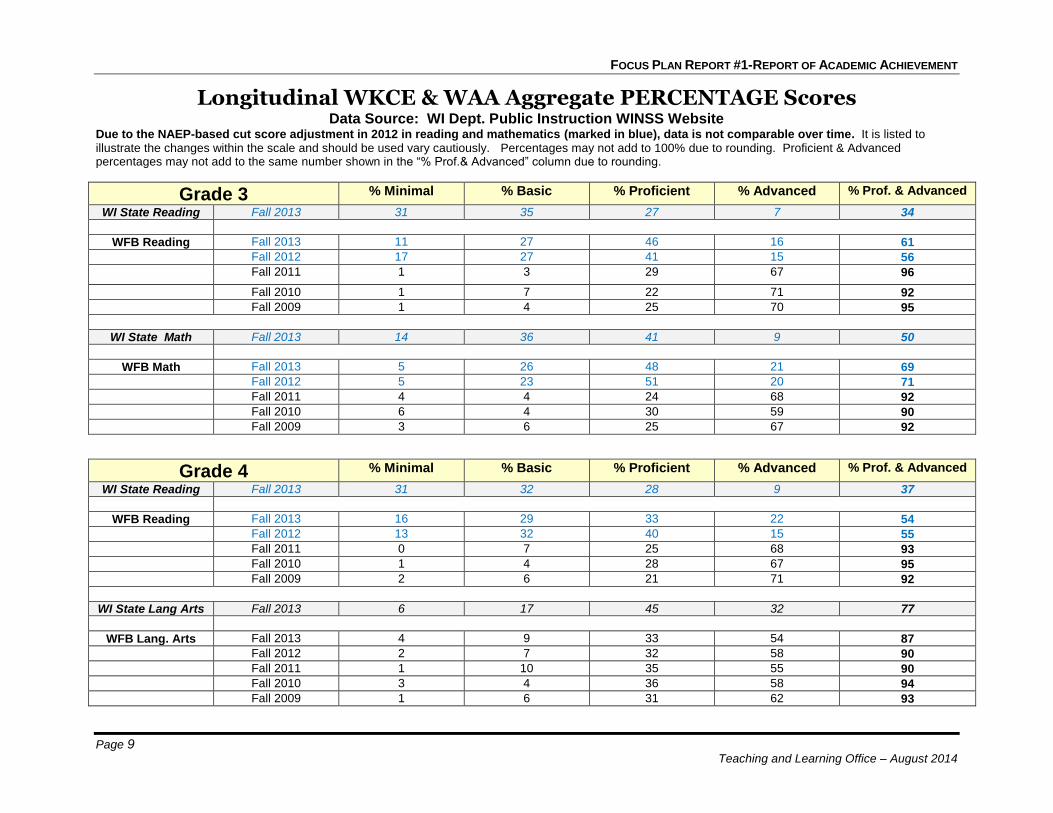
Longitudinal WKCE & WAA Aggregate PERCENTAGE Scores Data Source: WI Dept. Public Instruction WINSS Website
Due to the NAEP-based cut score adjustment in 2012 in reading and mathematics (marked in blue), data is not comparable over time. It is listed to illustrate the changes within the scale and should be used vary cautiously. Percentages may not add to 100% due to rounding. Proficient & Advanced percentages may not add to the same number shown in the “% Prof.& Advanced” column due to rounding.
Grade 3 % Minimal % Basic % Proficient % Advanced % Prof. & Advanced
WI State Reading Fall 2013 31 35 27 7 34
WFB Reading Fall 2013 11 27 46 16 61
Fall 2012 17 27 41 15 56
Fall 2011 1 3 29 67 96
Fall 2010 1 7 22 71 92
Fall 2009 1 4 25 70 95
WI State Math Fall 2013 14 36 41 9 50
WFB Math Fall 2013 5 26 48 21 69
Fall 2012 5 23 51 20 71
Fall 2011 4 4 24 68 92
Fall 2010 6 4 30 59 90
Fall 2009 3 6 25 67 92
Grade 4 % Minimal % Basic % Proficient % Advanced % Prof. & Advanced
WI State Reading Fall 2013 31 32 28 9 37
WFB Reading Fall 2013 16 29 33 22 54
Fall 2012 13 32 40 15 55
Fall 2011 0 7 25 68 93
Fall 2010 1 4 28 67 95
Fall 2009 2 6 21 71 92
WI State Lang Arts Fall 2013 6 17 45 32 77
WFB Lang. Arts Fall 2013 4 9 33 54 87
Fall 2012 2 7 32 58 90
Fall 2011 1 10 35 55 90
Fall 2010 3 4 36 58 94
Fall 2009 1 6 31 62 93
FOCUS PLAN REPORT #1-REPORT OF ACADEMIC ACHIEVEMENT
Page 10 Teaching and Learning Office – August 2014
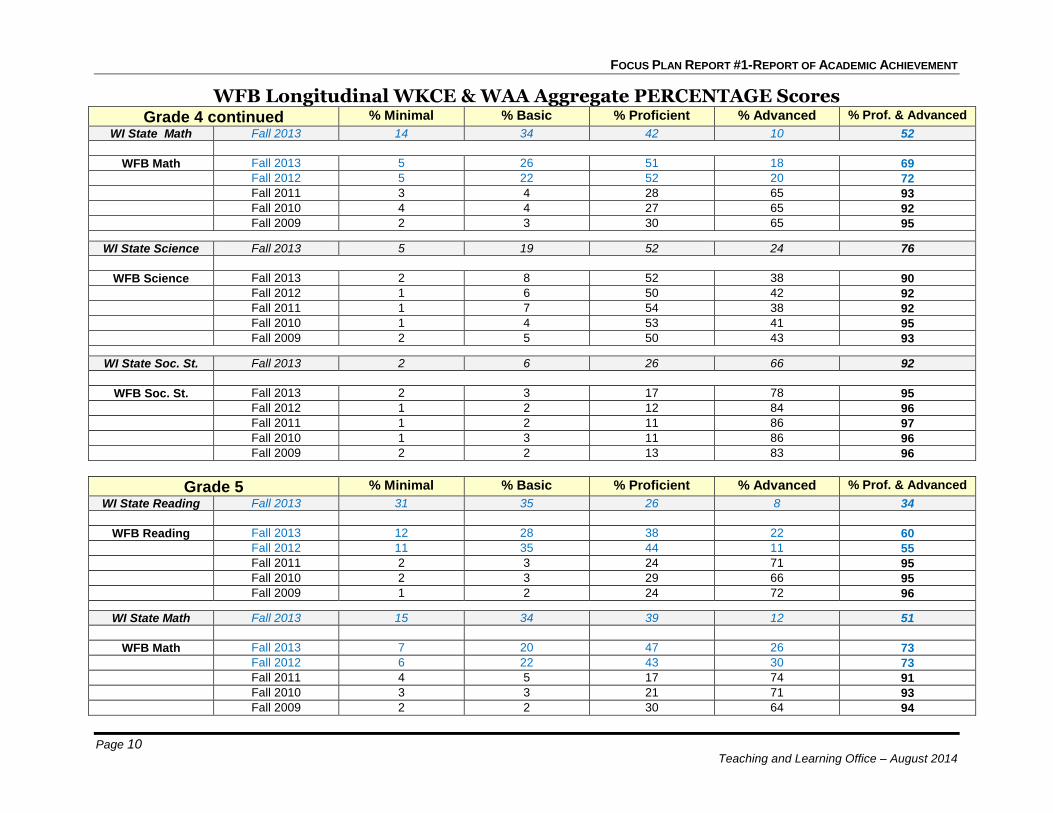
WFB Longitudinal WKCE & WAA Aggregate PERCENTAGE Scores Grade 4 continued % Minimal % Basic % Proficient % Advanced % Prof. & Advanced
WI State Math Fall 2013 14 34 42 10 52
WFB Math Fall 2013 5 26 51 18 69
Fall 2012 5 22 52 20 72
Fall 2011 3 4 28 65 93
Fall 2010 4 4 27 65 92
Fall 2009 2 3 30 65 95
WI State Science Fall 2013 5 19 52 24 76
WFB Science Fall 2013 2 8 52 38 90
Fall 2012 1 6 50 42 92
Fall 2011 1 7 54 38 92
Fall 2010 1 4 53 41 95
Fall 2009 2 5 50 43 93
WI State Soc. St. Fall 2013 2 6 26 66 92
WFB Soc. St. Fall 2013 2 3 17 78 95
Fall 2012 1 2 12 84 96
Fall 2011 1 2 11 86 97
Fall 2010 1 3 11 86 96
Fall 2009 2 2 13 83 96
Grade 5 % Minimal % Basic % Proficient % Advanced % Prof. & Advanced
WI State Reading Fall 2013 31 35 26 8 34
WFB Reading Fall 2013 12 28 38 22 60
Fall 2012 11 35 44 11 55
Fall 2011 2 3 24 71 95
Fall 2010 2 3 29 66 95
Fall 2009 1 2 24 72 96
WI State Math Fall 2013 15 34 39 12 51
WFB Math Fall 2013 7 20 47 26 73
Fall 2012 6 22 43 30 73
Fall 2011 4 5 17 74 91
Fall 2010 3 3 21 71 93
Fall 2009 2 2 30 64 94
FOCUS PLAN REPORT #1-REPORT OF ACADEMIC ACHIEVEMENT
Page 11 Teaching and Learning Office – August 2014
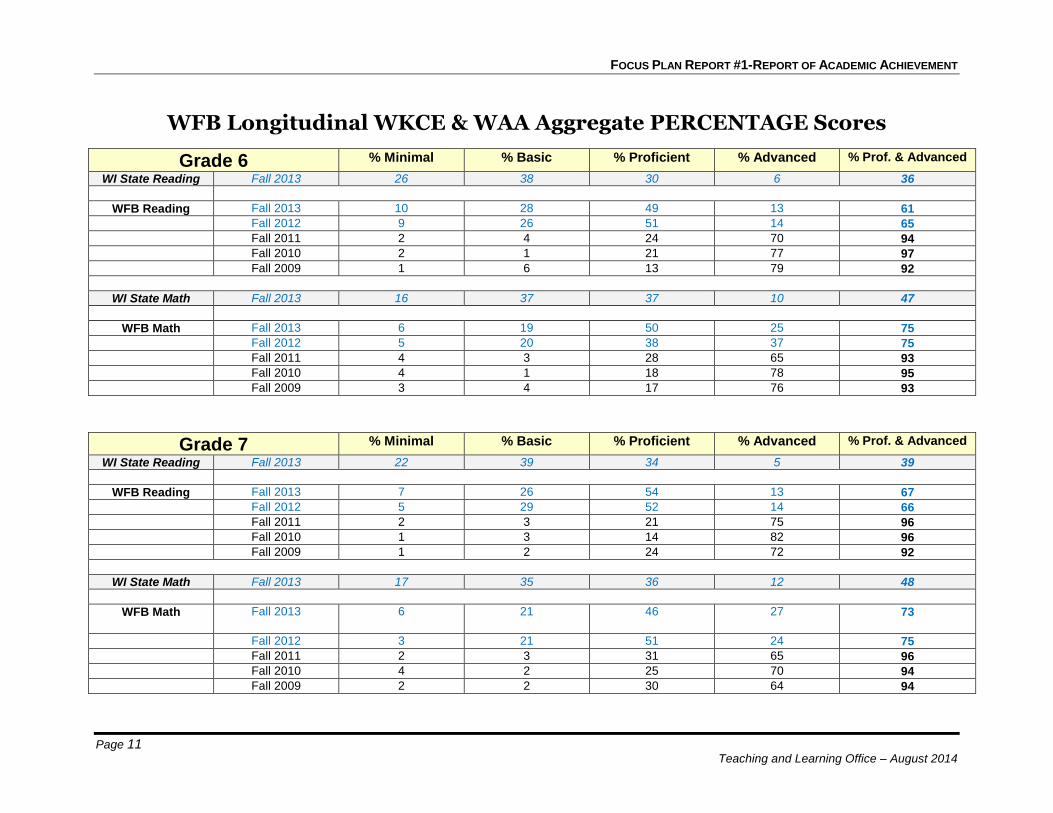
WFB Longitudinal WKCE & WAA Aggregate PERCENTAGE Scores
Grade 6 % Minimal % Basic % Proficient % Advanced % Prof. & Advanced
WI State Reading Fall 2013 26 38 30 6 36
WFB Reading Fall 2013 10 28 49 13 61
Fall 2012 9 26 51 14 65
Fall 2011 2 4 24 70 94
Fall 2010 2 1 21 77 97
Fall 2009 1 6 13 79 92
WI State Math Fall 2013 16 37 37 10 47
WFB Math Fall 2013 6 19 50 25 75
Fall 2012 5 20 38 37 75
Fall 2011 4 3 28 65 93
Fall 2010 4 1 18 78 95
Fall 2009 3 4 17 76 93
Grade 7 % Minimal % Basic % Proficient % Advanced % Prof. & Advanced
WI State Reading Fall 2013 22 39 34 5 39
WFB Reading Fall 2013 7 26 54 13 67
Fall 2012 5 29 52 14 66
Fall 2011 2 3 21 75 96
Fall 2010 1 3 14 82 96
Fall 2009 1 2 24 72 92
WI State Math Fall 2013 17 35 36 12 48
WFB Math Fall 2013 6 21 46 27 73
Fall 2012 3 21 51 24 75
Fall 2011 2 3 31 65 96
Fall 2010 4 2 25 70 94
Fall 2009 2 2 30 64 94
FOCUS PLAN REPORT #1-REPORT OF ACADEMIC ACHIEVEMENT
Page 12 Teaching and Learning Office – August 2014
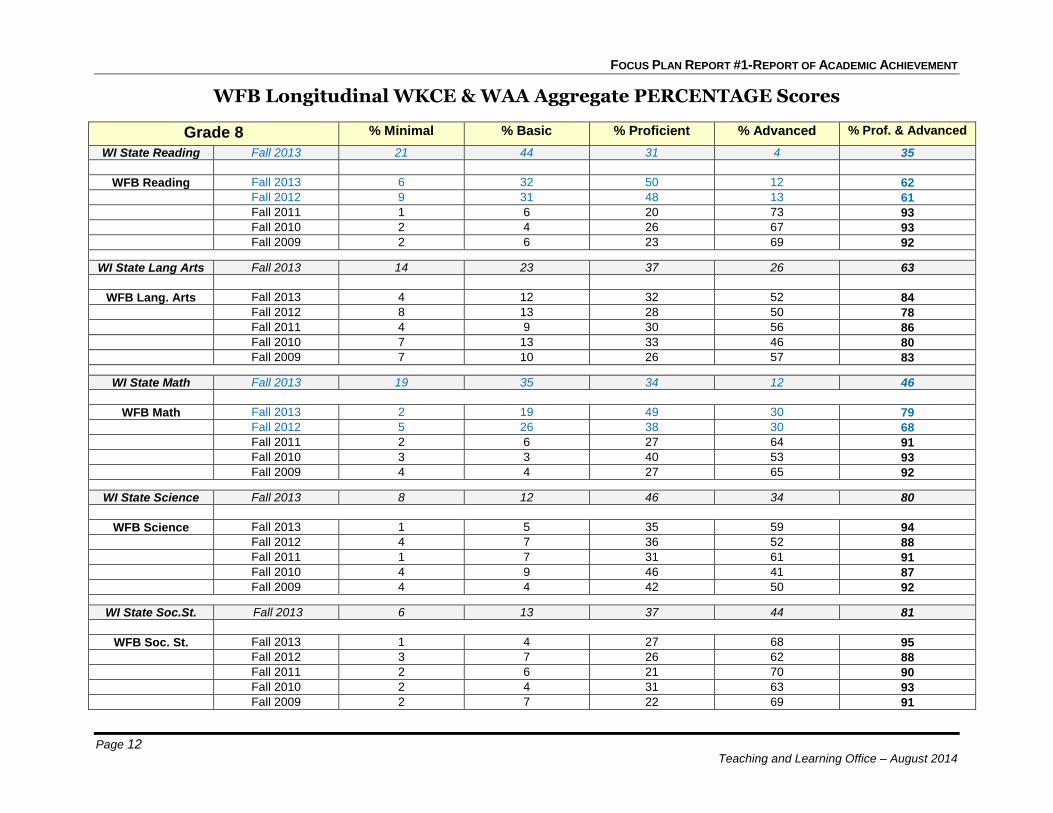
WFB Longitudinal WKCE & WAA Aggregate PERCENTAGE Scores
Grade 8 % Minimal % Basic % Proficient % Advanced % Prof. & Advanced
WI State Reading Fall 2013 21 44 31 4 35
WFB Reading Fall 2013 6 32 50 12 62
Fall 2012 9 31 48 13 61
Fall 2011 1 6 20 73 93
Fall 2010 2 4 26 67 93
Fall 2009 2 6 23 69 92
WI State Lang Arts Fall 2013 14 23 37 26 63
WFB Lang. Arts Fall 2013 4 12 32 52 84
Fall 2012 8 13 28 50 78
Fall 2011 4 9 30 56 86
Fall 2010 7 13 33 46 80
Fall 2009 7 10 26 57 83
WI State Math Fall 2013 19 35 34 12 46
WFB Math Fall 2013 2 19 49 30 79
Fall 2012 5 26 38 30 68
Fall 2011 2 6 27 64 91
Fall 2010 3 3 40 53 93
Fall 2009 4 4 27 65 92
WI State Science Fall 2013 8 12 46 34 80
WFB Science Fall 2013 1 5 35 59 94
Fall 2012 4 7 36 52 88
Fall 2011 1 7 31 61 91
Fall 2010 4 9 46 41 87
Fall 2009 4 4 42 50 92
WI State Soc.St. Fall 2013 6 13 37 44 81
WFB Soc. St. Fall 2013 1 4 27 68 95
Fall 2012 3 7 26 62 88
Fall 2011 2 6 21 70 90
Fall 2010 2 4 31 63 93
Fall 2009 2 7 22 69 91
FOCUS PLAN REPORT #1-REPORT OF ACADEMIC ACHIEVEMENT
Page 13 Teaching and Learning Office – August 2014
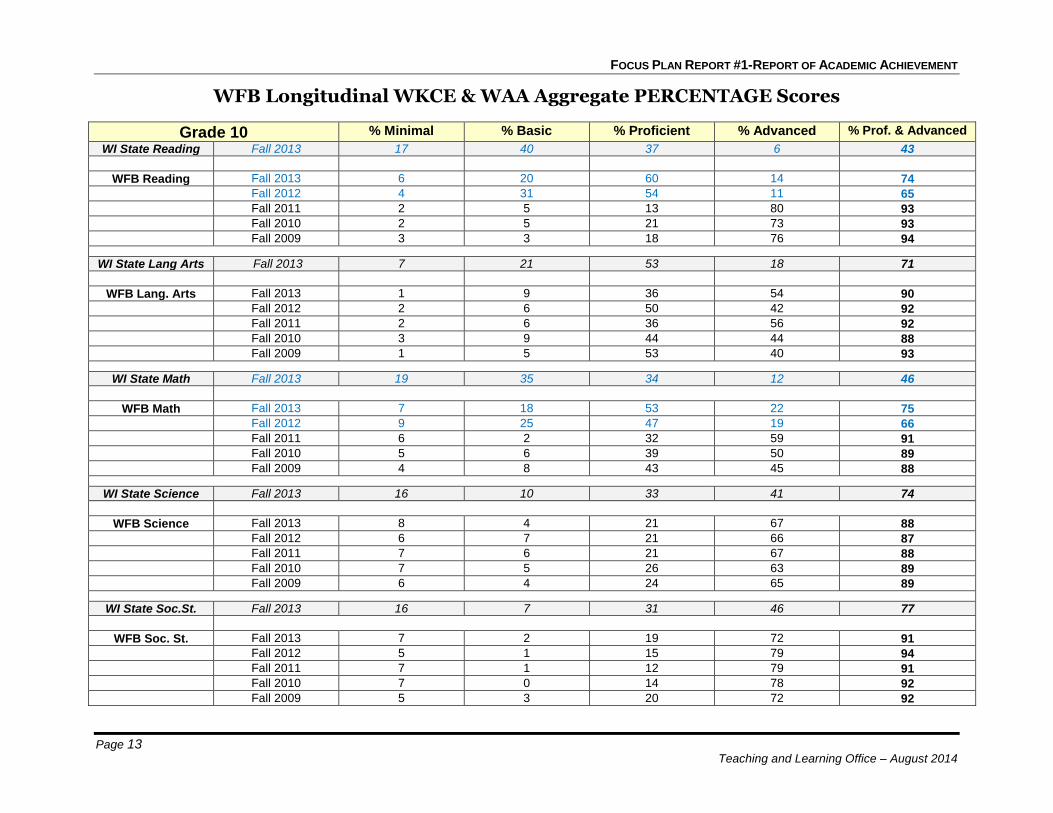
WFB Longitudinal WKCE & WAA Aggregate PERCENTAGE Scores
Grade 10 % Minimal % Basic % Proficient % Advanced % Prof. & Advanced
WI State Reading Fall 2013 17 40 37 6 43
WFB Reading Fall 2013 6 20 60 14 74
Fall 2012 4 31 54 11 65
Fall 2011 2 5 13 80 93
Fall 2010 2 5 21 73 93
Fall 2009 3 3 18 76 94
WI State Lang Arts Fall 2013 7 21 53 18 71
WFB Lang. Arts Fall 2013 1 9 36 54 90
Fall 2012 2 6 50 42 92
Fall 2011 2 6 36 56 92
Fall 2010 3 9 44 44 88
Fall 2009 1 5 53 40 93
WI State Math Fall 2013 19 35 34 12 46
WFB Math Fall 2013 7 18 53 22 75
Fall 2012 9 25 47 19 66
Fall 2011 6 2 32 59 91
Fall 2010 5 6 39 50 89
Fall 2009 4 8 43 45 88
WI State Science Fall 2013 16 10 33 41 74
WFB Science Fall 2013 8 4 21 67 88
Fall 2012 6 7 21 66 87
Fall 2011 7 6 21 67 88
Fall 2010 7 5 26 63 89
Fall 2009 6 4 24 65 89
WI State Soc.St. Fall 2013 16 7 31 46 77
WFB Soc. St. Fall 2013 7 2 19 72 91
Fall 2012 5 1 15 79 94
Fall 2011 7 1 12 79 91
Fall 2010 7 0 14 78 92
Fall 2009 5 3 20 72 92
FOCUS PLAN REPORT #1-REPORT OF ACADEMIC ACHIEVEMENT
Page 14 Teaching and Learning Office – August 2014
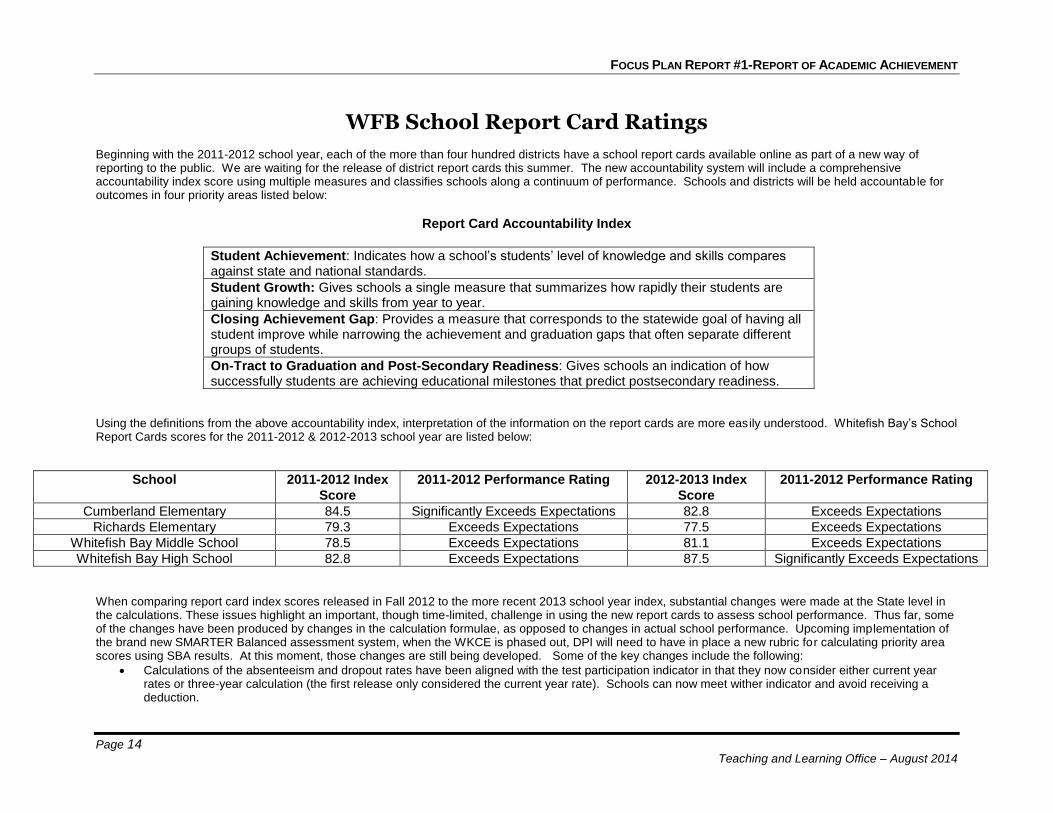
WFB School Report Card Ratings
Beginning with the 2011-2012 school year, each of the more than four hundred districts have a school report cards available online as part of a new way of reporting to the public. We are waiting for the release of district report cards this summer. The new accountability system will include a comprehensive accountability index score using multiple measures and classifies schools along a continuum of performance. Schools and districts will be held accountable for outcomes in four priority areas listed below:
Report Card Accountability Index
Student Achievement: Indicates how a school’s students’ level of knowledge and skills compares against state and national standards.
Student Growth: Gives schools a single measure that summarizes how rapidly their students are gaining knowledge and skills from year to year.
Closing Achievement Gap: Provides a measure that corresponds to the statewide goal of having all student improve while narrowing the achievement and graduation gaps that often separate different groups of students.
On-Tract to Graduation and Post-Secondary Readiness: Gives schools an indication of how successfully students are achieving educational milestones that predict postsecondary readiness.
Using the definitions from the above accountability index, interpretation of the information on the report cards are more easily understood. Whitefish Bay’s School Report Cards scores for the 2011-2012 & 2012-2013 school year are listed below:
School 2011-2012 Index
Score
2011-2012 Performance Rating 2012-2013 Index
Score
2011-2012 Performance Rating
Cumberland Elementary 84.5 Significantly Exceeds Expectations 82.8 Exceeds Expectations
Richards Elementary 79.3 Exceeds Expectations 77.5 Exceeds Expectations
Whitefish Bay Middle School 78.5 Exceeds Expectations 81.1 Exceeds Expectations
Whitefish Bay High School 82.8 Exceeds Expectations 87.5 Significantly Exceeds Expectations
When comparing report card index scores released in Fall 2012 to the more recent 2013 school year index, substantial changes were made at the State level in the calculations. These issues highlight an important, though time-limited, challenge in using the new report cards to assess school performance. Thus far, some of the changes have been produced by changes in the calculation formulae, as opposed to changes in actual school performance. Upcoming implementation of the brand new SMARTER Balanced assessment system, when the WKCE is phased out, DPI will need to have in place a new rubric for calculating priority area scores using SBA results. At this moment, those changes are still being developed. Some of the key changes include the following:
Calculations of the absenteeism and dropout rates have been aligned with the test participation indicator in that they now consider either current year rates or three-year calculation (the first release only considered the current year rate). Schools can now meet wither indicator and avoid receiving a deduction.

FOCUS PLAN REPORT #1-REPORT OF ACADEMIC ACHIEVEMENT
Page 15 Teaching and Learning Office – August 2014
The student achievement indicator now includes only tested student enrolled for a full academic year, whereas the first version included non-tested students in a school’s average.
The closing gaps calculation compares a given school’s target subgroup achievement with the achievement of the comparison group at the state level, rather than that of the school’s comparison group. For example, student achievement in a given school or district for specific ration/ethinic groups, such as African American students, is compared to the statewide average of white student achievement, as opposed to white student achievement in the individual school or district.
When looking closer at the report cards Whitefish Bay continues to exceed in extremely high levels in the areas of student achievement, growth and on-tract to graduation and post-secondary readiness. Closing the achievement gap continues to be an area of focus in the past as well as into our future. The teaching and learning office will be working towards closing the achievement gap through the following measures:
Systematic implementation of Response to Intervention (RtI)
Additional training of the IRC’s in the area s of mathematics, focusing on early intervention
Additional universal screening tools in the early grades
Continued full staff training in evidenced based practices in all classrooms
Inclusion of additional action steps that will become part of the department’s future action plan developed through the educator effectiveness framework completed by the Director of Teaching and Learning Services
FOCUS PLAN REPORT #1-REPORT OF ACADEMIC ACHIEVEMENT
Page 16 Teaching and Learning Office – August 2014
Part THREE
Results of the Measure of Academic Progress (MAP)
District Assessment
Page 17 Teaching and Learning Office – August 2014
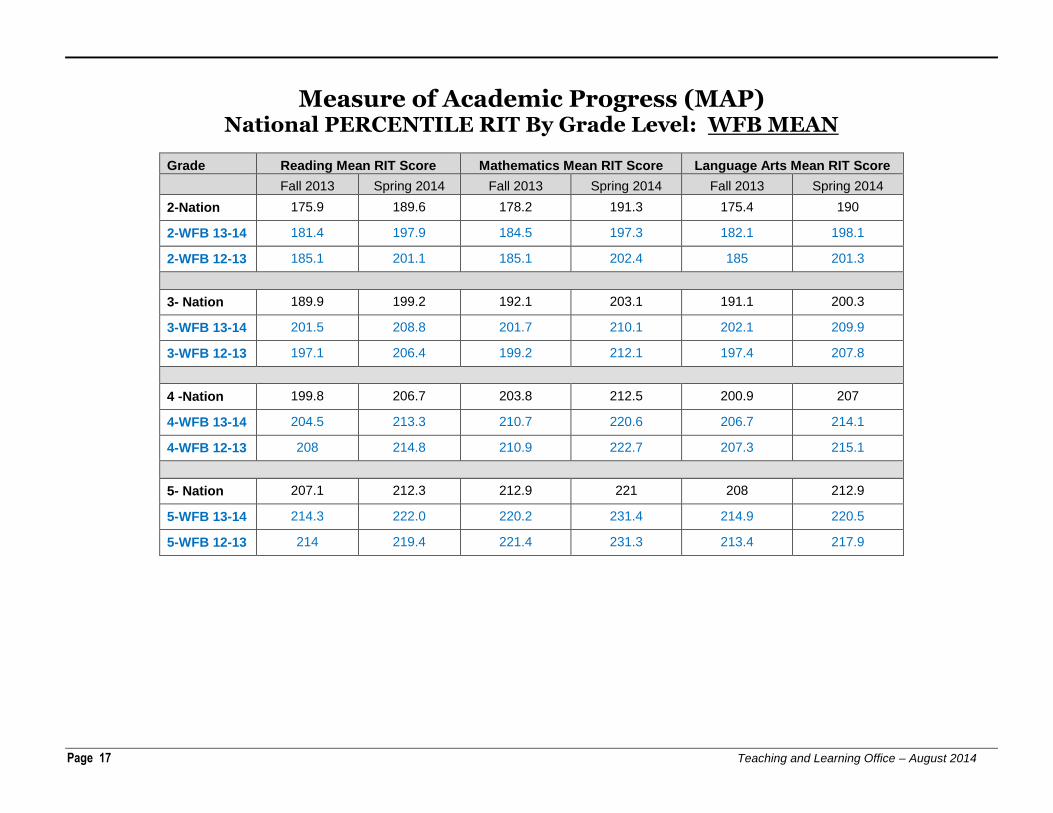
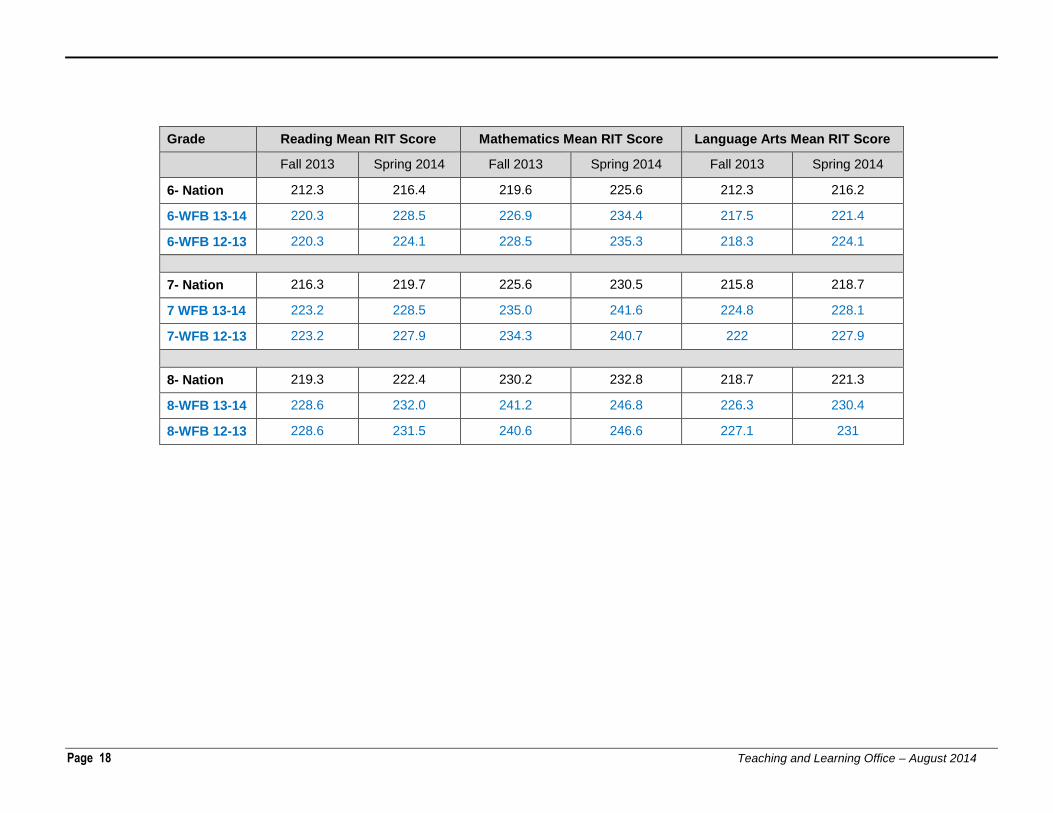
Measure of Academic Progress (MAP) National PERCENTILE RIT By Grade Level: WFB MEAN
Grade Reading Mean RIT Score Mathematics Mean RIT Score Language Arts Mean RIT Score
Fall 2013 Spring 2014 Fall 2013 Spring 2014 Fall 2013 Spring 2014
2-Nation 175.9 189.6 178.2 191.3 175.4 190
2-WFB 13-14 181.4 197.9 184.5 197.3 182.1 198.1
2-WFB 12-13 185.1 201.1 185.1 202.4 185 201.3
3- Nation 189.9 199.2 192.1 203.1 191.1 200.3
3-WFB 13-14 201.5 208.8 201.7 210.1 202.1 209.9
3-WFB 12-13 197.1 206.4 199.2 212.1 197.4 207.8
4 -Nation 199.8 206.7 203.8 212.5 200.9 207
4-WFB 13-14 204.5 213.3 210.7 220.6 206.7 214.1
4-WFB 12-13 208 214.8 210.9 222.7 207.3 215.1
5- Nation 207.1 212.3 212.9 221 208 212.9
5-WFB 13-14 214.3 222.0 220.2 231.4 214.9 220.5
5-WFB 12-13 214 219.4 221.4 231.3 213.4 217.9
Page 18 Teaching and Learning Office – August 2014
Grade Reading Mean RIT Score Mathematics Mean RIT Score Language Arts Mean RIT Score
Fall 2013 Spring 2014 Fall 2013 Spring 2014 Fall 2013 Spring 2014
6- Nation 212.3 216.4 219.6 225.6 212.3 216.2
6-WFB 13-14 220.3 228.5 226.9 234.4 217.5 221.4
6-WFB 12-13 220.3 224.1 228.5 235.3 218.3 224.1
7- Nation 216.3 219.7 225.6 230.5 215.8 218.7
7 WFB 13-14 223.2 228.5 235.0 241.6 224.8 228.1
7-WFB 12-13 223.2 227.9 234.3 240.7 222 227.9
8- Nation 219.3 222.4 230.2 232.8 218.7 221.3
8-WFB 13-14 228.6 232.0 241.2 246.8 226.3 230.4
8-WFB 12-13 228.6 231.5 240.6 246.6 227.1 231
Page 19 Teaching and Learning Office – August 2014
Part FOUR
Results of the SAT, ACT, AP and NMSQT
Page 20 Teaching and Learning Office – August 2014
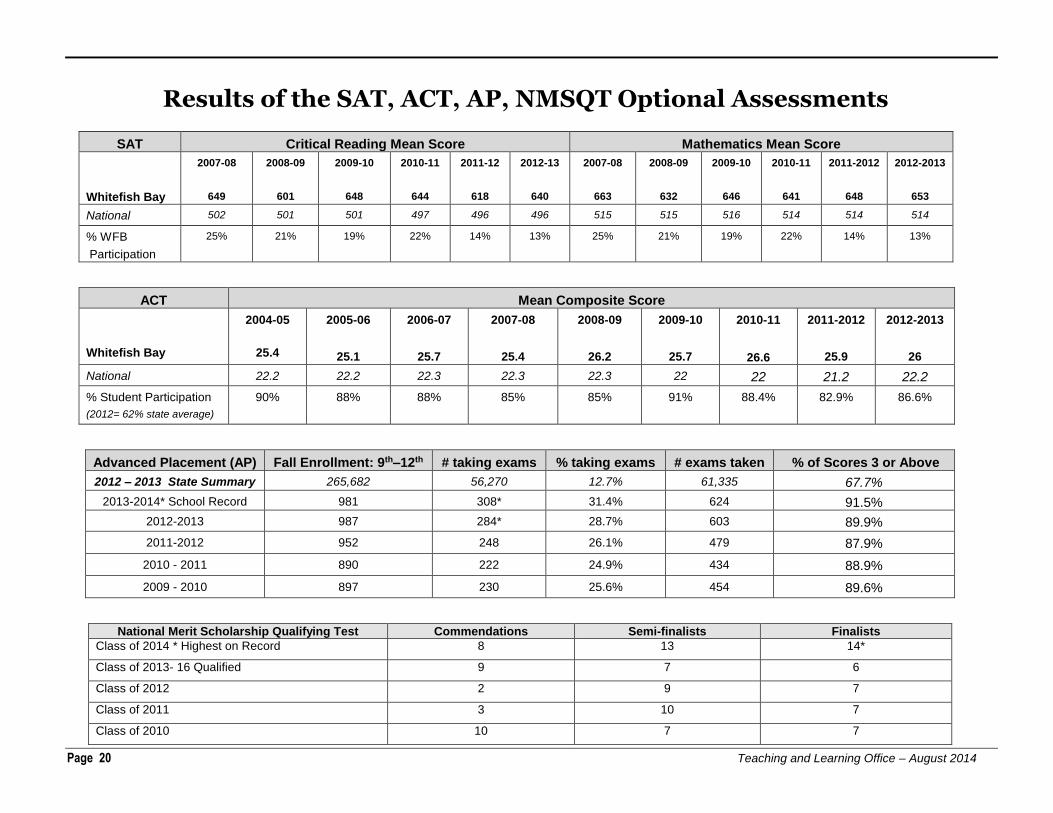
Results of the SAT, ACT, AP, NMSQT Optional Assessments
SAT Critical Reading Mean Score Mathematics Mean Score
Whitefish Bay
2007-08
649
2008-09
601
2009-10
648
2010-11
644
2011-12
618
2012-13
640
2007-08
663
2008-09
632
2009-10
646
2010-11
641
2011-2012
648
2012-2013
653
National 502 501 501 497 496 496 515 515 516 514 514 514
% WFB
Participation
25% 21% 19% 22% 14% 13% 25% 21% 19% 22% 14% 13%
ACT Mean Composite Score
Whitefish Bay
2004-05
25.4
2005-06
25.1
2006-07
25.7
2007-08
25.4
2008-09
26.2
2009-10
25.7
2010-11
26.6
2011-2012
25.9
2012-2013
26
National 22.2 22.2 22.3 22.3 22.3 22 22 21.2 22.2
% Student Participation
(2012= 62% state average)
90% 88% 88% 85% 85% 91% 88.4% 82.9% 86.6%
Advanced Placement (AP) Fall Enrollment: 9th–12th # taking exams % taking exams # exams taken % of Scores 3 or Above
2012 – 2013 State Summary 265,682 56,270 12.7% 61,335 67.7%
2013-2014* School Record 981 308* 31.4% 624 91.5%
2012-2013 987 284* 28.7% 603 89.9%
2011-2012 952 248 26.1% 479 87.9%
2010 - 2011 890 222 24.9% 434 88.9%
2009 - 2010 897 230 25.6% 454 89.6%
National Merit Scholarship Qualifying Test
(NMSQT)
Commendations Semi-finalists Finalists
Class of 2014 * Highest on Record 8 13 14*
Class of 2013- 16 Qualified 9 7 6
Class of 2012 2 9 7
Class of 2011 3 10 7
Class of 2010 10 7 7
Page 21 Teaching and Learning Office – August 2014
End of report