school funding reality - the boston foundation - tbf/media/tbforg/files/reports/mba… · ·...
TRANSCRIPT

School Funding Reality:A Bargain Not Kept
Prepared by Ed Moscovitch
President, Cape Ann EconomicsChairman, Bay State Reading Institute
forThe Boston Foundation and
The Massachusetts Business Alliance for Education
U n d e r s t a n d i n g B o s t o n
December 2010
Design: Kate Canfield, Canfield Design
Cover Photo: © Nancy Louie
© 2010 by The Boston Foundation. All rights reserved.
The Boston Foundation The Boston Foundation, Greater Boston’s community foundation, is one of the oldest and largest community foundations
in the nation, with assets of $733 million. In Fiscal Year 2010, the Foundation and its donors made more than $82 million
in grants to nonprofit organizations and received gifts of close to $83 million. The Foundation is made up of some 900
separate charitable funds established by donors either for the general benefit of the community or for special purposes.
The Boston Foundation also serves as a major civic leader, provider of information, convener, and sponsor of special initia-
tives designed to address the community’s and region’s most pressing challenges. For more information about the Boston
Foundation, visit www.tbf.org or call 617-338-1700.
The Massachusetts Business Alliance for EducationThe Massachusetts Business Alliance for Education (MBAE) is committed to a high quality public education system that
will prepare all students to engage successfully in a global economy and society. MBAE brings together business and
education leaders to promote education policies and practices based on measurable standards of achievement, account-
ability for performance, and equitable educational opportunities for all students in the Commonwealth.
UNDERSTANDING BOSTON is a series of forums, educational events, and research sponsored by the Boston Foundation to provide
information and insight into issues affecting Boston, its neighborhoods, and the region. By working in collaboration with
a wide range of partners, the Boston Foundation provides opportunities for people to come together to explore challenges
facing our constantly changing community to develop an informed civic agenda. Visit www.tbf.org to learn more about
Understanding Boston and the Boston Foundation.

School Funding Reality: A Bargain Not Kept
By
Edward Moscovitch
CAPE ANN ECONOMICS
Prepared for the
Massachusetts Business Alliance for Education
Supported by
The Boston Foundation
December, 2010


A Bargain Not Kept
Page i
INTRODUCTION
Massachusetts faces an unprecedented education funding crisis as the slow recovery
of state revenues and a concurrent drop in municipal income are compounded by the
impending end of federal stimulus funding. The immediate need for financial
efficiency, and a recent resurgence of education reform efforts, makes this an
opportune time to reexamine the school finance system and evaluate what changes are
needed to achieve its goal – delivering high quality public education to all students.
In 1991, the Massachusetts Business Alliance for Education (MBAE) called for
specific legislative action to reform both the education system and the way that it was
financed. The so-called foundation budget, a key feature of that proposal, became part
of the Education Reform Act of 1993 to provide a progressive plan for funding the
state’s schools based on a model of the way a school system really functions. The
foundation budget set standards for student teacher ratios, maintenance expenditures,
support personnel, teacher training, and budgets for educational supplies among other
details. The formula also recognized the special needs of disadvantaged youth by
providing for the services needed to close the achievement gap between low-income
and affluent students.
The new law contained an inflation-adjustment mechanism designed to establish and
preserve equity among districts, and to allow schools to continue to operate at the
program levels envisioned in 1993. The expectation was that the dollar value of the
foundation budget would keep pace with rising costs. Over time, this expectation has
not been met as actual costs came to exceed the factor used to adjust the foundation
budget. In particular, healthcare insurance expenditures for education employees have
risen far faster than inflation, surpassing the foundation budget allowance in 2010 by
almost $1.7 billion dollars alone. As a result, while Massachusetts may spend on
average $10,700 per student per year on education, the percentage of that amount that
directly affects what goes on in the classroom, as opposed to paying for
administration, contractual obligations and health care, is much lower.
MBAE, with the support of The Boston Foundation, has undertaken this study to
examine how the foundation budget has met original expectations as well as current
needs. This is the first of a three-part series on school finance from MBAE. Next we
will look at where opportunities can be found for savings through cost efficiencies
and consolidation. The final phase of this work will review what other states and
districts are doing to advance new paradigms of school finance that could both
increase efficiency and achieve an increase in the quality and equality of education
opportunities for students.

A Bargain Not Kept
Page ii
Our purpose is to identify where adjustments are needed in the way Massachusetts
finances our schools, and to inform and promote policies that will provide sufficient
funding for a world class school system that educates all children for success.
Linda Noonan, Executive Director
Massachusetts Business Alliance for Education
December 2010

Page 1
EXECUTIVE SUMMARY
The 1993 Massachusetts education reform law represented a “grand bargain” – high
standards and accountability for student performance in return for equitable funding
across districts. High standards were to be established through curriculum
frameworks that specified what every child should learn. For their part, educators
agreed to be held accountable for student achievement, including implementation of
the Massachusetts Comprehensive Assessment System (MCAS) exams and
graduation requirements linked to MCAS.
In return, the governor and the legislature, with broad support from the business
community, agreed to make sure that every school district had sufficient funding to
provide its students with the quality education needed to meet this consistent standard
of academic achievement. This was intentionally designed to achieve equity for urban
districts with large concentrations of minority and low-income students, which had
traditionally been underfunded.
The accountability and the funding provisions were closely linked. Political and
business leaders did not want to put additional resources into the schools without
clear measures of educator accountability, and educators could not fairly be held
accountable for student performance absent adequate funding.
At the heart of this historic bargain was the foundation budget – the new law’s
definition of what constituted adequate funding. Since 1993, successive governors
and legislatures have lived up to their obligations under the Education Reform Act,
making sure that all districts reached the foundation funding goal set by the law.
Nonetheless, it is clear today to any reader of the state’s newspapers that something is
amiss. School districts across the state are laying off teachers and cutting back on
book purchases, teacher training, library services, and athletic programs.
Having played a central role in forging and passing the 1993 historic bargain, MBAE
has a sustained interest in the school finance debate today. The organization
commissioned this paper together with the Boston Foundation to examine the
apparent contradiction between the state government’s adherence to the foundation
budget requirements and the school funding challenges visible in so many school
districts across the state.
Key Findings
1. Health Care Costs: The explosive growth in the cost of health care for
school employees has caused a major funding shortfall. From 2000 to 2007,
costs rose by 13.6 percent per year, while the overall inflation adjustment was
growing at only 3.4 percent. Over this period, annual health care costs in

Page 2
school budgets grew by $1.0 billion – $300 million more than the increase
in Chapter 70 aid.
2. Impact on Teachers, Education Materials, Training: With health care costs
rising rapidly but overall district spending increasing at more modest rates,
there has been relatively little left over for other areas of the school budget that
directly affect student learning -- teachers, instructional materials, and teacher
training. Since 2000, per-pupil spending statewide on these key elements of
school budgets, adjusted for inflation, has been falling. From 2000 to 2007,
spending on books fell by more than half and spending on teacher
training by almost a quarter.
3. Inflation Adjustment Falls Short: The price indicator used to adjust the
foundation budget to keep it in line with inflation has increased much more
slowly than the actual cost of running schools in Massachusetts – only 3.4
percent a year from 2000 to 2007. As a result, the foundation budget, and the
state aid and local spending requirements that depend on it, have failed to keep
up with rising costs. The foundation budget shortfall was $1.2 billion in
2007 and is now almost $1.7 billion.
4. Equity Not Achieved: Over the 17 years since the Education Reform Act
passed, there has been virtually no equalization in spending or state aid
between rich districts and poor. The gains made by the neediest districts in the
years before 2000 have been all but nullified by losses in the years since.
With growth of only 2.3 percent per year from 2007 to 2010, the per-pupil
spending in needy districts was a full percentage point less than the wealthiest suburban districts (3.4 percent). As a result, they made very
little progress relative to the foundation goal, properly adjusted for inflation.
Poor districts were 21 percent below in 1993, rose to within 3 percent of the
goal in 2000, and were back down to 6 percent below in 2010.
In addition to the impact of skyrocketing healthcare costs for their own employees,
school districts are also hurt by soaring increases in Medicaid and health insurance for
state employees – increases that are crowding out all other areas of the state budget.
From 2000 to 2010, health care consumed two thirds of the entire increase in state spending. Controlling health care costs has therefore become a critical
education issue.
The inability to increase state aid, and the resulting cuts in spending, particularly in
the neediest districts, call into question the historic bargain created in the Education
Reform Act of 1993. If we cannot bring resources in the classroom to the foundation
goal – either by increasing state assistance or reducing costs in health care, student
transportation, school operations, central administration, and other areas that don’t
directly impact teaching and learning in classrooms – we cannot in good faith

Page 3
continue to hold teachers and principals accountable for reaching the reform law’s
performance goals.
THE CENTRAL ROLE OF THE FOUNDATION BUDGET
The school funding side of the 1993 “grand bargain” was codified by the reform law’s
spending goal – the foundation budget. This consisted of a specific set of resources
that were to be made available to every school. It included class size goals (22 for
elementary school, 25 for middle school), additional teachers for music, art, libraries,
and physical education, funding goals for teacher professional development, and
funds for books, software, and other educational materials. The foundation budget
rises (and falls) with changes in enrollment, and provides additional resources for
districts with high percentages of low-income students and students who are not
fluent in English. This approach was considered a radical change at the time because
instead of basing state aid on available funds, regardless of whether this was enough
to educate students properly, the new law began by defining what schools needed, and
then allocating funds accordingly.
The school funding formula was set up to ensure that over the first seven years of the
reform period, every district’s spending would be brought up to the foundation level
and be maintained there as the foundation itself was adjusted for inflation. This was
done by keying both state aid and required local support to the foundation budget
spending goal.
Adjusting for Inflation
Prices and wages rise over time. Unless adjusted to reflect rising costs, the dollar
amounts established in 1993 would quickly become too low to maintain the class size,
book purchase, and professional development goals set in the 1993 bargain. For this
reason, an inflation adjustment was included in the 1993 statute. As we’ve seen, the
price index used for this adjustment – a national index of the cost of operating state
and local governments – has not kept pace with the actual cost of running
Massachusetts schools. As a practical matter, this has meant that neither state aid nor
required local contributions have risen sufficiently to allow districts to meet the 1993
class size, book purchase, and professional development goals.
Many districts, mainly wealthier suburban districts, have chosen to spend more than
the statutory minimums. But other districts, usually inner-city districts with low
property wealth and high percentages of needy students, have spent at or near the
minimum required. Such districts are now spending well below the programmatic
levels envisioned in the 1993 bargain.

Page 4
The basic idea behind the state aid formula established in 1993 is simple enough.
There’s a target for how much each district should be spending (the foundation
budget) and a formula for determining how much each district should contribute in
the way of local funds, taking into account personal income and property wealth in
equal measure. If the foundation budget is greater than what a district can reasonably
be expected to fund on its own, the difference is made up with state education aid. A
similar approach is used in the vast majority of states across the country.
Had the foundation budget increased at the rate necessary to cover districts’ rising
costs – or if those costs had risen at the same rate as the formula’s inflation
adjustment, as was the case from 1993 to 2000 – most of the complaints about the
funding formula would disappear.
The Chapter 70 formula is designed to keep districts at the foundation budget,
regardless of whether that budget is itself keeping up with actual costs.1 The only
way to fix this problem is to control costs and/or add revenue. Intellectually, this
solution is much simpler than redesigning the formula’s underlying algebra.
Politically, it’s much more difficult.
Organization of the Paper
The conclusions summarized above are spelled out in more detail below, using a
series of charts to illustrate the key points graphically. The paper begins by looking at
the statewide increase in school spending over the reform period and where it went
(teachers, book purchases, school operation, employee health insurance). This is
done first in current dollars, then in real, inflation-adjusted dollars. The next section
goes beyond the statewide totals to look at how the neediest districts with large
percentages of low-income and minority students and with low property wealth have
fared, and how their spending trends compare to the more well-off districts. The
concluding section looks at the impact of health care costs on the state budget as a
whole.
Analysis Before and After 2000
Financial trends since 1993 are best understood by looking separately at the periods
before and after FY 2000 (fiscal year 2000, which was school-year 1999-2000).
From 1993 to 2000, the spending increases envisioned in the foundation budget were
phased in gradually. During this period there were relatively larger increases in state
aid to bring districts up to foundation and increases in costs were roughly in line with
the foundation budget inflation adjustments, so the process went quite smoothly.
1 The provisions that govern state school aid and required local contributions in support of the
schools appear in Chapter 70 of the general laws; for convenience the school aid formula is often
referred to as “Chapter 70” or the “Chapter 70 formula”.

Page 5
Once districts reached foundation budget levels in 2000, there was no longer the need
to increase state aid payments at levels substantially above the inflation rate. Since
2000, the cost of employee health care has risen dramatically; and the problems have
been compounded by two periods of overall state budget shortfalls. As a result, much
of the progress made in the earlier years has been lost over the past 10 years.
Ideally, we would look at trends from 1993 to 2000 and then from 2000 to 2010.
Data is available over this entire period for actual school spending, the foundation
budget, and district enrollment.2 To understand what has happened, we need to be
able to look at spending by area of expenditure – most importantly, by separating out
spending on employee health care. However, information at this level of detail for
spending and enrollment is available only for 1996, 2000, and 2007. Where possible,
the analysis that follows runs from 1993 to 2010; where necessary, it is limited to the
periods 1996 to 2000 and 2000 to 2007.
2 Spending data for FY 2010 is for budgeted rather than actual spending.

Page 6
PART 1: WHERE THE MONEY WENT
Overall Spending Increase
In school year 1995-96 (FY 96), net school spending in Massachusetts was $5.2
billion.3 Of this total, $233 million was spent on tuition for students who were the
financial responsibility of the district but actually attended school elsewhere –
primarily out-of-district spending for special education students, but also students
using the school choice law or attending charter schools. The remaining $5.0 billion
was spent in the district’s schools in support of local students.4
Of the $5.0 billion spent in-district, $546 million went to support employee benefits,
mainly health care, leaving $4.4 billion available to operate and staff the district’s
schools.5
By FY 2000 spending had increased by $1.6 billion to $6.8 billion; it increased by
another $3 billion over the following seven years, reaching $9.9 billion in FY2007.
As we see in the left-hand portion of Chart 1 below, the increases in tuition and health
care costs between 1996 and 2000 were relatively small. Most of the new funds -
$1.4 billion – were available to support teachers, book purchase, and other programs
within the schools.
3 Net school spending – the definition of spending used consistently in the paper - is used by
DESE for comparison with the foundation budget goal. It excludes revenues other than those
from state and local governments (such as money paid by students for school lunches and funds
from federal grants); it also excludes the cost of student transportation. 4 Funds received from other districts for incoming choice students are not counted.
5 The budget category for which data is available includes all employee benefits (this would
include employee life insurance), but the greatest portion of this money goes to employee health
insurance, and this insurance certainly accounts for almost all of the increases seen.

Page 7
0
500
1,000
1,500
2,000
2,500
3,000
96-00 00-07 07-10 96-00 00-07 07-10
Total Per-Year
1,364
1,493
341 213
165
1,028
41
147
93
517
23 74
834
278
Increases in School Spending, by Year & Type
Statewide Spending, Millions of Dollars
Total (2007 - 2010)
Tuition
Benefits
In-District, Excluding Benefits
Chart 1
After 2000 the picture is very different. A third of the overall increase in school
spending over this period went to cover the increased cost of employee health care.
The increase in tuition paid reflected a large increase in the number of students going
to charter schools or using school choice programs. When account is taken of the
decreased number of students the statewide impact of the increased tuition payments
on per-pupil funding for in-district programs is relatively small, although it may be
quite large in particular districts.6
Annual Changes in Spending
These trends are best understood by looking at spending trends on an annual basis, as
shown in the right-hand side of Chart 1. With health care costs rising by an additional
$100 million a year ($147 million after 2000, against only $41 million before), the
increases remaining for in-district programs fell dramatically – from $341 million
before 2000 to only $213 million after.
In the three years since 2007, annual spending has grown by an even smaller amount
– only $278 million a year. Employee health care data for this period is not available
yet, but based on information from the state’s Group Insurance Commission, a
reasonable assumption would be that the increase continued at $147 million a year.
Even without further increases in tuition payments, this would leave only $131
6 Per-pupil spending for all students grew by 5.7 percent per year over this period; spending in-
district for in-district students rose by 5.4 percent.

Page 8
million more each year for school operation – barely more than half the increase from
2000 to 2007 and a reduction of almost two-thirds from the pace prior to 2000.
Chart 2 shows the spending change not in total dollars but in percent per year.
0%
2%
4%
6%
8%
10%
12%
14%
Spending In-District Health Total Per Student
Total SubTotal Insurance In-District Except Health
7.0
%
6.9
%
6.8
%
6.9
%
5.5
%
5.4
%
4.8
%
13
.6%
3.3
%
3.9
%
Annual Change, Spending & Students
Total, In-School SubTotal, Percent per Year
96-00
00-07
Chart 2
Total spending growth fell from 7.0 percent prior to 2000 to 5.4 percent afterwards.
In-district spending grew by somewhat less – 4.8 percent from 2000 to 2007. With
health care costs rising at 13.6 percent per year, the amount left for everything else
grew by only 3.3 percent – less than half the rate in the earlier period. In-district
enrollment grew at 1.4 percent prior to 2000; it fell by .6 percent a year over the next
7 years. As a result, spending per-student grew at 3.9 percent.
As a practical matter, per-pupil costs tend to rise when enrollment falls, as it is
difficult for districts to cut fixed costs. The spending “pain” – and the impact on
spending in the classroom – of the reduced spending growth after 2000 are therefore
somewhat understated by the per-student analysis.
Spending by Type
The goal of the 1993 reform was to make possible major improvements in student
performance, particularly low-income and minority students whose performance has
traditionally lagged behind more affluent peers. While closing the gap involves more
than money alone, the 1993 historic bargain was based on the premise that spending
matters and that high-poverty districts needed to spend somewhat more than the
wealthy districts because of their needier student bodies. The foundation budget was

Page 9
structured to make sure that class sizes in inner-city schools were reasonable and that
funds were available for necessary increases in spending on teacher professional
development and on acquisition of books, software, and other instructional material.
There is overwhelming evidence that research-based instructional materials and
training for teachers in such areas as using data to drive instruction, differentiating
instruction and practice to make sure each student is challenged at his/her own level,
and knowing how to develop students’ oral language, vocabulary, and higher-order
thinking skills are essential to closing the achievement gap.
Unfortunately, inflation-adjusted, per-pupil spending in these key areas has actually
been falling since 2000, as shown in Chart 3.
-12%
-7%
-2%
3%
8%
SubTotal Teachers Other Profs Oper- ations
Books PD
2.1
%
1.0
%
3.4
%
3.0
%
0.9
% 2
0.2
%
0.3
%
-0.1
%
3.5
%
-0.2
%
-11
.3%
-3.6
%
Inflation-Adjusted Change in Per-Pupil Spending
In-District Spending, Net of Health Care, Annual Change
96-00
00-07
Chart 3
When adjusted for changes in teachers’ salaries and the cost of operating schools and
buying books, the 3.9 percent increase in nominal in-district per-pupil spending (net
of health insurance for school employees) from 2000 to 2007 becomes an annual
decrease of 0.3 percent. The brunt of this decrease comes in two areas critical to
school transformation: materials and educator professional development. Spending
on instructional materials adjusted for inflation fell by 11.3 percent per year, an
overall decrease of 57 percent. Put another way, schools statewide are buying fewer
than half the books they bought just 10 years ago and spending on teacher
professional development has been falling at 3.6 percent per year.

Page 10
Teachers and Teacher Salaries
A surprising finding from this analysis is that, despite the almost $5 billion increase in
total school spending from 1996 to 2007, there has been almost no change in the
number of teachers or in average class sizes. This occurred because the increase in
funds available for teachers was small, not because teacher salaries rose at an
unreasonable rate. On average, teacher salaries have risen in line with the cost of
living. Average salaries were up 3.4 percent a year from 1996 to 2000, while the
Boston CPI rose 2.8 percent. From 2000 to 2007, average salaries rose 3.2 percent
per year while the CPI was up 3.3 percent.
In the earlier period, funds available for classroom and other teachers rose by 5.9
percent a year. This was well above the increase in salaries; the number of teachers
districts could afford went up from 63,900 to 70,200. From 2000 to 2007, however,
funds available for teachers rose by only 2.5 percent per year, below the increase in
average salaries. The number of teachers fell back to 66,800. In short, about half the
gains from 1996 to 2000 were erased by 2007; given the even lower growth in school
spending since 2007, these declines have almost certainly continued.
Under-Adjusting for Inflation
The foundation budget was the central element in the financial portion of the 1993
reform law. It set a spending goal – actually, a spending minimum – for each district,
based on its enrollment and the percent of its students who are low-income.
Recognizing that prices and wages rise over time, the law provided that this
foundation budget would be adjusted each year to reflect the impact of inflation; the
price index chosen for this purpose is a national index that purports to measure
changes in operating state and local governments. In practice, that index has not
reflected increases in the actual cost of operating schools in Massachusetts.
Chart 4 compares the statewide increase in the foundation budget with the increases
in a hypothetical “true cost” foundation, where the inflation adjustment reflected the
actual cost of running Massachusetts schools. The true cost foundation uses the
actual costs of tuition payments and health care. Other costs are increased over time
to reflect changes in in-district enrollment and are adjusted by the change in statewide
average teacher wage rates (for teachers and other professionals) and by appropriate
national indicators for the cost of fuel and books for, respectively, school operations
and purchases of educational materials.

Page 11
0%
2%
4%
6%
8%
10%
12%
93-00 00-07 07-10
4.6
%
4.1
%
4.3
%
5.5
%
5.3
%
5.3
%
7.4
%
4.7
%
2.9
%
12
.0%
3.3
%
4.9
%
Foundation Budget Falls Behind True Cost
Annual Increases Statewide - Foundation vs True Foundation
Foundation Budget
True Foundation
Spending
Aid
Chart 4
From 1993 to 2000, the actual foundation budget used to increase state aid payments
and to set required levels of local contribution rose at 4.6 percent per year – only
slightly less than the 5.5 percent actual increase in cost. State school aid rose by 12.0
percent, as this was a period of large increases to bring districts to foundation, and
actual school spending rose by 7.4 percent.
After 2000 the picture is much different. The foundation budget used in the state
budget increased by 4.1 percent, while actual costs rose by 5.3 percent. Over this
period, total school spending rose by 4.7 percent so spending was failing to keep up
with rising costs. At 3.3 percent per year, state aid was rising much more slowly than
school costs. Over the past 3 years, the actual increase in school spending, at 2.9
percent per year, fell even further behind the increase in actual costs (5.3 percent).
Chart 4 sums up the basic problem – over 17 years the actual cost of running state
schools has risen more rapidly than the foundation budget allocations for school
spending. .
PART 2 - NEEDY VS. WELL-OFF DISTRICTS
MBAE’s report Every Child a Winner, released in 1991, paved the way for the 1993
reform law. As its title suggests, this was an effort to help every child perform at high
levels. As numerous studies have shown, minority and low-income students are far
more likely to be struggling in school. The heaviest concentrations of these needy
students are in the older, low-income cities, in communities that also lack the tax base
to support the larger faculties and special programs necessary to address the needs of
children who come to school with limited vocabularies and language skills.
Page 12
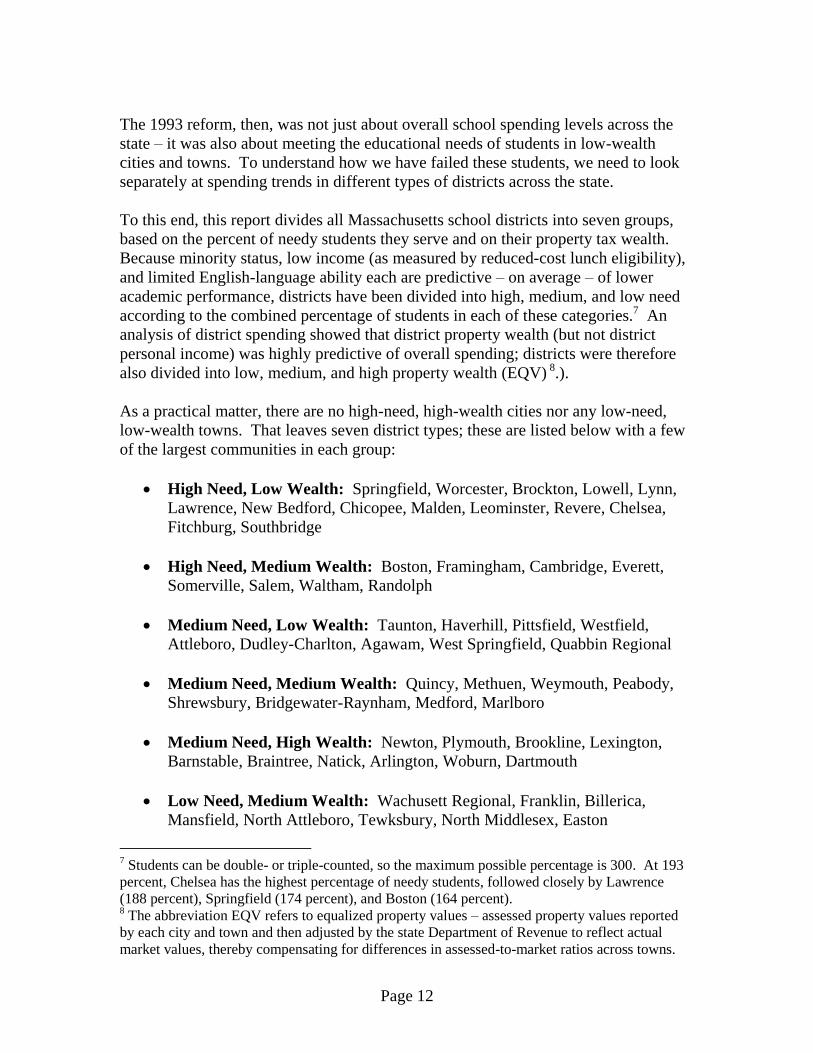
The 1993 reform, then, was not just about overall school spending levels across the
state – it was also about meeting the educational needs of students in low-wealth
cities and towns. To understand how we have failed these students, we need to look
separately at spending trends in different types of districts across the state.
To this end, this report divides all Massachusetts school districts into seven groups,
based on the percent of needy students they serve and on their property tax wealth.
Because minority status, low income (as measured by reduced-cost lunch eligibility),
and limited English-language ability each are predictive – on average – of lower
academic performance, districts have been divided into high, medium, and low need
according to the combined percentage of students in each of these categories.7 An
analysis of district spending showed that district property wealth (but not district
personal income) was highly predictive of overall spending; districts were therefore
also divided into low, medium, and high property wealth (EQV) 8.).
As a practical matter, there are no high-need, high-wealth cities nor any low-need,
low-wealth towns. That leaves seven district types; these are listed below with a few
of the largest communities in each group:
High Need, Low Wealth: Springfield, Worcester, Brockton, Lowell, Lynn,
Lawrence, New Bedford, Chicopee, Malden, Leominster, Revere, Chelsea,
Fitchburg, Southbridge
High Need, Medium Wealth: Boston, Framingham, Cambridge, Everett,
Somerville, Salem, Waltham, Randolph
Medium Need, Low Wealth: Taunton, Haverhill, Pittsfield, Westfield,
Attleboro, Dudley-Charlton, Agawam, West Springfield, Quabbin Regional
Medium Need, Medium Wealth: Quincy, Methuen, Weymouth, Peabody,
Shrewsbury, Bridgewater-Raynham, Medford, Marlboro
Medium Need, High Wealth: Newton, Plymouth, Brookline, Lexington,
Barnstable, Braintree, Natick, Arlington, Woburn, Dartmouth
Low Need, Medium Wealth: Wachusett Regional, Franklin, Billerica,
Mansfield, North Attleboro, Tewksbury, North Middlesex, Easton
7 Students can be double- or triple-counted, so the maximum possible percentage is 300. At 193
percent, Chelsea has the highest percentage of needy students, followed closely by Lawrence
(188 percent), Springfield (174 percent), and Boston (164 percent). 8 The abbreviation EQV refers to equalized property values – assessed property values reported
by each city and town and then adjusted by the state Department of Revenue to reflect actual
market values, thereby compensating for differences in assessed-to-market ratios across towns.

Page 13
Low Need, High Wealth: Andover, Chelmsford, Westford, Needham,
Wellesley, Marshfield, North Andover, Reading, Winchester, Hingham
Expenditure Trends by District Type
-4%
-3%
-2%
-1%
0%
1%
2%
3%
4%
Low EQV Med EQV Low EQV Med EQV High EQV Med EQV High EQV
High Need Medium Need Low Need
3.1
%
0.3
%
3.0
%
1.5
%
1.4
%
2.5
%
0.9
%
-0.8
%
-1.5
%
-0.4
%
-0.5
%
-0.1
%
-0.8
%
-0.4
%
-3.1
%
-2.3
%
-1.0
%
-3.2
%
-3.1
%
-1.3
%
-2.2
%
Spending Trends Across District Types
Per-Pupil Spending, Adjusted for Inflation- Annual Pct Change
93-00 00-07 07-10
Chart 5
Chart 5 shows annual changes in per-pupil spending, adjusted for changes in the cost
of running schools. The adjustment is calculated using the true cost foundation
budget. For example, the actual per-pupil spending for high-need, low-EQV districts
(the first bar at the left on the chart) was 6.4 percent; the cost of running those schools
(including tuition for out-placed students, health insurance for school employees,
increases in teacher salaries, and increases in the costs of books and fuel oil)
increased at 3.4 percent. The inflation-adjusted increase – the difference between the
nominal increase of 6.4 percent and the inflation index of 3.4 percent - was 3.1
percent, as shown on the chart.
The light grey bars, representing the period from 1993 to 2000, show that inflation-
adjusted spending increased in all district types, although the gain in the high-need,
medium wealth cities (Boston, Cambridge, for example – cities that already had very
high per-pupil spending) was quite modest. The largest increases came in the
neediest districts, exactly as the law intended.
In the years from 2000 to 2007, and again from 2007 to 2010, inflation-adjusted
spending fell across all district types. Again using the neediest (high-need, low-

Page 14
wealth) districts as an example, nominal spending (not shown on the chart) increased
at 4.5 percent, down substantially from the 6.4 percent increases in the earlier period,
while costs rose at 5.4 percent, pushing down inflation-adjusted spending by 0.8
percent per year.
Looking across the chart, we see that the decreases in this period were roughly the
same for all district types.9
The decline has been even more severe since 2007. The nominal increase in spending
for the neediest districts fell to only 2.3 percent per year. The data to calculate the
true foundation is not yet available for 2010, but it’s reasonable to assume that costs
continued to rise at the same annual rate as in earlier years – for these districts, 5.4
percent a year.10
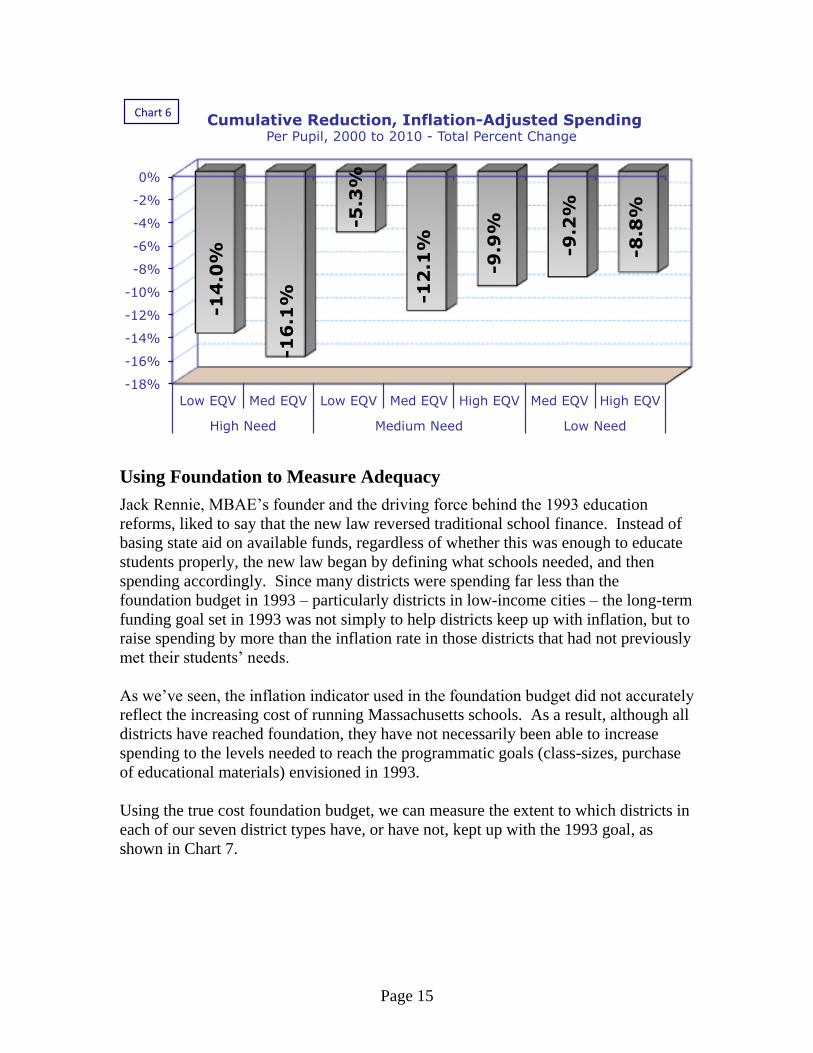
Inflation-adjusted spending in the neediest districts, then, fell by 3.1 percent in the
period from 2007 to 2010. The cumulative reduction in per-pupil spending in these
neediest districts was 17.7 percent over the years from 2000 to 2010. Although all
district types have experienced decreases, the cutbacks in districts with the highest
proportion of low-income and minority students (left-hand side of the chart) have
been almost twice as great as the reductions in districts with very few needy children
(rightmost two bars).
9 The particularly large drop in non-health-care spending in the neediest district is not the result
of differences in health-care cost change across districts. The increases in employee health care
costs were actually slightly less in the high need, low wealth districts than in the rest of the state.
Rather spending net of health care fell more in these districts because overall state aid and total
spending grew less than in other districts. 10
As indicated above, the most important cost driver has been employee health insurance. Data
from the Group Insurance Commission (GIC), which insures state employees, shows that annual
increases in premiums were actually larger after 2007 than in the years just before.
Page 15
-18%
-16%
-14%
-12%
-10%
-8%
-6%
-4%
-2%
0%
Low EQV Med EQV Low EQV Med EQV High EQV Med EQV High EQV
High Need Medium Need Low Need
-14
.0%
-16
.1%
-5.3
%
-12
.1%
-9.9
%
-9.2
%
-8.8
%
Cumulative Reduction, Inflation-Adjusted Spending Per Pupil, 2000 to 2010 - Total Percent Change
Chart 6
Using Foundation to Measure Adequacy
Jack Rennie, MBAE’s founder and the driving force behind the 1993 education
reforms, liked to say that the new law reversed traditional school finance. Instead of
basing state aid on available funds, regardless of whether this was enough to educate
students properly, the new law began by defining what schools needed, and then
spending accordingly. Since many districts were spending far less than the
foundation budget in 1993 – particularly districts in low-income cities – the long-term
funding goal set in 1993 was not simply to help districts keep up with inflation, but to
raise spending by more than the inflation rate in those districts that had not previously
met their students’ needs.
As we’ve seen, the inflation indicator used in the foundation budget did not accurately
reflect the increasing cost of running Massachusetts schools. As a result, although all
districts have reached foundation, they have not necessarily been able to increase
spending to the levels needed to reach the programmatic goals (class-sizes, purchase
of educational materials) envisioned in 1993.
Using the true cost foundation budget, we can measure the extent to which districts in
each of our seven district types have, or have not, kept up with the 1993 goal, as
shown in Chart 7.

Page 16
-25%
-20%
-15%
-10%
-5%
0%
5%
10%
15%
20%
Low EQV Med EQV Low EQV Med EQV High EQV Med EQV High EQV
High Need Medium Need Low Need
-21
%
7%
-17
% -7
%
8%
-9%
9%
-3%
10
%
2%
3%
19
%
8%
16
%
-16
%
-7%
-3%
-9%
8%
-1%
7%
Spending Relative to True Foundation
By District Type, 1993, 2000, 2010
1993 2000
2010
Chart 7
In 1993, the last year before the reform, the high-need, low wealth districts were
spending at 21 percent below foundation (actual and true cost foundation were
identical in 1993). The years of large aid increases and modest growth in health care
costs brought them almost to true cost foundation; they were just 3 percent below in
2000. By 2010, however, budgeted spending was 16 percent below true cost
foundation. In short, most of the gains made in these neediest districts over the first
seven years of reform have been lost over the last 10 years.
The wealthiest districts – those with high EQV – have managed to keep spending 7 or
8 percent above the true cost foundation. Spending in these districts, then, exceeds
the spending goals set in 1993. While these districts have lost ground since 2000,
their spending relative to true cost foundation is unchanged since 1993. The districts
with very low poverty and medium property wealth are essentially at the true cost
foundation goal (1 percent below). Thus, the most comfortable districts, with high
property wealth and/or very low populations of needy students, remain at or above the
inflation-adjusted foundation goal; none of the other district types are so fortunate,
and the very neediest districts are the farthest below the spending goal.
Chart 8 shows per-pupil spending in relation to the foundation budget as used in the
state budget and the true cost foundation budget for all district types in 2010. Except
for the low-wealth, high-need inner city districts, all other district types were
spending at levels that met the foundation budget as published by the state. However,
as shown in Chart 7, most districts are spending well below the true cost foundation.
Massachusetts is living up to the letter of the 1993 reform, but not its spirit.

Page 17
5,000
6,000
7,000
8,000
9,000
10,000
11,000
12,000
13,000
14,000
Low EQV Med EQV Low EQV Med EQV High EQV Med EQV High EQV
High Need Medium Need Low Need
10
,73
9
10
,73
6
9,4
43
9,1
37
8,9
60
8,2
73
8,3
71
12
,29
3 14
,19
1
10
,80
7
10
,90
9
10
,75
3
9,5
23
9,8
35
10
,33
0
13
,20
4
10
,45
6
9,9
41
11
,61
6
9,3
88
10
,50
5
Foundation & Spending, 2010
Per-Pupil, Thousands of Dollars
Foundation
True Foundation
Spending
Chart 8
Chart 8 also shows us how the foundation budget for districts with needy students –
just over $10,700 per student in 2010 -- is much higher than for districts with few
needy students – about $8,300. In practice, the reform goal of spending more per
student in the neediest districts has not been realized. At $10,300, actual per-pupil
spending in the older urban centers with low property wealth (Holyoke and Lawrence,
but not Boston and Cambridge) in 2010 was slightly less than spending in the high-
wealth, low-need suburbs ($10,500) – despite disparities in costs for the additional
teachers, counselors, interventions, and training necessary to meet the needs of their
very challenging student bodies.
State Aid Not Meeting Equity Goal
The neediest districts receive the great majority of their school funding from the state
government. In 2010, for example, state aid supplied 82 percent of school spending
in the low-wealth, high-need districts. It follows, then, that the large decline in their
spending relative to true cost foundation from 2000 to 2010 reflects much slower
increases in state aid. In the last 3 years, aid growth was up slightly for needy
districts but doubled for wealthy districts.

Page 18
0%
2%
4%
6%
8%
10%
12%
14%
Low EQV Med EQV Low EQV Med EQV High EQV Med EQV High EQV
High Poverty Medium Poverty Low Poverty
8.7
%
13
.8%
8.7
%
7.9
%
12
.4%
10
.4%
11
.4%
3.6
%
2.8
%
3.1
%
2.8
%
2.5
%
2.7
%
3.5
%
4.8
%
4.6
%
4.8
%
5.8
%
6.9
%
5.7
%
8.4
%
Increases in Chapter 70 State Aid, Per Pupil Annual Increases, by Type of District
93-00
00-07
07-10
Chart 9
As we see in Chart 9, there has not been a period when aid to the high need districts
grew at rates well above those to low-need districts. From 1993 to 2000, aid to all
groups of districts was growing rapidly – somewhere from 8 percent to 14 percent a
year. From 2000 to 2007 the growth in aid was much lower and almost universally
low – ranging from 2.5 percent to 3.6 percent a year.
The Two Drivers of Aid Increases
Two key factors determine how much aid grows under the Chapter 70 formula. For
low-wealth, high-need communities, aid is determined primarily by the difference
between the spending goal – the district’s foundation budget – and the amount its
member towns are expected to raise locally, based on personal income and property
wealth. Had the foundation budget increased at rates that reflected the actual
increases in school costs (the rates shown here as the true cost foundation), we would
have seen much greater increases in aid to the neediest districts.
To assure that wealthier districts receive at least some state assistance, the revised aid
formula sets as a goal that all districts should receive Chapter 70 aid equal to at least
17.5 percent of their foundation budgets.11 How quickly the aid increases needed to
meet this goal are phased in determines how much aid to these districts increases.
The fact that aid to the wealthier districts has grown more rapidly in recent years than
11
Significant revisions to Chapter 70 were passed in the spring of 2006, including the “minimum
aid” goal for wealth towns. There were changes in how the foundation budget was calculated, but
no major changes to its bottom line.

Page 19
aid to older cities reflects the high priority given to meeting this “minimum aid”
provision even in a period of fiscal austerity.
Foundation Budget Shortfall
Chart 8 demonstrated that the true cost foundation was higher than the actual
foundation. By 2010, this gap, totaled across all district types, amounted to almost
$1.7 billion, as shown in Chart 10 below.
0
2,000
4,000
6,000
8,000
10,000
12,000
1996 2000 2007 2010
5,054
6,022
7,986
9,058 183
383 1,229
1,694
Milio
ns o
f D
ollars
Foundation Budget Shortfall Foundation Compared with Measure of True Cost
Gap
Foundation
Chart 10
Any effort to close this gap would require both an increase in state aid but also an
increase in local support of schools. In the neediest districts, all or almost all of the
cost of any increase in the foundation budget would come from additional state aid.
As we saw in Chart 8, the wealthiest districts, taken as a whole, are already spending
more than the true foundation; in most cases, then, there would be no required
increase in local spending. In wealthy districts not at the increased foundation, most
of the adjustment would come through a required increase in local tax effort. A
reasonable estimate is that it would cost the state government somewhere between
$800 million and $1 billion a year in increased state aid payments to raise the
foundation budget by $1.7 billion.
PART 3 - THE LARGER PROBLEM OF HEALTH CARE COSTS
The problem of rising health care costs goes far deeper than education alone. Over
the past 10 years, from FY 2000 to FY 2010, health care costs consumed 66 percent
- fully two-thirds – of the entire increase in state spending. This included

Page 20
Medicaid, the Group Insurance Commission (which provides health care to state
employees) and, more recently, the cost of the state’s universal health care law. This
is shown in Chart 11 below.
3,671 3,955 4,188 4,086 3,883 4,082 4,252 4,542 4,842 5,084 4,997
1,002 1,110 1,037 982 830 912 888 1,112 1,083 1,087 1,067
10,450 11,124 10,851 10,487 10,588
11,588 11,954 13,515 13,729 13,423
12,688
4,947
5,461 6,243 6,607 6,802 7,243
7,801
9,577 10,598 11,654
11,971
0
5,000
10,000
15,000
20,000
25,000
30,000
35,000
FY 00 FY 01 FY 02 FY 03 FY 04 FY 05 FY 06 FY 07 FY 08 FY 09 FY 10
Shares of Massachusetts State Budget - Education, Health Care Billions of Dollars per Year - FY 2000 to FY 2010
Health Care
All Else
Colleges & UMass
K-12, PreSchool
Chart 11
This extraordinary increase is primarily related to the overall cost increases in health
care, rather than the adoption of the new Massachusetts health-care law. From 2000
to 2006 – before the new law was enacted – health care costs consumed 59 percent of
all new spending. The problem is particularly difficult in hard budget times; from
2007 to 2010, health care costs in the state budget rose by $2.4 billion while the total
budget rose by only $2 billion.
With revenues for everything other than health care caught in a squeeze between very
high growth in health care costs and relatively small growth in overall revenues, there
is no way to provide larger increases to state education. This is illustrated in Chart 12
below:

Page 21
-3%
-1%
1%
3%
5%
7%
9%
Health Care K-12, PreSchool
Colleges & UMass
All Else State Government
Total
9.9%
3.1% 1.5%
3.7%
5.3%
7.7%
3.2%
-1.3% -2.1%
2.2%
Average Annual Percent Change, FY 2000 to FY 2010 Elements of Massachusetts State Budget
FY 00 - 07
FY 07 - 10
Chart 12
Education
Over the last 3 years, health care costs have risen at 7.7 percent per year while total
spending has gone up at 2.2 percent. Pre-school and K-12 education saw an increase of
3.2 percent, reflecting the priority given to this area by the governor and the legislature.
Higher education spending fell at 1.3 percent per year; taken together, all other areas of
state government saw spending decline at 2.1 percent annually. These figures are in
nominal dollars; adjusted for inflation, the annual changes would be even less.
Even these figures understate the problem, since, as we’ve seen, health care is itself a
major component within K-12 spending. From FY 2000 to FY 2007 Chapter 70
education aid rose by $700 million a year. Over this same period, school spending on
employee health care rose by $1 billion. In effect, schools had a net loss in state aid over
these seven years.
CONCLUSIONS
Since 1993, successive governors and legislatures have faithfully worked to meet the
school funding commitments as defined by the Commonwealth’s historic education reform
bargain – high standards and accountability for performance in return for equitable
distribution of resources to meet these benchmarks. Educators have kept their part of the
agreement and today Massachusetts students, on average, outperform the nation.
Yet, if the letter of the funding law has been honored, why are we are falling short in
meeting the programmatic goals of the historic bargain as school systems grapple with
huge budget shortfalls and student achievement gaps persist? The results of this analysis
show that health care costs and other overhead expenses are crowding out classroom
expenditures directly affecting student learning.

Page 22
Controlling the overall cost of health care in Massachusetts is now the ultimate
education issue. Absent a major change in the trend of health care costs, it is impossible
to see how the state can keep all districts at foundation or cover the costs of the classroom
resources promised in 1993. Even if a new source of revenue or significant change in
employee health care costs or other expenses were to provide short term relief, these gains
would be quickly lost if health care costs continue to rise at 10 percent or so each year.
Reducing school costs outside of the classroom is an imperative for schools and
districts. Immediate steps at the state level include granting Massachusetts
municipalities the ability to move employee health care benefits to lower-cost
alternatives such as the state Group Insurance Commission, switch eligible retirees to
federal Medicare or achieve savings through more efficient operation of school buildings,
merging administrative costs across smaller districts, or other steps to gain efficiencies.
While spending alone does not guarantee high performance, it is clear that education
services and outcomes will suffer if the gap between funds available and the actual
foundation costs continues to grow. Since a $1 billion increase in state aid is highly
unlikely anytime soon, and since a $1 billion savings from cost reduction (that is, lower
health insurance costs, more fuel-efficient buildings, lower overhead) also seems
unrealistic, every combination of options to address the problem must be considered.
Only then will Massachusetts have a school finance system that lives up to the vision first
articulated by MBAE 20 years ago, a system that funds the educational programs and
supports necessary to ensure that all students achieve at high levels and every student
graduates prepared for success in college, career, and citizenship.
Acknowledgements
Edward Moscovitch of Cape Ann Economics and the Bay State Reading Institute
developed the original foundation formula for MBAE in 1991 and 1992, conducted the
analysis of current data, and is the author of this report. We thank him for bringing his
unique perspective and expertise to this work and for his thorough and understandable
review of the foundation budget’s history and effectiveness.
MBAE is grateful for the support of The Boston Foundation, which funded this study. It
was originally issued as part of the Foundation’s Understanding Boston series.
This project was undertaken at the initiative of MBAE’s Advisory Council. Advisory
Council members Jose Alvarez and Chris Gabrieli, joined by MBAE Board members
Michael Widmer, Peter Nessen and Joseph Esposito, provided guidance and direction
to ensure that the right questions were asked and that the best evidence was assembled to
produce valid findings and conclusions. We appreciate the great knowledge, experience
and dedication to results-driven reform that all of these business leaders brought to this
project.

