school height and report - south dakotaschool height and weight ... project in the 1998-1999 school...
TRANSCRIPT

School Height and Weight Report
South Dakota Students 20092010 School Year
November 2010 South Dakota Department of Health

PREFACE The South Dakota Department of Health prepared the School Height and Weight Report, South Dakota Students, 2009-2010 School Year. The report includes 18 sections. These sections contain data on childhood obesity as well as guidelines and references for preventing and reversing the childhood obesity epidemic. Sections of note are: Executive Summary, which highlights data at a glance; Technical Notes, which explains the terminology and BMI for children and adolescents; and Regional Data, which examines the data by the Department of Education’s regions.
Also included are instructions and a form for any school interested in submitting data in the future. Please direct questions concerning the data to the following office within the South Dakota Department of Health: Office of Data, Statistics, and Vital Records 600 East Capitol Avenue Pierre, South Dakota 57501-2536 Phone: 605.773.3361
Contributors: Kristin Biskeborn, MPH, RD, LN State Nutritionist Barb Buhler Public Information Officer Carrie Cushing Policy Data Analyst Mark Gildemaster Management Analyst Anthony C. Nelson, RN Administrator, Data, Statistics, & Vital Records / State Registrar


TABLE OF CONTENTS Executive Summary................................................................................................................. 1
Results..................................................................................................................................... 1
Introduction.............................................................................................................................. 2
Data Collection Process .......................................................................................................... 2
Comparison To Previous Reports ........................................................................................... 2
Data Limitations....................................................................................................................... 3
Measurement Requirements ................................................................................................... 3
Height ................................................................................................................................ 4 - 5
Underweight ....................................................................................................................... 5 - 6
Overweight and Obese....................................................................................................... 7 - 9
Regional Data ................................................................................................................ 10 - 11
Obesity Risk Factors ............................................................................................................. 12
Comparison to Other Data ............................................................................................. 12 - 13
Prevention of Child Overweight and Child Obesity ............................................................... 13
What Everyone Can Do......................................................................................................... 14
What Parents Can Do ........................................................................................................... 14
What Students Can Do.......................................................................................................... 15
What Teachers & Coaches Can Do ............................................................................... 15 - 16
What School Nutrition Staff Can Do ...................................................................................... 16
What School Administrators & Board Members Can Do....................................................... 17
What School Nurses & Health Professionals Can Do........................................................... 18
What Communities Can Do................................................................................................... 18
Technical Notes.............................................................................................................. 19 - 20
Acknowledgements .............................................................................................................. 21 For More Information............................................................................................................. 21 References ....................................................................................................................... 22-23

TABLE OF CONTENTS (continued) Appendices: Appendix 1: Data Collection Form and Instructions .................................... 24 - 26 Appendix 2: Participating Schools............................................................... 27 - 31 Appendix 3: Map of Participating Schools.......................................................... 32 List of Tables: Table 1: School Year 2009-2010 Height-For-Age................................................ 4 Table 2: School Year 2009-2010 Height-For-Age, by Race................................. 5 Table 3: School Year 2009-2010 Underweight, Low Body Mass Index, for Age ................................................................................................... 5 Table 4: School Year 2009-2010 Underweight, Low Body Mass Index, by Race ................................................................................................. 6 Table 5: School Year 2009-2010 Overweight and Obese Body Mass Index for Age ...................................................................... 8 Table 6: School Year 2009-2010 Overweight and Obese Body Mass Index, by Race.................................................................... 9 Table 7: School Year 2001-2010 Overweight and Obese Body Mass Index, by Gender................................................................. 9 Table 8: School Year 2009-2010 Racial Distribution by Regions ...................... 10 Table 9: School Year 2009-2010 Age Distribution by Regions.......................... 10 Table 10: School Year 2009-2010 Overweight and Obese Body Mass Index, by Regions ............................................................ 11 List of Figures: Figure 1: Height-for-Age Below 5th Percentile 2001-2010, by Age...................... 4 Figure 2: Underweight, Weight-For-Height, 2001-2010, by Age .......................... 6 Figure 3: Obese 5-8 Year Olds Compared to State Totals, 2001-2010 ............... 8 Figure 4: Obese 9-11 Year Olds Compared to State Totals, 2001-2010 ............. 8 Figure 5: Obese 12-14 Year Olds Compared to State Totals, 2001-2010 ........... 8 Figure 6: Obese 15-19 Year Olds Compared to State Totals, 2001-2010 ........... 8 Figure 7: SD Education Service Agencies Region Map..................................... 10 Figure 8: School Year 2009-2010 Obese Body Mass Index for Age, by Regions with Confidence Intervals ................................................ 11

Executive Summary This report summarizes data collected on school-age children and adolescents during the 2009-2010 school year and also includes data collected since the start of the project in the 1998-1999 school year.
Key Findings:
This is the twelfth year data was collected and analyzed.
The sample size is currently 29.6 percent of the state’s students.
School submissions in the current report represent 205 schools.
No age group has been over the expected 5 percent below the 5th percentile in BMI-for-age, or underweight.
There has been a slight decrease in the overweight category from 17.0 percent in 2008-2009 to 16.7 percent in 2009-2010.
By race, American Indians increased in the overweight category from 19.3 percent in 2008-2009 to 19.6 percent in 2009-2010.
Overall, there has been a decrease in the obese category from 16.6 percent in 2008-2009 to 16.0 percent in 2009-2010. However, this is an increase from 15.1 percent in 1998-1999.
By race, American Indians decreased in the obese category from 26.4 percent in 2008-2009 to 26.0 percent in 2009-2010.
South Dakota has not met the national Healthy People 2010 Initiative of 5 percent overweight and obese in children and adolescents.
2009-2010 South Dakota data at a glance (ages 5-19):
3.2 percent height-for-age below 5th percentile (Short stature)
2.6 percent BMI-for-age below 5th percentile (Underweight)
16.7 percent overweight
16.0 percent obese
American Indians – 19.6 percent overweight and 26.0 percent obese
Males show 17.3 percent obese compared to females at 14.6 percent obese
Results Although slightly different age group categories are used for analysis, South Dakota’s data is currently lower than the latest national data. This data was compared to the growth charts developed by the Centers for Disease Control and Prevention. The growth charts are based on the body mass index* (BMI) and provide the most up-to-date standard for evaluating body measurements of children. The growth charts provide a reference that is consistent with adult standards and can be used from two years of age throughout adulthood.
Please note that even though BMI is an effective screening tool used to identify individuals who are underweight or overweight, it is not a diagnostic tool. For example, a relatively heavy child may have a high BMI for his or her age. Healthcare providers must make further assessments to determine whether the child has excess fat or is truly obese. This may include triceps’ skin fold measurements, assessments of diet, health, and physical activity.
* Calculate Body Mass Index by dividing a person’s weight in pounds by their height in inches squared times 703. The mathematical equation for BMI is: weight (lb)/height (in)2 x 703.
1

Introduction
ealth risks, the Department of Health (DOH) with the South Dakota
Education (DOE), started a
em. In addition, it
hool health and and school ls share their
Due to increasing rates of child obesity and its hin cooperation
partment of Deprocess during the 1998-1999 school year to collect data on the height and weight of students. The intent of this data collection effort was to start a data surveillance system of school-aged children. This report summarizes the data collected during the 2009-2010 school year and allows South Dakota to quantify the extent of the hildhood obesity problc
provides the data needed to address the prevention of childhood obesity and decrease it as a public health problem. Data Collection Process The Coordinated School Health Program sent
tters to all South Dakota sclephysical education teachersnurses requesting that schooheight and weight data with the DOH. Copies of this letter were also sent electronically to superintendents and building principals. Data collection instructions on the correct way to measure children and forms to submit data were posted on the project website, http://doh.sd.gov/SchoolWeight/. Electronic submission using the Infinite Campus system is preferred, but other formats are accepted and included in the results (Appendix 1). School participation in the data collection effort is voluntary and there is no payment for submitting data. South Dakota completed this project for the twelfth time during the 2009-2010 school year.
Comparison to Previous Reports
chool Height and Weight Report, For South Dakota Students, 1998-1999 School
ear is not comparable to any report
th
2006-2007 report the ategory definition for the 95th percentile
94th percentile changed from
The S
Ypublished after it. The 1998-1999 publication eported weight-for-height above the 95r
percentile for younger students and Body Mass Index or BMI above the 95th percentile for adolescents between 15 percent and 18 percent. For male students, the reference was through the age of 11 years 6 months and less than 57 inches tall. For females, the reference was through the age of 10 years and less than 54 inches tall. The available BMI standard could be used for students 14 to 18 years of age. Starting with the report for the 1999-2000 school year, the DOH used BMI-for-age as the criteria. Starting with the cand above changed from ‘overweight’ to ‘obese’ and the category definition for the 85th through‘at risk of overweight’ to ‘overweight’. These changes reflect the new recommended definitions for children and adolescents. The Centers for Disease Control and Prevention (CDC) reanalyzed all data along with this year’s data to the same standards and definitions. Comparisons are included in this report where possible.
2

3
Data Limitations
ata quality has been determined to be within cceptable standard deviation but has the
following limitations: First, schools voluntarily submitted height and weight data from across the state, but no attempt was made to obtain a representative sample (Appendix 2 and 3). However, school personnel collected data for 29.6 percent of the state’s students from 205 schools. While American Indian students comprise 16.0 percent of the South Dakota enrollment population, they represent 10.2 percent of the students surveyed. Second, the data was filtered and the following types of records were removed: data gathered prior to the 2009-2010 school year, data that had biologically implausible results, entries where all essential data elements were not completed, and duplicate records. After removing the above cases, the sample size was 40,945 students and 205 schools for analysis. Third, while the instructions included the type of equipment and technique that schools should use, there is no assurance that school personnel always followed the instructions. The DOH provided balance-beam scales and wall-mounted measuring boards to schools to help improve the quality of data. While it is not known what training persons who obtained the measurements had, it is known that school nurses or school health and physical education teachers obtained or supervised the data collected. Fourth, South Dakota’s height data are of acceptable quality, however, worldwide measurements of height tend to be of marginal quality. There could be several possible reasons for this including the use of m
measuring equipment that did not allow accurate heights to be obtained. This can occur when the person doing the measuring is shorter than the person being measured. Those who measure adolescents may need to stand on a step stool or a chair to have their eye level above the child’s head. In addition, if the measuring stick on a standing scale was used, the children would be inaccurately reported as shorter than they are. South Dakota should be aware of this problem when determining heights. This may be solved now as adolescent height is more normal but this may explain the high level of short stature for the 1998-1999 school year. Measurement Requirements The DOH is able to provide school specific data, aggregate data in this report, and county specific data to schools who submitted measurements on 100 or more students. Schools submitting data on less than 100 students are given the aggregate data in this report and county specific data, provided there are 100 or more student measurements from all schools in that county. Provided again this year is a 3-year trend analysis for schools that have been unable to obtain measurements on 100 or more students for the past 3 years. The CDC determined that small numbers do not produce stable rates, so they have established the 100-student cut-off.
Da
4
1
Source: South Dakota Department of Health Note: Year represents the end of school year, i.e. 2009 is for school year 2008-2009, etc.
cenFigure
Height-for-Age Below 5th Per tile 2001-2010, by Age
0.0%
1.0%
2.0%
3.0%
0%4.
5.0%
6.0%
7.0%
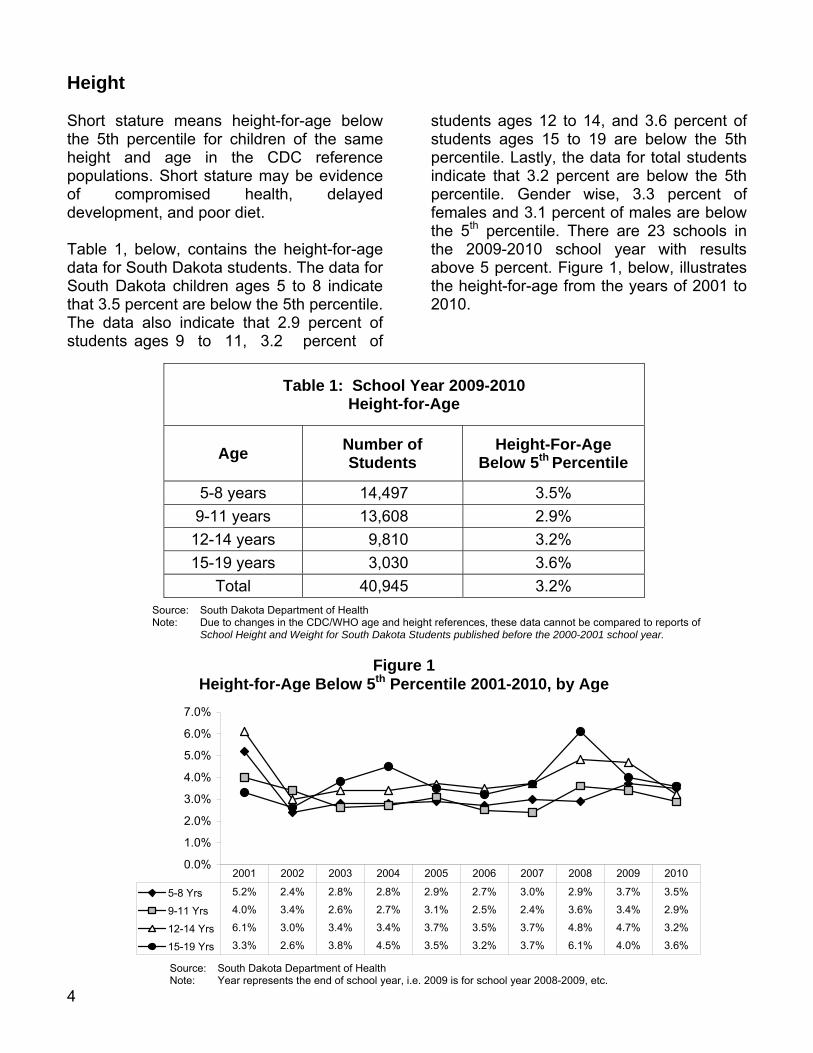
5-8 Yrs 5.2% 2.4% 2.8% 2.8% 2.9 2.7% 3.0% 2.9% 3.7% 3.5%%
9-11 Yrs 4.0% 3.4% 2.6% 2.7% 3.1 2.5% 2.4% 3.6% 3.4% 2.9%%
12-14 Yrs 6.1% 3.0% 3.4% 3.4% 3.7 3.5% 3.7% 4.8% 4.7% 3.2%%
15-19 Yrs 3.3% 2.6% 3.8% 4.5% 3.5 3.2% 3.7% 6.1% 4.0% 3.6%
200 2006 2007 2008 2009 2010
H Sthh the CDC reference populationsof compromised health, delayed d TdSthTsstudents ages 12 to a ge11ss
sspinpfeththath2
a-A e
eight
hort stature means height-for-age below e 5th percentile for children of the same
eight and age in
tudents ages 12 to 14, and 3.6 percent of tudents ages 15 to 19 are below the 5th ercentile. Lastly, the data for total students dicate that 3.2 percent are below the 5th ercentile. Gender wise, 3.3 percent of males and 3.1 percent of males are below e 5th percentile. There are 23 schools in e 2009-2010 school year with results bove 5 percent. Figure 1, below, illustrates e height-for-age from the years of 2001 to 010.
r 2009-2010
. Short stature may be evidence
evelopment, and poor diet.
able 1, below, contains the height-for-age ata for South Dakota students. The data for outh Dakota children ages 5 to 8 indicate at 3.5 percent are below the 5th percentile. he data also indicate that 2.9 percent of tudents ages 9 to 11, 3.2 percent of
Table 1: School YeHeight-for
g
%
2001 2002 2003 2004 5
Age Number ofStudents
Height-For-Age
Below 5th Percentile
5-8 years 14,497 3.5%
9-11 years 13,608 2.9%
12-14 years 9,810 3.2%
15-19 years 3,030 3.6%
Total 40,945 3.2%
Source: South Dakota Department of Health Note: Due to changes in the CDC/WHO age and heig
School Height and Weight for South Dakota Studeht r
neferences, these data cannot be compared to reports of ts published before the 2000-2001 school year.
5
Table 3: School Year 2009-2010 Underweight,
Low Body Mass Index, for Age
Age
Number of Students
Body Mass Index Below 5th Percentile
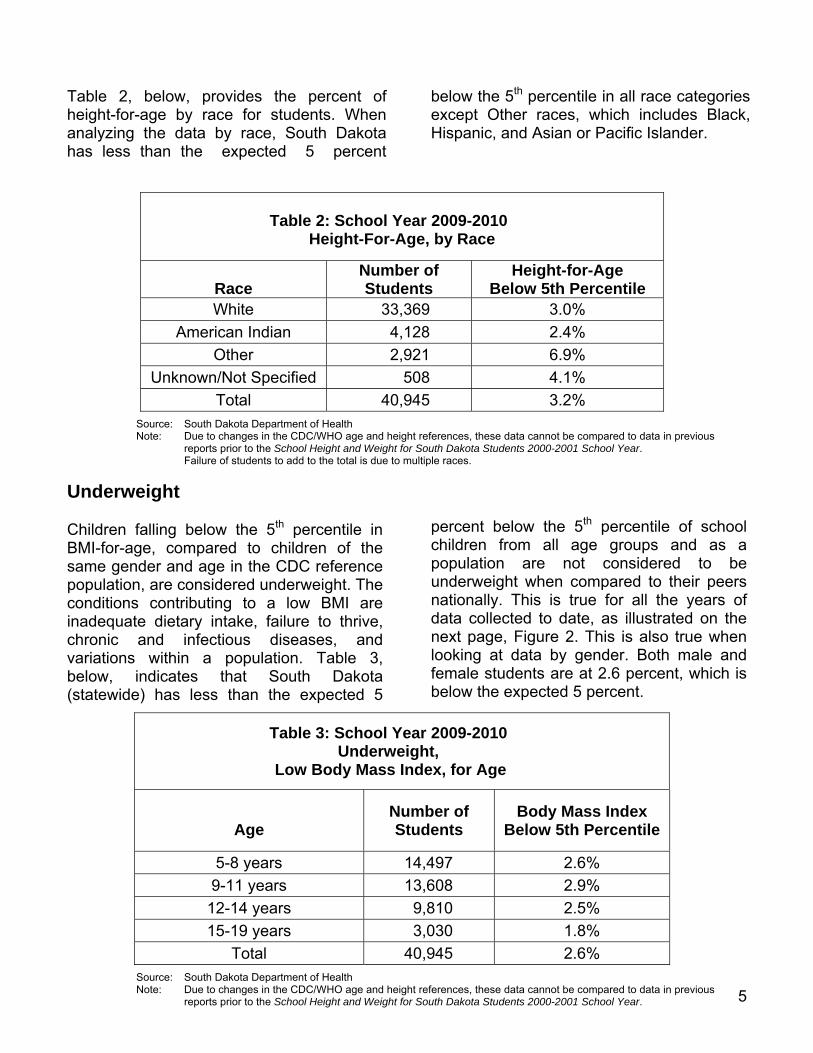
5-8 years 14,497 2.6%
9-11 years 13,608 2.9%
12-14 years 9,810 2.5%
15-19 years 3,030 1.8%
Total 40,945 2.6%
SourceNote: Due to changes in the CDC/WHO age and height references, these data cannot be compared to data in previous
reports prior to the School Height and Weight for South Dakota Students 2000-2001 School Year.
below, provides the percent of elow the 5th percentile in all race categories
nderweight
hildren falling b percentileMI-for-age, com ildren of tame gender and DC referenopulation, are considered underweight. ond ions contributing to a low BMI are adequate ry
hronic and invariations within a population. Table below, indicates(statewide) has lecent
percent below the 5th percentile of school children from all age groups and as a population are not considered to be underweight w mpared to their peers nationally. This is true for all the years of
n the n
ent.
able 2: School Year Age,
Table 2,height-for-age by race for students. When analyzing the data by race, South Dakota has less than the expected 5 percent
T
bexcept Other races, which includes Black, Hispanic, and Asian or Pacific Islander.
2009-2010 by Race
: South Dakota Department of Health
U C elow the 5
pared to ch
th in he B
s age in the C ce p The c itin dieta intake, failure to thrive,
fectious diseases, and data collected to date, as illustrated onext page, Figure 2. This is also true whec
Height-For-
Race
NumStud
ber oents
f
Height-for-Age Below 5th Percentile
White 33,369 3.0%
American Indian 4,128 2.4%
Other 2,921 6.9%
Unknown/Not Spe 4.1% cified 508
Total 40,945 3.2%
Source: South Dakota Department of Health Note: Due to changes in the CDC/WHO ferences, thes to data in previous
reports the School Height th Dakota St ear. Failure of students to add to the to iple races.
age and height re and Weight for Soutal is due to mult
e data cannot be comparedudents 2000-2001 School Y prior to
3, looking at data by gender. Both male and fe that South Dakota
ss than the expected 5 male students are at 2.6 percent, which is
below the expected 5 perc
hen co

Table 4 provides the percent of underweight
When the data is analyzed y race, South Dakota again has less than
5 percentile in each race category. owever, there are 17 schools in the 2009-010 school year with results above 5
l Yeaweig Ind
students by race.bthe expected 5 percent below the
Table 4: SchooUnder
Low Body Mass
th
H2percent.
r 2009-2010 ht, ex, by Race
Age
NumbStude
er nt
of s
Body Mass Index Below 5th Percentile
White 33,369 2.7%
American Indian 4,128 1.5%
Other 2,921 3.6%
Unknown/Unspecified 508 2.6%
Tota l 40,945 2.6%
Source: South Dak artment of Health Note: Due to changes i HO age and height es, these data cannot be c data in previous
report ool Height and Weight for South Dakota Students 2000-2 l Year. Failur dd to the total is due to multiple races.
HO age and height es, these data cannot be c data in previous report ool Height and Weight for South Dakota Students 2000-2 l Year.
Failur dd to the total is due to multiple races.
ota Depn the CDC/W
s prior to the Sch of students to a
the CDC/Ws prior to the Sch of students to a
re rencre rencfefe oompared to 001 Schoo
mpared to 001 Schoo
ee
Source: South Dakota Department of Health Source: South Dakota Department of Health Note: Year reNote: Year represents the end of school year, i.e. 2009 is for school year 2008-2009, etc.
Figure 2 Underweight Weight-for-Height 2001-2010, by Age
0.0%
0.5%
1.0%
1.5%
2.0%
2.5%
3.0%
3.5%
5-8 Yea 2.5% 3.2% 2.5% 2.5% 2. 9% 2.6%rs 2.7% 3.1% 2.4% 8% 2.
9-11 Year 2.5% 3.0% 2.4% 2.7% 2. 9% 2.9%s 3.1%2.2% 2.6% 7% 2.
12- 2.4% 2.4% 2.3% 2. 7% 2.5%14 Years 3.0% 1.5%2.0% 2.3% 9% 2.
15- 2.2% 1.9% 1.7% 2. 8% 1.8%
2002 2003 200 2006
19 Years 2.0% 1.5% 1.7%
2001 4 2005 2007 2 09 2010008 20
1.6% 4% 1.
6

Overweight and The DOH began using the definitions of overweight and obese beginning with the 2006-2007 report to describe elevated BMI-for-age for children and adolescents. BMI-for-age is the preferred term to describe children and adolescents. For adults, just a BMI value is used, but as children grow at different rates depending upon age and gender, the BMI value is plotted on growth charts. The resulting value of BMI-for-age is given as a percentile value. The American Medical Association, along with the U.S. Department of Health and Human Services and the Centers for Disease C ed an exp
commendations on the assessment, revention, and treatment of child and youth
for-age is between the 85th and 94th percentile in the CDC reference population of children matched for age and gender, the term to describe the child is “a child is at or above the 95thchildren of that age and genddescribe the child is “obese”. The terms overweight and obese provide continuityadult definitions of overweight and obese.
One of the objectives of the national Healthy People 2010 initiative is to “reduce the proportion of children and adolescents who are overweight or obese.” This is defined as, “at or above the gender- and age-specific 95th percentile of BMI based on a preliminary analysis of data used to construct the year 2001 U.S. Growth Charts.” Throughout this report, the term obese is used to indicate children and adolescents who meet the criteria for the Healthy People 2010 objective. The target in each of the four age groups is 5 percent or less. The DOH also identified a goal to “reversing
cing the percent of school-age children and adolescents who are at or above the 95th percentile BMI for
he prevalence of obesity has dramatically sen among children in the United States, articularly among minority populations.
ultiple causes of childhood ity, most of which are associated with
nal habits and inactivity. onditions of obesity and overweight are
icult an t and cure. The y to a epidemic will
e to prevent this c ndition in children.
ble 5, on the n ge, provides the BMI-r-age statistics uth Dakota students. e data show for each of the age oups, South D needs to substantially duce the num f obese children and
dolescents to meet the Healthy People
Obese
ontrol and Prevention, convenert committee to develop the trend and redu
repoverweight and obesity. This expert panel representing 15 professional organizations recommended changing the terms used to describe pediatric obesity. If a child’s BMI-
age (obese) to 15 percent by 2010.” That goal was recently updated to 14 percent by 2020. Tri
overweight”. If There are m percentiler, the term to poor nutritio
e for obes
to diffke
p
Cd expensive to trea
ddressing this national b o Ta ext pafo for SoThgr
s that akota
re ber oa2010 objective of 5 percent.
7

igures 3 - 6 illustrate each age group’s
nts ages 15 to 19 show the most hange compared to statewide rates with
Table 5: School Year 2009-2010 Overweight and Obese
Body Mass Index r Age
Fobese rate by year, compared to that year’s rate of all students at the 95th percentile and above. When compared to statewide rates, students ages 9 to 14 are consistently higher tly,
fo
higher than the group as a whole each year, while 5 to 8 year olds are repeatedly lower. Studecsome years being higher and some lower.
Age
Number of Students
Overweight
Obese
Overweight and
Obese Combined
5-8 years 14,497 16.6% 13.4% 30.0% 9-11 years 13,608 16.6% 17.3% 33.9%
12-14 years 9,810 17.0% 17.4% 34.4% 15-19 years 3,030 16.4% 18.3% 34.7%
Total 40,945 16.7% 16.0% 32.7%
Source: South Dakota Department of Health Note: Due to changes in the CDC/WHO age and h
reports prior to the School Height and Weigh
eight ret for So
Note: Year represents the end of school year, i.e. 2009 is for school year 2008-2009, etc.
ferences, these data cannot be compared to data in previous uth Dakota Students 2000-2001 School Year.
Figures 3-6 Source: South Dakota Department of Health
Figure 3: Obese 5-8 Year Olds Compared to State Totals, 2001-2010
14.4%14.5%15.7%
13.5%14.2% 13.0%14.3%
15.5%13.9%13.4%
16.3%16.3%16.9%16.4%15.8%16.6%16.0%17.8% 16.6%16.0%
2001 2002 2003 2004 2005 2006 2007 2008 2009 2010
0.0%
5.0%
10.0%
15.0%
20.0%
25.0%
5-8 yr olds Total
Figure 4: Obese 9-11 Year Olds Compared to State Totals, 2001-2010
20.1%
17.3%18.0%17.7%18.4% 18.1%
17.2%17.7% 18.1%17.17.8%
0%
0%
3%
16.9%16.4%15.8%
16.6%16.0% 16.3% 16.6% 0%
0.
5.
10.
15.
20.
25.
16.3% 16.
0%
0%
0%
2001 2002 2003 2004 2005 2006 2007 2008 2009 2010
0%
9-11 yr olds Total
Figure 5: Obese 12-14 Year Olds Compared to State Totals, 2001-2010
17.1%16.5%17.0%18.4%
17.6%19.2%
16.9% 16.8%
18.5%
17.4%
17.8%
16.0%16.6%
15.8% 16.4%16.9%
16.3% 16.3%16.6%
16.0%
0.0%
5.0%
10.0%
15.0%
20.0%
25.0%
2001 2002 2003 2004 2005 2006 2007 2008 2009 2010
12-14 yr olds Total
Figure 6: Obese 15-19 Year Olds Compared to State Totals, 2001-2010
15.9%
16.8%
15.0%
14.9%
16.0%16.7%
18.5%
17.4%
17.0%18.3
16.9%16.4%
15.8%
16.6%
16.0%
17.8%
16.3%
16.3%
16.6%16.0%
.0%
.0%
.0% %
0.0%
5
10
15
20
25 %
2001 2002 2003 2004 2005 2006 2007 2008 2009 2010
.0%
.0
HP 2010 Goal 5% HP 2010 Goal 5%
HP 2010 Goal 5% HP 2010 Goal 5%
15-19 yr olds Total
8

9
hen comparing the body mass index by ce in Table 6, below, 16.2 percent of hites and 19.6 percent of American Indians ere between the 85th percentile and 94th ercentiles, or were overweight. The data
also indicate that 14.5 percent of whites and
and 26.0 percent of American Indians were above the 95th percentile, or were obese. This is a decrease for both white and American Indian students when compared to the obese percentages from the 2008-2009 school year.
Table 6: School Year 2009-2010 Overweight and Obese Body Mass Index, by Race
Wrawwp
Race
Number of Students
Overweight
Obese
Overweight and Obese Combined
White 33,369 16.2% 14.5% 30.7%
American Indian 4,128 19.6% 26.0% 45.6%
Other 2,921 16.7% 17.5% 34.2%
Unknown/Not Specified 508 18.1% 17.1% 35.2%
Total 40,945 16.7% 16.0% 32.7%
Table 7, below, shows the number of student measurements taken from 2001 to 2010 with the percent overweight and obese. The table also displays the data by gender.
As the table shows, females have consistently had a higher overweight percentage than males, while males have had a higher obese percentage than females.
Total Female Male
Year
# of Students
Overweight
Obese
# of Students
Overweight
Obese
# of Students
Overweight
Obese
2010 40,945 16.7% 16.0% 19,735 16.7% 14.6% 21,210 16.7% 17.3% 2009 40,202 17.0% 16.6% 19,412 17.1% 15.5% 20,790 17.0% 17.6% 2008 37,028 16.8% 16.3% 17,931 17.2% 14.5% 19,097 16.4% 17.9% 2007 41,579 16.6% 16.3% 20,359 16.9% 14.7% 21,220 16.3% 17.8% 2006 45,251 16.9% 16.9% 21,948 17.3% 15.3% 23,303 16.5% 18.3% 2005 35,489 16.6% 16.4% 17,295 16.7% 14.8% 18,194 16.6% 17.8% 2004 27,418 16.2% 15.8% 13,278 16.1% 14.3% 14,140 16.3% 17.2% 2003 19,424 16.7% 16.6% 9,518 17.0% 15.1% 9,906 16.4% 18.0% 2002 15,559 16.5% 16.0% 7,522 16.5% 14.5% 8,037 16.5% 17.3% 2001 12,285 15.9% 17.8% 6,002 16.1% 16.2% 6,283 15.6% 19.3%
Table 7: School Year 2001-2010 Overweight and Obese Body Mass Index, by Gender
Source: South Dakota Department of Health Note: Due to changes in the CDC/WHO age and height references, these data cannot be compared to data in previous reports prior to the
School Height and Weight for South Dakota Students 2000-2001 School Year. Failure of students to add to the total is due to multiple races.
Source: South Dakota Department of Health Note: ‘Year’ represents the end of school year, i.e. 2009 is for school year 2008-2009, etc.
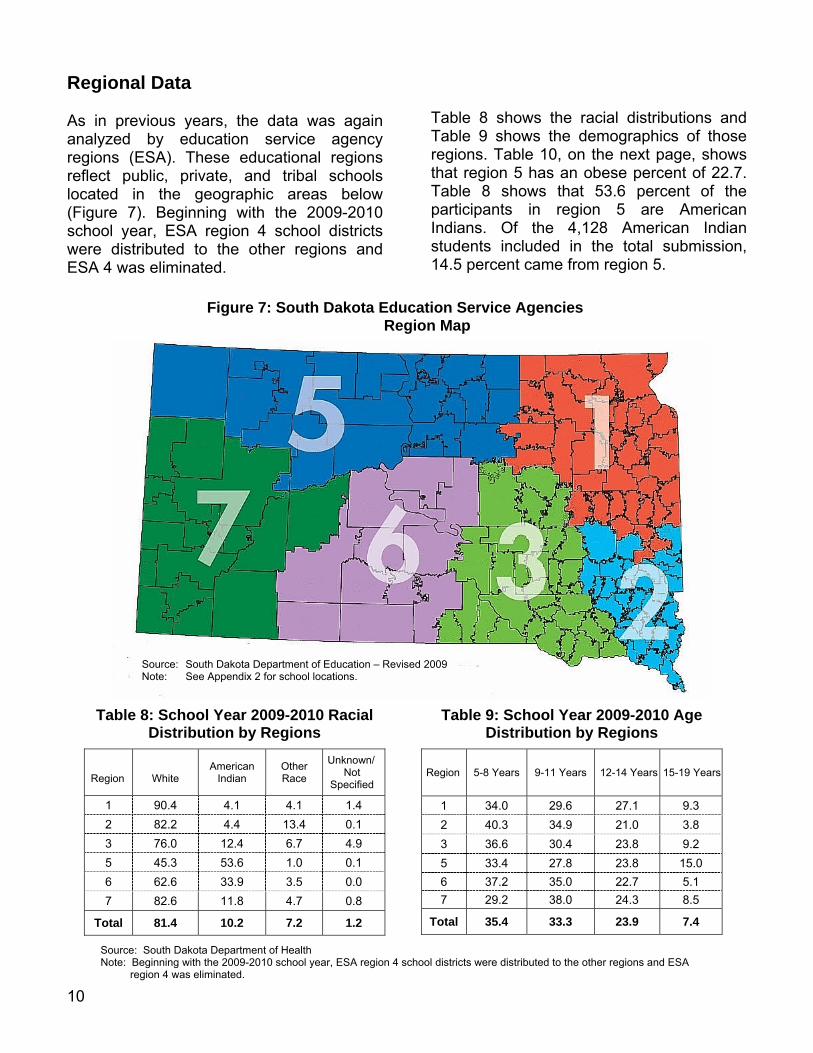
Regional Data As in previous years, the data was again analyzed by education service agency regions (ESA). These educational regions reflect public, private, and tribal schools located in the geographic areas below (Figure 7). Beginning with the 2009-2010 school year, ESA region 4 scwere distributed to ESA 4 was eliminated.
ws that 53.6 percent of the participants in region 5 are American
e 4,128 American Indian e total submission,
Table 8: School Year 2009-2010 Ra
t y s
gion
can n
Un
Sp
hool districts Indians. Of ththe other regions and students included in th
14.5 percent came from region 5.
Table 8 shows the racial distributions and Table 9 shows the demographics of those regions. Table 10, on the next page, shows that region 5 has an obese percent of 22.7. Table 8 sho
Re
cialDis ribution b
Region
WhiteAmeri
IndiaOther Race
known/ Not ecified
1 90.4 4.1 4.1 1.4
2 82.2 4.4 13.4 0.1
3 4 76.0 12. 6.7 4.9
5 6 45.3 53. 1.0 0.1
6 9 0.0 62.6 33. 3.5
7 8 0.8 82.6 11. 4.7
Total 2 1.2 81.4 10. 7.2
Table 9: School Year 2009-2010 Ageibu R
on 9-1 12 15-1
Distr tion by egions
Regi 5-8 Years 1 Years -14 Years 9 Years
1 34.0 29.6 27.1 9.3
2 40.3 34.9 21.0 3.8
3 36.6 30.4 23.8 9.2
5 15.0 33.4 27.8 23.8
6 35.0 37.2 22.7 5.1
7 38.0 29.2 24.3 8.5
Total 35.4 33.3 23.9 7.4
Figure 7: S ta E ice Agencies Region Map
outh Dako ducation Serv
Source: Sout Note: See
h Dakota Department of Education – Revised 2009 Appendix 2 for school locations.
S rce: South Dakota Department of Health ouNote: Beginning with the 2009-2010 school year, ESA region 4 school districts were distributed to the other regions and ESA region 4 was eliminated.
10

17.6
13
19.7
.6
22.7
.0
.0
0
15.0
25.0
30.0
15.9 14.9
20.0
0
5
10.
Obese Low CI Hi
igure 8, below, shows that region 7 is the nly region that is significantly below the
state low confidence interval rate of 15.6 percent. Regions 3 and 5 are significantly
igher than the state rate.
Regions 1, 2, and 6 are not significantly different as they fall into the statewide range of 15.6 to 16.4 percent. See page 19 for an explanation of confidence interval rates.
Table 10: School Year 2009-2010 Overweight and Obese ex, b
gh CI
Fo
h
Body Mass Ind
y Regions
Region
Number of Students
Overwe
Obese
Overweight/Obese Combined
ight
1 11,165 17.1% 15.9% 33.0%
2 12,038 16.7% 14.9% 31.6%
3 5,792 17.5% 19.7% 37.2%
5 1,119 18.8% 22.7% 41.5%
6 37.0% 2,588 19.4% 17.6%
7 8,243 14.5% 28.1% 13.6%
Total 40,945 16.7% 16.0% 32.7%
Source: South Dakota Department of Health Note: Beginning with the 2009-2010 school year, ESA region 4 school districts were distributed to the other regions and ESA region 4 was eliminated.
Figure 8: School Year 2009-2010 Obese Body Mass Index for Age, by Regions with Confidence Intervals
akota Department of Health region 4 school districts were distributed to the other six regions and
Source: South DNote: For the 2009-2010 school year, ESA ESA region 4 was eliminated.
Reg
ion
1
Reg
ion
2
Reg
ion
5
Reg
ion
7 6
Reg
ion
3
Reg
ion
State Low C te 15.6I Ra % State High te 16.CI Ra 4%
11
Obesity Risk Obesity is a risk factor r the following conditions in adul iovasculadiseas hyperte diadegenerative joint disease, and psychological problems. Although com hought oan adul isease, ob a growproblem in children and adolescents andconsequences are increasingly being seNumerou tudies show ric obesitassociate with the ed riskspsycholo al and ps c problecardiovascular risk factors, chronic inflammatio
esearch shows that 60 5- to 10-year-old
hildren already have at least one risk factor
quently found in overweight children and overweight children also have m
nd orthopedic complicationhildren are taller and mature earlier than on-overweight children. (Dietz, Pediatrics 01 Suppl, March 1998).
he most widespread consequences of besity in children are psychological. With a ulture that generally prefers thinness, obese hildren are targets of early and systematic iscrimination. They have fewer friends and re regarded as lazy or sloppy. Obese dolescents develop a negative self-image. hildren who m e early te o have loelf-esteem. (D , Pediat 101 Suarch 1998).
Having excess weight during childhood increases ll be
se dult JM: 7;3 73) repo percent
of obes en 6 to 10 years will be obese at age 25, 83 percent of ob dren 10-15 years will be obese at age 25, and 77 percent of obese adolescents 15 rs will be obese a 5. For child weight, the percentages are 55, 75, and 67 respectively. Overweight and obesity in childhood and adolesc ve also be ciated with adverse socioeconomic outcomes in
Comparison to Other Data Height and weightnsSN S). When the new obese definition is applied to data from earlier national health examination
children as relatively stable from
the 1960s to 1980. However, from NHANES II (1976-80) to NHANES III, the prevalence of obesity nearly doubled among children and adolescents. In the time interval between NHANES II and III, the prevalence of obesity among children ages 6-11 years increased from an estimated 7 percent to 11 percent, and among adolescents ages 12-19 years, increased from 5 percent to 11 percent. NHANES IV results for 2003-2004 indicated that 18.8 percent of children, ages 6 to 11 were obese and 17.4 percent of adolescents ages 12 to 19 were obese.
Factors
fo
thood: cardnsion,
r e, betes, obe
199monly t f as
t d esity is ing its en.
s s pediat y is d increas of gic ychiatri ms,
n, type 2 diabetes mellitus, and asthma. (Krebs, Pediatrics 120 Suppl, adulthood.
December 2007) Rpercent of overweightcfor heart disease, including hyperlipidemia and elevated blood pressure or insulin levels. Type 2 diabetes, a disease that typically appears in adults, is increasing at alarming rates among children and adolescents. Liver disorders are more fre
ore hypertension, sleep apnea, s. Overweight
surveys, it is apparent that obesity in and adolescents wa
cn1 ToccdaaC atur
ietznd trics
wer ppl, s
M
the chance that the person wi. Wh (NEas an a
37-869-8itaker et alrted hat 69t
e childrese chil
-18 yeat age 2 ren over
ence ha en asso
data were measured ationally in a series of representative urveys (National Health Examination urvey-NHES and National Health and utrition Examination Survey-NHANE
12
Another recent NHANES survey found that g children and
dolescents showed no significant changes
ng and increasing
hysical activity and decreasing inactivity.
Care must also be taken not to encourage weight preoccupation, inappropriate eating habits, and extreme amounts of exercise
is d s
ta e g ut s
obesity prevalence amonabetween 2003-2004 and 2005-2006. The current NHANES survey reports 18.7 percent for 6-19 year olds, 19.6 percent for 6-11 year olds, and 18.1 percent for 12-19 year olds. (Ogden CL, Carroll MD, Curtin LR, Lamb MM, Flegal KM: Prevalence of High Body Mass Index in US Children and Adolescents, 2007-2008 JAMA. 2010; 303(3):242-249) By using the Pediatric Nutrition Surveillance System or PedNSS, the DOH has collected height and weight data of infants and children participating in the South Dakota Supplemental Nutrition Program for Women, Infants, and Children (WIC) since 1995. WIC serves children under the age of 5 who are at nutritional risk and are from families with limited incomes. The 2009 rate for those at or above the 95th percent for BMI-for-age, ages 2 to 5 years was 16.4 percent, up from 16.2 percent in 2008. Prevention of Child Overweight andChild Obesity
Child overweight and child obesity is a multi-faceted problem that should be addressed bypromoting healthy eatipWhile it will take all South Dakotans working together to overcome this increasing problem,schools can play a key role in providingeducation and healthy environments.
associated with eating disorders in youth.While overweight and obese are used in threport, choosing language to inform the chiland family should be more neutral, such ausing “weight” , “excess weight”, and “BMI.” Based on the school height and weight dasubmitted, some South Dakota schools havsuccessfully worked to reverse the increasintrend in overweight children. For ideas abowhat these schools can do, see the schooltab on www.HealthySD.gov. School WellnesPolicies can be a great tool for creating healthier e
s
nvironments. For help in creating a school wellness policy, go to
ellnesspolicy.ahttp://doe.sd.gov/schoolhealth/wsp While prevention should be the goal, recognize that individual children may need specific plans of care. Schools are encouraged to work with their local health care providers to define when and how referrals for further evaluation and intervention are made for individual students.
13

What Everyone Can Do
Set a good example by being physicallyactive and eating a healthy, balancedintake high in fruits, vegetables, and whole grains.
Advocate for convenient, safe, andadequate places for young people to playand take part in physical activity programs.
Support daily physical education and other school programs that promote lifelong healthy eating and physical activity, not just
s
y p l
r
in the Park activities at
competitive sports.
Urge parent associations and school clubto sell healthy foods or non-food items forfund-raising activities.
Join a school health or nutrition advisorcouncil, such as Team Nutrition, to helguide nutrition policy and educationaprograms.
Access walking and bicycling trails in youcommunity and area parks.
Participate in Walk South Dakota state parks. For a schedule listing, go to http://gfp.sd.gov/calendar.aspx
Participate in Action for Healthy Kids network to improve the health and educational performance of children through better nutrition and physical activity in schools. http://www.action forhealthykids.org/
W
Learn what your children want from physical
mit television watching or video games to
hat Parents Can Do
Provide children with healthy food choices for meals and snacks.
Encourage children to be physically active.
Involve children in selecting and preparing food.
activity programs and help choose appropriate activities.
Volunteer to help children’s sports teams and recreation programs.
Make physical activity a fun, family event.
Serve as a role model for your children by eating a variety of healthy foods.
Play and be physically active with children.
Li no more than two hours per day.
Research shows six science-based strategies to prevent obesity and other chronic d
Research shows that children must be offered a food 9-15 times before they will try it.
Continue to offer a new food and eventually they are likely to try it.
iseases: Increase physical activity Decrease television viewing Increase fruit and vegetable intake Decrease sweetened beverage intake Decrease portion sizes Increase breastfeeding
14

W
in school and at
h, physical
ches Can Do
an be downloaded or
hat Students Can Do
Make healthy choices in the school cafeteria, when packing lunch, and for snacks.
Walk to school where possible.
Set goals for increasing your physical activity and monitor your progress.
Encourage friends and family members to be physically active and to eat healthfully.
Use protective clothing and proper equipment to prevent injuries and ill-nesses.
Encourage the student council to ad-vocate for physical education classes and after-school programs that are attractive to all students and to request healthy food choicesschool events.
Take elective courses in healteducation, cooking, and nutrition.
Limit television watching or computer games to no more than two hours per day.
What Teachers & Coa
Team Nutrition provides a wealth of information that cordered without charge. http://doe.sd.gov/cans/teamnutrition.asp
Use the South Dakota Health Education Content Standards and the South Dakota Physical Education Content Standards as guides for curriculum planning. http://doe.sd.gov/oess/cans/nutrition/index.asp
Contact Coordinated School Health in
m and
the Departments of Education and Health for technical assistance in selecting quality curriculuincreasing physical activity. http://doe.sd.gov/schoolhealth/index.asp
Promote walking or biking to school and participate in the “South Dakota Walk-n-
Roll to School” program.http://doe.sd.gov/schoolhealth/schoolwalk.asp
Offer healthy, appealing foods wherever food is available and discourage the availability of foods high in fat, sodium, and added sugars (such as soda, candy, and fried chips) at school functions and trips and as part of fund-raising activities.
competition.
Help students become competent in many motor and behavioral skills.
Provide nutrition education through activities that are fun, participatory, developmentally appropriate, and culturally relevant. Activities should emphasize the positive, appealing aspects of healthy eating rather than the harmful effects of unhealthy eating.
Emphasize activity and enjoyment over
Turn-off TV Week is a national awareness campaign that encourages
Americans to turn off the TV and media for seven days and use that time to take
part in other activities.
InW
www.H
2011, National Turn off the TV
eek will be promoted April 18-24 & September 18-24 through ealthySD.gov and state partners.
15
Provide opportunities for all children, to participate in quality physical educationclasses every school day. For informationregardi
ng physical activity standards, analyze the training events and a tool to
quality of current curriculum, see http://doe.sd.gov/schoolhealth/index.asp.
Work with food nutrition managers,coaches, physical education teachersand other staff to coordinate nutritioneducation
,
efforts and give students
good nutrition and physical activity
in physical activity
cipline or
ude in teaching a discussion of body image and societal pressures, especially f
efore and afchool orks best for yo
W
ontinuing education opportunities
l of
ds corating the
consistent messages about healthyeating.
Model habits.
Involve physical activity when teaching ina classroom setting.
Involve families and communitorganizations
y Apply for the Healthier U.S. SchooChallenge from the U.S. Department Agriculture.
Support classroom lessons by offering footo illustrate key messages and de
programs.
Refrain from using food to disreward students.
Request healthy snacks for class parties.
Incl
c
or young girls.
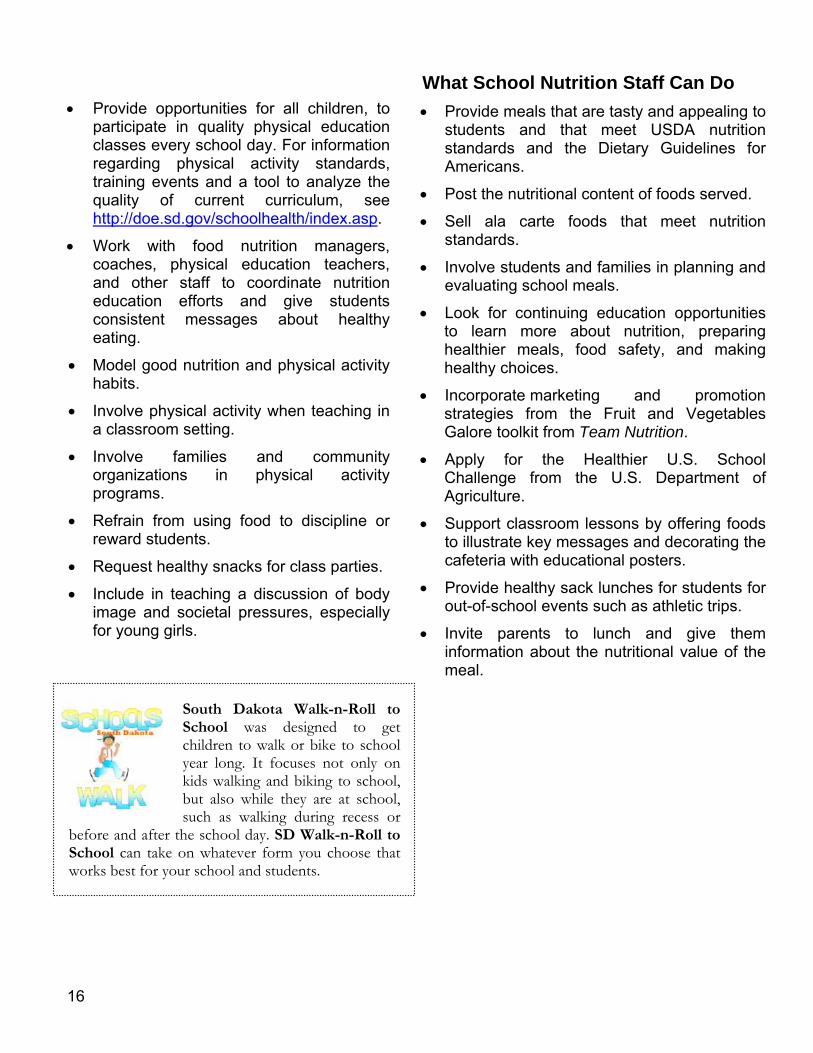
South Dakota WSchool wa
bi
such as walking during recess or
alk-n-Roll s designed to get
ike to school ot only
king to sch at school,
ter the school day. SD Walk-n-Roll to can take on whatever form you choose that
ur school and students.
to
children to walk or byear long. It focuses nkids walking andbut also while they are
on ool,
bSw
hat School Nutrition Staff Can Do
Provide meals that are tasty and appealing tostudents and that meet USDA nutrition standards and the Dietary Guidelines for Americans.
Post the nutritional content of foods served.
Sell ala carte foods that meet nutrition standards.
Involve students and families in planning andevaluating school meals.
Look for cto learn more about nutrition, preparinghealthier meals, food safety, and making healthy choices.
Incorporate marketing and promotion strategies from the Fruit and Vegetables Galore toolkit from Team Nutrition.
afeteria with educational posters.
Provide healthy sack lunches for students for out-of-school events such as athletic trips.
Invite parents to lunch and give theminformation about the nutritional value of the meal.
16

17
What School Administrators & Board Members Can Do
Organize a school health or nutrition advisory committee that includes all key groups.
Allocate adequate time for nutrition education as part of a sequential, comprehensive health education program.
Make schools available to the public to use for walking.
Require health education and daily physical education for students in grades K-12.
Encouraglimit serviportions.
Become and acces
Provide time during the day, such as recess, for unstructured physical activity, such as walking or jumping rope.
hey were in
er healthy
igh-fat, high-sugar
ity
lth promotion programs
ol
ng. http://doe.sd.gov/contentstandards/
Did you know? 81.0 percent of S.D. High School Students did not attend physical education classes daily (when tschool) as compared to 66.7 percent nationally?
Source: 2009 SD YRBS and 2009 National YRBS
Stock vending machines with 100 percent fruit juice and othsnacks; make sure that healthy foods are served at school meetings and events.
Limit the sale of h
Coordinated School Health has developed a monthly communications network for
fessional development
g promoting physical activity and
choolhealth/newsinfused/i
snacks during mealtimes and at fund-raisers.
Hire qualified physical activ
informing all public, private, BIE and tribal school districts about current health issues,
available resources, prospecialists and coaches, food service and nutrition education staff.
Provide hea
and funding opportunities. Information focuses on Coordinated School Health priority areas includin
nutrition, HIV prevention, and tobacco prevention. To view past issues online, go to
http://doe.sd.gov/s
for faculty and staff.
Evaluate school nutrition and physical activity programs using the Schondex.asp Health Index.
Use the S.D. Health Education Content Standards and the S.D. Physical Education Content Standards as guides for curriculum planni
Use Fit, Healthy, and Ready to Learn to help write school health policy. http://nasbe.org/index.php/shs/53-
e food service staff to ng sizes to recommended
a Team Nutrition school s information available.
Provide adequate time and space for students to eat meals in a pleasant, safe environment.
shs-resources/396-fit-healthy-and-ready-to-learn-a-school-health-policy-guide
Utilize the “Strides to a Healthier Worksite” guide that will take you step by step on how to start a worksite wellness program in your school. http://www.healthysd.gov/Workplace/PDF/WorksiteToolkit.pdf

18
Evaluate children and olescents with constructive
screens and refer as appropriate for intervention.
What School Nurses & HealthProfessionals Can Do
Measure height and weight accurately and use the CDC growth charts to screen children and adolescents.
Provide anticipatory guidance toparents and children regarding healthy eating and physical activity habits. ad
Include in teaching a discussion ofbody image and societal pressures especially for young girls.
View information from “Obesity in South Dakota a Clinical Toolkit for Healthcare Providers” to helpaddress weight issues in patients.
www.healthysd.gov/HealthProfs/obesitytoolkit.aspx
Did you know?
servings of
Only 15 percent of South Dakota high school students ate 5 or morefruits and vegetables per day during thepast seven days?
What Communities Can Do
lthier Communievaluate your community. http://www unitie
Utilize the “Strides to a Heaty” planning guide to
.healthysd.gov/Comms/pdf/StridesHealthyCommunity.pdf
Provide a mix of competitive team g
fitness and recreation activities.
r-school programs for
re that
tivity
sports and noncompetitive, lifelon
Increase the availability of parks,public swimming pools, hiking and biking trails, and other places for physical activity, including sidewalks.
Ensure that coaches have appropriate coaching competencies.
Provide aftechildren.
Work with schools, businesses, and community groups to ensulow-income young people have transportation to and appropriate equipment for physical acprograms.
Participate in South Dakota Great Day of Play.
South Dakota Great Day of Play is an annual event that encourages all people to get outside and ‘play’ by being physically active. The first South Dakota Great Day of Play was held in August of 2007 in collaboration with the S.D. Parks and Recreation Association and the state parks, which provided various activities to promote physical activity. Look to www.HealthySD.gov for 2011 events and opportunities for hosting activities.
Source: 2009 SD Youth Risk Behavior Survey

19
Technical Notes Height- Short stature is defined as a height-for-age below the 5th percentile for children of the same height and age in the reference populations used by the CDC. Children grow at different rates depending upon age and gender. The BMI value is plotted on growth charts, and the resulting value of BMI-for-age is presented as a percentile value. Underweight- Children falling below
reference
the 5th percentile in BMI-for-age, compared to children of the same gender and age in the CDC population, are considered underweight. Overweight- If a child’s BMI-for-age is between the 85th and 94th percentile in the CDC reference population ochildren matched for age and gender,
f
e child is considered to be verweight.
O
tho
bese- If a child is at or above the 95th percentile for children of that age and gender, the child is considered to be obese. Obesity- Obesity is an excessively high amount of body fat or adipose tissue in
lation to lean body mass. Adults with
verweight, while adults with a BMI of 0 or more are considered obese.
onfidence Intervals (CI)-
rea BMI of 25 to 29.9 are considered o3 C The tandard error (SE) of a rate is used in ealth statistics when studying or omparing rates. The SE defines a te’s variability and can be used to
alculate a confidence interval (CI) to ariance of a rate
5 percent of the time. Rates for two ifferent populations (areas, regions)
are
h
this formula, we
n 5’s obese rate is onsidered significantly different from e
con25.5ove be said for regi ion 7 (12.8-14.4 w the state CI level. Regions 1, 2, and 6 are not con ferent as the confidence intervals overlap the statewide intervals. See Figure 8 on pag BM
shcracdetermine the actual v9d
are considered significantly different when their confidence intervals do not overlap. The standard error and confidence intervals are calculated in the following manner. For example, region 5’s obese rate is 22.7 percent. This was based on 1,119 student measurements of whic254 are “obese” in 2009-2010. The square root of 254 is roughly 15.9. By dividing the rate of 22.7 by 15.9, the estimated SE of approximately 1.43 is the result. The estimated SE can then be used to compute a 95 percent CI for the rate. The standard formula RATE ±(1.96 *SE) is used for determining the 95 percent CI. Followingproduce an equation of 22.7 ± (1.96 * 1.43) and the result is 22.7 ± 2.8. From this, the estimated 95 percent CI is 19.9 to 25.5 percent. It could then be stated, with 95 percent certainty that the actual 2009-2010 obese rate for region 5 is between 19.9 and 25.5 percent. Therefore, regiocth state rate. This is because the
fidence intervals for region 5 (19.9-) and the state (15.6-16.4) do not
rlap. The same can on 3 (18.6-20.8). Reg) is significantly belo
sidered significantly dif
e 11.
I (Body Mass Index)- The formula to ulate BMI is weight (lb) ÷ height (in) ight (in) x 703. This formula is used
calc÷ hefor adults. See the next page for children and adolescents BMI.
20
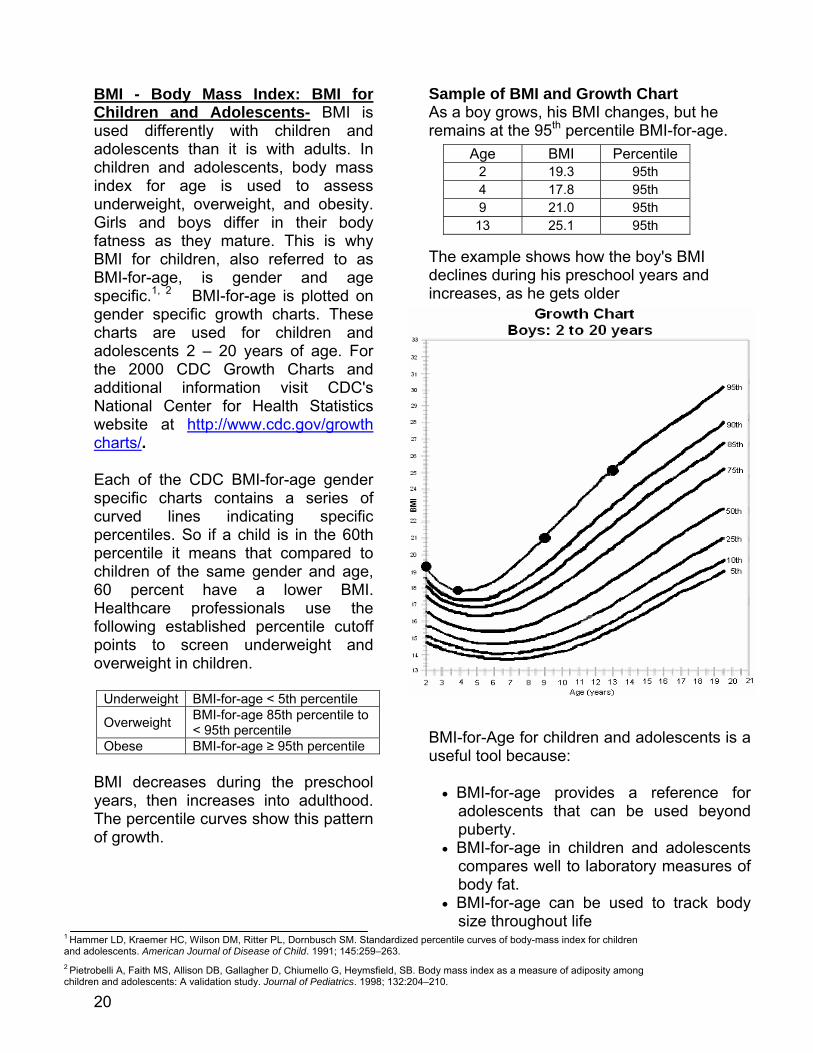
MI - Body Mass Index: BMI for BChildren and Adolescents- BMI is used differently with children and adolescents than it is with adults. In children and adolescents, body mass index for age is used to assess nderweight, overweight, and obesity.
ender specific growth charts. These
ttp://www.cdc.gov/growth
uGirls and boys differ in their body fatness as they mature. This is why BMI for children, also referred to as BMI-for-age, is gender and age specific.1, 2 BMI-for-age is plotted on gcharts are used for children and adolescents 2 – 20 years of age. For the 2000 CDC Growth Charts and additional information visit CDC's National Center for Health Statistics website at hcharts/.
means that compared to hildren of the same gender and age,
to screen underweight and verweight in children.
Each of the CDC BMI-for-age gender specific charts contains a series of curved lines indicating specific percentiles. So if a child is in the 60th percentile it c60 percent have a lower BMI. Healthcare professionals use the following established percentile cutoff points o
Underweight BMI-for-age < 5th percentile
Overweight BMI-for-age 85th percentile to < 95th percentile
Obese BMI-for-age ≥ 95th percentile BMI decreases during the preschool
ample of BMI and Growth Chart
a
for cents that can be used beyond
puberty. nts of
ody
years, then increases into adulthood. The percentile curves show this pattern of growth.
SAs a boy grows, his BMI changes, but he remains at the 95th percentile BMI-for-age.
The example shows how the boy's BMI declines during his preschool years and increases, as he gets older
BMI-for-Age for children and adolescents isuseful tool because:
BMI-for-age provides a reference adoles
BMI-for-age in children and adolescecompares well to laboratory measuresbody fat.
BMI-for-age can be used to track bsize throughout life
1 Ham rdized p entile curves of body-mass index for children and ad 3. 2 Pietr , SB. B y mass index as a measure of adiposity among childre olescents: A validation study. Journal of Pediatrics. 1998; 132:204– .
mer LD, Kraemer HC, Wilson DM, Ritter PL, Dornbusch SM. Standaolescents. American Journal of Disease of Child. 1991; 145:259–26
obelli A, Faith MS, Allison DB, Gallagher D, Chiumello G, Heymsfieldn and ad
erc
od210
Age BMI Percentile 2 19.3 95th 4 17.8 95th 9 21.0 95th
13 25.1 95th

Acknowledgements A special thanks goes to the school persofor Disease Control and Prevention for teand schools are encouraged to continue to Other South Dakota State Agency Websites: Healthy South Dakota:
nnel who submitted the data and to the Centers chnical ass ce. Th an oject submit data they are collecting.
v
is nta is is ong proing
www.HealthySD.go
the Departments of Education and Health: Healthy SD Coordinated School Health inhttp://doe.sd.gov/schoolhealth/index.asp CANS/Team Nutrition SD Model Shttp://doe.sd.gov/schoolhealth/documents/
chool Wellness Policy and Resources: Wellness_Policy.pdf
weight and obesity, try these websites:
(CDC), National Center for Chronic Disease ion of Adolescent and School Health:
For More Information
For additional ideas about how to address over Centers for Disease Control and PreventionPrevention and Health Promotion, Diviswww.cdc.gov/healthyyouth/index.htm Centers for Disease Control and PreventionPrevention and Health Promotion, Divisionhttp://www.cdc.gov/nccdphp/dnpao
(CDC), National Center for Chronic Disease of Nutrition, Physical Activity, and obesity:
School Health Index for Physical Activity and Healthy Eating: A Self-Assessment and
Youth/SHI/uide: http://www.cdc.gov/HealthyPlanning G Action for Healthy Kids, nationwide initiative with guidance provided by more than 30 n organ gencieational izations and government a s: www.actionforhealthykids.org Promoting Physical Activity A Guide to Cohttp://www.cdc.gov/physicalactivity/profess
mmunity Action: ionals/promotion/communityguide.html
source System: http://schoolmeals.nal.usda. Team Nutrition—Healthy School Meals Re gov/ South Dakota Department of Education: www.doe.sd.gov/oess/schoolhealth /index.asp
hures and resources for outdoor physical
ota Game, Fish, and Parks has brocSouth Dakeducation opportunities. http://gfp.sd.gov/
21

References
ical Nutrition 1991;54:773.
dolescent Overweight and Obesity: Summary Report, Journal of Pediatrics supplement,
ren and Adolescents. BMI is used differently
with children than it is with adults. ht
1. American Journal of Clin
2. Barlow SE and the Expert Committee, Expert Committee Recommendations Regarding the Prevention, Assessment, and Treatment of Child and A
2007; 120; S164-S192
3. BMI – Body Mass Index: BMI for Child
www.cdc.gov/healthyweight/assessing/bmi/childrens_bmi/about_childrens_bmi.ml
4. Centers for Disease Control and Prevention. Guidelines for School and
Community Programs to Promote Lifelong Physical Activity Among Young People, MMWR v 46 no RR-6, March 7, 1997.
5. Centers for Disease Control and Prevention. Guidelines for School Health
Lifelong Healthy Eating Among Young People, MMWR d Reports June 14, 1996/45 (RR-9); 1-33
tion of Childhood Obesity, Journal of Pediatrics
Environment, September 2001.
Programs to PromoteRecommendation an
6. Centers for Disease Control and Prevention. Press Release, More American Children and Adolescents are Overweight, March 12, 2002.
7. Davis MM, Gance-Cleveland B, Hassink S, Johnson R, Paradis G, and Resnicow K. Recommendations for Prevensupplement, 2007; 120; S229-S253.
8. Department of Agriculture, Food & Nutrition Service, Changing the Scene, Improving the School Nutritionwww.fns.usda.gov/tn.
9. Department of Health & Human Services, Centers for Disease Control, School
s of
ed
12. Krebs NF, Himes, JH, Jacobson D, Nicklas TA, Guilday P, and Styne D.
Pediatrics supplement, 2007; 120; S193-S228
Health Index. February 2001.
10. Dietz WH, Health Consequences of Obesity in Youth: Childhood PredictorAdult Disease, Pediatrics, vol 101, no 3, March 1998 suppl.
11. Hammer LD, Kraemer HC, Wilson DM, Ritter PL, Dornbusch SM. Standardizpercentile curves of body-mass index for children and adolescents. American Journal of Disease of Child. 1991; 145:259-263
Assessment of Child and Adolescent Overweight and Obesity, Journal of
22

13. Mei, Z, Scanlon KS, Grummer-Strawn LM, Freedman DS, Yip R, Trowbridge FL,
-Income Preschool Children: The Centers for Disease Control and Prevention Pediatric Nutrition Surveillance,
pidemic in the United States, 1991-1998, JAMA vol 282, no 16, October 27, 1999.
s of Education, Fit Healthy, and Ready to
Increasing Prevalence of Overweight Among US Low
1983 to 1995, Pediatrics vol 101, no 1, January 1998.
14. Mokdad AH, Serdula MK, Dietz WH, Bowman BA, Marks JS, Koplan JP, The Spread of the Obesity E
15. National Association of State Board
Learn, March 2001. www.nasbe.org/index.php/shs/53-shs-resorces/396-fit-healthy-and-readyto-learn-a-school-healthy-policy-guide
erica,
7B9def2ebe-10ae-432c-9bd0-
16. Nutrition and Physical Activity Field Assessment of Children in Rural AmJessica Noel Walker, Joy Miller Del Rosso, and Alison Karyl Held, March 2005 http://www.savethechildren.org/atf/cf/%df91d2eba74a%7D/10-Nutrition-and-Physical-Activity-Field-Assessment-2005.pdf
. adolescents: A
validation study. Journal of Pediatrics. 1998; 132:204–210.
Activity and Sports, A Report to the President from the Secretary of Health and Human Services and the
ong Young People, How You Can Help,
CDC, June 1997.
You Can Help,
n
Risk Behavior Survey Report http://doe.sd.gov/schoolhealth/yrbs.asp
17. Pietrobelli A, Faith MS, Allison DB, Gallagher D, Chiumello G, Heymsfield, SB
Body mass index as a measure of adiposity among children and
18. Promoting Better Health for Young People Through Physical
Secretary of Education, Fall 2001.
19. Promoting Lifelong Healthy Eating Am
20. Promoting Lifelong Physical Activity Among Young People, How
CDC, March 1997.
21. South Dakota Department of Education and South Dakota Department of HumaServices, South Dakota Youth
illance System (PedNSS) Summary of 2009 Data, July 2010.
24. Troiano RP and Flegal KM, Overweight Children and Adolescents: Description,
suppl.
22. South Dakota Department of Health, Pediatric Nutrition Surve
23. Story M, Holt K, and Sofka D, Bright Futures in Practice: Nutrition, 2001.
Epidemiology, and Demographics, Pediatrics, vol 101, no 3, March 1998
23
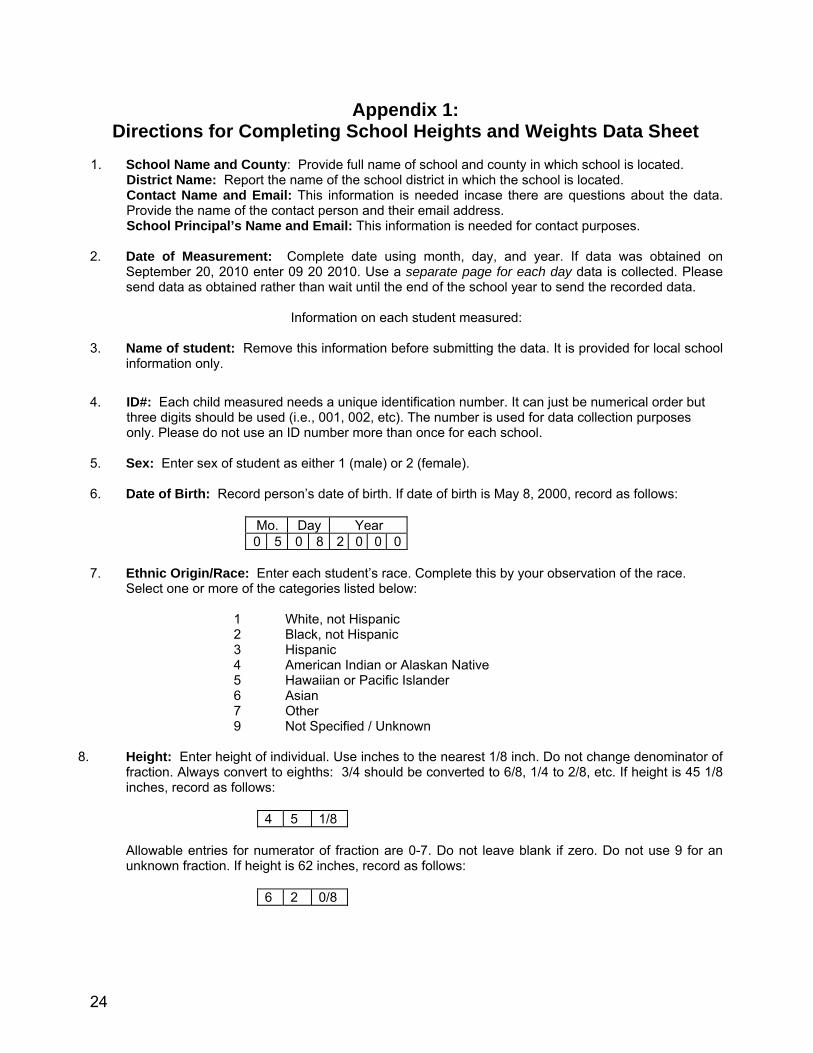
Appendix 1: Directions for Completing School Heights and Weights Data Sheet
1. School Name and County: Provide full name of school and county in which school is located.
District Name: Report the name of the school district in which the school is located. data.
n lease
ata.
hool
three digits should be used (i.e., 001, 002, etc). The number is used for data collection purposes
Contact Name and Email: This information is needed incase there are questions about theProvide the name of the contact person and their email address. School Principal’s Name and Email: This information is needed for contact purposes.
2. Date of Measurement: Complete date using month, day, and year. If data was obtained o
September 20, 2010 enter 09 20 2010. Use a separate page for each day data is collected. Psend data as obtained rather than wait until the end of the school year to send the recorded d
Information on each student measured:
3. Name of student: Remove this information before submitting the data. It is provided for local sc
information only.
ID#: Each child measured needs a unique identification number. It can just be numerical order but 4.
only. Please do not use an ID number more than once for each school.
5. Sex: Enter sex of student as either 1 (male) or 2 (female).
6. Date of Birth: Record person’s date of birth. If date of birth is May 8, 2000, record as follows:
Mo. Day Year 0 5 0 8 2 0 0 0
1 White, not Hispanic
Hispanic American Indian or Alaskan Native
n
8. of 45 1/8
7. Ethnic Origin/Race: Enter each student’s race. Complete this by your observation of the race. Select one or more of the categories listed below:
2 Black, not Hispanic 3 4 5 Hawaiian or Pacific Islander 6 Asian 7 Other 9 Not Specified / Unknow
Height: Enter height of individual. Use inches to the nearest 1/8 inch. Do not change denominator fraction. Always convert to eighths: 3/4 should be converted to 6/8, 1/4 to 2/8, etc. If height isinches, record as follows:
4 5 1/8
an
6 2 0/8
Allowable entries for numerator of fraction are 0-7. Do not leave blank if zero. Do not use 9 for unknown fraction. If height is 62 inches, record as follows:
24

Below is a conversion chart to convert feet and inches to inches. We have added this to the report form for ease of submitting height in inches, as required.
Ft. In. = In. Ft. In. = In. Ft. In. = In. Ft. In. = In. 3 0 36 4 0 48 5 0 60 6 0 72 3 1 37 4 1 49 1 61 6 1 73 5 3 2 38 4 2 50 5 2 62 6 2 74 3 3 39 4 3 51 5 3 63 6 3 75 3 4 40 4 4 52 5 4 64 6 4 76 3 5 41 4 5 53 5 5 65 6 5 77 3 6 42 4 6 54 5 6 66 6 6 78 3 4 43 4 7 55 5 7 67 6 7 79 3 8 44 4 8 56 5 8 68 6 8 80 3 9 45 4 9 57 5 9 69 6 9 81 3 10 46 4 10 58 5 10 70 6 10 82 3 11 47 4 11 59 5 11 71 6 11 83
School personnel should measure heig ght-angle headpiece or full-length measuring board uring rod on the adult balance
(1) Have the student stand with his or her back against the wall on a flat floor directly in front of the
s,
ching the wall or measuring
t angle to the head. Lower it until it firmly
(6) Read the measu ent at eye level where the lower edge of the headpiece intersects the measuring tape
(7) Repeat the pro r ents agree within 1/4 inch. Record the larger of the two measurements on the form.
9. s to the nearest 1/4 pound. Do not change the
denominator of the fraction. Always convert to fourths (1/2 should be converted to 2/4, 4/16 to 1/4, follows:
ht with a metal measuring tape and ri to insure accuracy. Do not use the meas
beam weight scale because it is not accurate. Have individual remove shoes, heavy outer clothing, hats, and hair barrettes. Procedure:
measuring tape. The tape should run directly down the center of the back. (2) Individual should stand with feet slightly apart and the back as straight as possible. The heel
buttocks, and shoulder blades should touch the wall or surface of the measuring board. (3) Have individual look straight ahead with head erect but not tou
board. (4) Place the headpiece flat against the wall and at a righ
touches the crown of the head. (5) Hold the right-angle headpiece steady and have the person move out from under it.
rem. cedure until two measu em
Weight: Enter weight of individual. Use pound
etc.) For example, if weight is 56 1/2 pounds, record as
0 5 6 2/4
Do not leave num or unknown fraction unless pounds are follows:
1
erator of fraction blank if zero. Do not uis recorded as
se 9 funknown also. For example, 125 pounds
2 5 0/4
Weight should be taken without shoes or heavy outer clothing. Use adult beam balance scale if at all possible. Scale needs to be placed on uncarpeted floor if possible for an accurate weight. Child needs to stand on the center of scale platform and not be touching other objects or person. Child should be weighed, ste ff s , and then weighed again to ensure an accurate weight.
10.
Email: [email protected]
p o the cale
Submit data as soon as possible after measurements are taken, though data will be accepted throughout the school year until the June 15 deadline. Send all data to:
Carrie Cushing South Dakota Department of Health
600 E. Capitol Pierre, SD 57501-2535 Fax:5605.773.5683
Mail:
25
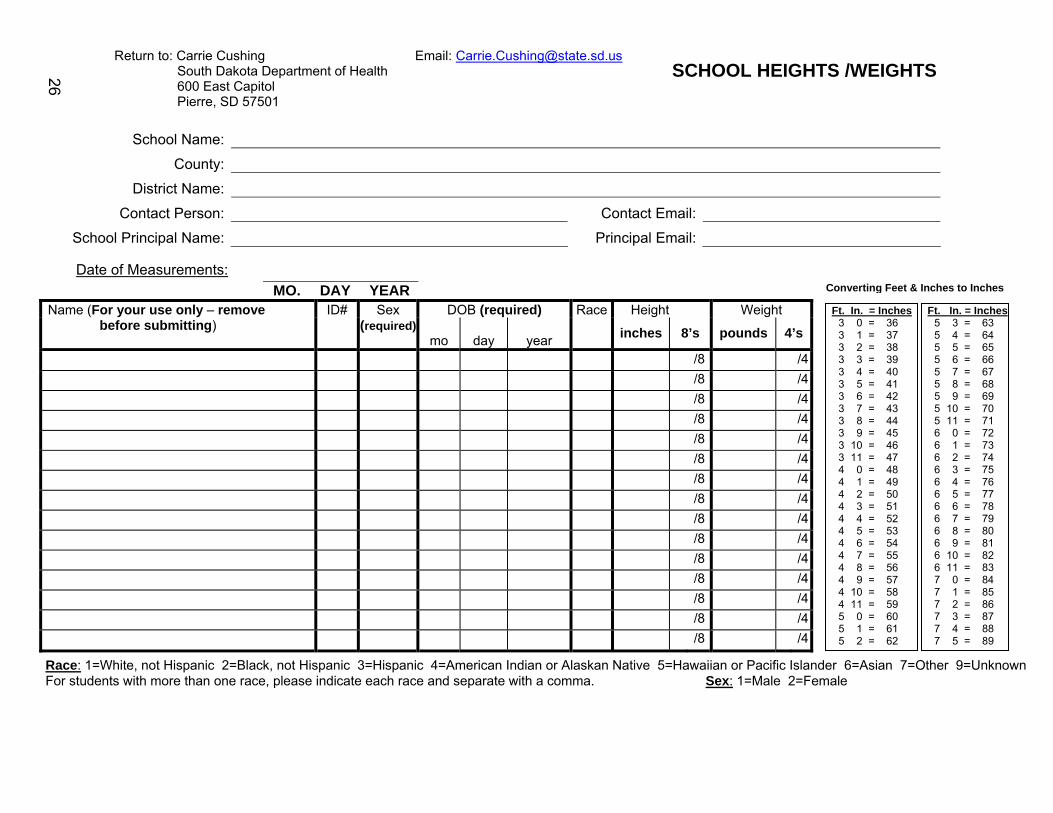
Return to: Carrie Cushing Email: [email protected] South Dakota Department of Health 600 East Capitol e SD 57501
c :
:
S
hoo
Pi
l N
C
rre,
ame
ounty
District Name:
Cont :act Person Contact Email:
S n Pchool Pri cipal Name: rincipal Email:
Date of Measurements:
MO
. DAY AR YENa r o ID# x e ight me (For you use nly – remove Se DOB (requir d) Race Height We s ired)
s before ubmitting) (requ
mo day
year
inches 8’s pound 4’s
/8 /4
/8 /4
/8 /4
/8 /4
/8 /4
/8 /4
/8 /4
/8 /4
/8 /4
/8 /4
/8 /4
/8 /4
/8 /4
/8 /4
/8 /4
Ft. In. = Inches 3 0 = 36
3 2 = 38
3 4 = 40
3 7 = 43 3 8 = 44
3 10 = 46
4 0 = 48
4 3 = 51 4 4 = 52
4 6 = 54
4 8 = 56
4 11 = 59 5 0 = 60 5 1 = 61 5 2 = 62
3 1 = 37
3 3 = 39
3 3
5 = 6
41 42 =
3 9 = 45
3 11 = 47
4 4
1 = 2
4950=
4 5 = 53
4 7 = 55
4 4
9 10
= 5758=
Converting Feet & Inches to Inches
Ft. In. = Inches 6364
5 6566
5 676869
707172
7374
6 754 765 776 787 798 80
9 8110 82
6 11 830 841 85
7 2 86 7 3 87 7 4 88 7 5 89
Race:
5 5
3 = 4 = 5 = 6 = 7 = 8 = 9 =
10 = 11 = 0 = 1 = 2 = 3 =
= = = = = = = = = = = = = =
5
5 5
5
5 6
66
6 6
6 6 6 6
6
7 7
1=White, not Hispa Hispanic 3 spani Al a 5 w acific Islander 6=Asian 7=Ot known For students with more th ase indicate each race an arat t om
her 9=Unaiian or PSex: 1=M
=Ha
n N
ative
askma.
nic an o
2=Black, notne race, ple
=Hi c 4=American Indid sep
an h a c
or e wi ale 2=Female
SCHOOL HEIGHTS /WEIGHTS 26

Appendix 2 Participating School
Education Serv
s
ice Agency Region School Name, City y CountAlcester-Hudson Elementar ste ..........2................................. ......Alkali Elementary, Sturgis........................................7...........................................All City Elementary, Sioux FallsAnne Sullivan Elementary,Armour Elementary, AAtall Elementary, Union Center ........ . . . . .Axtell Park Middle School, Sioux ....................2.....................................Minnehaha Baltic Elementary, Baltic ..........................................2.....................................Minnehaha Baltic High School, Baltic.........................................2.....................................Minnehaha Baltic Middle School, Baltic .....................................2.....................................Minnehaha Batesland Elementary, BateslandBeadle Elementary, Yankton ...................................3.........................................Belle Fourche High School, BeBelle Fourche Middle School, e ...........7..............................................Black Hawk Elementary, Black Hawk ......................7...........................................Blumengard Colony, Brandon Elementary, .............................2.....................................Minnehaha Brandon Valley Middle School, BrandonBrentwood Colony, Faulkton ...................................5..............................................Brown High School, Sturgis.....................................7...........................................Buchanan Elementary, Huron..................................3...........................................Buchanan Elementary, Pierre Hughes Burke Schools, Burke ............ . ......................3......................................... Gregory Camelot Intermediate, Brookings ............................1.......................................Canyon Lake Elementary, Rapid City......................7.................................... Pennington CC Lee Elementary, Aberdeen................................1............................................Central High School, Aberdeen ...............................1............................................Challenge Center, Sioux F Minnehaha Chancellor Elementary, .........................2Chester Area Schools, ChesterCleveland Elementary, Sio ls ..........................2.....................................Minnehaha Colman-Egan Schools, ColmanCorral Drive Elementary, Rapid City........................7.................................... Pennington Corsica Schools, Corsica ........................................3......................................... Douglas Crow Creek Tribal Schools ephan.......................3..............................................Dakota Middle School, Rapid ...........................7.................................... Pennington Dakota Valley Elementary, N. Sioux City.................2.............................................De S .....................................1.......................................Kingsbury Dell Rapids Middle School ds ..................2.....................................Minnehaha Discovery Elementary, Sioux Falls Minnehaha Douglas Middle School, Bo Elder Pennington East Elementary, S Lawrence Edison Middle School, Sioux Falls Minnehaha Elk Point-Jefferson Elementar t ...............2.............................................Elk Point-Jefferson M , Elm Springs Elementary, Wasta
y, Al
Sioux..
ce
Falls..
r .
....................2..............................................
..
..
...
...
....
...
....
...........3....................................
.. Union Meade
Meade
... Butte Butte
Meade Faulk
Faulk Meade Beadle
Brown Brown
Lincoln
Moody
Hyde
Union
Union Union
Meade
...............................2.....................................
....
Minnehaha Minnehaha
..... Douglas rmour.......................7...... ........ ........ ........ ........
Falls
............................7........................................ Shannon Yankton
lleBelle Fourch
.................................5..............................................
Fourche ..............7...........................................
FaulktonBrandon ...
.................2.....................................Minnehaha
..................................6..........................................
...... .....Brookings
alls .................................2.....................................Chancellor ...........................................
...............................1...............................................ux Fal
...............................1............................................
, StCity
y, Elk Poin
met Schools, De S
pearfish
S
met, Dell Rapi
x
Elk Point
..........................2.....................................
..........................7....................................
...........................2.....................................
............................2...........................................................................7...........................................
.....................................7.......................................
Lake
27

Participating Schools (continued) School Name, City E y Region Countyducation Service Agenc
Emery Elementary, Emery.......................................2.......................................... Hanson Enning Elementary, Enning .....................................7........................................... Meade
..............................................3.........................................Ethan Schools, Ethan Davison Eugene Field Elementary, Sioux Falls.....................2.....................................Minnehaha Evergreen Colony, Faulkton ....................................5..............................................Faulk Explorer Elementary, Harrisburg .............................2........................................... Lincoln Faith Elementary, Faith ...........................................5........................................... Meade Family Immersion Center, Sioux Falls .....................2.....................................Minnehaha Flex, Sioux Falls ......................................................2.....................................Minnehaha Florence Schools, Florence.....................................1...................................... Codington Fred Assam Elementary, Brandon...........................2.....................................Minnehaha Garfield Elementary, Sioux Falls .............................2.....................................Minnehaha General Beadle Elementary, Mobridge....................5........................................Walworth General Beadle Elementary, Rapid City ..................7.................................... Pennington George S. Mickelson Middle School, Brookings ......1.......................................Brookings Georgia Morse Middle School, Pierre......................6.......................................... Hughes Gertie Belle Rogers Elementary, Mitchell ................3......................................... Davison Gracevale Colony Elementary, Madison .................2...............................................Lake Grandview Elementary, Rapid City..........................7.................................... Pennington Gregory Schools, Gregory.......................................3......................................... Gregory Groton Schools, Groton...........................................1............................................ Brown Hamlin Elementary School, Hayti ............................1........................................... Hamlin Harrisburg High School, Harrisburg.........................2........................................... Lincoln Harrisburg Middle School, Harrisburg......................2........................................... Lincoln Hartford Elementary, Hartford..................................2.....................................Minnehaha Harvey Dunn Elementary, Sioux Falls .....................2.....................................Minnehaha Hawthorne Elementary, Sioux Falls.........................2.....................................Minnehaha Hayward Elementary, Sioux Falls............................2.....................................Minnehaha
MHereford Elementary, Hereford................................7........................................... eade Highmore-Harrold Elementary, Highmore ...............6.............................................. Hyde Hillcrest Elementary, Brookings...............................1.......................................Brookings
.Holgate Middle School, Aberdeen ...........................1........................................... Brown Horace Mann Elementary, Rapid City .....................7.................................... Pennington Horace Mann Elementary, Sioux Falls ....................2.....................................Minnehaha Howard Elementary, Howard...................................2............................................. Miner Howard High School, Howard..................................2............................................. Miner Howard Junior High School, Howard.......................2............................................. Miner Humboldt Elementary, Humboldt.............................2.....................................Minnehaha Huron High School, Huron.......................................3........................................... Beadle Huron Middle School, Huron ...................................3........................................... Beadle Immaculate Conception, Watertown........................1...................................... Codington Jefferson Elementary, Huron...................................3........................................... Beadle Jefferson Elementary, Pierre ...................................6.......................................... Hughes
.Jefferson Elementary, Sioux Falls ...........................2.................................... Minnehaha FallsJoe Foss Alternative, Sioux .............................2.....................................Minnehaha
John F. Kennedy Elementary, Sioux Falls ...............2.....................................Minnehaha John Harris Elementary, Sioux Falls........................2.....................................Minnehaha John Paul II Elementary, Mitchell ............................3......................................... Davison Jolley Elementary, Vermillion...................................2............................................... Clay
28

Participating Schools (continued) School Name, City Education Service Agency Region County
29
Jones County Schools, Murdo.................................6.............................................Jones Journey Elementary, Harrisburg ..............................2........................................... Lincoln Kimball Schools, Kimball .........................................3.............................................. Brule Knollwood Heights Elementary, Rapid City .............7.................................... Pennington Koch Elementary, Milbank.......................................1............................................. Grant Lake Preston Elementary, Lake Preston .................1.......................................Kingsbury Laura B. Anderson Elementary, Sioux Falls ............2.....................................Minnehaha Laura Wilder Elementary, Sioux Falls......................2.....................................Minnehaha LB Williams Elementary, Mitchell.............................3......................................... Davison Lennox Elementary, Lennox....................................2........................................... Lincoln Lennox Middle School, Lennox................................2........................................... Lincoln Liberty Elementary, Harrisburg ................................2........................................... Lincoln Lincoln Elementary, Aberdeen.................................1............................................ Brown Lincoln Elementary, Watertown...............................1...................................... Codington Lincoln High School, Sioux Falls .............................2.....................................Minnehaha Longfellow Elementary, Mitchell ..............................3......................................... Davison Longfellow Elementary, Sioux Falls.........................2.....................................Minnehaha Lowell Elementary, Sioux Falls................................2.....................................Minnehaha Lower Brule Elementary, Lower Brule .....................6............................................Lyman Lower Brule High School, Lower Brule ....................6............................................Lyman Madison Central Elementary, Madison....................2...............................................Lake Madison Elementary, Huron ....................................3........................................... Beadle Mark Twain Elementary, Sioux Falls .......................2.....................................Minnehaha Marty Indian Schools, Marty ....................................3....................................Charles Mix May Overby Elementary, Aberdeen.........................1............................................ Brown McCook Central Middle School, Salem ...................2......................................... McCook McIntosh Schools, McIntosh....................................5...........................................Corson McKinley Elementary, Pierre ...................................6.......................................... Hughes McKinley Elementary, Watertown............................1...................................... Codington McLaughlin Elementary, McLaughlin.......................5...........................................Corson McLaughlin High School, McLaughlin......................5...........................................Corson McLaughlin Middle School, McLaughlin ..................5...........................................Corson Meadowbrook Elementary, Rapid City ....................7.................................... Pennington Medary Elementary, Brookings................................1.......................................Brookings Memorial Middle School, Sioux Falls.......................2.....................................Minnehaha Milbank High School, Milbank..................................1............................................. Grant Milbank Middle School, Milbank ..............................1............................................. Grant Mitchell High School, Mitchell ..................................3......................................... Davison Mitchell Middle School, Mitchell...............................3......................................... Davison Mobridge-Pollock Middle School, Mobridge ............5........................................Walworth Mount Vernon Schools, Mount Vernon....................3......................................... Davison New Underwood Schools, New Underwood............7.................................... Pennington North Middle School, Rapid City..............................7.................................... Pennington North Park Elementary, Belle Fourche ....................7.............................................. Butte Oelrichs Schools, Oelrichs.......................................7....................................... Fall River OM Tiffany Elementary, Aberdeen ..........................1............................................ Brown Opal Elementary, Opal ............................................7........................................... Meade Oscar Howe Elementary, Sioux Falls ......................2.....................................Minnehaha Patrick Henry Middle School, Sioux Falls ................2.....................................Minnehaha

Participating Schools (continued) School Name, City Education Service Agency Region County
Philip Schools, Philip ...............................................7.......................................... Haakon Piedmont/Stagebarn Elementary, Piedmont............7........................................... Meade Pierre Indian Learning Center, Pierre ......................6.......................................... Hughes Pinedale Elementary, Rapid City .............................7.................................... Pennington Plankinton Elementary, Plankinton ..........................3............................................Aurora Platte-Geddes Elementary, Platte ...........................3....................................Charles Mix Platte-Geddes Junior High School, Platte ...............3....................................Charles Mix RF Pettigrew Elementary, Sioux Falls .....................2.....................................Minnehaha Rapid Valley Elementary, Rapid City.......................7.................................... Pennington Redfield Schools, Redfield ......................................1............................................. Spink Renberg Elementary, Sioux Falls ............................2.....................................Minnehaha Robbinsdale Elementary, Rapid City .......................7.................................... Pennington Robert Bennis Elementary, Brandon .......................2.....................................Minnehaha Robert Frost Elementary, Sioux Falls ......................2.....................................Minnehaha Roosevelt High School, Sioux Falls.........................2.....................................Minnehaha Rosa Parks Elementary, Sioux Falls .......................2.....................................Minnehaha Sacred Heart, Yankton ............................................3......................................... Yankton Sanborn Central Schools, Forestburg .....................3.........................................Sanborn School for the Deaf, Sioux Falls ..............................2.....................................Minnehaha St. Elizabeth Seton, Rapid City................................7.................................... Pennington Simmons Elementary, Aberdeen .............................1............................................ Brown Simmons Middle School, Aberdeen.........................1............................................ Brown SF Lutheran School, Sioux Falls .............................2.....................................Minnehaha Sioux Valley Elementary, Volga...............................1.......................................Brookings Sioux Valley Middle School, Volga ..........................1.......................................Brookings Sisseton High School, Sisseton...............................1..........................................Roberts South Canyon Elementary, Rapid City ....................7.................................... Pennington South Central Schools, Bonesteel ...........................3......................................... Gregory South Park Elementary, Belle Fourche....................7.............................................. Butte South Park Elementary, Rapid City .........................7.................................... Pennington St Joseph Elementary, Pierre ..................................6.......................................... Hughes St Mary’s Schools, Dell Rapids................................2.....................................Minnehaha Stickney Schools, Stickney......................................3............................................Aurora Sturgis Elementary, Sturgis .....................................7........................................... Meade Success Academy, Sioux Falls................................2.....................................Minnehaha Sunny Plains Christian School, Iroquois..................1.......................................Kingsbury Terry Redlin Elementary, Sioux Falls ......................2.....................................Minnehaha Thunderbird Colony, Faulkton .................................5..............................................Faulk Timber Lake Public School, Timber Lake ................5........................................... Dewey Union Center Elementary, Union Center .................7........................................... Meade Valley Springs Elementary, Brandon .......................2.....................................Minnehaha Valley View Elementary, Rapid City ........................7.................................... Pennington Washington Elementary, Huron...............................3........................................... Beadle Washington Elementary, Pierre ...............................6.......................................... Hughes Washington High School, Sioux Falls......................2.....................................Minnehaha Watertown Middle School, Watertown.....................1...................................... Codington Waubay Schools, Waubay ......................................1................................................ Day Webster Elementary, Webster.................................1................................................ Day Webster Elementary, Yankton.................................3......................................... Yankton
30
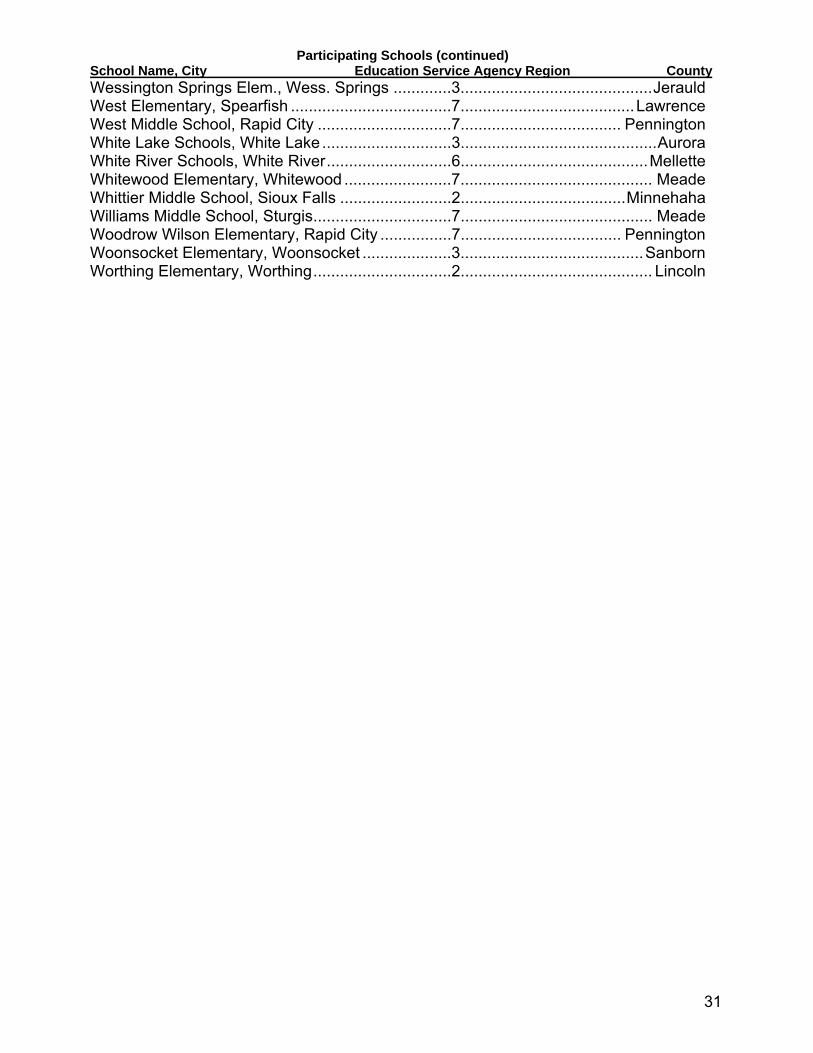
Participating Schools (continued) School Name, City Education Service Agency Region County
31
Wessington Springs Elem., Wess. Springs .............3...........................................Jerauld West Elementary, Spearfish ....................................7.......................................Lawrence West Middle School, Rapid City ..............................7.................................... Pennington White Lake Schools, White Lake .............................3............................................Aurora White River Schools, White River............................6..........................................Mellette Whitewood Elementary, Whitewood ........................7........................................... Meade Whittier Middle School, Sioux Falls .........................2.....................................Minnehaha Williams Middle School, Sturgis...............................7........................................... Meade Woodrow Wilson Elementary, Rapid City ................7.................................... Pennington Woonsocket Elementary, Woonsocket ....................3.........................................Sanborn Worthing Elementary, Worthing...............................2........................................... Lincoln
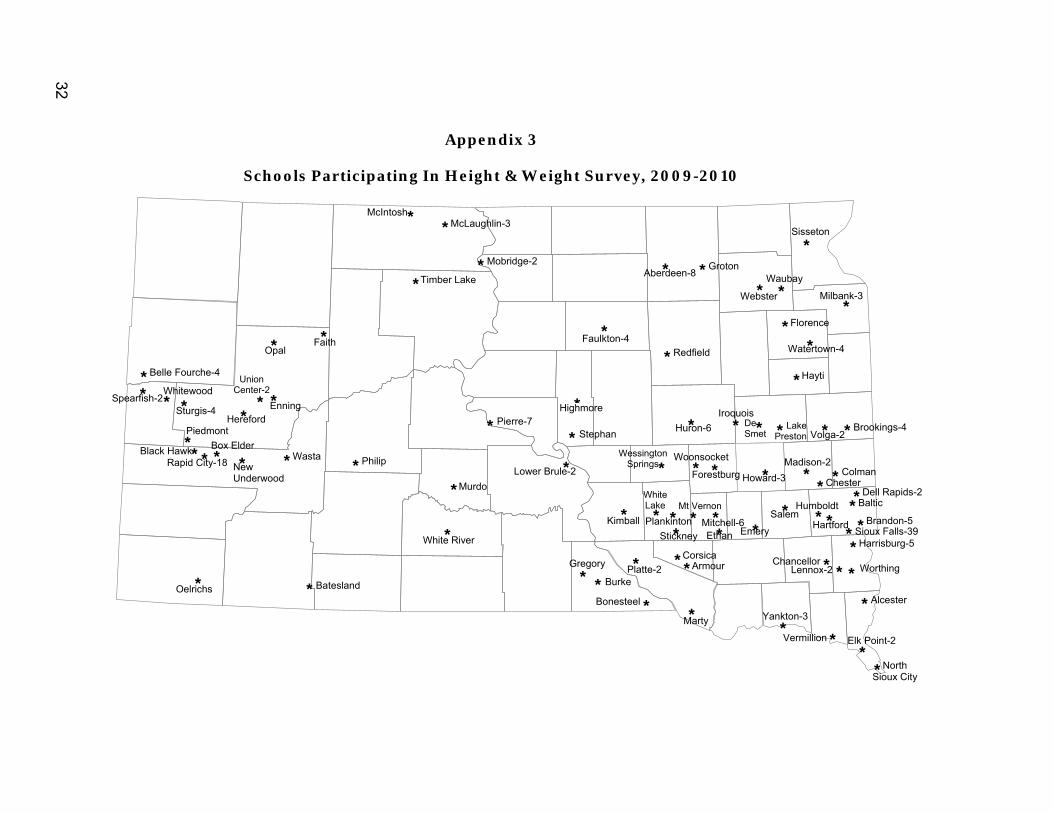
ds-2
*
*
*
* *
* * *
*
*
*
* *
*
*
*
*
* *
*
* * * * *
*
* * * * * *
*
* * *
* *
*
* * * * *
* *
*
* *
*
*
*
*
*
*
*
*
*
*
*
*
*
*
*
H
olm
W
B
ter
arris
an
orth
altic
burg
ing
-5
Marty
Mt Vernon
Mitchell-6
Piedmont
Enning
Union Center-2
Ethan
Wasta
Burke
Murdo
ArmourPlatte-2
Forestburg Howa
Corsica
Faulkton-4
Gregory
Kimball
Huron-6
Faith
Webst
Stickney
Black Hawk
Pierre-7
Redfield
Timber Lake
McIntosh
New Underwood
Y
Bonesteel
Batesland
Emery
De Smet
Sturgis-4
Whitewood
Har
eton
lion
mbol
on-2
C
Mi
tford
C
dt
hes
lban
Siss
m
rmil
ay
n-3
Hu
adis
Sale
rd-3
er
Ve
Waub
ankto
M
k-3
Elk
Sio
Highmore
Oelrichs
WhiteLake
Woonsocket
Iroquois
Aberdeen-8
Lower Brule-2
Box Elder
Spearfish-2
McLaughlin-3
Rapid City-18
Belle Fourche-4
WessingtonSprings
Opal
Philip
*
Point
ux
Sio
Alc
-2
Falls
Nortux
este
-39
h City
r
Wate
H
rtow
ayti
n-4
Groton
* * Florence
* LPresaketon * Volga-2* Bro
*
okings-4
*
Mobridge-2
Appendix 3
Schools Participating In Height & Weight Survey, 2009-2010
* Brandon-5
Hereford
ChancellLenn
orox-2
*
*
*
*
White River
*
*
*
Stephan
*
Dell Rapi* Plankinton *
32

500 copies of this public n were printed by the South Dakota Department of Health South Dakota artment of Health at a cost of $_____ per copy.
atioDep