school meal programs innovate to improve student...
TRANSCRIPT

School Meal Programs Innovate to Improve Student NutritionSurvey explores progress, challenges three years into transition to healthier food standards
A report from The Pew Charitable Trusts and the Robert Wood Johnson Foundation Dec 2016
JGI/Tom Grill/Getty Images

The Kids’ Safe and Healthful Foods Project, a collaboration between The Pew Charitable Trusts and the Robert Wood Johnson Foundation, provides nonpartisan analysis and evidence-based recommendations to make sure that all foods and beverages sold in U.S. schools are safe and healthful.
Contact: Matt Mulkey, manager, communications Email: [email protected] Project website: healthyschoolfoodsnow.org

The Pew Charitable TrustsSusan K. Urahn, executive vice president Allan Coukell, senior director
Robert Wood Johnson Foundation Jasmine Hall Ratliff, program officer
Kids’ Safe and Healthful Foods ProjectStephanie Scarmo, officer Sallyann Bergh, senior associate Whitney Meagher, senior associate Mollie Van Lieu, senior associate Carol Conroy, program assistant
External reviewers The report benefited from the insights and expertise of external peer reviewers Lindsey Turner, Ph.D., director of the Initiative for Healthy Schools and research associate professor in the College of Education at Boise State University, and Cliff Zukin, Ph.D., professor of public policy and political science at the Edward J. Bloustein School of Planning and Public Policy at Rutgers University. Although they reviewed the study’s findings and methodology, respectively, neither they nor their organizations necessarily endorse the conclusions.
AcknowledgmentsThe project team would like to thank Mathematica Policy Research for collecting and analyzing the data for this report, including Juan Diego Astudillo, Barbara Carlson, Irina Cheban, Mary Kay Crepinsek, Cheryl DeSaw, Elizabeth Gearan, Laura Kalb, Ryan McInerney, Kelley Monzella, and Jessy Nazario. Our thanks also go to Matt Gruenburg and Adam Zimmerman at Burness Communications; Tracy Fox at Food, Nutrition & Policy Consultants; and fact-checker Michelle Harris for their careful review and edits.
We further thank the following current and former Pew colleagues for their insight and guidance: Jessica Donze Black, Samantha Chao, Kyle Kinner, Alan van der Hilst, and Peter Wu. Thanks also to Dan Benderly, Laurie Boeder, Jennifer V. Doctors, Sara Flood, Mel Grant, Carol Hutchinson, Matt Mulkey, Danielle Ruckert, Liz Visser, and Gaye Williams for providing valuable feedback and production assistance on this report.

Contents
1 OverviewAbout the SMART Survey and Expert Panel 3
4 The national school meal programs
4 Progress and challenges implementing updated meal standardsExpert Experience: Training and Outreach Breed Success 10
11 Promoting healthy eating and reducing plate wasteExpert Experience: More Healthy Eating, Less Plate Waste 17
19 Trends in student participation and revenue from school nutrition programsExpert Experience: Building Student Participation and Revenue 23
25 Schools step up to the Smart Snacks standards
28 Recommendations
29 Conclusion
29 Appendix A: Tables from the SMART survey
43 Appendix B: Characteristics of school food authorities
45 Appendix C: Study design and methodology
52 Appendix D: Strengths and limitations of the study
52 Appendix E: Survey questionnaire
74 Endnotes

1
OverviewSchool meal programs and the individuals who run them have come under intense scrutiny in recent years as they planned for and implemented the U.S. Department of Agriculture’s healthier standards for foods and drinks offered to the nation’s students. But it is not just breakfast and lunch menus that have changed; vending machine options, a la carte lines, food-based fundraising practices, and more are being improved to meet the updated school nutrition rules that began to take effect in the 2012-13 school year (SY).
Studies of schools in three states—Connecticut, Texas, and Washington—show that under the updated standards, children’s eating habits are improving, which is a core goal of these strengthened policies.1 Students of all ages are choosing lunches higher in nutritional quality and lower in calories per gram and consuming more fruits and larger shares of their entrees and vegetables. Some studies also measured plate waste—the food taken and later discarded by kids—and found that it stayed the same or declined after the transition to healthier menus.
National nutrition standards influence many facets of school meal program operations, including menu planning, cooking and serving procedures, food costs, marketing strategies, and student participation rates. To investigate how updated requirements affect these areas and programs’ overall success, the Kids’ Safe and Healthful Foods Project—a joint initiative of The Pew Charitable Trusts and the Robert Wood Johnson Foundation—commissioned the School Meal Approaches, Resources, and Trends (SMART) Study, a national survey of 489 school nutrition directors representing school food authorities (SFAs) across the country.2 All respondents participated in the National School Lunch Program (NSLP), and nearly all took part in the School Breakfast Program (SBP). A separate group of 11 food service directors—the SMART Expert Panel, selected by the Kids’ Safe and Healthful Foods Project for their records of success in navigating the updated standards—reviewed the results and provided insights on the reported challenges and strategies to address common barriers.
This report explores the survey results on SFA directors’ perspectives on meal and snack nutrition requirements and on districts’ experiences implementing the updated standards near the end of SY 2014-15. It reveals that many districts have emerged from the most challenging phase of the transition to healthier meals. The key findings from the survey are:
• 6 in 10 directors said they faced only a few or no ongoing obstacles to meeting updated breakfast requirements; 4 in 10 said the same of the lunch guidelines.
• For breakfast and lunch, the commonly cited challenges were two rules that took effect in SY 2014-15: tighter limits on weekly average sodium content and a requirement that any food counted as a grain serving be made from at least 50 percent whole grains.
• Most programs use a mix of strategies—three, on average—to encourage students to eat nutritious meals. Nine in 10 adopted at least one practice to raise children’s fruit and vegetable consumption. For example, almost two-thirds of directors who increased the use of salad bars said that kids ate more produce as a result.
• Respondents said that holding taste tests with students and redistributing uneaten, sealed foods were among the most effective ways to reduce waste. But only 44 percent and 38 percent of programs, respectively, used these strategies.
• Directors whose programs prepared more foods from scratch and increased the use of salad bars were more likely to report that student participation rose or was unchanged from SY 2011-12 to 2014-15. Conversely, declines in participation were seen most often by directors who purchased more commercially prepared foods or decreased menu options.

2
• Directors reported uneven progress toward district-wide compliance with the Smart Snacks in School (Smart Snacks) nutrition standards, which govern items sold in cafeteria a la carte lines, vending machines, snack bars, and at fundraisers. Two-thirds of respondents said that all food and beverages sold by their departments met the standards in SY 2014-15. But only 2 in 10 reported that the same was true for products sold by other departments and school groups.
• Equipment and labor costs were the most frequently reported financial concerns (38 percent and 33 percent, respectively).
• 84 percent of program directors reported rising or stable combined revenue (meal reimbursements plus snack and beverage sales) in the past year. More than half (54 percent) of districts saw higher combined revenue in SY 2014-15 compared with a year earlier. Almost a third (30 percent) said total revenue remained level.
Reflecting on these results, the expert panel noted that running a school nutrition program is analogous to running a successful business: Directors reported constantly updating and expanding their menus and employing creative strategies to keep their customers—the students—happy. Sharing recipes, vendors, and purchasing responsibilities across schools and districts has helped them successfully navigate the transition to healthier meals, and buy-in from administrators and parents was also vital to success.
Panelists agreed that healthy eating behaviors are best promoted through active strategies, such as cooking demonstrations and taste tests with students and working with administrators to change the cafeteria environment or lunch schedules so students have enough time to eat. They also said that celebrating their accomplishments through local media and direct outreach to school officials, families, and the community generated positive perceptions of the program and support for efforts to serve healthier foods to students.
This report describes the survey findings and panelists’ insights and offers recommendations to states, districts, vendors, families, and communities to enhance meal programs’ success in implementing updated nutrition standards and encouraging healthy eating among students. By prioritizing nutrition as part of a culture of health in educational settings and in funding and policy decisions, policymakers can ensure that students have access to nutritious food. At the same time, nonprofit and for-profit organizations, as well as parents, can build a network of community support for school meal programs and their critical role in children’s lifelong health.
Panelists agreed that healthy eating behaviors are best promoted through active strategies, such as cooking demonstrations and taste tests with students and working with administrators to change the cafeteria environment or lunch schedules.

3
About the SMART Survey and Expert Panel
The findings presented in this report are based on an online survey of school food service directors from a nationally representative sample of public SFAs, conducted by Mathematica Policy Research. The questionnaire was designed to collect information on the continued challenges and successes achieved related to the ongoing implementation of the USDA’s nutrition standards for school meals and snacks. Directors from 489 SFAs completed the survey at the end of SY 2014-15, so when the data for this study were collected, all of the updated meal requirements were in effect. Data were weighted to be nationally representative of all public SFAs participating in the NSLP in SY 2014-15, and the weighted response rate was 52 percent. (See Appendix C.)
This report also includes suggestions from a panel of school nutrition professionals, listed below, who reviewed and discussed the survey results. They represent a range of meal programs that are using various strategies to successfully serve healthy meals and snacks.
Linette Dodson Director of School Nutrition Carrollton City Schools Carrollton, Georgia
Amy Droegemeier Director of Nutrition Services Gardner Edgerton School District #231 Gardner, Kansas
Roger Kipp Director of Food Services and Nutrition Norwood City School District Norwood, Ohio
Donna Martin Director, School Nutrition Program Burke County Public Schools Waynesboro, Georgia
Bridgette Matthews School Nutrition Program Director Elbert County School District Elberton, Georgia
Helen Phillips Senior Director of School Nutrition Norfolk Public Schools Norfolk, Virginia
Jeanne Reilly Director of Food Services RSU14—Windham Raymond School District Windham, Maine
Lisa Sims School Nutrition Director Daviess County Public Schools Owensboro, Kentucky
Rodney Taylor Director of Food and Nutrition Services Fairfax County Public Schools Fairfax, Virginia
Sal Valenza School Nutrition Director West New York School District West New York, New Jersey
Connie Vogts Nutrition Services Director USD 480—Liberal School District Liberal, Kansas

4
The national school meal programsThe National School Lunch (NSLP) and School Breakfast Program (SBP) both provide children with healthy, affordable meals during the school year. Established in 1946, the NSLP operates in about 95 percent of public schools.3 Each school day, more than 30 million students receive their midday meals through the NSLP, and 14 million receive their morning meals through the SBP.4 Participating schools must make meals available to all students and provide lunches and breakfasts to children from low-income families for free or at a reduced price.
In December 2010, Congress passed the Healthy, Hunger-Free Kids Act, reauthorizing the school meal programs with a focus on improving children’s access to nutritious foods and promoting healthy eating and physical activity. The law directed the USDA to update nutrition standards for all foods and beverages sold on campuses during the school day, and the resulting revised requirements are based on recommendations from the Health and Medicine Division at the National Academies of Sciences, Engineering, and Medicine (formerly the Institute of Medicine) and the most recent information on children’s nutritional requirements as reflected in the Dietary Guidelines for Americans.5 Congress also provided additional funding for lunch programs and created a universal meal option—the Community Eligibility Provision (CEP)—through which schools in high-poverty areas could provide free meals to all students.6
The updated standards, which represented the first major changes to meal requirements in more than 15 years, require more fruits, vegetables, and whole grains and limit the amount of calories, saturated fats, and sodium. In addition, for a meal to be reimbursable, students must select at least one serving of a fruit or vegetable. The healthier guidelines for lunches and breakfasts went into effect at the start of SY 2012-13 and SY 2013-14, respectively. Requirements to reduce the weekly average sodium content in meals and to ensure that any food counted as a grain serving be made from at least 50 percent whole grains were phased in for SY 2014-15.7
In addition to breakfast and lunch, the USDA also has responsibility for setting nutrition standards for “competitive” foods and beverages—items sold via vending machines, snack bars, stores, or fundraisers on campus during school hours or in cafeteria a la carte lines that can compete for children’s appetites and wallets often as snacks and meal supplements. In June 2013, the USDA published an interim final rule, known as “Smart Snacks,” that set the first-ever comprehensive minimum nutrition standards for these foods. The standards, which went into effect in SY 2014-15, require that snacks be comprised primarily of fruits, vegetables, dairy products, protein, or whole grains; limit the amount of calories, sugar, and sodium allowed; and restrict the types and serving sizes of beverages that can be sold.8 The USDA published the Smart Snacks final rule on July 29, 2016.
Progress and challenges implementing updated meal standardsThe updated standards for meals and competitive foods have required some SFAs to make a number of changes to their meal production and service. Although many districts have reported improvements in student participation in meal programs and acceptance of healthier options, others have raised concerns about participation, costs, revenue, and food waste. It is important, therefore, to better understand the situation at the district, state, and national levels in order to make informed decisions about how to most effectively address any barriers to success.

5
Variability among districts in terms of their success and challenges with implementing healthier standards is not new. Although most of the current nutrition requirements went into effect in SY 2012-13, many districts started implementing changes well before. A 2013 study by the Kids’ Safe and Healthful Foods Project—Serving Healthy School Meals: Despite Challenges, Schools Meet USDA Meal Requirements—found that 31 percent of school meal programs started serving healthier meals before the regulations were even proposed, 23 percent began when the guidelines were proposed (January 2011), and 45 percent started making changes only once the rule was final (January 2012).9
Regardless of when they started revising their programs, the vast majority of schools—94 percent—anticipated meeting updated nutrition standards by the end of SY 2012-13. State child nutrition agencies are responsible for certifying SFAs’ compliance with meal program rules, and data those agencies reported to the USDA show that nearly all districts—98.5 percent—had met updated nutrition standards by December 2015.10
However, SFAs that waited until the rules were final or nearly so had to make changes much more quickly than those that started in advance and may still be working through some of the implementation challenges that others have already overcome. This is particularly true for requirements that were rolled out more recently.
Operating a school meal program is a complex job. Nutrition professionals must serve healthy food on a tight budget in a short amount of time every day to an often tough audience. Serving Healthy School Meals: Despite Challenges, Schools Meet USDA Meal Requirements found that the two challenges reported most frequently by directors during the first year of implementation were cost and availability of foods that comply with the new requirements and the need to train staff.11
To explore the most pressing challenges SFA directors are facing, the SMART survey asked a series of questions about requirements and other factors contributing to those barriers and changes made to meal production or service in order to address them. (See Appendix A.) The SMART Expert Panel then met in December 2015 to discuss the issues identified and offer real-world recommendations on overcoming the challenges to implementing USDA nutrition standards for school meals and snacks. In general, the panelists cited perseverance, creativity, and collaboration as key to successful implementation of the lunch and breakfast requirements and acknowledged that planning menus that appeal to students and meet updated standards is a transition that gets easier over time.
LunchSchool food service directors had a broad range of experiences with fulfilling the lunch requirements during SY 2014-15. About 4 in 10 SFA directors (39 percent) reported facing few or no implementation challenges. More than a third (37 percent) reported some difficulties, and one-quarter (25 percent) reported many or a great deal of difficulties. (See Figure 1.)
Nearly all districts—98.5 percent—had met updated nutrition standards by December 2015.

6
Among SFA directors who reported difficulties, more than half said that the number of challenges either stayed the same (35 percent) or decreased (19 percent) since the initial implementation of the lunch requirements in SY 2012-13. The remaining 46 percent of directors reported that the number of challenges increased since the initial implementation of the lunch requirements.
Among SFA directors who reported difficulties in lunch menu-planning, the most common challenges were keeping sodium below the limit (78 percent), meeting the whole grain-rich requirement (60 percent), and holding calories below the maximums (54 percent). The SMART Expert Panel emphasized that the whole grain-rich requirements and the sodium target went into effect for the first time during SY 2014-15, so those were recent changes for SFA directors at the time of the survey. This may explain the increase in challenges for some districts, as most other lunch requirements had been in place since SY 2012-13.
As demonstrated in Serving Healthy School Meals: Despite Challenges, Schools Meet USDA Meal Requirements, the extent of challenges the SFAs encountered largely depended on how early they began making their changes. The SMART survey asked directors when they started making changes relative to when the bulk of the lunch requirements took effect, and nearly three-quarters (73 percent) reported that they began before SY 2012-13. One-fifth (20 percent) of respondents reported that they began making changes after the final regulations went
Figure 1
Nearly 40% of School Meal Directors Had Fewor No Difficulties Meeting Healthier Lunch StandardsExtent of challenges by percentage of respondents, SY 2014-15
Notes: The data are weighted to be representative of all public school food authorities offering the National School Lunch Program. Percentages might not total 100 percent because of rounding.
Source: School Meal Approaches, Resources, and Trends Study, 2015
© 2016 The Pew Charitable Trusts
31% A few challenges
8% No challenges 7% A great deal of
challenges
18% Many challenges
37% Some challenges

7
into effect. A subgroup analysis (data not shown) showed that slightly more early adopters (39 percent) reported few or no challenges in SY 2014-15, compared with those who waited for the standards to go into effect (35 percent).
BreakfastAmong the sampled SFAs that offer breakfast, 6 in 10 respondents (61 percent) reported facing few or no challenges in implementing the breakfast requirements during SY 2014-15. Twenty-nine percent reported some difficulties, and a small proportion (10 percent) reported many or a great deal of problems. (See Figure 2.)
Figure 2
More Than 60% of School Meal Directors Had Few or No Difficulties Meeting Healthier Breakfast StandardsExtent of challenges by percentage of respondents, SY 2014-15
Notes: The data are weighted to be representative of all public school food authorities offering the National School Lunch Program. Twenty-seven that do not offer breakfast were excluded.
Source: School Meal Approaches, Resources, and Trends Study, 2015
© 2016 The Pew Charitable Trusts
Some challenges29%
3% A great deal of challenges
Many challenges7%
Among the SFA directors who reported having trouble with the breakfast requirements, more than half said that the number of challenges either stayed the same (46 percent) or decreased (12 percent) since initial implementation. The remaining 39 percent reported that the number increased.
The most common challenges reported by SFA directors who said they encountered difficulties when planning breakfast menus were meeting the whole grain-rich requirement (55 percent), keeping sodium below the limit (50 percent), and holding total calories below the maximum (41 percent). Again, the whole grain and sodium
19% No challenges
42% A few challenges

8
Things like cycle menus are great tools, but those menus need to be driven by food taste testing and involvement in the classroom. If you haven’t involved your students, you’re probably not going to have great acceptance from them.” Linette Dodson, director of school nutrition, Carrollton City Schools, Georgia
requirements were implemented more recently than other standards, which may account for the greater challenges reported in association with them at the time of the survey.
Factors contributing to challenges in meeting meal requirementsThe survey asked respondents who faced at least one challenge to identify the factors that contributed to the problems they reported. The most commonly cited issues for both breakfast and lunch were the availability (80 percent) and cost (74 percent) of foods that meet meal requirements and are acceptable to students, and the availability of foods with appropriate sodium levels (61 percent). These findings align with those in Serving Healthy School Meals: Despite Challenges, Schools Meet USDA Meal Requirements, where the top challenge, identified by 76 percent of SFAs, was the availability and cost of products to meet the standards.12
Changes made to meal production or service to implement nutrition requirementsMost SFA directors (89 percent) reported making at least one change to their meal production or service to implement the updated breakfast and lunch requirements. The most common changes included moving to cycle menus (46 percent)—menus that offer different options every day and repeat after a fixed period, typically two to eight weeks—and using more pre-portioned condiments (44 percent) and salad dressings (40 percent). (See Figure 3.) Cycle menus save time and labor and help control food costs because regularly used items can be purchased in bulk,13 and, according to the SMART Expert Panel, buying condiments and dressings in pre-portioned amounts helps ensure that the servings will fit within daily and weekly nutrient requirements.
About one-third (31 to 33 percent) of SFA directors also reported making at least one of the following changes: preparing more or different foods from scratch, increasing menu options, expanding the use of salad bars, and purchasing more commercially prepared foods.
The analysis in Serving Healthy School Meals: Despite Challenges, Schools Meet USDA Meal Requirements showed that directors predicted such changes would be necessary. In 2012, 80 percent of districts wanted to implement standard recipes and preparation methods to meet lunch requirements, 55 percent planned to do more scratch cooking, and 28 percent were preparing to buy more ready-to-eat foods from vendors.14

9
Figure 3
Adding Cycle Menus and Pre-Portioned Condiments Helps Schools Meet Nutrition StandardsMost common changes made to meal production or service, by percentage of respondents
Notes: The data are weighted to be representative of all public school food authorities (SFAs) offering the National School Lunch Program. Respondents were asked, “Which of the following changes, if any, did your district make to meal production or meal service in order to implement the current meal requirements for lunch and breakfast?” These data reflect only SFA directors who reported at least one change to meal production or service. Multiple responses were allowed.
Source: School Meal Approaches, Resources, and Trends Study, 2015
© 2016 The Pew Charitable Trusts
Use more pre-portioned condiments to control portion size
Use more pre-portioned salad dressings to control portion size
Prepare more or di�erent foods from scratch
Increase menu options
Increase use of salad bars
Purchase more commercially prepared foods
Move to cycle menus
Richard Nowitz/Getty Images

10
Expert Experience: Training and Outreach Breed Success
The SMART Expert Panel reinforced the need for many of the changes reported by the survey respondents and offered several approaches to facilitate success in implementing updated meal standards:
Network
• Engage in informal sharing of recipes and ideas among food service directors across districts.
• Join food-buying co-ops or share vendors to procure quality ingredients and products.
• Reach out for support from food service directors in similar districts (i.e., size, region, and community type) who can serve as peer resources.
Prioritize training opportunities
• Participate in formal trainings, such as those offered through the Institute for Child Nutrition, the USDA’s Team Up for School Nutrition Success initiative, and the School Nutrition Association, which provide tailored technical assistance to school nutrition professionals.
• Take advantage of resources and training programs offered by state agencies that administer the Child Nutrition Programs.
• Access online information from the USDA’s Team Nutrition initiative, which provides recipes and best practices to support school meal programs.
Earn buy-in from stakeholders
• Communicate with administrators and food service staff about what changes you are making to the school meal programs, why, and how those modifications can improve the health and well-being of students.
• Develop outreach strategies to help students and parents understand the updated nutrition standards and participate in creating solutions.
• Promote the school meal program in the community and celebrate successes through social media, news outlets, and in-person events.
Panelists also emphasized that making numerous changes to meal production or service, involving students in the menu-planning process, and continually improving are all crucial components of success.
You have to re-challenge yourself, your staff, and the students and families. Reworking, re-taste testing, reviewing participation numbers—it’s constant reinvention!” Jeanne Reilly, director of food services, RSU14—Windham Raymond School District, Maine

11
Promoting healthy eating and reducing plate wasteSchools have had varying success getting students to accept and consume the healthier meals they are serving. To understand how some districts are accomplishing this goal, the survey asked questions relating to the promotion of healthy food and the reduction of plate waste. Overall, the SMART survey findings show that although most districts are implementing at least one strategy, many are using several. The SMART Expert Panel agreed that using multiple approaches has been a key to success in their districts.
Survey respondents most commonly reported employing passive strategies (e.g., displaying posters and signs in the cafeteria, posting nutrition education messages on menus or websites, providing teachers and parents with promotional material), but these were not perceived to be the most effective. The strategies that received the highest efficacy scores from SMART expert panelists, such as changing lunch or recess schedules or extending the lunch period, were less likely to be implemented.
The SMART expert panelists emphasized the need to embrace active approaches (e.g., conducting cooking demonstrations with staff, performing taste tests with children, working with administrators to change the cafeteria environment and meal schedule). They agreed that active strategies are more effective than passive ones in promoting positive perceptions of school nutrition programs among parents and teachers and in cultivating lifelong healthy eating habits among students.
Strategies to promote healthy eating among studentsMost SFA directors (87 percent) said they used at least one strategy to promote healthy eating in their district, but the average respondent reported employing a combination of three strategies. Displaying posters and signs in the cafeteria was the most common approach (91 percent), followed by providing nutrition education messages on the food service website or posted menus (58 percent) and inviting family members to join students for school meals (44 percent). Approximately one-quarter of SFA directors reported conducting schoolwide events to promote nutrition education (27 percent) or community events to encourage good nutrition and physical activity (22 percent). (See Table 1.) In addition, more than one-third of directors (36 percent) reported that their SFA required schools to provide classroom-based nutrition education.
I volunteer to emcee the Christmas concert so that I can speak to parents in the audience and build our brand as nutrition experts. I tell them that good music and recipes are similar; both are about bringing all of the components together and jazzing them up to make it interesting.” Roger Kipp, director of food services and nutrition, Norwood City School District, Ohio

12
Strategy* Percentage of respondents
Display posters and signs in cafeteria 91.1
Provide nutrition education messages on food service menus or website 57.6
Invite family members to consume school meals 44.4
Conduct schoolwide events to promote nutrition 27.4
Conduct or participate in community events to promote nutrition and physical activity 21.8
Conduct cooking demonstrations or other activities 18.1
Require school food service staff to be present at parent meeting 16.3
Other† 3.2
Number of SFAs (unweighted) 429
Number of SFAs (weighted) 11,843
Notes: The data are weighted to be representative of all public school food authorities (SFAs) offering the National School Lunch Program. Respondents were asked, in addition to classroom-based nutrition education, “What other strategies are used to promote healthy eating in your district?” These data reflect only SFA directors who reported using at least one strategy. Multiple responses were allowed.
* The number of strategies used ranged from one to seven, with an average of three.
† Other strategies reported include participating in the Fresh Fruit and Vegetable Program, providing nutrition education to students in classrooms and during physical education, conducting taste tests, and forming a student food committee.
Source: School Meal Approaches, Resources, and Trends Study, 2015
© 2016 The Pew Charitable Trusts
Table 1
Most School Meal Directors Offer Educational Messages to Encourage Healthy EatingStrategies used to promote nutrition
Reducing plate waste at lunchPlate waste refers to the amount of food students select as part of reimbursable school meals but leave uneaten. The survey asked SFA directors to report whether they observed changes in plate waste at lunch since the updated meal requirements took effect. Most (79 percent) noticed either an increase or decrease over the past three years, 12 percent did not, and 9 percent did not know.
When asked about waste of specific food and beverage items, about three-quarters of SFA directors reported no change for milk (77 percent) and meat and meat alternates or other entrees (74 percent). For grains, 43 percent reported no change, but 45 percent reported more waste. More than half (54 percent) of respondents reported that plate waste had increased for fruits, and three-quarters (75 percent) said that the amount of vegetable waste had increased. (See Figure 4.)

13
Figure 4
Plate Waste at Lunch Showed Mixed Results After Updates to School Nutrition StandardsPerceived changes in waste, by food group
Notes: The data are weighted to be representative of all public school food authorities offering the National School Lunch Program. Percentages for each food group might not total 100 percent because of rounding.
Source: School Meal Approaches, Resources, and Trends Study, 2015
© 2016 The Pew Charitable Trusts
Perc
enta
ge o
f res
pond
ents
Less waste No change More waste Missing
Milk Vegetables Grains Meat/meat alternatives or other entrees
Fruits
54%
30%
15%
1%
75%
16% 9%
1%
45%
43% 8%
4%
9%
74%
12%
5% 4%
8% 77%
12%
Most directors (82 percent) reported using at least one strategy to reduce plate waste, but on average, SFA directors said they used a combination of four approaches. The most frequently reported methods were training staff to encourage students to try unfamiliar foods (71 percent), providing nutrition education to help students understand the importance of eating healthy (48 percent), and performing taste tests with students (44 percent). About one-third (31 to 38 percent) of respondents said they redistributed uneaten or sealed foods, changed the cafeteria environment, and ensured that classroom celebrations do not compete with school meals.
SFA directors perceived the three most frequently used strategies to reduce plate waste as being somewhat or slightly effective (61 to 70 percent). However, more than one-third (38 percent) reported that performing taste tests with students was extremely or moderately effective. (See Table 2.)
Perc
enta
ge o
f res
pond
ents
Less waste No change More waste Missing
Milk Vegetables Grains Meat/meat alternatives or other entrees
Fruits
54%
30%
15%
1%
75%
16% 9%
1%
45%
43% 8%
4%
9%
74%
12%
5% 4%
8% 77%
12%

14
Note: The data are weighted to be representative of all public school food authorities (SFAs) offering the National School Lunch Program.
* Respondents were asked, “Please indicate whether your district has used any of the following strategies to help reduce plate waste.” These data reflect only SFA directors who reported using at least one strategy. Multiple responses were allowed. The number of strategies used ranged from one to 11, with an average of four.
† Respondents were asked, “For each of the strategies your district used to help reduce plate waste, please indicate how effective you perceive that strategy was in reducing plate waste.” These data reflect only SFA directors who reported using each strategy.
‡ Other strategies reported include altering portion sizes, hiring food consultants, conducting focus groups, posting signage to discourage waste, and modifying menus.
Source: School Meal Approaches, Resources, and Trends Study, 2015
© 2016 The Pew Charitable Trusts
Table 2
School Food Directors Say Student Taste Tests Reduce Plate WasteType and perceived effectiveness of strategies used, by percentage of respondents
Strategy
Percentage of SFAs
that used strategy*
Perceived effectiveness†
Extremely or moderately
effective
Somewhat or slightly effective
Not effective Missing
Encourage students to try unfamiliar foods 70.8 22.5 70.2 5.6 1.8
Provide nutrition education to students 48.2 10.4 68.5 20.1 1.0
Perform taste tests of new foods with students 44.2 37.6 60.5 1.9 0.0
Redistribute uneaten, sealed foods 37.9 40.9 53.2 4.7 1.3
Change the cafeteria environment 31.5 22.4 67.6 10.0 0.0
Ensure that classroom celebrations do not compete with school meals 31.1 28.4 55.8 15.9 0.0
Provide parents with promotional materials 28.5 10.1 55.1 33.1 1.9
Provide teachers with promotional materials 20.4 5.3 66.4 28.3 0.0
Provide teachers with nutrition education 17.3 8.2 64.5 24.2 3.1
Work with administrators to change lunch or recess schedules 14.6 22.9 56.2 20.8 0.0
Hire outside chefs to develop new recipes 6.4 38.3 54.8 4.3 2.7
Other‡ 4.5 62.5 23.8 0.0 13.6
Increase length of meal periods 4.2 24.9 61.3 8.0 5.7
Number of SFAs (unweighted) 407
Number of SFAs (weighted) 11,117

15
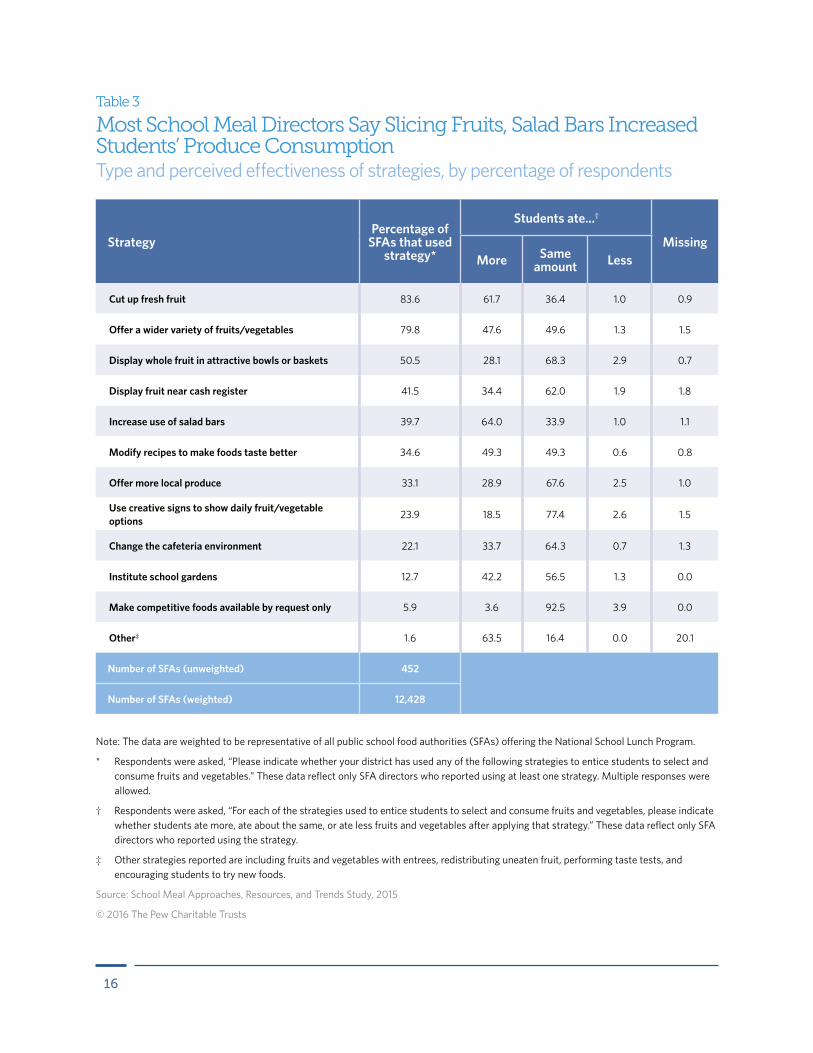
Strategies to encourage students to select and consume fruits and vegetablesIn addition to strategies used to promote healthy eating, the survey asked SFA directors about specific approaches to encourage students to select and consume more fruits and vegetables. Most respondents (92 percent) reported using at least one and an average of four methods. Cutting up fresh fruit to make it easier for young students to eat (84 percent) and offering a wider variety of choices (80 percent) were the most frequently used strategies. Close to half of SFA directors reported displaying whole fruit in attractive bowls or baskets (51 percent) and near the cash register (42 percent) and increasing the use of salad bars (40 percent). (See Table 3.)
The survey asked whether directors thought that the individual strategies led to students eating more, about the same amount, or less fruits and vegetables. More than 60 percent of SFA directors who reported cutting up fresh fruit or increasing the use of salad bars said that students ate more fresh produce as a result. Almost half (48 percent and 49 percent, respectively) of respondents who said they offered a wider variety of fruits and vegetables or modified recipes thought that these efforts led students to eat more of those foods.
MealtimeThe length and start time of school lunch periods can affect children’s ability to eat all of their meal. SFA directors reported a wide range of lunch durations, from 10 minutes to 1.5 hours. In more than half of SFAs (58 percent), the first lunch period started before 11 a.m.
Nearly half (47 percent) of districts have employed at least one strategy to increase the amount of time children have to eat lunch. The most common were cafeteria-based approaches to expedite meal purchasing, including providing all required components in every serving line or food station (68 percent), adding more serving lines or food stations (40 percent), offering more “grab and go” options (38 percent), and increasing the number of cashiers or checkout stations (30 percent). Other strategies included working with school administrators to modify lunch schedules (adding lunch periods, staggering schedules between grades, planning recess before lunch) but were reported by just 3 percent of SFAs.
Alex Pitt
16
Note: The data are weighted to be representative of all public school food authorities (SFAs) offering the National School Lunch Program.
* Respondents were asked, “Please indicate whether your district has used any of the following strategies to entice students to select and consume fruits and vegetables.” These data reflect only SFA directors who reported using at least one strategy. Multiple responses were allowed.
† Respondents were asked, “For each of the strategies used to entice students to select and consume fruits and vegetables, please indicate whether students ate more, ate about the same, or ate less fruits and vegetables after applying that strategy.” These data reflect only SFA directors who reported using the strategy.
‡ Other strategies reported are including fruits and vegetables with entrees, redistributing uneaten fruit, performing taste tests, and encouraging students to try new foods.
Source: School Meal Approaches, Resources, and Trends Study, 2015
© 2016 The Pew Charitable Trusts
Table 3
Most School Meal Directors Say Slicing Fruits, Salad Bars Increased Students’ Produce ConsumptionType and perceived effectiveness of strategies, by percentage of respondents
StrategyPercentage of
SFAs that used strategy*
Students ate...†
MissingMore Same
amount Less
Cut up fresh fruit 83.6 61.7 36.4 1.0 0.9
Offer a wider variety of fruits/vegetables 79.8 47.6 49.6 1.3 1.5
Display whole fruit in attractive bowls or baskets 50.5 28.1 68.3 2.9 0.7
Display fruit near cash register 41.5 34.4 62.0 1.9 1.8
Increase use of salad bars 39.7 64.0 33.9 1.0 1.1
Modify recipes to make foods taste better 34.6 49.3 49.3 0.6 0.8
Offer more local produce 33.1 28.9 67.6 2.5 1.0
Use creative signs to show daily fruit/vegetable options 23.9 18.5 77.4 2.6 1.5
Change the cafeteria environment 22.1 33.7 64.3 0.7 1.3
Institute school gardens 12.7 42.2 56.5 1.3 0.0
Make competitive foods available by request only 5.9 3.6 92.5 3.9 0.0
Other‡ 1.6 63.5 16.4 0.0 20.1
Number of SFAs (unweighted) 452
Number of SFAs (weighted) 12,428

17
Expert Experience: More Healthy Eating, Less Plate Waste
Working collaboratively with food service staff, administrators, parents, and students is important to promote healthy eating and reduce plate waste. The SMART Expert Panel shared specific approaches they used successfully in their districts:
Community
• Conduct or participate in community events, such as local chefs’ conferences, to publicize the school nutrition program.
• Partner with organizations in the community that promote nutrition and physical activity, such as hospitals and farmers’ markets.
• Invite local media outlets to cover school nutrition success stories.
Food service staff
• Conduct cooking demonstrations and taste tests with food service staff so they know how to prepare and serve new menu items.
• Work with school nutrition personnel to expand the variety of healthy foods in the cafeteria such as by adding “grab and go” meals and whole fruit as a la carte options.
• Deploy food service staff to serve as cafeteria greeters, cashiers, and salad bar monitors to promote healthy eating and reduce the amount of time children wait in line.
Administrators and teachers
• Explain to administrators and teachers that lunchtime can be as educational as math and science because the cafeteria is a place where children can develop food preferences that lead to lifelong healthy eating behaviors.
• Establish a “school staff eat free day,” when administrators and teachers can sample school meals and model healthy eating to students.
• Help administrators understand the importance of making sure students have enough time to eat, and work with them to develop appropriate lunch and recess schedules.
• Work with local school wellness groups or offer to have the food service department cater classroom celebrations to ensure that those events do not compete with school meals and that the healthy habits students learn in the cafeteria are reinforced throughout the day.
• Perform taste tests in the classroom to allow teachers and students to try new foods, create positive impressions of school meals, and encourage teachers to model healthy eating behaviors.
• Educate administrators on the child nutrition programs the district may qualify for, including the USDA’s Fresh Fruit and Vegetable and Farm to School programs, and help them understand the benefit these programs can have for students’ health and well-being.
Continued on next page
18
Parents
• Connect with parents at “back to school” nights to explain the value, variety, convenience, healthfulness, and quality of meals offered at school.
• Put out sampling trays during parents’ nights, special events, and Parent Teacher Association or Organization meetings so that parents can try the food their children will be eating.
• Volunteer in nontraditional school roles and on committees to increase awareness of the food service program and educate parents on the importance of healthy eating.
Students
• Perform taste tests with students to introduce them to new foods and gain insights to help tailor menus to meet their preferences.
• Offer a selection of fruit and vegetables, such as with a salad bar or fruit and vegetable bar.
• Allow students to feel empowered by serving some components of the meal themselves, which may increase the likelihood that they’ll eat their selections.
• Employ “Smarter Lunchroom” techniques, such as cutting up fruits and vegetables to make them easier for young children to eat, to make healthy foods convenient and attractive, and to nudge students toward healthier choices.
• Institute school gardens, in collaboration with teachers and parents if possible, so children can participate in growing the fruits and vegetables they will be offered in the lunchroom.
• Invite students to create posters and signs that promote healthy eating.
• Offer fruit and vegetable selections as a la carte items to expose all students—including those who bring their lunch from home—to healthier snack options.
Every student goes through the salad bar line first. We redeployed our staff so there was an adult on both sides to engage and encourage them.”Rodney Taylor, director of food and nutrition services, Fairfax County Public Schools, Virginia
Getting the school administrators and staff to understand that lunchtime is educational is huge. Yes, these kids are going to use math and science, but they’re going to eat food every day. We’re making sure the cafeteria is really a learning lab.” Sal Valenza, school nutrition director, West New York School District, New Jersey
19
Trends in student participation in and revenue from school nutrition programsStudent participation is a key measure of the success of school meal programs. Nationally, school breakfast participation has steadily increased since 1970.15 Total school lunch participation has risen and dipped over the program’s 70-year history, reaching its all-time peak in 2010. The number of students who receive free lunches continues to grow, while the amount qualifying for a reduced price has stayed level. Participation by students who pay full price has been declining since SY 2007-08.16
A variety of factors can influence participation rates, such as meal timing, prices, competing food availability, recipe and menu adjustments, and open campuses. The survey explored the reasons for the most recent trends and strategies for growing participation in the program.
The SMART expert panelists have all been successful in maintaining or growing participation in and revenue from their school nutrition programs since the advent of updated standards in 2012. They emphasized that growing participation while supervising other elements of the program was equivalent to managing a business. It requires attention not only to following rules and meeting standards, but also to marketing, finance, and administration. Panelists discussed the need to continually innovate in all areas of a program, from fine-tuning menus to changing perceptions of school food service among students, parents, administrators, and the community. They also noted that decreases in revenue from a la carte items can sometimes lead to increases in student participation in the meal program and in overall revenue, as predicted in the Kids’ Safe and Healthful Foods Project’s 2012 report, Health Impact Assessment: National Nutrition Standards for Snack and a la Carte Foods and Beverages Sold in Schools.17 In other situations, the panelists noted that income from competitive foods contributes to a district’s broader financial status. The survey findings align with this observation: Some programs that reported a decrease in revenue from reimbursable meals also had an overall maintenance or increase in revenue when including sales of non-reimbursable foods.
Student participation trendsThe survey asked SFA directors to indicate which changes, if any, they perceived in student participation since SY 2011-12—the year before the updated lunch standards took effect. More than half of respondents reported that participation either stayed the same (40 percent) or increased (13 percent) during the first year of implementation of the lunch requirements (SY 2012-13). Another 42 percent said they saw a decrease in student participation during the same period. About 50 percent of directors reported observing declines in participation over the next two school years compared with SY 2011-12. (See Figure 5.)
Most SFA directors (86 percent) reported employing at least one strategy to maintain or increase student participation in the meal programs, with the average respondent using a combination of five. The most frequently reported approaches included:
• Training staff to encourage students to try unfamiliar foods (69 percent).
• Providing nutrition education on the importance of eating a healthy meal (42 percent).
• Conducting assessments or surveys to gauge the level of interest that students, parents, and the community have in meal programs (41 percent).

20
• Working with school wellness representatives to ensure that classroom celebrations do not compete with school lunches (40 percent).
• Giving parents promotional materials explaining the value, variety, convenience, healthfulness, and quality of school meals (35 percent).
Respondents most commonly reported that these strategies were somewhat or slightly effective in maintaining or increasing student participation in the school meal programs. The approaches rated most successful were offering breakfast outside the cafeteria and using the Community Eligibility Provision (CEP), though these were not used as often; just 14 percent of SFA directors reported using CEP, for example. This may be because it is a relatively new option, having been made available starting in SY 2014-15, or because not all schools are able to participate.18
To better identify successful strategies, the researchers compared approaches used by SFA directors who reported stable or growing participation since implementation of the lunch requirements with those of respondents who experienced a decrease. The examination found that a larger proportion of SFAs with steady or increased student participation in their meal programs reported preparing more or different foods from scratch (38 percent versus 30 percent) and increasing the use of salad bars (37 percent versus 29 percent), compared with those with decreased participation (data not shown). Conversely, more of the SFAs that perceived a decline reported purchasing more commercially prepared foods (38 percent versus 22 percent) and decreasing menu options (30 percent versus 20 percent).
Figure 5
Since Lunch Standards Changed, Directors Say Student Participation Has Fluctuated Three-year changes in program use, by percentage of respondents
Notes: The data are weighted to be representative of all public school food authorities offering the National School Lunch Program. Percentages might not total 100 percent because of rounding.
Source: School Meal Approaches, Resources, and Trends Study, 2015
© 2016 The Pew Charitable Trusts
Increased Stayed the same Decreased Missing
Between SY 2011–12 and SY 2013–14
Between SY 2011–12 and SY 2014–15
13% 40% 42% 6%
15% 28% 51% 6%
20% 24% 50% 6%
Between SY 2011–12 and SY 2012–13

21
Revenue trends Reimbursable meals
The survey also asked SFA directors to indicate their perceived changes, if any, in revenue from reimbursable school meals since SY 2011-12. More than half reported that it either stayed the same (37 percent) or increased (18 percent) during the first year of the lunch requirements (SY 2012-13), while 41 percent said it decreased. For each of the subsequent two school years, nearly equal percentages of SFA directors reported that revenue stayed the same (27 percent in 2013-14 and 25 percent in 2014-15), increased (22 percent and 23 percent) or declined (47 percent and 48 percent), compared with SY 2011-12. (See Figure 6.)
Figure 6
About Half of School Meal Programs Have Seen Stable or Increasing Revenue From Federal ReimbursementsThree-year revenue changes, by percentage of respondents
Notes: The data are weighted to be representative of all public school food authorities offering the National School Lunch Program. Percentages might not total 100 percent because of rounding.
Source: School Meal Approaches, Resources, and Trends Study, 2015
© 2016 The Pew Charitable Trusts
18% 37% 41% 4%
Between SY 2011–12 and SY 2012–13
22% 27% 47% 4%
Between SY 2011–12 and SY 2013–14
23% 25% 48% 4%
Between SY 2011–12 and SY 2014–15
Increased Stayed the same Decreased Missing
Combined revenue
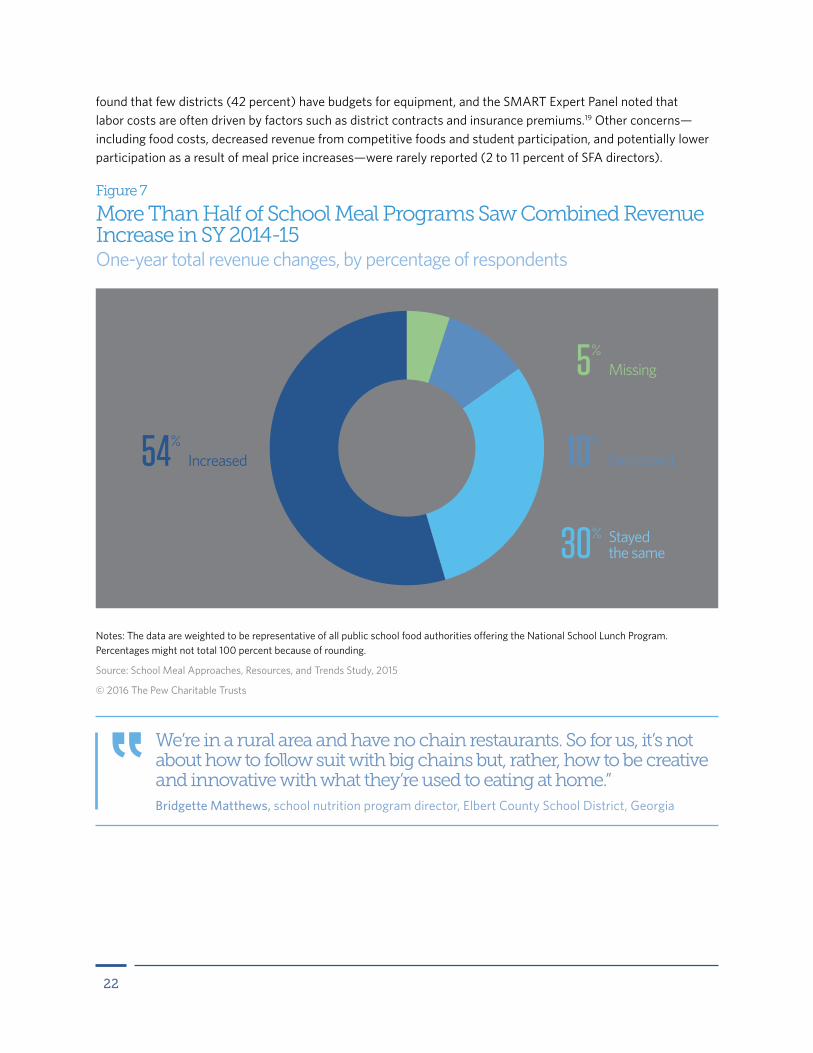
For some SFAs, sales of competitive foods supplement those of reimbursable meals, contributing to overall school food service revenue. When asked about any changes in total revenue, more than half (54 percent) of directors said their total revenue increased between SY 2013-14, the year after most updated meal requirements were implemented, and SY 2014-15, when Smart Snacks standards took effect. Almost one-third (30 percent) reported that total revenue stayed the same, and 10 percent reported a decrease. (See Figure 7.)
Overall, 87 percent of SFA directors reported having financial concerns, but many were due to nonfood expenses. In particular, they most frequently cited equipment costs (38 percent) and labor costs (33 percent) as causes of financial burden. The second Serving Healthy School Meals report, U.S. Schools Need Updated Kitchen Equipment,
22
found that few districts (42 percent) have budgets for equipment, and the SMART Expert Panel noted that labor costs are often driven by factors such as district contracts and insurance premiums.19 Other concerns—including food costs, decreased revenue from competitive foods and student participation, and potentially lower participation as a result of meal price increases—were rarely reported (2 to 11 percent of SFA directors).
Figure 7
More Than Half of School Meal Programs Saw Combined Revenue Increase in SY 2014-15 One-year total revenue changes, by percentage of respondents
Notes: The data are weighted to be representative of all public school food authorities offering the National School Lunch Program. Percentages might not total 100 percent because of rounding.
Source: School Meal Approaches, Resources, and Trends Study, 2015
© 2016 The Pew Charitable Trusts
54% Increased
Stayed the same30%
5%Missing
Decreased 10%
We’re in a rural area and have no chain restaurants. So for us, it’s not about how to follow suit with big chains but, rather, how to be creative and innovative with what they’re used to eating at home.” Bridgette Matthews, school nutrition program director, Elbert County School District, Georgia

23
Expert Experience: Building Student Participation and Revenue
During their discussion, the SMART Expert Panel devised the six C’s to describe specific approaches they use to maintain or increase student participation in and revenue from their school nutrition programs:
Culture
• Treat the cafeteria as a restaurant and the students as customers. Demonstrate that student input matters by offering more of the menu items they select most.
• Build trust through engagement and nutrition education so students are more willing to try new foods.
• Train nutrition staff to understand that the meal program is a business that requires an investment. Quality ingredients may be more expensive, but appealing dishes can attract new students and boost revenue.
• Work with all school personnel, including district and administrative staff, to build and implement a strong curriculum of health and wellness with consistent messaging from the district level to the classroom and cafeteria.
Creativity
• Engage students through a menu-planning challenge in which they design meals that meet the standards, market them to classmates, and ultimately have their creations served in the cafeteria.
• Explore nontraditional ways to offer reimbursable meals to students, such as through vending machines, which can attract customers who may not have purchased meals in a serving line.
• Increase menu choices by incorporating seasonal fruits and vegetables.
• Follow food trends, but consider the school culture. Students more familiar with fast-casual restaurants may appreciate menu items such as burrito bowls, wraps, and salads, which mimic dishes they purchase commercially. Those more accustomed to home-cooked meals might prefer innovative interpretations of those dishes.
Collaboration
• Share resources (e.g., recipes, cycle menus, cooking techniques) with and borrow them from nutrition professionals in districts of comparable size, community type, and region.
• Partner with other districts to identify needs and provide joint trainings for food service personnel.
• Participate in purchasing cooperatives with other districts to maximize buying power for quality ingredients, paper goods, and small equipment.
Continued on next page
24
• Work with administrators, teachers, and other staff to expose children to aspects of the school meal program they may be less familiar with, such as by asking the principal to bring students through the cafeteria in the morning to learn about the breakfast program.
Communication
• Use social media to connect with parents and explain the convenience, quality, and healthfulness of school meals.
• Display posters and signs and offer nutrition education to encourage students who bring lunch to try the school meal program.
• Educate administrators on the importance of school meals to student wellness and academic achievement, and tie nutrition education to broader school and district goals so all staff are working to create a culture of health.
Consistency
• Consistently produce high-quality meals and innovate regularly to keep students enthusiastic about the food.
• Examine participation numbers often (at least monthly) and review menu items to identify which were successful and eliminate others.
• Promote the program to administrators frequently and offer regular, quality training opportunities for nutrition staff.
Celebration
• Invite local media to a special event for the school meal program.
• Thank school nutrition staff for their efforts in preparing and marketing new menu items or participating in special events.
• Share success stories with administrators, parents, and the community.
If you get back to quality food, I don’t think you can go wrong. I probably do spend more money on quality foods, and I think that’s just good business.” Linette Dodson, director of school nutrition, Carrollton City Schools, Georgia
You have to celebrate your staff’s hard work. When I asked them to make 500 sandwiches that look like monsters, they didn’t roll their eyes. They did it, and our lunch participation was higher. All we did was decorate!”Jeanne Reilly, director of food services, RSU14—Windham Raymond School District, Maine

25
Schools step up to the Smart Snacks standardsIn addition to complete meals, many districts offer snacks and drinks that students may purchase separately. Until the USDA issued its Smart Snacks standards in 2013, the regulation of these foods and beverages varied widely among states and even districts. Even today, these foods are frequently not all under the control of the school nutrition program—some, for example, may be provided by other school departments, clubs, or private vending machine operators—so SFA directors may have limited authority to regulate them. Such competition from less healthy foods can affect the success of meal programs. To examine the potential impact of competitive foods and beverages, the survey asked SFA directors to report their experiences during the first year of Smart Snacks implementation (SY 2014-15).
The SMART Expert Panel also discussed the service of competitive foods and generally advocated two strategies to mitigate the challenges. First, panelists from several districts explained how they eliminated or reduced snack offerings to encourage more students to purchase healthy school meals, leading to greater reimbursement revenue. A second approach was to continue to offer competitive foods, but to choose more nutritious versions of snacks and beverages, making the entire school nutrition environment healthier. Panelists using the second approach were more likely to consider the sales of competitive foods as an important contributor to their total food service revenue.
Panel members also noted that the geographic setting of their school districts influenced the success of competitive food sales. For example, some directors in urban districts found that they could reinforce healthy eating habits by offering more nutritious versions of snacks and beverages that students could purchase from nearby convenience stores. In rural districts, where students have fewer food buying options, some directors reported that greatly reducing or eliminating a la carte or vending machine options was feasible. Regardless of approach, the panelists noted that successful implementation of nutrition standards for competitive foods required collaboration with the administration to ensure that the whole school community—including those conducting fundraising—was engaged in enhancing student nutrition.
XiXinXing/Getty Images

26
Timing of Smart Snacks standards implementationMore than a third (38 percent) of SFAs started to implement the Smart Snacks standards before the requirements took effect in SY 2014-15, and 23 percent began at the time of the launch. In contrast, about a quarter (26 percent) of SFA directors reported that they had not yet started to implement the standards as of spring 2015, when the survey was conducted. (See Figure 8.)
23% During SY 2014–15
Figure 8
Nearly 40% of School Districts Began Applying Smart Snacks Standards Ahead of Schedule Timing of implementation, by percentage of respondents
Notes: The data are weighted to be representative of all public school food authorities offering the National School Lunch Program. Fourteen reported that their districts do not sell competitive foods and were excluded. The Smart Snacks standards went into effect in SY 2014-15 as an interim final rule. Percentages might not total 100 percent because of rounding.
Source: School Meal Approaches, Resources, and Trends Study, 2015
© 2016 The Pew Charitable Trusts
35% After 2011, but before SY 2014–15
3% Before SY 2010–11 2% Missing
11% Don’t know
26% Had not yet started to implement standards

27
Reach of Smart Snacks standardsThe survey asked SFA directors to report the extent to which competitive foods sold by their departments and by other entities (e.g., school fundraisers or vending machines operated by other school departments) met the Smart Snacks standards. Two-thirds (66 percent) of SFA directors reported that all competitive foods sold by their department met the Smart Snacks standards. In contrast, 19 percent reported that all of the foods sold outside the department met the standards. (See Table 4.)
Barriers to Smart Snacks implementation SFA directors who reported that not all of the competitive foods sold by the food service department meet the Smart Snacks standards also shared barriers they faced in implementing the requirements. The most frequently reported challenges among those experiencing difficulty were student acceptance (70 percent), cost (61 percent), availability of competitive foods that meet the standards (59 percent), faculty and staff reactions (58 percent), and kitchen staff understanding of the standards (43 percent).
Notes: The data are weighted to be representative of all public school food authorities (SFAs) offering the National School Lunch Program. Fourteen reported that their districts do not sell competitive foods and were excluded. Compliance with Smart Snacks standards was self-reported by SFA directors. Percentages may not total 100 percent because of rounding.
Source: School Meal Approaches, Resources, and Trends Study, 2015
© 2016 The Pew Charitable Trusts
Table 4
Two-Thirds of School Meal Programs Claimed Full Compliance With Smart Snacks StandardsShare of competitive foods that comply
Percentage of respondents
Foods sold by the food service department
Foods sold outside of the food service department
All foods 66.0 19.4
Most foods 16.2 19.4
Some foods 3.5 15.6
Few foods 0.4 11.3
No foods 1.0 5.5
Don’t know 10.2 26.5
Missing 2.7 2.2
Number of SFAs (unweighted) 475
Number of SFAs (weighted) 13,178
28
RecommendationsBased on the survey findings and the suggestions of the SMART Expert Panel, the Kids’ Safe and Healthful Foods Project recommends that school districts; local, state, and federal policymakers; food service directors; parents; and community organizations embrace the following strategies to help support meal programs and ensure that students are getting the nutrition they need to succeed in school while also building lifelong healthy habits:
Prioritize school nutrition as part of a broader culture of health and education in the school district Local policymakers, school officials, and food service directors should work together to:
• Encourage greater community involvement in setting school wellness goals and regularly report to students, families, and other stakeholders on progress toward them.
• Identify and seize additional opportunities to ensure that students are well-nourished and ready to learn, such as by offering school breakfast and after-school meals and snacks, and by participating in the Community Eligibility Provision to make lunches available to all kids free of charge.
• Integrate nutrition education into regular classroom lessons and encourage teachers to partner with food service staff when possible.
• Develop lunch and recess schedules and cafeteria procedures that provide students with enough time to eat.
• Support the full implementation of Smart Snacks standards across campus and limit exemptions for fundraisers or other special occasions regardless of state allowances and especially before and during mealtimes.
• Establish regular communication between food service directors and administrators, including superintendents and principals. Include opportunities for food service directors to present during professional development days and use local wellness policies and committees to bolster efforts around school meal programs.
• Expand community access to cafeteria and kitchen spaces and infrastructure whenever possible to permit positive shared use activities.
Adopt federal and state policies and make investments that maximize student access to healthy meals Federal and state policymakers should:
• Maintain and support the ongoing implementation of consistent nutrition standards.
• Provide funding for school kitchen equipment and infrastructure upgrades and training and technical assistance for staff to help schools serve healthy and appealing meals. Whenever possible, enact state funding mechanisms to leverage and expand federal investment in modern kitchens and updated equipment.
• Support the implementation of the Smart Snacks standards by setting strong policies to ensure that unhealthy fundraisers do not compete with school meals.
• Set policies that support adequate time for students to consume school meals.

29
Notes: The data are weighted to be representative of all public school food authorities (SFAs) offering the National School Lunch Program. Respondents were asked, “Have the number of challenges increased, stayed the same, or decreased since the initial implementation of the meal requirements for lunch (School Year 2012-13)?” These data reflect only SFA directors who reported challenges in implementing meal requirements for lunch in SY 2014-15.
Source: School Meal Approaches, Resources, and Trends Study, 2015
© 2016 The Pew Charitable Trusts
Number of challenges... Percentage of respondents
Increased 46.0
Stayed the same 35.3
Decreased 18.7
Number of SFAs (unweighted) 452
Number of SFAs (weighted) 12,538
Table A.1
Change in Challenges Associated With Lunch Requirements Since SY 2012-13
Collaborate with schools in the community to facilitate nutrition program success Nonprofit and for-profit organizations with an interest in improving children’s health and wellness, community partners, and parents should:
• Provide volunteers to reduce resource gaps in schools, such as cafeteria monitors.
• Help schools plan and execute healthy fundraising activities.
• Offer free training in expertise areas, such as business management, nutrition education, or marketing.
• Advocate for policies that will support the work of school nutrition programs.
• Serve on or support the work of local wellness committees.
ConclusionAlthough their results vary significantly, many school districts across the country are successfully serving healthier meals and snacks to students every day. This survey demonstrates that SFAs are using an array of creative strategies to promote healthy eating, increase students’ acceptance of new foods, reduce plate waste, and maintain or increase participation in school meal programs. Districts experiencing the greatest success are generally implementing multiple strategies and often taking advantage of some of the less common but more effective methods for overcoming challenges.
Networking with other food service directors, offering ongoing training opportunities for school nutrition staff, earning buy-in from administrators and parents, and involving students in the menu-planning process can improve schools’ ability to serve healthier meals and snacks. Policymakers should make resources and technical assistance available to help districts achieve long-term success in running school meal programs to ensure that students are well-nourished and ready to learn.
Appendix A: Tables from the SMART survey

30
Table A.2
Significant Lunch Menu Planning Challenges
Challenge Percentage of respondents
Sodium limit 78.4
Whole grain-rich requirement 60.1
Calorie maximum 53.9
Weekly amounts for vegetable subgroups 43.2
Daily or weekly amounts for total grains 25.7
Daily or weekly amounts for total vegetables 24.4
Daily or weekly amounts for fruit 22.7
Calorie minimum 20.5
Saturated fat limit 19.1
Restriction on types of milk 12.0
Daily or weekly amounts for meats or meat alternates 10.3
Trans fat limit 10.0
Number of SFAs (unweighted) 381
Number of SFAs (weighted) 10,514
Notes: The data are weighted to be representative of all public school food authorities (SFAs) offering the National School Lunch Program. Respondents were asked, “Which of the following meal requirements, if any, are currently a significant challenge for your district when planning lunch menus?” These data reflect only SFA directors who reported facing at least one significant challenge in implementing lunch requirements in SY 2014-15. Multiple responses were allowed.
Source: School Meal Approaches, Resources, and Trends Study, 2015
© 2016 The Pew Charitable Trusts
Table A.3
Timing of Program Changes Made to Meet Updated Lunch Standards
Changes began... Percentage of respondents
Before proposed regulations (pre-January 2011) 39.0
When regulations were first proposed (between January 2011 and January 2012) 33.9
After final regulations went into effect (post-July 2012) 20.0
Had not yet started 0.2
Don’t know 6.8
Missing 0.2
Number of SFAs (unweighted) 489
Number of SFAs (weighted) 13,570
Notes: The data are weighted to be representative of all public school food authorities offering the National School Lunch Program. Percentages might not total 100 percent because of rounding.
Source: School Meal Approaches, Resources, and Trends Study, 2015
© 2016 The Pew Charitable Trusts

31
Table A.4
Change in Challenges Associated With Breakfast Requirements Since SY 2013-14
Number of challenges... Percentage of respondents
Increased 38.9
Stayed the same 46.3
Decreased 12.2
Don’t know 2.3
Missing 0.3
Number of SFAs (unweighted) 379
Number of SFAs (weighted) 10,404
Notes: The data are weighted to be representative of all public school food authorities (SFAs) offering the National School Lunch Program. Respondents were asked, “Have the number of challenges increased, stayed the same, or decreased since the initial implementation of the meal requirements for breakfast (SY 2013-14)? These data reflect only SFA directors who reported facing challenges in implementing breakfast requirements in SY 2014-15.
Source: School Meal Approaches, Resources, and Trends Study, 2015
© 2016 The Pew Charitable Trusts
Table A.5
Significant Breakfast Menu Planning Challenges
Challenge Percentage of respondents
Whole grain-rich requirement 54.5
Sodium limit 49.8
Calorie maximum 40.8
Daily or weekly amounts for fruit 36.8
Daily or weekly amounts for total grains 20.9
Calorie minimum 13.4
Saturated fat limit 13.3
Restriction on types of milk 8.7
Trans fat limit 5.9
Number of SFAs (unweighted) 285
Number of SFAs (weighted) 7,810
Notes: The data are weighted to be representative of all public school food authorities (SFAs) offering the National School Lunch Program. Respondents were asked, “Which of the following meal requirements, if any, are currently a significant challenge for your district when planning breakfast menus?” These data reflect only SFA directors who reported facing at least one significant challenge in implementing breakfast requirements in SY 2014-15. Multiple responses were allowed.
Source: School Meal Approaches, Resources, and Trends Study, 2015
© 2016 The Pew Charitable Trusts

32
Table A.6
Factors Contributing to Challenges in Meeting Breakfast or Lunch Requirements
Factor Percentage of respondents
Availability of foods that meet current meal requirements and are acceptable to students 79.7
Cost of foods required to meet the meal requirements 73.9
Availability of foods with appropriate sodium levels 60.6
Availability of whole grain-rich foods 48.9
Needing to offer different portion sizes to different grade groups 48.6
Needing technical assistance 47.8
Availability of foods with appropriate calorie levels 47.7
Kitchen staff understanding of meal requirements 46.3
Training staff to prepare meals that meet requirements 45.2
Additional staff or labor hours to prepare meals that meet requirements 30.1
Additional equipment to prepare meals that meet requirements 22.2
Other* 5.7
Number of SFAs (unweighted) 456
Number of SFAs (weighted) 12,644
Notes: The data are weighted to be representative of all public school food authorities (SFAs) offering the National School Lunch Program. Respondents were asked, “Which of the following factors contribute to the challenges your district faces in meeting the meal requirements for lunch or breakfast?” These data reflect only SFA directors who reported facing challenges in implementing meal requirements for breakfast or lunch in SY 2014-15. Multiple responses were allowed. The percentages of “don’t know” responses ranged from 2.0 to 5.0 percent across all questions, and the percentages of missing responses ranged from 4.9 to 10.6 percent.
* Other reported contributing factors include funding issues (need for more money to purchase foods, inadequate reimbursement, cost of training staff); minimum fruit and vegetable requirements; plate waste; and finding vendors that meet requirements and cost constraints.
Source: School Meal Approaches, Resources, and Trends Study, 2015
© 2016 The Pew Charitable Trusts
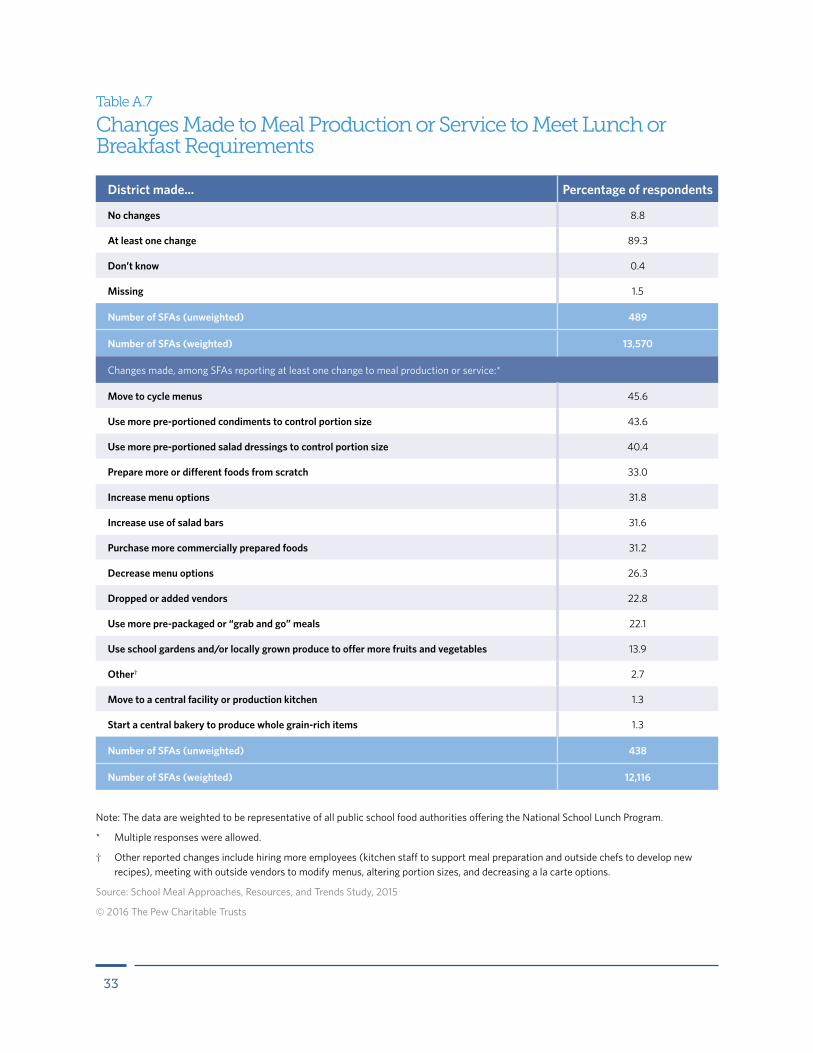
33
Table A.7
Changes Made to Meal Production or Service to Meet Lunch or Breakfast Requirements
District made... Percentage of respondents
No changes 8.8
At least one change 89.3
Don’t know 0.4
Missing 1.5
Number of SFAs (unweighted) 489
Number of SFAs (weighted) 13,570
Changes made, among SFAs reporting at least one change to meal production or service:*
Move to cycle menus 45.6
Use more pre-portioned condiments to control portion size 43.6
Use more pre-portioned salad dressings to control portion size 40.4
Prepare more or different foods from scratch 33.0
Increase menu options 31.8
Increase use of salad bars 31.6
Purchase more commercially prepared foods 31.2
Decrease menu options 26.3
Dropped or added vendors 22.8
Use more pre-packaged or “grab and go” meals 22.1
Use school gardens and/or locally grown produce to offer more fruits and vegetables 13.9
Other† 2.7
Move to a central facility or production kitchen 1.3
Start a central bakery to produce whole grain-rich items 1.3
Number of SFAs (unweighted) 438
Number of SFAs (weighted) 12,116
Note: The data are weighted to be representative of all public school food authorities offering the National School Lunch Program.
* Multiple responses were allowed.
† Other reported changes include hiring more employees (kitchen staff to support meal preparation and outside chefs to develop new recipes), meeting with outside vendors to modify menus, altering portion sizes, and decreasing a la carte options.
Source: School Meal Approaches, Resources, and Trends Study, 2015
© 2016 The Pew Charitable Trusts
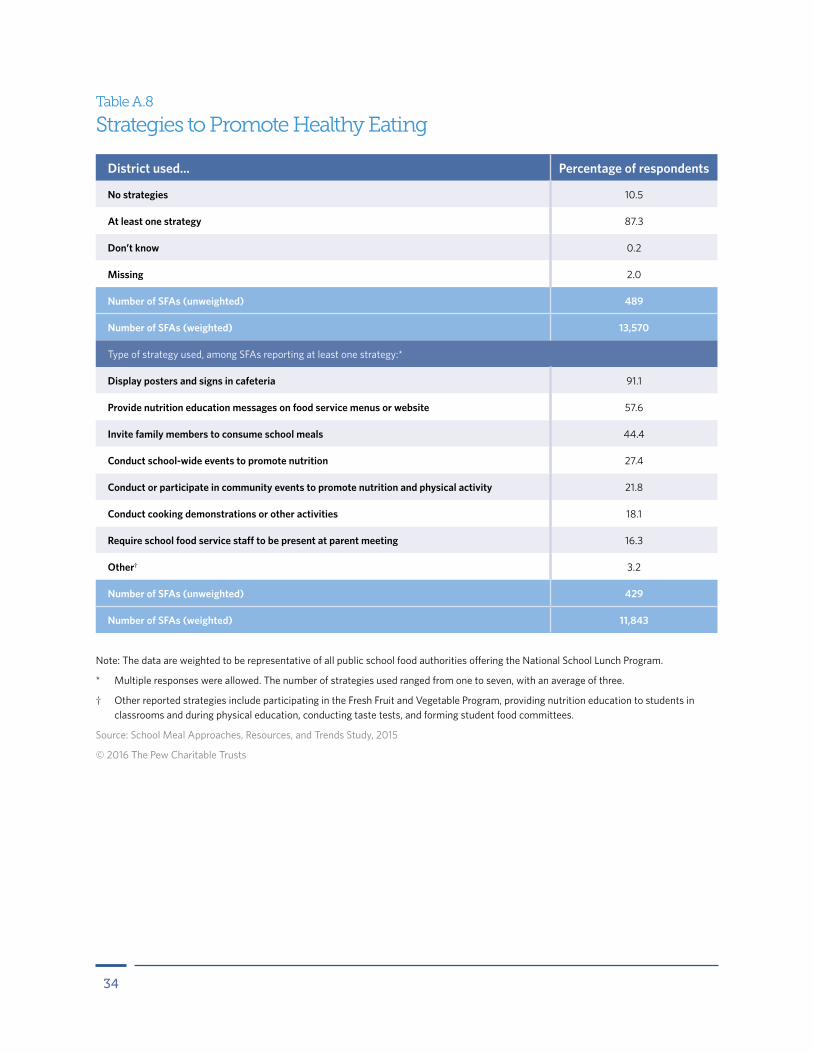
34
Table A.8
Strategies to Promote Healthy Eating
District used... Percentage of respondents
No strategies 10.5
At least one strategy 87.3
Don’t know 0.2
Missing 2.0
Number of SFAs (unweighted) 489
Number of SFAs (weighted) 13,570
Type of strategy used, among SFAs reporting at least one strategy:*
Display posters and signs in cafeteria 91.1
Provide nutrition education messages on food service menus or website 57.6
Invite family members to consume school meals 44.4
Conduct school-wide events to promote nutrition 27.4
Conduct or participate in community events to promote nutrition and physical activity 21.8
Conduct cooking demonstrations or other activities 18.1
Require school food service staff to be present at parent meeting 16.3
Other† 3.2
Number of SFAs (unweighted) 429
Number of SFAs (weighted) 11,843
Note: The data are weighted to be representative of all public school food authorities offering the National School Lunch Program.
* Multiple responses were allowed. The number of strategies used ranged from one to seven, with an average of three.
† Other reported strategies include participating in the Fresh Fruit and Vegetable Program, providing nutrition education to students in classrooms and during physical education, conducting taste tests, and forming student food committees.
Source: School Meal Approaches, Resources, and Trends Study, 2015
© 2016 The Pew Charitable Trusts
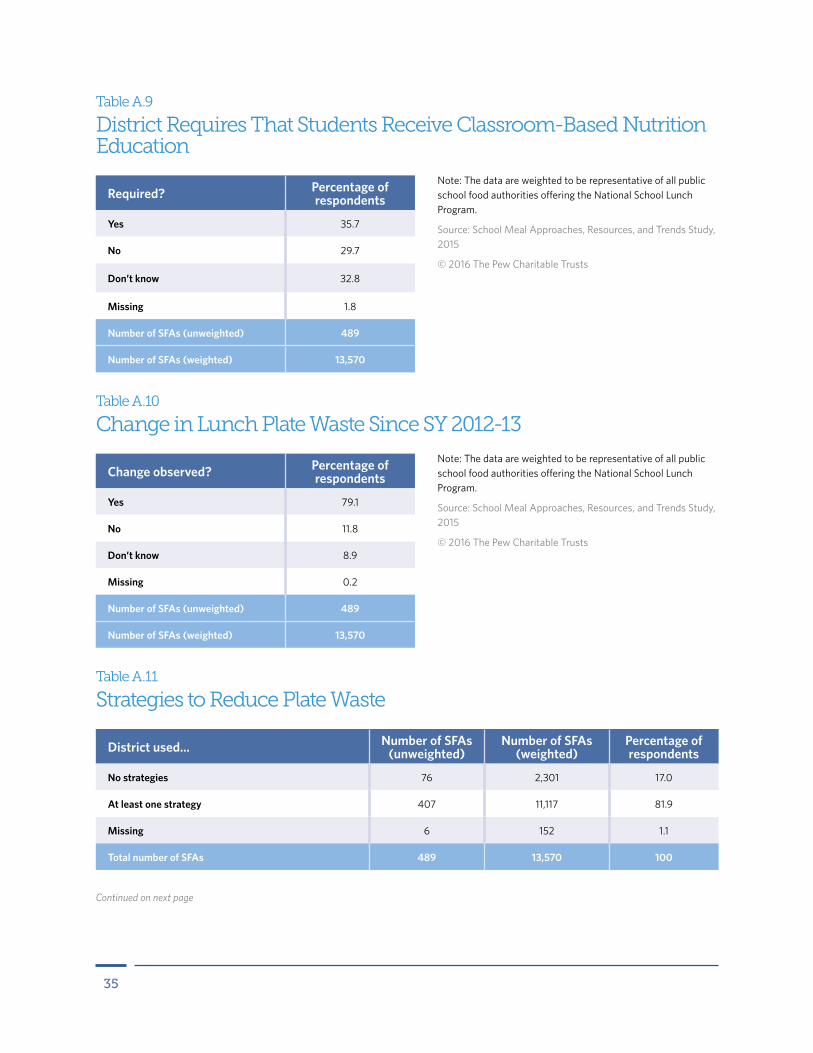
35
Table A.9
District Requires That Students Receive Classroom-Based Nutrition Education
Required? Percentage of respondents
Yes 35.7
No 29.7
Don’t know 32.8
Missing 1.8
Number of SFAs (unweighted) 489
Number of SFAs (weighted) 13,570
Note: The data are weighted to be representative of all public school food authorities offering the National School Lunch Program.
Source: School Meal Approaches, Resources, and Trends Study, 2015
© 2016 The Pew Charitable Trusts
Table A.10
Change in Lunch Plate Waste Since SY 2012-13
Change observed? Percentage of respondents
Yes 79.1
No 11.8
Don’t know 8.9
Missing 0.2
Number of SFAs (unweighted) 489
Number of SFAs (weighted) 13,570
Note: The data are weighted to be representative of all public school food authorities offering the National School Lunch Program.
Source: School Meal Approaches, Resources, and Trends Study, 2015
© 2016 The Pew Charitable Trusts
Table A.11
Strategies to Reduce Plate Waste
District used... Number of SFAs (unweighted)
Number of SFAs (weighted)
Percentage of respondents
No strategies 76 2,301 17.0
At least one strategy 407 11,117 81.9
Missing 6 152 1.1
Total number of SFAs 489 13,570 100
Continued on next page
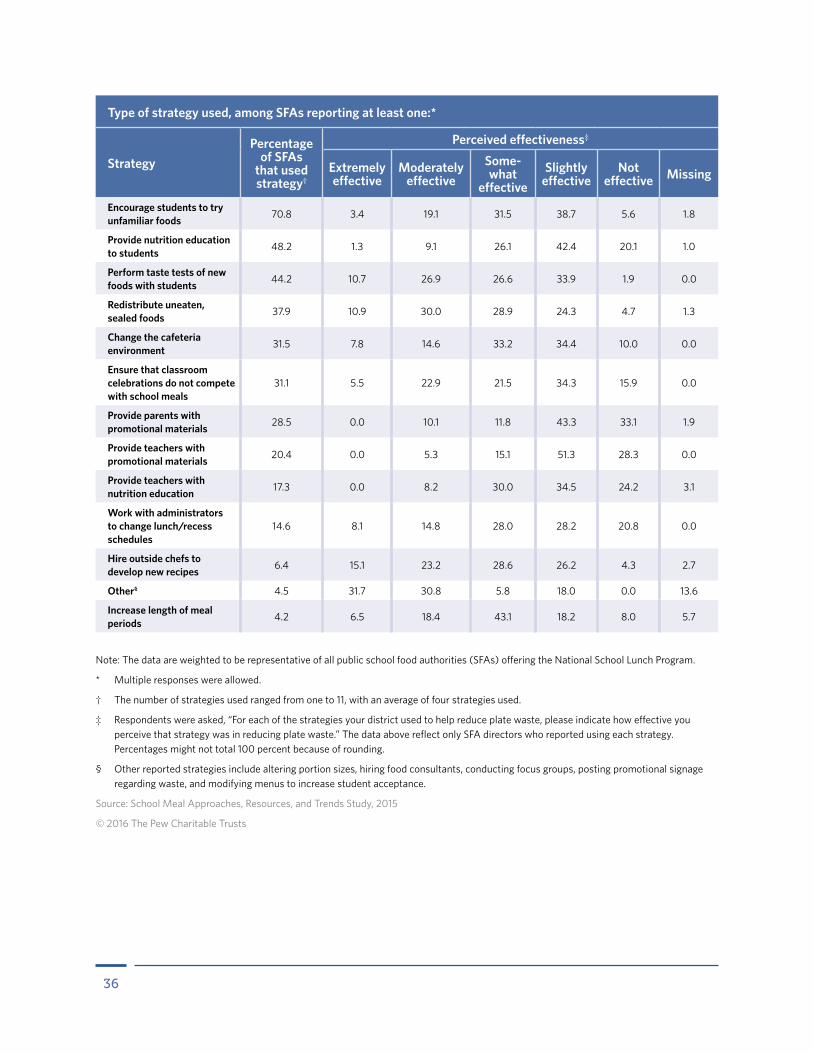
36
Type of strategy used, among SFAs reporting at least one:*
StrategyPercentage
of SFAs that used strategy†
Perceived effectiveness‡
Extremely effective
Moderately effective
Some-what
effectiveSlightly
effectiveNot
effective Missing
Encourage students to try unfamiliar foods 70.8 3.4 19.1 31.5 38.7 5.6 1.8
Provide nutrition education to students 48.2 1.3 9.1 26.1 42.4 20.1 1.0
Perform taste tests of new foods with students 44.2 10.7 26.9 26.6 33.9 1.9 0.0
Redistribute uneaten, sealed foods 37.9 10.9 30.0 28.9 24.3 4.7 1.3
Change the cafeteria environment 31.5 7.8 14.6 33.2 34.4 10.0 0.0
Ensure that classroom celebrations do not compete with school meals
31.1 5.5 22.9 21.5 34.3 15.9 0.0
Provide parents with promotional materials 28.5 0.0 10.1 11.8 43.3 33.1 1.9
Provide teachers with promotional materials 20.4 0.0 5.3 15.1 51.3 28.3 0.0
Provide teachers with nutrition education 17.3 0.0 8.2 30.0 34.5 24.2 3.1
Work with administrators to change lunch/recess schedules
14.6 8.1 14.8 28.0 28.2 20.8 0.0
Hire outside chefs to develop new recipes 6.4 15.1 23.2 28.6 26.2 4.3 2.7
Other§ 4.5 31.7 30.8 5.8 18.0 0.0 13.6
Increase length of meal periods 4.2 6.5 18.4 43.1 18.2 8.0 5.7
Note: The data are weighted to be representative of all public school food authorities (SFAs) offering the National School Lunch Program.
* Multiple responses were allowed.
† The number of strategies used ranged from one to 11, with an average of four strategies used.
‡ Respondents were asked, “For each of the strategies your district used to help reduce plate waste, please indicate how effective you perceive that strategy was in reducing plate waste.” The data above reflect only SFA directors who reported using each strategy. Percentages might not total 100 percent because of rounding.
§ Other reported strategies include altering portion sizes, hiring food consultants, conducting focus groups, posting promotional signage regarding waste, and modifying menus to increase student acceptance.
Source: School Meal Approaches, Resources, and Trends Study, 2015
© 2016 The Pew Charitable Trusts

37
Table A.12
Strategies to Increase Fruit and Vegetable Consumption
Type of strategy used, among SFAs reporting at least one:*
StrategyPercentage of SFAs that
used strategy†
Perceived effectiveness‡
Students ate more
Students ate same amount
Students ate less Missing
Cut up fresh fruit 83.6 61.7 36.4 1.0 0.9
Offer a wider variety of fruits/vegetables 79.8 47.6 49.6 1.3 1.5
Display whole fruit in attractive bowls/baskets 50.5 28.1 68.3 2.9 0.7
Display fruit near cash register 41.5 34.4 62.0 1.9 1.8
Increase use of salad bars 39.7 64.0 33.9 1.0 1.1
Modify recipes to make foods taste better 34.6 49.3 49.3 0.6 0.8
Offer more local produce 33.1 28.9 67.6 2.5 1.0
Use creative signs to show daily fruit/vegetable options 23.9 18.5 77.4 2.6 1.5
Change the cafeteria environment 22.1 33.7 64.3 0.7 1.3
Institute school gardens 12.7 42.2 56.5 1.3 0.0
Make competitive foods available by request only 5.9 3.6 92.5 3.9 0.0
Other§ 1.6 63.5 16.4 0.0 20.1
District used... Number of SFAs (unweighted)
Number of SFAs (weighted)
Percentage of respondents
No strategies 33 1,030 7.6
At least one strategy 452 12,428 91.6
Don’t know 1 31 0.2
Missing 3 81 0.6
Total number of SFAs 489 13,570 100
Note: The data are weighted to be representative of all public school food authorities (SFAs) offering the National School Lunch Program.
* Multiple responses were allowed.
† The number of strategies used ranged from one to 11, with an average of four.
‡ Respondents were asked, “For each of the strategies used to entice students to select and consume fruits and vegetables, please indicate whether students ate more, ate about the same, or ate less fruits and vegetables after applying that strategy.” These data reflect only SFA directors who reported using each strategy. Percentages might not total 100 percent because of rounding.
§ Other reported strategies were including fruits and vegetables with entrees, redistributing uneaten fruit, performing taste tests, and encouraging students to try new foods.
Source: School Meal Approaches, Resources, and Trends Study, 2015
© 2016 The Pew Charitable Trusts
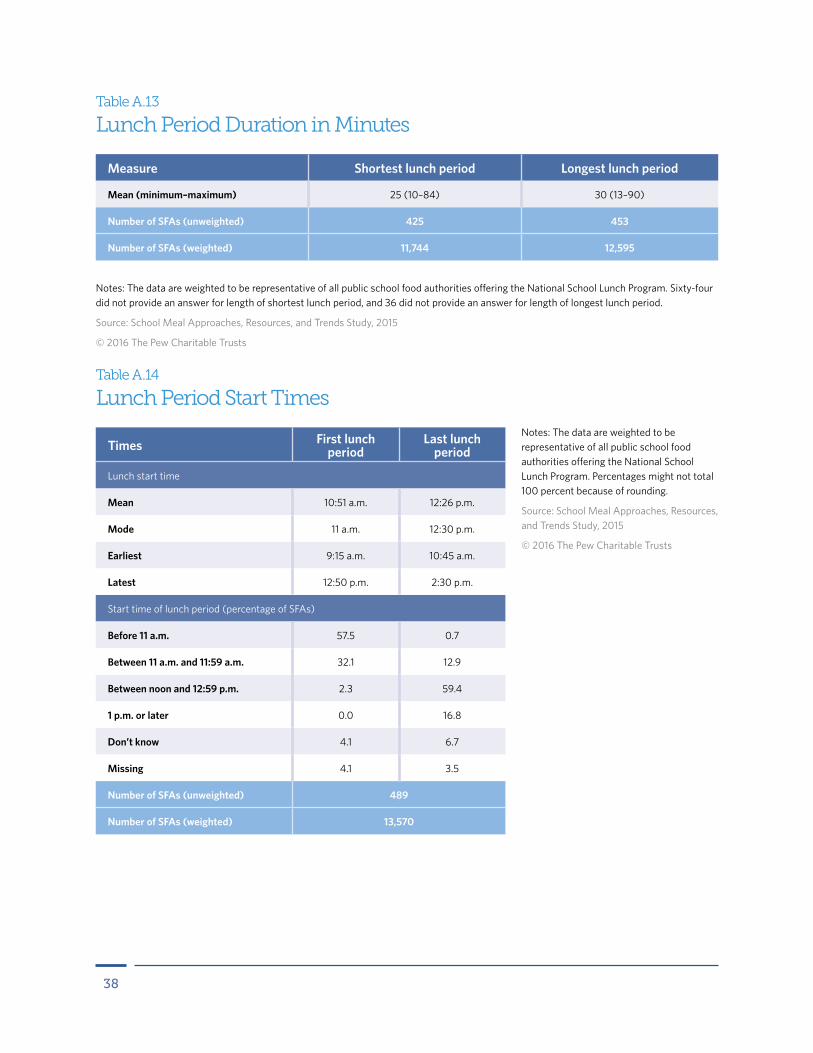
38
Table A.13
Lunch Period Duration in Minutes
Measure Shortest lunch period Longest lunch period
Mean (minimum–maximum) 25 (10–84) 30 (13–90)
Number of SFAs (unweighted) 425 453
Number of SFAs (weighted) 11,744 12,595
Notes: The data are weighted to be representative of all public school food authorities offering the National School Lunch Program. Sixty-four did not provide an answer for length of shortest lunch period, and 36 did not provide an answer for length of longest lunch period.
Source: School Meal Approaches, Resources, and Trends Study, 2015
© 2016 The Pew Charitable Trusts
Table A.14
Lunch Period Start Times
Times First lunch period
Last lunch period
Lunch start time
Mean 10:51 a.m. 12:26 p.m.
Mode 11 a.m. 12:30 p.m.
Earliest 9:15 a.m. 10:45 a.m.
Latest 12:50 p.m. 2:30 p.m.
Start time of lunch period (percentage of SFAs)
Before 11 a.m. 57.5 0.7
Between 11 a.m. and 11:59 a.m. 32.1 12.9
Between noon and 12:59 p.m. 2.3 59.4
1 p.m. or later 0.0 16.8
Don’t know 4.1 6.7
Missing 4.1 3.5
Number of SFAs (unweighted) 489
Number of SFAs (weighted) 13,570
Notes: The data are weighted to be representative of all public school food authorities offering the National School Lunch Program. Percentages might not total 100 percent because of rounding.
Source: School Meal Approaches, Resources, and Trends Study, 2015
© 2016 The Pew Charitable Trusts

39
Table A.15
Strategies to Increase Time to Eat During Lunch
District used... Percentage of respondents
No strategies 48.8
At least one strategy 46.9
Don’t know 0.8
Missing 3.6
Number of SFAs (unweighted) 489
Number of SFAs (weighted) 13,570
Type of strategy used, among SFAs reporting at least one strategy:*
Provide all required meal components on every serving line/food station 68.3
Increase the number of serving lines/food stations 40.3
Offer more “grab and go” options in the cafeteria 37.8
Increase the number of cashiers/checkout stations 29.8
Require students to pre-order lunch 16.7
Provide students the option to pre-order lunch 9.8
Provide reimbursable “grab and go” lunches at vending machines/other locations 5.8
Other† 2.9
Number of SFAs (unweighted) 233
Number of SFAs (weighted) 6,360
Note: The data are weighted to be representative of all public school food authorities offering the National School Lunch Program.
* Multiple responses were allowed. The number of strategies used ranged from one to six, with an average of two strategies used.
† Other reported strategies include modifying lunch schedules (adding additional lunch periods, staggering schedules between grades, planning recess before lunch) and providing precut fruits.
Source: School Meal Approaches, Resources, and Trends Study, 2015
© 2016 The Pew Charitable Trusts
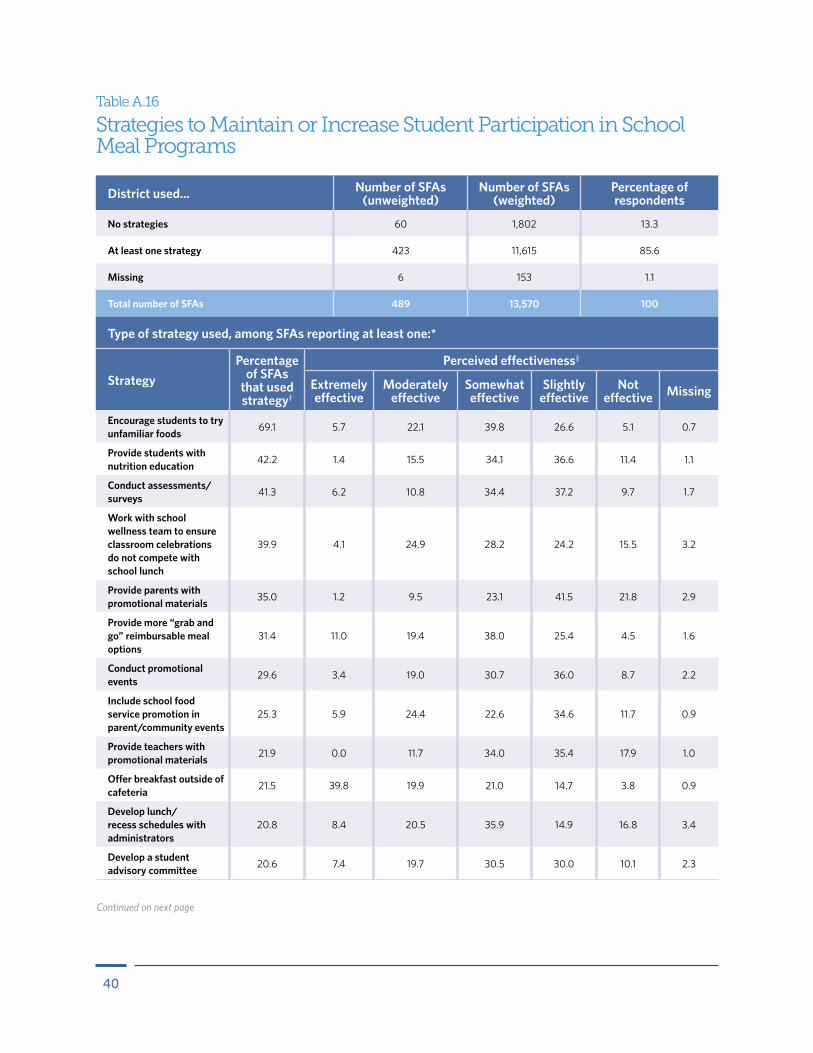
40
Table A.16
Strategies to Maintain or Increase Student Participation in School Meal Programs
Type of strategy used, among SFAs reporting at least one:*
StrategyPercentage
of SFAs that used strategy†
Perceived effectiveness‡
Extremely effective
Moderately effective
Somewhat effective
Slightly effective
Not effective Missing
Encourage students to try unfamiliar foods 69.1 5.7 22.1 39.8 26.6 5.1 0.7
Provide students with nutrition education 42.2 1.4 15.5 34.1 36.6 11.4 1.1
Conduct assessments/surveys 41.3 6.2 10.8 34.4 37.2 9.7 1.7
Work with school wellness team to ensure classroom celebrations do not compete with school lunch
39.9 4.1 24.9 28.2 24.2 15.5 3.2
Provide parents with promotional materials 35.0 1.2 9.5 23.1 41.5 21.8 2.9
Provide more “grab and go” reimbursable meal options
31.4 11.0 19.4 38.0 25.4 4.5 1.6
Conduct promotional events 29.6 3.4 19.0 30.7 36.0 8.7 2.2
Include school food service promotion in parent/community events
25.3 5.9 24.4 22.6 34.6 11.7 0.9
Provide teachers with promotional materials 21.9 0.0 11.7 34.0 35.4 17.9 1.0
Offer breakfast outside of cafeteria 21.5 39.8 19.9 21.0 14.7 3.8 0.9
Develop lunch/recess schedules with administrators
20.8 8.4 20.5 35.9 14.9 16.8 3.4
Develop a student advisory committee 20.6 7.4 19.7 30.5 30.0 10.1 2.3
District used... Number of SFAs (unweighted)
Number of SFAs (weighted)
Percentage of respondents
No strategies 60 1,802 13.3
At least one strategy 423 11,615 85.6
Missing 6 153 1.1
Total number of SFAs 489 13,570 100
Continued on next page
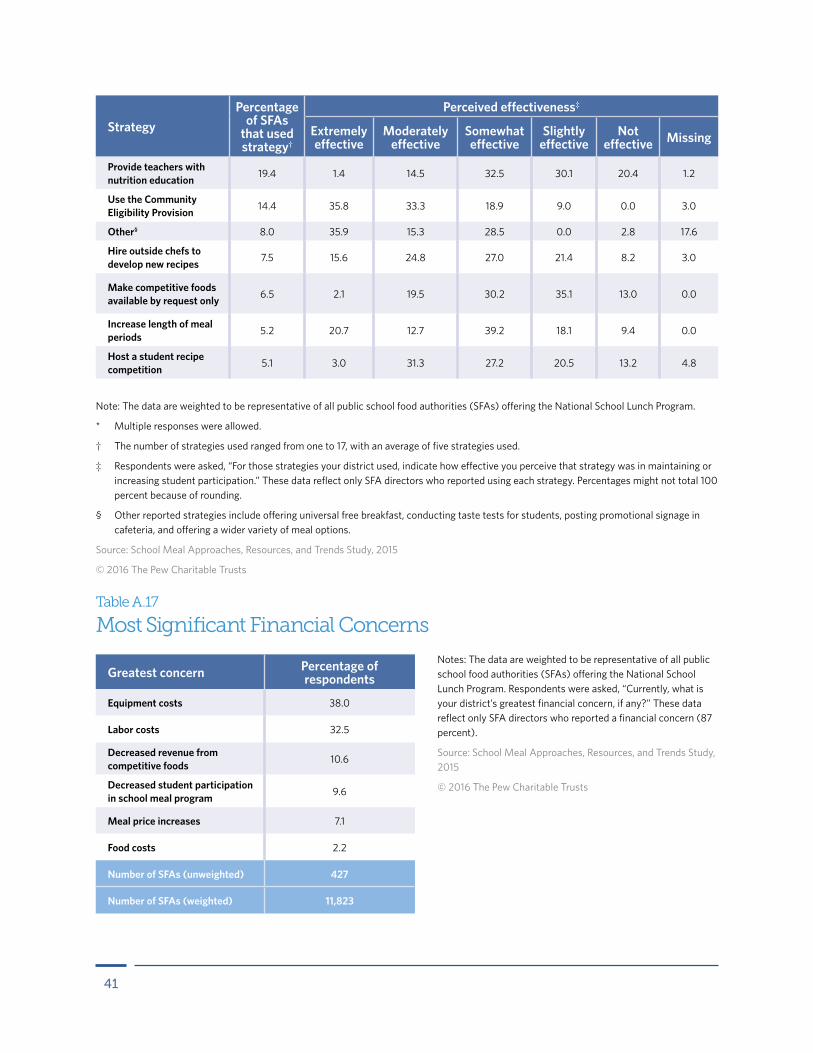
41
Note: The data are weighted to be representative of all public school food authorities (SFAs) offering the National School Lunch Program.
* Multiple responses were allowed.
† The number of strategies used ranged from one to 17, with an average of five strategies used.
‡ Respondents were asked, “For those strategies your district used, indicate how effective you perceive that strategy was in maintaining or increasing student participation.” These data reflect only SFA directors who reported using each strategy. Percentages might not total 100 percent because of rounding.
§ Other reported strategies include offering universal free breakfast, conducting taste tests for students, posting promotional signage in cafeteria, and offering a wider variety of meal options.
Source: School Meal Approaches, Resources, and Trends Study, 2015
© 2016 The Pew Charitable Trusts
StrategyPercentage
of SFAs that used strategy†
Perceived effectiveness‡
Extremely effective
Moderately effective
Somewhat effective
Slightly effective
Not effective Missing
Provide teachers with nutrition education 19.4 1.4 14.5 32.5 30.1 20.4 1.2
Use the Community Eligibility Provision 14.4 35.8 33.3 18.9 9.0 0.0 3.0
Other§ 8.0 35.9 15.3 28.5 0.0 2.8 17.6
Hire outside chefs to develop new recipes 7.5 15.6 24.8 27.0 21.4 8.2 3.0
Make competitive foods available by request only 6.5 2.1 19.5 30.2 35.1 13.0 0.0
Increase length of meal periods 5.2 20.7 12.7 39.2 18.1 9.4 0.0
Host a student recipe competition 5.1 3.0 31.3 27.2 20.5 13.2 4.8
Table A.17
Most Significant Financial Concerns
Greatest concern Percentage of respondents
Equipment costs 38.0
Labor costs 32.5
Decreased revenue from competitive foods 10.6
Decreased student participation in school meal program 9.6
Meal price increases 7.1
Food costs 2.2
Number of SFAs (unweighted) 427
Number of SFAs (weighted) 11,823
Notes: The data are weighted to be representative of all public school food authorities (SFAs) offering the National School Lunch Program. Respondents were asked, “Currently, what is your district’s greatest financial concern, if any?” These data reflect only SFA directors who reported a financial concern (87 percent).
Source: School Meal Approaches, Resources, and Trends Study, 2015
© 2016 The Pew Charitable Trusts
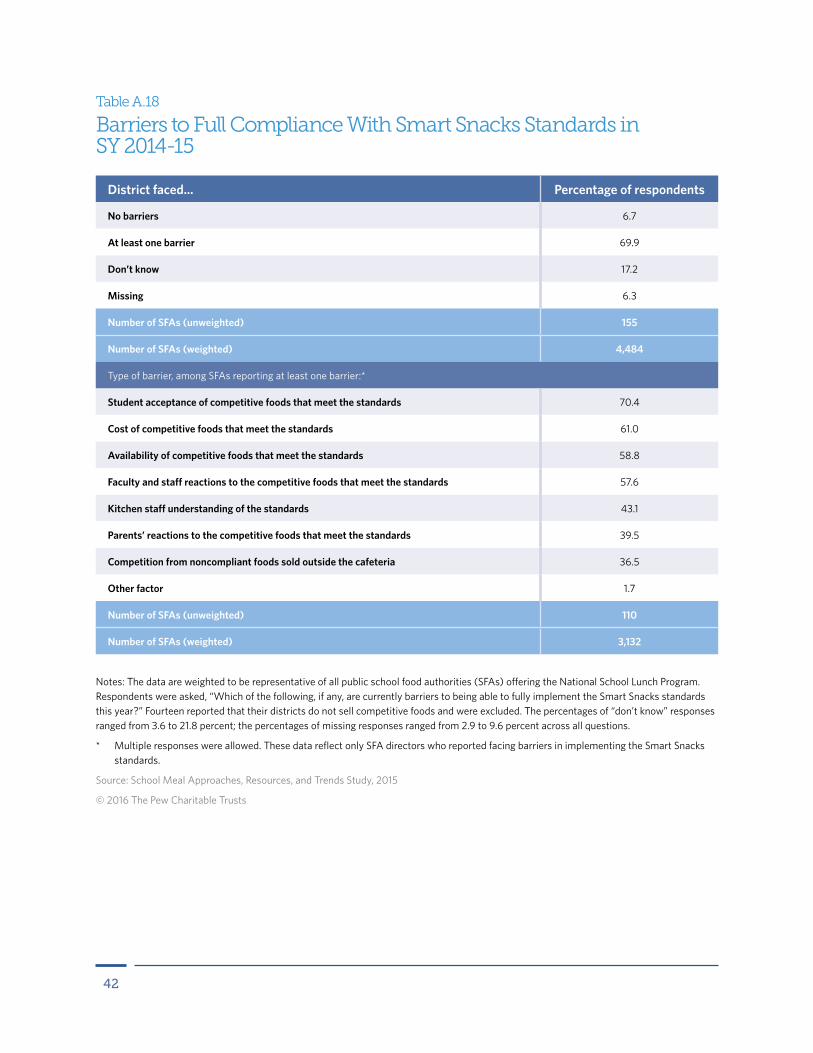
42
Table A.18
Barriers to Full Compliance With Smart Snacks Standards in SY 2014-15
District faced... Percentage of respondents
No barriers 6.7
At least one barrier 69.9
Don’t know 17.2
Missing 6.3
Number of SFAs (unweighted) 155
Number of SFAs (weighted) 4,484
Type of barrier, among SFAs reporting at least one barrier:*
Student acceptance of competitive foods that meet the standards 70.4
Cost of competitive foods that meet the standards 61.0
Availability of competitive foods that meet the standards 58.8
Faculty and staff reactions to the competitive foods that meet the standards 57.6
Kitchen staff understanding of the standards 43.1
Parents’ reactions to the competitive foods that meet the standards 39.5
Competition from noncompliant foods sold outside the cafeteria 36.5
Other factor 1.7
Number of SFAs (unweighted) 110
Number of SFAs (weighted) 3,132
Notes: The data are weighted to be representative of all public school food authorities (SFAs) offering the National School Lunch Program. Respondents were asked, “Which of the following, if any, are currently barriers to being able to fully implement the Smart Snacks standards this year?” Fourteen reported that their districts do not sell competitive foods and were excluded. The percentages of “don’t know” responses ranged from 3.6 to 21.8 percent; the percentages of missing responses ranged from 2.9 to 9.6 percent across all questions.
* Multiple responses were allowed. These data reflect only SFA directors who reported facing barriers in implementing the Smart Snacks standards.
Source: School Meal Approaches, Resources, and Trends Study, 2015
© 2016 The Pew Charitable Trusts

43
Appendix B: Characteristics of school food authoritiesTo provide context for the study findings, Table B.1 presents data on key characteristics of the sample, including SFA size (number of students enrolled), number of schools, community type, region, and poverty category. Using data from the sample frame, SFAs were grouped into five categories based on size: very small (fewer than 1,000), small (1,000 to 2,499), medium (2,500 to 9,999), large (10,000 to 24,999), and very large (25,000 or more). Almost half of SFAs (47 percent) have fewer than 1,000 students and can be characterized as very small. A quarter are small, and another 20 percent are medium. Large and very large SFAs are much less common, accounting for only 8 percent of all SFAs.
SFA size can also be measured by the number of individual schools operating the lunch program. The smallest have one to three schools (56 percent). About a third (33 percent) have four to 11 schools, and the remaining 11 percent have 12 or more schools.
Respondents were asked to characterize the location of the majority of schools in their SFAs as urban, suburban, or rural. About 6 in 10 (59 percent) reported that most of their schools are in rural areas. Less than a quarter (22 percent) reported that most of their schools are in suburban communities, and 18 percent described their schools as mainly urban.
The USDA’s Food and Nutrition Service (FNS) administers the National School Lunch Program and School Breakfast Program through seven regional offices. The largest proportion of SFAs is in the Midwest region (26 percent); the Northeast, Southwest, Western, and Mountain Plains regions each account for 12 to 17 percent of SFAs; and 9 percent are in each of the Mid-Atlantic and Southeast regions.
To measure socioeconomic status, the study used data from the sample frame on the percentage of enrolled students that is approved for free or reduced-price meals. Children from families with household incomes at or below 130 percent of the federal poverty threshold are eligible to receive free meals under the programs, and those from households with incomes between 131 and 185 percent of the federal poverty threshold are eligible to receive meals at a reduced price. Three poverty categories were created: low (less than 40 percent of students are approved for free or reduced-price meals), intermediate (40 to 60 percent are approved), and high (more than 60 percent are approved). More than a third of all SFAs (38 percent) fall within the low-poverty category. Equal proportions fall within the intermediate and high-poverty categories (31 percent each).
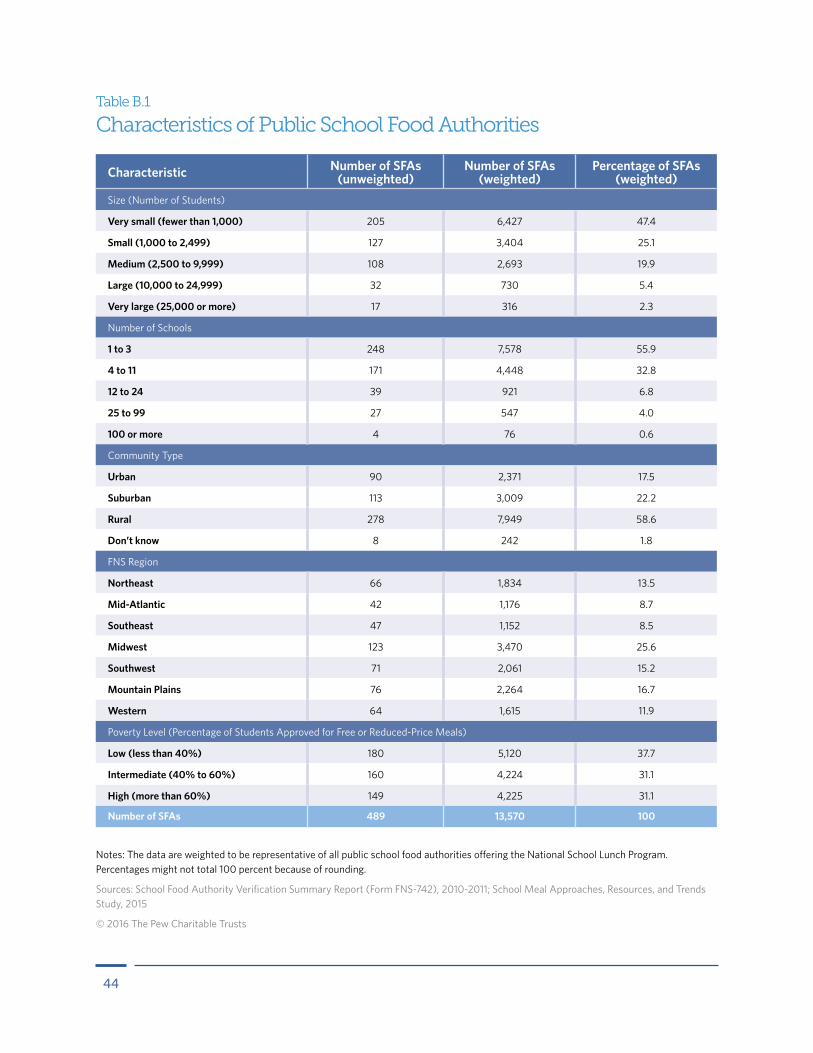
44
Table B.1
Characteristics of Public School Food Authorities
Characteristic Number of SFAs (unweighted)
Number of SFAs (weighted)
Percentage of SFAs (weighted)
Size (Number of Students)
Very small (fewer than 1,000) 205 6,427 47.4
Small (1,000 to 2,499) 127 3,404 25.1
Medium (2,500 to 9,999) 108 2,693 19.9
Large (10,000 to 24,999) 32 730 5.4
Very large (25,000 or more) 17 316 2.3
Number of Schools
1 to 3 248 7,578 55.9
4 to 11 171 4,448 32.8
12 to 24 39 921 6.8
25 to 99 27 547 4.0
100 or more 4 76 0.6
Community Type
Urban 90 2,371 17.5
Suburban 113 3,009 22.2
Rural 278 7,949 58.6
Don’t know 8 242 1.8
FNS Region
Northeast 66 1,834 13.5
Mid-Atlantic 42 1,176 8.7
Southeast 47 1,152 8.5
Midwest 123 3,470 25.6
Southwest 71 2,061 15.2
Mountain Plains 76 2,264 16.7
Western 64 1,615 11.9
Poverty Level (Percentage of Students Approved for Free or Reduced-Price Meals)
Low (less than 40%) 180 5,120 37.7
Intermediate (40% to 60%) 160 4,224 31.1
High (more than 60%) 149 4,225 31.1
Number of SFAs 489 13,570 100
Notes: The data are weighted to be representative of all public school food authorities offering the National School Lunch Program. Percentages might not total 100 percent because of rounding.
Sources: School Food Authority Verification Summary Report (Form FNS-742), 2010-2011; School Meal Approaches, Resources, and Trends Study, 2015
© 2016 The Pew Charitable Trusts
45
Appendix C: Study design and methodologyThe objective of the SMART Study was to examine school food authorities’ continued challenges and successes related to the ongoing implementation of USDA nutrition standards for school meals and Smart Snacks standards for competitive foods. The study was a follow-up to the Kitchen Infrastructure and Training for Schools (KITS) Study conducted by Mathematica Policy Research for the Kids’ Safe and Healthful Foods Project in 2012.20 The sample frame for the KITS Study included public SFAs in all 50 states and the District of Columbia that participated in the NSLP in SY 2010-11. The KITS Study sample was used to randomly select a nationally representative sample of 1,000 SFAs for the SMART Study. Directors from sampled SFAs were invited to complete an online survey toward the end of SY 2014-15. A total of 489 responded, resulting in a final response rate of 52 percent (unweighted and weighted). All responses were voluntary, and no financial incentive was offered.
To provide reliable estimates and to help ensure that the study’s findings would be more representative of all public SFAs nationwide, the researchers computed analysis weights. Applying weights to the SFAs that responded helps to reduce the potential bias that sometimes occurs when subgroups of SFAs (such as those of different sizes) are over- or undersampled relative to their proportion of the population or when various types of sample members respond at different rates. An analysis was also conducted to determine whether characteristics associated with key survey responses were also related to the likelihood of responding, and the weights were adjusted accordingly. The final weights accounted for unequal selection probabilities and potential nonresponse bias.
This appendix describes the design and methodological processes involved in conducting the SMART Study. Information is provided on sample design, data collection, response rates, weighting, data cleaning, and analysis.
Sample design The SMART Study used the sample from the KITS Study as its sample frame. The KITS sample frame was developed from the USDA Food and Nutrition Service School Food Authority Verification Summary Report (Form FNS-742) for SY 2010-11. The reference population for the SMART Study was all SFAs that were eligible for the KITS Study in 2012 and were still in existence in 2015. The KITS sample was chosen as the sampling frame for the SMART Study because it was nationally representative of all SFAs at that time and contact information for SFA directors was available for this sample. Although the KITS sample was nationally representative, it also had state-specific precision requirements, meaning that certain states had higher sampling rates—and of those, many had all their SFAs included in the sample. Given that the SMART sample had no state-level precision requirements, the researchers attempted to equalize the cumulative sampling probabilities to increase precision for an anticipated 600 respondents among the 1,000 sampled SFAs. To preserve the variance properties of the original sample, the SMART sample was selected from within the original KITS sampling strata. These strata were states; in some states, SFAs were further stratified by characteristics such as size and region.
Sample allocation and selection
The KITS sample (the SMART Study frame) had 6,944 SFAs whose sampling weights (which account for selection probabilities only) total 14,837—the size of the population under study. This includes all initially sampled SFAs, including a random subsample of 945 that were never released for data collection. The KITS Study determined before data collection that 60 sampled SFAs were ineligible for the study. Removing those left
46
a sampling frame of 6,884, which represented a population of approximately 14,707 SFAs. The initial sample for the SMART Study was 1,500 SFAs from the sample frame of 6,884.
SFAs were categorized into 161 strata inherited from the design of the KITS sample. The sampling strategy for the SMART Study aimed to have a self-weighting sample—that is, to have a cumulative equal probability of selection from the eligible population of 14,707 SFAs for all cases. This required differential sampling rates because the KITS sample was drawn using a stratified sample with disproportionate sampling rates across strata. Equal selection probabilities were not always achieved due to sampling constraints; that is, when the desired sample size was larger than the available sample and when the desired sample size was smaller than the lower threshold of two SFAs per stratum. The SAS SurveySelect procedure was used to select the sample. Initial sampling weights were calculated as the inverse of the cumulative selection probability (the KITS selection probability [P1] times the SMART selection probability [P2]).
Subsampling
Once the initial sample of 1,500 SFAs was selected, child nutrition (CN) directors in each state were asked to identify any sampled SFAs that were not eligible for the study because they no longer existed or participated in the NSLP. Eighteen were found to be ineligible and were removed from the sample. The total of the sampling weights across the remaining 1,482 SFAs was 14,534, which became the next best estimate of the number of SFAs in the study’s reference population. The researchers then selected a stratified random subsample of 1,000 SFAs among the 1,482 eligible SFAs to release for data collection. This was done in a way that preserved, to the extent possible, the equal cumulative selection probabilities. The new cumulative sampling weight was set to P1 times P2 times P3, where P3 is the subsampling rate within a stratum.
The new cumulative sampling weights ranged from 4.0 to 15.4, with the sum of the weights remaining at 14,534. Most of the subsampled SFAs (869 of 1,000) had a cumulative sampling weight of 14.7. The 72 sampled SFAs with a sampling weight of less than 14.7 were those in strata for which the sample size needed to achieve the desired cumulative sampling weight was smaller than 2, and for which two SFAs were sampled. The 59 sample SFAs with a sampling weight of greater than 14.7 were those in strata that lacked enough sample to achieve the desired cumulative sampling weight and for which all were subsampled.
Questionnaire developmentThe SMART Study questionnaire was developed collaboratively by the study teams at Mathematica Policy Research and the Kids’ Safe and Healthful Foods Project. Six individuals with expertise in child nutrition helped to identify the key issues to be measured, determined critical survey questions, and provided feedback on the draft questionnaire. The draft questionnaire underwent pilot testing in March 2015. Ten school nutrition directors completed a paper copy of the survey, and respondents provided positive feedback on the questionnaire design and topics covered. The survey was designed to be self-administered and completed online within an average of 20 minutes. The Kids’ Safe and Healthful Foods Project approved the final version of the survey. Programming and internal testing for the web-based questionnaire was finalized by early April 2015.
Data collection Data for the SMART Study were collected between April and July 2015. Several advance activities were conducted to notify regional, state, and local school nutrition staff about the study and request their support. In March 2015, Pew staff emailed regional and state CN directors to introduce the SMART Study and ask for help in getting SFAs to participate. Mathematica then sent emails to all state CN directors to briefly describe the study,

47
ask for assistance in collecting contact information for the sampled SFAs in their states, and ask them to inform the SFAs about the study and encourage participation.
CN directors were also asked to identify any sampled SFAs that no longer existed or participated in the NSLP. Nineteen states did not respond to these requests, so additional efforts were needed to obtain information for approximately 750 SFA directors. These efforts to obtain correct email addresses for directors in the sampled SFAs continued throughout data collection. At the end of April 2015, emails were sent to SFA directors, providing a link for them to access and complete the online survey.21
To maximize response rates, SFA directors received email and telephone reminders encouraging them to complete the survey. Throughout the data collection period, weekly email reminders were sent to nonrespondents, emphasizing that the survey was easy and relatively quick to complete. Various emails were sent to SFA directors who never accessed the survey, who started but did not complete it, or who declined to participate. After a month of data collection, trained telephone interviewers began calling nonrespondents to encourage participation, obtain updated email addresses, and identify more appropriate or alternative respondents as needed. Interviewers also attempted to convert refusals over the phone and offered to complete the survey over the phone. A total of 47 surveys were completed over the phone. Some SFA directors continued to refuse to participate in the study, so state CN directors were asked to contact them and encourage them to participate. Data collection ended in July 2015.
Response rates Of the 1,000 SFAs sampled for data collection, 489 completed the survey. This includes eight partially completed surveys that had sufficient information to be included in the analysis.22 Among the 511 nonrespondents, 434 had an unknown eligibility status, 35 were known to be ineligible, and 42 were eligible. To calculate the response rate, this analysis assumed that a proportion of the 434 SFAs with undetermined status were actually eligible for the study. Based on observed features of SFAs for which eligibility status was determined (93.8 percent were eligible), the unweighted response rate was calculated as follows (Table C.1):
Unweighted Response Rate = = 52.12 percent489
489 + 42 + (.938)434
After applying the sampling weights to these counts, accounting for the cumulative probability of selection (see Sample design on Page 45), the weighted response rate was 51.98 percent. Unequal selection probabilities and nonresponse adjustments to their corresponding weights can adversely affect the precision of weighted estimates, and one measure of that impact is the design effect. A design effect of 1 means weights had no impact on variance, whereas a design effect of, say, 1.5 means the weighting inflated the variance of an estimate by 50 percent. The design effect of unequal weighting in this study is very small, only 1.067, which means that, in essence, the weighted estimates had the same precision as an equal-weighted sample of 458.5 SFAs.
Weighting and analysis methods All data analyses were weighted to produce estimates that are representative of public SFAs in the 50 states and the District of Columbia. The procedures used to develop weights, along with those used to clean and analyze the data, are described next.

48
Weighting and nonresponse analysis
The study used weighting and nonresponse analysis to produce nationally representative estimates. The purpose of weighting is to reduce the bias of estimates by making the responding sample of SFAs resemble the corresponding target population (all public SFAs nationally). Analysis weights adjust for unequal probabilities of selection and for differential response patterns across the sample.
The first step in the weighting process was to account for the probability of selection, assigning each SFA the inverse of its cumulative probability of selection. As described above, most sampled SFAs had a sampling weight of 14.7, but some had weights as low as 4.0 and as high as 15.4 due to sampling constraints. The sampling weights for the released sample of 1,000 SFAs total the best estimate of the eligible population of SFAs at the time of sampling (which was 14,534 SFAs).
The second step was to adjust the sampling weights for nonresponse. Because most nonrespondents had an undetermined eligibility status, adjustments were made first for whether eligibility was determined, and then for whether a response to the survey was obtained from those known to be eligible for the study. For each of these two adjustments, the researchers tried to find variables that were predictive of nonresponse, probably correlated with key survey outcomes, and available for both respondents and nonrespondents.
The unit of analysis in this study is the SFA, so the main source of variables (other than the SMART survey) was the USDA Form FNS-742 database. A secondary data source—the National Center for Education Statistics’ (NCES’) Common Core of Data (CCD)—was used to provide data at the local education agency (LEA) level.23 The pool of variables included the following, which were available for all sampled SFAs:
• FNS region.
• Number of schools.
• Number of students.
• Percentage of students approved for free or reduced-price meals.
And these variables from the CCD:
• Presence of charter schools.
• Whether the SFA was in a metropolitan statistical area (MSA).
• Urbanicity.
Table C.1
Sample Sizes and Response Rates
SMART StudyNumber of
sample SFAs released
Number of sample
SFAs eligible
Number of sample SFAs
randomly subselected
Number of sample SFAs
that completed survey
Response rates
(percentage of SFAs)
Unweighted Weighted
Sample 1,500 1,482 1,000 489 52.1 52
© 2016 The Pew Charitable Trusts
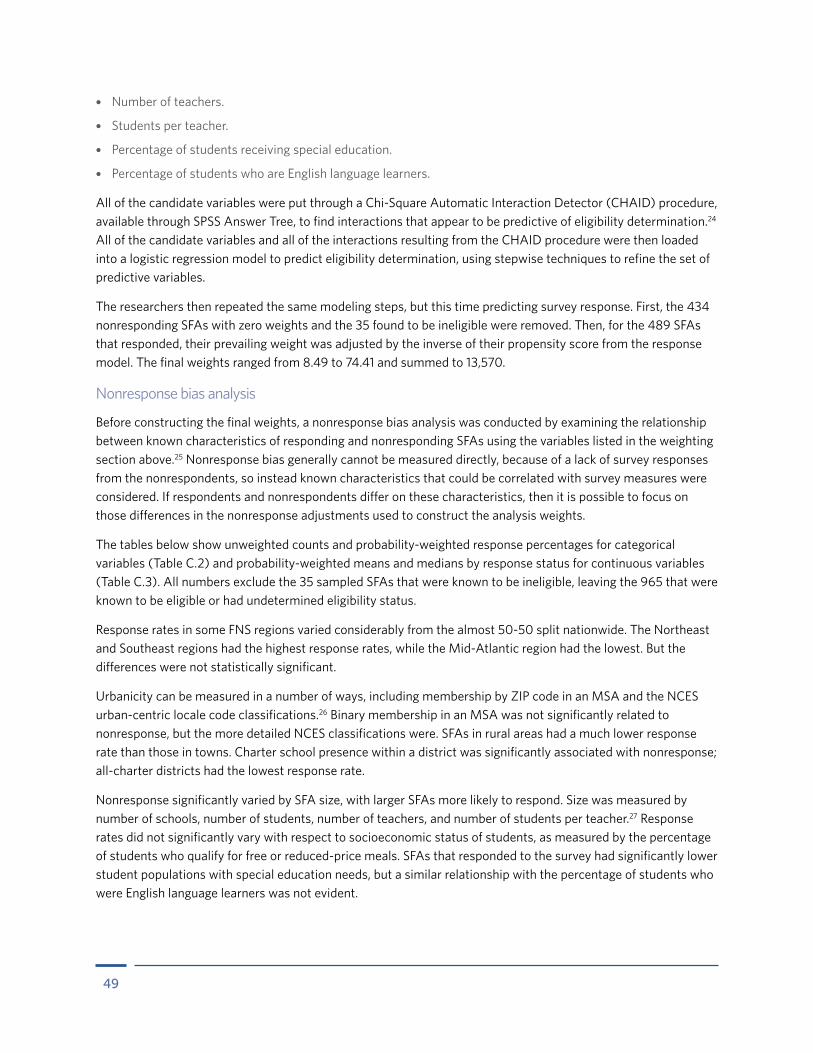
49
• Number of teachers.
• Students per teacher.
• Percentage of students receiving special education.
• Percentage of students who are English language learners.
All of the candidate variables were put through a Chi-Square Automatic Interaction Detector (CHAID) procedure, available through SPSS Answer Tree, to find interactions that appear to be predictive of eligibility determination.24 All of the candidate variables and all of the interactions resulting from the CHAID procedure were then loaded into a logistic regression model to predict eligibility determination, using stepwise techniques to refine the set of predictive variables.
The researchers then repeated the same modeling steps, but this time predicting survey response. First, the 434 nonresponding SFAs with zero weights and the 35 found to be ineligible were removed. Then, for the 489 SFAs that responded, their prevailing weight was adjusted by the inverse of their propensity score from the response model. The final weights ranged from 8.49 to 74.41 and summed to 13,570.
Nonresponse bias analysis
Before constructing the final weights, a nonresponse bias analysis was conducted by examining the relationship between known characteristics of responding and nonresponding SFAs using the variables listed in the weighting section above.25 Nonresponse bias generally cannot be measured directly, because of a lack of survey responses from the nonrespondents, so instead known characteristics that could be correlated with survey measures were considered. If respondents and nonrespondents differ on these characteristics, then it is possible to focus on those differences in the nonresponse adjustments used to construct the analysis weights.
The tables below show unweighted counts and probability-weighted response percentages for categorical variables (Table C.2) and probability-weighted means and medians by response status for continuous variables (Table C.3). All numbers exclude the 35 sampled SFAs that were known to be ineligible, leaving the 965 that were known to be eligible or had undetermined eligibility status.
Response rates in some FNS regions varied considerably from the almost 50-50 split nationwide. The Northeast and Southeast regions had the highest response rates, while the Mid-Atlantic region had the lowest. But the differences were not statistically significant.
Urbanicity can be measured in a number of ways, including membership by ZIP code in an MSA and the NCES urban-centric locale code classifications.26 Binary membership in an MSA was not significantly related to nonresponse, but the more detailed NCES classifications were. SFAs in rural areas had a much lower response rate than those in towns. Charter school presence within a district was significantly associated with nonresponse; all-charter districts had the lowest response rate.
Nonresponse significantly varied by SFA size, with larger SFAs more likely to respond. Size was measured by number of schools, number of students, number of teachers, and number of students per teacher.27 Response rates did not significantly vary with respect to socioeconomic status of students, as measured by the percentage of students who qualify for free or reduced-price meals. SFAs that responded to the survey had significantly lower student populations with special education needs, but a similar relationship with the percentage of students who were English language learners was not evident.

50
In summary, this nonresponse bias analysis showed that survey nonresponse was not random but varied systematically with respect to some SFA characteristics that could be correlated with survey outcomes. To the extent that the responding and nonresponding groups would respond differently from one another to the variables of interest, this introduces nonresponse bias to the survey. Rural and smaller SFAs as well as those with only charter schools were underrepresented in the responding sample. The nonresponse weighting adjustments attempted to reduce the possible bias associated with this by incorporating these and other variables in the weighting adjustments.
Note: For the categorical variables, a Rao-Scott design-adjusted Chi-Square test was used to assess significance.
* p<.05
© 2016 The Pew Charitable Trusts
Table C.2
SMART Study Response Percentages by Categorical Variables
Variable Value Total sample members in category Weighted percentage respondingOverall 965 50.51
Variables from the FNS-742 and available for all 965 SFAs
FNS Region
Mid-Atlantic 97 42.82
Mountain Plains 157 48.15
Midwest 250 49.19
Northeast 111 59.55
Southeast 77 60.81
Southwest 138 51.31
Western 135 46.88
Variables from the CCD and available for only 725 SFAs
MSANo 350 53.42
Yes 375 48.81
NCES Urbanicity*
City 72 56.47
Town 126 60.71
Suburb 157 51.91
Rural 370 46.40
Presence of Charter Schools*
All 56 35.70
Some 48 55.43
None 620 52.20
Data cleaning and coding
After data collection, Mathematica researchers reviewed the raw data file and began to develop data cleaning rules and coding instructions. Data cleaning included checks for:
1. Ensuring that skip patterns were followed and respondents answered only the questions they were meant to.
2. Identifying out-of-range values and duplicate entries.
3. Removing inconsistencies in responses across questionnaire items.
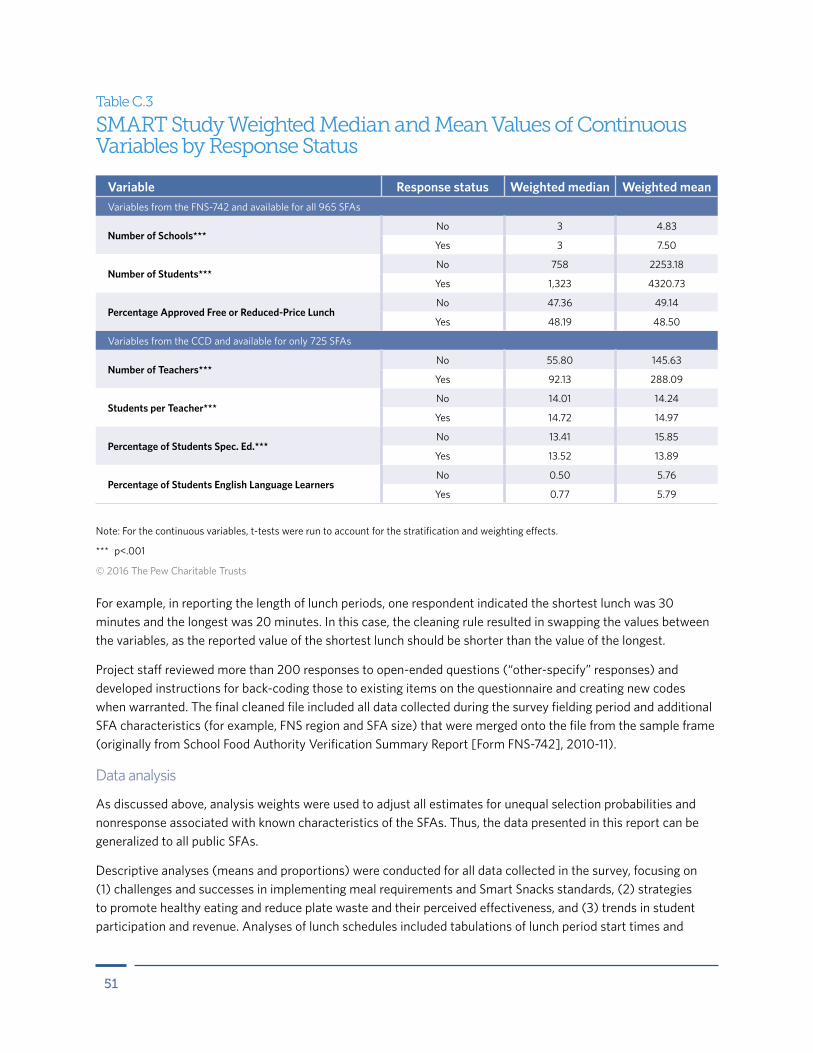
51
Note: For the continuous variables, t-tests were run to account for the stratification and weighting effects.
*** p<.001
© 2016 The Pew Charitable Trusts
Table C.3
SMART Study Weighted Median and Mean Values of Continuous Variables by Response Status
Variable Response status Weighted median Weighted meanVariables from the FNS-742 and available for all 965 SFAs
Number of Schools***No 3 4.83
Yes 3 7.50
Number of Students***No 758 2253.18
Yes 1,323 4320.73
Percentage Approved Free or Reduced-Price LunchNo 47.36 49.14
Yes 48.19 48.50
Variables from the CCD and available for only 725 SFAs
Number of Teachers***No 55.80 145.63
Yes 92.13 288.09
Students per Teacher***No 14.01 14.24
Yes 14.72 14.97
Percentage of Students Spec. Ed.***No 13.41 15.85
Yes 13.52 13.89
Percentage of Students English Language LearnersNo 0.50 5.76
Yes 0.77 5.79
For example, in reporting the length of lunch periods, one respondent indicated the shortest lunch was 30 minutes and the longest was 20 minutes. In this case, the cleaning rule resulted in swapping the values between the variables, as the reported value of the shortest lunch should be shorter than the value of the longest.
Project staff reviewed more than 200 responses to open-ended questions (“other-specify” responses) and developed instructions for back-coding those to existing items on the questionnaire and creating new codes when warranted. The final cleaned file included all data collected during the survey fielding period and additional SFA characteristics (for example, FNS region and SFA size) that were merged onto the file from the sample frame (originally from School Food Authority Verification Summary Report [Form FNS-742], 2010-11).
Data analysis
As discussed above, analysis weights were used to adjust all estimates for unequal selection probabilities and nonresponse associated with known characteristics of the SFAs. Thus, the data presented in this report can be generalized to all public SFAs.
Descriptive analyses (means and proportions) were conducted for all data collected in the survey, focusing on (1) challenges and successes in implementing meal requirements and Smart Snacks standards, (2) strategies to promote healthy eating and reduce plate waste and their perceived effectiveness, and (3) trends in student participation and revenue. Analyses of lunch schedules included tabulations of lunch period start times and

52
strategies to increase eating time, and the mean, median, and range of start times and period durations. Data on distributions of SFA characteristics from the sample frame were also tabulated. In addition, the researchers conducted analyses comparing findings for SFAs that maintained or increased student participation or revenue with those for SFAs that perceived a decline in one or both.28 All analyses were conducted using the survey procedures in SAS Statistical Software (Version 9.4, SAS Institute Inc., Cary, NC, 2014).
Appendix D: Strengths and limitations of the studyWhen drawing conclusions from the SMART Study, both its strengths and limitations should be considered. One of its major strengths is its nationally representative sample of public SFAs that participated in the NSLP in SY 2014-15. Although the survey had a response rate of 52 percent (weighted and unweighted), the responding sample was weighted to better represent all SFAs nationally. The sample design attempted to equalize selection probabilities to maximize the precision of estimates, and it was successful in doing so. The design effect due to unequal weighting was minimal (1.067). Thus, the estimates in this report can be generalized to all public SFAs. Another strength of the study is the timeliness of the findings in relation to the specific meal requirements that had recently taken effect (for example, the sodium Target 1) and the competitive food standards that took effect in SY 2014-15.
The main limitation of the study was that fewer SFAs completed the survey than planned (n= 600), which had a small impact on the precision of estimates. This lower response rate relates to the timing of the data collection period. The SMART Study collected data toward the end of SY 2014-15 (April to July), when a number of other national studies also were collecting data among the same sampling pool and several SFAs already had closed for summer break. However, the response rate for this study is comparable to that of other online surveys of SFAs, including the KITS Study (57 percent and 54 percent weighted and unweighted response rates, respectively). The nonresponse bias analysis found that some subgroups of SFAs may have been underrepresented in the responding sample, but the weights attempted to correct for potential nonresponse bias associated with these characteristics and enhanced the representativeness of the responding sample.
Appendix E: Survey questionnaire
Mathematica Policy ResearchSection A: Implementing the current meal requirements
A1. Thinking about all the schools in your School Food Authority (SFA) or district, would you say the majority of your schools are… Select one only
1 m Located in urban areas
2 m Located in suburban areas
3 m Located in rural areas
d m Don’t know

53
As you know, the current meal requirements for lunch have been in effect since the 2012-13 school year, with some additional requirements phased in during subsequent school years.
A2. Initially, some school districts faced varying challenges in implementing the meal requirements for lunch. During the current school year (2014-15), how would you describe your district’s experience with implementing meal requirements for lunch? Select one only
1 m No challenges GO TO QA8
2 m A few challenges
3 m Some challenges
4 m Many challenges
5 m A great deal of challenges
A3. Have the number of challenges increased, stayed the same, or decreased since the initial implementation of the meal requirements for lunch (SY 2012-13)? Select one only
1 m The number of challenges has increased
2 m The number of challenges has stayed about the same
3 m The number of challenges has decreased
A4. Which of the following meal requirements, if any, are currently a challenge for your district when planning lunch menus? Please focus on challenges related to meeting requirements in planned menus. We’ll ask you about challenges related to student acceptance later in the survey. Select all that apply
0 m Currently meeting all meal requirements without significant challenges
1 m Calorie maximum (keeping total calories below the maximum)
2 m Calorie minimum (keeping total calories at or above the minimum)
3 m Saturated fat limit (keeping saturated fat below the limit)
4 m Trans fat limit (keeping trans fat below the limit)
5 m Sodium limit (keeping sodium below the limit)
6 m Daily or weekly amounts for fruit
7 m Daily or weekly amounts for total vegetables
8 m Weekly amounts for vegetable subgroups (dark green, red/orange, legumes, starchy, and other)
Continued on next page
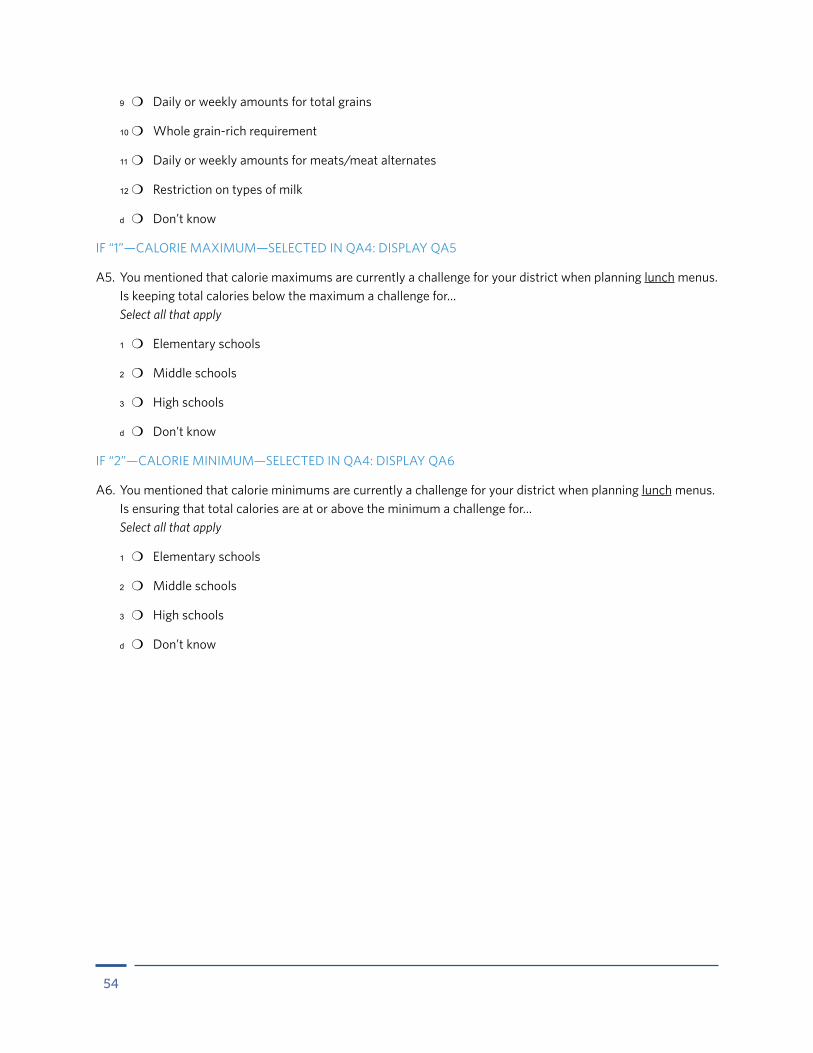
54
9 m Daily or weekly amounts for total grains
10 m Whole grain-rich requirement
11 m Daily or weekly amounts for meats/meat alternates
12 m Restriction on types of milk
d m Don’t know
IF “1”—CALORIE MAXIMUM—SELECTED IN QA4: DISPLAY QA5
A5. You mentioned that calorie maximums are currently a challenge for your district when planning lunch menus. Is keeping total calories below the maximum a challenge for… Select all that apply
1 m Elementary schools
2 m Middle schools
3 m High schools
d m Don’t know
IF “2”—CALORIE MINIMUM—SELECTED IN QA4: DISPLAY QA6
A6. You mentioned that calorie minimums are currently a challenge for your district when planning lunch menus. Is ensuring that total calories are at or above the minimum a challenge for… Select all that apply
1 m Elementary schools
2 m Middle schools
3 m High schools
d m Don’t know

55
IF MORE THAN ONE MEAL REQUIREMENT SELECTED AS CHALLENGING IN QA4: DISPLAY QA7
A7. Of the requirements that are currently a challenge for your district, which are the two most challenging to meet when planning lunch menus? Range = 1-12, d
Item number of first most challenging Item number of second most challenging
m Don’t know
A8. Which of the following best describes when your district began implementing the current meal requirements for lunch? Select one only
1 m Started making changes prior to proposed regulations (before January 2011)
2 m Started making changes when regulations were first proposed (between January 2011 and January 2012)
3 m Started making changes after final regulations went into effect (July 1, 2012)
n m Have not yet made changes
d m Don’t know
As you know, the current meal requirements for breakfast have been in effect since the 2013-14 school year, with some additional requirements phased in during subsequent school years.
A9. Initially, some school districts faced varying challenges in implementing the meal requirements for breakfast. During the current school year (2014-15), how would you describe your district’s experience with implementing meal requirements for breakfast? Select one only
1 m No challenges GO TO QA16
2 m A few challenges
3 m Some challenges
4 m Many challenges
5 m A great deal of challenges
n m District does not offer breakfast GO TO QA16
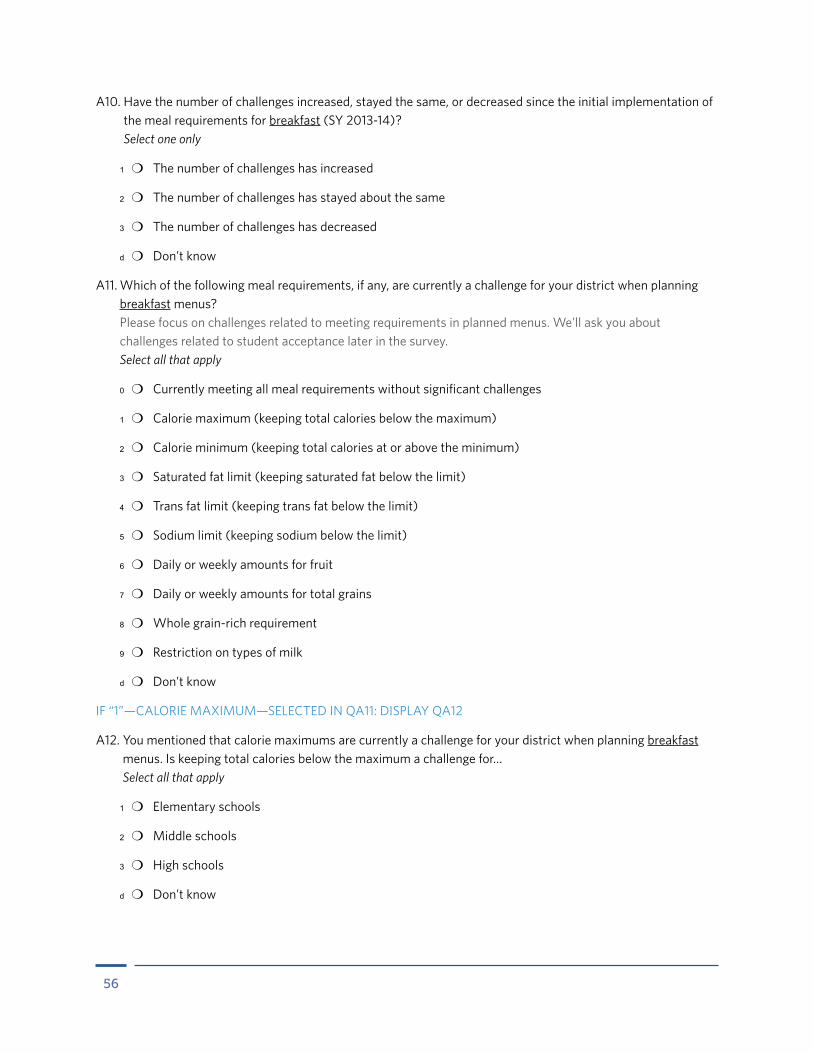
56
A10. Have the number of challenges increased, stayed the same, or decreased since the initial implementation of the meal requirements for breakfast (SY 2013-14)? Select one only
1 m The number of challenges has increased
2 m The number of challenges has stayed about the same
3 m The number of challenges has decreased
d m Don’t know
A11. Which of the following meal requirements, if any, are currently a challenge for your district when planning breakfast menus? Please focus on challenges related to meeting requirements in planned menus. We’ll ask you about challenges related to student acceptance later in the survey. Select all that apply
0 m Currently meeting all meal requirements without significant challenges
1 m Calorie maximum (keeping total calories below the maximum)
2 m Calorie minimum (keeping total calories at or above the minimum)
3 m Saturated fat limit (keeping saturated fat below the limit)
4 m Trans fat limit (keeping trans fat below the limit)
5 m Sodium limit (keeping sodium below the limit)
6 m Daily or weekly amounts for fruit
7 m Daily or weekly amounts for total grains
8 m Whole grain-rich requirement
9 m Restriction on types of milk
d m Don’t know
IF “1”—CALORIE MAXIMUM—SELECTED IN QA11: DISPLAY QA12
A12. You mentioned that calorie maximums are currently a challenge for your district when planning breakfast menus. Is keeping total calories below the maximum a challenge for… Select all that apply
1 m Elementary schools
2 m Middle schools
3 m High schools
d m Don’t know
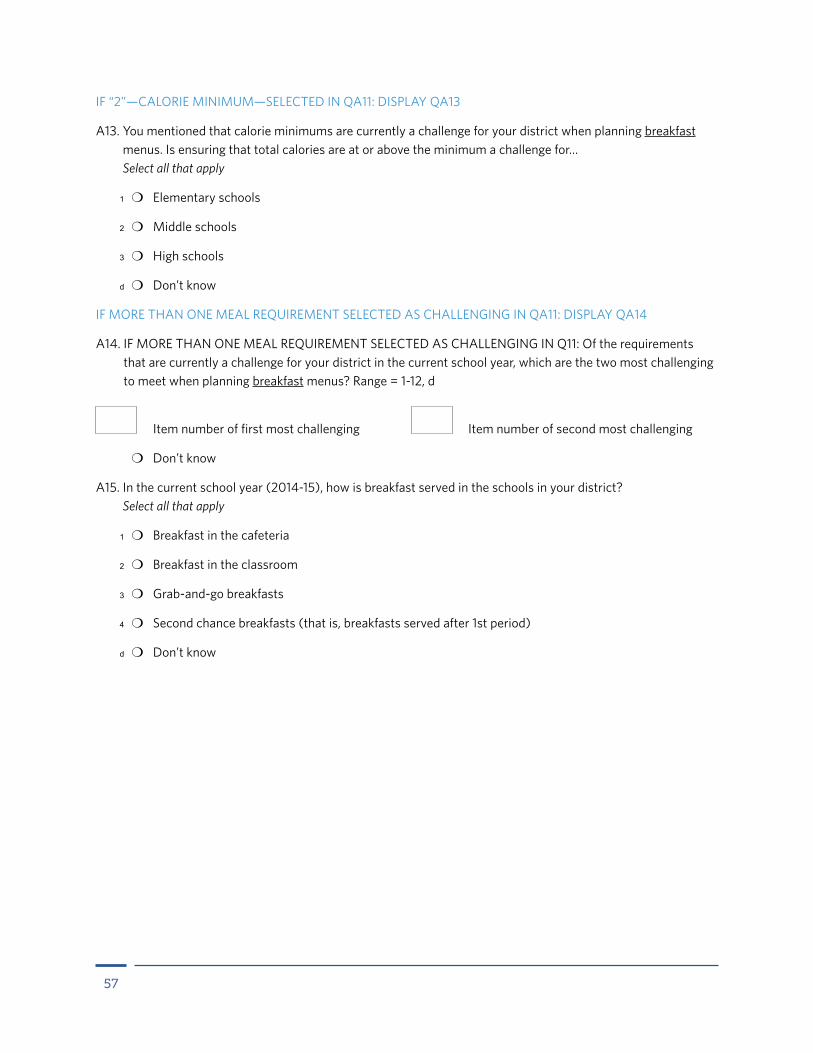
57
IF “2”—CALORIE MINIMUM—SELECTED IN QA11: DISPLAY QA13
A13. You mentioned that calorie minimums are currently a challenge for your district when planning breakfast menus. Is ensuring that total calories are at or above the minimum a challenge for… Select all that apply
1 m Elementary schools
2 m Middle schools
3 m High schools
d m Don’t know
IF MORE THAN ONE MEAL REQUIREMENT SELECTED AS CHALLENGING IN QA11: DISPLAY QA14
A14. IF MORE THAN ONE MEAL REQUIREMENT SELECTED AS CHALLENGING IN Q11: Of the requirements that are currently a challenge for your district in the current school year, which are the two most challenging to meet when planning breakfast menus? Range = 1-12, d
Item number of first most challenging Item number of second most challenging
m Don’t know
A15. In the current school year (2014-15), how is breakfast served in the schools in your district? Select all that apply
1 m Breakfast in the cafeteria
2 m Breakfast in the classroom
3 m Grab-and-go breakfasts
4 m Second chance breakfasts (that is, breakfasts served after 1st period)
d m Don’t know

58
IF YOU EXPERIENCE CHALLENGES IN QA2 AND/OR QA11 (QS A2 AND A11 ARE GREATER THAN 1) : DISPLAY QA16
A16. Which of the following factors contribute to the challenges your district currently faces in meeting the meal requirements for lunch or breakfast? Select one factor per row
Yes No Don’t knowa. Kitchen staff understanding of the current meal requirements 1 m 0 m d m
b. Availability of foods with appropriate calorie levels 1 m 0 m d m
c. Availability of foods with appropriate sodium levels 1 m 0 m d m
d. Availability of whole grain-rich foods 1 m 0 m d m
e. Cost of foods required to meet the current meal requirements 1 m 0 m d m
f. Availability of foods that meet the current meal requirements and are acceptable to students
1 m 0 m d m
g. Needing to offer different portion sizes to different grade groups 1 m 0 m d m
h. Needing additional staff or labor hours to prepare meals that meet the current meal requirements
1 m 0 m d m
i. Needing additional equipment to prepare meals that meet current meal requirements
1 m 0 m d m
j. Training staff to prepare meals that meet the current meal requirements
1 m 0 m d m
k. Needing technical assistance, for example, with nutrient analysis, modifying recipes, or developing purchasing specifications to be consistent with meal requirements
1 m 0 m d m
l. Another factor contributes (specify) 1 m 0 m d m
A17. Did your district make any of the following changes to meal production or meal service in order to implement the current meal requirements for lunch or breakfast? Select all that apply
1 m Move to a central facility/commissary or production kitchen(s)
2 m Prepare more or different foods from scratch
3 m Purchase more commercially prepared foods
4 m Use more pre-packaged or grab-and-go meals
5 m Use more pre-portioned condiments to control portion sizes
6 m Use more pre-portioned salad dressings to control portion sizes
7 m Use school gardens and/or locally grown produce to offer more fruits and vegetables
8 m Increase menu options
Continued on next page

59
9 m Decrease menu options
10 m Move to cycle menus
11 m Increase use of salad bars
12 m Start a central bakery to produce whole grain-rich items
13 m Dropped or added vendors
14 m Did not make any changes
99 m Other (specify)
A18. Beginning in the current school year (2014-15), all grains served in lunches and breakfasts are required to be whole grain-rich. Given product availability, what proportion of grains do you think you could most successfully serve as whole grain-rich? Select one only
1 m All (100%)
2 m Nearly all (90%)
3 m Most (75%)
4 m Some (50%)
5 m Few (less than 50%)
6 m None
A19. Please think about your district’s revenue from reimbursable school meals (including lunch and breakfast). Compared to school year 2011-12 (the year before the new meal requirements went into effect), please indicate whether revenue from reimbursable school meals increased a great deal, increased somewhat, stayed the same, decreased somewhat, or decreased a great deal during the three school years below: Select one per row
School year Increased a great deal
Increased somewhat Stayed the same Decreased
somewhatDecreased a
great deal
a. 2012-13 1 m 2 m 3 m 4 m 5 m
b. 2013-14 1 m 2 m 3 m 4 m 5 m
c. 2014-15 1 m 2 m 3 m 4 m 5 m
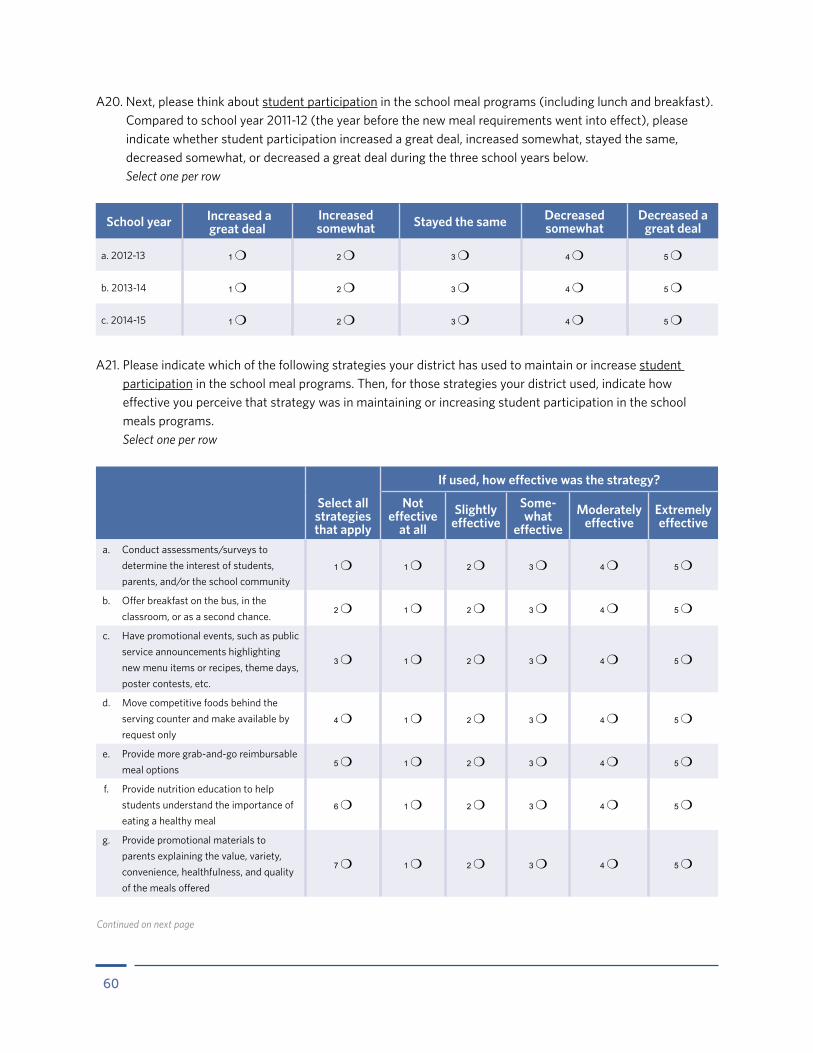
60
A20. Next, please think about student participation in the school meal programs (including lunch and breakfast). Compared to school year 2011-12 (the year before the new meal requirements went into effect), please indicate whether student participation increased a great deal, increased somewhat, stayed the same, decreased somewhat, or decreased a great deal during the three school years below. Select one per row
School year Increased a great deal
Increased somewhat Stayed the same Decreased
somewhatDecreased a
great deal
a. 2012-13 1 m 2 m 3 m 4 m 5 m
b. 2013-14 1 m 2 m 3 m 4 m 5 m
c. 2014-15 1 m 2 m 3 m 4 m 5 m
A21. Please indicate which of the following strategies your district has used to maintain or increase student participation in the school meal programs. Then, for those strategies your district used, indicate how effective you perceive that strategy was in maintaining or increasing student participation in the school meals programs. Select one per row
If used, how effective was the strategy?
Select all strategies that apply
Not effective
at allSlightly
effectiveSome-what
effectiveModerately
effectiveExtremely effective
a. Conduct assessments/surveys to determine the interest of students, parents, and/or the school community
1 m 1 m 2 m 3 m 4 m 5 m
b. Offer breakfast on the bus, in the classroom, or as a second chance.
2 m 1 m 2 m 3 m 4 m 5 m
c. Have promotional events, such as public service announcements highlighting new menu items or recipes, theme days, poster contests, etc.
3 m 1 m 2 m 3 m 4 m 5 m
d. Move competitive foods behind the serving counter and make available by request only
4 m 1 m 2 m 3 m 4 m 5 m
e. Provide more grab-and-go reimbursable meal options
5 m 1 m 2 m 3 m 4 m 5 m
f. Provide nutrition education to help students understand the importance of eating a healthy meal
6 m 1 m 2 m 3 m 4 m 5 m
g. Provide promotional materials to parents explaining the value, variety, convenience, healthfulness, and quality of the meals offered
7 m 1 m 2 m 3 m 4 m 5 m
Continued on next page

61
h. Provide promotional materials to teachers explaining the importance of the current standards
8 m 1 m 2 m 3 m 4 m 5 m
i. Provide nutrition education to teachers to help understand the importance of the current standards
9 m 1 m 2 m 3 m 4 m 5 m
j. Train staff to encourage students to try unfamiliar foods 10 m 1 m 2 m 3 m 4 m 5 m
k. Work with administrators to develop lunch/recess schedules 11 m 1 m 2 m 3 m 4 m 5 m
l. Work with school wellness representatives to ensure that classroom celebrations do not compete with school lunch
12 m 1 m 2 m 3 m 4 m 5 m
m. Hire outside chefs to develop new recipes that students enjoy 13 m 1 m 2 m 3 m 4 m 5 m
n. Develop a student advisory committee to gather input on new recipes and products and perform taste tests of new foods
14 m 1 m 2 m 3 m 4 m 5 m
o. Increase the length of the lunch/breakfast periods 15 m 1 m 2 m 3 m 4 m 5 m
p. Host a student recipe competition 16 m 1 m 2 m 3 m 4 m 5 m
q. Utilize the Community Eligibility Provision 17 m 1 m 2 m 3 m 4 m 5 m
r. Include school food service promotion in parent and community school nights, special events, PTA or PTO meetings, etc.
18 m 1 m 2 m 3 m 4 m 5 m
s. Other (specify) 19 m 1 m 2 m 3 m 4 m 5 m
t. Have not used any strategies n m
If used, how effective was the strategy?
Select all strategies that apply
Not effective
at allSlightly
effectiveSome-what
effectiveModerately
effectiveExtremely effective
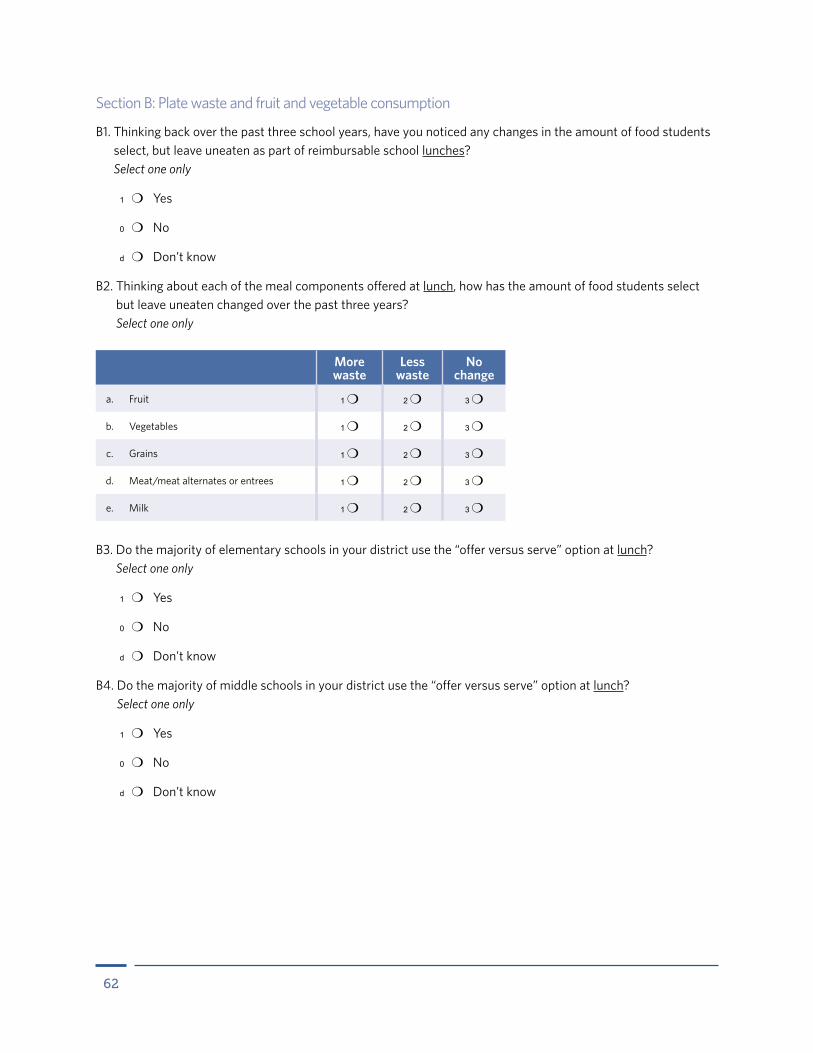
62
Section B: Plate waste and fruit and vegetable consumption
B1. Thinking back over the past three school years, have you noticed any changes in the amount of food students select, but leave uneaten as part of reimbursable school lunches? Select one only
1 m Yes
0 m No
d m Don’t know
B2. Thinking about each of the meal components offered at lunch, how has the amount of food students select but leave uneaten changed over the past three years? Select one only
More waste
Less waste
No change
a. Fruit 1 m 2 m 3 m
b. Vegetables 1 m 2 m 3 m
c. Grains 1 m 2 m 3 m
d. Meat/meat alternates or entrees 1 m 2 m 3 m
e. Milk 1 m 2 m 3 m
B3. Do the majority of elementary schools in your district use the “offer versus serve” option at lunch? Select one only
1 m Yes
0 m No
d m Don’t know
B4. Do the majority of middle schools in your district use the “offer versus serve” option at lunch? Select one only
1 m Yes
0 m No
d m Don’t know

63
B5. Please indicate whether your district has used any of the following strategies to help reduce plate waste. Then, for those strategies that your district used, indicate how effective you perceive that strategy was in reducing plate waste.
If used, how effective was the strategy?
Select all strategies that apply
Not effective
at allSlightly
effectiveSome-what
effectiveModerately
effectiveExtremely effective
a. Provide nutrition education to help students understand the importance of eating a healthy meal
1 m 1 m 2 m 3 m 4 m 5 m
b. Provide promotional materials to parents explaining the value, variety, convenience, healthfulness, and quality of the meals offered
2 m 1 m 2 m 3 m 4 m 5 m
c. Provide promotional materials to teachers explaining the importance of the current meal requirements
3 m 1 m 2 m 3 m 4 m 5 m
d. Provide nutrition education to teachers to help understand the importance of the current meal requirements
4 m 1 m 2 m 3 m 4 m 5 m
e. Train staff to encourage students to try unfamiliar foods
5 m 1 m 2 m 3 m 4 m 5 m
f. Work with administrators to change lunch/recess schedules
6 m 1 m 2 m 3 m 4 m 5 m
g. Work with school wellness representatives to ensure that classroom celebrations do not compete with school meals
7 m 1 m 2 m 3 m 4 m 5 m
h. Hire outside chefs to develop new recipes that students enjoy
8 m 1 m 2 m 3 m 4 m 5 m
i. Perform taste tests of new foods with students
9 m 1 m 2 m 3 m 4 m 5 m
j. Increase the length of the lunch/breakfast periods
10 m 1 m 2 m 3 m 4 m 5 m
k. Change the cafeteria environment to help students make smarter choices
11 m 1 m 2 m 3 m 4 m 5 m
l. Use share tables or other ways of redistributing uneaten, sealed foods
12 m 1 m 2 m 3 m 4 m 5 m
m. Other (specify) 13 m 1 m 2 m 3 m 4 m 5 m
n. Have not used any strategies N m

64
B6. Please indicate whether your district has used any of the following strategies to entice students to select and consume fruits and vegetables. Then, for those strategies your district used, please indicate whether students ate more, ate about the same amount, or ate less fruits and vegetables after applying that strategy.
If used, how did fruit or vegetable consumption change?
Select all strategies that apply
Ate more Ate about the same amount Ate less
a. Cut up fresh fruit to make it easier for young students to eat
1 m 1 m 2 m 3 m
b. Offer a wider variety of fruit and vegetable choices
2 m 1 m 2 m 3 m
c. Display whole fruit in attractive bowls or baskets
3 m 1 m 2 m 3 m
d. Show daily fruit and vegetable options on signs with creative and age-appropriate names
4 m 1 m 2 m 3 m
e. Display fruit near the cash register 5 m 1 m 2 m 3 m
f. Offer more local produce 6 m 1 m 2 m 3 m
g. Increase use of salad bars 7 m 1 m 2 m 3 m
h. Move competitive foods behind the serving counter and make available by request only
8 m 1 m 2 m 3 m
i. Modify recipes to make foods taste better to students
9 m 1 m 2 m 3 m
j. Institute school gardens where children participate in growing fruits and vegetables
10 m 1 m 2 m 3 m
k. Other (specify) 11 m 1 m 2 m 3 m
l. Did not use any strategies n m

65
Section C: Lunch schedules
C1. How many minutes is the longest lunch period in your district? Range = 0-90
Longest lunch period
d m Don’t know
C2. How many minutes is the shortest lunch period in your district? Range = 0-90
Shortest lunch period
d m Don’t know
C3. When does the first lunch period start in your district? Range: Hour 0-2 | Minutes 0-90
Hour Minute
1 m a.m.
2 m p.m
d m Don’t know
C4. When does the last lunch period start in your district? Range: Hour 0-2 | Minutes 0-90
Hour Minute
1 m a.m.
2 m p.m
d m Don’t know
C5. Some districts have employed strategies to help increase the amount of time students have to eat lunch. Has your district used any of the following strategies to increase the amount of time students have to eat their lunch? Select all that apply
n m Have not tried to increase eating time for lunch
1 m Increase the number of serving lines and/or food stations available to students, such as kiosks, carts, standalone salad bars or other self-service stations, fresh fruit displays, and milk coolers
2 m Increase the number of cashiers/checkout stations
3 m Provide all required meal components on every serving line or food station in the required minimum amounts
Continued on next page

66
4 m Require students to pre-order lunch
5 m Provide students the option to pre-order lunch
6 m Offer more grab-and-go options in the cafeteria
7 m Provide reimbursable grab-and-go lunches via vending machines or at other locations in the school
99 m Used another strategy (specify)
Section D: Implementing the Smart Snacks standards
In this section, we ask about the steps your district has taken to implement the Smart Snack in Schools nutrition standards. We ask separately about competitive foods (that is, foods and beverages sold outside of the school meal programs) that are sold by the food service department versus those sold by other entities in your schools.
D1. When did your district start to implement the nutrition standards for competitive foods sold by the school food service department? Select one only
1 m Started making changes before the 2010-11 school year
2 m Started making changes after 2011 but before the Smart Snack standards went into effect (2014-15 school year)
3 m Started making changes during the current school year (2014-15), when the Smart Snack standards went into effect
4 m Have not yet started to implement nutrition standards for competitive foods
d m Don’t know
D2. To what extent do competitive foods sold by the school food service department currently meet the Smart Snacks standards? Select one only
1 m All foods meet the Smart Snack standards GO TO QD4
2 m Most foods meet the Smart Snack standards
3 m Some foods meet the Smart Snack standards
4 m Few foods meet the Smart Snack standards
5 m No foods meet the Smart Snack standards
d m Don’t know

67
D3. Some districts may face barriers when providing foods and beverages that meet the Smart Snack standards. Which of the following, if any, are currently barriers to being able to fully implement the Smart Snacks standards this school year? Select one per row
Yes No Don’t knowa. Kitchen staff understanding of the Smart Snack standards 1 m 0 m d m
b. Availability of competitive foods that meet the Smart Snack standards
1 m 0 m d m
c. Cost of competitive foods that meet the Smart Snack standards 1 m 0 m d m
d. Student acceptance of competitive foods that meet the Smart Snack standards
1 m 0 m d m
e. School faculty and staff reactions to the competitive foods that meet the Smart Snack standards
1 m 0 m d m
f. Parents’ reactions to the competitive foods that meet the Smart Snack standards
1 m 0 m d m
g. Competition from noncompliant foods sold directly outside the cafeteria, such as fundraiser
1 m 0 m d m
h. Other (specify) 1 m 0 m d m
i. District faces no barriers to providing foods and beverages that meet the Smart Snacks standards
1 m 0 m d m
D4. To what extent do competitive foods sold outside of your district’s food service program (e.g. fundraisers, school stores) meet the Smart Snack standards? Select one only
1 m All foods meet the Smart Snack standards
2 m Most foods meet the Smart Snack standards
3 m Some foods meet the Smart Snack standards
4 m Few foods meet the Smart Snack standards
5 m No foods meet the Smart Snack standards
d m Don’t know
D5. Who are the key people in your district that ensure stronger competitive food standards are implemented? Select all that apply
1 m State child nutrition staff
2 m SFA director
3 m Other SFA staff
4 m School superintendent
Continued on next page

68
5 m School board members
6 m School nutrition managers
7 m Principals
8 m Teachers
9 m Parents (e.g., Parent Teacher Association-PTA)
10 m Health advisory/wellness council or committee
d m Don’t know
D6. Which of the strategies listed below has your district used to provide safe, free drinking water to students in areas where meals are served? Select all that apply
n m Have not used any strategies
1 m Promote water consumption with signage/positive messaging
2 m Direct students to functioning water fountains located in or near the cafeteria
3 m Offer nonfountain sources of water (e.g., dispensers, pitchers, coolers) in the meal service area
4 m Allow children to bring water bottles for refilling
99 m Other (specify)
D7. Some school districts may face barriers to providing safe, free drinking water to students. Which of the following, if any, are barriers your district faces in making safe, free drinking water readily available to students in areas where meals are served? Select all that apply
n m Have not faced any barriers
1 m Significant infrastructure repairs are needed for old plumbing or fixtures
2 m More plumbing is needed, such as water supply or location of fountains or sinks
3 m Water in the fountain or dispensers is not cold
4 m Too few fountains for the number of students
5 m Lack of policy or practice for testing water quality
6 m The need to implement hygiene standards for drinking fountains
7 m Need additional funds to offer bottled water or water pitchers and cups
8 m Lead in the water making it unsafe to drink
99 m Other (specify)
69
D8. When you think about any change in revenue from competitive foods and reimbursable school meals combined between school year 2013-14 and 2014-15, would you say… Select one only
1 m Overall revenue increased
2 m Overall revenue decreased
3 m Overall revenue stayed the same
D9. Some districts report that they struggle to make revenue meet costs. Currently, what is your district’s greatest financial concern, if any? Select one only
1 m Labor costs
2 m Food costs
3 m Equipment costs
4 m Decreased revenue from competitive foods
5 m Decreased student participation in school meal programs
6 m Meal price increases
n m No concerns
d m Don’t know
Section E: Nutrition education
E1. Are students in your district required to receive classroom-based nutrition education? Select one only
1 m Yes
0 m No
d m Don’t know
E2. What other strategies are used to promote healthy eating in your district? Select all that apply
n m Have not used any strategies
1 m Cooking demonstrations or activities conducted by school food service staff or teachers
2 m Conducting schoolwide events to promote nutrition (for example, a school garden project, nutrition fair, or school play)
3 m Conducting (or participating in) communitywide programs or events to promote nutrition and physical activity
Continued on next page

70
4 m Nutrition education messages on food service website/posted menus
5 m Posters and signs in cafeteria
5 m Invite family members to consume school meal
7 m School food service staff present at PTA or other parent meeting
8 m Some other way (specify)
Section F: Kitchen equipment funding and purchases
F1. In the past three years, has your district received USDA funding from competitive equipment grants? Select one only
1 m Yes
0 m No GO TO QF7
d m Don’t know
F2. Which of the following criteria are used to determine the allocation of USDA funds for kitchen equipment to the schools in your district? Select all that apply
1 m Schools with the greatest need
2 m Schools with 50% or more of students eligible for free or reduced-price meals
3 m Schools that are new or recently rebuilt
4 m Schools with the greatest potential for increased student participation
99 m Other (specify)

71
F3. Has your district purchased equipment using USDA funds to support any of the key food service functions listed below? Select one per row
Yes No Don’t knowReceiving and storage
a. Receiving and storage equipment, such as forklifts/pallet jacks, scales, dry storage shelving, walk-in refrigerators/freezers
1 m 0 m d m
Production
b. Production equipment, such as fruit/vegetable preparation sinks, stainless-steel worktables, slicers/vertical cutters, food processors/mixers, roll-in convection ovens, steam jacketed kettles, conveyor/wrapper system
1 m 0 m d m
Holding and transportation
c. Holding equipment, such as walk-in cooler (separate from receiving/storage walk-in refrigerators), hot holding mobile carts
1 m 0 m d m
d. Transportation equipment, such as refrigerated and nonrefrigerated trucks
1 m 0 m d m
Meal service area
e. Meal service equipment, such as hot or cold food service line counters, salad or fruit/vegetable bar, steam tables, milk coolers
1 m 0 m d m
Administrative
f. Administrative equipment, such as computers and software programs 1 m 0 m d m

72
IF “YES” FOR ANY OF THE EQUIPMENT TYPES IN QF3: DISPLAY QF4
F4. Thinking about the equipment your district purchased using USDA funds, please indicate whether the equipment purchase had an impact on your district’s ability to meet any of the current meal requirements. Select all that apply for each equipment type selected
Greater variety of fruit and
vegetable items on menus
Increased whole
grain-rich items on menus
Calorie ranges, saturated fat, trans fat, and
sodium targets
Varied portion sizes by grade
groupsDon’t know
Receiving and storage
a. Receiving and storage equipment, such as forklifts/pallet jacks, scales, dry storage shelving, walk-in refrigerators/freezers
1 m 2 m 3 m 4 m d m
Production
b. Production equipment, such as fruit/vegetable preparation sinks, stainless-steel worktables, slicers/vertical cutters, food processors/mixers, roll-in convection ovens, steam jacketed kettles, conveyor/wrapper system
1 m 2 m 3 m 4 m d m
Holding and transportation
c. Holding equipment, such as walk-in cooler (separate from receiving/storage walk-in refrigerators), hot holding mobile carts
1 m 2 m 3 m 4 m d m
d. Transportation equipment, such as refrigerated and nonrefrigerated trucks
1 m 2 m 3 m 4 m d m
Meal service area
e. Meal service equipment, such as hot or cold food service line counters, salad or fruit/vegetable bar, steam tables, milk coolers
1 m 2 m 3 m 4 m d m
Administrative
f. Administrative equipment, such as computers and software programs
1 m 2 m 3 m 4 m d m

73
IF “YES” FOR ANY OF THE EQUIPMENT TYPES IN QF3: DISPLAY QF5
F5. Would you say the use of these equipment funds has improved meal preparation and service in any of the following ways? Select one per row
Yes No Don’t knowa. Improved the safety of food served in the school meal programs 1 m 0 m d m
b. Improved the overall efficiency of school food service operations (for example, by increasing the number of serving lines or food stations offering reimbursable meal components)
1 m 0 m d m
c. Improved the quality of school meals 1 m 0 m d m
d. Improved or expanded participation in the NSLP and/or SBP 1 m 0 m d m
e. Improved the ways for cashiers to identify students who are eligible for free or reduced-price meals
1 m 0 m d m
f. Other (specify) 1 m 0 m d m
F6. Were the USDA equipment funds your district received adequate to meet your district’s needs?
1 m Yes
0 m No
d m Don’t know
F7. What sources of funding, other than the USDA funding, do you use to purchase equipment? Select all that apply
n m No other funding sources
1 m State or tribal government agency other than USDA (e.g., health department)
2 m City, county, or other local government agency (e.g., health department, agriculture department)
3 m Nutrition trade association (e.g., Academy of Nutrition and Dietetics, American School Nutrition Association)
4 m Universities, colleges, or other higher education institutions
5 m Health associations (e.g., state or national affiliates of the American Cancer Society or Diabetes or Heart associations)
6 m Private individual donations
99 m Other (specify)

74
Endnotes1 Juliana F.W. Cohen et al., “Impact of the New U.S. Department of Agriculture School Meal Standards on Food Selection, Consumption,
and Waste,” American Journal of Preventive Medicine 46, no. 4 (2014): 388–94, doi: 10.1016/j.amepre.2013.11.013; Marlene B. Schwartz et al., “New School Meal Regulations Increase Fruit Consumption and Do Not Increase Total Plate Waste,” Childhood Obesity 11, no. 3 (2015): 242–47, doi: 10.1089/chi.2015.0019; Karen W. Cullen, Tzu-An Chen, and Jayna M. Dave, “Changes in Foods Selected and Consumed After Implementation of the New National School Lunch Program Meal Patterns in Southeast Texas,” Preventive Medicine Reports 2 (2015): 440–43, doi: 10.1016/j.pmedr.2015.05.007; Donna B. Johnson et al., “Effect of the Healthy Hunger-Free Kids Act on the Nutritional Quality of Meals Selected by Students and School Lunch Participation Rates,” JAMA Pediatrics 170, no. 1 (2016), doi: 10.1001/jamapediatrics.2015.3918; Lindsey Turner et al., “Improvements and Disparities in Types of Foods and Milk Beverages Offered in Elementary School Lunches, 2006–2007 to 2013–2014,” Preventing Chronic Disease 17 (2016): 13:E39, doi: 10.5888/pcd13.150395; and Yvonne M. Terry-McElrath, Patrick M. O’Malley, and Lloyd D. Johnston, “Foods and Beverages Offered in U.S. Public Secondary Schools Through the National School Lunch Program From 2011–2013: Early Evidence of Improved Nutrition and Reduced Disparities,” Preventive Medicine 78 (2015): 52–58, doi: 10.1016/j.ypmed.2015.07.010.
2 School food authorities are local administrative units that operate the National School Lunch Program and/or School Breakfast Program for one or more school districts.
3 National Center for Education Statistics, “Schools and Staffing Survey (SASS) 2011–2012,” accessed Jan. 26, 2016, http://nces.ed.gov/surveys/sass/tables/sass1112_2013312_s12n_001.asp.
4 U.S. Department of Agriculture, Food and Nutrition Service, “National School Lunch Program: Participation and Lunches Served (Data as of November 10, 2016),” accessed Nov. 15, 2016, http://www.fns.usda.gov/sites/default/files/pd/slsummar.pdf; and U.S. Department of Agriculture, Food and Nutrition Service, “School Breakfast Program Participation and Meals Served (Data as of November 10, 2016),” accessed Nov. 15, 2016, http://www.fns.usda.gov/sites/default/files/pd/sbsummar.pdf.
5 Institute of Medicine, School Meals: Building Blocks for Healthy Children (Washington: National Academies Press, 2010); and U.S. Department of Agriculture and U.S. Department of Health and Human Services, Dietary Guidelines for Americans, 2010, 7th ed., http://health.gov/dietaryguidelines/2010.
6 U.S. Department of Agriculture, “School Meals: Community Eligibility Provision,” accessed Jan. 27, 2016, http://www.fns.usda.gov/school-meals/community-eligibility-provision. The Community Eligibility Provision (CEP) of the Healthy, Hunger-Free Kids Act of 2010 allows schools and local education agencies (LEAs) in communities with high poverty rates to provide breakfast and lunch to all students at no cost. The CEP eliminates the burden of collecting applications from and determining eligibility for free or reduced-price meals of individual families and instead uses information from other programs, such as the Supplemental Nutrition Assistance Program and Temporary Assistance for Needy Families. The USDA phased in the CEP over a period of three years in a limited number of states and made it available nationwide beginning July 1, 2014.
7 U.S. Department of Agriculture, Food and Nutrition Service, “Tools for Schools: Serving Whole Grain-Rich,” accessed Feb. 9, 2016, http://www.fns.usda.gov/healthierschoolday/tools-schools-serving-whole-grain-rich; and U.S. Department of Agriculture, Food and Nutrition Service, “Tools for Schools: Reducing Sodium,” accessed Feb. 9, 2016, http://www.fns.usda.gov/healthierschoolday/tools-schools-sodium. Beginning in SY 2012–13 for lunch and SY 2013–14 for breakfast, half of the grains offered in school meals had to meet the whole grain-rich criteria. By SY 2014–15, all grains in school lunches and breakfasts were required to be whole grain-rich. The USDA’s updated nutrition standards for school meals also established three sodium targets intended to be phased in over 10 years, with specific limits for students by grade level. Schools were expected to comply with the sodium Target 1 level by SY 2014–15. Federal Register (2012), 7 CFR Parts 210 and 220, “Nutrition Standards in the National School Lunch and School Breakfast Programs: Final Rule,” U.S. Department of Agriculture, Food and Nutrition Service, 77 (17) (Jan. 26, 2012), https://www.gpo.gov/fdsys/pkg/FR-2012-01-26/pdf/2012-1010.pdf.
8 Federal Register (2013), 7 CFR Parts 2010 and 220, “National School Lunch and School Breakfast Program: Nutrition Standards for All Foods Sold in School as Required by the Healthy, Hunger-Free Kids Act of 2010; Interim Final Rule,” U.S. Department of Agriculture, Food and Nutrition Service, 78 (125) (June 28, 2013), https://www.gpo.gov/fdsys/pkg/FR-2013-06-28/pdf/2013-15249.pdf.
9 The Pew Charitable Trusts and the Robert Wood Johnson Foundation, Serving Healthy School Meals: Despite Challenges, Schools Meet USDA Meal Requirements (2013), http://www.pewtrusts.org/en/research-and-analysis/reports/2013/09/30/serving-healthy-school-meals.
10 U.S. Department of Agriculture, Food and Nutrition Service, “School Meal Certification Data (Data as of December 2015),” accessed March 21, 2016, http://www.fns.usda.gov/school-meals/school-meal-certification-data.
11 The Pew Charitable Trusts and the Robert Wood Johnson Foundation, Serving Healthy School Meals: Despite Challenges, Schools Meet USDA Meal Requirements.
12 Ibid.

75
13 Whitney Ellersick, “Cycle Menus 101,” School Nutrition Magazine, November 2015, https://schoolnutrition.org/uploadedFiles/Certification,_Education_and_Professional_development/PDAs/ItsYourBusiness_NOV15_PDA.pdf.
14 The Pew Charitable Trusts and the Robert Wood Johnson Foundation, Serving Healthy School Meals: Despite Challenges, Schools Meet USDA Meal Requirements.
15 U.S. Department of Agriculture, Food and Nutrition Service, “School Breakfast Program.”
16 U.S. Department of Agriculture, Food and Nutrition Service, “National School Lunch Program.”
17 The Pew Charitable Trusts and the Robert Wood Johnson Foundation, Health Impact Assessment: National Nutrition Standards for Snack and a la Carte Foods and Beverages Sold in Schools (2012), http://www.pewtrusts.org/en/research-and-analysis/reports/0001/01/01/health-impact-assessment-national-nutrition-standards-for-snack-and-a-la-carte-foods-and-beverages-sold-in-schools.
18 U.S. Department of Agriculture, Food and Nutrition Service, “The Community Eligibility Provision (CEP): What Does It Mean for Your School or Local Educational Agency?” accessed April 11, 2016, http://www.fns.usda.gov/sites/default/files/cn/CEPfactsheet.pdf. Schools with a minimum identified student percentage of at least 40 percent are eligible to participate in the CEP. Identified students are those certified for free meals without the use of household applications (for example, those directly certified through the Supplemental Nutrition Assistance Program).
19 The Pew Charitable Trusts and the Robert Wood Johnson Foundation, Serving Healthy School Meals: U.S. Schools Need Updated Kitchen Equipment (2013), http://www.pewtrusts.org/en/research-and-analysis/reports/2013/12/18/serving-healthy-school-meals-kitchen-equipment.
20 The Pew Charitable Trusts and the Robert Wood Johnson Foundation, Serving Healthy School Meals: Despite Challenges, Schools Meet USDA Meal Requirements.
21 SFA directors were the intended respondents for the study. However, SFA directors could designate another staff person to complete the survey.
22 In addition, 94 partial responses were treated as nonrespondents: Forty-two of these were known to be eligible for the study, and 52 had an undetermined eligibility.
23 SFAs and LEAs usually coincide, except when an SFA operates school nutrition programs for multiple districts or for an individual school (for example, for charter schools). Only 725 of the 965 SFAs (eligible or undetermined status) were matched to the CCD by an LEA identifier. Another 165 SFAs were manually matched, leaving 75 with no CCD data to use for weighting. The SFAs that could not be linked to the CCD were assigned a special “missing” category for their CCD variables.
24 IBM Corp., “IBM SPSS Statistics for Windows, Version 22.0” (Armonk, NY: IBM Corp., 2013).
25 As mentioned above, only 725 of these 965 SFAs were matched to the CCD by the LEA identifier. At the time of the nonresponse bias analysis, the additional cases had not yet been manually matched to the CCD, nor had the special missing category been created. For these variables, the nonresponse bias was analyzed using the smaller sample size.
26 Although a strong relationship exists between MSA classification and NCES urban-centric locale codes in the sample, the relationship is not as clear as one might expect. Almost all cities and suburbs are located within MSAs, but towns and rural areas are somewhat more evenly split.
27 Number of teachers is measured in full-time-equivalent teachers, so for some SFAs this number is fractional.
28 The SMART survey asked SFA directors about perceptions of changes in student participation and revenue from reimbursable school meals since SY 2011–12—the year before the new meal requirements went into effect. SFAs that had either (1) increased or steady participation in SYs 2012–13 and 2014–15 or (2) steady or decreased participation in SYs 2012–13 and 2013–14 but increased participation in SY 2014–15 were categorized as maintaining or increasing student participation. The remaining SFAs that provided valid responses were categorized as having a decrease. The subgroups for the revenue analyses were defined using similar specifications.

healthyschoolfoodsnow.org
rwjf.org pewtrusts.org