school name: group members problem/team project... · score for mao asada. 8.75 8.25 8.75 8.50 8.00...
TRANSCRIPT

© 2014 Scott Adamson
2014 Excellence in Mathematics Contest
Team Project
School Name:
Group Members:
_________________________________________________________________________
_________________________________________________________________________
_________________________________________________________________________
_________________________________________________________________________
_________________________________________________________________________

_________________________________________________________________________
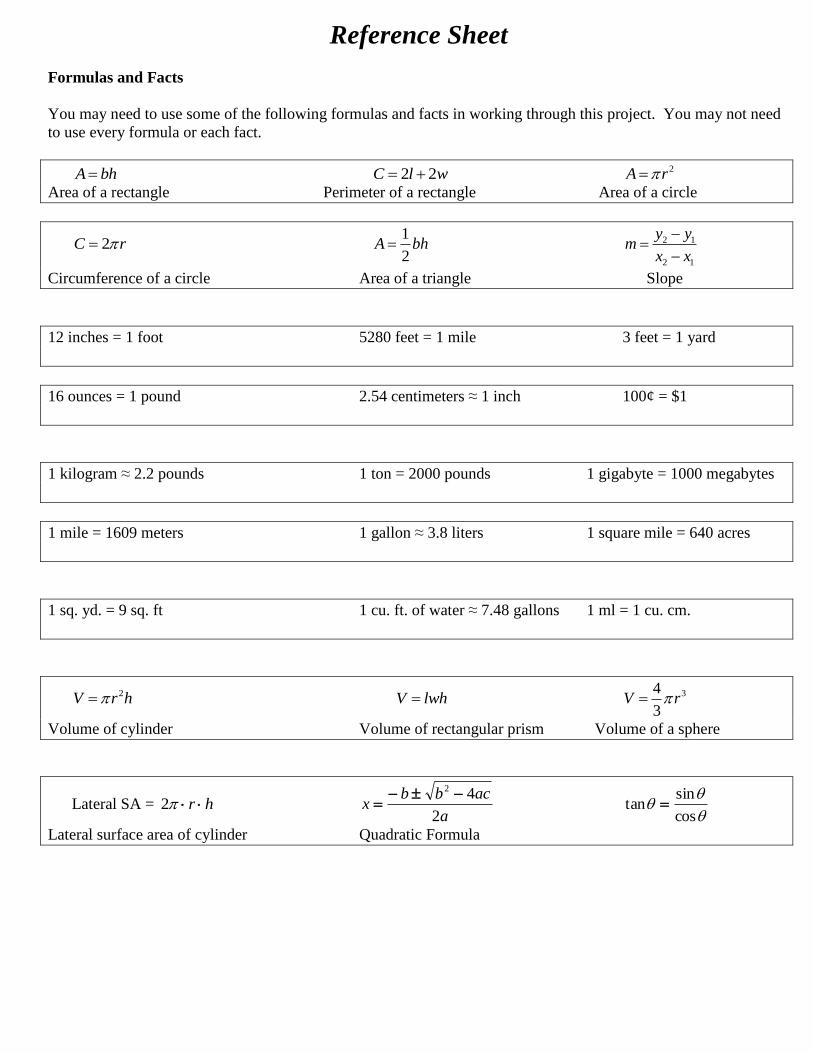
Reference Sheet
Formulas and Facts
You may need to use some of the following formulas and facts in working through this project. You may not need
to use every formula or each fact.
A bh 2 2C l w 2A r
Area of a rectangle Perimeter of a rectangle Area of a circle
2C r 1
2A bh 2 1
2 1
y ym
x x
Circumference of a circle Area of a triangle Slope
12 inches = 1 foot 5280 feet = 1 mile 3 feet = 1 yard
16 ounces = 1 pound 2.54 centimeters ≈ 1 inch 100¢ = $1
1 kilogram ≈ 2.2 pounds 1 ton = 2000 pounds 1 gigabyte = 1000 megabytes
1 mile = 1609 meters 1 gallon ≈ 3.8 liters 1 square mile = 640 acres
1 sq. yd. = 9 sq. ft 1 cu. ft. of water ≈ 7.48 gallons 1 ml = 1 cu. cm.
2V r h V lwh 34
3V r
Volume of cylinder Volume of rectangular prism Volume of a sphere
Lateral SA = hr 2 a
acbbx
2
42
cos
sintan
Lateral surface area of cylinder Quadratic Formula
TEAM PROJECT
2014 Excellence in Mathematics Contest
____________________________________________________________________________________________
The Team Project is a group activity in which the students are presented an open ended, problem situation
relating to a specific theme. The team members are to solve the problems and write a narrative about the theme
which answers all the mathematical questions posed. Teams are graded on accuracy of mathematical content,
clarity of explanations, and creativity in their narrative.
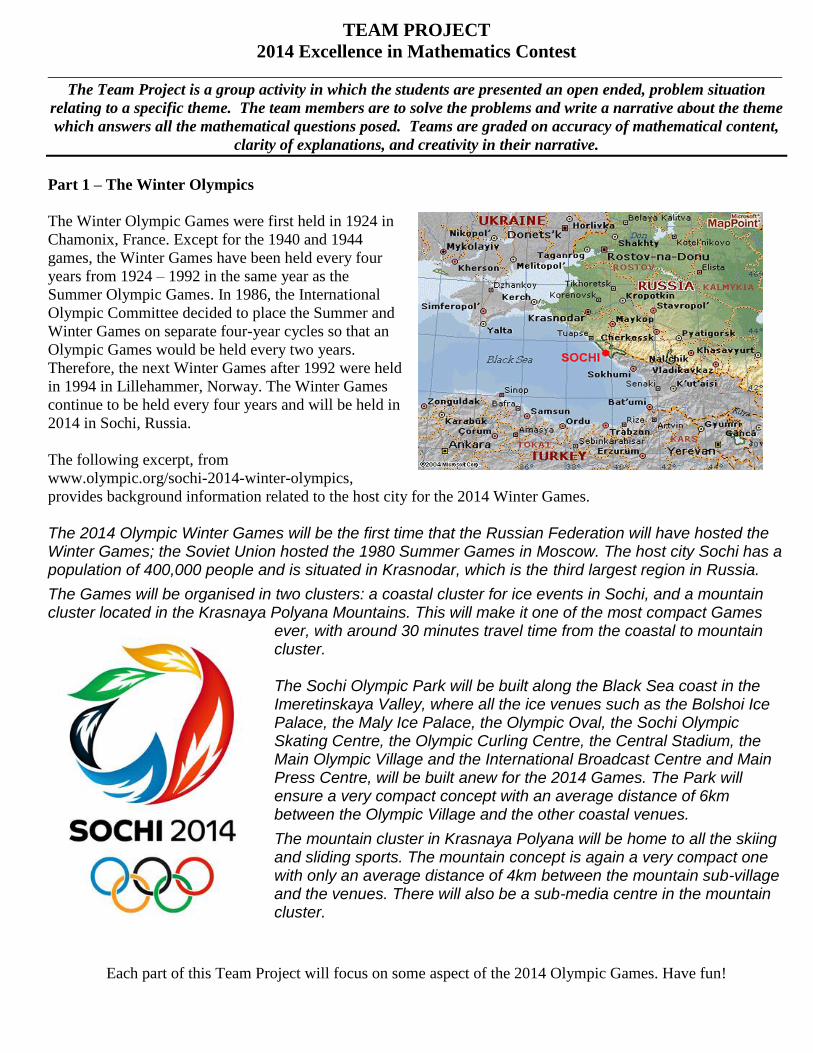
Part 1 – The Winter Olympics
The Winter Olympic Games were first held in 1924 in
Chamonix, France. Except for the 1940 and 1944
games, the Winter Games have been held every four
years from 1924 – 1992 in the same year as the
Summer Olympic Games. In 1986, the International
Olympic Committee decided to place the Summer and
Winter Games on separate four-year cycles so that an
Olympic Games would be held every two years.
Therefore, the next Winter Games after 1992 were held
in 1994 in Lillehammer, Norway. The Winter Games
continue to be held every four years and will be held in
2014 in Sochi, Russia.
The following excerpt, from
www.olympic.org/sochi-2014-winter-olympics,
provides background information related to the host city for the 2014 Winter Games.
The 2014 Olympic Winter Games will be the first time that the Russian Federation will have hosted the Winter Games; the Soviet Union hosted the 1980 Summer Games in Moscow. The host city Sochi has a population of 400,000 people and is situated in Krasnodar, which is the third largest region in Russia.
The Games will be organised in two clusters: a coastal cluster for ice events in Sochi, and a mountain cluster located in the Krasnaya Polyana Mountains. This will make it one of the most compact Games
ever, with around 30 minutes travel time from the coastal to mountain cluster. The Sochi Olympic Park will be built along the Black Sea coast in the Imeretinskaya Valley, where all the ice venues such as the Bolshoi Ice Palace, the Maly Ice Palace, the Olympic Oval, the Sochi Olympic Skating Centre, the Olympic Curling Centre, the Central Stadium, the Main Olympic Village and the International Broadcast Centre and Main Press Centre, will be built anew for the 2014 Games. The Park will ensure a very compact concept with an average distance of 6km between the Olympic Village and the other coastal venues.
The mountain cluster in Krasnaya Polyana will be home to all the skiing and sliding sports. The mountain concept is again a very compact one with only an average distance of 4km between the mountain sub-village and the venues. There will also be a sub-media centre in the mountain cluster.
Each part of this Team Project will focus on some aspect of the 2014 Olympic Games. Have fun!
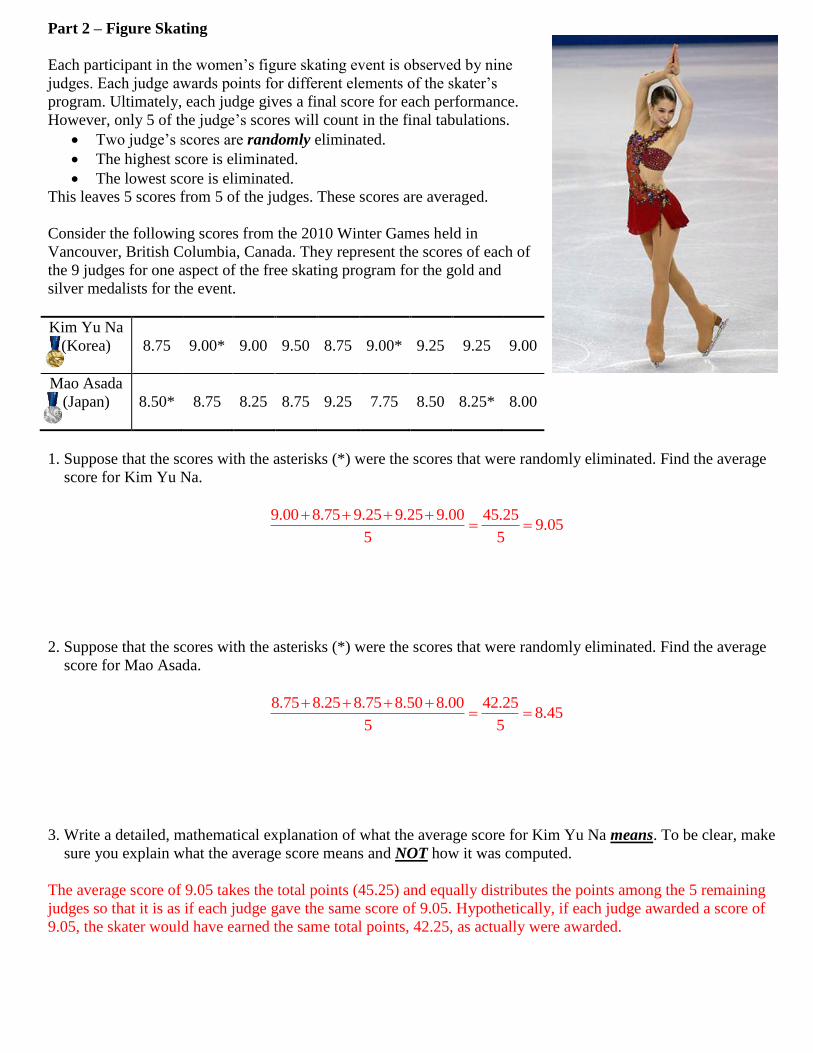
Part 2 – Figure Skating
Each participant in the women’s figure skating event is observed by nine
judges. Each judge awards points for different elements of the skater’s
program. Ultimately, each judge gives a final score for each performance.
However, only 5 of the judge’s scores will count in the final tabulations.
Two judge’s scores are randomly eliminated.
The highest score is eliminated.
The lowest score is eliminated.
This leaves 5 scores from 5 of the judges. These scores are averaged.
Consider the following scores from the 2010 Winter Games held in
Vancouver, British Columbia, Canada. They represent the scores of each of
the 9 judges for one aspect of the free skating program for the gold and
silver medalists for the event.
Kim Yu Na
(Korea)
8.75 9.00* 9.00 9.50 8.75 9.00* 9.25 9.25 9.00
Mao Asada
(Japan)
8.50* 8.75 8.25 8.75 9.25 7.75 8.50 8.25* 8.00
1. Suppose that the scores with the asterisks (*) were the scores that were randomly eliminated. Find the average
score for Kim Yu Na.
9.00 8.75 9.25 9.25 9.00 45.259.05
5 5
2. Suppose that the scores with the asterisks (*) were the scores that were randomly eliminated. Find the average
score for Mao Asada.
8.75 8.25 8.75 8.50 8.00 42.258.45
5 5
3. Write a detailed, mathematical explanation of what the average score for Kim Yu Na means. To be clear, make
sure you explain what the average score means and NOT how it was computed.
The average score of 9.05 takes the total points (45.25) and equally distributes the points among the 5 remaining
judges so that it is as if each judge gave the same score of 9.05. Hypothetically, if each judge awarded a score of
9.05, the skater would have earned the same total points, 42.25, as actually were awarded.
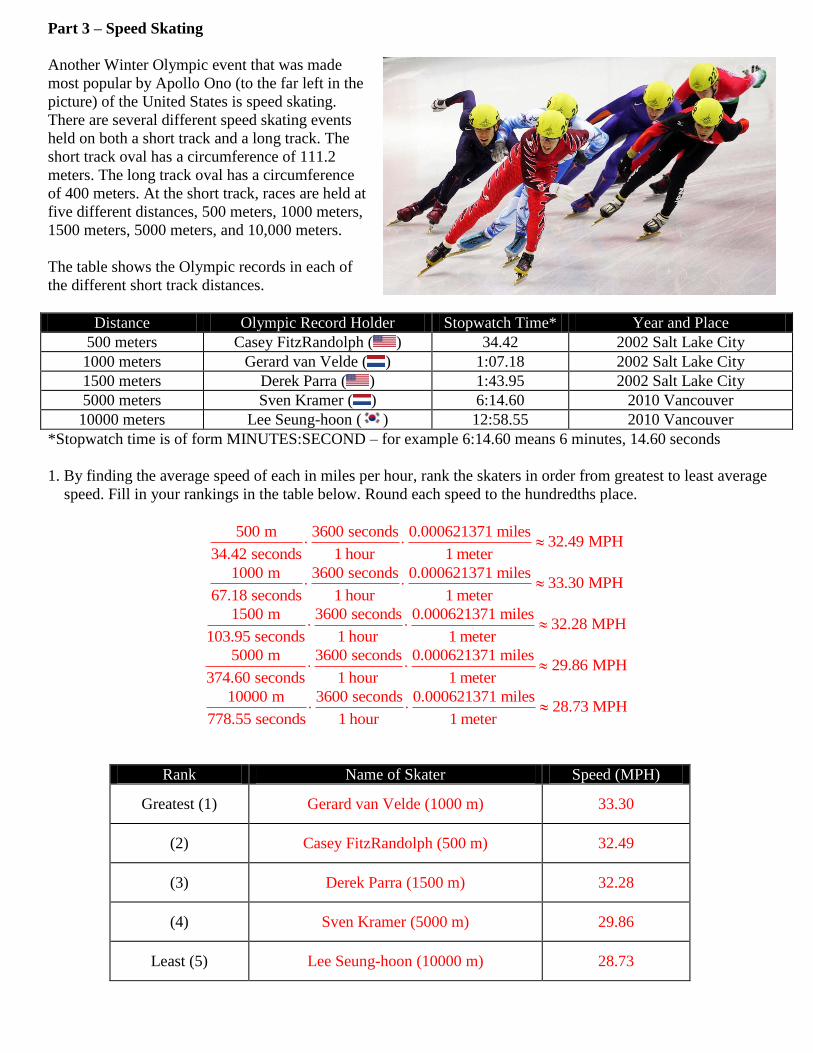
Part 3 – Speed Skating
Another Winter Olympic event that was made
most popular by Apollo Ono (to the far left in the
picture) of the United States is speed skating.
There are several different speed skating events
held on both a short track and a long track. The
short track oval has a circumference of 111.2
meters. The long track oval has a circumference
of 400 meters. At the short track, races are held at
five different distances, 500 meters, 1000 meters,
1500 meters, 5000 meters, and 10,000 meters.
The table shows the Olympic records in each of
the different short track distances.
Distance Olympic Record Holder Stopwatch Time* Year and Place
500 meters Casey FitzRandolph ( ) 34.42 2002 Salt Lake City
1000 meters Gerard van Velde ( ) 1:07.18 2002 Salt Lake City
1500 meters Derek Parra ( ) 1:43.95 2002 Salt Lake City
5000 meters Sven Kramer ( ) 6:14.60 2010 Vancouver
10000 meters Lee Seung-hoon ( ) 12:58.55 2010 Vancouver
*Stopwatch time is of form MINUTES:SECOND – for example 6:14.60 means 6 minutes, 14.60 seconds
1. By finding the average speed of each in miles per hour, rank the skaters in order from greatest to least average
speed. Fill in your rankings in the table below. Round each speed to the hundredths place.
500 m 3600 seconds 0.000621371 miles32.49 MPH
34.42 seconds 1 hour 1 meter
1000 m 3600 seconds 0.000621371 miles33.30 MPH
67.18 seconds 1 hour 1 meter
1500 m 3600 seconds 0.000621371 miles32.28 MPH
103.95 seconds 1 hour 1 meter
5000 m 3600 seconds 0.000621371 miles29.86 MPH
374.60 seconds 1 hour 1 meter
10000 m 3600 seconds 0.000621371 miles28.73 MPH
778.55 seconds 1 hour 1 meter
Rank Name of Skater Speed (MPH)
Greatest (1) Gerard van Velde (1000 m) 33.30
(2) Casey FitzRandolph (500 m) 32.49
(3) Derek Parra (1500 m) 32.28
(4) Sven Kramer (5000 m) 29.86
Least (5) Lee Seung-hoon (10000 m) 28.73

Part 3 Continues…
2. Suppose Casey FitzRandolph skated at his average speed throughout the entire race. Create a graph of Casey’s
distance (in meters) from the starting line as a function of time (in seconds) for the duration of the race. Write a
brief explanation of why you made the graph the way you made it. Be as precise as possible.
Assuming a constant speed of 33.30 MPH (14.53 meters per second), the graph of distance from start (in
meters) versus elapsed time (in seconds) is linear. If his speed was constant, he would cover the same amount of
distance in any particular given interval of time during any part of the race.
3. If possible, write a function formula for the graph you created in #2 above. Explain how you were able to create
this function formula. If it is not possible, explain why.
The function formula is 14.53D t where D represents the distance from start (in meters) and t represents the
elapsed time in the race. At an average speed of 14.53 meters per second, we multiply this by the time elapsed to
find the total distance traveled.
4. Suppose Casey FitzRandolph was able to compete in the 10,000 meter race and was able to maintain his average
speed found in #1. What would his finish time have been? Would he have set a record? Comment on whether or
not Casey would be able to complete the 10,000 meters in this way.
10000 14.53
10000
14.53
688.23 seconds
t
t
t
At an average speed of 14.53 meters per second, Casey would have completed the 10,000 meter race in 688.23
seconds or 11:28.23. This would be an Olympic record. It is unlikely that Casey would be able to keep this pace
for the entire 10,000 meter race.
Dis
tance
fro
m S
tart
(m
eter
s)
Elapsed Time (seconds)

Part 3 Continues…
5. The following graph shows the progression of average world record speeds for the different race lengths. Clearly
describe the details of the most dramatic increase in the record speed that can be observed in the graph. When
did it occur? Which race and gender? How do you know?
www.vorbridge.com
The women’s 5,000 meter race experienced the greatest increase in average world record speed in
approximately 1985. We see that the average speed had been holding steady for about 20 or 25 years at
approximately 21 MPH and then increased to about 24 MPH around 1985.
6. The website www.nbclearn.com/olympics shares a video
where two different 5000 meter racing scenarios are
presented. In one case (Case I), it is proposed that a racer
starts out fast but then tires out and slows down as he
finishes the race. In the other case (Case II), it is proposed
that the racer starts out slower but then finishes the race
relatively quickly. The following graph is used to represent
these situations. Which graph, A or B, corresponds with
which scenario, I or II? Explain how you know.
Case I – B
Case II – A
A good response will clearly describe the relationship
between distance and time in justifying their conclusion. A mediocre response will only point to the “steepness”
of the graph with no attempt to describe the covarying nature of the quantities.
7. According to the graph, which skater, A or B, won the race?
According to the graph, the race was a tie. Each skater traveled the required 5000 meters in the same amount of
time thus making the race a tie.
Part 4 – Gold Medal Count
Since 1976, the United States and Germany have been among the top countries that have earned medals (gold,
silver, and bronze) in the Winter Olympic Games. The following table shows the total number of medals earned by
each country since the 1976 games.
Year 1976 Innsbruck
1980 Lake
Placid
1984 Sarajevo
1988 Calgary
1992 Albertville
1994 Lillehammer
1998 Nagano
2002 Salt Lake
City
2006 Turin
2010 Vancouver
USA 19 12 8 6 11 13 13 34 25 37
Germany* 10 23 24 25 26 24 29 36 29 30
*East Germany until 1992
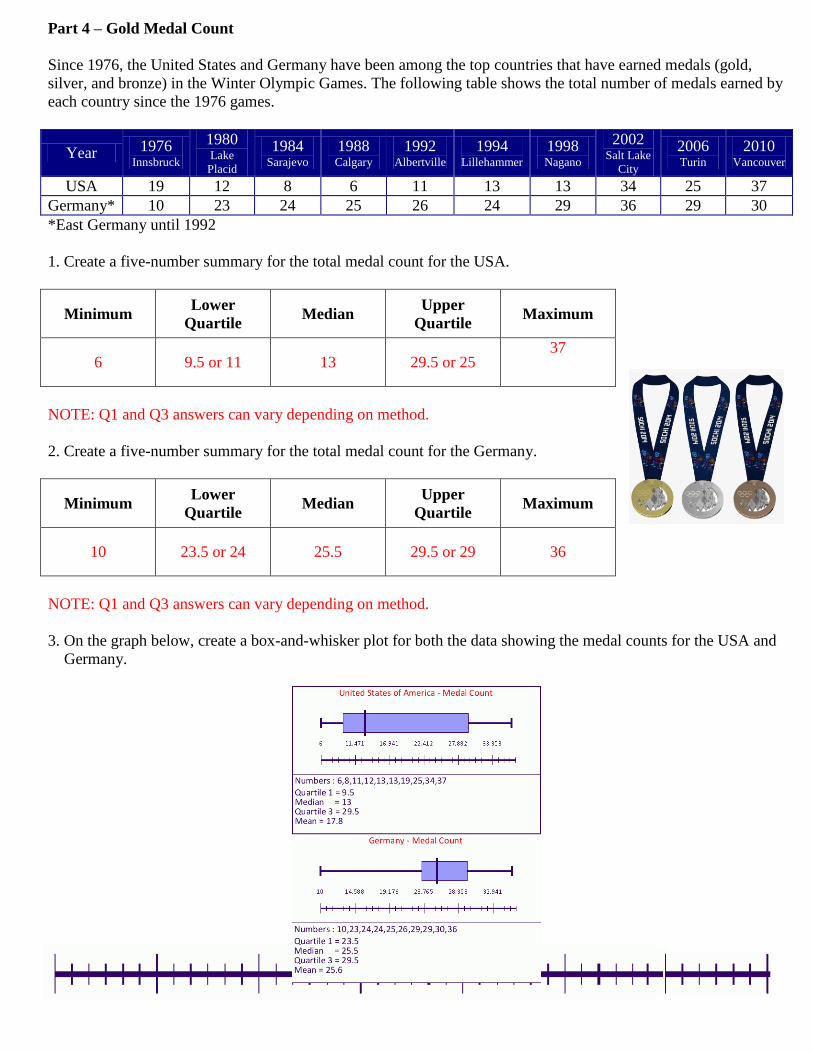
1. Create a five-number summary for the total medal count for the USA.
Minimum Lower
Quartile Median
Upper
Quartile Maximum
6 9.5 or 11 13 29.5 or 25 37
NOTE: Q1 and Q3 answers can vary depending on method.
2. Create a five-number summary for the total medal count for the Germany.
Minimum Lower
Quartile Median
Upper
Quartile Maximum
10 23.5 or 24 25.5 29.5 or 29 36
NOTE: Q1 and Q3 answers can vary depending on method.
3. On the graph below, create a box-and-whisker plot for both the data showing the medal counts for the USA and
Germany.
Part 4 Continues…
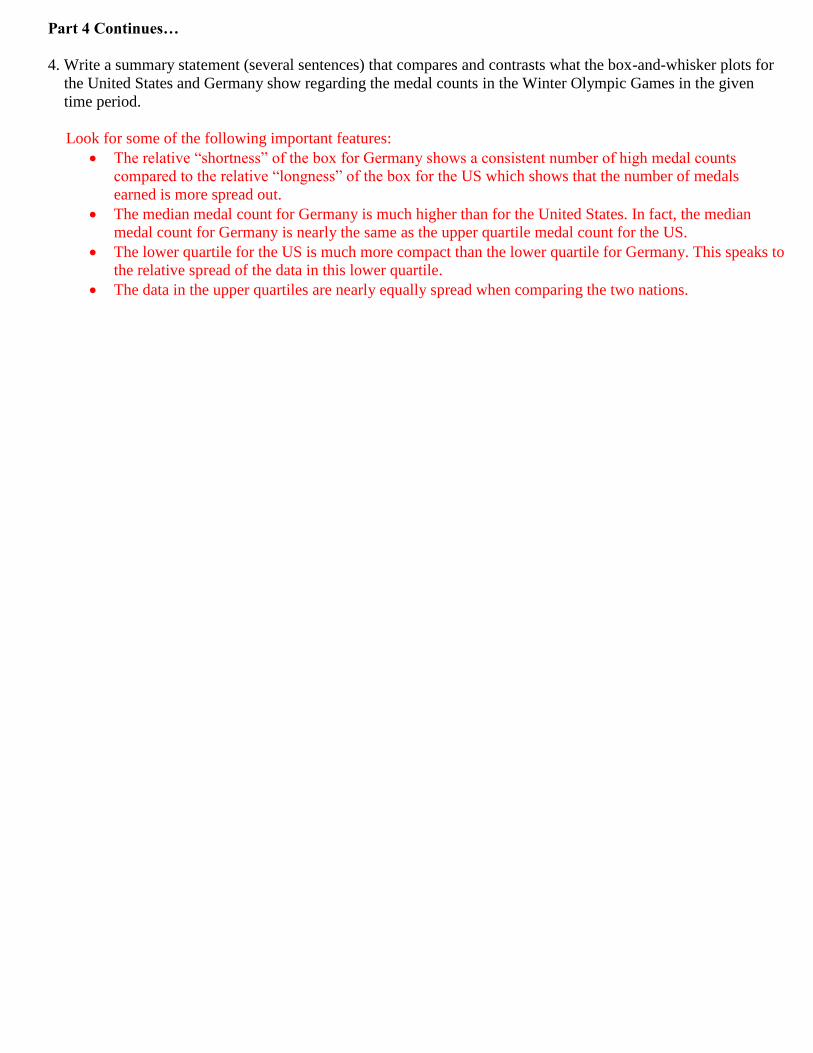
4. Write a summary statement (several sentences) that compares and contrasts what the box-and-whisker plots for
the United States and Germany show regarding the medal counts in the Winter Olympic Games in the given
time period.
Look for some of the following important features:
The relative “shortness” of the box for Germany shows a consistent number of high medal counts
compared to the relative “longness” of the box for the US which shows that the number of medals
earned is more spread out.
The median medal count for Germany is much higher than for the United States. In fact, the median
medal count for Germany is nearly the same as the upper quartile medal count for the US.
The lower quartile for the US is much more compact than the lower quartile for Germany. This speaks to
the relative spread of the data in this lower quartile.
The data in the upper quartiles are nearly equally spread when comparing the two nations.

Part 5 – The Skeleton Event
Skeleton is an event at the Winter Olympic Games
where participants ride a sled, head first, down the
bobsled track. They are allowed a running start but
then must jump on the sled, belly down, and navigate
the course. The course in Sochi has a length of 1,814
meters and participants will experience a vertical drop
of 131.9 meters. The course is designed to have 19
curves that must successfully be navigated by the
participants. The goal is to finish the course in the
fastest time. There
has been some
controversy
surrounding the design of the course in Sochi. It is required that the local
event team submits the downhill grade to Olympic officials to ensure safety.
It was reported that the downhill grade of seven sights have been submitted
but Olympic officials have rejected them all due to high downhill grade on the
track.
While the downhill grade varies at different places along the course, your task
is to use the given quantities and report an overall downhill grade for the course. In the space below, clearly
communicate the mathematical thinking involved in your response. You may use words, mathematical symbols,
computations, and/or pictures as needed to best communicate your strategy.
Answers may vary. Here is a strategy…
Suppose we straighten out the track (hypothetically). Using the given quantities, we can create the following
picture (not to scale). Use the Pythagorean Theorem to compute the length of the horizontal side.
2 2 2
2 2 2
2
131.9 1814
1814 131.9
3273198.39
1809.198 meters
L
L
L
L
Therefore, the grade is: 131.9
0.07291809.198
or about 7.3%
1814 meters
131.9 meters
1809.19 meters
Part 6 – Ice Hockey
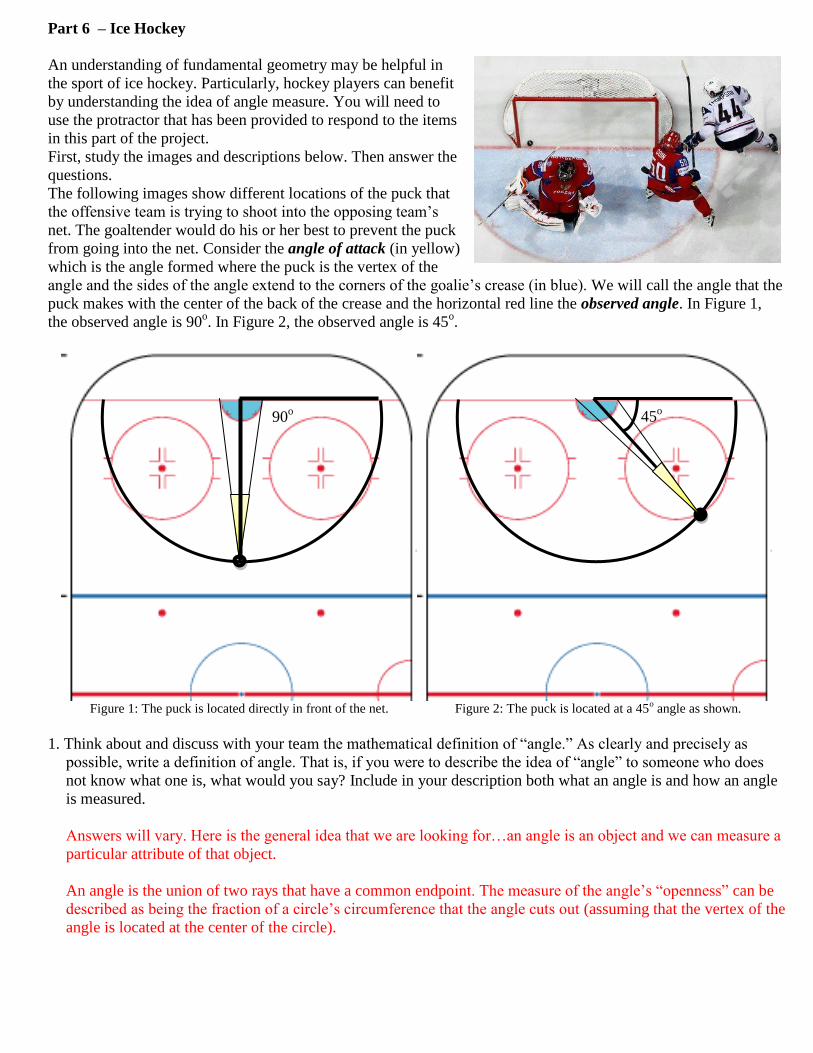
An understanding of fundamental geometry may be helpful in
the sport of ice hockey. Particularly, hockey players can benefit
by understanding the idea of angle measure. You will need to
use the protractor that has been provided to respond to the items
in this part of the project.
First, study the images and descriptions below. Then answer the
questions.
The following images show different locations of the puck that
the offensive team is trying to shoot into the opposing team’s
net. The goaltender would do his or her best to prevent the puck
from going into the net. Consider the angle of attack (in yellow)
which is the angle formed where the puck is the vertex of the
angle and the sides of the angle extend to the corners of the goalie’s crease (in blue). We will call the angle that the
puck makes with the center of the back of the crease and the horizontal red line the observed angle. In Figure 1,
the observed angle is 90o. In Figure 2, the observed angle is 45
o.
Figure 1: The puck is located directly in front of the net. Figure 2: The puck is located at a 45
o angle as shown.
1. Think about and discuss with your team the mathematical definition of “angle.” As clearly and precisely as
possible, write a definition of angle. That is, if you were to describe the idea of “angle” to someone who does
not know what one is, what would you say? Include in your description both what an angle is and how an angle
is measured.
Answers will vary. Here is the general idea that we are looking for…an angle is an object and we can measure a
particular attribute of that object.
An angle is the union of two rays that have a common endpoint. The measure of the angle’s “openness” can be
described as being the fraction of a circle’s circumference that the angle cuts out (assuming that the vertex of the
angle is located at the center of the circle).
45o
90o
Part 6 Continues…
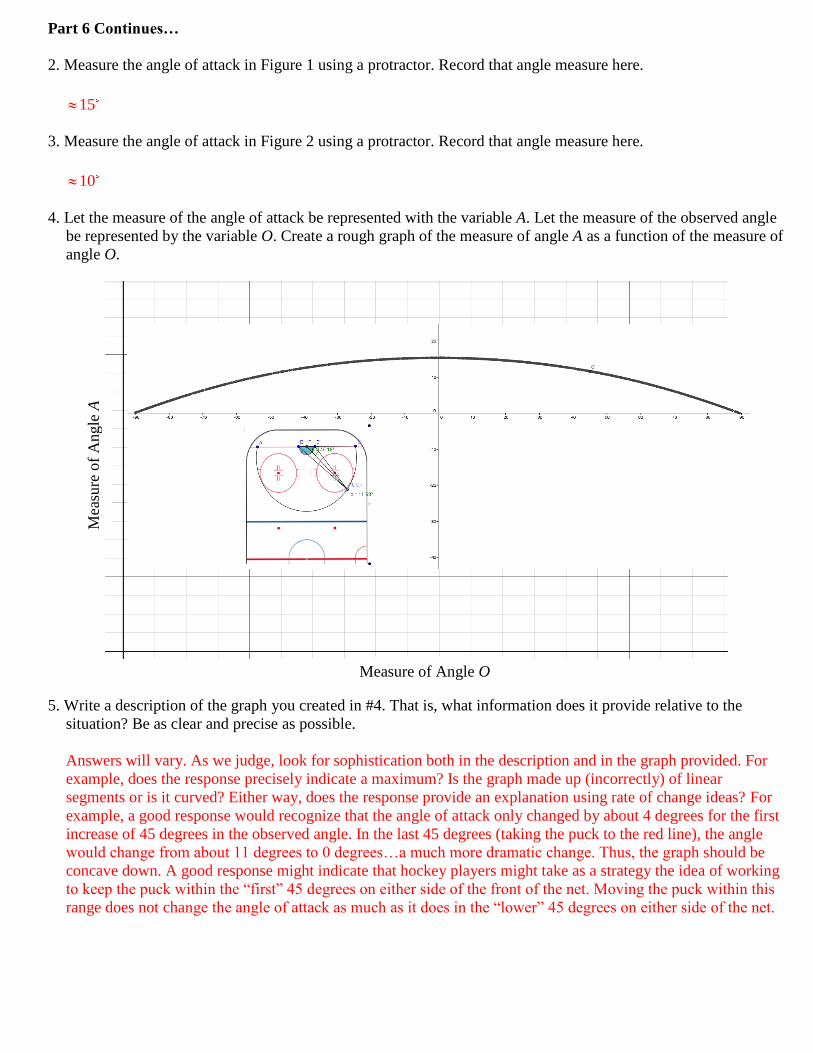
2. Measure the angle of attack in Figure 1 using a protractor. Record that angle measure here.
15
3. Measure the angle of attack in Figure 2 using a protractor. Record that angle measure here.
10
4. Let the measure of the angle of attack be represented with the variable A. Let the measure of the observed angle
be represented by the variable O. Create a rough graph of the measure of angle A as a function of the measure of
angle O.
5. Write a description of the graph you created in #4. That is, what information does it provide relative to the
situation? Be as clear and precise as possible.
Answers will vary. As we judge, look for sophistication both in the description and in the graph provided. For
example, does the response precisely indicate a maximum? Is the graph made up (incorrectly) of linear
segments or is it curved? Either way, does the response provide an explanation using rate of change ideas? For
example, a good response would recognize that the angle of attack only changed by about 4 degrees for the first
increase of 45 degrees in the observed angle. In the last 45 degrees (taking the puck to the red line), the angle
would change from about 11 degrees to 0 degrees…a much more dramatic change. Thus, the graph should be
concave down. A good response might indicate that hockey players might take as a strategy the idea of working
to keep the puck within the “first” 45 degrees on either side of the front of the net. Moving the puck within this
range does not change the angle of attack as much as it does in the “lower” 45 degrees on either side of the net.
Mea
sure
of
Angle
A
Measure of Angle O
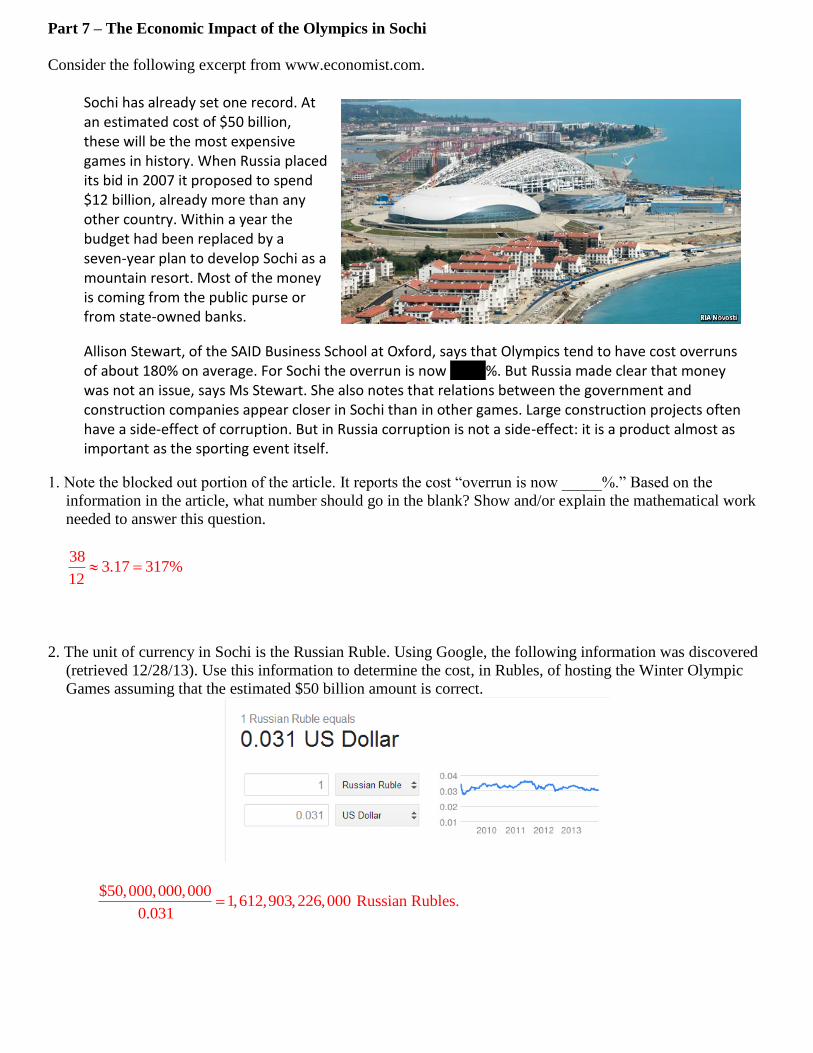
Part 7 – The Economic Impact of the Olympics in Sochi
Consider the following excerpt from www.economist.com.
Sochi has already set one record. At an estimated cost of $50 billion, these will be the most expensive games in history. When Russia placed its bid in 2007 it proposed to spend $12 billion, already more than any other country. Within a year the budget had been replaced by a seven-year plan to develop Sochi as a mountain resort. Most of the money is coming from the public purse or from state-owned banks.
Allison Stewart, of the SAID Business School at Oxford, says that Olympics tend to have cost overruns of about 180% on average. For Sochi the overrun is now 500%%. But Russia made clear that money was not an issue, says Ms Stewart. She also notes that relations between the government and construction companies appear closer in Sochi than in other games. Large construction projects often have a side-effect of corruption. But in Russia corruption is not a side-effect: it is a product almost as important as the sporting event itself.
1. Note the blocked out portion of the article. It reports the cost “overrun is now _____%.” Based on the
information in the article, what number should go in the blank? Show and/or explain the mathematical work
needed to answer this question.
383.17 317%
12
2. The unit of currency in Sochi is the Russian Ruble. Using Google, the following information was discovered
(retrieved 12/28/13). Use this information to determine the cost, in Rubles, of hosting the Winter Olympic
Games assuming that the estimated $50 billion amount is correct.
$50,000,000,0001,612,903,226,000
0.031 Russian Rubles.
Part 7 Continues…
3. According to sochimagazine.com, the average monthly
salary in Sochi is 32,100 rubles. The population of Sochi
is 343,334 (google.com). Considering that not all of the
population is working (e.g. kids, elderly, retired), we will
assume that 40% of the population is working (similar to
the US). To gain perspective on the cost of hosting the
Olympics, determine how many month’s salary would the
workers in Sochi hypothetically have to donate to the
Olympic cause in order to cover the $50 billion cost?
Explain your results.
0.40 343,334 137,334 workers in Sochi
1,612,903,226,000 Russian Rubles50,246,207 monthly salaries
32,100 rubles per person per month
50,246,207 365.87
137,334
A total of about 50,246,207monthly salaries or about 366 monthly salaries from each worker in Sochi would
have to be donated in order to cover the cost of hosting the Olympic Games.
4. According to the Bureau of Labor Statistics, the 128.2 million workers in the United States as of May 2011 hold
jobs ranging from fast-food workers requiring no education and earning barely above minimum wage to CEOs
with MBAs who earned more than nine times that amount. The population of the US is about 313.9 million
people. The population of Salt Lake City, UT is 189,314 people. The average monthly salary in Salt Lake City is
$4,333. How many monthly salaries from the people in Salt Lake City would hypothetically have to be donated
to the Olympic cause in order to cover the $50 billion cost? Assume that the percentage of workers in Salt Lake
City is the same as for the US. Explain your results.
$50,000,000,00011,539,349 monthly salaries
$4,333 per person per month
The percentage of workers in the US (and therefore Salt Lake City) is 128,200,000
0.41 41%313,900,000
0.41 189,314 77,619 workers in Salt Lake City
11,539,349148.67
77,619
A total of about 11,539,349monthly salaries or about 149 monthly salaries from each worker in Salt Lake City
would have to be donated in order to cover the cost of hosting the Olympic Games.